optimization of ferronickel production from …etd.lib.metu.edu.tr/upload/12617272/index.pdf · bu...
TRANSCRIPT
i
OPTIMIZATION OF FERRONICKEL PRODUCTION
FROM
SİVRİHİSAR NICKEL LATERITE ORE
A THESIS SUBMITTED TO
THE GRADUATE SCHOOL OF NATURAL AND APPLIED SCIENCES
OF
MIDDLE EAST TECHNICAL UNIVERSITY
BY
SAEID POURNADERI
IN PARTIAL FULFILLMENT OF THE REQUIREMENTS
FOR
THE DEGREE OF DOCTOR OF PHILOSOPHY
IN
METALLURGICAL AND MATERIALS ENGINEERING
MAY 2014

ii
iii
Approval of the thesis:
OPTIMIZATION OF FERRONICKEL PRODUCTION
FROM
SİVRİHİSAR NICKEL LATERITE ORE
submitted by SAEID POURNADERI in partial fulfillment of the requirements
for the degree of Doctor of Philosophy in Metallurgical and Materials
Engineering Department, Middle East Technical University by,
Prof. Dr. Canan Özgen
Dean, Graduate School of Natural and Applied Sciences
Prof. Dr. C. Hakan Gür
Head of Department, Metallurgical and Materials Eng.
Prof. Dr. Ahmet Geveci
Supervisor, Metallurgical and Materials Eng. Dept., METU
Prof. Dr. Yavuz A. Topkaya
Co-Supervisor, Metallurgical and Materials Eng. Dept., METU
Examining Committee Members:
Prof. Dr. Naci Sevinç
Metallurgical and Materials Eng. Dept., METU
Prof. Dr. Ahmet Geveci
Metallurgical and Materials Eng. Dept., METU
Prof. Dr. Abdullah Öztürk
Metallurgical and Materials Eng. Dept., METU
Prof. Dr. M. Ümit Atalay
Mining Eng. Dept., METU
Assist. Prof. Dr. Erkan Konca
Metallurgical and Materials Eng. Dept., Atılım University
Date: 15.05.2014

iv
I hereby declare that all information in this document has been obtained and
presented in accordance with academic rules and ethical conduct. I also declare
that, as required by these rules and conduct, I have fully cited and referenced all
material and results that are not original to this work.
Name, Last name: SAEID, POURNADERI
Signature:
v
ABSTRACT
OPTIMIZATION OF FERRONICKEL PRODUCTION
FROM
SİVRİHİSAR NICKEL LATERITE ORE
Pournaderi, Saeid
Ph.D., Department of Metallurgical and Materials Engineering
Supervisor : Prof. Dr. Ahmet Geveci
Co-Supervisor: Prof. Dr. Yavuz A. Topkaya
May 2014, 173 pages
In this study, pyrometallurgical treatment of limonitic laterite ore from Sivrihisar
region was investigated. The run-of-mine (ROM) ore contained 1.26 wt.% Ni but was
initially upgraded to 1.405 wt.% Ni by screening out the +50 mm particles. Finer than
50 mm ore was crushed to -1 mm and used in the experiments. Then, the ore was
calcined at different temperatures. The optimum calcination conditions were
determined as 700°C and 40 min. which resulted in 10% weight loss.
At the next (prereduction) stage, the calcined ore was reduced at 700-1100°C by the
addition of 5.74, 8.61 and 11.48 wt.% coal under argon atmosphere. It was found that
the metallization of iron was limited until 900°C but increased rapidly at higher
temperatures. The metallization of nickel and cobalt initiated at much lower
temperatures and increased with temperature. The results also showed that increased
coal additions did not affect the iron metallization up to 900°C. At 1000°C the
metallization of Fe became slightly better, but its effect was more pronounced at
1100°C. The increased coal addition increased the nickel reduction at all temperatures,
while it had no effect on the metallization of cobalt. The usage of 70%N2-20%CO2-
10%CO gas mixture as reducing atmosphere substantially improved the reduction
process below 1000°C.
Finally, the reduced ore was smelted to produce ferronickel. No coal was added at the
smelting stage and the reduction reactions were completed by the unreacted coal from

vi
the previous prereduction stage. Conditions were adjusted to produce a ferronickel
containing ~15% Ni. The physical and the chemical losses of nickel in the slag were
directly proportional to the ferronickel grade. Colemanite was added to the charge to
decrease the physical losses in the slag and to increase nickel recovery but no positive
effect was observed.
Keywords: Laterite, pyrometallurgy, characterization, calcination, reduction,
smelting, nickel losses in slag, colemanite
vii
ÖZ
SİVRİHİSAR NİKEL LATERİT CEVHERİNDEN
FERRONİKEL ÜRETİMİNİN OPTİMİZASYONU
Pournaderi, Saeid
Doktora, Metalurji ve Malzeme Mühendisliği Bölümü
Tez Yöneticisi : Prof. Dr. Ahmet Geveci
Ortak Tez Yöneticisi: Prof. Dr. Yavuz A. Topkaya
Mayıs 2014, 173 Sayfa
Bu çalışmada, Sivrihisar bölgesinden alınan limonitik laterit cevherinin pirometalurjik
işlemi incelenmiştir. Madenden gelen cevher ağırlıkça %1,26 Ni içermiştir,
başlanğıçta nikel yüzdesi +50 büyük parçaların elenmesi sonucu ağırlıkça %1,405’e
yükseltilmiştir. Parça boyutu 50 mm’den küçük cevhere ise kırılarak -1 mm’ye
indirildikten sonra deneylerde kullanılmıştır. Daha sonra, cevher farklı sıcaklıklarda
kalsine edilmiştir. En uygun kalsinasyon şartları 700°C ve 40 dakika olarak
belirlenmiş olup ayrıca %10 ağrılık kaybına neden olmuştur.
Bir sonraki aşamada (önindirgeme), kalsine edilmiş cevhere %5,74; %8,61 ve %11,48
kömür ilave edilerek 700-1100°C sıcaklık aralığında argon atmosferi altında
indirgenmiştir. Demirin metalleşmesinin 900°C’nin altında sınırlı olduğu ve daha
yüksek sıcaklıklarda hızla arttığı belirlenmiştir. Nikel ve kobaltın metalleşmeleri ise
çok daha düşük sıcaklıklarda başlamış olup, sıcaklığın yükselmesi ile artmışlardır.
Demirin metalleşme sonuçlarına fazla kömürün ilavesinin 900°C altında bir etkisi
olmamıştır. Fazla kömürün ilavesi 1000°C de demirin metalleşmesini biraz
iyileşmiştir ama bu etki 1100°C de daha belirgin olmuştur. Fazla kömürün ilavesi
nikelin metalleşmesinin tüm sıcaklıklarda artırmıştır, ama kobaltın metalleşmesini
etkilememiştir. İndirgeyici gaz karışımı olarak %70N2-%20CO2-%10CO kullanımı
1000°C’nin altında metal indirgemesini arttırmıştır.
viii
Sonunda, indirgenmiş cevher ergitilerek ferronikel üretilmiştir. Ergitme aşamasında
kömür eklenmemiştir ve indirgeme reaksiyonları bir önceki önindirgeme aşamasından
kalan tepkimeye girmemiş kömür ile tamamlanmıştır. Ergitme şartları %15 Ni içeren
ferronikel üretimini sağlayacak şekilde ayarlanmıştır. Nikelin cüruftaki fiziksel ve
kimyasal kayıplarının üretilen ferronikel’in nikel içeriliği ile orantılı olduğu
gözlemlenmiştir. Cüruftaki fiziksel kayıpları azaltmak ve nikel verimini yükseltmek
için, şarj karışımına kolemanit ilave edilmiştir, ama deneyler sonucu, olumlu etkisinin
olmadığı anlaşılmıştır.
Anahtar Kelimeler: Laterit, pirometalurji, karakterizasyon, kalsinasyon, indirgeme,
ergitme, cüruftaki nikel kayıpları, kolemanit.

ix
To my family…
x
ACKNOWLEDGEMENTS
I wish to express my deepest appreciation and thanks to my supervisor Prof. Dr. Ahmet
Geveci. He was my tremendous mentor who held my hand from the first day I came
here to Turkey. He was always kind to me and his guidance and advice continually
motivated and supported me during my Ph.D. period. Without his helps, I could never
stand on the spot I am standing today.
I wish to express my deepest appreciation and thanks to my co-supervisor Prof. Dr.
Yavuz A. Topkaya. His advices on both research as well as on my career have been
priceless. His office door was always open and he always had time to teach me
patiently and precisely. I have learned a lot from him. I can never repay his many
kindness to me.
I wish to express my deepest appreciation and thanks to my co-supervisor Assoc. Prof.
Dr. Ender Keskinkılıç. He encouraged me throughout my thesis study with his
persistent support. It was a great honor to work under his supervision. Without his
guidance, help and great effort this research would not have been possible.
A special thanks to Ms. Kerime Güney for the AAS analyses. I learned a lot about wet
chemical analyses from her and without her assistance I could not finish on time. I
would like to thank Prof. Dr. Asuman Türkmenoğlu and Assist. Prof. Dr. Eren Kalay
for their kind assistance with the XRD analysis of the ore. I would like to thank Prof.
Dr. Yavuz Ataman for permitting me to work in his research laboratory, and to his
research group for their help with ICP analyses.
In addition, I would like to thank Prof. Dr. Naci Sevinç, Prof. Dr. Ümit Atalay, and
Prof. Dr. İshak Karakaya for their critical comments and advices on my thesis. I would
like to thank Prof. Dr. Muharrem Timuçin and Prof. Dr. Abdullah Öztürk for their
kind assistance during my thesis.
I also want to thank The Scientific and Technological Research Council of Turkey
(TÜBİTAK) for the financial support given under the Project No: 109M068 and the
xi
fellowship under 2215 program. META Nickel Cobalt Company is acknowledged for
supplying the lateritic ore sample.
I want to thank Barış Alpay, Aydın Rüşen, Amir Fadai, Şerif Kaya, Mehmet Ali Recai
Önal, Evrim Tufan, Derya Kapusuz and Nursev Bilgin for their great friendship and
for their support. I would like to thank Saffet Ayık and Serkan Yılmaz for SEM,
XRF and XRD measurements and to Atalay Özdemir, Cemal Yanardağ and
Salih Türe for their technical support.
I would like to give my endless gratitude to my wife Saeideh Farnian for her invaluable
patience and love, who supported and motivated me with her understanding during the
whole period of my study. I also want to thank my family’s each member; my father,
my mother and my sisters for their prayers, for all of the sacrifices they made and for
all kind of support they gave me throughout my life. My special thanks go to my cute
nephews and nieces for making my life colorful and cheerful.
Thank you all.
Saeid Pournaderi
March 7, 2014
PostScript: Due to the bureaucratic limitations of the Graduate School of Natural and
Applied Sciences during the assignment of the second co-supervisor, the name of
Assoc. Prof. Dr. Ender Keskinkılıç could not be included in the “Approval of the
Thesis”. Although his name does not officially appear as my co-supervisor, once more
I would like to thank him as my second co-supervisor because he advised me
throughout my thesis study and without his great efforts this study would not be
possible.
xii
TABLE OF CONTENTS
ABSTRACT ................................................................................................................. v
ÖZ .............................................................................................................................. vii
ACKNOWLEDGEMENTS ......................................................................................... x
TABLE OF CONTENTS ........................................................................................... xii
LIST OF TABLES ..................................................................................................... xv
LIST OF FIGURES ................................................................................................. xvii
CHAPTERS
1 INTRODUCTION ................................................................................................ 1
2 LITERATURE REVIEW ..................................................................................... 5
2.1 Nickel Resources ........................................................................................... 5
2.1.1 Sulfide Ores ........................................................................................... 6
2.1.2 Laterites ................................................................................................. 7
2.2 Laterite Processing ...................................................................................... 11
2.3 Hydrometallurgical Processes ..................................................................... 14
2.3.1 The HPAL Process ............................................................................... 14
2.3.2 The Caron Process ............................................................................... 15
2.4 Pyrometallurgical Processing of Laterites................................................... 15
2.4.1 Smelting to Matte ................................................................................. 16
2.4.2 Smelting to Ferronickel........................................................................ 16
2.5 Laterites of Turkey ...................................................................................... 34
2.6 The Aim of the Study .................................................................................. 36
3 EXPERIMENTAL.............................................................................................. 39
3.1 Ore Supply................................................................................................... 39
3.2 Ore Characterization ................................................................................... 40
xiii
3.2.1 Dry Screen Analysis & Tumbler Test .................................................. 40
3.2.2 Chemical Analysis ............................................................................... 40
3.2.3 Qualitative Mineralogical Analysis...................................................... 40
3.2.4 Quantitative Mineralogical Analysis.................................................... 41
3.2.5 Thermal Analysis ................................................................................. 41
3.3 Calcination Experiments ............................................................................. 42
3.4 Prereduction Experiments ........................................................................... 43
3.4.1 Experimental Set-up ............................................................................. 43
3.4.2 Experimental Procedure ....................................................................... 45
3.4.3 Characterization Methods .................................................................... 46
3.5 Smelting Experiments ................................................................................. 47
3.5.1 Experimental Set-up ............................................................................. 47
3.5.2 Experimental Procedure ....................................................................... 48
3.5.3 Characterization Methods .................................................................... 50
4 RESULTS & DISCUSSION .............................................................................. 53
4.1 Mineral Dressing & Characterization .......................................................... 53
4.1.1 Dry Screen Analysis ............................................................................. 53
4.1.2 Chemical Analysis ............................................................................... 55
4.1.3 Qualitative Phase Analysis ................................................................... 57
4.1.4 Quantitative Phase Analysis ................................................................. 60
4.1.5 Thermal Analysis ................................................................................. 62
4.2 Calcination ................................................................................................... 63
4.2.1 Effect of Temperature and Time .......................................................... 65
4.2.2 Chemical Analysis of the Calcined Ore ............................................... 72
4.3 Prereduction ................................................................................................. 72
4.3.1 Thermodynamic Considerations .......................................................... 73
4.3.2 Study of Phase Transformations during Reduction ............................. 78

xiv
4.3.3 Microstructural Study under SEM ....................................................... 80
4.3.4 Effect of Reduction Temperature......................................................... 82
4.3.5 Effect of Coal Amount ......................................................................... 87
4.3.6 Effect of Retention Time ..................................................................... 89
4.3.7 Effect of Furnace Atmosphere ............................................................. 91
4.3.8 Choice of the Optimum Prereduction Conditions ................................ 95
4.4 Smelting ...................................................................................................... 96
4.4.1 Experiments in the Horizontal Tube Furnace ...................................... 96
4.4.2 Experiments in the Vertical Tube Furnace ........................................ 110
4.4.3 Smelting of Industrial Ferronickel and Slag ...................................... 141
5 CONCLUSIONS .............................................................................................. 145
6 RECOMMENDATIONS FOR FUTURE STUDIES ....................................... 149
REFERENCES ........................................................................................................ 151
APPENDICES
A. FERRONICKEL SPECIFICATION AND DELIVERY REQUIREMENTS .... 163
B. SAMPLE PREPARATION FOR SCREEN ANALYSIS AND TUMBLER TEST
.................................................................................................................................. 165
C. REQUIRED COAL CALCULATION ............................................................... 167
CURRICULUM VITAE .......................................................................................... 169
xv
LIST OF TABLES
TABLES
Table 2-1. Nickel sulfide smelters and their feed compositions (wt%) ....................... 7
Table 2-2. Processing methods of nickel laterites and corresponding products [1] ... 12
Table 2-3. Composition of the refined ferronickel for some operations (wt.%) [13] 32
Table 3-1. Calorific value and chemical analysis (wt.%) of the coal used in the present
study ........................................................................................................................... 45
Table 3-2. Chemical composition of the calcined colemanite (wt.%) ....................... 50
Table 4-1. Chemical composition of the ROM and -50 mm ores (wt.%) .................. 56
Table 4-2. Average composition of the smectite sample (wt.%) ............................... 60
Table 4-3. Mineralogical composition of Sivrihisar limonitic ore (wt.%) ................. 61
Table 4-4. List of the calcination experiments ........................................................... 64
Table 4-5. Chemical analysis of the calcined ore (wt.%) .......................................... 72
Table 4-6. List of the prereduction experiments ........................................................ 73
Table 4-7. EDS point analysis of the metallic phases formed within the reduced
particles (wt.%) .......................................................................................................... 81
Table 4-8. List of the experiments performed in the horizontal tube furnace ............ 97
Table 4-9. Chemical composition of the slags obtained from the smelting of the
samples in the rectangular prism-shaped alumina crucibles (wt.%) ........................ 109
Table 4-10. Ferronickel grade for the 6th and 14th and the repeated experiments in the
new set-up (vertical tube furnace) ............................................................................ 111
Table 4-11. List of the smelting experiments done in the vertical tube furnace ...... 112
Table 4-12. Weights of the charge material and the prereduced products ............... 113
Table 4-13. XRF analysis of the ferronickel products for exps. 20-23 .................... 114
Table 4-14.C and S content of the ferronickel products for exps. 20-23 (wt.%) ..... 114
Table 4-15. XRF analysis of the slags for exps. 20-23 ........................................... 116
Table 4-16. Physically lost metals in the slag. ......................................................... 120
Table 4-17. XRF analysis of the ferronickel products for exps. 24 and 25 ............. 124
Table 4-18. XRF analysis of the slags for exp. 24 and 25 ....................................... 124
Table 4-19. Entrapped and dissolved metal in the slag for exps. 24 and 25 ............ 124
xvi
Table 4-20. XRF analysis of the ferronickel obtained at 1490°C (wt.%) ................ 125
Table 4-21. XRF analysis of the slag obtained at 1490°C (wt.%) ........................... 125
Table 4-22. Entrapped and dissolved metal in the slag at 1490°C .......................... 125
Table 4-23. XRF analysis of the ferronickel products for exps. 29-33 .................... 127
Table 4-24. C and S contents of the ferronickel products for exps. 29-33 (wt.%) .. 127
Table 4-25. XRF analysis of the slags for exps. 29-33 ............................................ 127
Table 4-26. Weight and chemical composition of the ferronickel for the experiment
with 2 wt.% colemanite addition ............................................................................. 131
Table 4-27. Entrapped and dissolved metal in the slag for the experiment with 2 wt.%
colemanite addition .................................................................................................. 131
Table 4-28. Chemical composition of the Larco ferronickel (wt.%) ....................... 142
Table 4-29. XRF analysis of the Larco slag ............................................................ 143
Table 4-30. Entrapped and dissolved metal analyses in industrial slag from Larco
smelter ...................................................................................................................... 143
Table 4-31. Weight of the product ferronickel settled at the end of the experiments
done with industrial ferronickel and slag ................................................................. 144
Table A-1. General ferronickel specification and delivery requirements [93] ........ 163
Table A-2 specific ferronickel classification and delivery requirements ................ 163
xvii
LIST OF FIGURES
FIGURES
Figure 2-1. Distribution of the world nickel laterites according to contained nickel
(Adapted from [7]). ...................................................................................................... 8
Figure 2-2. A simple presentation of nickel laterite profiles (adapted from [5, 20]). .. 9
Figure 2-3. Laterite profiles under wet and dry climate conditions. ............................ 9
Figure 2-4. Flow chart for various methods of processing of laterites [7]. ................ 12
Figure 2-5. Nickel laterite projects and processing configuration (2008) (data derived
from [8]). .................................................................................................................... 13
Figure 2-6. (a) Capacity of a RKEF line, (b) increase in furnace power over the years.
.................................................................................................................................... 18
Figure 2-7. (a) shielded-arc, (b) immersed electrode operating modes. .................... 18
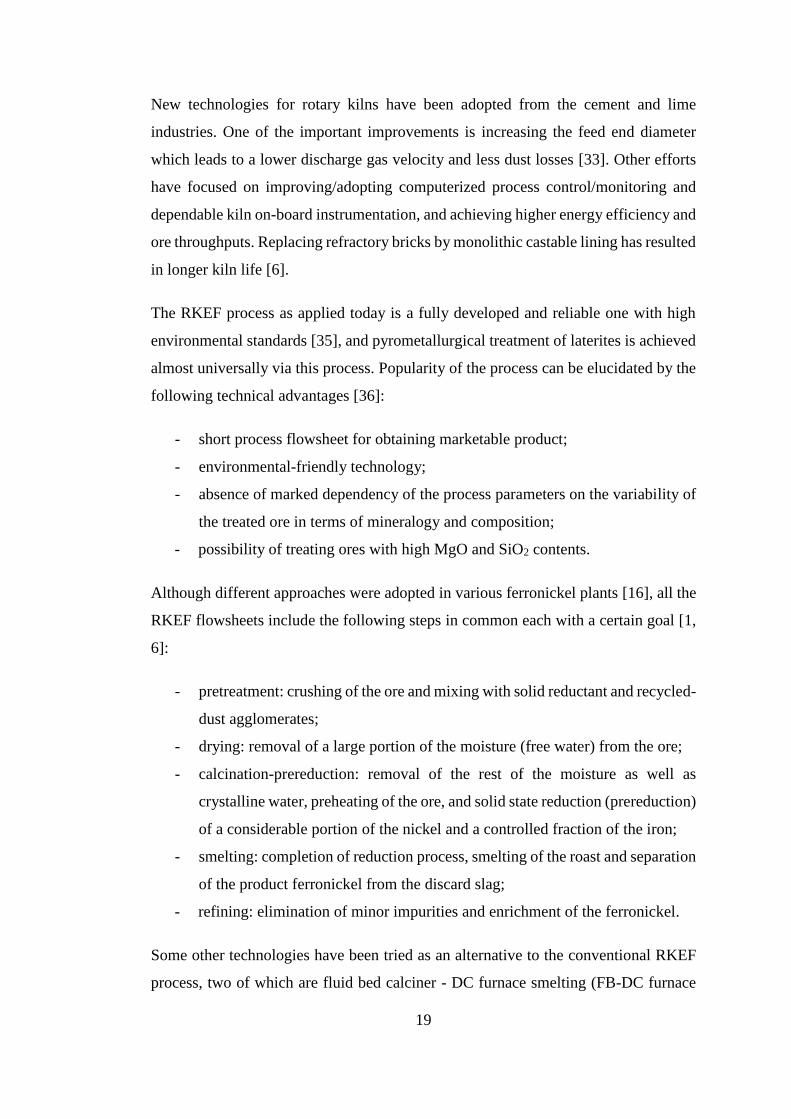
Figure 2-8. Effect of (a) reduction (roasting) temperature and, (b) and (c) reduction
time (at 860 and 900°C respectively) on the energy consumption in the smelting step.
.................................................................................................................................... 22
Figure 2-9. Typical profile of (a) kiln gas temperature and flow rate, (b) charge
temperature and degree of reduction. ......................................................................... 23
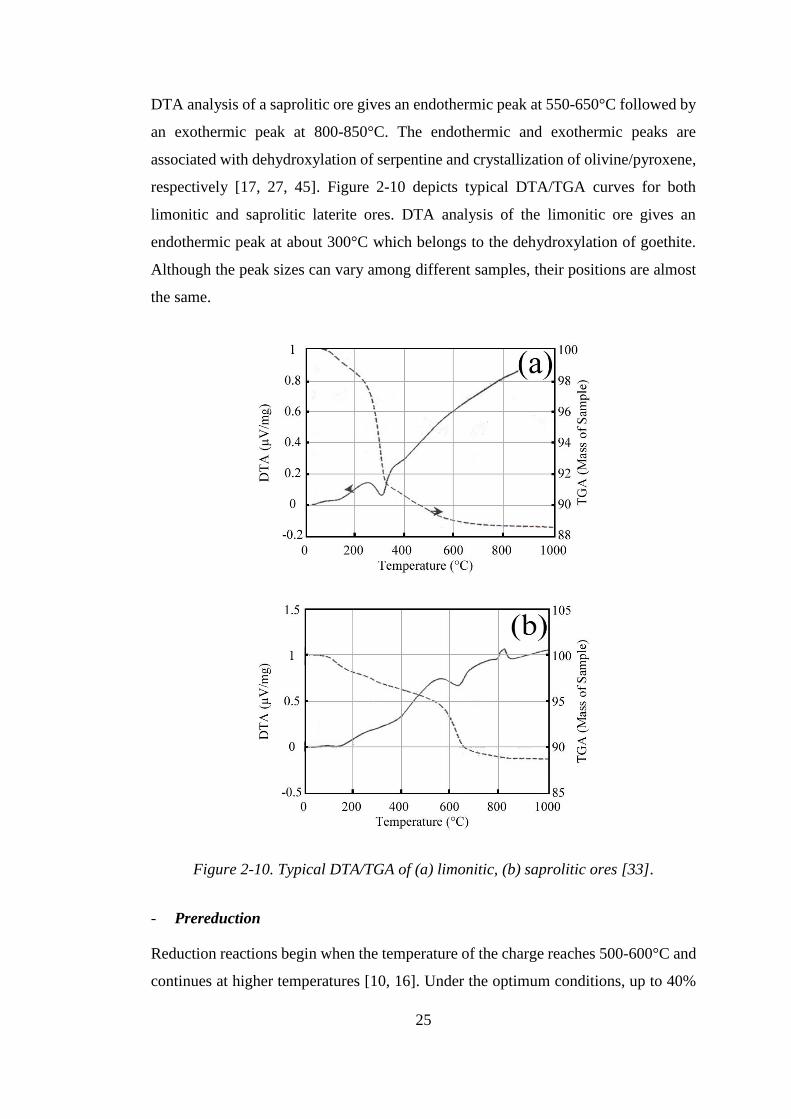
Figure 2-10. Typical DTA/TGA of (a) limonitic, (b) saprolitic ores [30]. ................ 25
Figure 2-11. SiO2-MgO-FeO ternary phase diagram showing slag composition for
laterite smelters (adapted from [25]). ......................................................................... 28
Figure 2-12. Liquidus temperatures as a function of SiO2/MgO indicating slag tapping
and liquidus temperature pairs for various ferronickel smelters. ............................... 28
Figure 2-13. Liquidus temperatures for Fe-Ni-C system. .......................................... 29
Figure 2-14. Liquidus diagram and oxygen isobars for FeO-Fe2O3-SiO2 ternary
system. ........................................................................................................................ 30
Figure 2-15. A comparison of smelting modes for saprolite (here indicated as
garnierite) and limonite ores. ..................................................................................... 31
Figure 2-16. Grade-recovery relationship for smelting of three different laterite ores.
.................................................................................................................................... 33
xviii
Figure 2-17. Dependency of nickel and cobalt recovery on iron recovery (exp.:
experimental results; calc.: calculated results) [33]. .................................................. 34
Figure 2-18. Nickel laterite deposits of Turkey. ........................................................ 35
Figure 3-1. Particle size distribution of the ore used in the experiments. .................. 39
Figure 3-2. Photograph of the muffle furnace and chamotte tray used in the calcination
experiments. ............................................................................................................... 42
Figure 3-3. General view of the gas supply for both Ar and N2-CO2-CO mixtures. . 43
Figure 3-4. Schematic presentation of a gas manometer. .......................................... 44
Figure 3-5. Schematic diagram of the horizontal tube furnace and the crucible used in
the prereduction experiments. .................................................................................... 45
Figure 3-6. Schematic diagram of the vertical tube furnace and the crucible used in the
smelting experiments. ................................................................................................ 48
Figure 3-7. Heating and cooling regime in the smelting tests. .................................. 49
Figure 4-1. Particle size distribution of the ROM ore. .............................................. 54
Figure 4-2. Particle size of the sample before and after tumbler test. ....................... 54
Figure 4-3. SEM micrograph of limonitic ore particles, (a) morphology and (b)
metallographic section. .............................................................................................. 55
Figure 4-4. Variation of (a) low concentration and (b) high concentration
elements/compounds with particle size. .................................................................... 56
Figure 4-5. XRD pattern of Sivrihisar limonitic ore. ................................................. 57
Figure 4-6. XRD patterns of different preparations of the clay-sized fraction. ......... 58
Figure 4-7. XRD pattern of the smectite containing rock taken from the mine site. . 59
Figure 4-8. DTA/TG curves of the smectite containing rock taken from the mine site.
.................................................................................................................................... 59
Figure 4-9. The calculated (red line), observed (bold dotted black line) X-ray patterns
and their difference (blue line) for (a) non-clay and (b) clay-sized fractions. ........... 61
Figure 4-10. Distribution of the nickel among the various minerals. ........................ 62
Figure 4-11. DT/TG analysis of Sivrihisar limonitic ore. .......................................... 63
Figure 4-12. Weight loss as a function of time at various temperatures. ................... 65
Figure 4-13. Variations of the final weight loss and time with temperature. ............ 66
Figure 4-14. Room temperature XRD Patterns of -50 mm ore after calcination at
different temperatures for 40 min. ............................................................................. 67
Figure 4-15. Weight loss as a function of time at various temperatures. ................... 68
xix
Figure 4-16. Weight loss during calcination for continuous and fixed-time approaches
and their difference in percent.................................................................................... 70
Figure 4-17. Schematic diagram of the experiment conducted to determine degree of
reversibility. ............................................................................................................... 71
Figure 4-18. Ellingham diagram for all the elements present in the ore. ................... 75
Figure 4-19. 𝐿𝑛 (𝑃𝐶𝑂𝑃𝐶𝑂2) vs. temperature for the main reactions taking place
during the reduction. .................................................................................................. 77
Figure 4-20. Room temperature XRD patterns of the ore samples reduced at different
temperatures for 40 min. ............................................................................................ 79
Figure 4-21. SEM photographs of the limonitic ore particles reduced at given
temperatures. .............................................................................................................. 81
Figure 4-22. Variation of the equilibrium constant for the given reactions. .............. 82
Figure 4-23. Remaining carbon in the samples reduced at various temperatures ...... 83
Figure 4-24. Effect of temperature on the metallization of (a) iron, (b) nickel and (c)
cobalt. ......................................................................................................................... 85
Figure 4-25. Reduction rate (metallization percentage) of nickel as a function of
temperature reported in the literature [42]. ................................................................ 86
Figure 4-26. Selectivity change with temperature for various coal amounts. ............ 87
Figure 4-27. Effect of coal amount on metallization of (a) iron, (b) nickel and (c)
cobalt. ......................................................................................................................... 88
Figure 4-28. The relationship between the excess coal and the remaining carbon in the
samples reduced at 1000°C. ....................................................................................... 89
Figure 4-29. Effect of time on metallization at the given temperature. ..................... 90
Figure 4-30. Metallization change with temperature under the given atmospheres for
(a) iron, (b) nickel and (c) cobalt. .............................................................................. 92
Figure 4-31. Remaining carbon and weight loss variation with temperature for the
given furnace atmospheres. ........................................................................................ 93
Figure 4-32. Relationship between the selectivity and temperature for the given
atmospheres. ............................................................................................................... 94
Figure 4-33. Variations in (a) weight and (b) grade of the ferronickel product with
temperature. ................................................................................................................ 98
Figure 4-34. Variation of NiO content of the slag with temperature. ........................ 99
xx
Figure 4-35. Variation of (a) Al2O3 and (b) FeO content of the slag with temperature.
.................................................................................................................................. 100
Figure 4-36. Variations in the weight and the grade of the ferronickel product with
excess coal. .............................................................................................................. 102
Figure 4-37. Variation of NiO content of the slag with excess coal. ....................... 102
Figure 4-38. Variation of (a) Al2O3 and (b) FeO content of the slag with excess coal.
.................................................................................................................................. 103
Figure 4-39. Variations in the weight and the grade of the ferronickel product with
retention time. .......................................................................................................... 104
Figure 4-40. Variation of NiO content of the slag with retention time. ................... 105
Figure 4-41. Variation of Al2O3 content of the slag with retention time. ................ 105
Figure 4-42. Variations in the weight and the grade of the ferronickel product with
MgO addition. .......................................................................................................... 106
Figure 4-43. Variation of NiO content of the slag with MgO addition. .................. 107
Figure 4-44. Variation of Al2O3 content of the slag with MgO addition. ................ 107
Figure 4-45. (a) Button-shaped ferronickel pieces and (b) schematic diagram of a
sample smelted in the small rectangular prism-shaped alumina crucibles. ............. 108
Figure 4-46. (a) Cross section of a sample smelted in the rectangular prism-shaped
alumina crucibles and (b) photograph of a sample indicating the severe interaction
between the slag and crucible. ................................................................................. 109
Figure 4-47. (a) A Haldenwanger smelting crucible, (b) typical metal and slag samples
obtained after smelting. ............................................................................................ 110
Figure 4-48. Effect of coal on the grade and weight of the ferronickel product. ..... 115
Figure 4-49. (a) C and (b) Si content of ferronickel vs. FeO in slag. ...................... 117
Figure 4-50. SEM photographs of the slag; (a) low magnification, (b) high
magnification and (c) entrapped metal particles in slag. ......................................... 118
Figure 4-51. EDS analysis of (a) matrix, (b) strips and (c) regular phases in the slag.
.................................................................................................................................. 119
Figure 4-52. Typical XRD pattern of the slags. ....................................................... 119
Figure 4-53. Variation of physically lost iron and entrapped ferronickel in slag with
excess coal addition. ................................................................................................ 121
Figure 4-54. Variation of physically lost nickel and grade of the entrapped ferronickel
in slag with excess coal addition. ............................................................................. 122
xxi
Figure 4-55. Chemically lost nickel and cobalt in the slag with excess coal addition.
.................................................................................................................................. 123
Figure 4-56. Variations of the weight and the grade of the ferronickel products with
the addition of calcined colemanite.......................................................................... 128
Figure 4-57. Physically lost (a) Fe, (b) Ni, (c) Co in the slag with colemanite addition.
.................................................................................................................................. 129
Figure 4-58. Chemically lost nickel and cobalt with colemanite addition. .............. 130
Figure 4-59. Fracture surface the sample with (a) 0% and (b) 2.5% colemanite addition
(T=1500°C, Ar Atmosphere). .................................................................................. 134
Figure 4-60. The equilibrium partial pressure of boron oxide with temperature. .... 135
Figure 4-61. SEM micrograph of the sample heated at a) 1450°C and b) 1480°C. . 136
Figure 4-62. Expected mechanism for metal-slag separation. ................................. 137
Figure 4-63. Cross section of the samples treated at a) 1450°C and b) 1480°C. ..... 138
Figure 4-64. SEM micrograph of a particle reduced at 1100°C. ............................. 139
Figure 4-65. Suggested mechanism for metal-slag separation in the crucible. ........ 140
Figure 4-66. SEM micrograph of the Larco ferronickel. ......................................... 142
Figure 4-67. SEM micrographs of the Larco slag. ................................................... 143
Figure 4-68. (a) Low and (b) high magnification SEM photographs of the ferronickel
particles entrapped among the Cr-rich particulate phase. ........................................ 144
Figure B-1. Sample preparation flowchart for screen analysis and tumbler test. .... 165

xxii
1
CHAPTER 1
1 INTRODUCTION
Nickel plays an important role in modern infrastructure and technology. It is used in a
wide range of products and various applications because of its superior properties such
as low thermal and electrical conductivities, excellent strength and toughness at
elevated temperatures and high resistance to corrosion and oxidation [1].
The world nickel consumption has increased steadily over the last century. Only
during the last 20 years, it has increased from 900 000 tonnes to more than 1.8 million
tonnes [2]. The demand for nickel is greatly connected to economic growth in China
[3]. In 2011, China produced 9.69 million tons of austenitic stainless steel as the
world’s premier producer [4].
Today, nickel is used in more than 300 000 products. Primary nickel is consumed
mainly in stainless steels, alloy steels, nonferrous alloys and superalloys, and only
minority is used in electroplating, batteries, chemicals and catalysts [1, 4]. End uses
of nickel includes transportation, fabricated metal products, electrical equipment,
petroleum industry, chemical industry, construction, household appliances, and
industrial machinery [4].
Economically important Ni resources are sulfide and oxide (called as laterite) ores.
The early nickel was extracted from laterite ores by smelting of the rich laterite
deposits from New Caledonia in the iron blast furnace in 1879. After that, in 1886,
sulfides deposits of Sudbury (Canada) were mined. Sulfide ores became the world’s
major nickel supply by the early part of the 20th century [5, 6, 7] and retained its
position in nickel industry for years.
Identified land-based resources (referred to as Ni resources in this text) averaging
greater than 1% nickel contain at least 130 million tonnes of nickel. 60% of these
2
resources is contained in the oxide ores with the remainder being in the sulfide ores
[4]. Although laterites form the majority of Ni resources, historically the bulk of Ni
has been produced from sulfide ores [8]. This difference is related to political,
geographic, technical and economic factors as follows [5, 9]:
Sulfide deposits are generally located in politically stable countries and close
to the main nickel markets.
In contrast to oxide ores, the nickel content of sulfide ores can be concentrated
relatively easily and cheaply by common methods.
The energy costs for laterite processing are 2-3 times higher than that for
sulfide ores. Laterite treatment is therefore very sensitive to energy costs.
The possibility of recovering some valuable byproducts also favors
exploitation of sulfide ores.
Despite, depletion of high grade sulfide ores and increased cost of underground
mining, especially labor costs together with the improvements in laterite technology
attracted attentions towards laterites [6, 10]. The share of laterites from nickel
production has increased from less than 10% to 42% during the second half of the last
century. In 2004, it was predicted that this share will rise up to more than 50% by 2012
[7]. However, by virtue of wide failures in laterite industry and global economic
recession since the year 2008, another study in 2010 cast doubt on laterites becoming
the dominant resource within the coming few years [8].
At the present time, some successful laterite projects are being continued to be
implemented. The Barro Alto and Onca Puma laterite projects in Brazil have been
producing ferronickel since early 2011. The Goro hydrometallurgical complex in New
Caledonia began producing a mixed nickel-cobalt hydroxide precipitate (MHP) for
export in 2010 [4] and reached full production in 2013. This situation denotes that
laterite technology is still continuing to grow and the coming decades promise to be
an attractive one for nickel laterites.
During the last decades, a number of laterite reserves have been discovered in Turkey,
but not a considerable effort has been made to commercially process these reserves
until a few years ago. Laboratory researches, meanwhile, were also conducted during
the last years [11, 12, 13]. However, almost all of them addressed either mineralogical
3
aspects or hydrometallurgical processing of these ores. Being the owner of Sivrihisar
laterite reserve, META Nickel and Cobalt Company is recently searching for an
appropriate processing method to extract nickel from this reserve. This thesis study
aimed, in parallel, to research pyrometallurgical nickel extraction from Sivrihisar
limonitic laterite ore. The ore was fully characterized as the important first stage. Then,
its calcination, reduction and smelting behaviors were studied.

4

5
CHAPTER 2
2 LITERATURE REVIEW
2.1 Nickel Resources
Nickel is 24th element in abundance and its concentration in the Earth’s crust is
estimated as 0.008 %. Although nickel is more abundant than copper, zinc and lead,
commercially important nickel ore bodies are fewer [5]. Economic Ni resources are
spread across many regions of the world, mostly in Canada, Russia, Australia, the
Caribbean and the western Pacific archipelago [8]. It has been reported (in 2006) that
reserves with 1.5-3 wt.% Ni contain 64 Mt of metal which can supply for around 40
years assuming no recycling. This image, however, can change, since economical
metal reserves are closely linked to changes in metal prices and technological
developments. Increased metal prices and/or advancements in processing technologies
lower the cut-off grade and hence raise the amount of resources [14].
In addition to sulfide and laterite type ores, nickel is also found in deep-sea nodules.
Sea nodules were discovered in the late 1800s on extensive area of the ocean bed, but
nevertheless their exploitation has not occurred until today. This has not been due to
the shortage of practical recovery methods. Exploitation has been delayed by the world
geo-political situation, environmental issues and the important fact that the present
land-based resources (sulfide and laterite types) meet the current market need [15].
Sulfide and laterite ores are very different in terms of composition:
- Sulfide ores have up to 2% Ni and usually are accompanied by Cu, Co and Fe
sulfides. Precious metals and undesirable minor constituents such as As, Se, Te, etc.
are also present. Sulfide ores can be concentrated in a product of ~6-20% Cu-Ni by
mineral dressing techniques.

6
- Oxide ores contain up to 3% Ni, typically with some Co. They contain considerable
amounts of free water (moisture) and chemically bound water (as hydroxides).
Sometimes its water content can reach 45 wt.%. In spite of many efforts to concentrate
laterites, desired technique has not been developed yet and only minor upgrading by
screening can be applied [16, 17]. Concentration of laterites for Ni has been tried by
magnetic separation but the method showed a low nickel recovery at 50 – 70% range
[18]. The reason for quite difficult concentration is the fine-grained nickel bearing
minerals which are finely incorporated and distributed throughout the ore [17].
Coexistence of laterite and sulfide-based reserves in the same geographic area is
unlikely due to main geological differences. An exception is a high-grade nickel
sulfide deposit (9.5–14% Ni) in Western Australia at the Silver Swan mining property
which is close to several laterite operations near the goldfields in the Kalgoorlie
area [15].
In this thesis, processing of a laterite type ore has been studied. Accordingly, the next
section will provide just a short information on the sulfide ores and their processing
and the reminder of the text will focus on laterites.
2.1.1 Sulfide Ores
Sulfide ores form through volcanic or hydrothermal processes and usually include
copper and/or cobalt, and often minor amounts of precious metals such as gold,
platinum, palladium and rhodium [8]. They typically contain 0.4-2% Ni, 0.2-2% Cu,
10-30% Fe and 5-20% S. The balance consists of SiO2, MgO, Al2O3, and CaO. The
principal nickel-bearing mineral is pentlandite (Fe9S8). In addition, pyrrhotite (Fe7S8),
pyrite (FeS2) and chalcopyrite (CuFeS2) may be present but they are uncommon. The
nickel sulfides are normally intergrown with the iron sulfides or dissolved in crystal
lattice of iron sulfides. As a result, rejection of iron sulfides and rock, and production
of high grade nickel concentrates are not achieved. Typical grades of concentrates
range from 6 to 20% Cu-Ni [5, 16].
Sulfide ores have been the principal source of metallic nickel [19] and a large number
of valuable byproducts including the platinum group metals (PGMs), gold, silver,
selenium, tellurium, copper, cobalt, sulfur, and iron [5].
7
With the exception of Sherritt-Gordon pressure leaching, sulfide concentrates are
treated using pyrometallurgical methods. Pyrometallurgical processing of nickel
sulfide ores is very close to the other base metals and includes roasting, smelting and
converting [10]. Depending on the grade of ores, copper is obtained as an important
by-product or co-product. Sulfide ores are mined by either open-cut or underground
mining. The ore is concentrated via flotation [8]. The concentrate is roasted in air
above 700°C to adjust its sulfide content. The roasted product is smelted in a
reverberatory, electric or flash smelting furnace at 1250-1300°C. Siliceous fluxes are
also added to the furnace. At the end of the smelting step, a molten matte containing
nickel, copper and iron is obtained. In the converting step, the iron is oxidized and
removed in the slag. The remaining high grade Ni-Cu matte is refined hydro- or
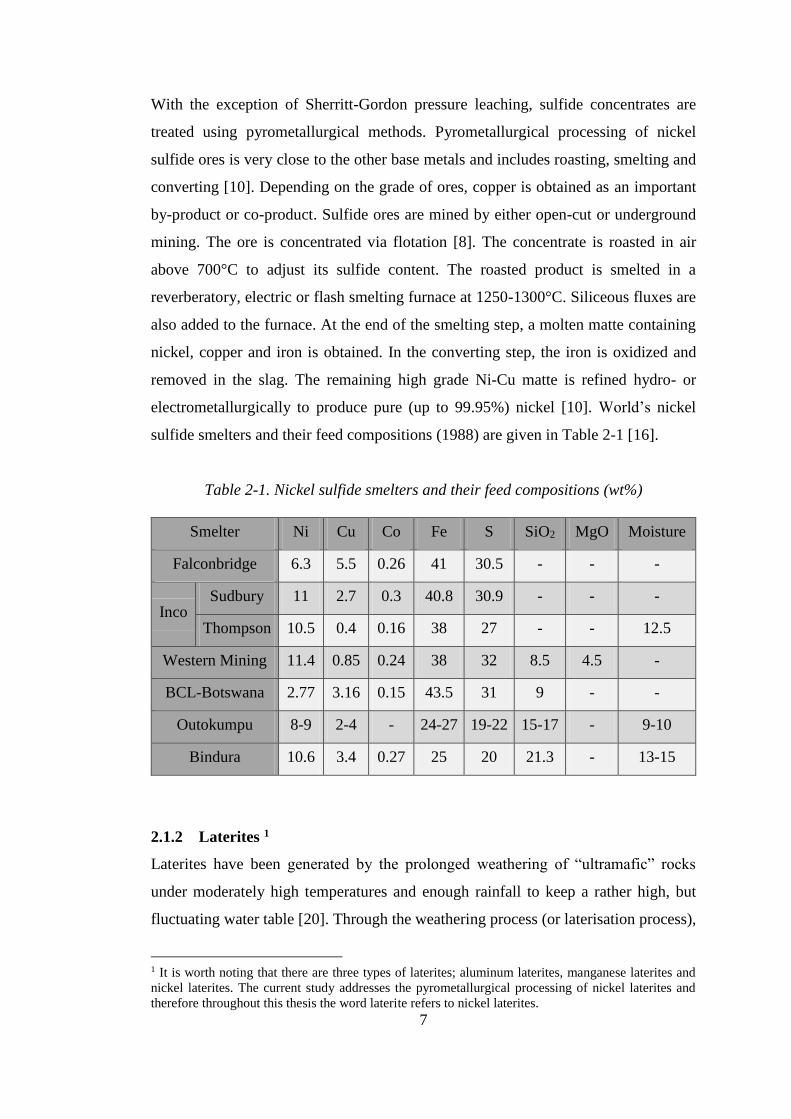
electrometallurgically to produce pure (up to 99.95%) nickel [10]. World’s nickel
sulfide smelters and their feed compositions (1988) are given in Table 2-1 [16].
Table 2-1. Nickel sulfide smelters and their feed compositions (wt%)
Smelter Ni Cu Co Fe S SiO2 MgO Moisture
Falconbridge 6.3 5.5 0.26 41 30.5 - - -
Inco Sudbury 11 2.7 0.3 40.8 30.9 - - -
Thompson 10.5 0.4 0.16 38 27 - - 12.5
Western Mining 11.4 0.85 0.24 38 32 8.5 4.5 -
BCL-Botswana 2.77 3.16 0.15 43.5 31 9 - -
Outokumpu 8-9 2-4 - 24-27 19-22 15-17 - 9-10
Bindura 10.6 3.4 0.27 25 20 21.3 - 13-15
2.1.2 Laterites 1
Laterites have been generated by the prolonged weathering of “ultramafic” rocks
under moderately high temperatures and enough rainfall to keep a rather high, but
fluctuating water table [20]. Through the weathering process (or laterisation process),
1 It is worth noting that there are three types of laterites; aluminum laterites, manganese laterites and
nickel laterites. The current study addresses the pyrometallurgical processing of nickel laterites and
therefore throughout this thesis the word laterite refers to nickel laterites.

8
magnesium, iron, nickel, and colloidal silica are leached from these rocks by
groundwater containing carbon dioxide. Main part of the iron rapidly oxidizes near
the surface in contact with air and precipitates as goethite and hematite. The dissolved
nickel and magnesium, and the colloidal silica, percolate downwards until the acidic
solution is neutralized reacting with rock and soil. At this point, they precipitate as
hydrated magnesium silicates [5, 6].
The only exception to the laterisation process, is the Greek laterites. Greece has
extensive nickel laterites representing 90% of laterite deposits in the European Union
(the rest being in Finland) [1], but they are majorly low-grade limonitic type (a type
of laterites that will be explained in the coming paragraphs). The Greek laterites are
sedimentary and have been formed by transport and sedimentation of material which
has been generated through the laterisation elsewhere [21].
Depth of laterite profiles are typically 6 to 15 m, but sometimes it can reach up to 60
m [20]. Laterisation rate has been assessed at 20 mm per 1000 years (Nahon and Trady,
1992; cited in [22]) and therefore it may take more than one million years for a laterite
deposit to form. Because of the shallow nature and the large area of laterites, they are
mined by open-cut method [8]. Figure 2-1 depicts the distribution of laterites
worldwide.
Figure 2-1. Distribution of the world nickel laterites according to contained nickel
(Adapted from [7]).
Due to the nature of the laterisation process, laterites are of a layered structure. These
layers are never separated as distinct zones and there are gradational boundaries
9
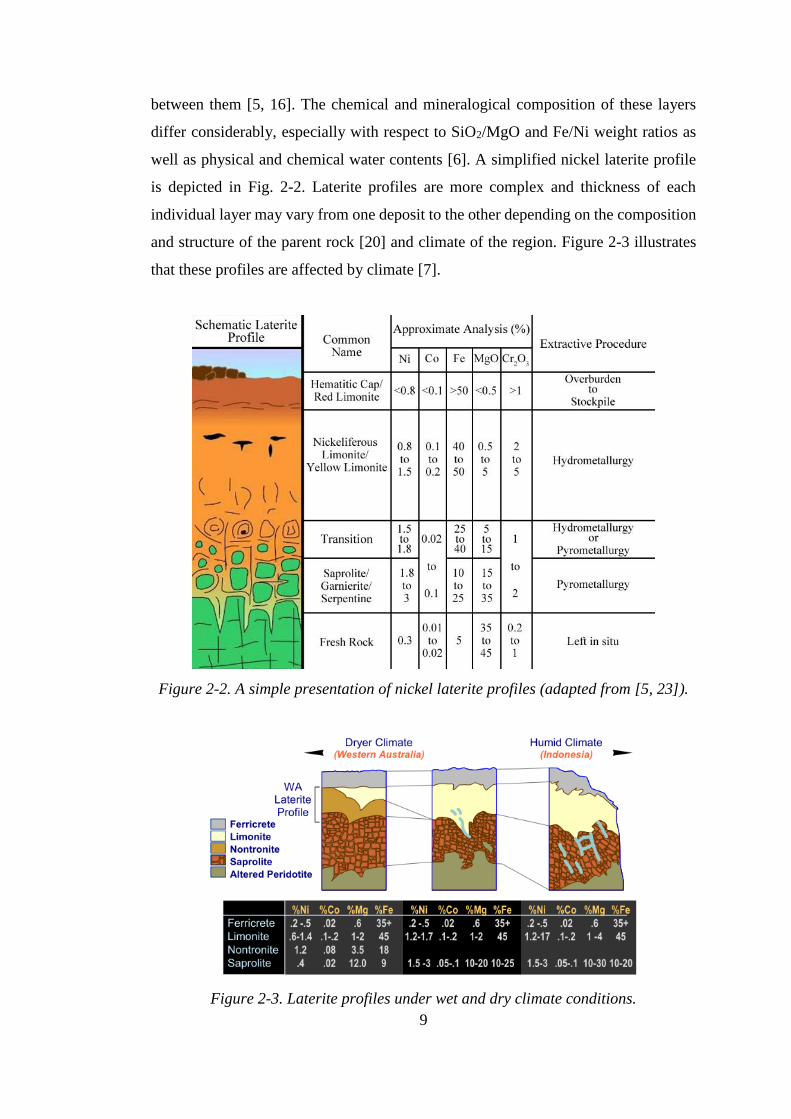
between them [5, 16]. The chemical and mineralogical composition of these layers
differ considerably, especially with respect to SiO2/MgO and Fe/Ni weight ratios as
well as physical and chemical water contents [6]. A simplified nickel laterite profile
is depicted in Fig. 2-2. Laterite profiles are more complex and thickness of each
individual layer may vary from one deposit to the other depending on the composition
and structure of the parent rock [20] and climate of the region. Figure 2-3 illustrates
that these profiles are affected by climate [7].
Figure 2-2. A simple presentation of nickel laterite profiles (adapted from [5, 23]).
Figure 2-3. Laterite profiles under wet and dry climate conditions.
10
Laterites are classified into three main types based on the composition and the
mineralogy of these layers [5, 8, 17, 24]:
(i) Limonite type which is enriched in iron, but depleted in silica and
magnesium (15–32% or higher Fe, MgO < 10%). Limonite mainly consists
of iron oxides of which goethite (α-FeO·OH) is the major constituent. It is
also relatively rich in cobalt and chromium. Iron oxides in laterites are
pretty poorly crystalline with nanometric crystal sizes and large surface
areas. These characteristics may result in substantial absorption of number
of ions, in particular Al3+, from soil. Iron oxides are seldom present in
laterites in their pure form, because these ions substitute for iron [25].
(ii) Saprolite type, which is also called as garnierite or serpentine, contains
lower iron and higher magnesium (Fe < 12% and MgO > 25%). The most
important Ni-bearing minerals belong to the garnierite group which are
hydrous nickel-magnesium silicate minerals. NiO content of these minerals
imparts green color to them. According to (Mg+Ni)/Si ratio, they are
divided into three subgroups; 3/2 corresponds to serpentine and chlorite
groups, while 3/4 corresponds to clays.
(iii) Nontronite which is an intermediate type and lies between limonitic and
saprolitic types (12–15% Fe and 25–35% or 10–25% MgO).
Laterites are made up of composite and single phase particles of varying sizes. Ore
particles have complex structures including fine grain mixture, intergrowth, vein-
like/plate-like, porous and dense microstructures [26]. This micro-scale,
heterogeneous and complex mineralogy of the laterites together with the fact that the
value elements (nickel and cobalt) are present in solid solution rather than as definite
minerals, make it extremely difficult to upgrade the ore by common concentration
methods (e.g. flotation) [3, 23, 24]. Therefore, every tonne of laterite must be
processed to extract valuable metals, resulting in high capital and operating costs [3,
27].
The variability in composition and lack of an applicable concentration method also
means that various ores must be blended to keep the feed composition varying over a

11
narrow range. This is essential for most processes and, under these circumstances,
selective mining must be applied to produce the required blend [23].
The only practical process to upgrade laterites is rock rejection. Laterite ores
commonly contain Ni-deficient particles which are typically surrounded by tiny and
loosely attached nickeliferous particles. Thus, a gentle abrasion may detach the soft
nickel-bearing material from the surface of the hard particles. Rejection of these
particles by screening can result in significant upgrading. This can be done in a
‘‘trommel’’ rock rejection device or in an autogenous grinding drum [21].
In one study, high gradient magnetic field has been applied to a lateritic ore for the
preparation of a suitable leaching feed (for hydrometallurgical processing). The high
gradient magnetic field takes the advantages of slightly magnetic nickeliferous
minerals such as limonite and serpentine to separate them from nonmagnetic quartz
and calcite. The process would be effective provided that a high intensity magnetic
field has been used and a satisfactory mineral liberation has been previously attained
by grinding. It was reported that, under the optimum conditions, more than 95% of Ni
can be recovered while up to 37% of CaO is removed and 18% of feed weight is
reduced [21].
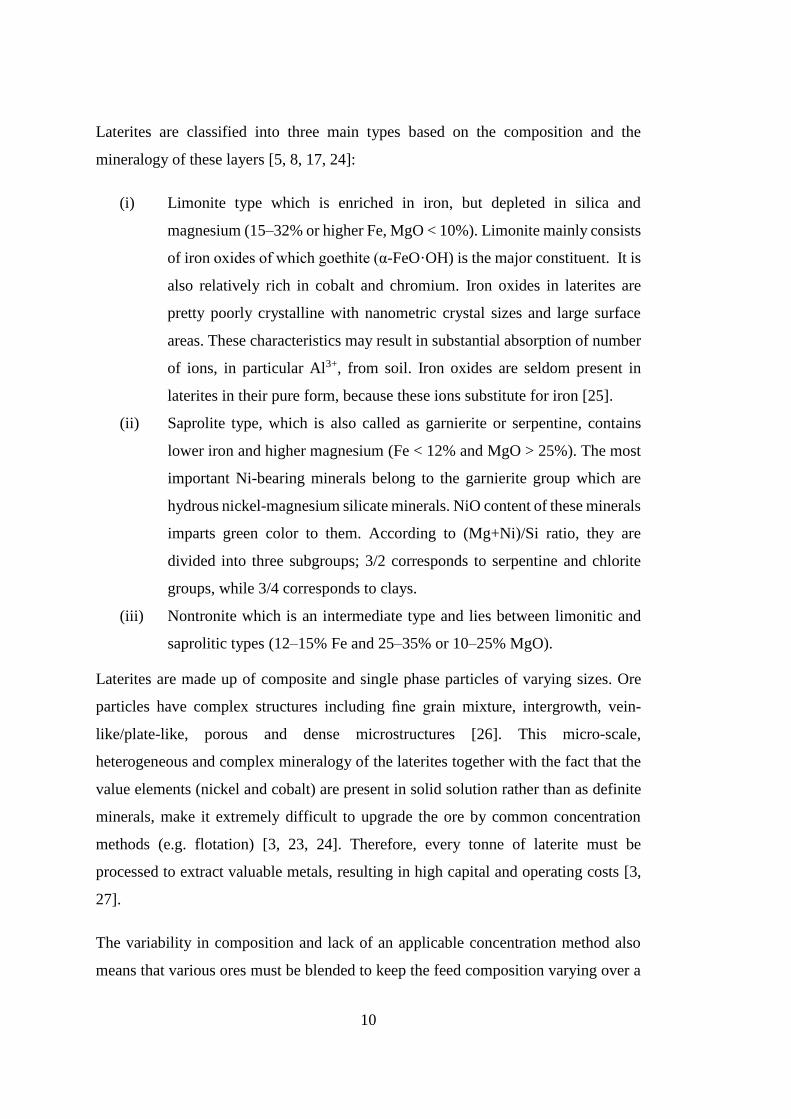
2.2 Laterite Processing
The mineralogy and type of the lateritic ore impact the processing method for the
extraction of nickel. Complex mineralogy of these ores has given rise to a number of
pyro- and hydrometallurgical extractive techniques of which four are commercially
attractive: matte smelting, ferronickel smelting via the rotary kiln-electric furnace
(RKEF) process, high pressure acid leaching (HPAL) and the Caron process [7, 23].
Each process leads to a different product as shown in Table 2.2. Figure 2.4 shows the
generalized flow chart for these processes.
It is almost universally accepted that saprolite type is suitable for smelting, whereas
limonite type is best treated by hydrometallurgical processes [6, 16, 27, 28]. The first
reason for this division is the heterogeneous chemical and mineralogical composition
of saprolites compared to limonites. The heterogeneous saprolitic ore necessitates a
more flexible processing method, i.e. pyrometallurgy. The other reason is the high
12
magnesia content of the saprolitic ores which considerably increases acid consumption
in hydrometallurgical processing. Besides, saprolites have desirable slag forming
minerals that are not present in limonites. On the contrary, limonites with more
homogeneous mineralogy and composition, and less acid consumption are preferred
to be treated hydrometallurgically [5, 23]. Processing of the ores containing
comparable amounts of the two types can be problematic [23].
Table 2-2. Processing methods of nickel laterites and corresponding products [1]
Processing method Product
Matte smelting Nickel matte
Ferronickel smelting Ferronickel
HPAL Briquettes and nickel powder
Caron process NiO
Figure 2-4. Flow chart for various methods of processing of laterites [7].
Although it has been reported that about 40% of the laterites are appropriate for
pyrometallurgy [6, 17], the current situation in nickel industry draws a quite different
image of the processing configuration. The main nickel laterite projects worldwide
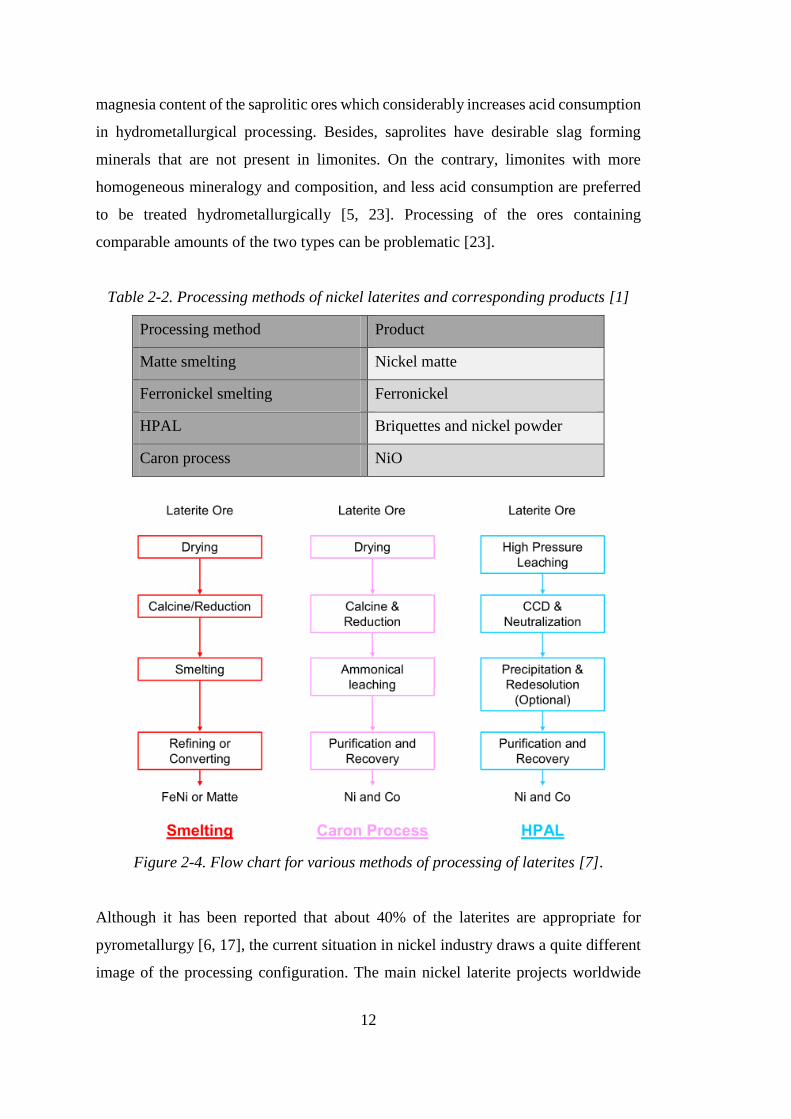
13
and processing configuration is depicted in Fig. 2-5. According to this figure, about
70% of laterite is being processed by the RKEF process.
Figure 2-5. Nickel laterite projects and processing configuration (2008) (data
derived from [8]).
In spite of the fact that RKEF and HPAL are well proven and most common methods
for the processing of laterites, there is a big interest in alternative methods with less
energy requirement. Heap leaching (leaching under atmospheric pressure) [29] and
selective reduction followed by physical upgrading (either flotation or magnetic
separation) have been two avenues [27]. Heap leaching, although an old method, has
emerged newly in nickel industry. Two heap leach projects are targeted at Çaldağ in
Turkey and Murrin Murrin in Australia [8].
Low capital costs and reduced engineering problems are the two main advantages of
heap leaching over HPAL and RKEF. But lower recoveries, higher acid consumption
and extended leaching time are the obstacles to atmospheric leaching being a
commercial processing method [8, 23].
In the following sections, HPAL, Caron process and smelting to matte will be
described briefly. Then RKEF will be reviewed in more detail as the subject of this
study.
14
2.3 Hydrometallurgical Processes
The two major hydrometallurgical methods for the processing of laterites are HPAL
and the Caron process. The Caron process is actually a combination of both pyro and
hydro methods, but it is customarily classified as a hydrometallurgical process.
2.3.1 The HPAL Process
The HPAL process utilizes high temperatures (245-270°C) and high pressures (up to
5.4 MPa) to leach the limonitic ore in sulfuric acid. The solid residue is separated from
the solution by Counter-Current Decantation (CCD). There are several ways for
purification of the solution. Final product can be electrolytic nickel, nickel oxide or
nickel briquettes. Some plants produce mixed hydroxides or mixed sulfides as an
intermediate products which should be refined elsewhere [7, 8].
The ore to be treated with HPAL needs to contain as low saprolite as possible since
extraction of the nickel from silicate structure is more difficult [26]. Furthermore, it
should preferably contain Mg + Al less than 5% as their compounds are high acid
consumers [7, 28].
The first HPAL plant was constructed at Moa Bay (Cuba) in 1959 [8]. In fact there
were no further commercial PAL operations until the 1990s when three new plants
were constructed in Western Australia in 1998. Although, at the outset, the low capital
costs became the incentive for the establishment of the new plants, maintenance costs
was far beyond the assessments [3]. Two of the Australian plants have been closed
and only one remained in operation (Murrin Murrin plant) [8].
Usage of titanium lined autoclaves and other improvements in technology minimized
the processing costs and encouraged new projects. Coral Bay (Philippines) was later
built in 2005 which seems to be the most successful plant to date. Currently, some new
large HPAL laterite projects are under development [8] including Ambatovy
(Madagascar), Ramu (PNG), Taganito (Philippine) and Gördes (Turkey) but they are
not yet in operation. Nevertheless, some engineering problems, particularly scale
formation on the walls of autoclaves and pipes [23], still exist and should be overcome.

15
2.3.2 The Caron Process
Developed in 1940s, the Caron process is the oldest for processing low grade limonitic
ores [3]. It includes drying and reduction roasting followed by leaching in a buffered
ammoniacal solution. During the roasting which is done at about 700°C, the nickel
and cobalt oxides (and some iron oxide [7]) in the ore are selectively reduced to form
alloy (metallic) particles. These particles are then leached away with an ammonium
carbonate solution [30]. The leached liquor is purified and nickel carbonate is
obtained. This intermediate solid product is then reduced in solid state by a reducing
gas to form nickel metal [26]. The leaching residue is a suitable source for iron [31].
The Caron process can be applied to a mixture of limonitic and saprolitic ores, but the
recovery decreases as the saprolite proportion is increased. Nickel and cobalt in the
silicate matrix are difficult to reduce at temperatures used in this process [7].
Comparing with HPAL, the Caron process can tolerate higher Mg amounts [7] and
uses atmospheric leaching. The other advantage is that lixiviant1 in the Caron process
is recycled [3]. The process has also some significant disadvantages that have
restricted its commercial success. It is energy intensive and requires various reagents
in the leaching step [7]. In addition, the nickel and cobalt recoveries are typically ~80
and ~55% respectively, which are lower than those for smelting or HPAL [3].
Only five Caron plants have ever been developed, with four in operation until 2004
[3, 7]. A more recent review in 2010, reported only two Caron plants (see Fig. 2-5)
[8].
2.4 Pyrometallurgical Processing of Laterites
Historically, saprolitic ores have been treated by smelting processes. Pyro methods
include smelting to a Ni-Fe-S matte by adding sulfur, and smelting to ferronickel.
Owing to the much lower free energy of nickel, its separation from the gangue
components such as silica is relatively simple. A controlled reduction allows the
reduction of entire nickel oxide while restricting the degree of reduction of iron oxide,
1 A liquid medium used in hydrometallurgy to selectively extract the desired metal from the ore [93].
16
but a complete separation of nickel from iron cannot be achieved by selective
reduction [5, 7, 16].
It is proposed that matte smelting is suitable when the smelting produce a slag with
low melting temperature where the Ni containing phase should also have low melting
temperature [7]. The liquidus temperature of S-deficient mattes (i.e. PT Inco) is
essentially controlled by the S content. Typically the liquidus temperature of a matte
with 8-10% S is ~1300°C [16]. Ores that produce slags having high melting
temperatures are more appropriate for ferronickel smelting [7].
2.4.1 Smelting to Matte
Saprolitic ore was first smelted in blast furnace in 1870s. The process was developed
by Societ´e Le Nickel (SLN) to produce ferronickel, but they ran into difficulties with
eliminating sulfur from the alloy and switched the operation to produce Fe-Ni sulfide
matte [5].
The process is based on the larger affinity of nickel for sulfur compared with that of
iron and the larger affinity of iron for oxygen compared with that of nickel [23]. The
ore is mixed with a flux, a reductant and a source of sulfur. The source of sulfur can
be a sulfide mineral or elemental sulfur. Almost all of the nickel and a large fraction
of the iron are reduced and react with sulfur to form a matte. Fluxing and selective
oxidation in a converter oxidize the iron and eliminate it in the slag to yield a nickel
matte with more than 75% Ni, 20 – 22% S, and less than 1% Fe. This matte is cast,
ground, and roasted in fluidized-bed roasters to remove sulfur. It is then chloridized
via roasting in a rotary kiln, followed by acid leaching to eliminate copper. Finally,
the nickel oxide product is smelted and reduced with coke and metal is obtained.
Today, laterites are smelted in electric furnaces, and matte smelting is practiced only
in former Soviet Union [5], and Inco’s Sorowako operation (Indonesia) [6].
2.4.2 Smelting to Ferronickel
In this case, the ore is smelted to yield a ferronickel product via the Rotary Kiln-
Electric Furnace (RKEF) process. RKEF is a two stage process which involves drying,
calcination and partial reduction of the ore in a rotary kiln, followed by smelting in an
electric arc furnace. Depending on the ore grade, the ferronickel product can contain
17
20-40% nickel [27]. Ferronickel production accounted for 19% of the annual new
nickel output in 2002 [15]. This value reached to more than 35% in 2010 (derived
from the data in [8]) indicating the growing importance of ferronickel smelting in
nickel industry. Two typical ferronickel classifications, one based on the nickel grade
and the other based on the carbon content of ferronickel product, are given in
Appendix A.
Electric furnaces were introduced to nickel industry in 1958 by SLN and replaced blast
furnace operations [5]. It has also been reported that the RKEF process is a
modification of LM process which had been previously invented by Professor L.
Moussoulos and implemented in Larco during the 1960s [32]. Regardless of its origin,
there has been an unbroken technology refinement over time, especially in the late 20th
century. Improved productivities of kilns and furnaces have given rise to high powered
and smaller units which can fulfil production goals at much lower capital and operating
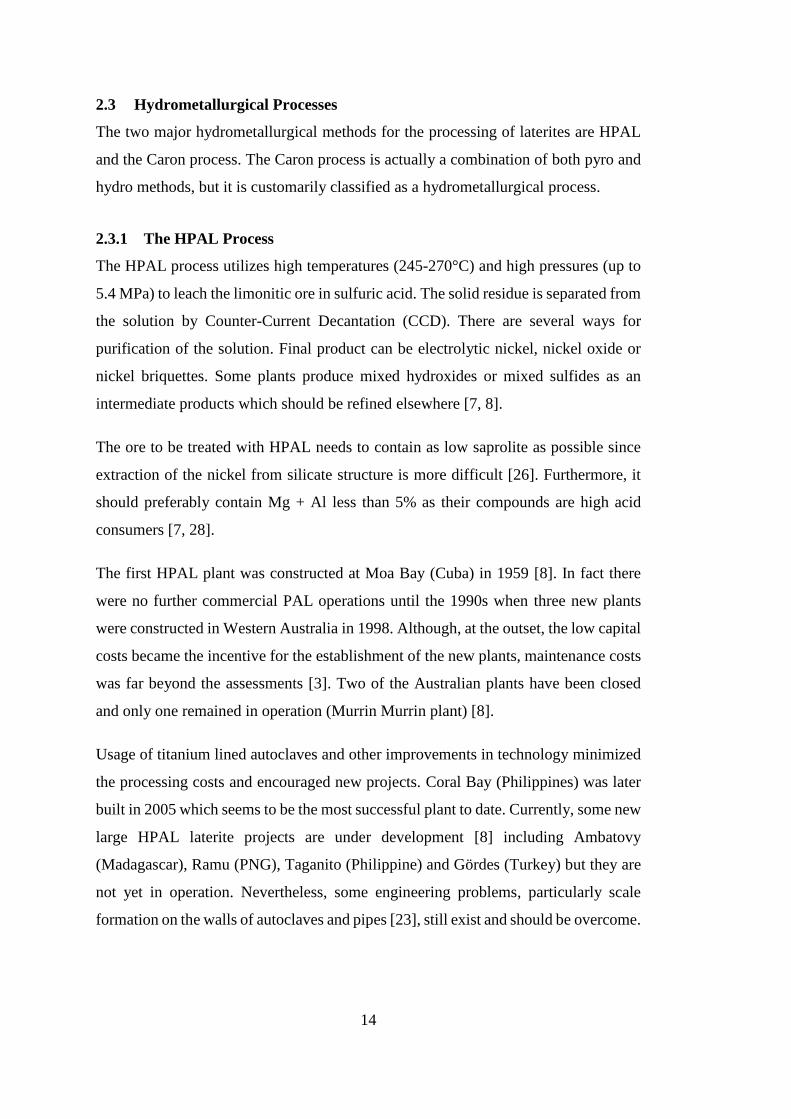
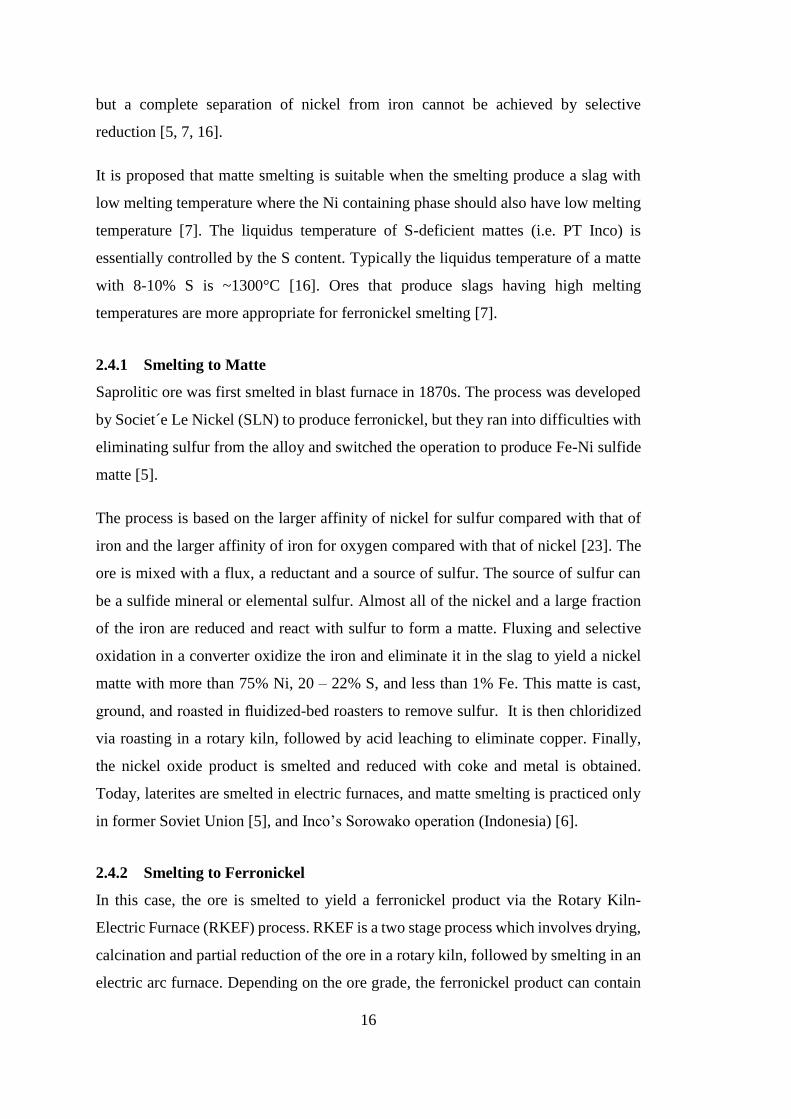
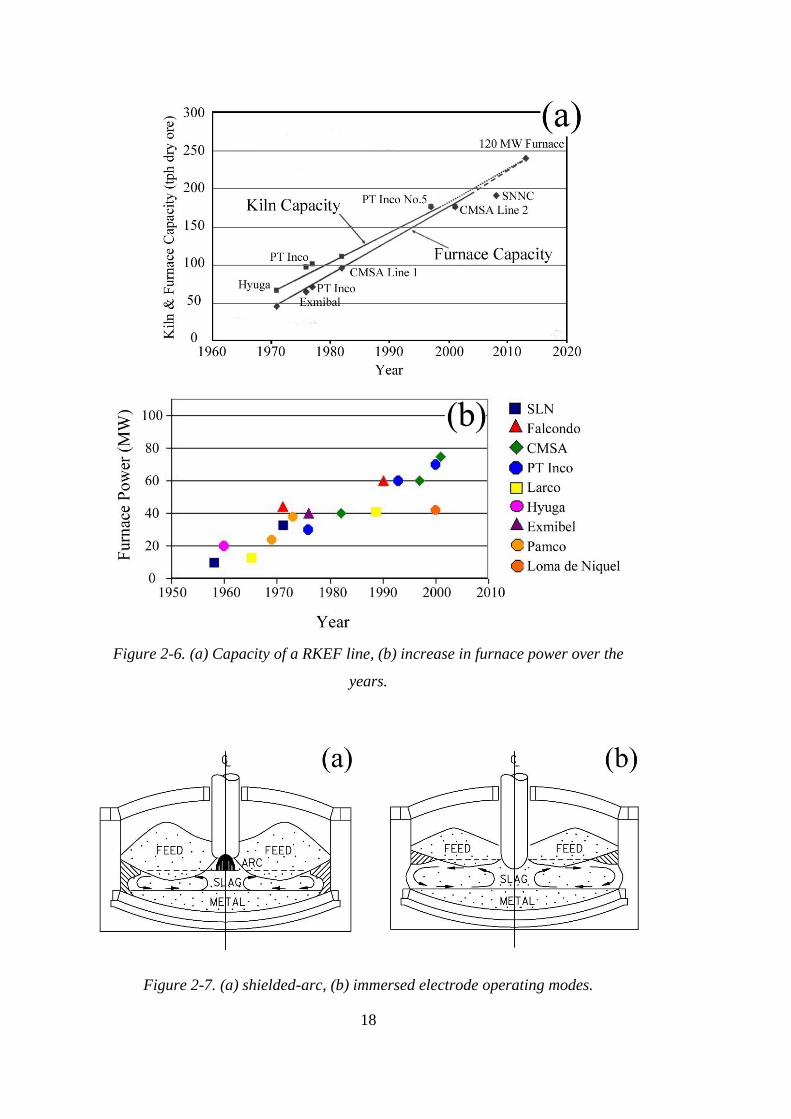
costs per tonne of ferronickel. Figure 2-6-a [33] shows kilns and furnace capacities
over the past 45 years and Fig. 2-6-b [34] shows the increase in furnace power in the
meantime. A single RKEF line consisting of one kiln (240 t/h of calcine) and a 120
MW furnace can process 2 million tonnes of dry ore per year [33].
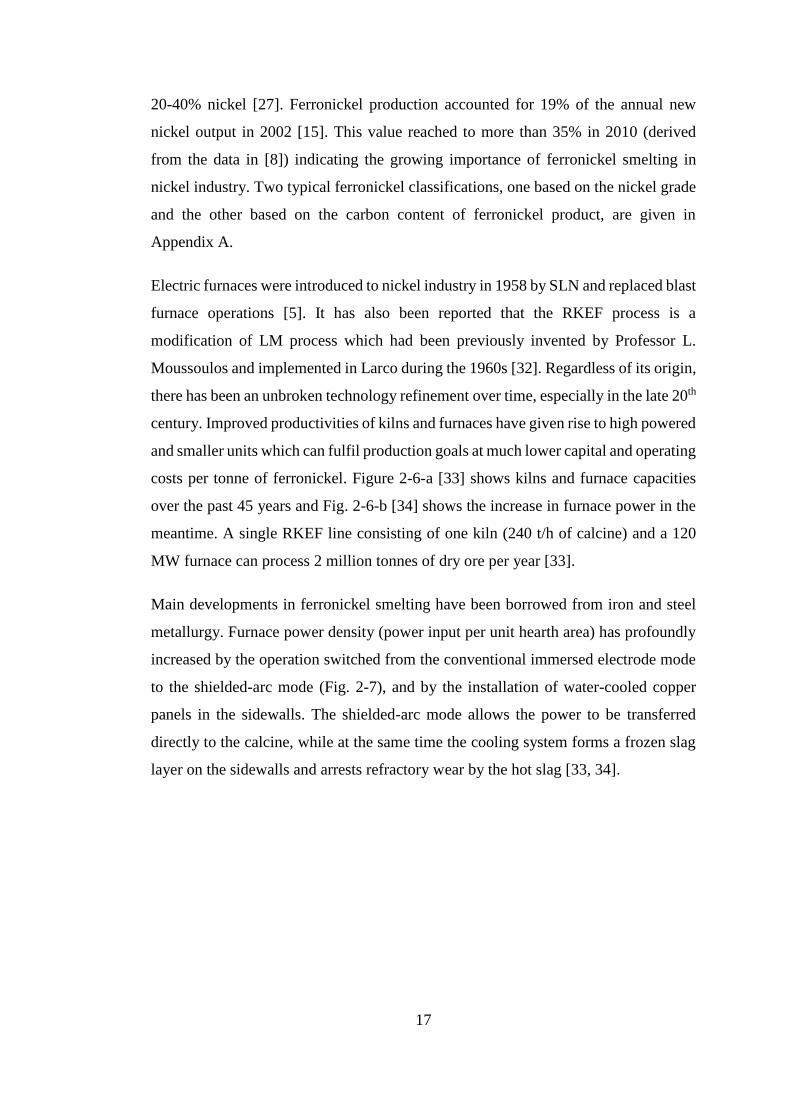
Main developments in ferronickel smelting have been borrowed from iron and steel
metallurgy. Furnace power density (power input per unit hearth area) has profoundly
increased by the operation switched from the conventional immersed electrode mode
to the shielded-arc mode (Fig. 2-7), and by the installation of water-cooled copper
panels in the sidewalls. The shielded-arc mode allows the power to be transferred
directly to the calcine, while at the same time the cooling system forms a frozen slag
layer on the sidewalls and arrests refractory wear by the hot slag [33, 34].
18
Figure 2-6. (a) Capacity of a RKEF line, (b) increase in furnace power over the
years.
Figure 2-7. (a) shielded-arc, (b) immersed electrode operating modes.
19
New technologies for rotary kilns have been adopted from the cement and lime
industries. One of the important improvements is increasing the feed end diameter
which leads to a lower discharge gas velocity and less dust losses [33]. Other efforts
have focused on improving/adopting computerized process control/monitoring and
dependable kiln on-board instrumentation, and achieving higher energy efficiency and
ore throughputs. Replacing refractory bricks by monolithic castable lining has resulted
in longer kiln life [6].
The RKEF process as applied today is a fully developed and reliable one with high
environmental standards [35], and pyrometallurgical treatment of laterites is achieved
almost universally via this process. Popularity of the process can be elucidated by the
following technical advantages [36]:
- short process flowsheet for obtaining marketable product;
- environmental-friendly technology;
- absence of marked dependency of the process parameters on the variability of
the treated ore in terms of mineralogy and composition;
- possibility of treating ores with high MgO and SiO2 contents.
Although different approaches were adopted in various ferronickel plants [16], all the
RKEF flowsheets include the following steps in common each with a certain goal [1,
6]:
- pretreatment: crushing of the ore and mixing with solid reductant and recycled-
dust agglomerates;
- drying: removal of a large portion of the moisture (free water) from the ore;
- calcination-prereduction: removal of the rest of the moisture as well as
crystalline water, preheating of the ore, and solid state reduction (prereduction)
of a considerable portion of the nickel and a controlled fraction of the iron;
- smelting: completion of reduction process, smelting of the roast and separation
of the product ferronickel from the discard slag;
- refining: elimination of minor impurities and enrichment of the ferronickel.
Some other technologies have been tried as an alternative to the conventional RKEF
process, two of which are fluid bed calciner - DC furnace smelting (FB-DC furnace
20
process) [28] and smelting to ferronickel in a two-zone Vaniukov Furnace (VF) [36].
Both of these processes have been launched in a pilot scale. It is also suggested [34,
37] that DC furnaces can be used to treat dust and fines to produce a salable ferronickel
after refining.
The following sections will focus on the steps involved in the RKEF process.
2.4.2.1 Pretreatment (Dressing) & Drying
The run-of-mine ore usually contains 25-30% moisture (sometimes up to 40% or
more) [37]. Water needs much energy to evaporate and heat up and therefore drying
is an essential first step. Most plants use direct fired rotary dryers for this purpose.
The ore is dried at ~250°C and the moisture-laden off-gas leave the dryer at about
100°C. The ore is partly dried to yield an easy-to-handle product with 15-20%
moisture. This controlled residual moisture prevents inordinate dusting [6, 16].
As mentioned before, laterites are not amenable to concentration by the conventional
methods and only a minor upgrading is normally achieved by screening out the large
Ni deficient lumps [6].
In most of the cases, plants receive ores from various mining sites which should be
blended to maintain a relatively constant feed composition [6]. This blend is next
mixed with a solid fuel and recycled dust before being charged to the rotary kiln.
2.4.2.2 Calcination & Prereduction
2.4.2.2.1 General description
The ore from the dryer has 15-20% residual free water and 10-12% crystalline water.
This high amount of water present in the ore necessitates some pretreatments (drying
and calcination) before smelting [10, 37]. Rotary kilns are almost universally used to
dry and preheat the ore before smelting. The exception is Falcondo Smelter
(Dominican Republic) where briquettes of partly dried ore is charged to rectangular
shaft furnaces for drying and calcination [6, 16]. Lurgi Metallurgie has also developed
and tested a process in laboratory scale where fluidized bed reactor is used for this
purpose [38].
21
Function of rotary kilns (RKs) in the earliest plants was restricted to drying and
calcination and operating temperature did not transcend 700°C. As time passed and
the process was developed, several improvements in design and operating technique
were made. The operating temperature was raised to 900-1000°C and reductant was
added to the feed to allow a partial reduction of the ore in the kiln [5]. These
improvements enabled energy conservation in the electric furnace and replacing fossil
fuel for more expensive electrical energy [5, 16, 33]. The maximum energy
conservation can be achieved via a precise control of the conditions in the RK. Figure
2-8 reflects the findings of a study on the effect of reductive roasting (prereduction) in
the RK on the energy consumption in the EF [1].
In the RK, fuel is burned at the discharge end so as to generate the desired reducing
atmosphere which travels counter-current to the charge. The ore moves forward in the
slightly sloped RK and is consecutively dried, preheated, calcined and reduced in solid
state [6]. Depending on the moisture content of the feed, 15-25% of the heat and half
of the kiln length are needed for drying and preheating of the charge to the calcination
temperature. Towards the end of the kiln, the ore is partially reduced.
The feed enters the kiln at ambient temperature and exits it at 750-950°C [33]. Higher
temperatures are avoided since the ore is likely to agglomerate and create accretion on
the kiln walls (ringing) [5, 16, 32]. Hot calcine is poured into a surge bin, which is
discharged into insulated containers periodically. The containers are transported to a
crane, which lifts and places them above the electric furnace where they are discharged
into the feed bins [33].
The off-gas leaves the kiln from the feed end at 250-350°C. A scrubber or an
electrostatic precipitator is used to remove dust from the flue-gas before it is
discharged to air [33]. Dusting rates are commonly 10-20% [6]. Kiln sizes varies in a
wide range from 90 to 185 m in length and 4.2 to 6.1 m in diameter. Figure 2-9-a
shows the typical temperature and gas flow rate profile in a ferronickel rotary kiln.
There is always 150-250°C difference between the charge and the kiln gas
temperatures [33]. Figure 2-9-b shows charge temperature and degree of reduction
along a RK reported in another study [32].
22
Figure 2-8. Effect of (a) reduction (roasting) temperature and, (b) and (c) reduction
time (at 860 and 900°C respectively) on the energy consumption in the smelting step.

23
Figure 2-9. Typical profile of (a) kiln gas temperature and flow rate, (b) charge
temperature and degree of reduction.
2.4.2.2.2 Phenomena in RK
- Calcination
Upon heating, the ore is calcined and its crystalline water is removed (This process is
also called dehydroxylation). Calcination has an appreciable influence on the
24
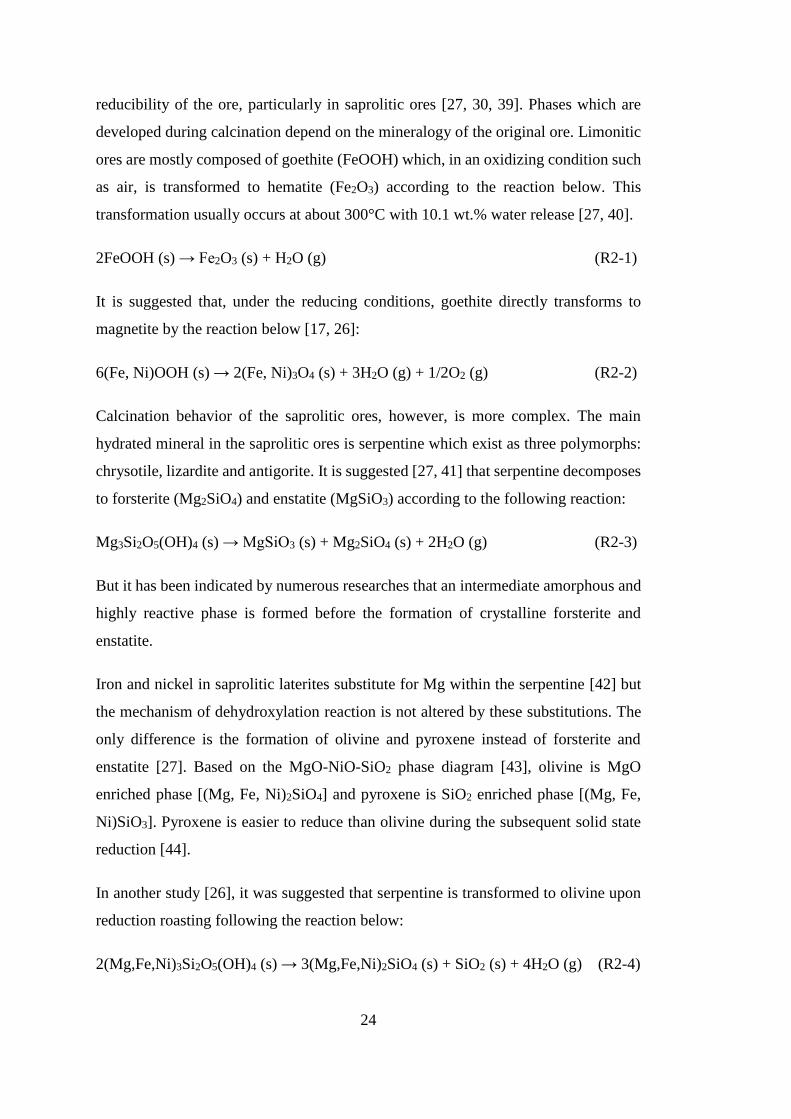
reducibility of the ore, particularly in saprolitic ores [27, 30, 39]. Phases which are
developed during calcination depend on the mineralogy of the original ore. Limonitic
ores are mostly composed of goethite (FeOOH) which, in an oxidizing condition such
as air, is transformed to hematite (Fe2O3) according to the reaction below. This
transformation usually occurs at about 300°C with 10.1 wt.% water release [27, 40].
2FeOOH (s) → Fe2O3 (s) + H2O (g) (R2-1)
It is suggested that, under the reducing conditions, goethite directly transforms to
magnetite by the reaction below [17, 26]:
6(Fe, Ni)OOH (s) → 2(Fe, Ni)3O4 (s) + 3H2O (g) + 1/2O2 (g) (R2-2)
Calcination behavior of the saprolitic ores, however, is more complex. The main
hydrated mineral in the saprolitic ores is serpentine which exist as three polymorphs:
chrysotile, lizardite and antigorite. It is suggested [27, 41] that serpentine decomposes
to forsterite (Mg2SiO4) and enstatite (MgSiO3) according to the following reaction:
Mg3Si2O5(OH)4 (s) → MgSiO3 (s) + Mg2SiO4 (s) + 2H2O (g) (R2-3)
But it has been indicated by numerous researches that an intermediate amorphous and
highly reactive phase is formed before the formation of crystalline forsterite and
enstatite.
Iron and nickel in saprolitic laterites substitute for Mg within the serpentine [42] but
the mechanism of dehydroxylation reaction is not altered by these substitutions. The
only difference is the formation of olivine and pyroxene instead of forsterite and
enstatite [27]. Based on the MgO-NiO-SiO2 phase diagram [43], olivine is MgO
enriched phase [(Mg, Fe, Ni)2SiO4] and pyroxene is SiO2 enriched phase [(Mg, Fe,
Ni)SiO3]. Pyroxene is easier to reduce than olivine during the subsequent solid state
reduction [44].
In another study [26], it was suggested that serpentine is transformed to olivine upon
reduction roasting following the reaction below:
2(Mg,Fe,Ni)3Si2O5(OH)4 (s) → 3(Mg,Fe,Ni)2SiO4 (s) + SiO2 (s) + 4H2O (g) (R2-4)
25
DTA analysis of a saprolitic ore gives an endothermic peak at 550-650°C followed by
an exothermic peak at 800-850°C. The endothermic and exothermic peaks are
associated with dehydroxylation of serpentine and crystallization of olivine/pyroxene,
respectively [17, 27, 45]. Figure 2-10 depicts typical DTA/TGA curves for both
limonitic and saprolitic laterite ores. DTA analysis of the limonitic ore gives an
endothermic peak at about 300°C which belongs to the dehydroxylation of goethite.
Although the peak sizes can vary among different samples, their positions are almost
the same.
Figure 2-10. Typical DTA/TGA of (a) limonitic, (b) saprolitic ores [33].
- Prereduction
Reduction reactions begin when the temperature of the charge reaches 500-600°C and
continues at higher temperatures [10, 16]. Under the optimum conditions, up to 40%
26
of the nickel oxide is reduced to metallic state (Ni°) in the kiln product. At the same
time, the main portion of the iron is reduced from Fe3+ to Fe2+ [5, 10]. Limited amount
of the iron oxide should be reduced to metallic form to ensure a high grade ferronickel
in the subsequent smelting [27]. The main reactions during the coal based reduction
of laterites will be given in section 4.3.1.
2.4.2.2.3 Factors affecting the reduction process
Different factors affect the reducibility of laterites in RKs. Ore grain size is one of the
important factors. Reduction reactions occur on the surface of the ore particles and
their rate increases by decreasing ore particle size as the reacting surface area increases
consistently. Much higher degrees of reduction are achieved by gradual decrease of
feed size from -40 to -12 mm. In addition, a finer ore corresponds to a higher mean
temperature of the calcine which in turn leads to more energy saving during the
smelting in EF. On the other hand, finer ore particles raise dusting and corresponding
problems [24].
The type of the solid fuel is another essential affecting factor. Solid fuels are used for
both heating and reduction [24]. Lignite, coal, anthracite, coke and graphite are the
most common fuels. Among these, lignite and coal are the most reactive ones.
Reductants with higher volatiles are more reactive than those with low volatiles [5].
However, excessive volatile matter in the RK charge results in high temperature of the
flue gases and additional thermal losses. It also increases fire risk in the dedusting
equipment. Accordingly, a controlled mixture of volatile and less volatile fuels should
be used for the best result [24].
The reducibility of laterites depends on the mineralogy and type of the ore. An ore
which is composed mostly of nickel-bearing goethite will react differently from that
in which the nickel is in a complex hydrosilicate [23]. Nickel in saprolitic ores is more
difficult to reduce than the limonitic ores. The poor reducibility of nickel in saprolitic
ores, especially at high temperatures, has been ascribed to the formation of olivine [26,
39]. Due to the very similar ionic radius of Ni and Mg ions (0.068 and 0.065 nm for
Ni2+ and Mg2+, respectively), nickel can easily swap places with magnesium in
silicates. Entrapped nickel in the silicate structure cannot be readily reduced [19, 30].
In addition, olivine is a dense phase with low surface area [27] which decreases
27
effective reaction surface and hence the reaction rate. Therefore, prevention of olivine
formation during calcination is critical to achieve high degree of reduction in saprolitic
ores.
Temperature and reducing potential of the kiln atmosphere are also two critical
parameters that affect the maximum degree of the reduction achieved. These
parameters will be discussed in detail in the results and discussion part as they are
addressed in this study.
2.4.2.3 Smelting
The prereduced calcine from the RK is mixed with coal or coke and is charged into
the electric furnace for smelting. In the electric furnace, the final reduction takes place
and resulting ferronickel and slag are separated. All of the nickel and part of the iron
oxides are reduced to form ferronickel. There is a large difference between the
formation energies of the nickel oxide and the other refractory oxides. This enables
the complete reduction of the nickel oxide while restricting the reduction of the other
oxides [5]. The grade of the ferronickel can vary in a relatively wide range depending
on the nature of the ore. For saprolites, 60-70% of the iron oxides are typically reduced
to yield a ferronickel containing about 25% Ni, whereas lower percentages (10-15%
[5]) of iron oxides in the high iron containing limonites are reduced to give a product
with 15-20% nickel [10]. The crude ferronickel from smelting also contains carbon
and other minor impurities. A high carbon ferronickel is obtained from the ores with
a Fe/Ni weight ratio less than 6 while a low-carbon ferronickel is obtained from the
ores with higher Fe/Ni weight ratios [6].
Depending on the type of the ore and its composition, various ternary systems, such
as FeO-SiO2-CaO [1], SiO2-CaO-MgO [46] and SiO2-MgO-Fe3O4 [47] have been
used to predict the melting behavior of the ferronickel slags. However, it is very
common to use the FeO-SiO2-MgO system [48] for saprolitic ores. Figure 2-11 shows
the FeO-SiO2-MgO ternary phase diagram and the slag compositions for the main
ferronickel smelters. Figure 2-12 [7, 16, 34, 48] shows a well-known presentation of
liquidus temperature as a function of SiO2/MgO for these slags.
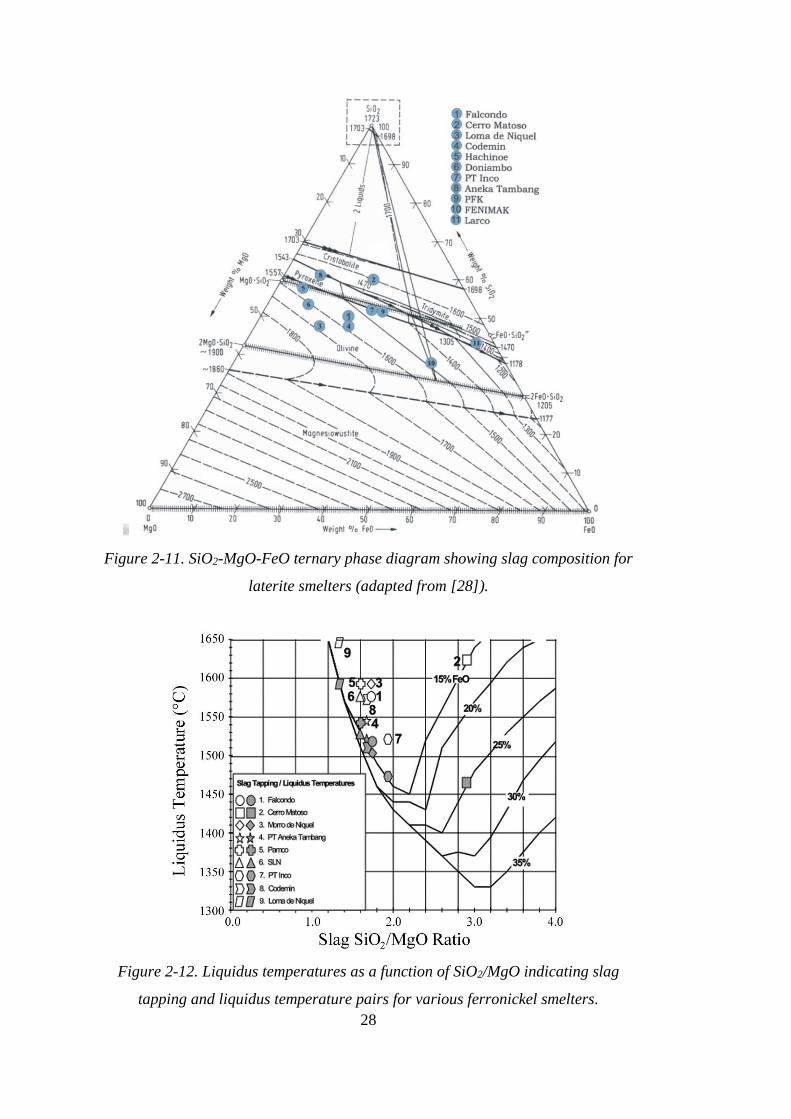
28
Figure 2-11. SiO2-MgO-FeO ternary phase diagram showing slag composition for
laterite smelters (adapted from [28]).
Figure 2-12. Liquidus temperatures as a function of SiO2/MgO indicating slag
tapping and liquidus temperature pairs for various ferronickel smelters.
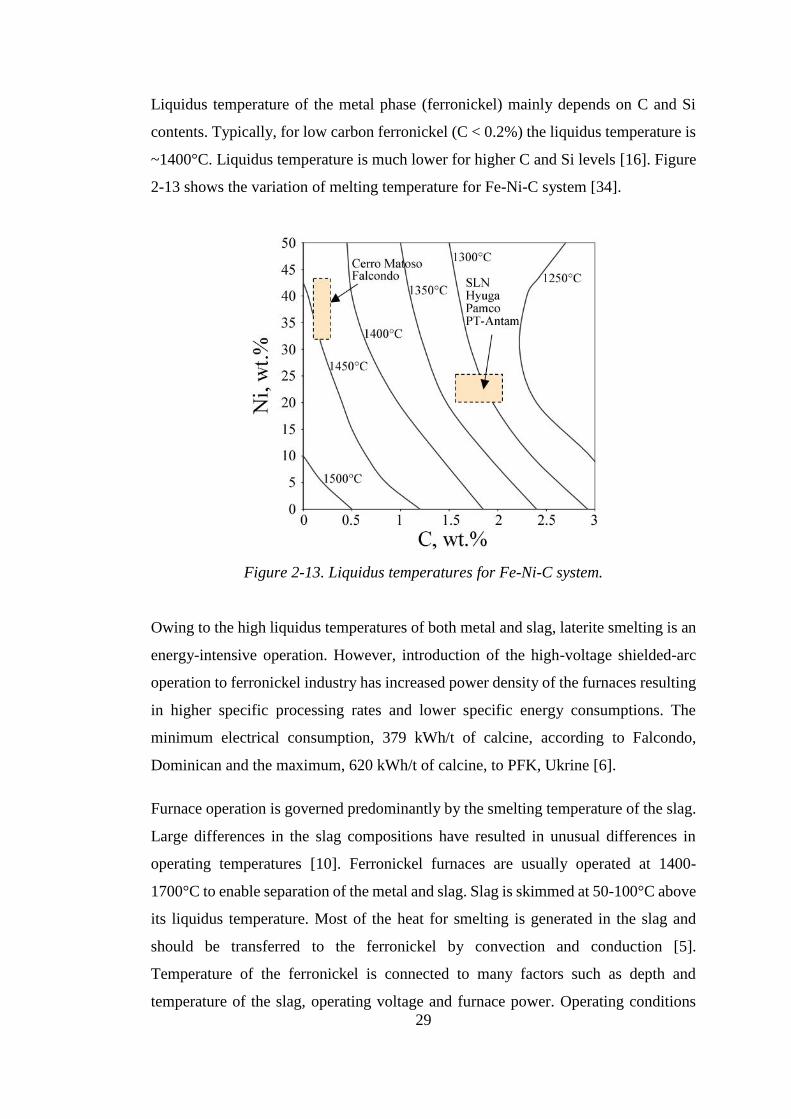
29
Liquidus temperature of the metal phase (ferronickel) mainly depends on C and Si
contents. Typically, for low carbon ferronickel (C < 0.2%) the liquidus temperature is
~1400°C. Liquidus temperature is much lower for higher C and Si levels [16]. Figure
2-13 shows the variation of melting temperature for Fe-Ni-C system [34].
Figure 2-13. Liquidus temperatures for Fe-Ni-C system.
Owing to the high liquidus temperatures of both metal and slag, laterite smelting is an
energy-intensive operation. However, introduction of the high-voltage shielded-arc
operation to ferronickel industry has increased power density of the furnaces resulting
in higher specific processing rates and lower specific energy consumptions. The
minimum electrical consumption, 379 kWh/t of calcine, according to Falcondo,
Dominican and the maximum, 620 kWh/t of calcine, to PFK, Ukrine [6].
Furnace operation is governed predominantly by the smelting temperature of the slag.
Large differences in the slag compositions have resulted in unusual differences in
operating temperatures [10]. Ferronickel furnaces are usually operated at 1400-
1700°C to enable separation of the metal and slag. Slag is skimmed at 50-100°C above
its liquidus temperature. Most of the heat for smelting is generated in the slag and
should be transferred to the ferronickel by convection and conduction [5].
Temperature of the ferronickel is connected to many factors such as depth and
temperature of the slag, operating voltage and furnace power. Operating conditions
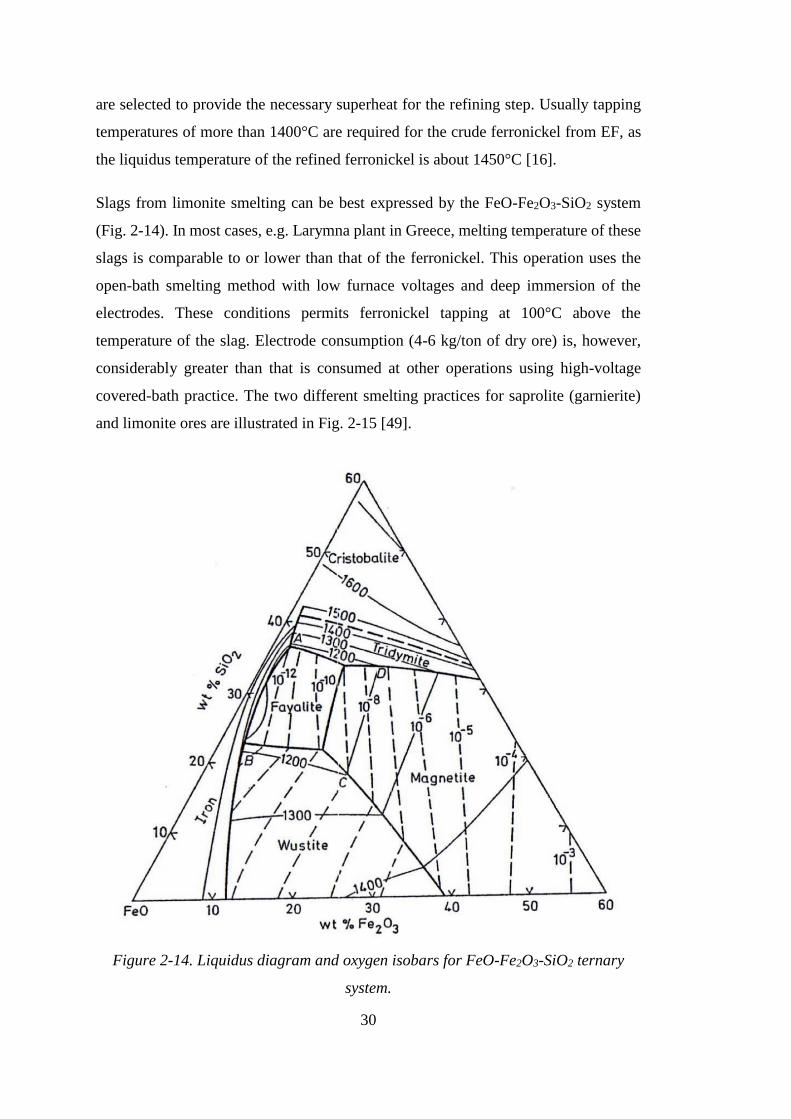
30
are selected to provide the necessary superheat for the refining step. Usually tapping
temperatures of more than 1400°C are required for the crude ferronickel from EF, as
the liquidus temperature of the refined ferronickel is about 1450°C [16].
Slags from limonite smelting can be best expressed by the FeO-Fe2O3-SiO2 system
(Fig. 2-14). In most cases, e.g. Larymna plant in Greece, melting temperature of these
slags is comparable to or lower than that of the ferronickel. This operation uses the
open-bath smelting method with low furnace voltages and deep immersion of the
electrodes. These conditions permits ferronickel tapping at 100°C above the
temperature of the slag. Electrode consumption (4-6 kg/ton of dry ore) is, however,
considerably greater than that is consumed at other operations using high-voltage
covered-bath practice. The two different smelting practices for saprolite (garnierite)
and limonite ores are illustrated in Fig. 2-15 [49].
Figure 2-14. Liquidus diagram and oxygen isobars for FeO-Fe2O3-SiO2 ternary
system.
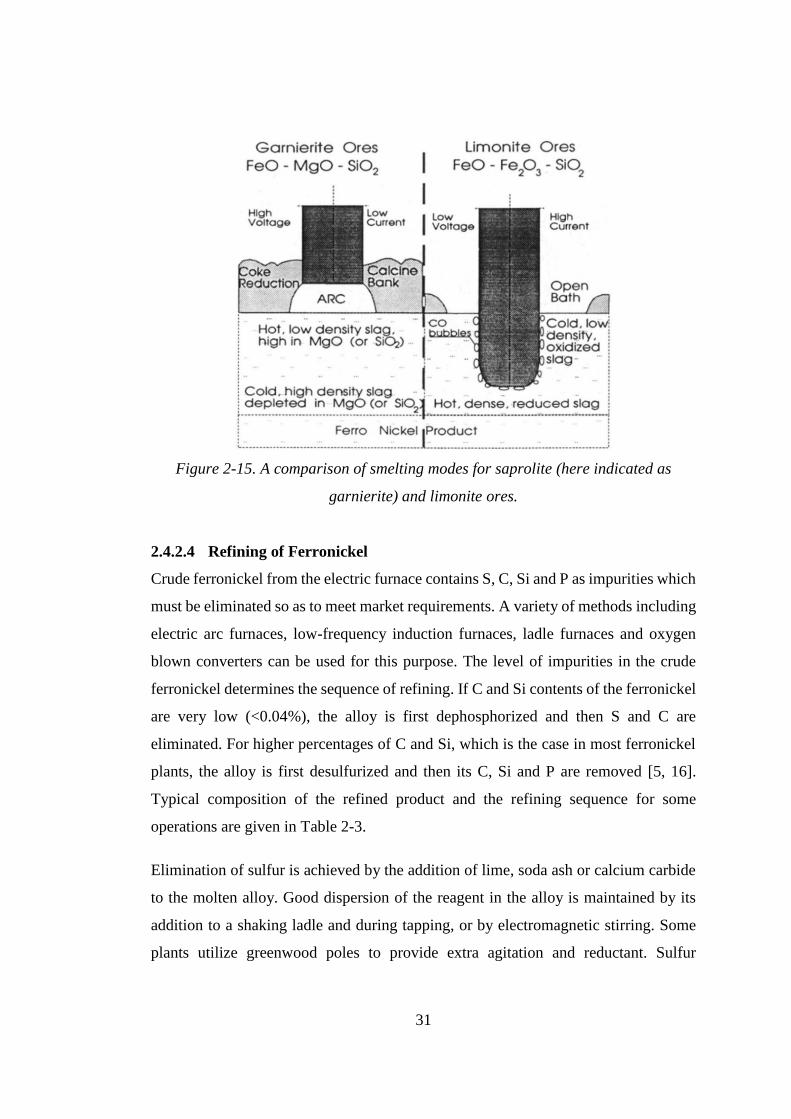
31
Figure 2-15. A comparison of smelting modes for saprolite (here indicated as
garnierite) and limonite ores.
2.4.2.4 Refining of Ferronickel
Crude ferronickel from the electric furnace contains S, C, Si and P as impurities which
must be eliminated so as to meet market requirements. A variety of methods including
electric arc furnaces, low-frequency induction furnaces, ladle furnaces and oxygen
blown converters can be used for this purpose. The level of impurities in the crude
ferronickel determines the sequence of refining. If C and Si contents of the ferronickel
are very low (<0.04%), the alloy is first dephosphorized and then S and C are
eliminated. For higher percentages of C and Si, which is the case in most ferronickel
plants, the alloy is first desulfurized and then its C, Si and P are removed [5, 16].
Typical composition of the refined product and the refining sequence for some
operations are given in Table 2-3.
Elimination of sulfur is achieved by the addition of lime, soda ash or calcium carbide
to the molten alloy. Good dispersion of the reagent in the alloy is maintained by its
addition to a shaking ladle and during tapping, or by electromagnetic stirring. Some
plants utilize greenwood poles to provide extra agitation and reductant. Sulfur
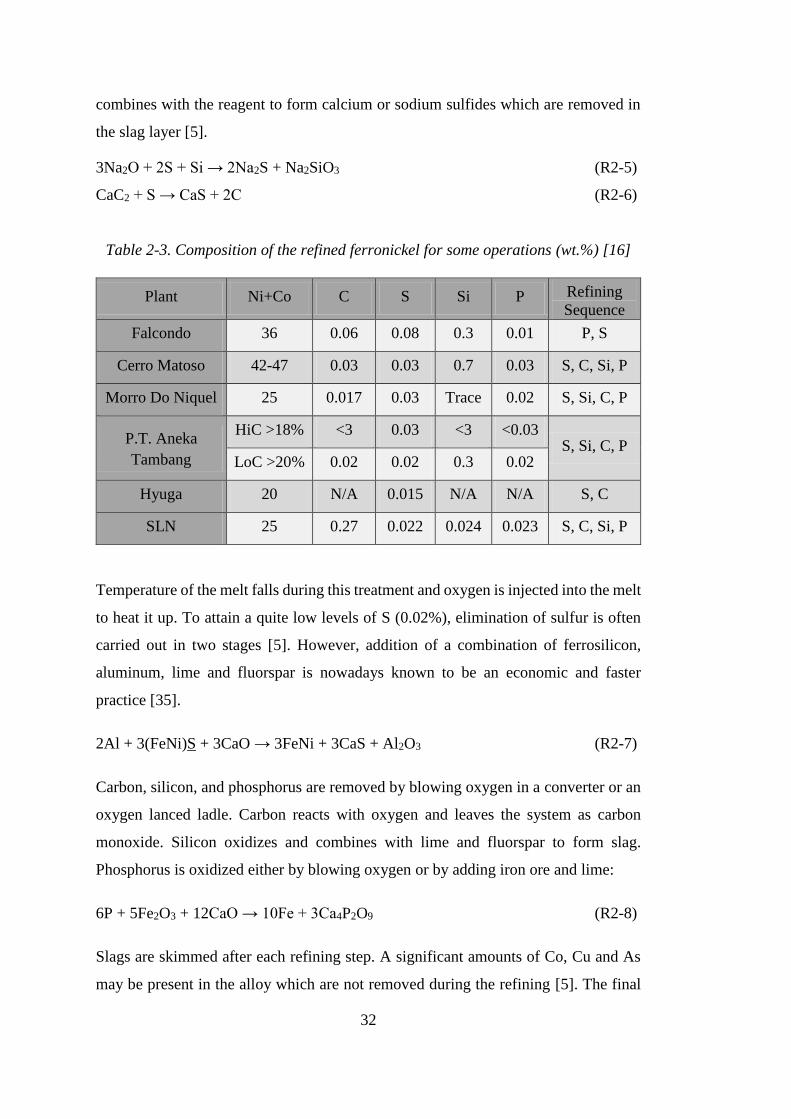
32
combines with the reagent to form calcium or sodium sulfides which are removed in
the slag layer [5].
3Na2O + 2S + Si → 2Na2S + Na2SiO3 (R2-5)
CaC2 + S → CaS + 2C (R2-6)
Table 2-3. Composition of the refined ferronickel for some operations (wt.%) [16]
Plant Ni+Co C S Si P Refining
Sequence
Falcondo 36 0.06 0.08 0.3 0.01 P, S
Cerro Matoso 42-47 0.03 0.03 0.7 0.03 S, C, Si, P
Morro Do Niquel 25 0.017 0.03 Trace 0.02 S, Si, C, P
P.T. Aneka
Tambang
HiC >18% <3 0.03 <3 <0.03 S, Si, C, P
LoC >20% 0.02 0.02 0.3 0.02
Hyuga 20 N/A 0.015 N/A N/A S, C
SLN 25 0.27 0.022 0.024 0.023 S, C, Si, P
Temperature of the melt falls during this treatment and oxygen is injected into the melt
to heat it up. To attain a quite low levels of S (0.02%), elimination of sulfur is often
carried out in two stages [5]. However, addition of a combination of ferrosilicon,
aluminum, lime and fluorspar is nowadays known to be an economic and faster
practice [35].
2Al + 3(FeNi)S + 3CaO → 3FeNi + 3CaS + Al2O3 (R2-7)
Carbon, silicon, and phosphorus are removed by blowing oxygen in a converter or an
oxygen lanced ladle. Carbon reacts with oxygen and leaves the system as carbon
monoxide. Silicon oxidizes and combines with lime and fluorspar to form slag.
Phosphorus is oxidized either by blowing oxygen or by adding iron ore and lime:
6P + 5Fe2O3 + 12CaO → 10Fe + 3Ca4P2O9 (R2-8)
Slags are skimmed after each refining step. A significant amounts of Co, Cu and As
may be present in the alloy which are not removed during the refining [5]. The final
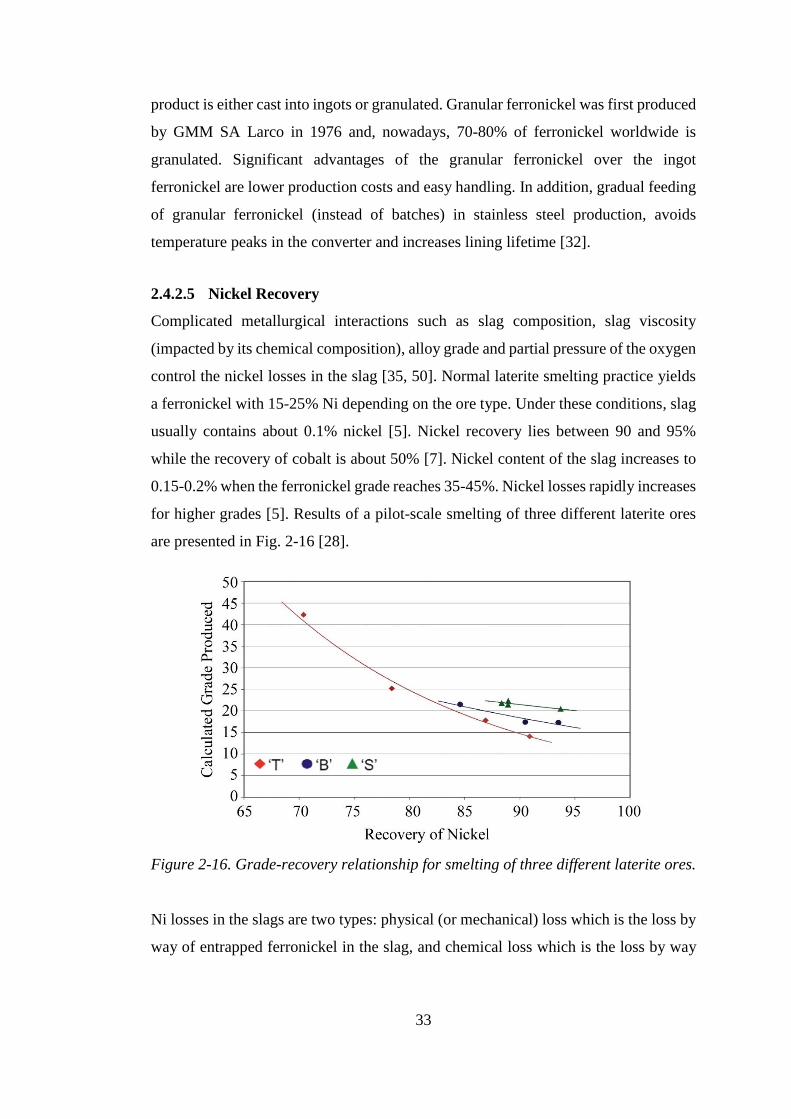
33
product is either cast into ingots or granulated. Granular ferronickel was first produced
by GMM SA Larco in 1976 and, nowadays, 70-80% of ferronickel worldwide is
granulated. Significant advantages of the granular ferronickel over the ingot
ferronickel are lower production costs and easy handling. In addition, gradual feeding
of granular ferronickel (instead of batches) in stainless steel production, avoids
temperature peaks in the converter and increases lining lifetime [32].
2.4.2.5 Nickel Recovery
Complicated metallurgical interactions such as slag composition, slag viscosity
(impacted by its chemical composition), alloy grade and partial pressure of the oxygen
control the nickel losses in the slag [35, 50]. Normal laterite smelting practice yields
a ferronickel with 15-25% Ni depending on the ore type. Under these conditions, slag
usually contains about 0.1% nickel [5]. Nickel recovery lies between 90 and 95%
while the recovery of cobalt is about 50% [7]. Nickel content of the slag increases to
0.15-0.2% when the ferronickel grade reaches 35-45%. Nickel losses rapidly increases
for higher grades [5]. Results of a pilot-scale smelting of three different laterite ores
are presented in Fig. 2-16 [28].
Figure 2-16. Grade-recovery relationship for smelting of three different laterite ores.
Ni losses in the slags are two types: physical (or mechanical) loss which is the loss by
way of entrapped ferronickel in the slag, and chemical loss which is the loss by way
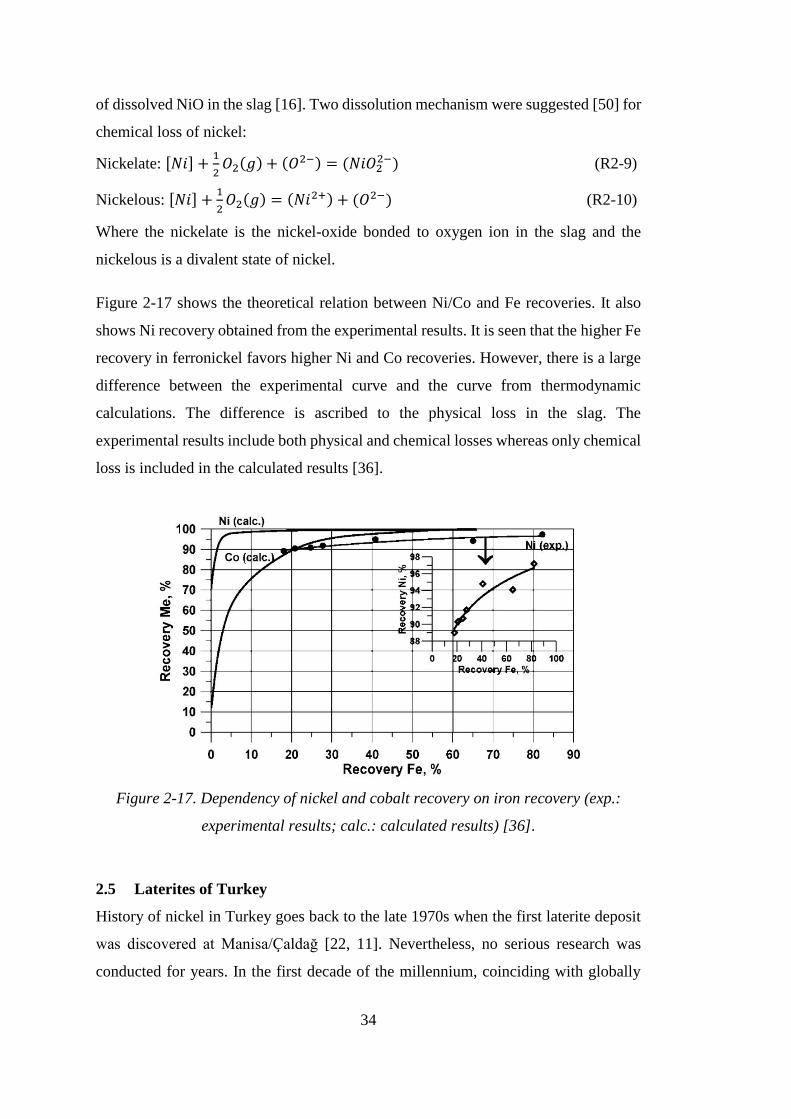
34
of dissolved NiO in the slag [16]. Two dissolution mechanism were suggested [50] for
chemical loss of nickel:
Nickelate: [𝑁𝑖] +1
2𝑂2(𝑔) + (𝑂2−) = (𝑁𝑖𝑂2
2−) (R2-9)
Nickelous: [𝑁𝑖] +1
2𝑂2(𝑔) = (𝑁𝑖2+) + (𝑂2−) (R2-10)
Where the nickelate is the nickel-oxide bonded to oxygen ion in the slag and the
nickelous is a divalent state of nickel.
Figure 2-17 shows the theoretical relation between Ni/Co and Fe recoveries. It also
shows Ni recovery obtained from the experimental results. It is seen that the higher Fe
recovery in ferronickel favors higher Ni and Co recoveries. However, there is a large
difference between the experimental curve and the curve from thermodynamic
calculations. The difference is ascribed to the physical loss in the slag. The
experimental results include both physical and chemical losses whereas only chemical
loss is included in the calculated results [36].
Figure 2-17. Dependency of nickel and cobalt recovery on iron recovery (exp.:
experimental results; calc.: calculated results) [36].
2.5 Laterites of Turkey
History of nickel in Turkey goes back to the late 1970s when the first laterite deposit
was discovered at Manisa/Çaldağ [22, 11]. Nevertheless, no serious research was
conducted for years. In the first decade of the millennium, coinciding with globally
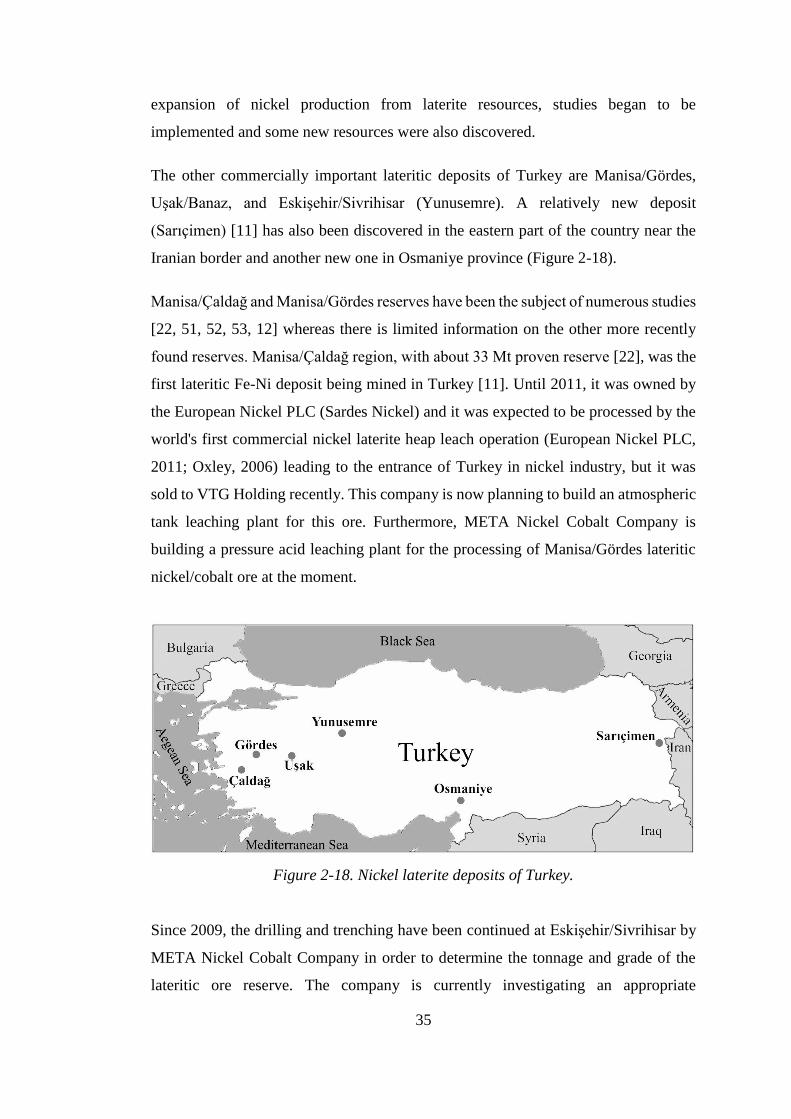
35
expansion of nickel production from laterite resources, studies began to be
implemented and some new resources were also discovered.
The other commercially important lateritic deposits of Turkey are Manisa/Gördes,
Uşak/Banaz, and Eskişehir/Sivrihisar (Yunusemre). A relatively new deposit
(Sarıçimen) [11] has also been discovered in the eastern part of the country near the
Iranian border and another new one in Osmaniye province (Figure 2-18).
Manisa/Çaldağ and Manisa/Gördes reserves have been the subject of numerous studies
[22, 51, 52, 53, 12] whereas there is limited information on the other more recently
found reserves. Manisa/Çaldağ region, with about 33 Mt proven reserve [22], was the
first lateritic Fe-Ni deposit being mined in Turkey [11]. Until 2011, it was owned by
the European Nickel PLC (Sardes Nickel) and it was expected to be processed by the
world's first commercial nickel laterite heap leach operation (European Nickel PLC,
2011; Oxley, 2006) leading to the entrance of Turkey in nickel industry, but it was
sold to VTG Holding recently. This company is now planning to build an atmospheric
tank leaching plant for this ore. Furthermore, META Nickel Cobalt Company is
building a pressure acid leaching plant for the processing of Manisa/Gördes lateritic
nickel/cobalt ore at the moment.
Figure 2-18. Nickel laterite deposits of Turkey.
Since 2009, the drilling and trenching have been continued at Eskişehir/Sivrihisar by
META Nickel Cobalt Company in order to determine the tonnage and grade of the
lateritic ore reserve. The company is currently investigating an appropriate
36
hydrometallurgical or pyrometallurgical processing technique for this reserve. The
current situation in Turkey implies that the nickel extraction from the lateritic sources
will be a hot topic in the near future of the country.
2.6 The Aim of the Study
All of the previous studies on Turkish laterite ores were concerned with geological
and mineralogical aspects of these ores [22, 11, 51, 54, 55] as well as their
hydrometallurgical processing [29, 52, 53, 56, 57, 13]. This thesis is the first study on
the pyrometallurgical extraction of nickel from Turkish laterites located in
Eskşehir/Sivrihisar region.
- The Reasons for Choosing Ferronickel Smelting
It is generally accepted that limonitic laterite ores are suitable for hydrometallurgical
treatment (HPAL in particular) while saprolitic laterites are suitable for
pyrometallurgical treatment. Despite this categorization, this is changing and new
projects are aiming to treat low-grade limonitic ores by pyrometallurgical routes [28].
Today’s research is directed toward the development of processes through which a
wider variety of ores can be treated. In pursuit of this end, pyrometallurgical methods
are at an advantage because they are more flexible and are less influenced by the
mineralogical and compositional changes in the ore. In the processing of laterites,
specifically, the pyrometallurgical methods have other significant advantages over the
hydrometallurgical methods. Nickel is incorporated in the minerals containing other
elements like Fe, Co and Mg. Hydrometallurgical methods basically handle the
separation of nickel from these elements through a complex process. In the contrary,
a simpler and shorter process is used in ferronickel smelting as the product contains
Ni, Fe, Co and Cu all at once.
The other reason for ferronickel smelting from limonitic laterites is the nickel market.
About 70% of the nickel output is used in iron-nickel based alloys like stainless steels
where Ni is added to the bath of molten alloy as ferronickel rather than high-priced
metallic nickel. Therefore, separation of nickel from iron through the longer and
complicated processes (hydrometallurgy) is not necessary. In addition, a gradual
decline in the high-grade saprolitic reserves will shift the industry towards the usage
37
of low grade limonitic ores, and inevitably, the share of these ores in ferronickel
production will increase.
Furthermore, recent advances in furnace technology have remedied, to a great degree,
difficulties related to the smelting of limonites such as unfavorable slag composition
and higher CO2 emission. Energy costs per tonne of the metal has decreased which
can compensate for the low grades of limonitic ores. The current nickel technology
and market permit to economically treat the ores with higher than 1% Ni. In the future,
however, higher Ni prices and new advances can lead to lower cut-off grades.
The principal part of this thesis study has focused on the optimization of ferronickel
production from the low grade limonitic laterite ore. It includes a complete
mineralogical analysis of the run-of-mine (ROM) ore and investigation of its
calcination, reduction and smelting behaviors.
- The Reasons for Colemanite Addition
Ferronickel slags typically contain 0.1-0.2% Ni and nickel partition ratio (%Ni in the
ferronickel divided by %Ni in the slag) is about 200 or above. Nonetheless, the
recovery does not exceed 95% at the best. The problem arises from the high volume
of the slag. Laterites are not amenable to concentration and whole of the ore consisting
of mainly gangue minerals has to be processed. Therefore, regardless of laterite type,
ferronickel smelting generates large volumes of slag in comparison with the alloy;
about 10-15 tonnes of slag per tonne of ferronickel.
Physical loss, which is suspended ferronickel particles in the slag, comprises the main
part of the losses and accounts for the recoveries which are much less than
theoretically expected levels (see Fig. 2-17). Although many studies have been
conducted on smelting of laterites, the nickel losses in the slag has not been addressed
enough in the literature and still remain as a challenge for this industry. A part of the
current research work has addressed this issue and investigated the effect of processing
parameters and colemanite addition on the nickel recovery. The main idea of
colemanite addition was to decrease slag viscosity. Colemanite was anticipated to
decrease the slag viscosity and to facilitate metal and slag separation.

38
Colemanite has been used in the iron and steel industry as well as in the copper
metallurgy. In the iron and steel industry, colemanite was tested to be used as flux
instead of CaF2 during production of steel in basic oxygen furnace (BOF) furnace and
also it was used as an additive material in sintering stage [58, 59, 60, 61]. According
to these studies, the advantages of colemanite usage are as follows; it decreases
melting point of the slag thereby increasing slag fluidity. It also increases the solubility
of lime and magnesia. Furthermore, no significant damage was noticed in refractory
materials. The only possible and objectionable result could be the entrance of boron
to the metal phase under reducing conditions. So, the negative aspect was that some
boron dissolved in the steel and increased its hardness which would cause hot tearing
in rolling or forging. Most of the time, more than 30 ppm boron in the steel product
cannot be tolerated in iron and steel industry.
In the copper metallurgy, the effect of colemanite and boric acid addition on the
reverberatory furnace slag was investigated in 1975 [62]. It was reported that the
matte-slag equilibrium condition was obtained very rapidly by the addition of boric
acid or colemanite. Results from a recent laboratory scale study on the effect of
colemanite addition on copper losses in matte smelting slag [63] also showed that it
was possible to decrease the copper losses from 0.88% to about 0.3–0.4% by the
addition of colemanite. The colemanite addition was industrially tested by EBİ smelter
(Samsun, Turkey) to lower the copper losses in the slag during matte smelting [64]. It
was reported that colemanite addition resulted in a considerable fuel saving. The
benefit was somewhat higher than the cost of colemanite used. It was also reported
that, the fluidity of slag dramatically increased by the addition of colemanite.
However, the copper content of the slag did not decrease significantly in the EBİ
smelter due to deficiencies in furnace design.
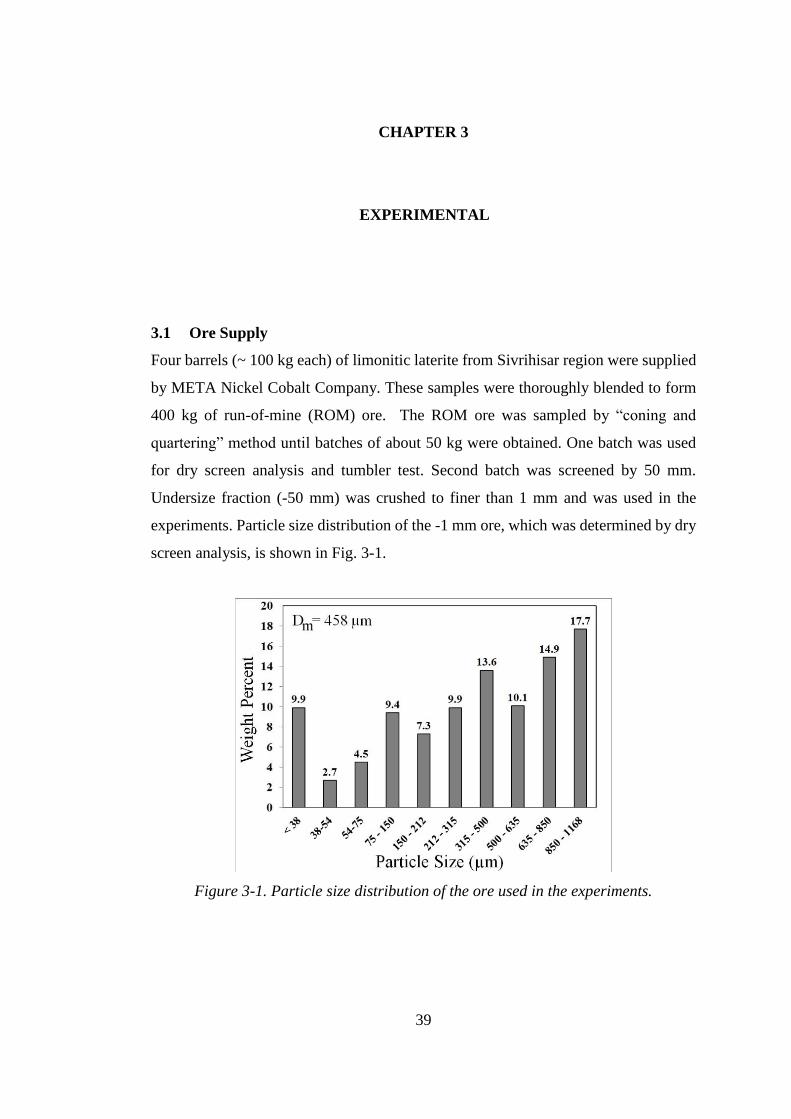
39
CHAPTER 3
3 EXPERIMENTAL
3.1 Ore Supply
Four barrels (~ 100 kg each) of limonitic laterite from Sivrihisar region were supplied
by META Nickel Cobalt Company. These samples were thoroughly blended to form
400 kg of run-of-mine (ROM) ore. The ROM ore was sampled by “coning and
quartering” method until batches of about 50 kg were obtained. One batch was used
for dry screen analysis and tumbler test. Second batch was screened by 50 mm.
Undersize fraction (-50 mm) was crushed to finer than 1 mm and was used in the
experiments. Particle size distribution of the -1 mm ore, which was determined by dry
screen analysis, is shown in Fig. 3-1.
Figure 3-1. Particle size distribution of the ore used in the experiments.

40
3.2 Ore Characterization
3.2.1 Dry Screen Analysis & Tumbler Test
Dry screen analysis was used to determine particle size distribution of the ROM ore.
This analysis was carried out separately for the two <4.75mm and >4.75mm size
ranges according to ASTM E389-03 and ASTM E276-03 standards. Tumbler test
(ASTM E279-97) was used to measure the resistance of the ore to degradation by
impact and abrasion. 10-50 mm fraction was used for this test. A flow chart showing
detailed stages of screen analysis and tumbler test is given in Appendix B.
3.2.2 Chemical Analysis
After the screen analysis, the retained ore on each sieve was crushed (if necessary) and
finely ground. A disc grinder was used to grind the ore. Chemical composition of each
fraction was determined by Inductively Coupled Plasma - Atomic Emission
Spectrometry (ICP-AES) and variation of the major elements with the particle size
was studied. In addition, a representative amount of the ROM ore was prepared and
analyzed by the same method. ICP-AES analyses were done by ALS Chemex
Company.
3.2.3 Qualitative Mineralogical Analysis
In order to identify the minerals present in the ore, a small amount of the ROM ore
was subjected to X-Ray Diffraction (XRD) analysis. XRD analysis was carried out on
a Rigaku SA-HF3 diffractometer with Cu Kα (λ=1.54 Å) radiation (40 kV and 40 mA).
Spectra were acquired from 5 to 70° 2θ at a scanning speed of 0.2°/min. All non-clay
minerals were identified by using the Print 2000PC & Multiflex Ver3004 software and
ICDD database. Clay minerals, which could not be identified by the routine sample
preparation methods, were determined by the clay mineralogy technique as briefly
described below.
A 10 g representative ore sample was placed in a 1000 ml beaker. It was filled with
distilled water and a small quantity (a pinch) of sodium pyrophosphate was added as
a dispersant. The mixture was stirred until a good dispersion was achieved. In order to
separate the clay-sized fraction (<2 µm), the dispersed suspension was then allowed
to settle for 8 hours. Following this, a 10 cm high column containing particles with
41
finer than 2 µm size was obtained. The upper portion of the suspension containing clay
minerals was pumped into another container. The beaker was filled with distilled water
again, and the same procedure was repeated until a clear liquid was obtained after 8
hours settling. The sediment was removed, dried and weighed to calculate the clay
minerals fraction within the ore. At the same time, the clay containing suspension was
settled by using a centrifuge apparatus. The supernate was decanted and the precipitate
(wet clay residue) was spread on four petrographic slides and left to air-dry. The first
sample was then treated in an ethylene glycol saturated atmosphere at 60°C for 3
hours. To create the required atmosphere, some ethylene glycol was poured into a
desiccator including the sample which was tightly closed and placed in the furnace.
The second and third samples were heated and kept for 1 hour at 300 and 550°C,
respectively. The last sample was maintained as it had been air-dried. All four prepared
samples were immediately examined by XRD.
3.2.4 Quantitative Mineralogical Analysis
To determine the concentration of the minerals present in the ore, a Rietveld method-
based mineral quantification was performed with GSAS [65] using the EXPGUI
graphical interface [66]. Crystal structure data of the components were downloaded
from the American Mineralogist Crystal Structure Database [67]. The best-fitting
crystallographic information files were selected to be used for the refinement. In order
to measure the instrumental contribution to peak shape, ultra high purity silicon and
lanthanum hexaboride LaB6 standard samples (NIST 640d and 660b, respectively)
were used. Background was modelled by a six-term Shifted Chebyshev function.
3.2.5 Thermal Analysis
Differential thermal analysis (DTA) and thermogravimetric analysis (TGA) were
performed at Central Laboratory of METU. Twenty milligrams of the ore was heated
from ambient temperature to 1000°C at a rate of 10 °C/min. in air. Simultaneous DTA
and TGA were also carried out for clay-sized fraction of the ore. Thermal analysis of
clays helped to identify their types.
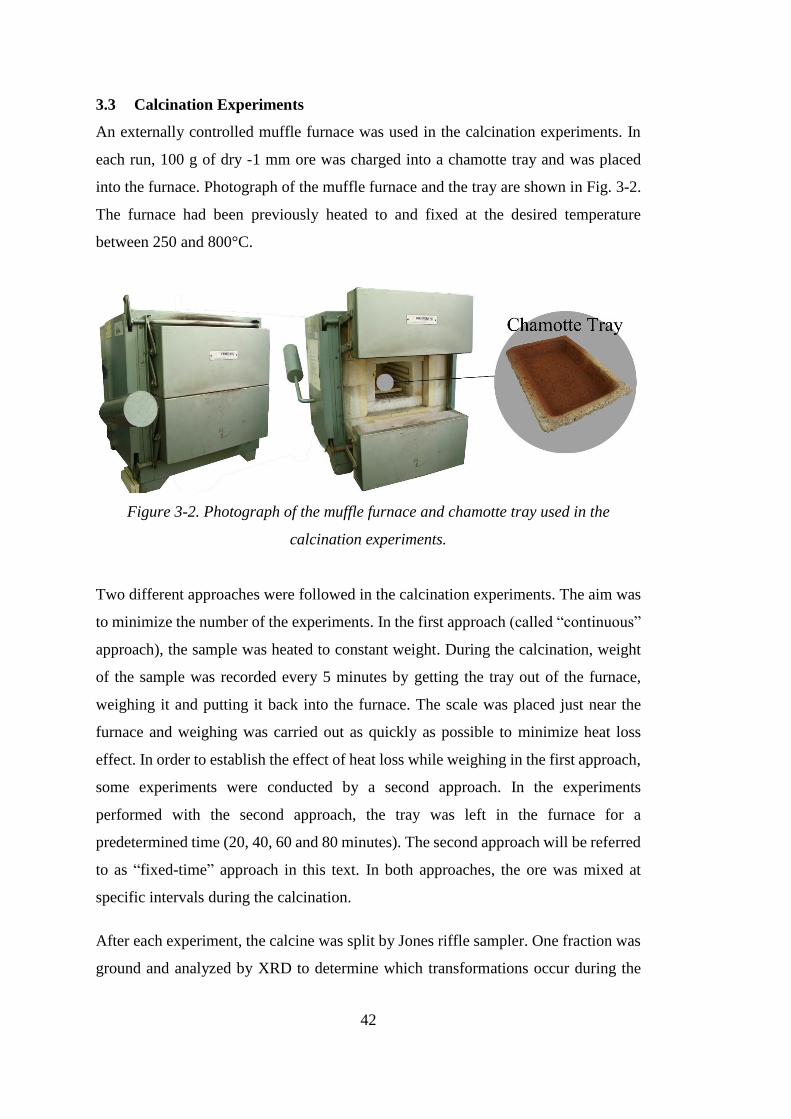
42
3.3 Calcination Experiments
An externally controlled muffle furnace was used in the calcination experiments. In
each run, 100 g of dry -1 mm ore was charged into a chamotte tray and was placed
into the furnace. Photograph of the muffle furnace and the tray are shown in Fig. 3-2.
The furnace had been previously heated to and fixed at the desired temperature
between 250 and 800°C.
Figure 3-2. Photograph of the muffle furnace and chamotte tray used in the
calcination experiments.
Two different approaches were followed in the calcination experiments. The aim was
to minimize the number of the experiments. In the first approach (called “continuous”
approach), the sample was heated to constant weight. During the calcination, weight
of the sample was recorded every 5 minutes by getting the tray out of the furnace,
weighing it and putting it back into the furnace. The scale was placed just near the
furnace and weighing was carried out as quickly as possible to minimize heat loss
effect. In order to establish the effect of heat loss while weighing in the first approach,
some experiments were conducted by a second approach. In the experiments
performed with the second approach, the tray was left in the furnace for a
predetermined time (20, 40, 60 and 80 minutes). The second approach will be referred
to as “fixed-time” approach in this text. In both approaches, the ore was mixed at
specific intervals during the calcination.
After each experiment, the calcine was split by Jones riffle sampler. One fraction was
ground and analyzed by XRD to determine which transformations occur during the
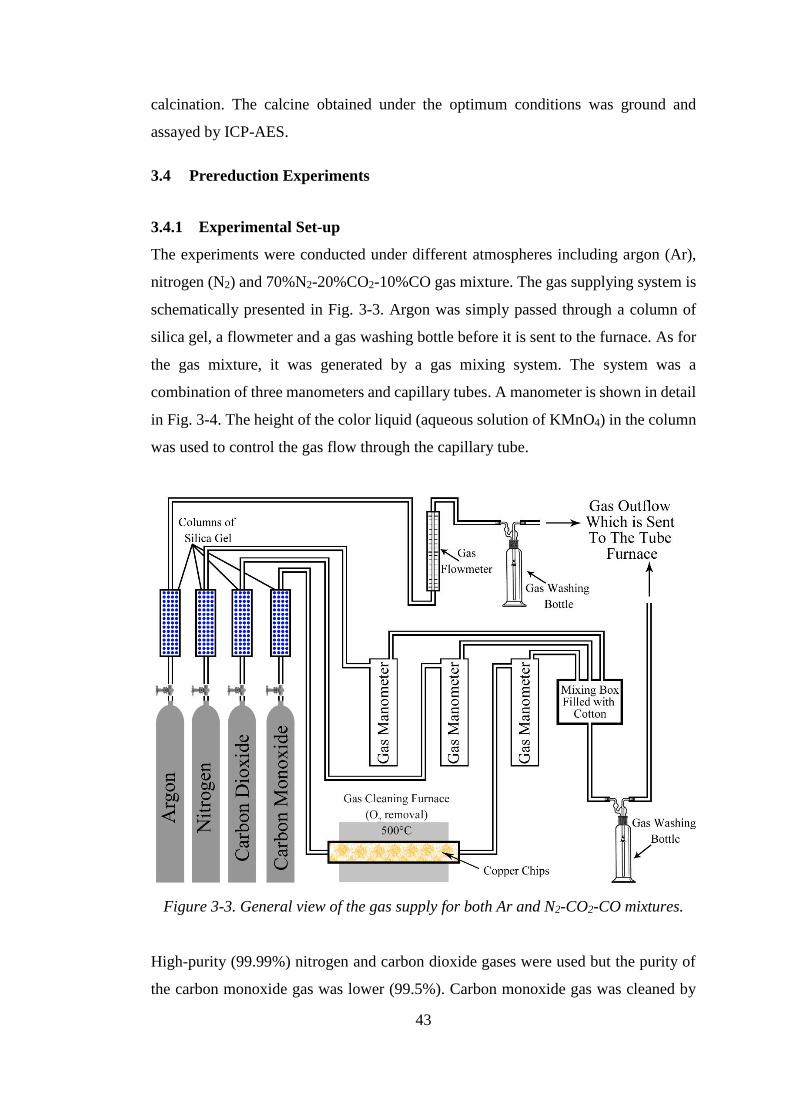
43
calcination. The calcine obtained under the optimum conditions was ground and
assayed by ICP-AES.
3.4 Prereduction Experiments
3.4.1 Experimental Set-up
The experiments were conducted under different atmospheres including argon (Ar),
nitrogen (N2) and 70%N2-20%CO2-10%CO gas mixture. The gas supplying system is
schematically presented in Fig. 3-3. Argon was simply passed through a column of
silica gel, a flowmeter and a gas washing bottle before it is sent to the furnace. As for
the gas mixture, it was generated by a gas mixing system. The system was a
combination of three manometers and capillary tubes. A manometer is shown in detail
in Fig. 3-4. The height of the color liquid (aqueous solution of KMnO4) in the column
was used to control the gas flow through the capillary tube.
Figure 3-3. General view of the gas supply for both Ar and N2-CO2-CO mixtures.
High-purity (99.99%) nitrogen and carbon dioxide gases were used but the purity of
the carbon monoxide gas was lower (99.5%). Carbon monoxide gas was cleaned by
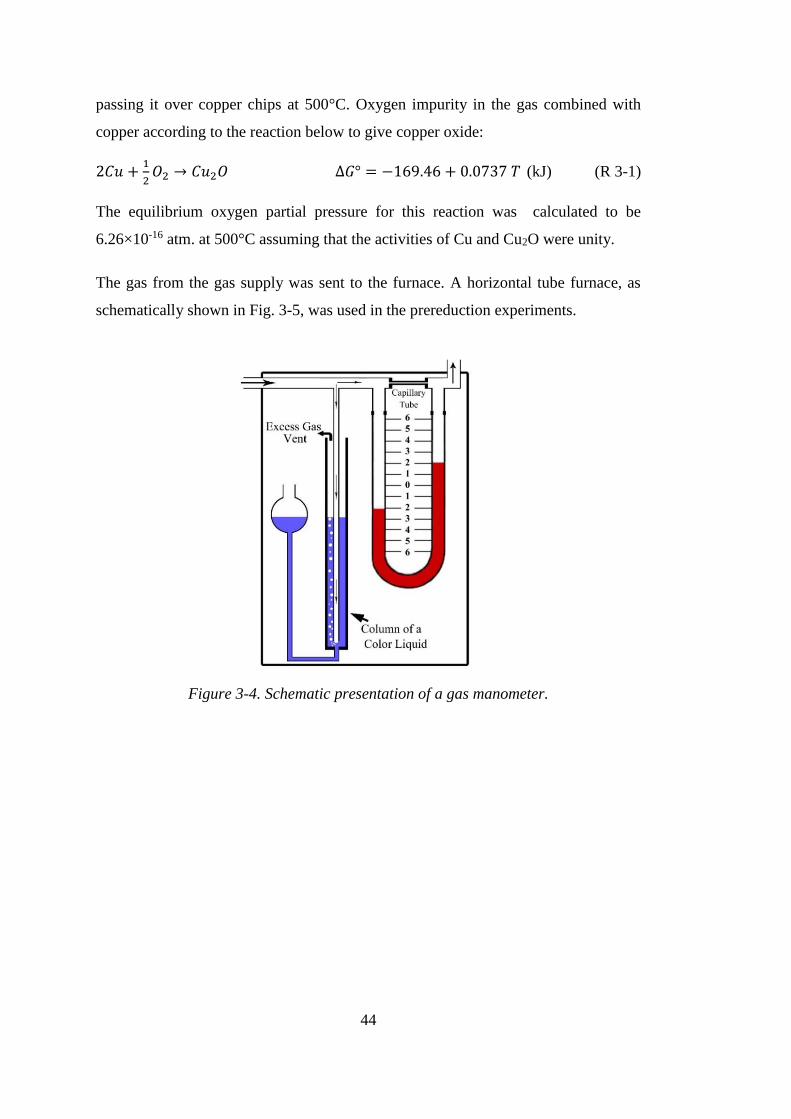
44
passing it over copper chips at 500°C. Oxygen impurity in the gas combined with
copper according to the reaction below to give copper oxide:
2𝐶𝑢 +1
2𝑂2 → 𝐶𝑢2𝑂 ∆𝐺° = −169.46 + 0.0737 𝑇 (kJ) (R 3-1)
The equilibrium oxygen partial pressure for this reaction was calculated to be
6.26×10⁻¹⁶ atm. at 500°C assuming that the activities of Cu and Cu2O were unity.
The gas from the gas supply was sent to the furnace. A horizontal tube furnace, as
schematically shown in Fig. 3-5, was used in the prereduction experiments.
Figure 3-4. Schematic presentation of a gas manometer.
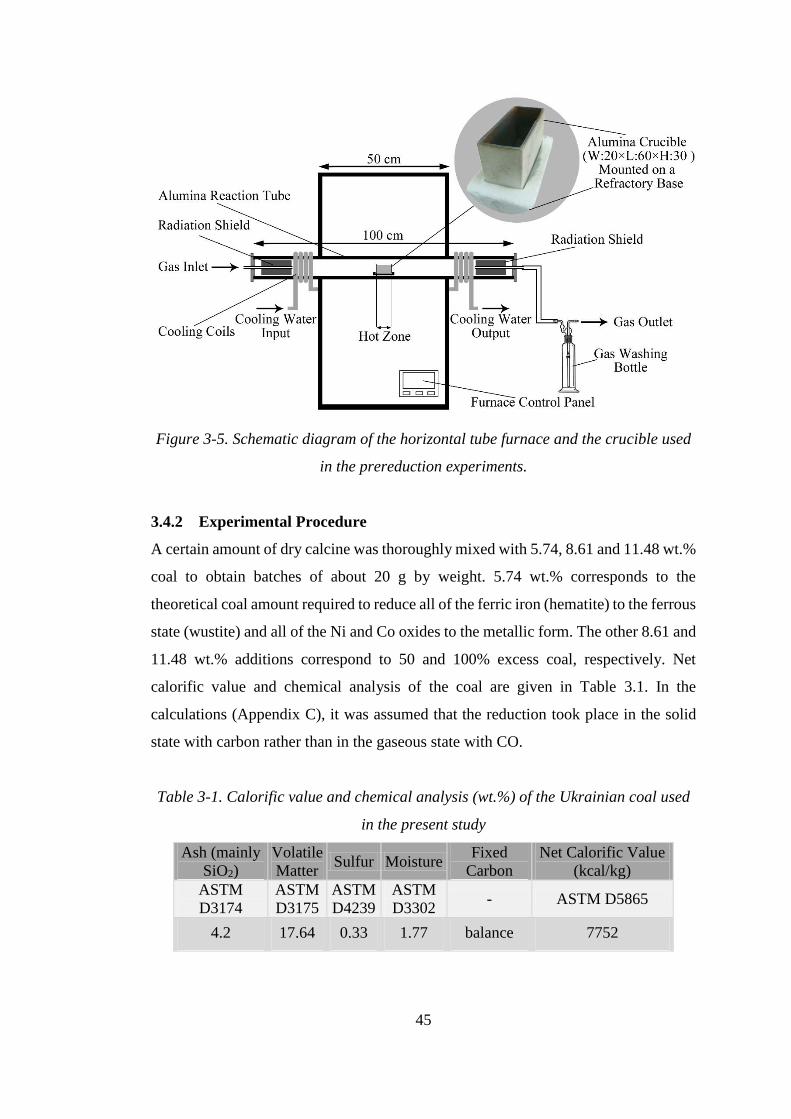
45
Figure 3-5. Schematic diagram of the horizontal tube furnace and the crucible used
in the prereduction experiments.
3.4.2 Experimental Procedure
A certain amount of dry calcine was thoroughly mixed with 5.74, 8.61 and 11.48 wt.%
coal to obtain batches of about 20 g by weight. 5.74 wt.% corresponds to the
theoretical coal amount required to reduce all of the ferric iron (hematite) to the ferrous
state (wustite) and all of the Ni and Co oxides to the metallic form. The other 8.61 and
11.48 wt.% additions correspond to 50 and 100% excess coal, respectively. Net
calorific value and chemical analysis of the coal are given in Table 3.1. In the
calculations (Appendix C), it was assumed that the reduction took place in the solid
state with carbon rather than in the gaseous state with CO.
Table 3-1. Calorific value and chemical analysis (wt.%) of the Ukrainian coal used
in the present study
Ash (mainly
SiO2)
Volatile
Matter Sulfur Moisture
Fixed
Carbon
Net Calorific Value
(kcal/kg)
ASTM
D3174
ASTM
D3175
ASTM
D4239
ASTM
D3302 - ASTM D5865
4.2 17.64 0.33 1.77 balance 7752
46
Mixtures of limonitic ore and coal were charged into the alumina crucibles with
20×60×30 mm width, length, height respectively (see Fig. 3-5) and heated to specified
temperatures in the range of 700-1100°C. After keeping for 40 min. at the chosen
temperature, they were cooled to room temperature. Heating and cooling rates were
chosen to be 7°C/min. which is the maximum permissible rate without damaging the
alumina tube of the furnace. To investigate the effect of duration, in two series of
experiments, the mixtures were kept at the chosen temperature for 60 or 80 min.
All of the experiments explained above, were conducted under argon atmosphere. The
system was flushed with argon for 5 min. at the beginning and then a flow rate of 10
ml/min. was maintained until the end of the tests. However, in another set of
experiments, 70%N2-20%CO2-10%CO gas mixture (total of 50 ml/min.) was passed
through the furnace. Prior to heating, the furnace was flushed with nitrogen for 30 min.
at 100 ml/min. and then the main gas mixture (70%N2-20%CO2-10%CO) was passed
for 1 hour at room temperature to ensure that it filled the furnace completely. The
furnace was turned on and the sample was heated to the desired temperature. The main
gas mixture was passed at a rate of 50 ml/min. throughout the experiment.
3.4.3 Characterization Methods
Partially reduced samples (referred to as ‘reduced sample’ hereafter) were finely
ground in an Agate mortar for characterization. Metallic iron, nickel and cobalt
contents of the reduced samples were determined by extraction of the metallic phases
with bromine-methanol solution [68] and then measurement of the dissolved metals
by atomic absorption spectrophotometer (AAS). The following is the detailed
description of the analysis procedure:
- 1 g of dry reduced ore was placed into a 100 ml Erlenmeyer flask;
- 50 ml of bromine-methanol solution (5 ml Br2 + 95 ml CH3OH) was added and
the flask was closed with a glass stopper or a watch-glass;
- the solution was stirred with a magnetic stirrer for 1 hour (heating and
contacting with water was avoided);
- the solution was filtered through a filter paper and the residue was washed with
methanol;
47
- the filtrate was collected in a 600 ml beaker and 25 ml of H2SO4 (20 vol.%)
was added;
- the solution was boiled until almost the whole liquid was volatilized (all the
methanol and bromine was removed);
- 1 ml of hydrogen peroxide (H2O2, 30%) was added while the solution was
boiling;
- after volatilizing the whole liquid, a solid residue was left behind which was
dissolved by adding 200 ml of distilled water and 25 ml of 37 vol.% HCl;
- the solution was boiled for about 30 minutes until the residue was dissolved
completely and then cooled down to ambient temperature;
- the solution was filtered into a 500 ml measuring flask and filled up with
distilled water;
- the dissolved iron, nickel and cobalt contents were analyzed with AAS.
Small amounts of the ground samples were analyzed by XRD to study the
transformations during the reduction. To measure unreacted carbon in the reduced
samples, a few selected samples were dried at 60°C and analyzed by ELTRA CS-800
combustion analyzer. In a series of experiments, some particles were collected from
the sample before grinding and their metallographic sections were prepared for
microscopic investigation by SEM/EDS. Cold mounting technique was used for the
preparation of the metallographic samples.
3.5 Smelting Experiments
3.5.1 Experimental Set-up
Two sets of smelting experiments were carried out. In the first set, experiments were
conducted in the horizontal tube furnace and the previous set-up and crucibles which
were utilized in the prereduction experiments was utilized for smelting. In the second
set, experiments were conducted in a vertical tube furnace (Fig. 3-6). Cylindrical
alumina smelting crucibles were used instead of the previous rectangular prism-shaped
alumina crucibles. The gas mixing system being used in the prereduction experiments
was used in the smelting experiments as well.
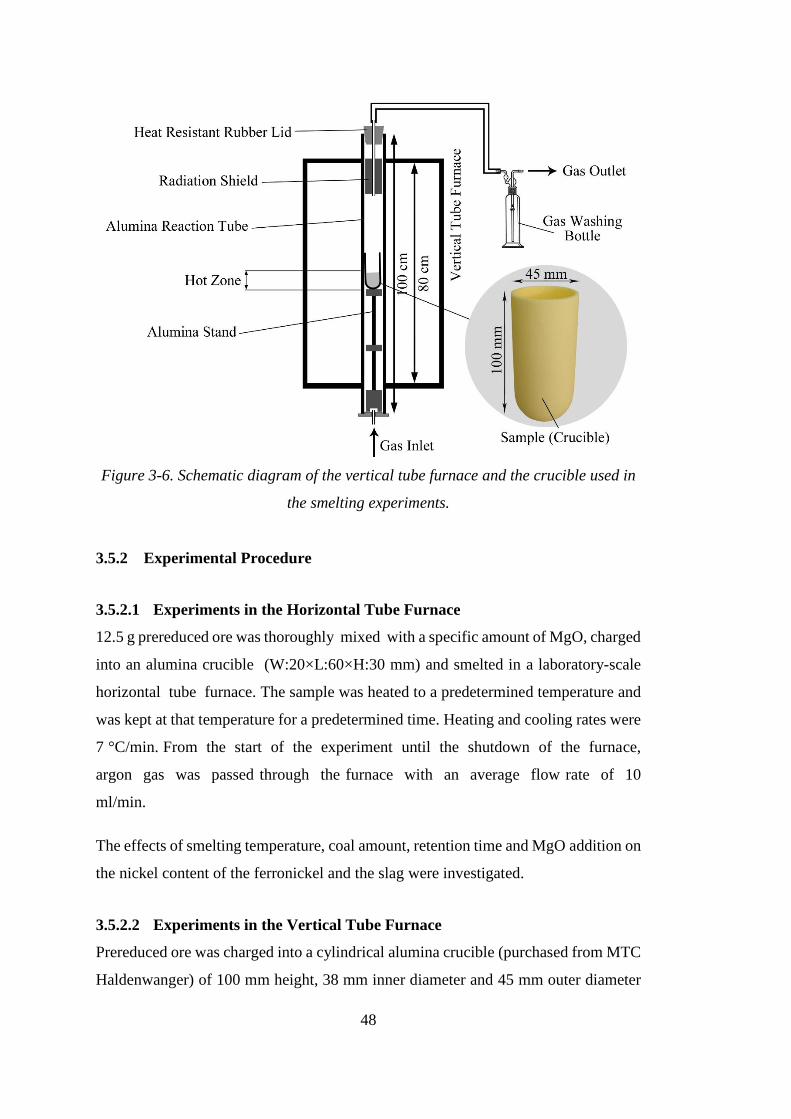
48
Figure 3-6. Schematic diagram of the vertical tube furnace and the crucible used in
the smelting experiments.
3.5.2 Experimental Procedure
3.5.2.1 Experiments in the Horizontal Tube Furnace
12.5 g prereduced ore was thoroughly mixed with a specific amount of MgO, charged
into an alumina crucible (W:20×L:60×H:30 mm) and smelted in a laboratory-scale
horizontal tube furnace. The sample was heated to a predetermined temperature and
was kept at that temperature for a predetermined time. Heating and cooling rates were
7 °C/min. From the start of the experiment until the shutdown of the furnace,
argon gas was passed through the furnace with an average flow rate of 10
ml/min.
The effects of smelting temperature, coal amount, retention time and MgO addition on
the nickel content of the ferronickel and the slag were investigated.
3.5.2.2 Experiments in the Vertical Tube Furnace
Prereduced ore was charged into a cylindrical alumina crucible (purchased from MTC
Haldenwanger) of 100 mm height, 38 mm inner diameter and 45 mm outer diameter
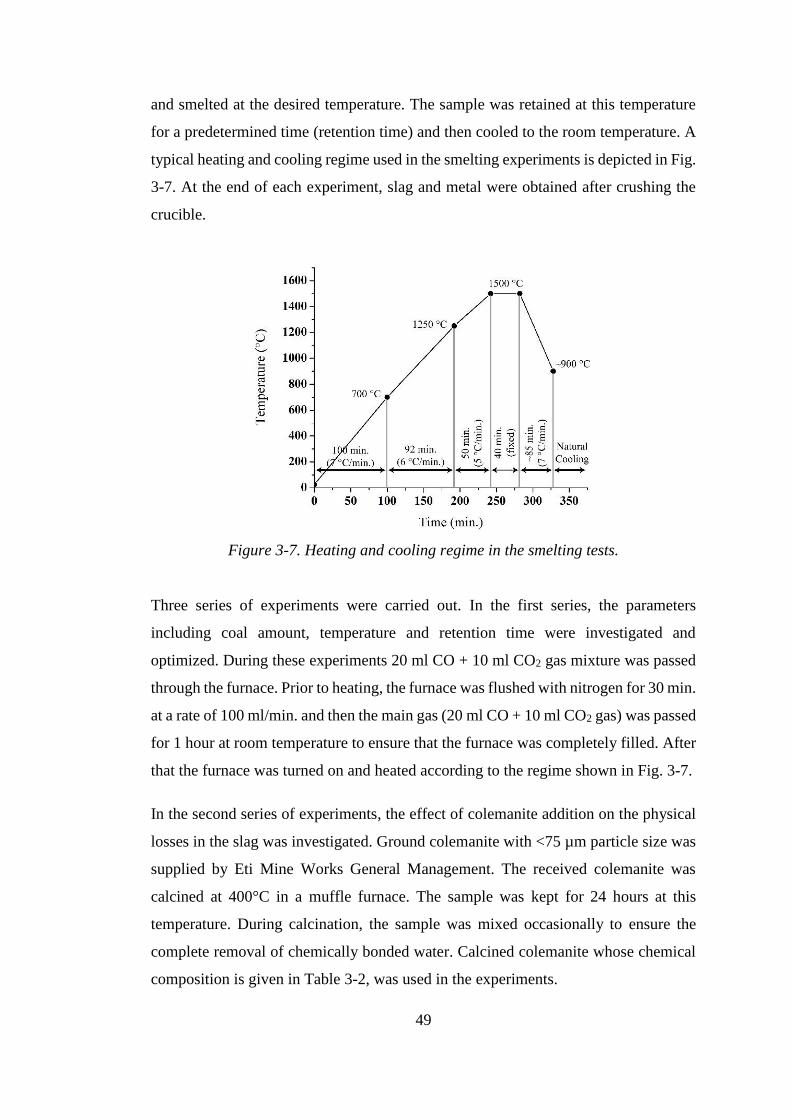
49
and smelted at the desired temperature. The sample was retained at this temperature
for a predetermined time (retention time) and then cooled to the room temperature. A
typical heating and cooling regime used in the smelting experiments is depicted in Fig.
3-7. At the end of each experiment, slag and metal were obtained after crushing the
crucible.
Figure 3-7. Heating and cooling regime in the smelting tests.
Three series of experiments were carried out. In the first series, the parameters
including coal amount, temperature and retention time were investigated and
optimized. During these experiments 20 ml CO + 10 ml CO2 gas mixture was passed
through the furnace. Prior to heating, the furnace was flushed with nitrogen for 30 min.
at a rate of 100 ml/min. and then the main gas (20 ml CO + 10 ml CO2 gas) was passed
for 1 hour at room temperature to ensure that the furnace was completely filled. After
that the furnace was turned on and heated according to the regime shown in Fig. 3-7.
In the second series of experiments, the effect of colemanite addition on the physical
losses in the slag was investigated. Ground colemanite with <75 µm particle size was
supplied by Eti Mine Works General Management. The received colemanite was
calcined at 400°C in a muffle furnace. The sample was kept for 24 hours at this
temperature. During calcination, the sample was mixed occasionally to ensure the
complete removal of chemically bonded water. Calcined colemanite whose chemical
composition is given in Table 3-2, was used in the experiments.
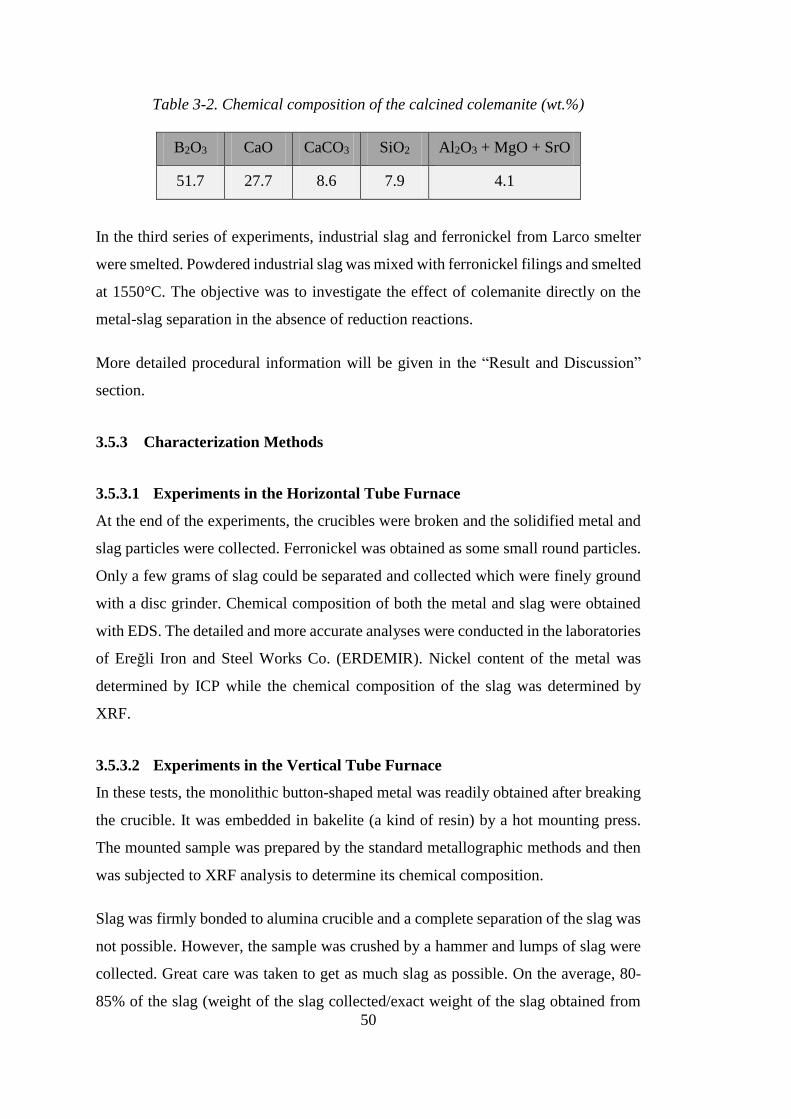
50
Table 3-2. Chemical composition of the calcined colemanite (wt.%)
B2O3 CaO CaCO3 SiO2 Al2O3 + MgO + SrO
51.7 27.7 8.6 7.9 4.1
In the third series of experiments, industrial slag and ferronickel from Larco smelter
were smelted. Powdered industrial slag was mixed with ferronickel filings and smelted
at 1550°C. The objective was to investigate the effect of colemanite directly on the
metal-slag separation in the absence of reduction reactions.
More detailed procedural information will be given in the “Result and Discussion”
section.
3.5.3 Characterization Methods
3.5.3.1 Experiments in the Horizontal Tube Furnace
At the end of the experiments, the crucibles were broken and the solidified metal and
slag particles were collected. Ferronickel was obtained as some small round particles.
Only a few grams of slag could be separated and collected which were finely ground
with a disc grinder. Chemical composition of both the metal and slag were obtained
with EDS. The detailed and more accurate analyses were conducted in the laboratories
of Ereğli Iron and Steel Works Co. (ERDEMIR). Nickel content of the metal was
determined by ICP while the chemical composition of the slag was determined by
XRF.
3.5.3.2 Experiments in the Vertical Tube Furnace
In these tests, the monolithic button-shaped metal was readily obtained after breaking
the crucible. It was embedded in bakelite (a kind of resin) by a hot mounting press.
The mounted sample was prepared by the standard metallographic methods and then
was subjected to XRF analysis to determine its chemical composition.
Slag was firmly bonded to alumina crucible and a complete separation of the slag was
not possible. However, the sample was crushed by a hammer and lumps of slag were
collected. Great care was taken to get as much slag as possible. On the average, 80-
85% of the slag (weight of the slag collected/exact weight of the slag obtained from
51
mass balance) could be collected. Metallographic sections of some slag lumps were
prepared and investigated under SEM. Point EDS analysis was utilized to determine
the chemical composition of the phases present in the slag. These lumps were next
crushed and ground for XRD and chemical analyses.
Chemical composition of the slag was determined by XRF. However, the XRF
analysis gives only a general elemental analysis and it is not possible to distinguish
between the same elements of different oxidation states, e.g. Fe3+ and Fe2+. This is
particularly crucial, in the current study since it is required to separately measure
physical (Ni0) and chemical (Ni2+) losses of the nickel in the slag. Therefore, wet
chemical techniques were used for this purpose. A two-step procedure was employed
to the finely ground slag. A well grinding ensured complete liberation of the entrapped
metallic particles from the silicate matrix of the solidified slag.
Physical losses of Fe, Ni and Co in the slag were determined by the bromine-methanol
analysis [68]. In this method, the entrapped metallic particles are selectively dissolved
in a bromine-methanol solution without affecting the silicate matrix. This method has
been explained in the preceding section. The same method was applied here, but 4 g
of the powdered slag was used instead of 1 g of slag. The bromine-methanol solution
was filtered. The filtrate was used to determine the physical losses while the residue
was used to determine the chemical losses in the slag.
For the determination of chemical losses, 0.1 g of the residue was placed in a special
Teflon container. 2 ml of nitric acid, 4 ml of hydrochloric acid and 2 ml of hydrofluoric
acid were added. A standard microwave oven was used to dissolve the sample in the
acid mixture. The solution obtained was then heated to vaporize all of the liquid. The
solid deposit was dissolved in 10 ml of deionized water + 5 ml of hydrochloric acid.
Resultant solution was poured in a 25 ml volumetric flask which was filled with
deionized water and then analyzed with AAS for Ni and Co.
In the cases that a microwave oven was not available, an alternative procedure was
utilized. 0.1 g of the sample (residue) was placed in a Teflon beaker. 1 ml of deionized
water, 1 ml of sulfuric acid and 5 ml of hydrofluoric acid were added. It was heated
until the whole liquid evaporated. Then, 8 ml of regal water (2 ml of nitric acid + 6 ml
of hydrochloric acid) were added and again it was heated until the whole liquid
52
evaporated leaving a solid residue behind. 15 ml of deionized water and 5 ml of
hydrochloric acid were added and boiled until the whole residue was dissolved. The
solution was filtered into a 25 ml volumetric flask which was filled with deionized
water and then analyzed by AAS.
53
CHAPTER 4
4 RESULTS & DISCUSSION
4.1 Mineral Dressing & Characterization
Characterization of the ore is the significant first stage in the design of a processing
method. In this study, dry screen analysis, chemical analysis, qualitative phase
analysis (XRD), quantitative phase analysis (Rietveld analysis) and thermal analyses
were employed to fully characterize the ore.
4.1.1 Dry Screen Analysis
The moisture content of the run-of-mine (ROM) ore was found to be 13.6 wt.% which
was lower than 25-30% range reported in the literature [37]. The ore might have partly
dried during the transportation and also during the sample preparation, especially
coning and quartering. Figure 4-1 shows the particle size distribution of the ROM ore.
According to this diagram, about 50% of the ore was finer than 10 mm and a
considerable fraction of the ore (about 16 wt.%) was present as dust (<600 µm). A
large fraction of fine particles is typical of laterites which greatly affects operation of
both the RK and EF. It is intimately connected with the high dusting rate in the rotary
kilns and also with the lower height of calcine self-lining in the electric furnace. The
calcine self-lining protects furnace walls from the chemical attack by slag [69].
Figure 4-2 shows the particle size distribution of the ore sample before and after
tumbler test. About 70% of the ore was decrepitated into particles finer than 600 µm
indicating the low resistance of the ore against abrasion and impact.
High moisture content, large amount of dust and low mechanical properties of the ore
were ascribed to its porous nature. The morphology of a typical limonitic particle is
presented in Fig. 4-3-a. It is seen that the fine particles stick to the surface of the larger
ones and form agglomerates with a large surface area. In addition, these fine particles
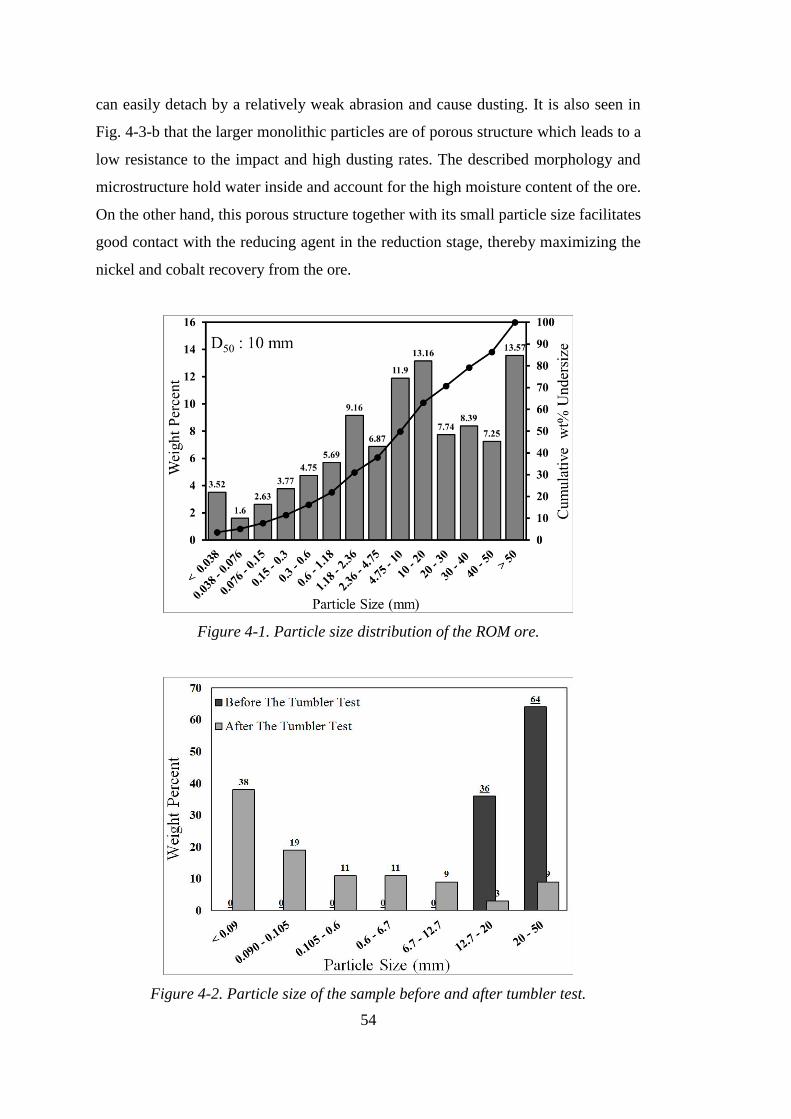
54
can easily detach by a relatively weak abrasion and cause dusting. It is also seen in
Fig. 4-3-b that the larger monolithic particles are of porous structure which leads to a
low resistance to the impact and high dusting rates. The described morphology and
microstructure hold water inside and account for the high moisture content of the ore.
On the other hand, this porous structure together with its small particle size facilitates
good contact with the reducing agent in the reduction stage, thereby maximizing the
nickel and cobalt recovery from the ore.
Figure 4-1. Particle size distribution of the ROM ore.
Figure 4-2. Particle size of the sample before and after tumbler test.
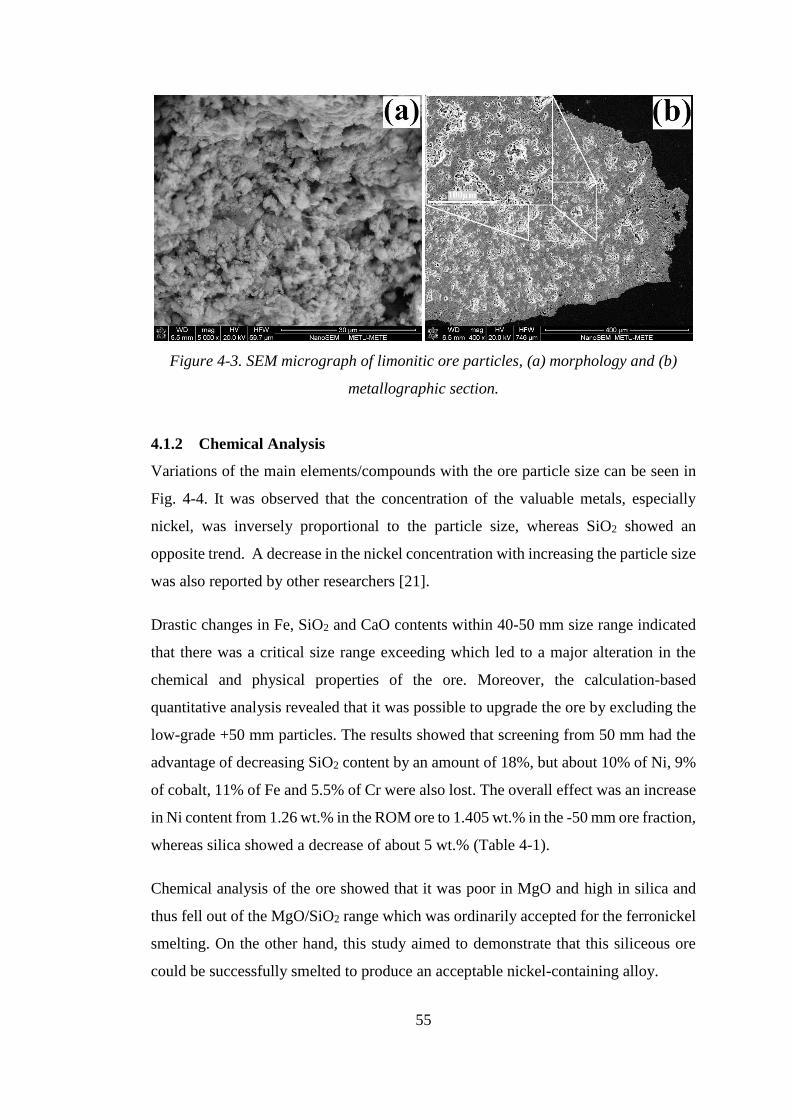
55
Figure 4-3. SEM micrograph of limonitic ore particles, (a) morphology and (b)
metallographic section.
4.1.2 Chemical Analysis
Variations of the main elements/compounds with the ore particle size can be seen in
Fig. 4-4. It was observed that the concentration of the valuable metals, especially
nickel, was inversely proportional to the particle size, whereas SiO2 showed an
opposite trend. A decrease in the nickel concentration with increasing the particle size
was also reported by other researchers [21].
Drastic changes in Fe, SiO2 and CaO contents within 40-50 mm size range indicated
that there was a critical size range exceeding which led to a major alteration in the
chemical and physical properties of the ore. Moreover, the calculation-based
quantitative analysis revealed that it was possible to upgrade the ore by excluding the
low-grade +50 mm particles. The results showed that screening from 50 mm had the
advantage of decreasing SiO2 content by an amount of 18%, but about 10% of Ni, 9%
of cobalt, 11% of Fe and 5.5% of Cr were also lost. The overall effect was an increase
in Ni content from 1.26 wt.% in the ROM ore to 1.405 wt.% in the -50 mm ore fraction,
whereas silica showed a decrease of about 5 wt.% (Table 4-1).
Chemical analysis of the ore showed that it was poor in MgO and high in silica and
thus fell out of the MgO/SiO2 range which was ordinarily accepted for the ferronickel
smelting. On the other hand, this study aimed to demonstrate that this siliceous ore
could be successfully smelted to produce an acceptable nickel-containing alloy.
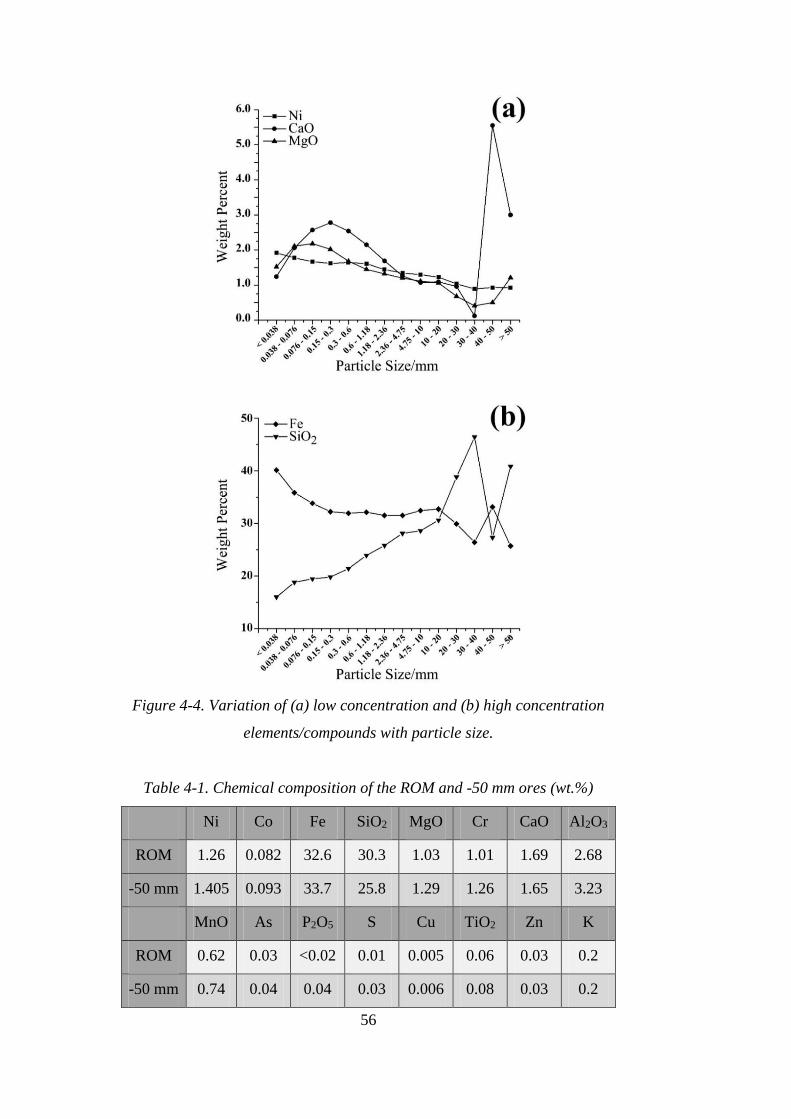
56
Figure 4-4. Variation of (a) low concentration and (b) high concentration
elements/compounds with particle size.
Table 4-1. Chemical composition of the ROM and -50 mm ores (wt.%)
Ni Co Fe SiO2 MgO Cr CaO Al2O3
ROM 1.26 0.082 32.6 30.3 1.03 1.01 1.69 2.68
-50 mm 1.405 0.093 33.7 25.8 1.29 1.26 1.65 3.23
MnO As P2O5 S Cu TiO2 Zn K
ROM 0.62 0.03 <0.02 0.01 0.005 0.06 0.03 0.2
-50 mm 0.74 0.04 0.04 0.03 0.006 0.08 0.03 0.2
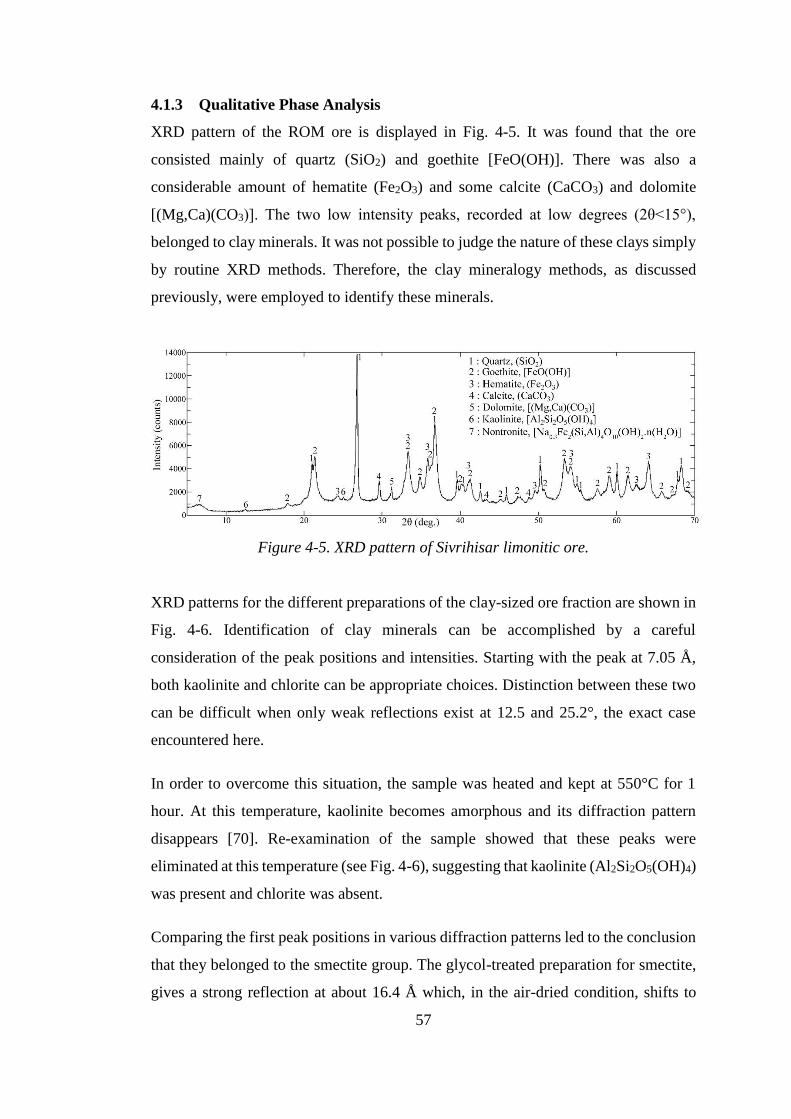
57
4.1.3 Qualitative Phase Analysis
XRD pattern of the ROM ore is displayed in Fig. 4-5. It was found that the ore
consisted mainly of quartz (SiO2) and goethite [FeO(OH)]. There was also a
considerable amount of hematite (Fe2O3) and some calcite (CaCO3) and dolomite
[(Mg,Ca)(CO3)]. The two low intensity peaks, recorded at low degrees (2θ<15°),
belonged to clay minerals. It was not possible to judge the nature of these clays simply
by routine XRD methods. Therefore, the clay mineralogy methods, as discussed
previously, were employed to identify these minerals.
Figure 4-5. XRD pattern of Sivrihisar limonitic ore.
XRD patterns for the different preparations of the clay-sized ore fraction are shown in
Fig. 4-6. Identification of clay minerals can be accomplished by a careful
consideration of the peak positions and intensities. Starting with the peak at 7.05 Å,
both kaolinite and chlorite can be appropriate choices. Distinction between these two
can be difficult when only weak reflections exist at 12.5 and 25.2°, the exact case
encountered here.
In order to overcome this situation, the sample was heated and kept at 550°C for 1
hour. At this temperature, kaolinite becomes amorphous and its diffraction pattern
disappears [70]. Re-examination of the sample showed that these peaks were
eliminated at this temperature (see Fig. 4-6), suggesting that kaolinite (Al2Si2O5(OH)4)
was present and chlorite was absent.
Comparing the first peak positions in various diffraction patterns led to the conclusion
that they belonged to the smectite group. The glycol-treated preparation for smectite,
gives a strong reflection at about 16.4 Å which, in the air-dried condition, shifts to

58
about 14.8 Å. Confirmation of this identification was accomplished by drying the
sample at 300°C. This treatment collapses smectite to about 10 Å [70].
Figure 4-6. XRD patterns of different preparations of the clay-sized fraction.
The word smectite covers a number of different smectites, each of which has a defined
range of compositions [71]. To distinguish the type of smectite present in the ore, a
clay containing sample was taken from the mine site and examined by
thermogravimetric and differential thermal analysis (TG/DTA). Thermal behavior of
clays offers valuable information about their composition. The sample was a brown
rock with plenty of green veins. The XRD pattern of this sample (Fig. 4-7) suggested
that it was composed of only quartz and smectite. TG/DTA curves for this sample are
presented in Fig. 4-8. There are two main endothermic peaks at about 100 and 550°C.
The first peak at 100°C caused by evaporation of sample moisture. The other peak at
550°C indicates that a transformation took place at this range. Considering quartz does
not undergo any mass-losing transformation below 800°C, it was connected to
smectite.

59
Depending on their composition, dehydroxylation temperatures of smectites vary
within a wide range. However, as a general feature, for the aluminum smectites
(montmorillonites and beidellites), dehydroxylation typically commences at
temperatures above 700°C, whereas for the iron rich smectites (ferruginous smectites
and nontronites), it occurs at lower temperatures (around 500°C) [72, 73, 74].
Therefore, the endothermic peak at 550°C revealed that the smecticte in the present
sample was iron rich type.
Figure 4-7. XRD pattern of the smectite containing rock taken from the mine site.
Figure 4-8. DTA/TG curves of the smectite containing rock taken from the mine site.
Chemical composition of the smectite sample was determined by EDS. Results of forty
point analysis were averaged out. The average analysis is given in Table 4-2.
According to the EDS examination, an iron rich smectite, either of ferruginous

60
smectite or nontronite, existed in the sample which confirmed the results obtained
from DTA/TG. Ferruginous smectite, called as Fe-rich montmorillonite, contains not
more than 33% Fe2O3 (excluding structural water) [73]. Consequently nontronite type
smectite with around 40% Fe2O3 and general formula of
Na0.3Fe2(Si,Al)4O10(OH)2.n(H2O) was present in the Sivrihisar limonitic laterite ore.
Table 4-2. Average composition of the smectite sample (wt.%)
Na2O MgO Al2O3 SiO2 Fe2O3 NiO
1.7 2.4 11.7 41.7 39.9 2.6
4.1.4 Quantitative Phase Analysis
The Rietveld method was employed to quantify the minerals percentages. It should be
noted that the method is valid only when using the diffraction data collected with fixed
slits. The present data, however, were collected with a variable slit. The problem was
solved by multiplying the data by 1/sin θ conversion factor to obtain pseudo-fixed slit
data [75]. The method was first applied to the five main non-clay minerals after
excluding the peaks of clay minerals from the pattern. Figure 4-9-a shows the fitted
profile.
From the clay mineralogy methods, the clay-sized fraction was determined to be 4.9%.
Nontronite to kaolinite ratio in the clay-sized fraction was found to be 3.6 by fitting a
profile to the diffraction pattern of the air-dried clay sample (Fig. 4-9-b). Accordingly,
nontronite and kaolinite fractions in the ROM ore were calculated as 4.5 and 1.2 wt.%,
respectively. Finally, the weight percentages of non-clay minerals were normalized by
multiplying with 0.951 [(100-4.9)/100]. Table 4-3 presents the weight percentages of
the minerals in the ore.
As a check, the total volatile constituents of the ore were calculated theoretically and
compared with the empirical one. Considering that 10.14 wt% of goethite, 18.16 wt%
of nontronite and 13.96% of kaolinite is water (as OH group), and 43.97 wt% of calcite
and 47.43 wt% of dolomite is CO2 (data from www.webmineral.com), the total
volatiles were calculated as follows:
(0.533×10.14%) + (0.038×18.6%) + (0.011×13.96%) + (0.039×43.97%) + (0.031×47.43%) = 9.45%
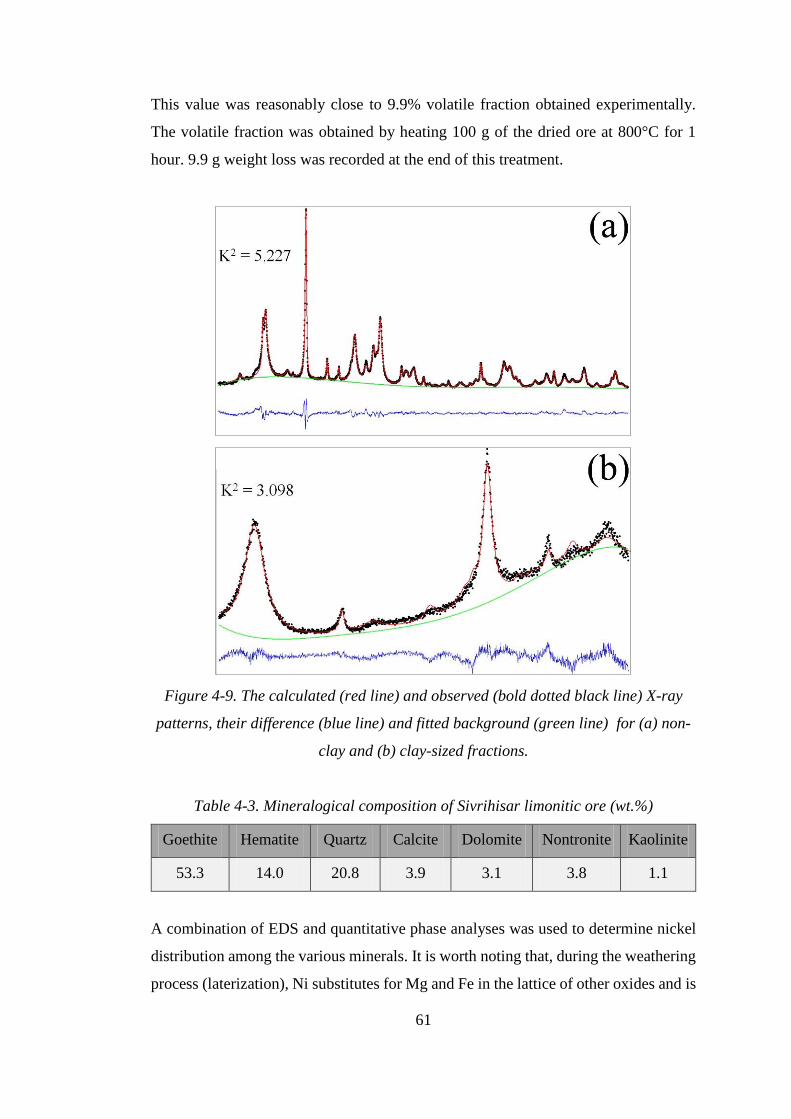
61
This value was reasonably close to 9.9% volatile fraction obtained experimentally.
The volatile fraction was obtained by heating 100 g of the dried ore at 800°C for 1
hour. 9.9 g weight loss was recorded at the end of this treatment.
Figure 4-9. The calculated (red line) and observed (bold dotted black line) X-ray
patterns, their difference (blue line) and fitted background (green line) for (a) non-
clay and (b) clay-sized fractions.
Table 4-3. Mineralogical composition of Sivrihisar limonitic ore (wt.%)
Goethite Hematite Quartz Calcite Dolomite Nontronite Kaolinite
53.3 14.0 20.8 3.9 3.1 3.8 1.1
A combination of EDS and quantitative phase analyses was used to determine nickel
distribution among the various minerals. It is worth noting that, during the weathering
process (laterization), Ni substitutes for Mg and Fe in the lattice of other oxides and is
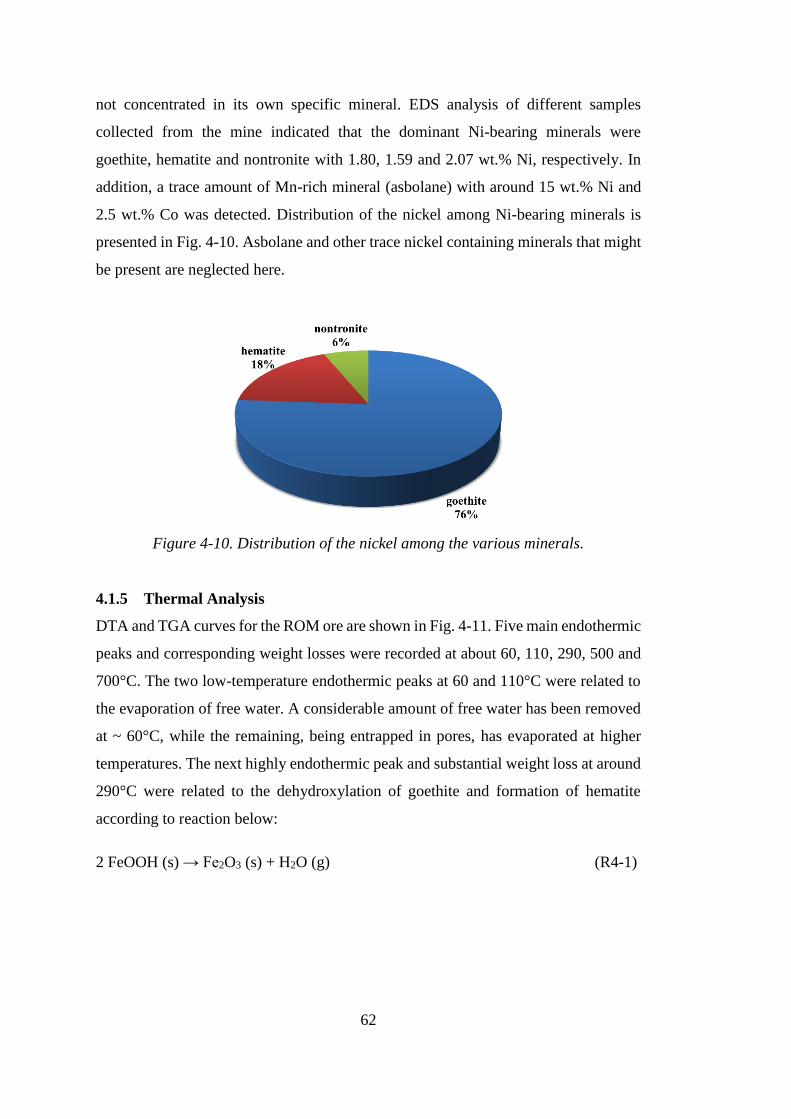
62
not concentrated in its own specific mineral. EDS analysis of different samples
collected from the mine indicated that the dominant Ni-bearing minerals were
goethite, hematite and nontronite with 1.80, 1.59 and 2.07 wt.% Ni, respectively. In
addition, a trace amount of Mn-rich mineral (asbolane) with around 15 wt.% Ni and
2.5 wt.% Co was detected. Distribution of the nickel among Ni-bearing minerals is
presented in Fig. 4-10. Asbolane and other trace nickel containing minerals that might
be present are neglected here.
Figure 4-10. Distribution of the nickel among the various minerals.
4.1.5 Thermal Analysis
DTA and TGA curves for the ROM ore are shown in Fig. 4-11. Five main endothermic
peaks and corresponding weight losses were recorded at about 60, 110, 290, 500 and
700°C. The two low-temperature endothermic peaks at 60 and 110°C were related to
the evaporation of free water. A considerable amount of free water has been removed
at ~ 60°C, while the remaining, being entrapped in pores, has evaporated at higher
temperatures. The next highly endothermic peak and substantial weight loss at around
290°C were related to the dehydroxylation of goethite and formation of hematite
according to reaction below:
2 FeOOH (s) → Fe2O3 (s) + H2O (g) (R4-1)
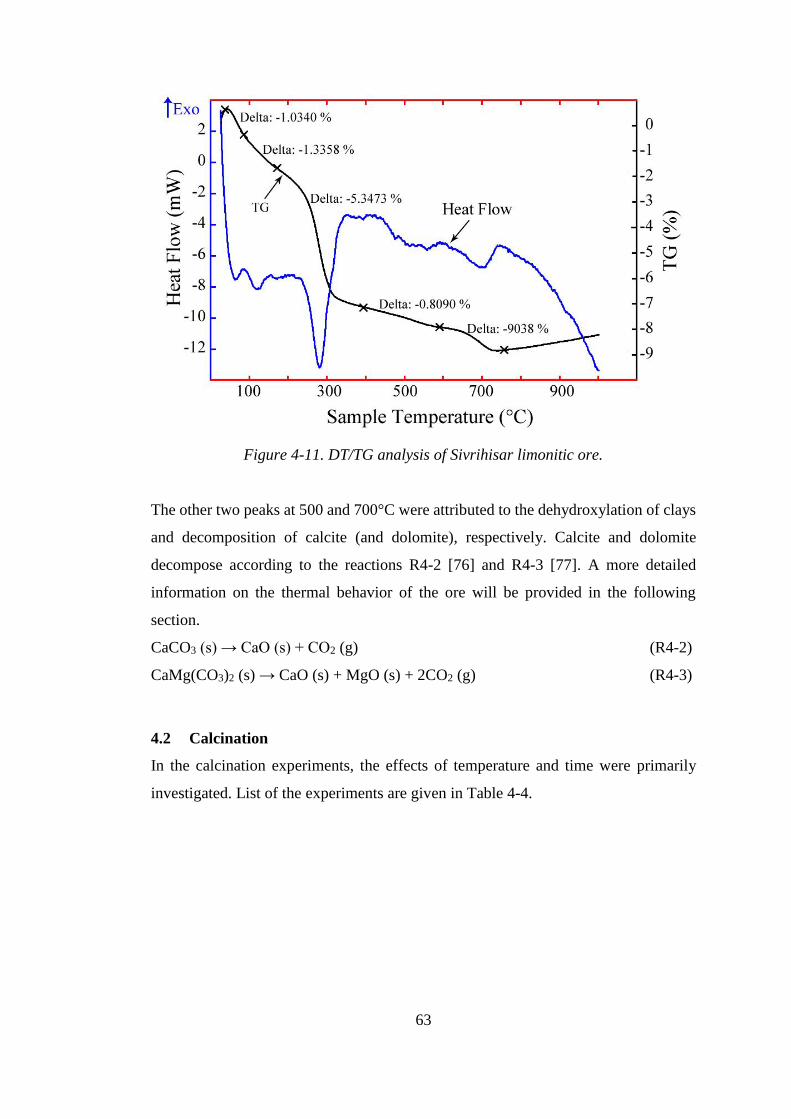
63
Figure 4-11. DT/TG analysis of Sivrihisar limonitic ore.
The other two peaks at 500 and 700°C were attributed to the dehydroxylation of clays
and decomposition of calcite (and dolomite), respectively. Calcite and dolomite
decompose according to the reactions R4-2 [76] and R4-3 [77]. A more detailed
information on the thermal behavior of the ore will be provided in the following
section.
CaCO3 (s) → CaO (s) + CO2 (g) (R4-2)
CaMg(CO3)2 (s) → CaO (s) + MgO (s) + 2CO2 (g) (R4-3)
4.2 Calcination
In the calcination experiments, the effects of temperature and time were primarily
investigated. List of the experiments are given in Table 4-4.
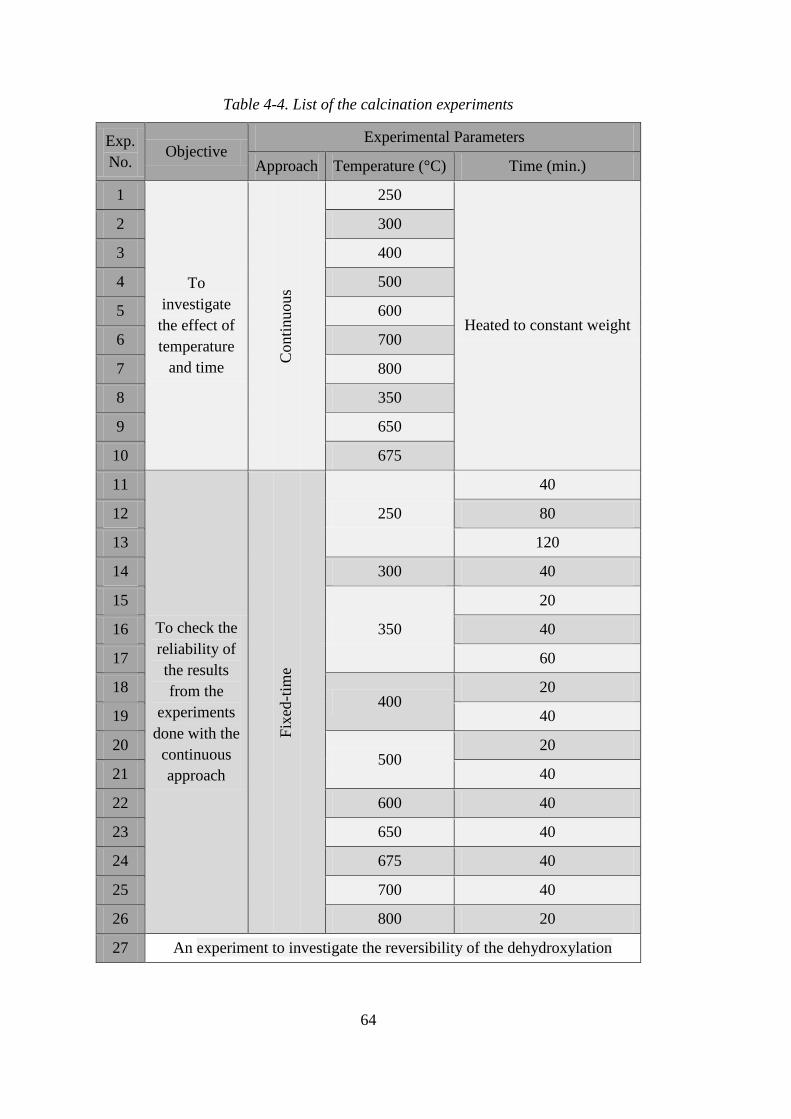
64
Table 4-4. List of the calcination experiments
Exp.
No. Objective
Experimental Parameters
Approach Temperature (°C) Time (min.)
1
To
investigate
the effect of
temperature
and time
Conti
nuous
250
Heated to constant weight
2 300
3 400
4 500
5 600
6 700
7 800
8 350
9 650
10 675
11
To check the
reliability of
the results
from the
experiments
done with the
continuous
approach
Fix
ed-t
ime
250
40
12 80
13 120
14 300 40
15
350
20
16 40
17 60
18 400
20
19 40
20 500
20
21 40
22 600 40
23 650 40
24 675 40
25 700 40
26 800 20
27 An experiment to investigate the reversibility of the dehydroxylation

65
4.2.1 Effect of Temperature and Time
Initially, the calcination experiments were conducted at 250, 300, 400, 500, 600, 700
and 800°C. Samples were heated to constant weight. Weight loss of these samples
with time are illustrated in Fig. 4-12. From this figure, at 250°C for instance, the
constant weight was achieved after 115 min. losing 5.88% of sample weight. The final
weight loss (weight loss after reaching the constant weight) was determined for each
temperature and plotted against the corresponding time (time required to reach the
constant weight) as presented in Fig. 4-13.
Figure 4-12. Weight loss as a function of time at various temperatures.
It can be seen that the final weight loss steadily increased with increasing temperature
up to 700°C and then remained constant and became independent of temperature
between 700 and 800°C. This result indicated that the removal of chemically bound
water and other volatiles was completed at a temperature between 600 and 700°C.
Variation of the time with temperature is also given in Fig. 4-13. It decreases until
400°C and then alternates at the higher temperatures. It is accepted that an increase in
temperature favors an endothermic reaction and, at the same time, increases the
reaction rate. Therefore, the anomalous increased time at 500 and 700°C implied that
some new reactions had begun before these temperatures were reached. These results
are in agreement with thermal analysis of the ore (see Fig. 4-11).

66
Figure 4-13. Variations of the final weight loss and time with temperature.
To have a better understanding of the nature of these reactions, the calcined samples
were analyzed by XRD. The XRD patterns of the samples are shown in Fig. 4-14.
According to these results, not the whole but a main part of goethite transformed into
hematite at 250°C. The remainder of goethite transformed at 300°C as its characteristic
peaks completely disappeared. No other change was observed until 600°C where a
relatively intense peak, designated by number 7, appeared. In fact, this peak existed in
the lower-temperature patterns but it was very weak. It has not been related to any
phases yet and is still unknown. In spite of the fact that any considerable change was
not detected in these XRD patterns until 600°C, from the previous findings (see Figs.
4-6 and 4-8), it was clear that dehydroxylation of nontronite and kaolinite took place
in this range. Dehydroxylation of nontronite is complicated and depending on its
composition different phases such as hematite, magnetite, fayalite and Fe-Si spinel can
be formed at the end of dehydroxylation [78]. Dehydroxylation of kaolinite at these
temperatures (500-600°C) leads to the formation of metakaolinite. The transformation
may simply be represented as below [79]:
Al2Si2O5(OH)4 → Al2Si2O7 + 2H2O (R4-4)
At much higher temperatures (e.g. 900°C), the metakaolinite decomposes to mullite,
γ-alumina and silica according to the reaction below:
3Al2Si2O7 → Al4SiO8 + Al2O3 + 5SiO2 (R4-5)
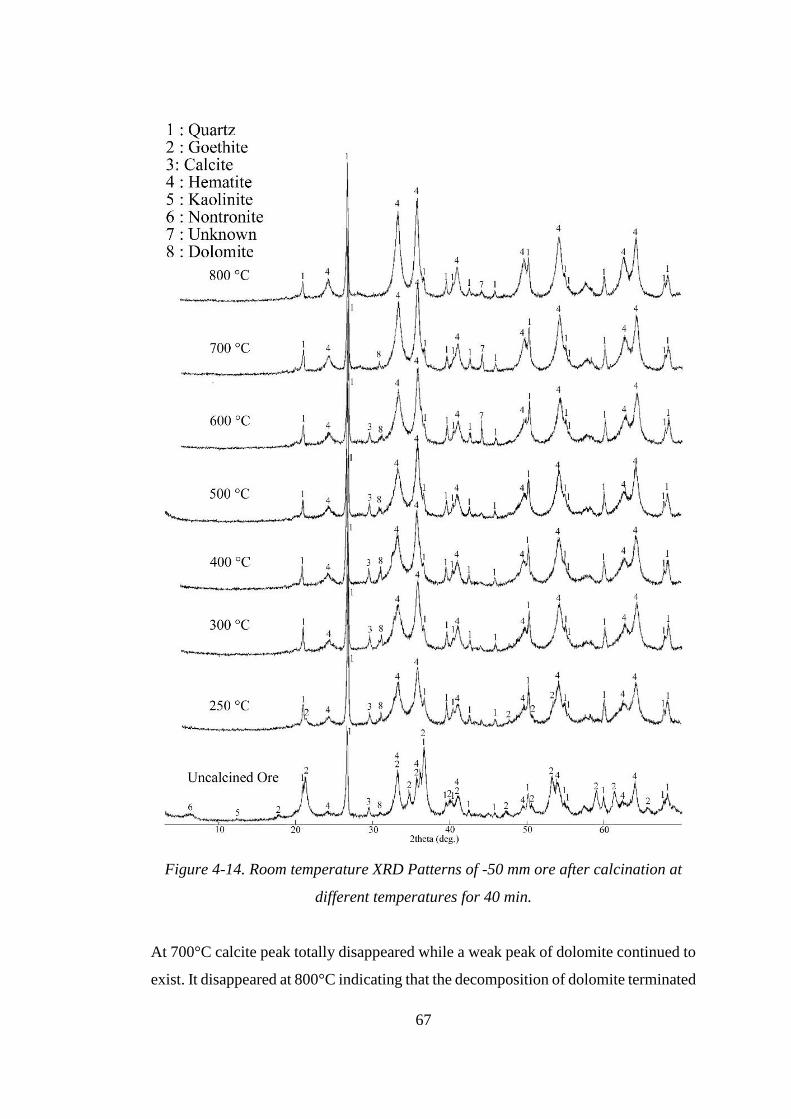
67
Figure 4-14. Room temperature XRD Patterns of -50 mm ore after calcination at
different temperatures for 40 min.
At 700°C calcite peak totally disappeared while a weak peak of dolomite continued to
exist. It disappeared at 800°C indicating that the decomposition of dolomite terminated

68
at a temperature between 700 and 800°C. In the calcination experiments, however,
additional weight loss had not been recorded above 700°C. It should be noted that
these samples were calcined for 40 min. before XRD analysis, while the constant
weight had been reached in 55 min. at 700°C. Therefore, maybe the weak dolomite
peak would have disappeared if longer time had been provided. Following these
observations, the weight loss and the reaction between 600 and 700°C were attributed
to the decomposition of calcite and dolomite (R4-2 and R 4-3).
In order to study the calcination behavior of the ore more precisely, two more
experiments were conducted at 350 and 650°C. Weight loss for these samples are also
shown in Fig. 4-15. The run conducted at 350°C produced a weight loss of 6.7%,
which was nearly the same as that obtained at 300°C (6.6%). The time to reach steady
state was 60 min., which was shorter than that of the run conducted at 300°C. So, it
was concluded that goethite to hematite transformation had happened almost
completely at 300°C.
Figure 4-15. Weight loss as a function of time at various temperatures.
Calcination of the ore at 650°C resulted in a weight loss of 9.6%. This value was less
than that was obtained at 700°C (10%), suggesting that 650°C was inadequate for
complete decomposition of calcite and dolomite even after extended periods of time.

69
So, a further experiment was carried out at the mid-point of 650-700°C. This time, a
weight loss of 10% was recorded which was equal to the one obtained at 700°C.
However, the time to reach constant weight was 75 min., which was longer than the
time required at 700°C (55 min.).
In summary, it was found that the full removal of chemically bound water and other
volatiles necessitated 75 min. at 675°C, 55 min. at 700°C, and 35 min. at 800°C.
Calcination temperature was preferred to be kept as low as possible to save energy and
also to avoid extra decrease in specific surface area of the ore. It has been reported that
the narrow pores are filled by diffusion and the specific surface area of the ore
decreases as temperature increases [69, 80]. The decreased specific surface area/
inhibits the effective contact between the ore and reducing atmosphere in the
subsequent reduction step. On the other hand, it takes a fairly long time to remove all
volatiles at 675°C. Under these circumstances, 700°C and 40 min. were chosen as the
optimum calcination conditions. 40 min. was suggested instead of 55 min., which was
necessary for a complete calcination of the ore. In this way, 2% of the volatiles was
left in the ore, which, in turn, led to 30% saving in time, i.e. 98% of the process
terminated within 40 min.
As mentioned in the previous chapter, two approaches, continuous and fixed-time,
were indicated to be used in the calcination experiments (refer to section 3.3). All of
the experiments discussed so far were conducted by the first approach. To check the
results obtained from the first approach, some experiments were performed with the
second approach, called as “fixed-time” approach. Results of the two approaches are
presented and compared in Fig. 4-16. The differences were calculated as written
below:
𝐷𝑖𝑓𝑓𝑒𝑟𝑒𝑛𝑐𝑒 (%) =𝑊𝐿𝑓𝑖𝑥𝑒𝑑−𝑊𝐿𝐶
𝑊𝐿𝐶× 100 (E4-1)
where 𝑊𝐿𝑓𝑖𝑥𝑒𝑑 and 𝑊𝐿𝐶 are weight losses recorded with the fixed-time and
continuous approaches, respectively. For temperatures above 350°C, weight losses
obtained from the second approach were found to be nearly the same as those recorded
in the first approach. The difference was found to stay in the ± 2% band indicating that
the heat loss during weighing did not affect the results and the continuous approach
yielded reliable results above 350°C. However, the weight loss difference was

70
prominent for the temperatures below 350°C, and reached the maximum of ~11% for
the lowest temperature (250°C, 40 min.). Redrawing of the weight loss vs. time curves
for these temperatures using the new points, which were obtained from the fixed-time
approach (see Fig. 4-16), could provide more accurate results.
This situation was abnormal because, if the problem had arisen from the heat loss
effect, the difference should be larger at higher temperatures (>350°C) due to the
steeper temperature gradient between the hot sample and air. In order to find out about
this problem, an experiment was conducted as follows: 100 g of the dried -50 mm ore
was kept at 300°C for 2 hours. The hot calcine was immediately weighed and was left
in air for one day. It was then dried overnight at 105°C to totally eliminate absorbed
moisture. The dried sample was weighed again and the difference with the weight
recorded just after calcination (in hot state) was determined. There was a permanent
increase in the weight of the dried sample compared to that of the sample just after
calcination (in hot state). Similar cycles were carried out at 500°C and 800°C for the
same sample. The process is schematically illustrated in Fig. 4-17.
Figure 4-16. Weight loss during calcination for continuous and fixed-time
approaches and their difference in percent.
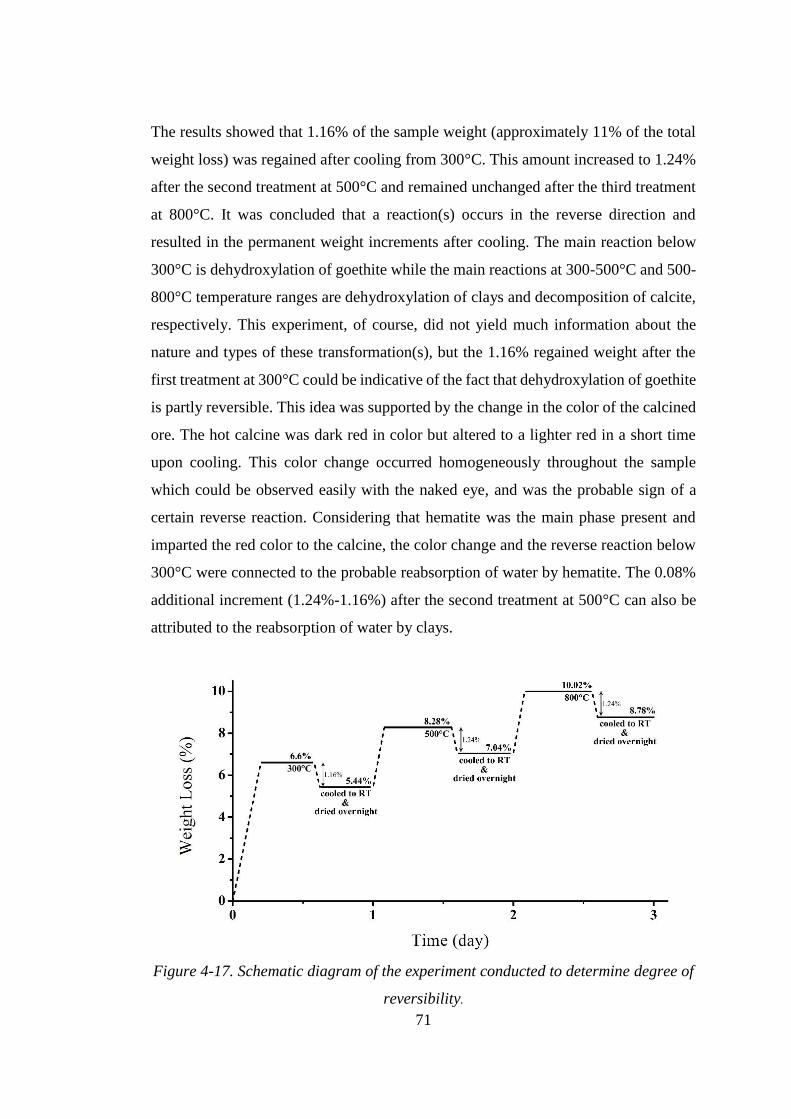
71
The results showed that 1.16% of the sample weight (approximately 11% of the total
weight loss) was regained after cooling from 300°C. This amount increased to 1.24%
after the second treatment at 500°C and remained unchanged after the third treatment
at 800°C. It was concluded that a reaction(s) occurs in the reverse direction and
resulted in the permanent weight increments after cooling. The main reaction below
300°C is dehydroxylation of goethite while the main reactions at 300-500°C and 500-
800°C temperature ranges are dehydroxylation of clays and decomposition of calcite,
respectively. This experiment, of course, did not yield much information about the
nature and types of these transformation(s), but the 1.16% regained weight after the
first treatment at 300°C could be indicative of the fact that dehydroxylation of goethite
is partly reversible. This idea was supported by the change in the color of the calcined
ore. The hot calcine was dark red in color but altered to a lighter red in a short time
upon cooling. This color change occurred homogeneously throughout the sample
which could be observed easily with the naked eye, and was the probable sign of a
certain reverse reaction. Considering that hematite was the main phase present and
imparted the red color to the calcine, the color change and the reverse reaction below
300°C were connected to the probable reabsorption of water by hematite. The 0.08%
additional increment (1.24%-1.16%) after the second treatment at 500°C can also be
attributed to the reabsorption of water by clays.
Figure 4-17. Schematic diagram of the experiment conducted to determine degree of
reversibility.
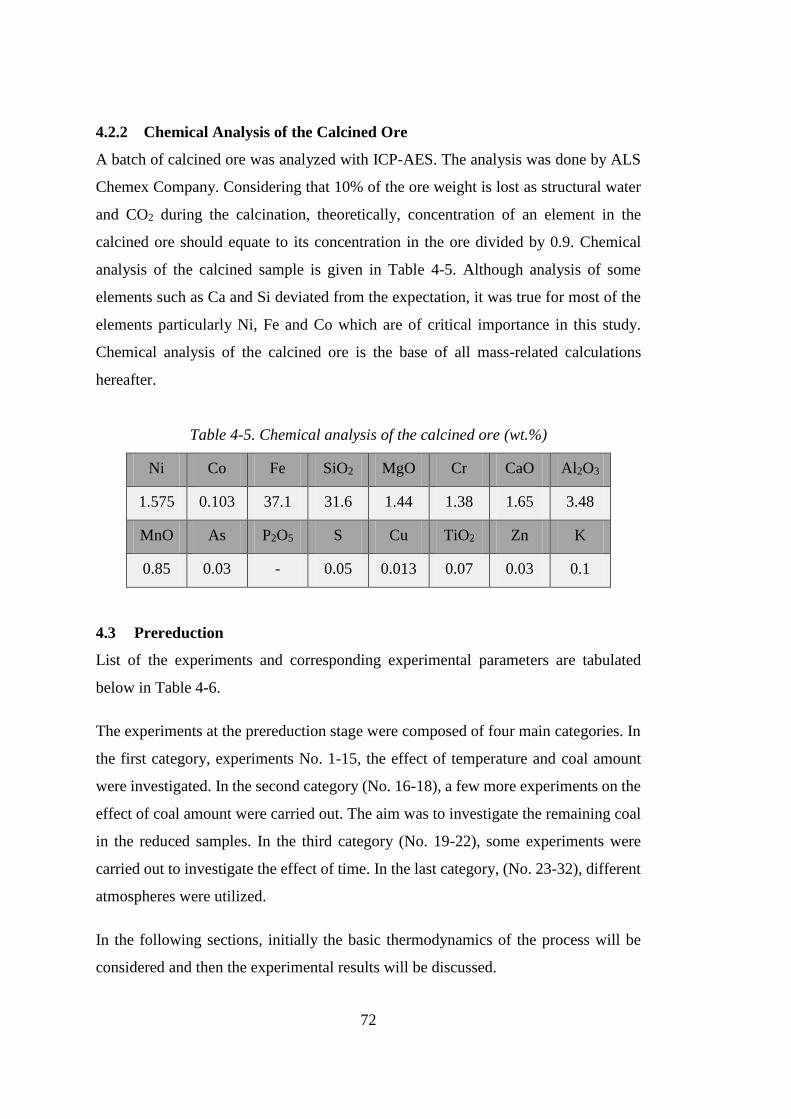
72
4.2.2 Chemical Analysis of the Calcined Ore
A batch of calcined ore was analyzed with ICP-AES. The analysis was done by ALS
Chemex Company. Considering that 10% of the ore weight is lost as structural water
and CO2 during the calcination, theoretically, concentration of an element in the
calcined ore should equate to its concentration in the ore divided by 0.9. Chemical
analysis of the calcined sample is given in Table 4-5. Although analysis of some
elements such as Ca and Si deviated from the expectation, it was true for most of the
elements particularly Ni, Fe and Co which are of critical importance in this study.
Chemical analysis of the calcined ore is the base of all mass-related calculations
hereafter.
Table 4-5. Chemical analysis of the calcined ore (wt.%)
Ni Co Fe SiO2 MgO Cr CaO Al2O3
1.575 0.103 37.1 31.6 1.44 1.38 1.65 3.48
MnO As P2O5 S Cu TiO2 Zn K
0.85 0.03 - 0.05 0.013 0.07 0.03 0.1
4.3 Prereduction
List of the experiments and corresponding experimental parameters are tabulated
below in Table 4-6.
The experiments at the prereduction stage were composed of four main categories. In
the first category, experiments No. 1-15, the effect of temperature and coal amount
were investigated. In the second category (No. 16-18), a few more experiments on the
effect of coal amount were carried out. The aim was to investigate the remaining coal
in the reduced samples. In the third category (No. 19-22), some experiments were
carried out to investigate the effect of time. In the last category, (No. 23-32), different
atmospheres were utilized.
In the following sections, initially the basic thermodynamics of the process will be
considered and then the experimental results will be discussed.
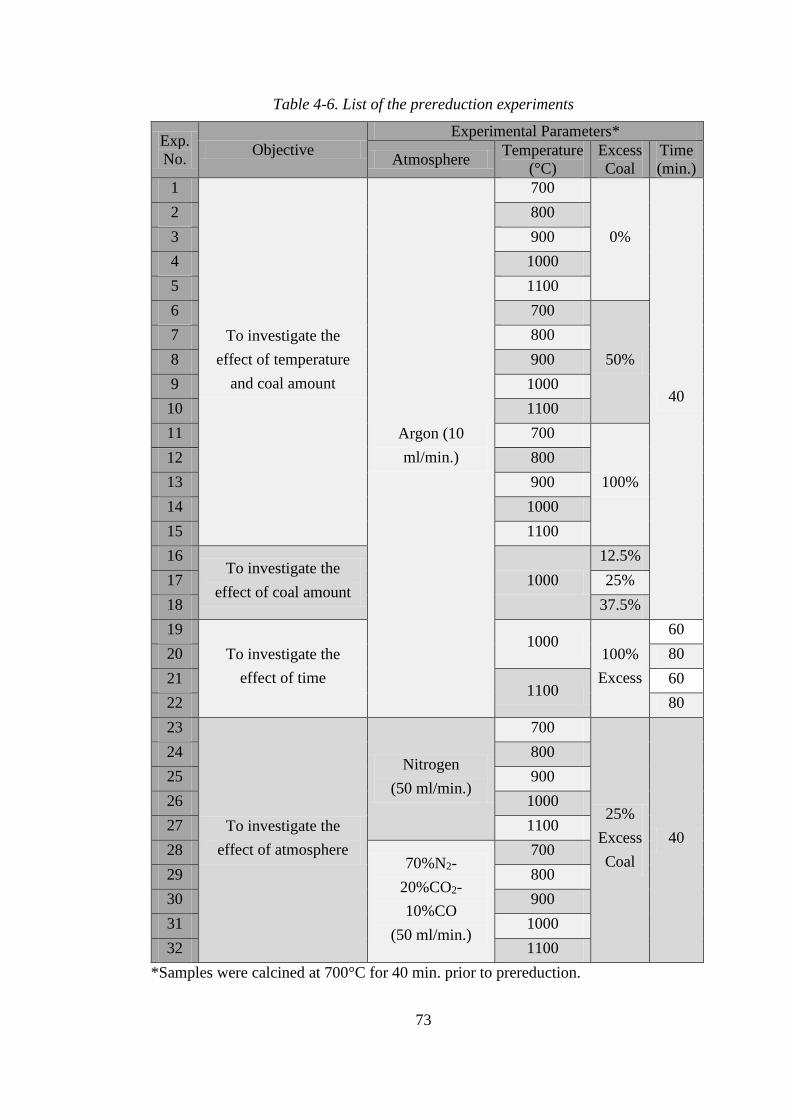
73
Table 4-6. List of the prereduction experiments
Exp.
No. Objective
Experimental Parameters*
Atmosphere Temperature
(°C)
Excess
Coal
Time
(min.)
1
To investigate the
effect of temperature
and coal amount
Argon (10
ml/min.)
700
0%
40
2 800
3 900
4 1000
5 1100
6 700
50%
7 800
8 900
9 1000
10 1100
11 700
100%
12 800
13 900
14 1000
15 1100
16 To investigate the
effect of coal amount 1000
12.5%
17 25%
18 37.5%
19
To investigate the
effect of time
1000 100%
Excess
60
20 80
21 1100
60
22 80
23
To investigate the
effect of atmosphere
Nitrogen
(50 ml/min.)
700
25%
Excess
Coal
40
24 800
25 900
26 1000
27 1100
28 70%N2-
20%CO2-
10%CO
(50 ml/min.)
700
29 800
30 900
31 1000
32 1100
*Samples were calcined at 700°C for 40 min. prior to prereduction.
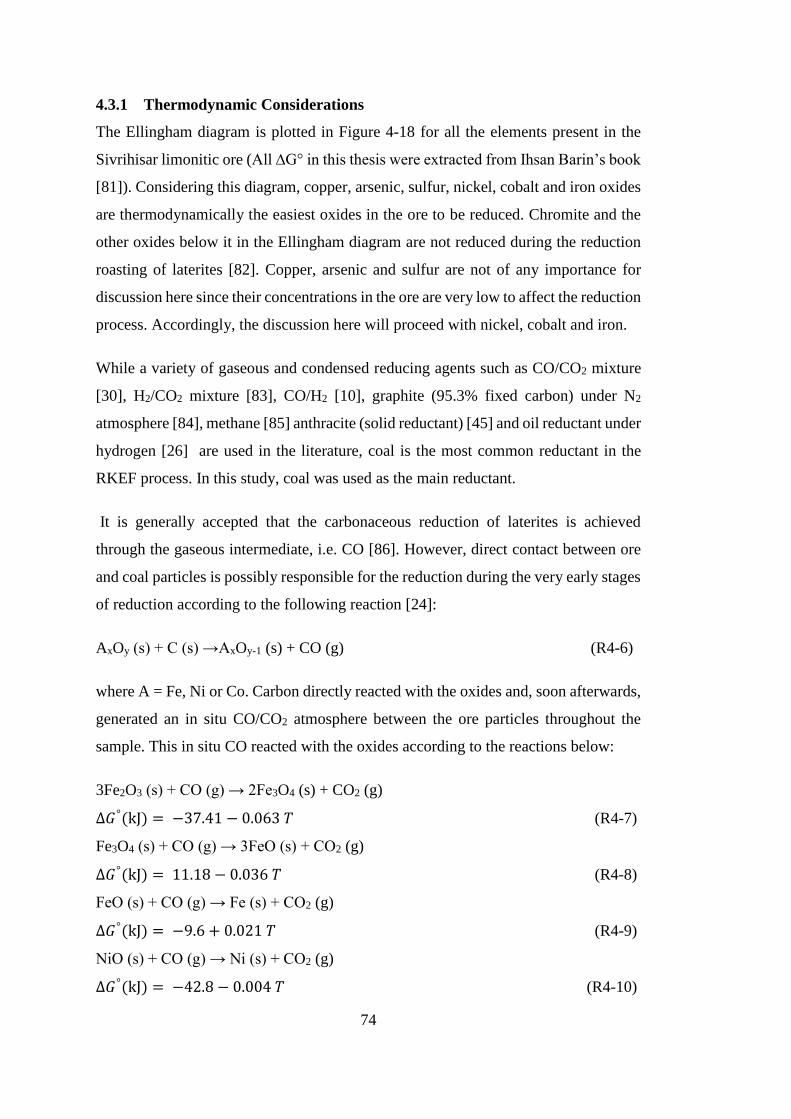
74
4.3.1 Thermodynamic Considerations
The Ellingham diagram is plotted in Figure 4-18 for all the elements present in the
Sivrihisar limonitic ore (All ∆G° in this thesis were extracted from Ihsan Barin’s book
[81]). Considering this diagram, copper, arsenic, sulfur, nickel, cobalt and iron oxides
are thermodynamically the easiest oxides in the ore to be reduced. Chromite and the
other oxides below it in the Ellingham diagram are not reduced during the reduction
roasting of laterites [82]. Copper, arsenic and sulfur are not of any importance for
discussion here since their concentrations in the ore are very low to affect the reduction
process. Accordingly, the discussion here will proceed with nickel, cobalt and iron.
While a variety of gaseous and condensed reducing agents such as CO/CO2 mixture
[30], H2/CO2 mixture [83], CO/H2 [10], graphite (95.3% fixed carbon) under N2
atmosphere [84], methane [85] anthracite (solid reductant) [45] and oil reductant under
hydrogen [26] are used in the literature, coal is the most common reductant in the
RKEF process. In this study, coal was used as the main reductant.
It is generally accepted that the carbonaceous reduction of laterites is achieved
through the gaseous intermediate, i.e. CO [86]. However, direct contact between ore
and coal particles is possibly responsible for the reduction during the very early stages
of reduction according to the following reaction [24]:
AxOy (s) + C (s) →AxOy-1 (s) + CO (g) (R4-6)
where A = Fe, Ni or Co. Carbon directly reacted with the oxides and, soon afterwards,
generated an in situ CO/CO2 atmosphere between the ore particles throughout the
sample. This in situ CO reacted with the oxides according to the reactions below:
3Fe2O3 (s) + CO (g) → 2Fe3O4 (s) + CO2 (g)
∆𝐺°(kJ) = −37.41 − 0.063 𝑇 (R4-7)
Fe3O4 (s) + CO (g) → 3FeO (s) + CO2 (g)
∆𝐺°(kJ) = 11.18 − 0.036 𝑇 (R4-8)
FeO (s) + CO (g) → Fe (s) + CO2 (g)
∆𝐺°(kJ) = −9.6 + 0.021 𝑇 (R4-9)
NiO (s) + CO (g) → Ni (s) + CO2 (g)
∆𝐺°(kJ) = −42.8 − 0.004 𝑇 (R4-10)
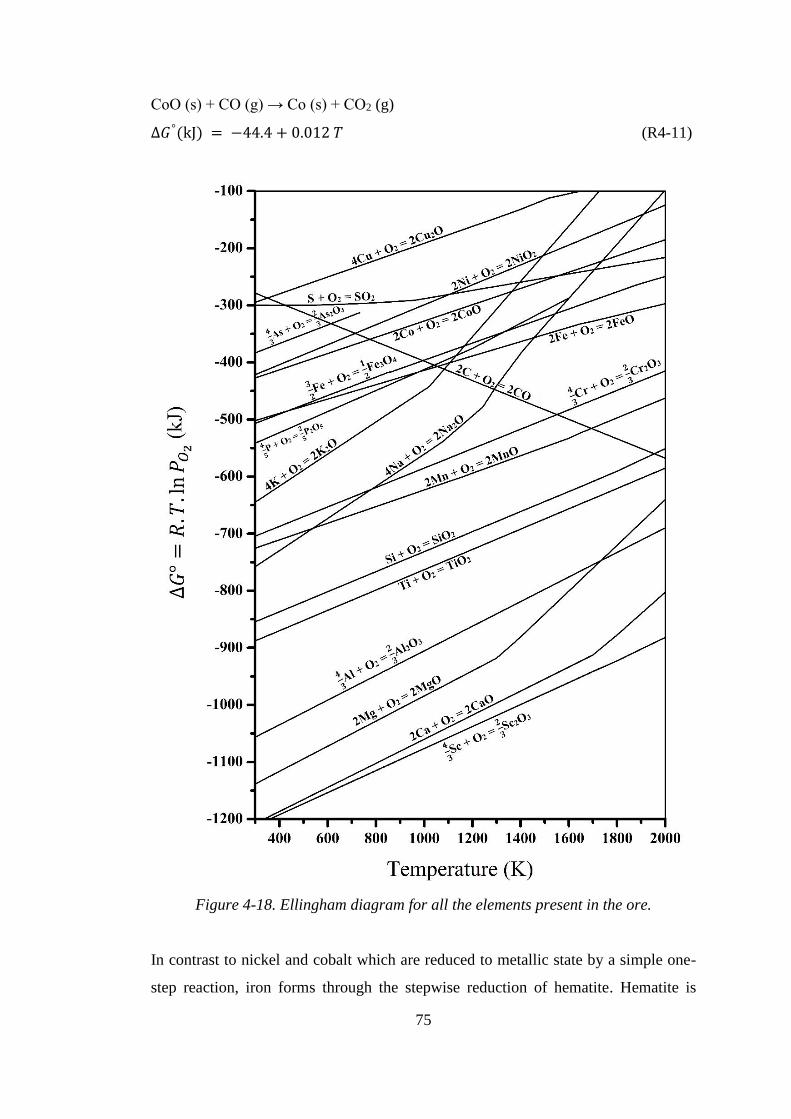
75
CoO (s) + CO (g) → Co (s) + CO2 (g)
∆𝐺°(kJ) = −44.4 + 0.012 𝑇 (R4-11)
Figure 4-18. Ellingham diagram for all the elements present in the ore.
In contrast to nickel and cobalt which are reduced to metallic state by a simple one-
step reaction, iron forms through the stepwise reduction of hematite. Hematite is
76
reduced into magnetite (Fe3O4), which, in turn, is reduced to wustite (FeO). In the
presence of quartz, FeO reacts with it to form fayalite (Fe2SiO4) according to either of
the following reactions:
0.106 Fe (s) + 2Fe0.947O (s) + SiO2 (s) → Fe2SiO4 (s)
∆𝐺°(kJ) = −39 + 0.023 𝑇 (R4-12)
2Fe0.947O (s) + SiO2 (s) + 0.106 CO (g) → 0.947 Fe2SiO4 (s) + 0.106 CO2 (g)
∆𝐺°(𝑘𝐽) = −38.62 + 0.024 𝑇 (R4-13)
Iron can also form by the reduction of fayalite at higher temperatures:
Fe2SiO4 (s) + 2 CO (g) → 2 Fe (s) + SiO2 (s) + 2 CO2 (g)
∆𝐺°(𝑘𝐽) = 4.15 + 0.006 𝑇 + 1𝐸 − 6 𝑇2 (R4-14)
CO2 from the above reactions reacts with C to generate CO via the Boudouard
reaction:
CO2 (g) + C (s) → 2CO (g) ∆𝐺°(𝑘𝐽) = 165.8 − 0.168 𝑇 (R4-15)
This reaction plays a predominant role in the carbothermic reduction of iron oxides
and has been studied extensively [87, 88]. It was found that the rates and activation
energies of the carbothermic reduction of iron oxides were very close to the oxidation
of carbon and, accordingly, the Boudouard reaction was the probable rate controlling
reaction. This can also be valid for limonitic laterites as there are some direct analogies
between these ores and iron ores.
The equilibrium 𝑃𝐶𝑂 𝑃𝐶𝑂2⁄ for these reactions against temperature is plotted in Fig. 4-
19 using the given Standard Gibbs Free Energies. According to these curves,
infinitesimal reduction potential is required for hematite to transform into magnetite.
That is, thermodynamically there is almost no obstacle for this reaction during the
reduction, and it occurs as soon as the activation energy is provided. Although
thermodynamically a similar situation is valid for fayalite formation, it does not form
until the magnetite is reduced to wustite because fayalite formation requires the
coexistence of wustite and silicon dioxide. The other reactions are reduction of NiO,
CoO, Fe3O4, FeO and Fe2SiO4 in order. However, this was not exactly replicated

77
during the reduction because these oxides do not exist in the ore in their free and pure
forms. Nickel and cobalt are incorporated in the matrix of other minerals, particularly
hematite and clays. This situation strongly affects the metallization of Ni and Co.
Constant changes in physical and chemical properties of the reactants and products
during the reduction add more complexity to the issue. In any case, Fig. 4-19 allows
rewarding predictions on the reducibility of these ores and explains the phase
transformations and other phenomena during the reduction process.
Figure 4-19. 𝐿𝑛 (𝑃𝐶𝑂 𝑃𝐶𝑂2⁄ ) vs. temperature for the main reactions taking place
during the reduction.
78
4.3.2 Study of Phase Transformations during Reduction
Calcined ore was mixed with 5.74 wt.% coal (stoichiometric coal amount) and heated
to a specific temperature between 700-1100°C. The samples were kept for 40 min. at
this temperature. During the experiments, argon gas at 10 ml/min. was sent into the
system. Mineralogical changes and formations of new phases during the reduction
process were investigated by XRD. The XRD patterns of these samples are shown in
Fig. 4-20. It can be seen that the sample treated at 700°C was composed of quartz,
magnetite and hematite. Although the reduction of hematite to magnetite is
thermodynamically possible at this temperature, its rate, controlled by the diffusion of
CO inside the particles, was slow, and part of the hematite still remained unchanged
after 40 min. The remainder of hematite was reduced to magnetite at 800°C where a
new phase, fayalite, came to existence. Similar to the reduction of hematite (see Fig.
4-19), the formation of fayalite is thermodynamically easy and forms when either
wustite or iron appears (R4-12 and R4-13 mentioned before). In addition, a nickel
rich alloy (FeNi3) with the corresponding peak at 2θ = 44.35 (d = 2.04 Å) formed
which is designated by the number 5 on the figure (FeNi3 formation was also reported
by other researchers [39]). This peak shifted to 2θ = 43.90 (d = 2.06 Å) at 900°C. It
was attributed to the additionally reduced iron which incorporated into the structure of
FeNi3. Iron increased the lattice parameter of FeNi3 and the corresponding peak shifted
to a lower 2θ of 43.90 (higher d value of 2.06 Å). Although increasing the temperature
from 800 to 900°C had increased the fayalite content, magnetite was still the major
phase. During the reduction, magnetite was expected to be reduced to wustite,
however, there was no sign of wustite even at 900°C. This was indicative of the fact
that wustite instantaneously combined with quartz to give rise to fayalite.
At 1000°C, the reduced sample was mainly composed of fayalite and quartz.
Magnetite and wustite were also present in minor quantities. Appearance of the
characteristic peak of wustite (designated by the number 8 on the patterns) indicated
that the wustite formation was accelerated at this temperature range and the rate of
fayalite formation was not high enough to consume all of the wustite. In addition, the
characteristic peak of FeNi3 intensified at 1000°C and shifted to the higher d values
(peak number 6) indicating development of a new phase (taenite). At the same time, a
weak peak of iron at 2θ = 44.58 (d = 2.03 Å) came to existence (peak number 7). Iron,

79
which was reduced to a larger extent at this temperature, alloyed with nickel to form
α-Fe, and taenite.
As heating continued to 1100°C, magnetite no longer pertained. Fayalite and quartz
were the main phases present and there was some wustite. Above 1000°C, an
appreciable part of the quartz was altered to cristobalite, a high-temperature
polymorph of silica, which persisted during cooling and was identified by a relatively
intense peak designated by the number 9. In addition, an increase in the iron peak
intensity was accompanied by a decrease in the intensity of fayalite and wustite peaks
(relative to the first peak of quartz as the reference). This was expected since iron
forms by decomposition of wustite and fayalite according to the reactions R4-9 and
R4-14 as mentioned before.
Figure 4-20. Room temperature XRD patterns of the ore samples reduced at
different temperatures for 40 min.
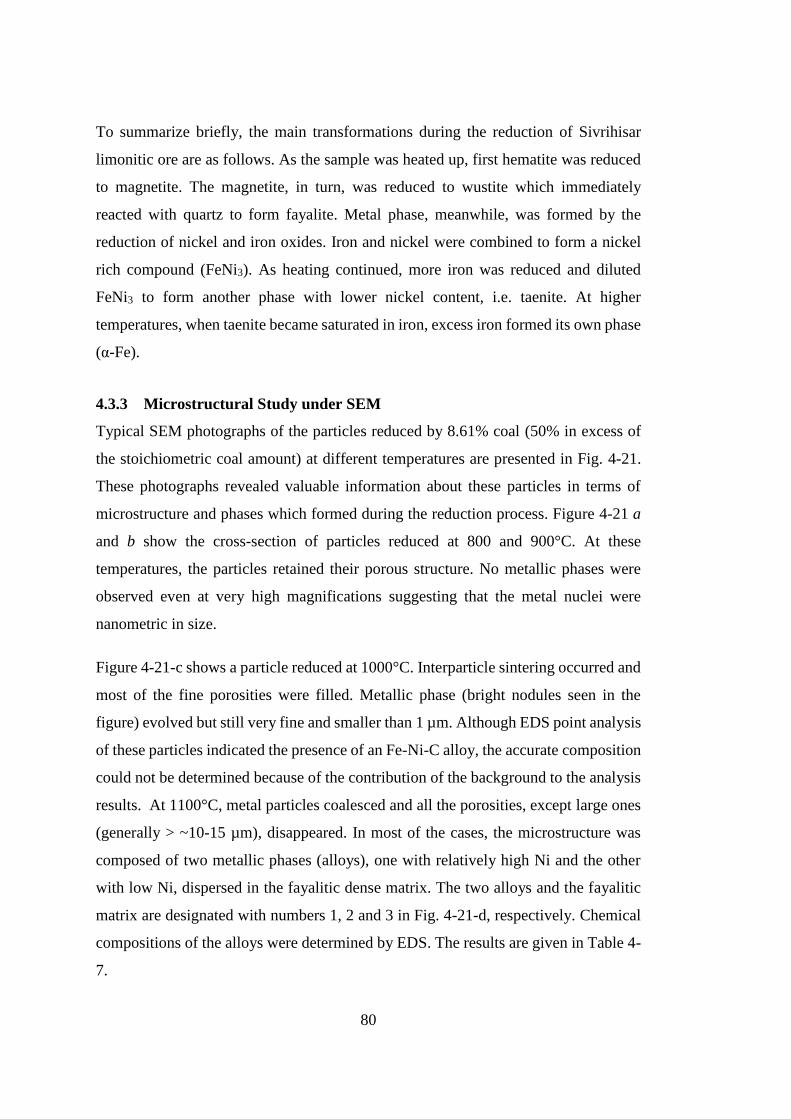
80
To summarize briefly, the main transformations during the reduction of Sivrihisar
limonitic ore are as follows. As the sample was heated up, first hematite was reduced
to magnetite. The magnetite, in turn, was reduced to wustite which immediately
reacted with quartz to form fayalite. Metal phase, meanwhile, was formed by the
reduction of nickel and iron oxides. Iron and nickel were combined to form a nickel
rich compound (FeNi3). As heating continued, more iron was reduced and diluted
FeNi3 to form another phase with lower nickel content, i.e. taenite. At higher
temperatures, when taenite became saturated in iron, excess iron formed its own phase
(α-Fe).
4.3.3 Microstructural Study under SEM
Typical SEM photographs of the particles reduced by 8.61% coal (50% in excess of
the stoichiometric coal amount) at different temperatures are presented in Fig. 4-21.
These photographs revealed valuable information about these particles in terms of
microstructure and phases which formed during the reduction process. Figure 4-21 a
and b show the cross-section of particles reduced at 800 and 900°C. At these
temperatures, the particles retained their porous structure. No metallic phases were
observed even at very high magnifications suggesting that the metal nuclei were
nanometric in size.
Figure 4-21-c shows a particle reduced at 1000°C. Interparticle sintering occurred and
most of the fine porosities were filled. Metallic phase (bright nodules seen in the
figure) evolved but still very fine and smaller than 1 µm. Although EDS point analysis
of these particles indicated the presence of an Fe-Ni-C alloy, the accurate composition
could not be determined because of the contribution of the background to the analysis
results. At 1100°C, metal particles coalesced and all the porosities, except large ones
(generally > ~10-15 µm), disappeared. In most of the cases, the microstructure was
composed of two metallic phases (alloys), one with relatively high Ni and the other
with low Ni, dispersed in the fayalitic dense matrix. The two alloys and the fayalitic
matrix are designated with numbers 1, 2 and 3 in Fig. 4-21-d, respectively. Chemical
compositions of the alloys were determined by EDS. The results are given in Table 4-
7.
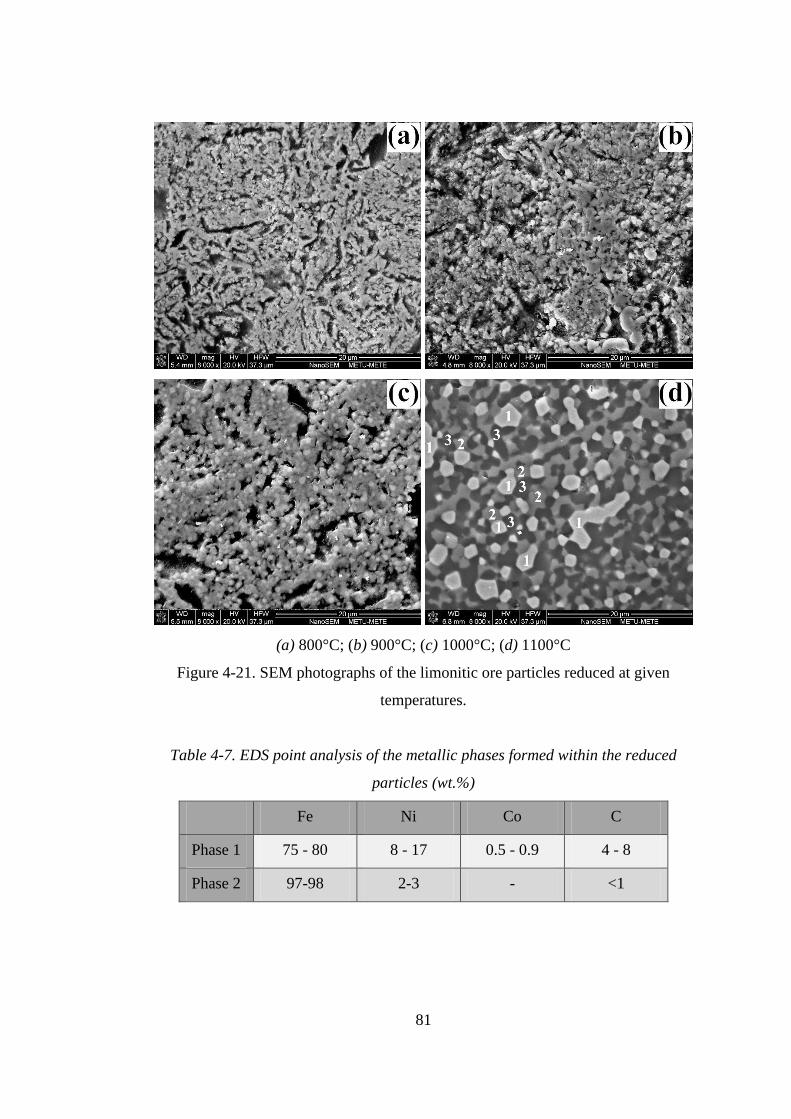
81
(a) 800°C; (b) 900°C; (c) 1000°C; (d) 1100°C
Figure 4-21. SEM photographs of the limonitic ore particles reduced at given
temperatures.
Table 4-7. EDS point analysis of the metallic phases formed within the reduced
particles (wt.%)
Fe Ni Co C
Phase 1 75 - 80 8 - 17 0.5 - 0.9 4 - 8
Phase 2 97-98 2-3 - <1

82
4.3.4 Effect of Reduction Temperature
4.3.4.1 Effect of Temperature on the Gasification of Carbon
Carbothermic reduction of laterites closely relates to the Boudouard reaction since the
required reducing atmosphere is provided via this reaction. The equilibrium constant
of this reaction is drawn against temperature in Fig. 4-22. This figure also includes
the equilibrium constant of the involving reduction reactions for comparison.
Figure 4-22. Variation of the equilibrium constant for the given reactions.
Equilibrium constant for the Boudouard reaction can be written as below:
𝐾 =𝑃𝐶𝑂
2
𝑃𝐶𝑂2×𝑎𝐶 (E4-2)
Where: 𝑃𝐶𝑂, 𝑃𝐶𝑂2 and 𝑎𝐶 are partial pressure of CO, partial pressure of CO2 and
activity of carbon, respectively. Assuming that the activity of the carbon in the coal

83
does not change during the reduction process, the dramatic increase of the equilibrium
constant above 1000°C should accompany with the corresponding decrease in 𝑃𝐶𝑂2
and increase in 𝑃𝐶𝑂. This means that the reaction shifts to the right hand side and 𝑃𝐶𝑂
exponentially increases. This was checked by the analysis of the remaining carbon in
the samples reduced at different temperatures. 50% excess coal was used in these
experiments. As shown in Fig. 4-23, the remaining carbon decreased sharply when the
temperature rose above 1000°C.
Figure 4-23. Remaining carbon in the samples reduced at various temperatures.
4.3.4.2 Effect of Temperature on Degree of Metallization
The degree of metallization of nickel and cobalt, as the value elements, is of prime
importance because it affects their recovery in subsequent smelting process. The
degree of metallization of an element is defined as the ratio of the amount of that
element in the metallic state to the total amount of that element in the reduced sample.
Figure 4-24 shows the relationship between the metallization and temperature for iron,
nickel and cobalt. Before 900°C, the metallization of iron was negligible. However, it
increased appreciably at 1000°C and rapidly reached higher values, e.g. ~55% for
100% excess coal addition, when heating continued up to 1100°C. As mentioned
before, the carbothermic reduction of hematite to iron occurs through a multi-step
84
process. It is first reduced to magnetite which in turn is reduced to wustite. Iron is then
produced by the reduction of wustite (and fayalite) at higher temperatures. According
to the XRD results (see Fig. 4-20), up to 900°C, only a limited amount of metallic iron
existed as FeNi3 with the remaining being present in the oxide state within magnetite
and fayalite. Therefore, a considerable metallization of iron was deferred until a
substantial portion of the magnetite was transformed into wustite at 1000°C.
Gasification of carbon via the Boudouard reaction encouraged largely iron reduction
above 1000°C and the degree of metallization increased significantly.
Nickel and cobalt followed an analogous trend. Their respective metallization
percentages constantly increased but at different rates at different intervals.
Metallization rate was high at first for both elements but decreased above 800°C and
again increased at about 1000°C for nickel and about 900°C for cobalt. This behavior
may be explained by considering the equilibrium constant of reduction of their oxides
by CO which are drawn in Fig. 4-22. The equilibrium constant for these reactions can
be written as:
𝐾 =𝑃𝐶𝑂2
𝑃𝐶𝑂×
𝑎𝑚𝑒𝑡𝑎𝑙
𝑎𝑜𝑥𝑖𝑑𝑒 (E4-3)
where 𝑎𝑚𝑒𝑡𝑎𝑙 and 𝑎𝑜𝑥𝑖𝑑𝑒 are activity of the component in the product metal and activity
of the oxide of the component in the structure of other compounds, respectively.
Reducing atmosphere around the ore particles is mainly controlled by the Boudouard
reaction and it is reasonable to assume that 𝑃𝐶𝑂2𝑃𝐶𝑂⁄ is imposed by this reaction.
According to Fig. 4-22, this ratio does not change considerably below 900°C (for the
Boudouard reaction) while K for the reduction of nickel and cobalt are declining
sharply, especially for nickel. Inevitably, the second fraction, 𝑎𝑚𝑒𝑡𝑎𝑙 𝑎𝑜𝑥𝑖𝑑𝑒⁄ , should
be decreased. As a result, there is a great tendency to decrease the activity of the metal
and increase the activity of the oxide as temperature rises. It seems that these oxides
resisted reduction and caused a decrease in the rate of the metallization until 𝑃𝐶𝑂
largely increased at higher temperatures. This effect is more pronounced for nickel
and happens over a wider range than for cobalt. This also is consistent with the
variations in the equilibrium constants for these reactions as the equilibrium constant
for nickel reduction declines steeply and over a wider range.
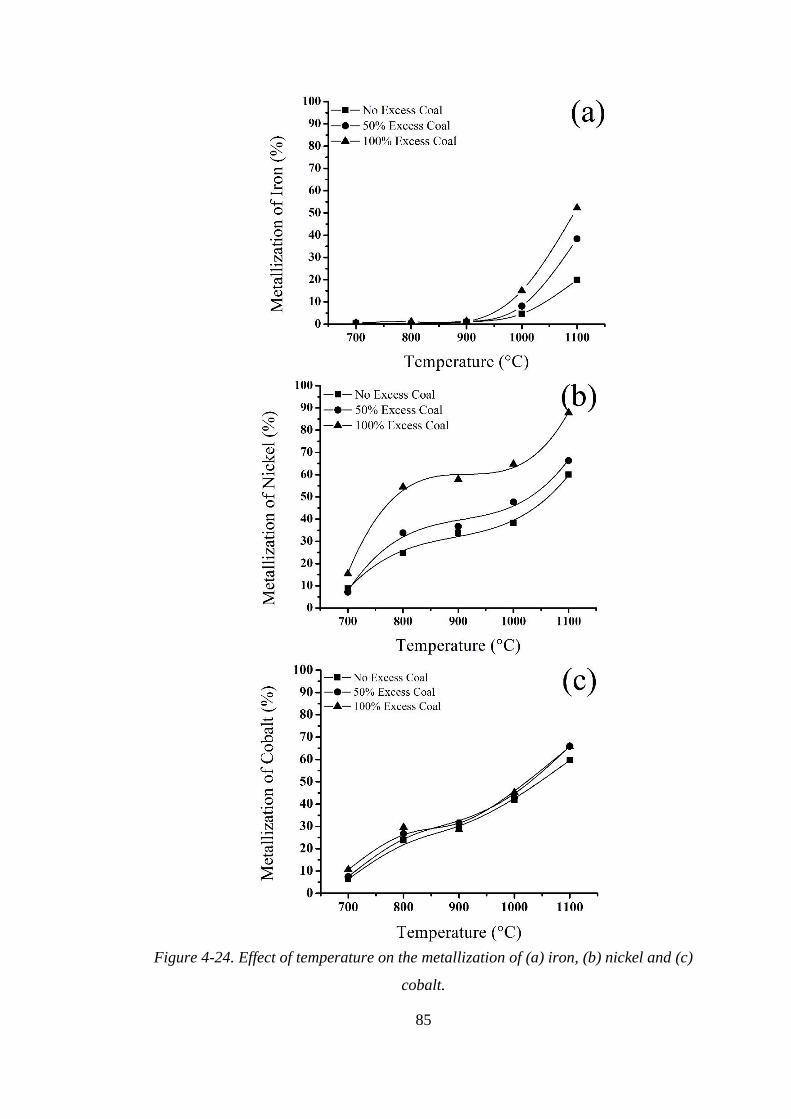
85
Figure 4-24. Effect of temperature on the metallization of (a) iron, (b) nickel and (c)
cobalt.
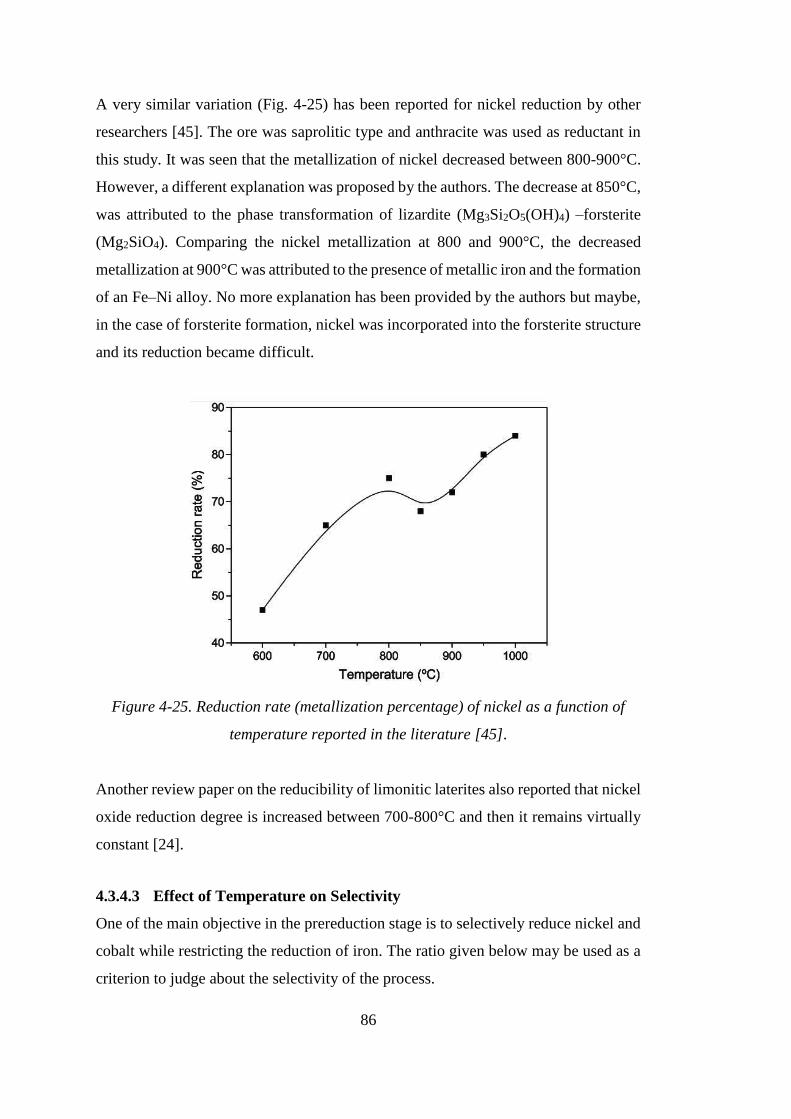
86
A very similar variation (Fig. 4-25) has been reported for nickel reduction by other
researchers [45]. The ore was saprolitic type and anthracite was used as reductant in
this study. It was seen that the metallization of nickel decreased between 800-900°C.
However, a different explanation was proposed by the authors. The decrease at 850°C,
was attributed to the phase transformation of lizardite (Mg3Si2O5(OH)4) –forsterite
(Mg2SiO4). Comparing the nickel metallization at 800 and 900°C, the decreased
metallization at 900°C was attributed to the presence of metallic iron and the formation
of an Fe–Ni alloy. No more explanation has been provided by the authors but maybe,
in the case of forsterite formation, nickel was incorporated into the forsterite structure
and its reduction became difficult.
Figure 4-25. Reduction rate (metallization percentage) of nickel as a function of
temperature reported in the literature [45].
Another review paper on the reducibility of limonitic laterites also reported that nickel
oxide reduction degree is increased between 700-800°C and then it remains virtually
constant [24].
4.3.4.3 Effect of Temperature on Selectivity
One of the main objective in the prereduction stage is to selectively reduce nickel and
cobalt while restricting the reduction of iron. The ratio given below may be used as a
criterion to judge about the selectivity of the process.
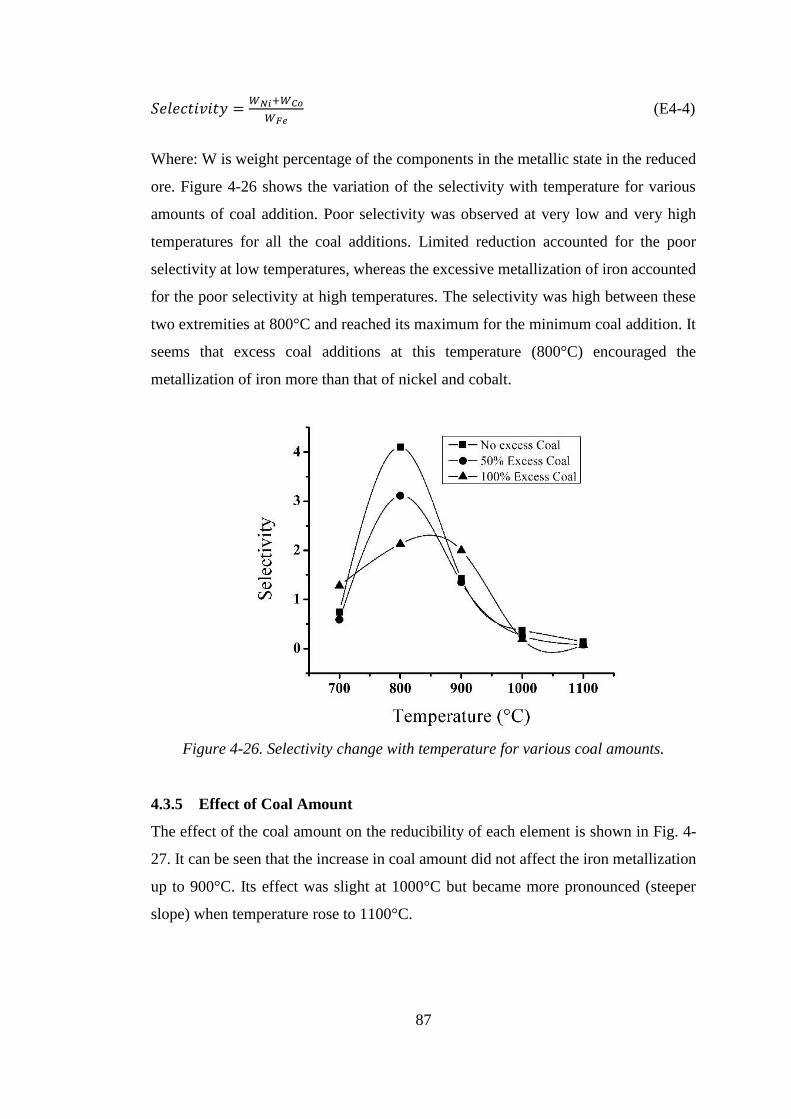
87
𝑆𝑒𝑙𝑒𝑐𝑡𝑖𝑣𝑖𝑡𝑦 =𝑊𝑁𝑖+𝑊𝐶𝑜
𝑊𝐹𝑒 (E4-4)
Where: W is weight percentage of the components in the metallic state in the reduced
ore. Figure 4-26 shows the variation of the selectivity with temperature for various
amounts of coal addition. Poor selectivity was observed at very low and very high
temperatures for all the coal additions. Limited reduction accounted for the poor
selectivity at low temperatures, whereas the excessive metallization of iron accounted
for the poor selectivity at high temperatures. The selectivity was high between these
two extremities at 800°C and reached its maximum for the minimum coal addition. It
seems that excess coal additions at this temperature (800°C) encouraged the
metallization of iron more than that of nickel and cobalt.
Figure 4-26. Selectivity change with temperature for various coal amounts.
4.3.5 Effect of Coal Amount
The effect of the coal amount on the reducibility of each element is shown in Fig. 4-
27. It can be seen that the increase in coal amount did not affect the iron metallization
up to 900°C. Its effect was slight at 1000°C but became more pronounced (steeper
slope) when temperature rose to 1100°C.

88
Figure 4-27. Effect of coal amount on metallization of (a) iron, (b) nickel and (c)
cobalt.
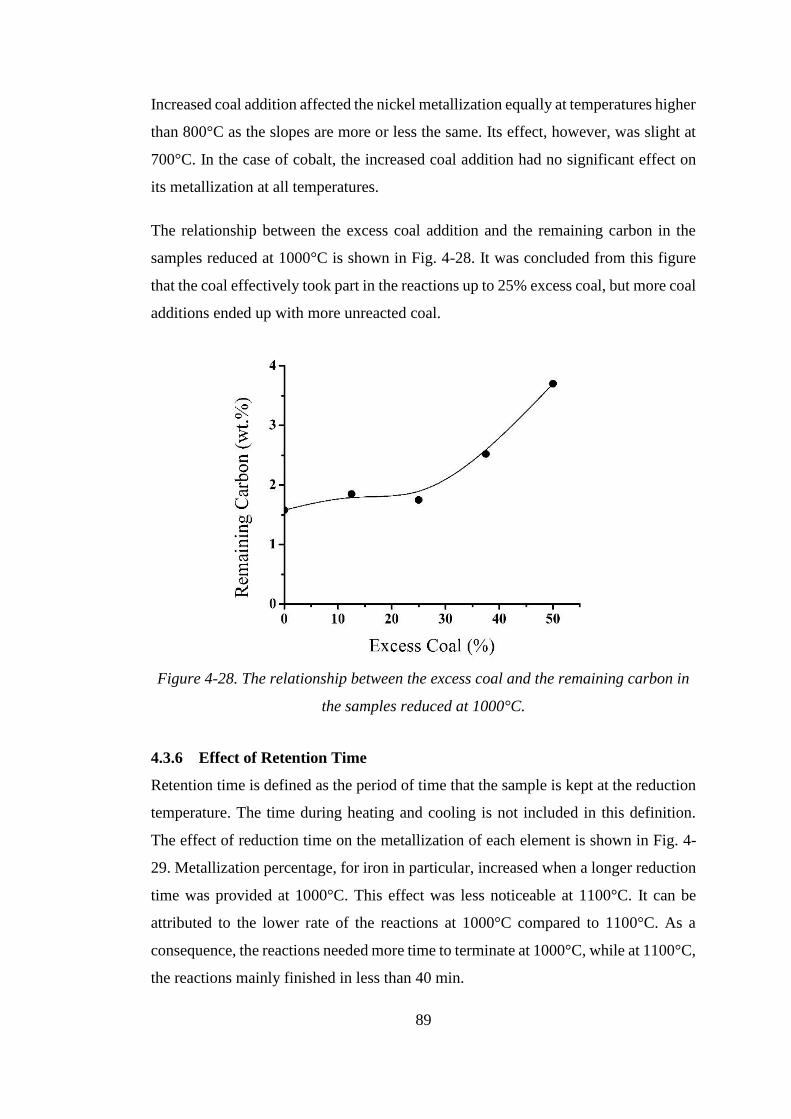
89
Increased coal addition affected the nickel metallization equally at temperatures higher
than 800°C as the slopes are more or less the same. Its effect, however, was slight at
700°C. In the case of cobalt, the increased coal addition had no significant effect on
its metallization at all temperatures.
The relationship between the excess coal addition and the remaining carbon in the
samples reduced at 1000°C is shown in Fig. 4-28. It was concluded from this figure
that the coal effectively took part in the reactions up to 25% excess coal, but more coal
additions ended up with more unreacted coal.
Figure 4-28. The relationship between the excess coal and the remaining carbon in
the samples reduced at 1000°C.
4.3.6 Effect of Retention Time
Retention time is defined as the period of time that the sample is kept at the reduction
temperature. The time during heating and cooling is not included in this definition.
The effect of reduction time on the metallization of each element is shown in Fig. 4-
29. Metallization percentage, for iron in particular, increased when a longer reduction
time was provided at 1000°C. This effect was less noticeable at 1100°C. It can be
attributed to the lower rate of the reactions at 1000°C compared to 1100°C. As a
consequence, the reactions needed more time to terminate at 1000°C, while at 1100°C,
the reactions mainly finished in less than 40 min.
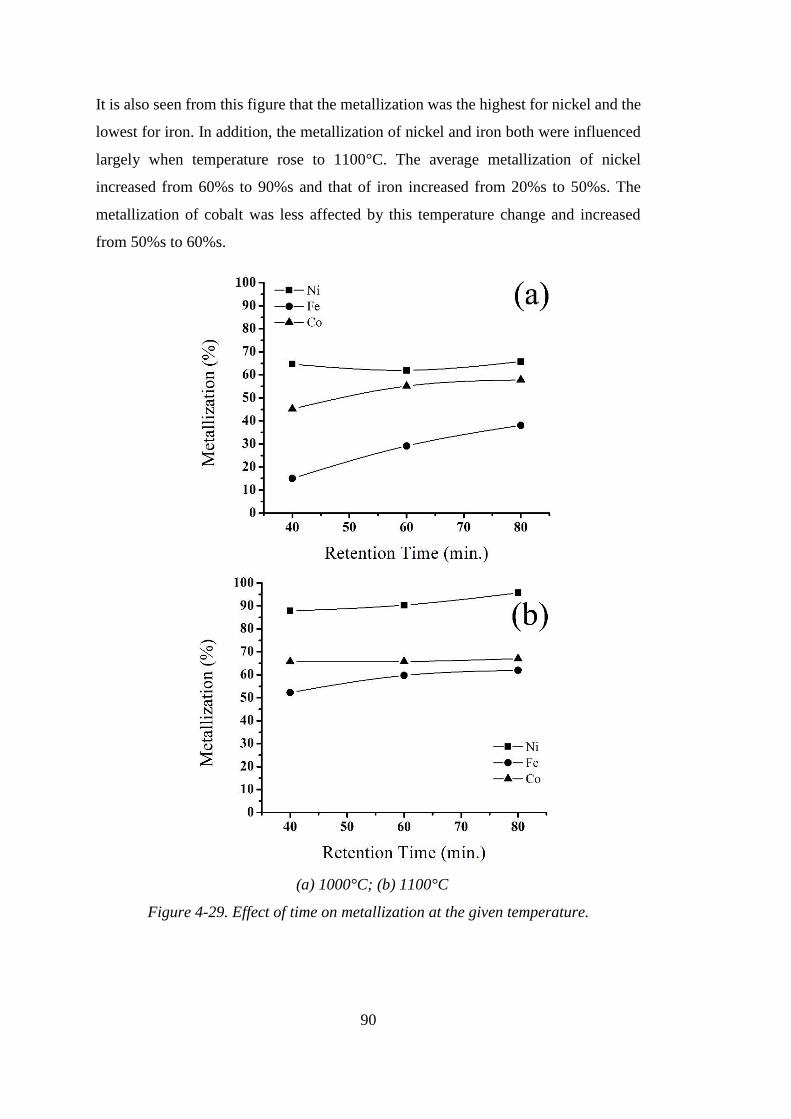
90
It is also seen from this figure that the metallization was the highest for nickel and the
lowest for iron. In addition, the metallization of nickel and iron both were influenced
largely when temperature rose to 1100°C. The average metallization of nickel
increased from 60%s to 90%s and that of iron increased from 20%s to 50%s. The
metallization of cobalt was less affected by this temperature change and increased
from 50%s to 60%s.
(a) 1000°C; (b) 1100°C
Figure 4-29. Effect of time on metallization at the given temperature.
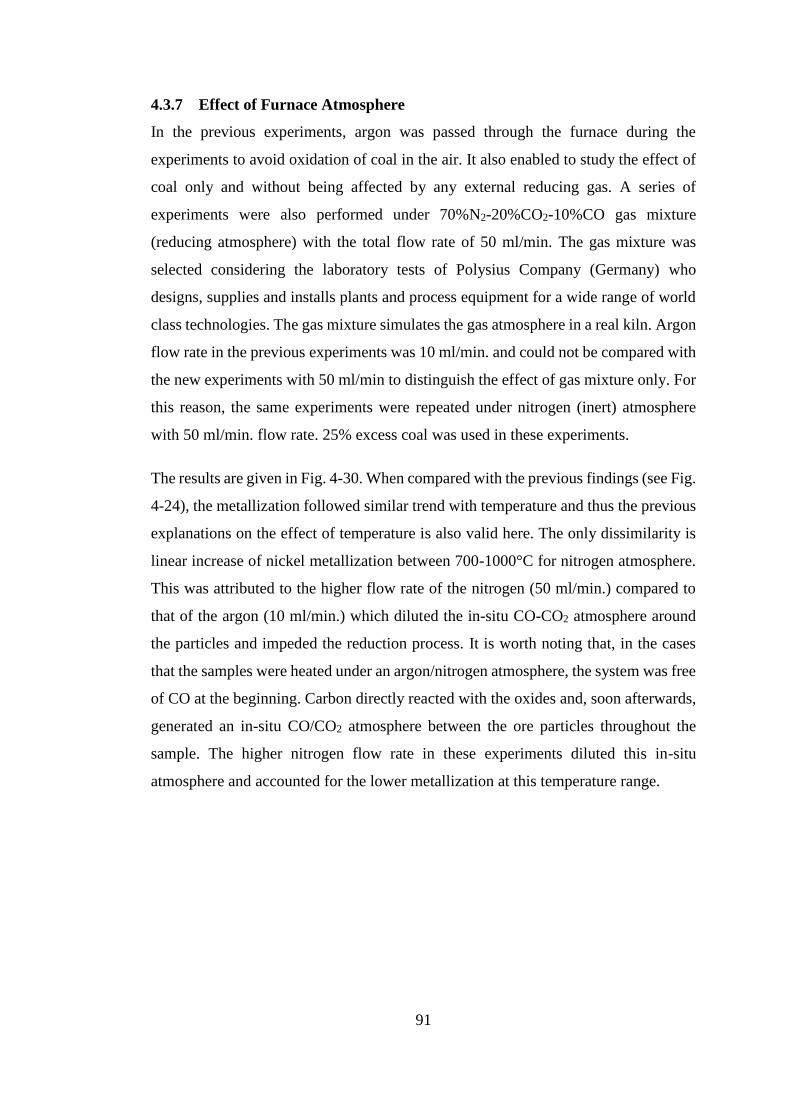
91
4.3.7 Effect of Furnace Atmosphere
In the previous experiments, argon was passed through the furnace during the
experiments to avoid oxidation of coal in the air. It also enabled to study the effect of
coal only and without being affected by any external reducing gas. A series of
experiments were also performed under 70%N2-20%CO2-10%CO gas mixture
(reducing atmosphere) with the total flow rate of 50 ml/min. The gas mixture was
selected considering the laboratory tests of Polysius Company (Germany) who
designs, supplies and installs plants and process equipment for a wide range of world
class technologies. The gas mixture simulates the gas atmosphere in a real kiln. Argon
flow rate in the previous experiments was 10 ml/min. and could not be compared with
the new experiments with 50 ml/min to distinguish the effect of gas mixture only. For
this reason, the same experiments were repeated under nitrogen (inert) atmosphere
with 50 ml/min. flow rate. 25% excess coal was used in these experiments.
The results are given in Fig. 4-30. When compared with the previous findings (see Fig.
4-24), the metallization followed similar trend with temperature and thus the previous
explanations on the effect of temperature is also valid here. The only dissimilarity is
linear increase of nickel metallization between 700-1000°C for nitrogen atmosphere.
This was attributed to the higher flow rate of the nitrogen (50 ml/min.) compared to
that of the argon (10 ml/min.) which diluted the in-situ CO-CO2 atmosphere around
the particles and impeded the reduction process. It is worth noting that, in the cases
that the samples were heated under an argon/nitrogen atmosphere, the system was free
of CO at the beginning. Carbon directly reacted with the oxides and, soon afterwards,
generated an in-situ CO/CO2 atmosphere between the ore particles throughout the
sample. The higher nitrogen flow rate in these experiments diluted this in-situ
atmosphere and accounted for the lower metallization at this temperature range.

92
Figure 4-30. Metallization change with temperature under the given atmospheres for
(a) iron, (b) nickel and (c) cobalt.
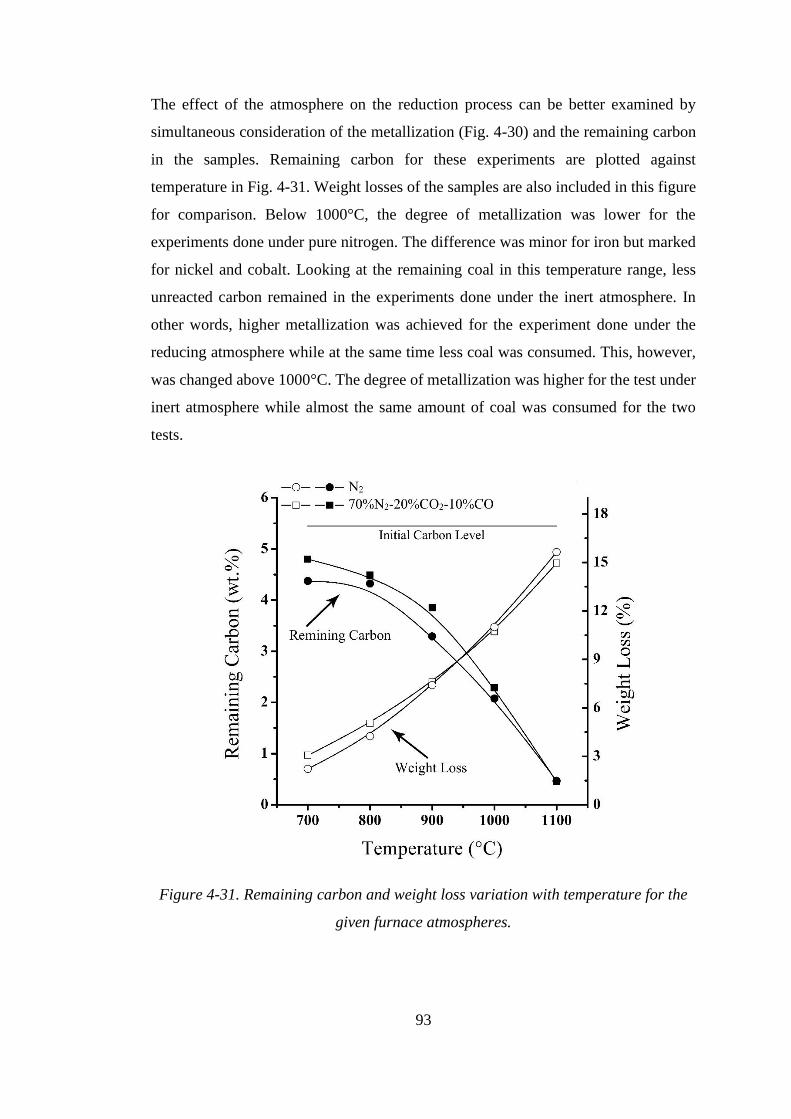
93
The effect of the atmosphere on the reduction process can be better examined by
simultaneous consideration of the metallization (Fig. 4-30) and the remaining carbon
in the samples. Remaining carbon for these experiments are plotted against
temperature in Fig. 4-31. Weight losses of the samples are also included in this figure
for comparison. Below 1000°C, the degree of metallization was lower for the
experiments done under pure nitrogen. The difference was minor for iron but marked
for nickel and cobalt. Looking at the remaining coal in this temperature range, less
unreacted carbon remained in the experiments done under the inert atmosphere. In
other words, higher metallization was achieved for the experiment done under the
reducing atmosphere while at the same time less coal was consumed. This, however,
was changed above 1000°C. The degree of metallization was higher for the test under
inert atmosphere while almost the same amount of coal was consumed for the two
tests.
Figure 4-31. Remaining carbon and weight loss variation with temperature for the
given furnace atmospheres.
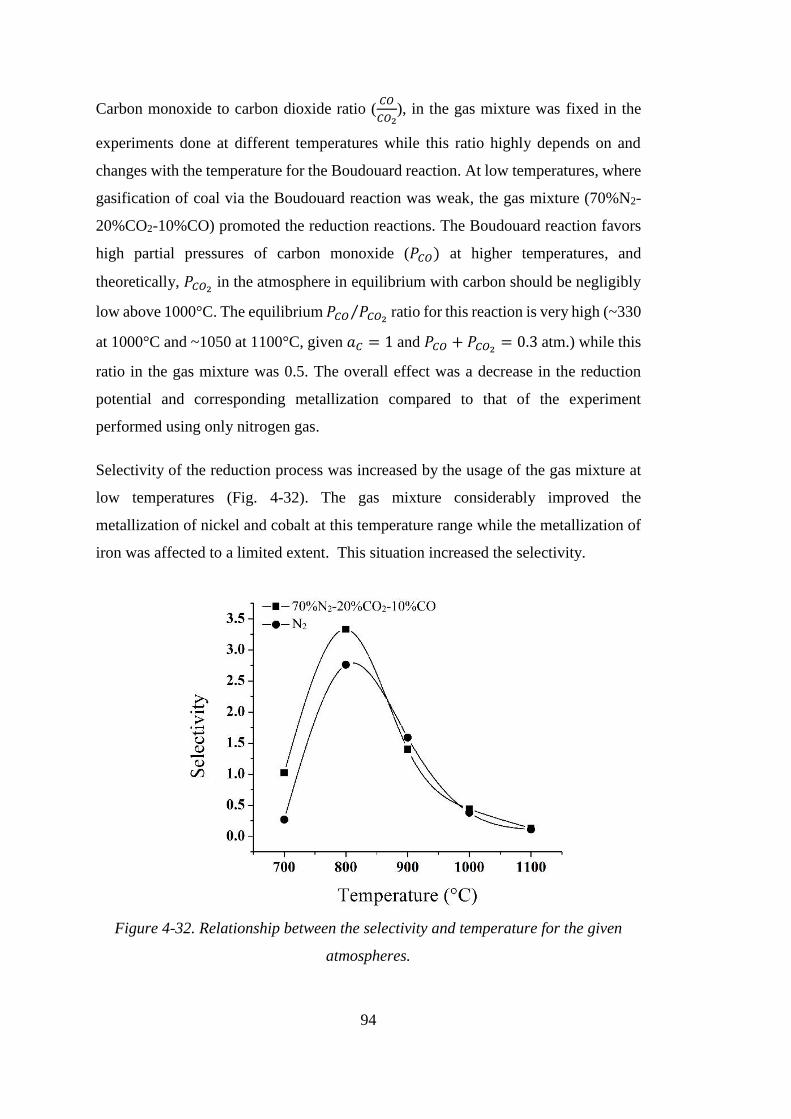
94
Carbon monoxide to carbon dioxide ratio (𝐶𝑂
𝐶𝑂2), in the gas mixture was fixed in the
experiments done at different temperatures while this ratio highly depends on and
changes with the temperature for the Boudouard reaction. At low temperatures, where
gasification of coal via the Boudouard reaction was weak, the gas mixture (70%N2-
20%CO2-10%CO) promoted the reduction reactions. The Boudouard reaction favors
high partial pressures of carbon monoxide (𝑃𝐶𝑂) at higher temperatures, and
theoretically, 𝑃𝐶𝑂2 in the atmosphere in equilibrium with carbon should be negligibly
low above 1000°C. The equilibrium 𝑃𝐶𝑂 𝑃𝐶𝑂2⁄ ratio for this reaction is very high (~330
at 1000°C and ~1050 at 1100°C, given 𝑎𝐶 = 1 and 𝑃𝐶𝑂 + 𝑃𝐶𝑂2= 0.3 atm.) while this
ratio in the gas mixture was 0.5. The overall effect was a decrease in the reduction
potential and corresponding metallization compared to that of the experiment
performed using only nitrogen gas.
Selectivity of the reduction process was increased by the usage of the gas mixture at
low temperatures (Fig. 4-32). The gas mixture considerably improved the
metallization of nickel and cobalt at this temperature range while the metallization of
iron was affected to a limited extent. This situation increased the selectivity.
Figure 4-32. Relationship between the selectivity and temperature for the given
atmospheres.

95
4.3.8 Choice of the Optimum Prereduction Conditions
The determination of the optimum conditions in the prereduction stage depends highly
upon the subsequent processing method. Reducibility of the laterites has been widely
studied in the literature but most of these studies has focused on the effect of reduction
on the leaching behavior of the ore via either acid leaching [9, 31] or Caron process
[30, 39, 89], as well as on the effect of reduction conditions on the beneficiation by
magnetic separation [90, 91].
In the hydrometallurgical processing of the laterites, conditions are optimized in a way
that it minimizes formation of magnesium silicates for saprolitic ores and minimizes
iron reduction for limonitic ores. In the first case (formation of magnesium silicates)
extraction of the nickel from the silicate structure becomes challenging. In the second
case (high iron reduction), iron precipitates as iron hydroxide which lowers nickel
recovery (a part of the nickel co-precipitates). In addition, iron alloys with nickel
which may exhibit a stronger resistance to chemical dissolution, resulting in decreased
nickel recoveries when nickel is incorporated into an alloy phase [39]. Consequently,
silicate formation and iron reduction are the two important factors which are
considered in the optimization of reduction process prior to hydrometallurgical
processes. Commonly, the reduction temperature does not exceed 800°C in these
processes.
In the cases, which use a magnetic field to extract nickel from the reduced ore, the
maximum nickel reduction is important. Reduction of iron does not create any problem
because the product is ferronickel. Generally a product with 5-6 wt.% nickel is
obtained while more than 90% of nickel is recovered. In these processes, higher
temperatures (up to 1100°C) are commonly selected.
When pyrometallurgical treatment of the laterites are considered, it has been stated
that a selective reduction ensures a high grade ferronickel and high nickel recoveries
[10, 83] but in all of the cases it is confined to only some general statement about the
issue. No detailed and exact study has been reported about the direct effect of
selectivity on either ferronickel grade or nickel recovery upon subsequent smelting.
Only a limited data is reported about the effect of prereduction temperature on the
energy consumption upon smelting in the electric furnace [1]. In some cases it is
96
reported that the conditions are adjusted to obtain the highest temperature and highest
degree of metallization while avoiding accretion formation on the kiln wall [24]. The
high calcine temperature minimizes the energy consumption and the high degree of
metallization leads to a more silent and smooth process in the electric furnace [16].
In the current study, 1000°C was selected as the best prereduction temperature. At
1100°C, interparticular sintering occurred and, although in very small amounts,
accretion was formed on the crucible. Therefore, 1000°C was the maximum possible
temperature which provided the maximum metallization without any sintering and
accretion formation. Coal amount was adjusted to produce a ferronickel containing
about 15 wt.% nickel.
4.4 Smelting
4.4.1 Experiments in the Horizontal Tube Furnace
The ore was dried, calcined and prereduced prior to the smelting. As the first and trial
smelting experiment, 12.5 g of prereduced ore was mixed with 2.9 g MgO and 1.54 g
coal and smelted at 1600°C. In the prereduction stage, the calcined ore was mixed with
50% excess coal and reduced at 1000°C for 40 min. The smelting temperature of
1600°C was selected to be high enough to ensure a complete smelting. MgO content
of the Sivrihisar limonitic ore was very low and fell out of the required SiO2/MgO
weight ratio (1.5-2.5) which is ordinarily accepted for the ferronickel smelting.
Therefore, some MgO was added to the charge to increase its MgO content. Coal
amount was chosen to be 10 wt.% of the weight of prereduced ore + MgO.
The trial experiment yielded a ferronickel with 3.3 wt.% nickel which was much lower
than the commercially acceptable minimum nickel grade, i.e. 15 wt.%. Consequently,
in the next experiments, no additional coal was added during the smelting and the
reduction reactions were completed by the remaining carbon from the prereduction
stage. In these experiments, the effects of temperature, retention time, coal amount
(added in the prereduction) stage and MgO addition were investigated. Experiments
performed in the horizontal tube furnace are listed in Table 4-8.
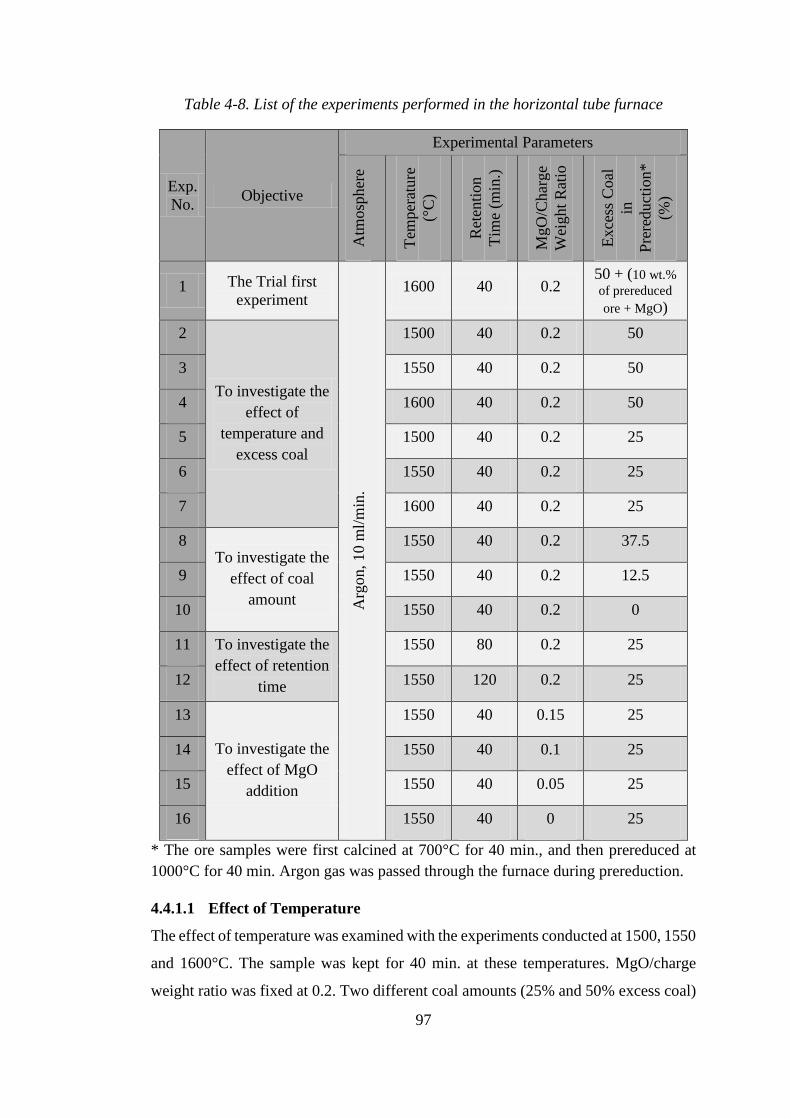
97
Table 4-8. List of the experiments performed in the horizontal tube furnace
Exp.
No. Objective
Experimental Parameters
Atm
osp
her
e
Tem
per
ature
(°C
)
Ret
enti
on
Tim
e (m
in.)
MgO
/Char
ge
Wei
ght
Rat
io
Exce
ss C
oal
in
Pre
reduct
ion
*
(%)
1 The Trial first
experiment
Arg
on,
10 m
l/m
in.
1600 40 0.2 50 + (10 wt.%
of prereduced
ore + MgO)
2
To investigate the
effect of
temperature and
excess coal
1500 40 0.2 50
3 1550 40 0.2 50
4 1600 40 0.2 50
5 1500 40 0.2 25
6 1550 40 0.2 25
7 1600 40 0.2 25
8 To investigate the
effect of coal
amount
1550 40 0.2 37.5
9 1550 40 0.2 12.5
10 1550 40 0.2 0
11 To investigate the
effect of retention
time
1550 80 0.2 25
12 1550 120 0.2 25
13
To investigate the
effect of MgO
addition
1550 40 0.15 25
14 1550 40 0.1 25
15 1550 40 0.05 25
16 1550 40 0 25
* The ore samples were first calcined at 700°C for 40 min., and then prereduced at
1000°C for 40 min. Argon gas was passed through the furnace during prereduction.
4.4.1.1 Effect of Temperature
The effect of temperature was examined with the experiments conducted at 1500, 1550
and 1600°C. The sample was kept for 40 min. at these temperatures. MgO/charge
weight ratio was fixed at 0.2. Two different coal amounts (25% and 50% excess coal)

98
were used in the prereduction stage to reduce the ore. In the smelting stage, additional
coal was not used.
Figure 4-33. Variations in (a) weight and (b) grade of the ferronickel product with
temperature.
The weight and the grade of the ferronickel products are plotted against temperature
in Figs. 4-33-a and 4-33-b, respectively. The weight of the ferronickel slightly
increased with temperature for 25% excess coal addition. As for 50% excess coal, it
increased when temperature was raised from 1500 to 1550°C, and then decreased at
1600°C. A reverse variation was observed for ferronickel grade. Ferronickel grade
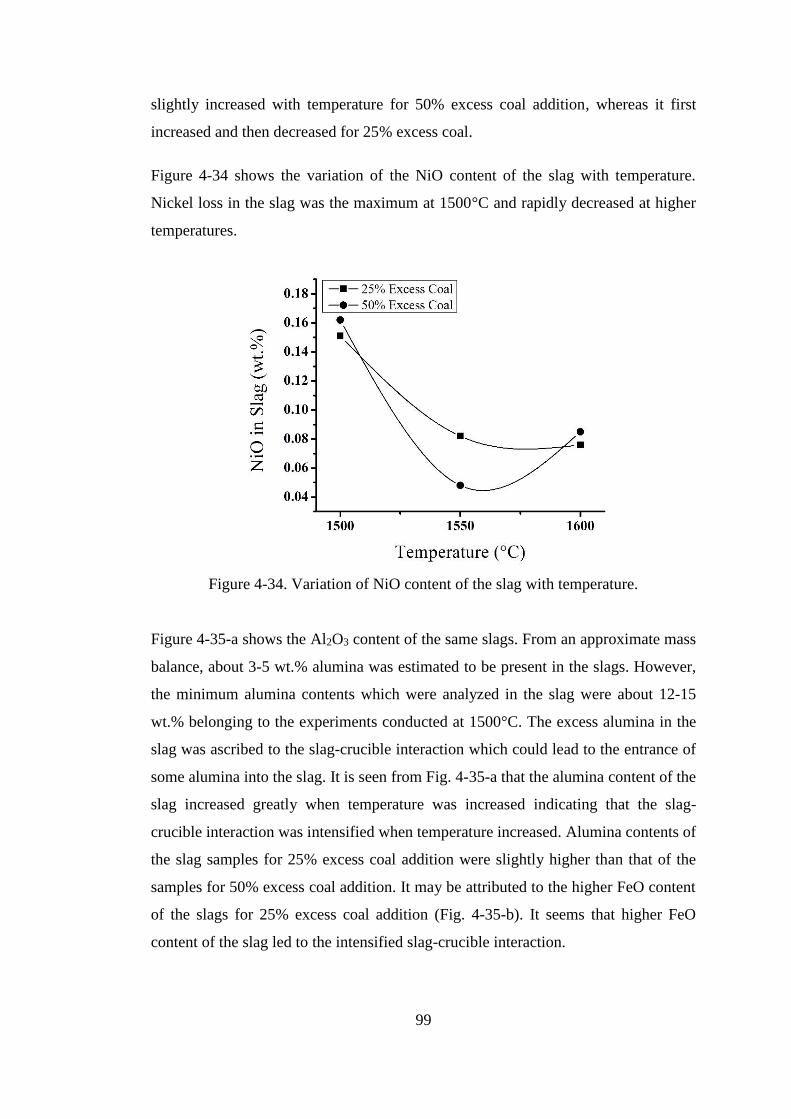
99
slightly increased with temperature for 50% excess coal addition, whereas it first
increased and then decreased for 25% excess coal.
Figure 4-34 shows the variation of the NiO content of the slag with temperature.
Nickel loss in the slag was the maximum at 1500°C and rapidly decreased at higher
temperatures.
Figure 4-34. Variation of NiO content of the slag with temperature.
Figure 4-35-a shows the Al2O3 content of the same slags. From an approximate mass
balance, about 3-5 wt.% alumina was estimated to be present in the slags. However,
the minimum alumina contents which were analyzed in the slag were about 12-15
wt.% belonging to the experiments conducted at 1500°C. The excess alumina in the
slag was ascribed to the slag-crucible interaction which could lead to the entrance of
some alumina into the slag. It is seen from Fig. 4-35-a that the alumina content of the
slag increased greatly when temperature was increased indicating that the slag-
crucible interaction was intensified when temperature increased. Alumina contents of
the slag samples for 25% excess coal addition were slightly higher than that of the
samples for 50% excess coal addition. It may be attributed to the higher FeO content
of the slags for 25% excess coal addition (Fig. 4-35-b). It seems that higher FeO
content of the slag led to the intensified slag-crucible interaction.
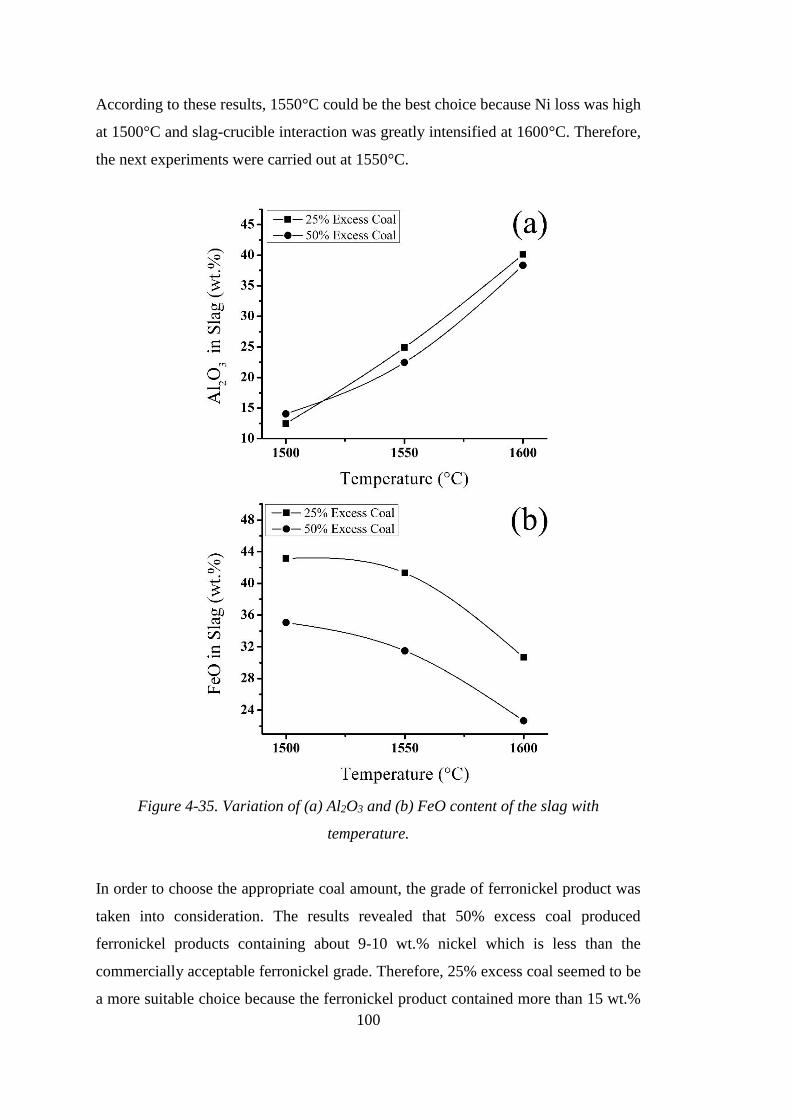
100
According to these results, 1550°C could be the best choice because Ni loss was high
at 1500°C and slag-crucible interaction was greatly intensified at 1600°C. Therefore,
the next experiments were carried out at 1550°C.
Figure 4-35. Variation of (a) Al2O3 and (b) FeO content of the slag with
temperature.
In order to choose the appropriate coal amount, the grade of ferronickel product was
taken into consideration. The results revealed that 50% excess coal produced
ferronickel products containing about 9-10 wt.% nickel which is less than the
commercially acceptable ferronickel grade. Therefore, 25% excess coal seemed to be
a more suitable choice because the ferronickel product contained more than 15 wt.%
101
nickel. The effect of coal was investigated in more detail by the addition of various
amounts of coal to the charge which will be discussed in the next section.
4.4.1.2 Effect of Coal Amount Used in the Prereduction Stage
As mentioned previously, coal was added at the prereduction stage and no extra coal
was added before smelting. 0, 12.5, 25, 37.5 and 50% in excess of the calculated coal
amount (Appendix C) were used to prereduce the ore. Prereduction experiments were
carried out at 1000°C for 40 min. The prereduced ore was then mixed with MgO
(MgO/charge weight ratio was 0.2) and smelted at 1550°C.
Variations of the weight and the grade of the ferronickel with excess coal is plotted in
Fig. 4-36. Weight of the ferronickel product increased while its grade decreased when
more excess coal was used. Obviously enough, more metal was reduced when more
coal was added and thus a heavier ferronickel was obtained. The increased weight was
largely due to the reduction of iron oxide rather than the reduction of nickel and cobalt
oxides. Iron oxide was reduced to a greater extent, upon which, more iron entered the
ferronickel phase and diluted the alloy product (lowered its grade). More detailed
discussion about the effect of coal addition on the grade of the ferronickel product will
be provided in the coming sections where the “experiments done in the vertical
furnace” will be discussed.
The effect of the coal addition on the nickel concentration in the slag is shown in Fig.
4-37. Nickel concentration in the slag continually decreased with coal addition. In fact,
nickel, as the value element, is lost in the slag and its concentration in the slag is
desired to be the minimum. This results showed that nickel oxide was reduced to a
larger extent when increased amounts of coal was used. The effect of coal amount was
pronounced when 12.5% excess coal was added. Higher coal amounts had minor
effect.
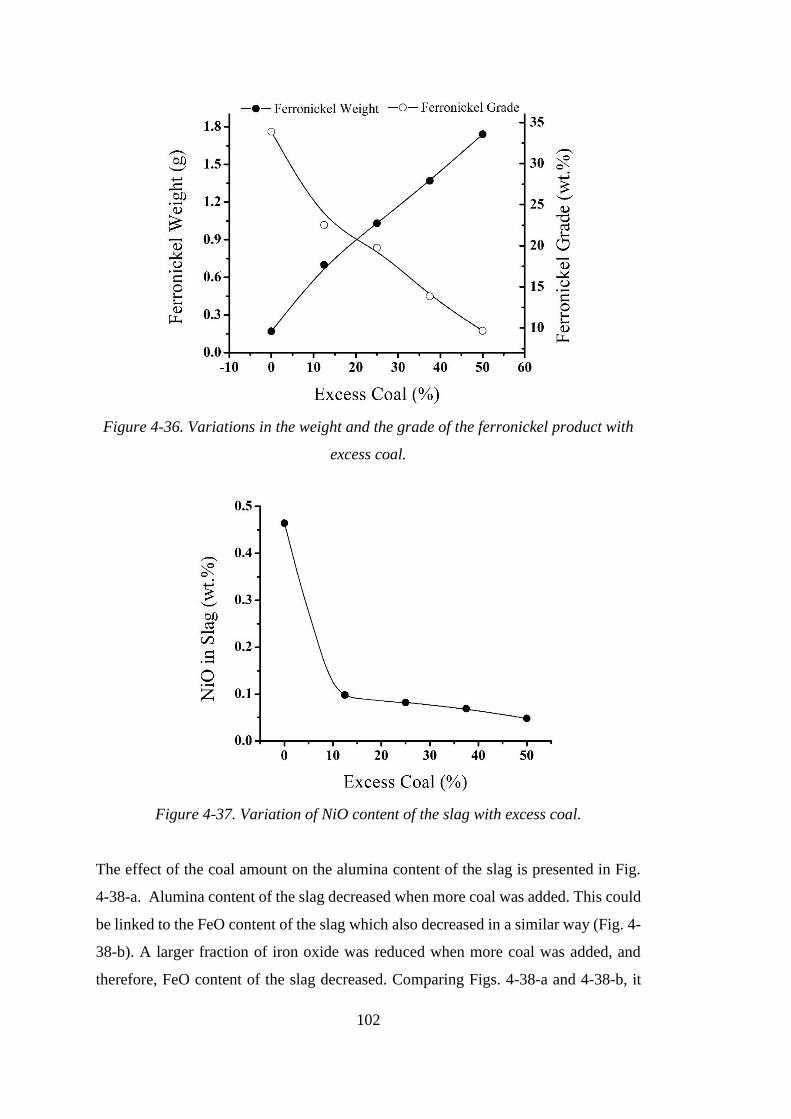
102
Figure 4-36. Variations in the weight and the grade of the ferronickel product with
excess coal.
Figure 4-37. Variation of NiO content of the slag with excess coal.
The effect of the coal amount on the alumina content of the slag is presented in Fig.
4-38-a. Alumina content of the slag decreased when more coal was added. This could
be linked to the FeO content of the slag which also decreased in a similar way (Fig. 4-
38-b). A larger fraction of iron oxide was reduced when more coal was added, and
therefore, FeO content of the slag decreased. Comparing Figs. 4-38-a and 4-38-b, it
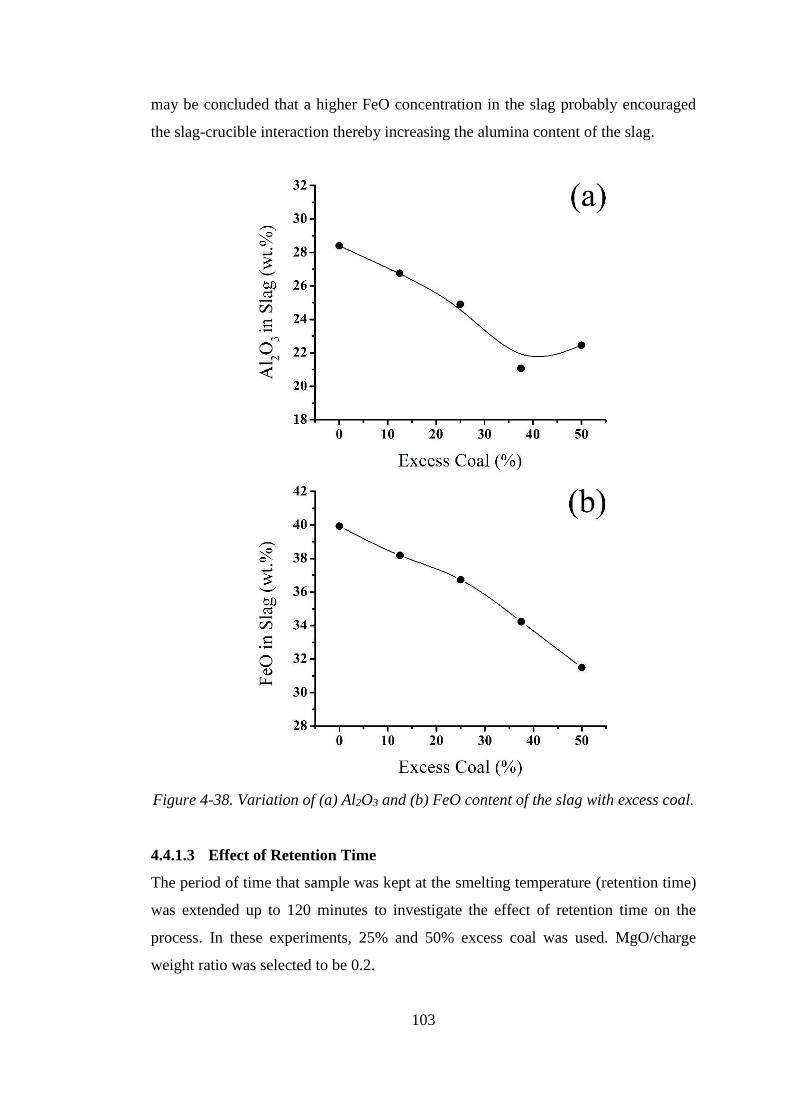
103
may be concluded that a higher FeO concentration in the slag probably encouraged
the slag-crucible interaction thereby increasing the alumina content of the slag.
Figure 4-38. Variation of (a) Al2O3 and (b) FeO content of the slag with excess coal.
4.4.1.3 Effect of Retention Time
The period of time that sample was kept at the smelting temperature (retention time)
was extended up to 120 minutes to investigate the effect of retention time on the
process. In these experiments, 25% and 50% excess coal was used. MgO/charge
weight ratio was selected to be 0.2.

104
Ferronickel weight was expected to increase or to remain unchanged by the extended
retention time. This was because of the fact that the reduction reactions were expected
to take place until almost all of the coal was consumed, and thereafter, they were
expected to cease. Reoxidation of metal phase was expected to be inhibited since argon
gas was passed through the furnace during the whole periods of the experiments.
Figure 4-39 shows the effect of retention time on the weight and the grade of the
ferronickel. Weight of the ferronickel product was slightly increased when the sample
was kept at the smelting temperature for longer periods of time. The ferronickel grade,
meanwhile, decreased which may be related to the more iron reduction which diluted
the ferronickel.
Figure 4-39. Variations in the weight and the grade of the ferronickel product with
retention time.
NiO content of the slag did not change when the retention time was extended from 40
to 80 min. but it increased at 120 min. (Fig. 4-40). According to what was mentioned
on the possible effect of retention time, the increase in the NiO content of the slag at
120 min. was considered to arise from sampling or analysis error.
As it is seen in Fig. 4-41, the alumina content of the slag largely increased when the
retention time was increased from 40 to 80 min. Longer retention times had slight
effect on the alumina content of the slag.
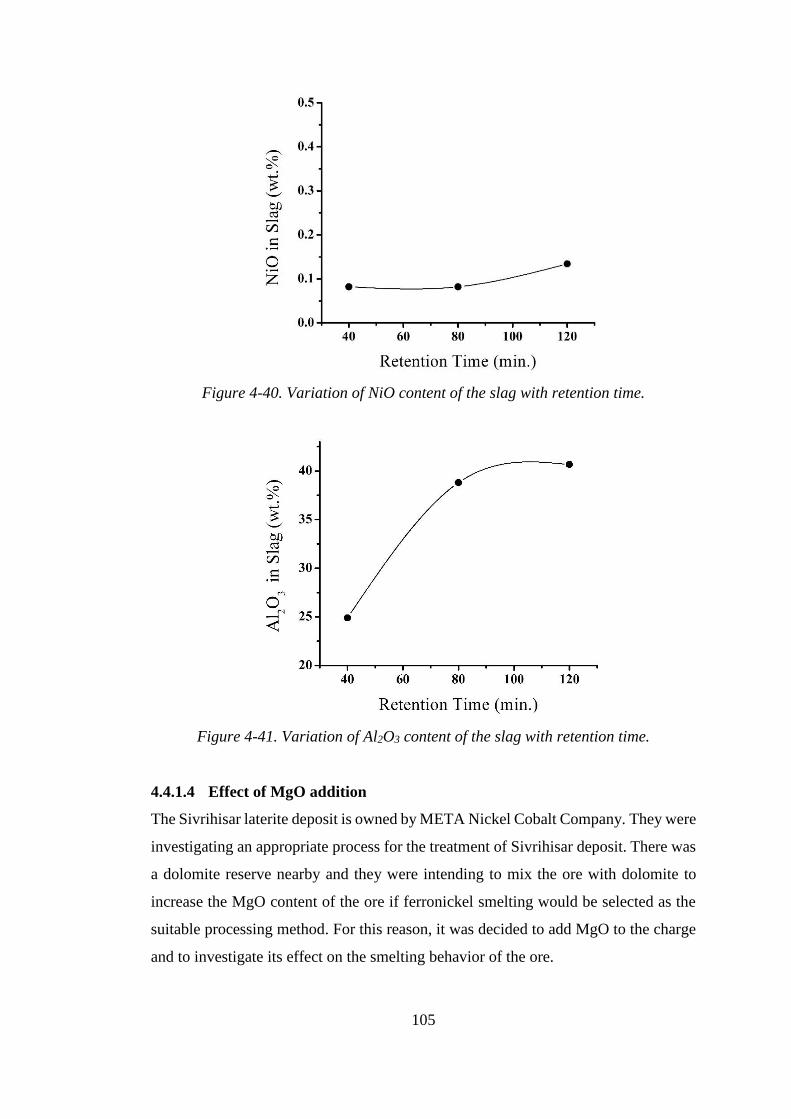
105
Figure 4-40. Variation of NiO content of the slag with retention time.
Figure 4-41. Variation of Al2O3 content of the slag with retention time.
4.4.1.4 Effect of MgO addition
The Sivrihisar laterite deposit is owned by META Nickel Cobalt Company. They were
investigating an appropriate process for the treatment of Sivrihisar deposit. There was
a dolomite reserve nearby and they were intending to mix the ore with dolomite to
increase the MgO content of the ore if ferronickel smelting would be selected as the
suitable processing method. For this reason, it was decided to add MgO to the charge
and to investigate its effect on the smelting behavior of the ore.
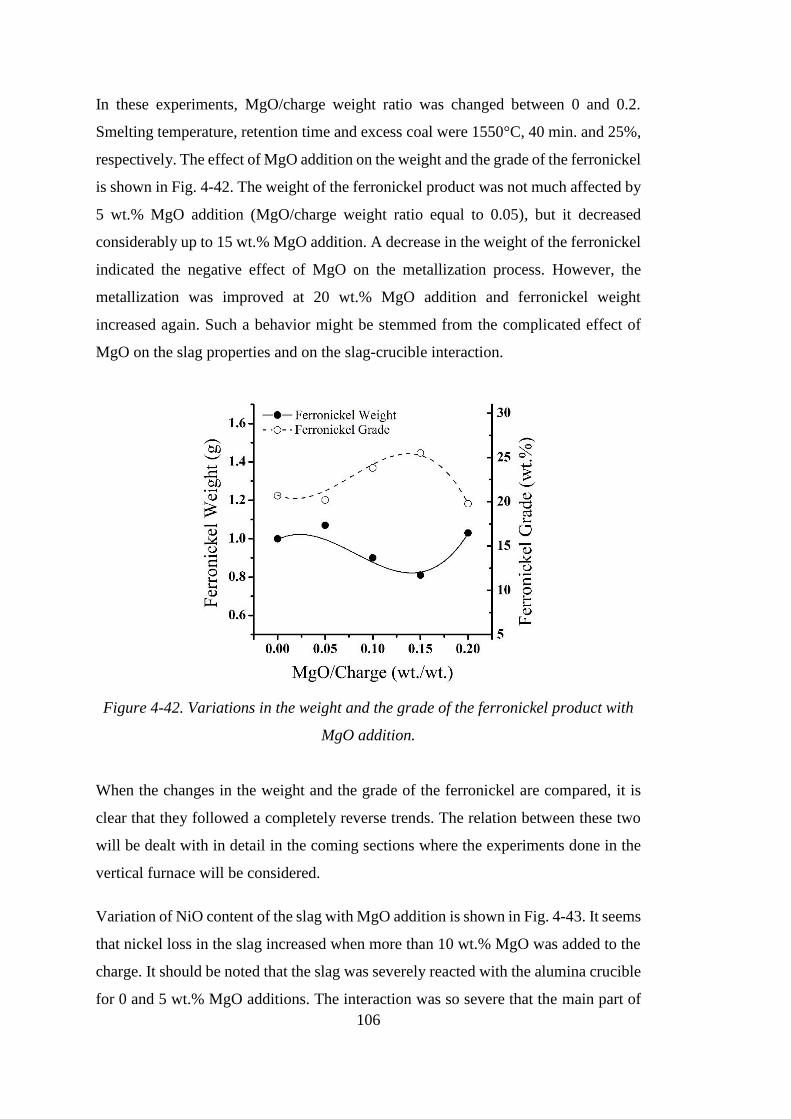
106
In these experiments, MgO/charge weight ratio was changed between 0 and 0.2.
Smelting temperature, retention time and excess coal were 1550°C, 40 min. and 25%,
respectively. The effect of MgO addition on the weight and the grade of the ferronickel
is shown in Fig. 4-42. The weight of the ferronickel product was not much affected by
5 wt.% MgO addition (MgO/charge weight ratio equal to 0.05), but it decreased
considerably up to 15 wt.% MgO addition. A decrease in the weight of the ferronickel
indicated the negative effect of MgO on the metallization process. However, the
metallization was improved at 20 wt.% MgO addition and ferronickel weight
increased again. Such a behavior might be stemmed from the complicated effect of
MgO on the slag properties and on the slag-crucible interaction.
Figure 4-42. Variations in the weight and the grade of the ferronickel product with
MgO addition.
When the changes in the weight and the grade of the ferronickel are compared, it is
clear that they followed a completely reverse trends. The relation between these two
will be dealt with in detail in the coming sections where the experiments done in the
vertical furnace will be considered.
Variation of NiO content of the slag with MgO addition is shown in Fig. 4-43. It seems
that nickel loss in the slag increased when more than 10 wt.% MgO was added to the
charge. It should be noted that the slag was severely reacted with the alumina crucible
for 0 and 5 wt.% MgO additions. The interaction was so severe that the main part of
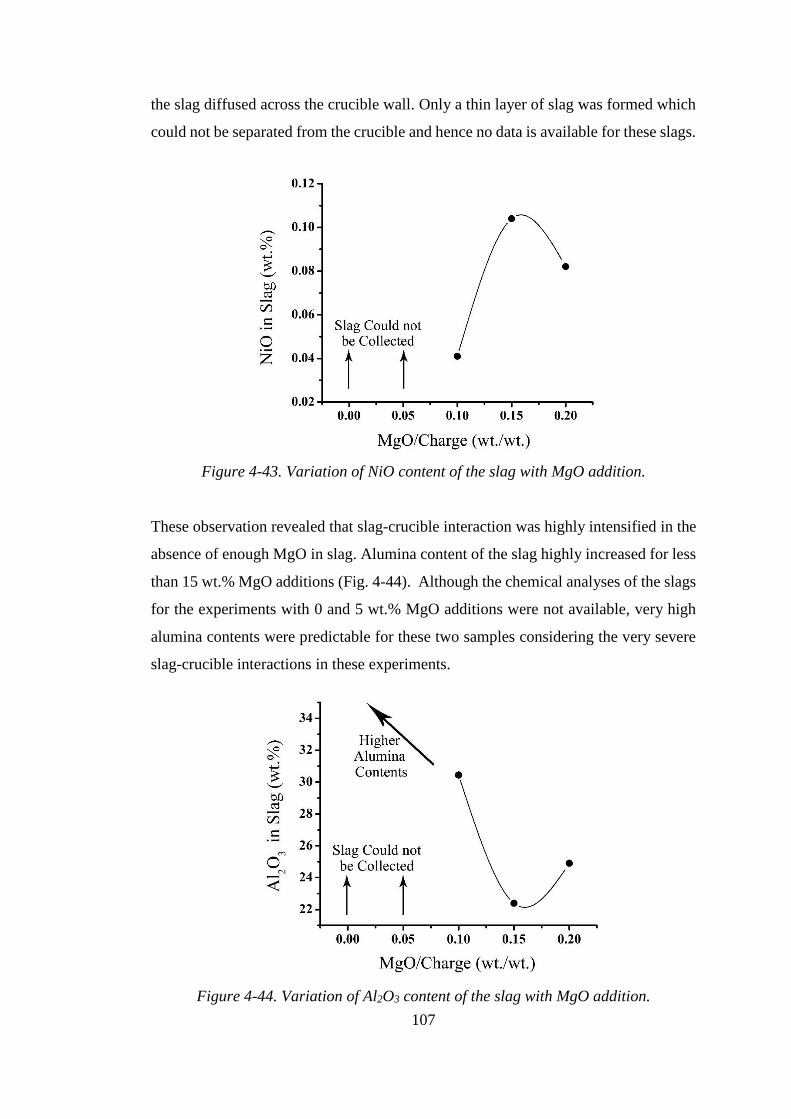
107
the slag diffused across the crucible wall. Only a thin layer of slag was formed which
could not be separated from the crucible and hence no data is available for these slags.
Figure 4-43. Variation of NiO content of the slag with MgO addition.
These observation revealed that slag-crucible interaction was highly intensified in the
absence of enough MgO in slag. Alumina content of the slag highly increased for less
than 15 wt.% MgO additions (Fig. 4-44). Although the chemical analyses of the slags
for the experiments with 0 and 5 wt.% MgO additions were not available, very high
alumina contents were predictable for these two samples considering the very severe
slag-crucible interactions in these experiments.
Figure 4-44. Variation of Al2O3 content of the slag with MgO addition.
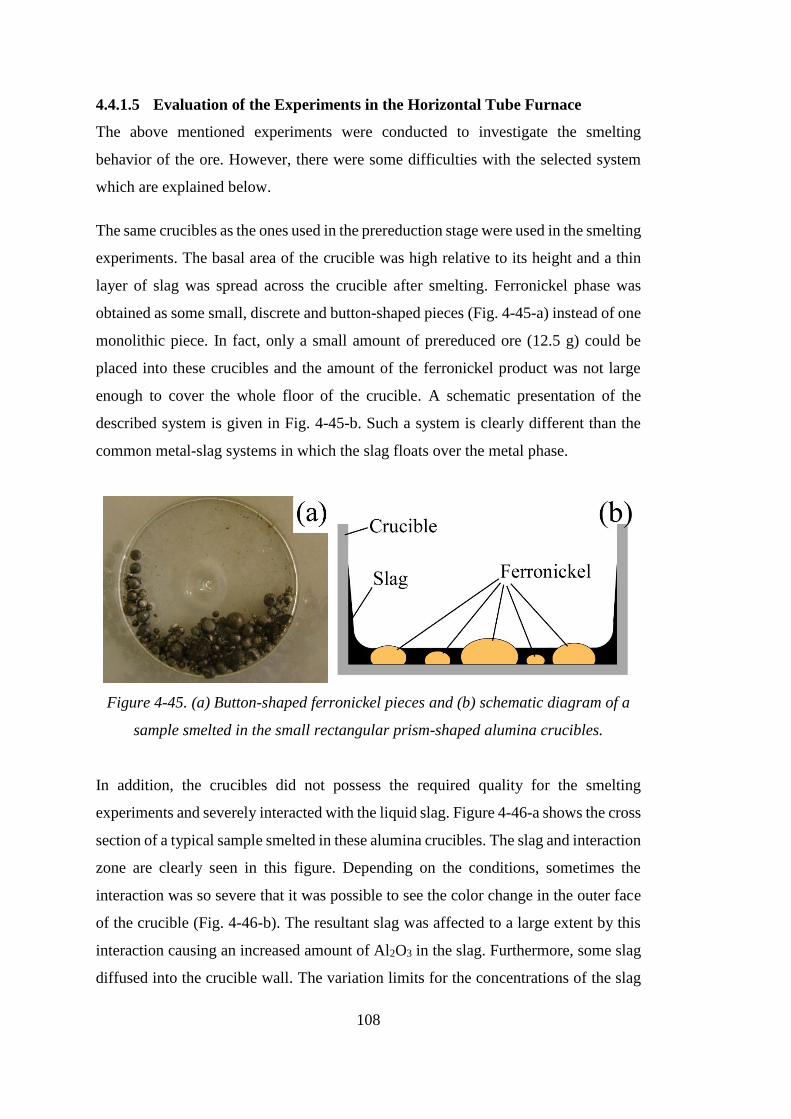
108
4.4.1.5 Evaluation of the Experiments in the Horizontal Tube Furnace
The above mentioned experiments were conducted to investigate the smelting
behavior of the ore. However, there were some difficulties with the selected system
which are explained below.
The same crucibles as the ones used in the prereduction stage were used in the smelting
experiments. The basal area of the crucible was high relative to its height and a thin
layer of slag was spread across the crucible after smelting. Ferronickel phase was
obtained as some small, discrete and button-shaped pieces (Fig. 4-45-a) instead of one
monolithic piece. In fact, only a small amount of prereduced ore (12.5 g) could be
placed into these crucibles and the amount of the ferronickel product was not large
enough to cover the whole floor of the crucible. A schematic presentation of the
described system is given in Fig. 4-45-b. Such a system is clearly different than the
common metal-slag systems in which the slag floats over the metal phase.
Figure 4-45. (a) Button-shaped ferronickel pieces and (b) schematic diagram of a
sample smelted in the small rectangular prism-shaped alumina crucibles.
In addition, the crucibles did not possess the required quality for the smelting
experiments and severely interacted with the liquid slag. Figure 4-46-a shows the cross
section of a typical sample smelted in these alumina crucibles. The slag and interaction
zone are clearly seen in this figure. Depending on the conditions, sometimes the
interaction was so severe that it was possible to see the color change in the outer face
of the crucible (Fig. 4-46-b). The resultant slag was affected to a large extent by this
interaction causing an increased amount of Al2O3 in the slag. Furthermore, some slag
diffused into the crucible wall. The variation limits for the concentrations of the slag
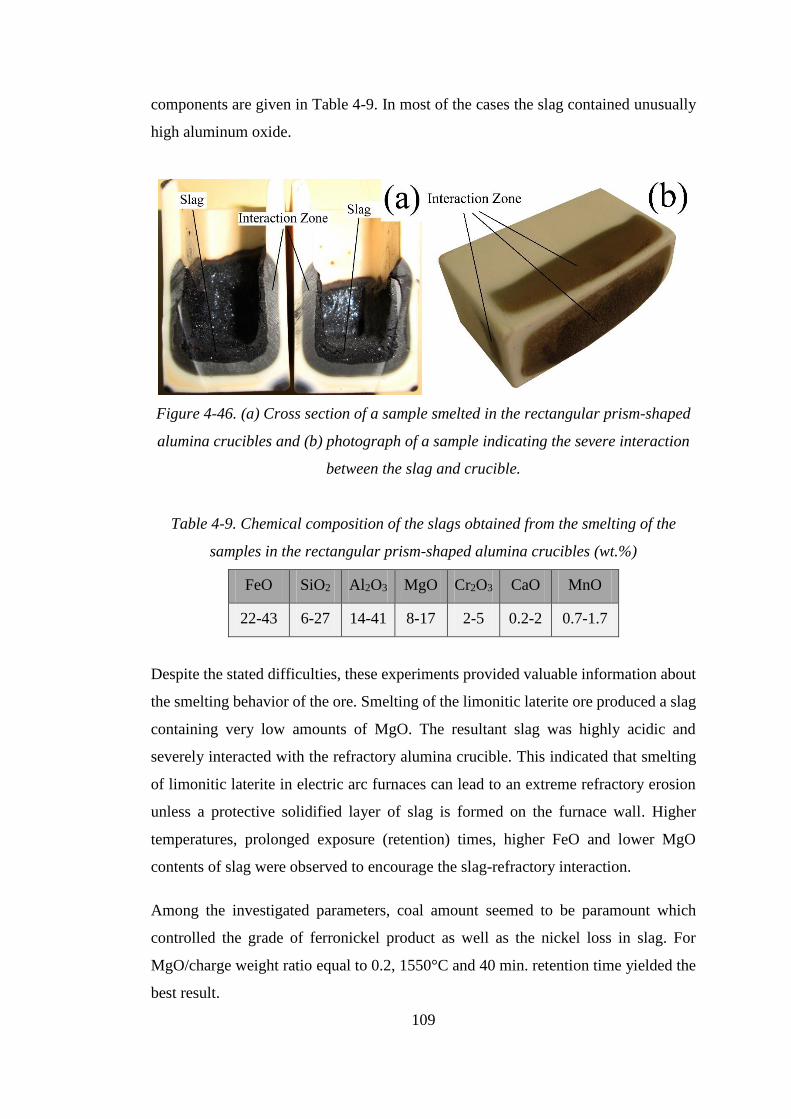
109
components are given in Table 4-9. In most of the cases the slag contained unusually
high aluminum oxide.
Figure 4-46. (a) Cross section of a sample smelted in the rectangular prism-shaped
alumina crucibles and (b) photograph of a sample indicating the severe interaction
between the slag and crucible.
Table 4-9. Chemical composition of the slags obtained from the smelting of the
samples in the rectangular prism-shaped alumina crucibles (wt.%)
FeO SiO2 Al2O3 MgO Cr2O3 CaO MnO
22-43 6-27 14-41 8-17 2-5 0.2-2 0.7-1.7
Despite the stated difficulties, these experiments provided valuable information about
the smelting behavior of the ore. Smelting of the limonitic laterite ore produced a slag
containing very low amounts of MgO. The resultant slag was highly acidic and
severely interacted with the refractory alumina crucible. This indicated that smelting
of limonitic laterite in electric arc furnaces can lead to an extreme refractory erosion
unless a protective solidified layer of slag is formed on the furnace wall. Higher
temperatures, prolonged exposure (retention) times, higher FeO and lower MgO
contents of slag were observed to encourage the slag-refractory interaction.
Among the investigated parameters, coal amount seemed to be paramount which
controlled the grade of ferronickel product as well as the nickel loss in slag. For
MgO/charge weight ratio equal to 0.2, 1550°C and 40 min. retention time yielded the
best result.

110
4.4.2 Experiments in the Vertical Tube Furnace
The difficulties encountered during the experiments performed using the rectangular
prism-shaped laboratory-produced alumina crucibles led to investigate more
appropriate crucibles ensuring not only to collect the metal in a single bullion but also
to decrease the metal-slag interaction. Therefore, cylindrical alumina crucibles were
bought from Haldenwanger®. The outer diameter of the crucibles was 45 mm while
their height was 100 mm. Correspondingly, the experiments were required to be
conducted using a vertical tube furnace. The new crucibles contained larger amount
of material and minimized the slag-crucible interaction. Its rounded bottom part
allowed the metal droplets to easily join each other and to form a monolithic metal
pool at the bottom of the crucible. Therefore, a standard slag-metal system could be
better simulated using these crucibles. Figure 4-47 shows a Haldenwanger smelting
crucible and the cross section of a typical smelted sample.
Figure 4-47. (a) A Haldenwanger smelting crucible, (b) typical metal and slag
samples obtained after smelting.
Some preliminary experiments were conducted in the new set-up. The 6th and 14th
experiments were repeated but different results were obtained (Table 4-10). These
different results were attributed to the difference in the geometry and the material of
the crucibles. In view of these results, the smelting stage was investigated again via
the experiments performed using the vertical tube furnace.
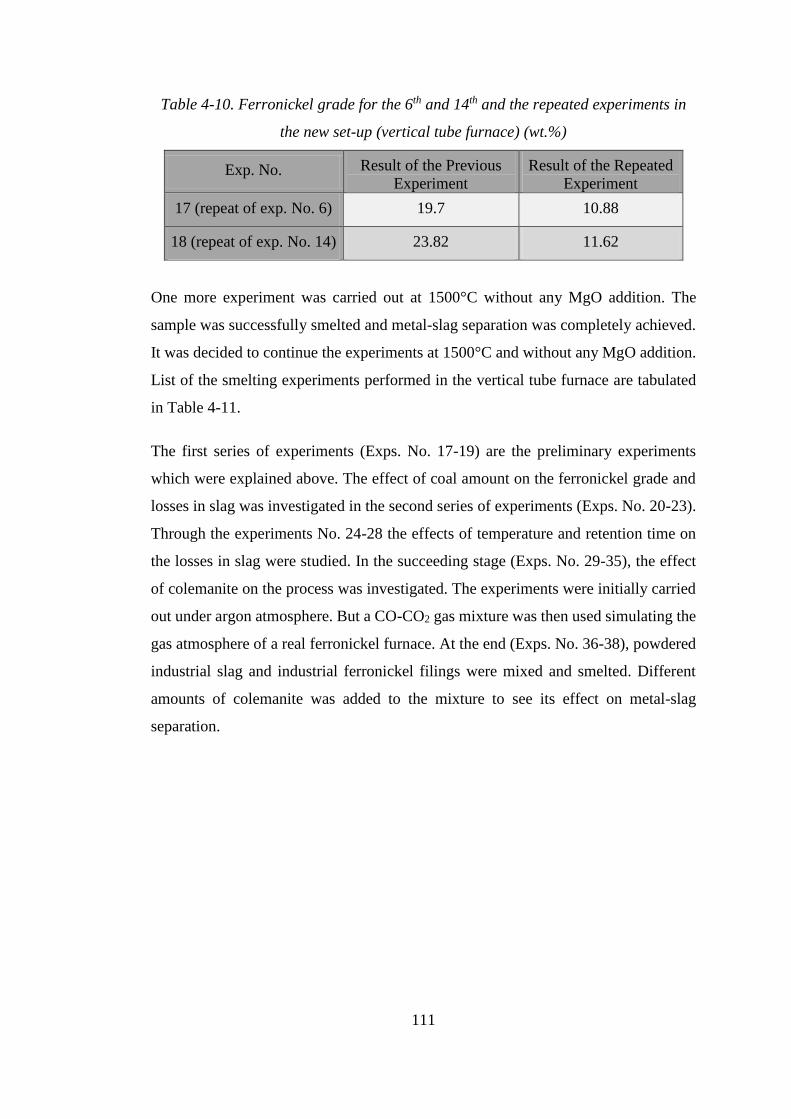
111
Table 4-10. Ferronickel grade for the 6th and 14th and the repeated experiments in
the new set-up (vertical tube furnace) (wt.%)
Exp. No. Result of the Previous
Experiment
Result of the Repeated
Experiment
17 (repeat of exp. No. 6) 19.7 10.88
18 (repeat of exp. No. 14) 23.82 11.62
One more experiment was carried out at 1500°C without any MgO addition. The
sample was successfully smelted and metal-slag separation was completely achieved.
It was decided to continue the experiments at 1500°C and without any MgO addition.
List of the smelting experiments performed in the vertical tube furnace are tabulated
in Table 4-11.
The first series of experiments (Exps. No. 17-19) are the preliminary experiments
which were explained above. The effect of coal amount on the ferronickel grade and
losses in slag was investigated in the second series of experiments (Exps. No. 20-23).
Through the experiments No. 24-28 the effects of temperature and retention time on
the losses in slag were studied. In the succeeding stage (Exps. No. 29-35), the effect
of colemanite on the process was investigated. The experiments were initially carried
out under argon atmosphere. But a CO-CO2 gas mixture was then used simulating the
gas atmosphere of a real ferronickel furnace. At the end (Exps. No. 36-38), powdered
industrial slag and industrial ferronickel filings were mixed and smelted. Different
amounts of colemanite was added to the mixture to see its effect on metal-slag
separation.
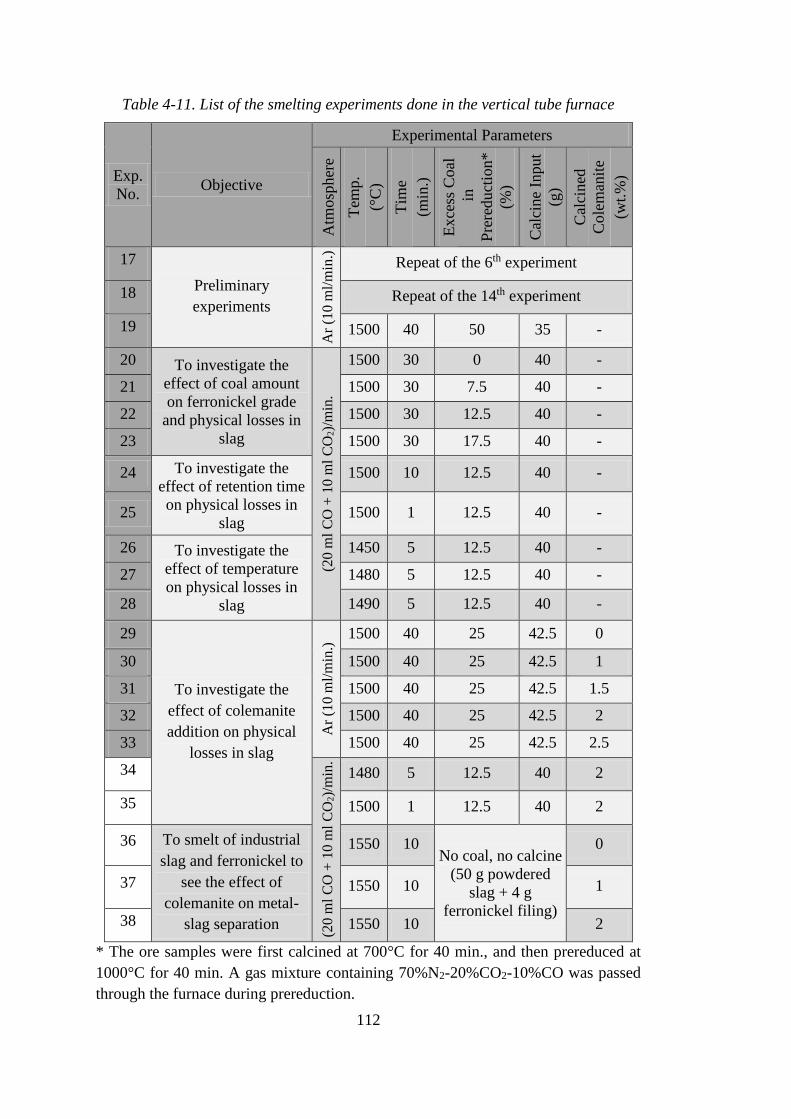
112
Table 4-11. List of the smelting experiments done in the vertical tube furnace
Exp.
No. Objective
Experimental Parameters
Atm
osp
her
e
Tem
p.
(°C
)
Tim
e
(min
.)
Exce
ss C
oal
in
Pre
reduct
ion*
(%)
Cal
cine
Input
(g)
Cal
cined
Cole
man
ite
(wt.
%)
17
Preliminary
experiments
Ar
(10
ml/
min
.)
Repeat of the 6th experiment
18 Repeat of the 14th experiment
19 1500 40 50 35 -
20 To investigate the
effect of coal amount
on ferronickel grade
and physical losses in
slag
(20 m
l C
O +
10 m
l C
O2)/
min
.
1500 30 0 40 -
21 1500 30 7.5 40 -
22 1500 30 12.5 40 -
23 1500 30 17.5 40 -
24 To investigate the
effect of retention time
on physical losses in
slag
1500 10 12.5 40 -
25 1500 1 12.5 40 -
26 To investigate the
effect of temperature
on physical losses in
slag
1450 5 12.5 40 -
27 1480 5 12.5 40 -
28 1490 5 12.5 40 -
29
To investigate the
effect of colemanite
addition on physical
losses in slag
Ar
(10 m
l/m
in.)
1500 40 25 42.5 0
30 1500 40 25 42.5 1
31 1500 40 25 42.5 1.5
32 1500 40 25 42.5 2
33 1500 40 25 42.5 2.5
34
(20
ml
CO
+ 1
0 m
l C
O2)/
min
.
1480 5 12.5 40 2
35 1500 1 12.5 40 2
36 To smelt of industrial
slag and ferronickel to
see the effect of
colemanite on metal-
slag separation
1550 10 No coal, no calcine
(50 g powdered
slag + 4 g
ferronickel filing)
0
37 1550 10 1
38 1550 10 2
* The ore samples were first calcined at 700°C for 40 min., and then prereduced at
1000°C for 40 min. A gas mixture containing 70%N2-20%CO2-10%CO was passed
through the furnace during prereduction.
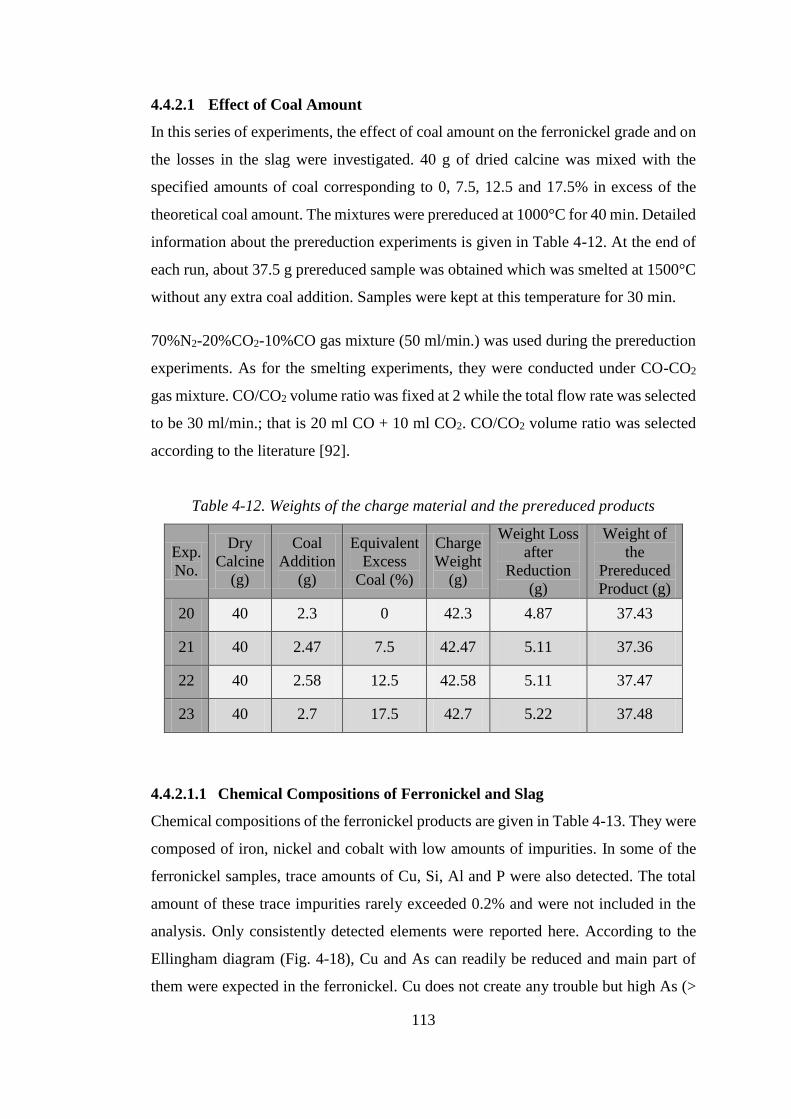
113
4.4.2.1 Effect of Coal Amount
In this series of experiments, the effect of coal amount on the ferronickel grade and on
the losses in the slag were investigated. 40 g of dried calcine was mixed with the
specified amounts of coal corresponding to 0, 7.5, 12.5 and 17.5% in excess of the
theoretical coal amount. The mixtures were prereduced at 1000°C for 40 min. Detailed
information about the prereduction experiments is given in Table 4-12. At the end of
each run, about 37.5 g prereduced sample was obtained which was smelted at 1500°C
without any extra coal addition. Samples were kept at this temperature for 30 min.
70%N2-20%CO2-10%CO gas mixture (50 ml/min.) was used during the prereduction
experiments. As for the smelting experiments, they were conducted under CO-CO2
gas mixture. CO/CO2 volume ratio was fixed at 2 while the total flow rate was selected
to be 30 ml/min.; that is 20 ml CO + 10 ml CO2. CO/CO2 volume ratio was selected
according to the literature [92].
Table 4-12. Weights of the charge material and the prereduced products
Exp.
No.
Dry
Calcine
(g)
Coal
Addition
(g)
Equivalent
Excess
Coal (%)
Charge
Weight
(g)
Weight Loss
after
Reduction
(g)
Weight of
the
Prereduced
Product (g)
20 40 2.3 0 42.3 4.87 37.43
21 40 2.47 7.5 42.47 5.11 37.36
22 40 2.58 12.5 42.58 5.11 37.47
23 40 2.7 17.5 42.7 5.22 37.48
4.4.2.1.1 Chemical Compositions of Ferronickel and Slag
Chemical compositions of the ferronickel products are given in Table 4-13. They were
composed of iron, nickel and cobalt with low amounts of impurities. In some of the
ferronickel samples, trace amounts of Cu, Si, Al and P were also detected. The total
amount of these trace impurities rarely exceeded 0.2% and were not included in the
analysis. Only consistently detected elements were reported here. According to the
Ellingham diagram (Fig. 4-18), Cu and As can readily be reduced and main part of
them were expected in the ferronickel. Cu does not create any trouble but high As (>
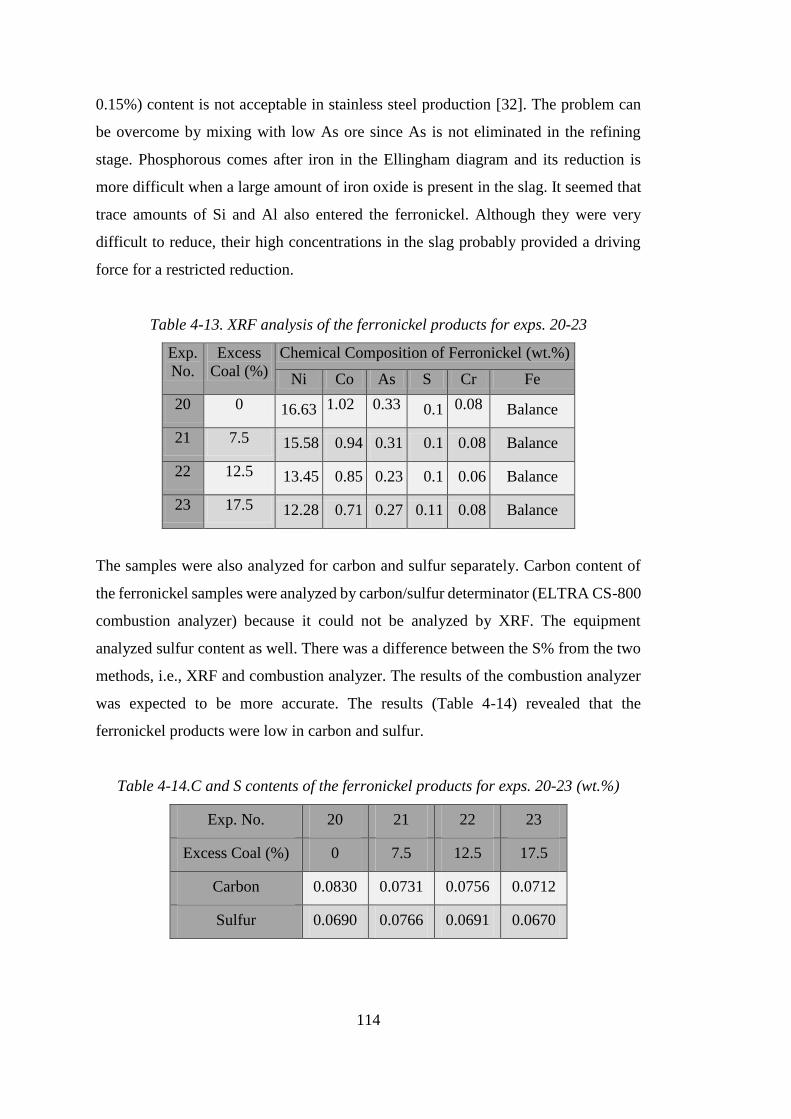
114
0.15%) content is not acceptable in stainless steel production [32]. The problem can
be overcome by mixing with low As ore since As is not eliminated in the refining
stage. Phosphorous comes after iron in the Ellingham diagram and its reduction is
more difficult when a large amount of iron oxide is present in the slag. It seemed that
trace amounts of Si and Al also entered the ferronickel. Although they were very
difficult to reduce, their high concentrations in the slag probably provided a driving
force for a restricted reduction.
Table 4-13. XRF analysis of the ferronickel products for exps. 20-23
Exp.
No.
Excess
Coal (%)
Chemical Composition of Ferronickel (wt.%)
Ni Co As S Cr Fe
20 0 16.63 1.02 0.33 0.1 0.08 Balance
21 7.5 15.58 0.94 0.31 0.1 0.08 Balance
22 12.5 13.45 0.85 0.23 0.1 0.06 Balance
23 17.5 12.28 0.71 0.27 0.11 0.08 Balance
The samples were also analyzed for carbon and sulfur separately. Carbon content of
the ferronickel samples were analyzed by carbon/sulfur determinator (ELTRA CS-800
combustion analyzer) because it could not be analyzed by XRF. The equipment
analyzed sulfur content as well. There was a difference between the S% from the two
methods, i.e., XRF and combustion analyzer. The results of the combustion analyzer
was expected to be more accurate. The results (Table 4-14) revealed that the
ferronickel products were low in carbon and sulfur.
Table 4-14.C and S contents of the ferronickel products for exps. 20-23 (wt.%)
Exp. No. 20 21 22 23
Excess Coal (%) 0 7.5 12.5 17.5
Carbon 0.0830 0.0731 0.0756 0.0712
Sulfur 0.0690 0.0766 0.0691 0.0670
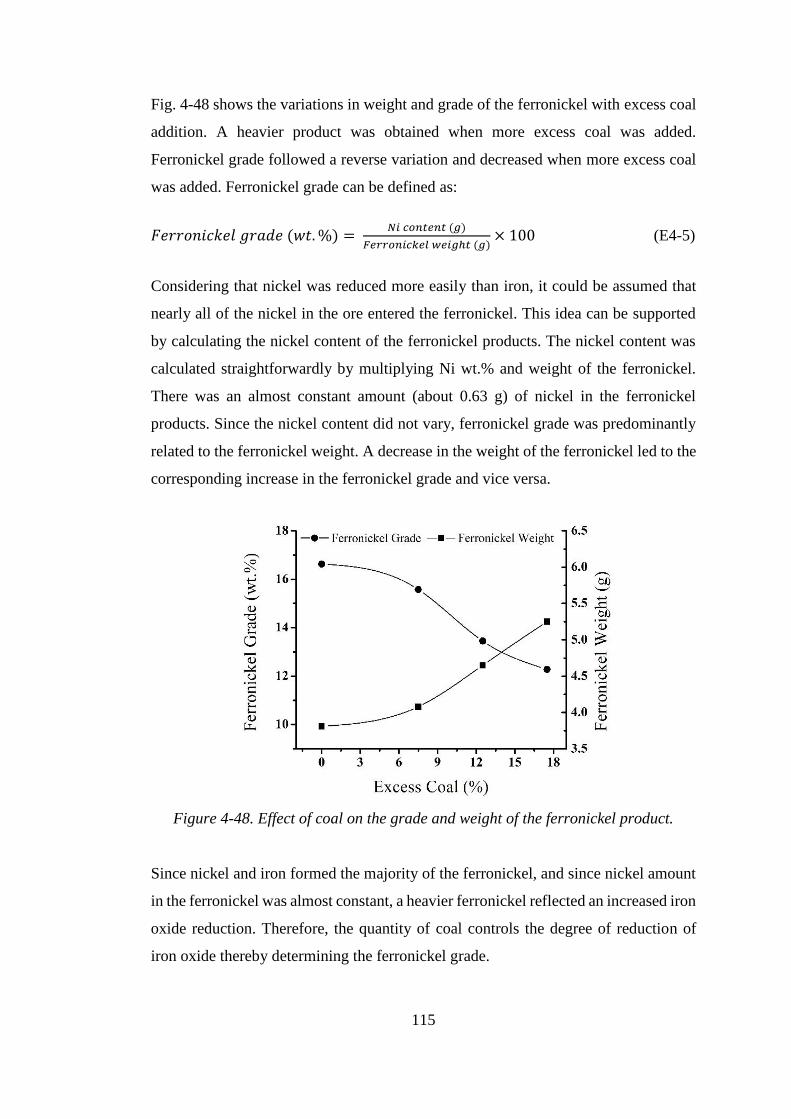
115
Fig. 4-48 shows the variations in weight and grade of the ferronickel with excess coal
addition. A heavier product was obtained when more excess coal was added.
Ferronickel grade followed a reverse variation and decreased when more excess coal
was added. Ferronickel grade can be defined as:
𝐹𝑒𝑟𝑟𝑜𝑛𝑖𝑐𝑘𝑒𝑙 𝑔𝑟𝑎𝑑𝑒 (𝑤𝑡. %) = 𝑁𝑖 𝑐𝑜𝑛𝑡𝑒𝑛𝑡 (𝑔)
𝐹𝑒𝑟𝑟𝑜𝑛𝑖𝑐𝑘𝑒𝑙 𝑤𝑒𝑖𝑔ℎ𝑡 (𝑔)× 100 (E4-5)
Considering that nickel was reduced more easily than iron, it could be assumed that
nearly all of the nickel in the ore entered the ferronickel. This idea can be supported
by calculating the nickel content of the ferronickel products. The nickel content was
calculated straightforwardly by multiplying Ni wt.% and weight of the ferronickel.
There was an almost constant amount (about 0.63 g) of nickel in the ferronickel
products. Since the nickel content did not vary, ferronickel grade was predominantly
related to the ferronickel weight. A decrease in the weight of the ferronickel led to the
corresponding increase in the ferronickel grade and vice versa.
Figure 4-48. Effect of coal on the grade and weight of the ferronickel product.
Since nickel and iron formed the majority of the ferronickel, and since nickel amount
in the ferronickel was almost constant, a heavier ferronickel reflected an increased iron
oxide reduction. Therefore, the quantity of coal controls the degree of reduction of
iron oxide thereby determining the ferronickel grade.
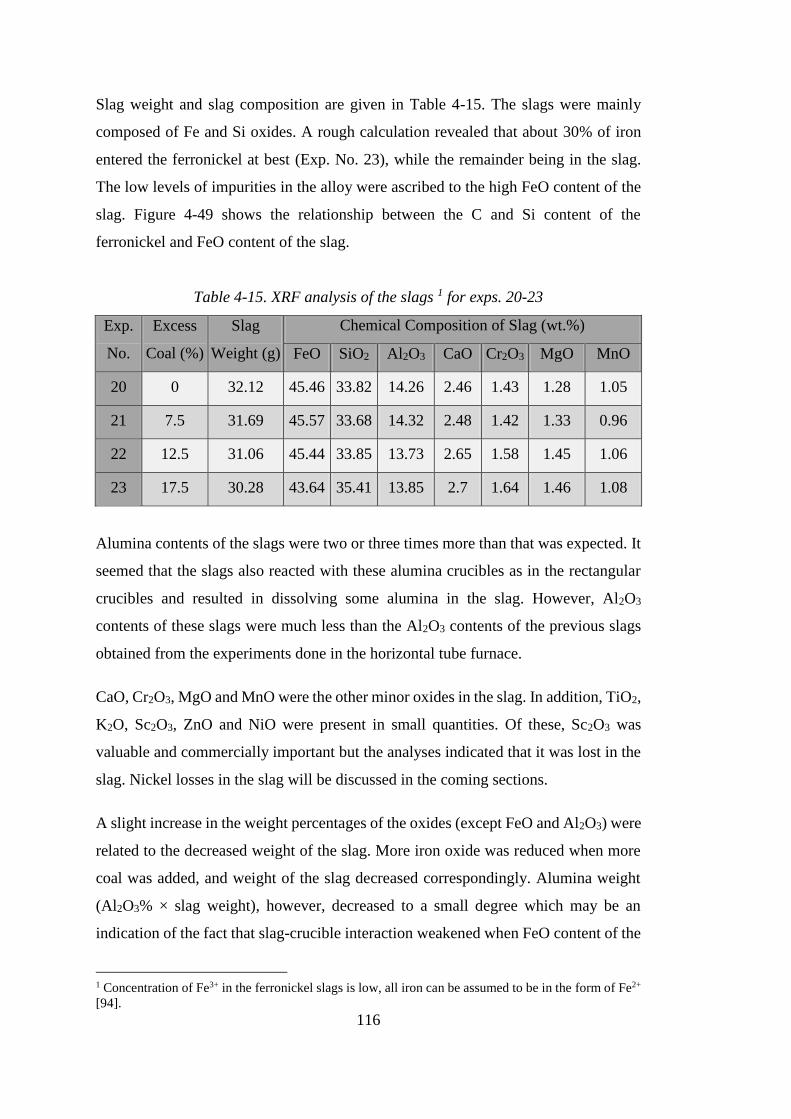
116
Slag weight and slag composition are given in Table 4-15. The slags were mainly
composed of Fe and Si oxides. A rough calculation revealed that about 30% of iron
entered the ferronickel at best (Exp. No. 23), while the remainder being in the slag.
The low levels of impurities in the alloy were ascribed to the high FeO content of the
slag. Figure 4-49 shows the relationship between the C and Si content of the
ferronickel and FeO content of the slag.
Table 4-15. XRF analysis of the slags 1 for exps. 20-23
Exp.
No.
Excess
Coal (%)
Slag
Weight (g)
Chemical Composition of Slag (wt.%)
FeO SiO2 Al2O3 CaO Cr2O3 MgO MnO
20 0 32.12 45.46 33.82 14.26 2.46 1.43 1.28 1.05
21 7.5 31.69 45.57 33.68 14.32 2.48 1.42 1.33 0.96
22 12.5 31.06 45.44 33.85 13.73 2.65 1.58 1.45 1.06
23 17.5 30.28 43.64 35.41 13.85 2.7 1.64 1.46 1.08
Alumina contents of the slags were two or three times more than that was expected. It
seemed that the slags also reacted with these alumina crucibles as in the rectangular
crucibles and resulted in dissolving some alumina in the slag. However, Al2O3
contents of these slags were much less than the Al2O3 contents of the previous slags
obtained from the experiments done in the horizontal tube furnace.
CaO, Cr2O3, MgO and MnO were the other minor oxides in the slag. In addition, TiO2,
K2O, Sc2O3, ZnO and NiO were present in small quantities. Of these, Sc2O3 was
valuable and commercially important but the analyses indicated that it was lost in the
slag. Nickel losses in the slag will be discussed in the coming sections.
A slight increase in the weight percentages of the oxides (except FeO and Al2O3) were
related to the decreased weight of the slag. More iron oxide was reduced when more
coal was added, and weight of the slag decreased correspondingly. Alumina weight
(Al2O3% × slag weight), however, decreased to a small degree which may be an
indication of the fact that slag-crucible interaction weakened when FeO content of the
1 Concentration of Fe3+ in the ferronickel slags is low, all iron can be assumed to be in the form of Fe2+
[94].

117
slag decreased. A similar result was obtained from the experiments done in the
horizontal tube furnace.
Figure 4-49. (a) C and (b) Si contents of ferronickel vs. FeO in slag (adapted from
[16]).
4.4.2.1.2 Microstructure of Slags
Microstructure of the solidified slag is shown in Fig. 4-50-a. The slag was composed
of three different phases with some entrapped ferronickel particles inside. The three
phases included a dark grey matrix, light grey strips and a dendritic phase. A closer
look (Fig. 4-50-b) revealed that, in most of the cases, the dendritic phase was
composed of fine particles of regular shapes. The dark background, the light grey
strips and the regular phase are labeled on Fig. 4-50-b with the numbers 1, 2 and 3,
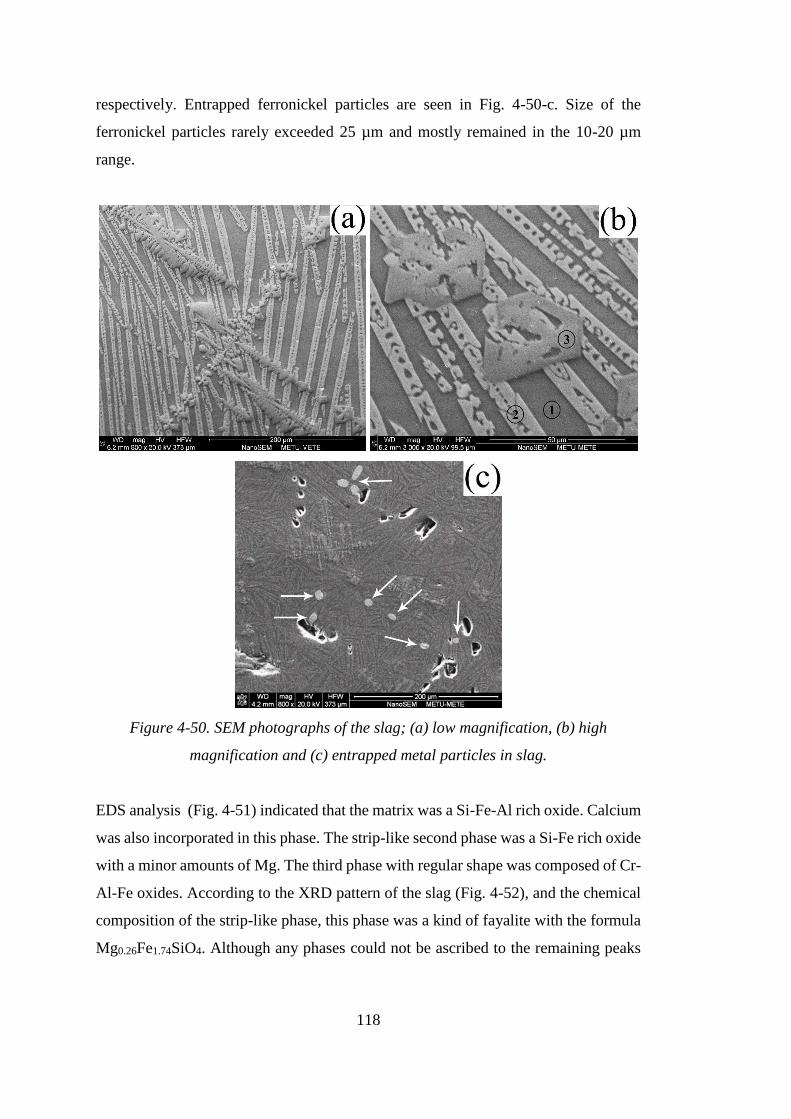
118
respectively. Entrapped ferronickel particles are seen in Fig. 4-50-c. Size of the
ferronickel particles rarely exceeded 25 µm and mostly remained in the 10-20 µm
range.
Figure 4-50. SEM photographs of the slag; (a) low magnification, (b) high
magnification and (c) entrapped metal particles in slag.
EDS analysis (Fig. 4-51) indicated that the matrix was a Si-Fe-Al rich oxide. Calcium
was also incorporated in this phase. The strip-like second phase was a Si-Fe rich oxide
with a minor amounts of Mg. The third phase with regular shape was composed of Cr-
Al-Fe oxides. According to the XRD pattern of the slag (Fig. 4-52), and the chemical
composition of the strip-like phase, this phase was a kind of fayalite with the formula
Mg0.26Fe1.74SiO4. Although any phases could not be ascribed to the remaining peaks
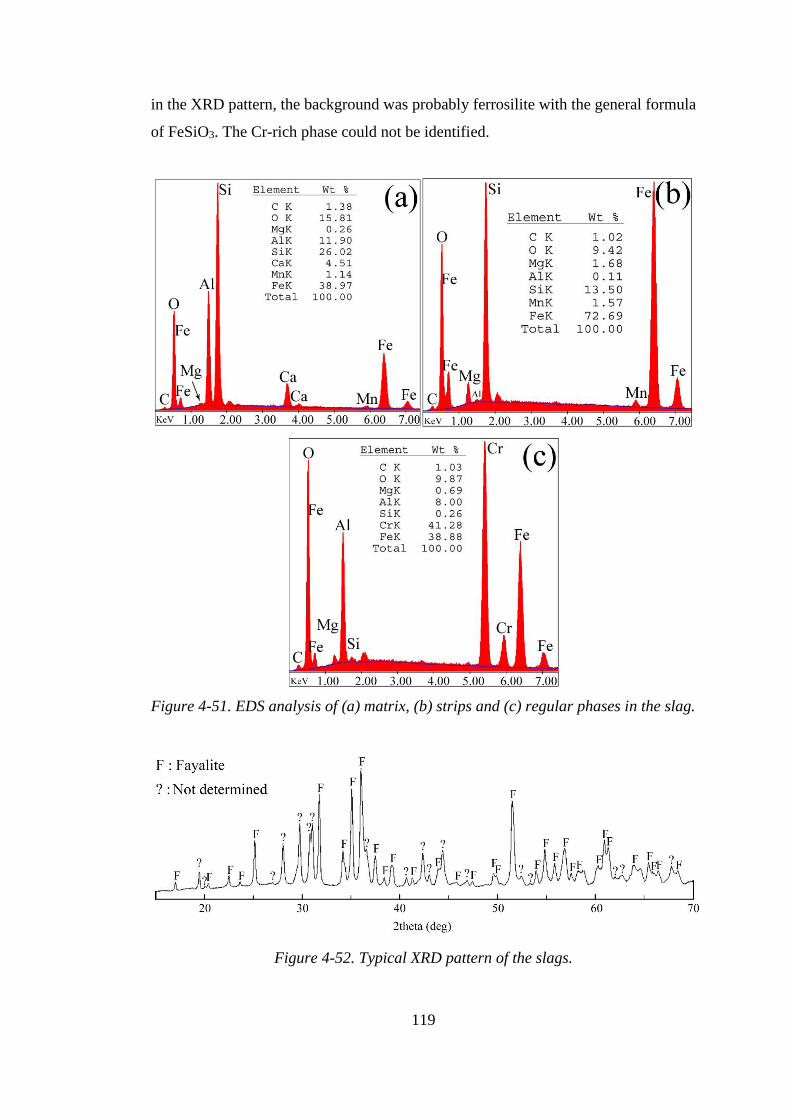
119
in the XRD pattern, the background was probably ferrosilite with the general formula
of FeSiO3. The Cr-rich phase could not be identified.
Figure 4-51. EDS analysis of (a) matrix, (b) strips and (c) regular phases in the slag.
Figure 4-52. Typical XRD pattern of the slags.
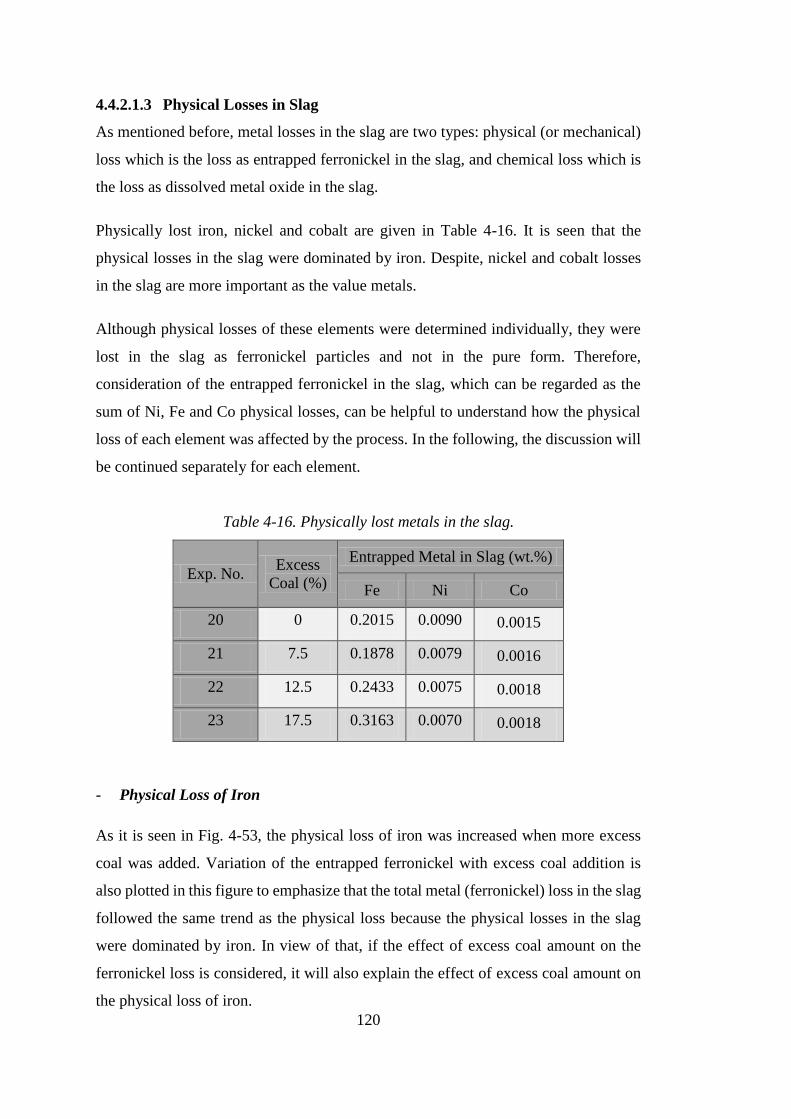
120
4.4.2.1.3 Physical Losses in Slag
As mentioned before, metal losses in the slag are two types: physical (or mechanical)
loss which is the loss as entrapped ferronickel in the slag, and chemical loss which is
the loss as dissolved metal oxide in the slag.
Physically lost iron, nickel and cobalt are given in Table 4-16. It is seen that the
physical losses in the slag were dominated by iron. Despite, nickel and cobalt losses
in the slag are more important as the value metals.
Although physical losses of these elements were determined individually, they were
lost in the slag as ferronickel particles and not in the pure form. Therefore,
consideration of the entrapped ferronickel in the slag, which can be regarded as the
sum of Ni, Fe and Co physical losses, can be helpful to understand how the physical
loss of each element was affected by the process. In the following, the discussion will
be continued separately for each element.
Table 4-16. Physically lost metals in the slag.
Exp. No. Excess
Coal (%)
Entrapped Metal in Slag (wt.%)
Fe Ni Co
20 0 0.2015 0.0090 0.0015
21 7.5 0.1878 0.0079 0.0016
22 12.5 0.2433 0.0075 0.0018
23 17.5 0.3163 0.0070 0.0018
- Physical Loss of Iron
As it is seen in Fig. 4-53, the physical loss of iron was increased when more excess
coal was added. Variation of the entrapped ferronickel with excess coal addition is
also plotted in this figure to emphasize that the total metal (ferronickel) loss in the slag
followed the same trend as the physical loss because the physical losses in the slag
were dominated by iron. In view of that, if the effect of excess coal amount on the
ferronickel loss is considered, it will also explain the effect of excess coal amount on
the physical loss of iron.
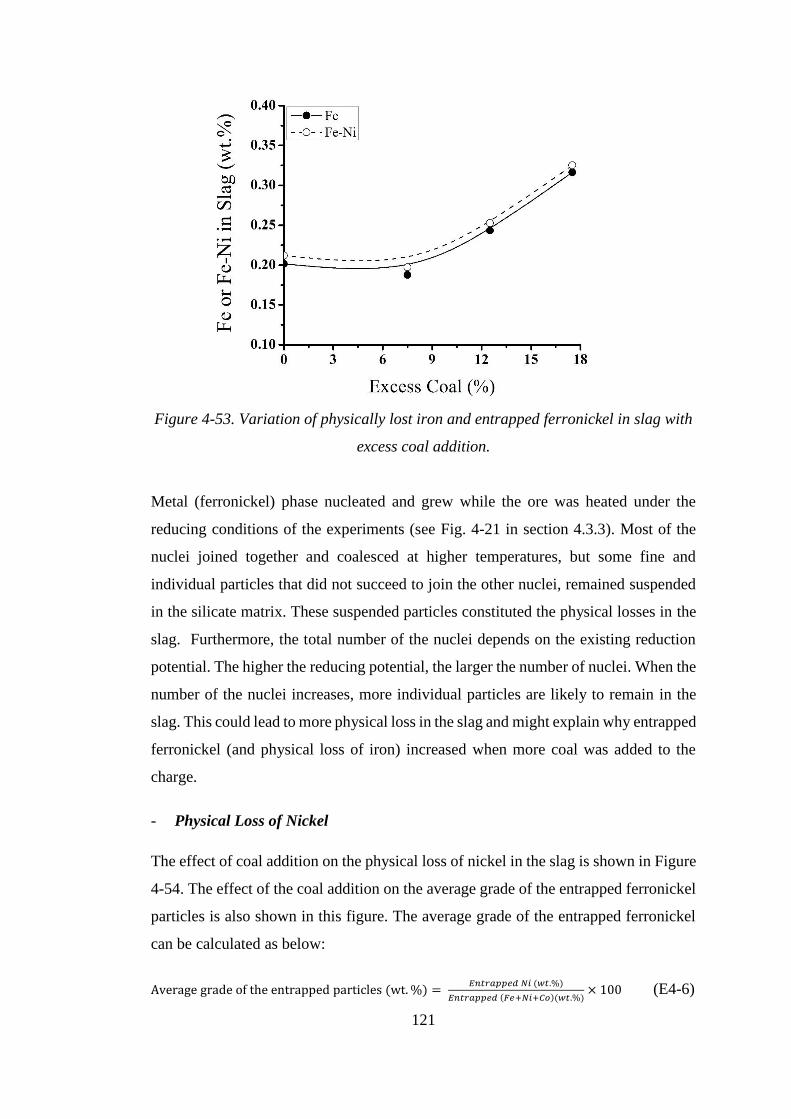
121
Figure 4-53. Variation of physically lost iron and entrapped ferronickel in slag with
excess coal addition.
Metal (ferronickel) phase nucleated and grew while the ore was heated under the
reducing conditions of the experiments (see Fig. 4-21 in section 4.3.3). Most of the
nuclei joined together and coalesced at higher temperatures, but some fine and
individual particles that did not succeed to join the other nuclei, remained suspended
in the silicate matrix. These suspended particles constituted the physical losses in the
slag. Furthermore, the total number of the nuclei depends on the existing reduction
potential. The higher the reducing potential, the larger the number of nuclei. When the
number of the nuclei increases, more individual particles are likely to remain in the
slag. This could lead to more physical loss in the slag and might explain why entrapped
ferronickel (and physical loss of iron) increased when more coal was added to the
charge.
- Physical Loss of Nickel
The effect of coal addition on the physical loss of nickel in the slag is shown in Figure
4-54. The effect of the coal addition on the average grade of the entrapped ferronickel
particles is also shown in this figure. The average grade of the entrapped ferronickel
can be calculated as below:
Average grade of the entrapped particles (wt. %) = 𝐸𝑛𝑡𝑟𝑎𝑝𝑝𝑒𝑑 𝑁𝑖 (𝑤𝑡.%)
𝐸𝑛𝑡𝑟𝑎𝑝𝑝𝑒𝑑 (𝐹𝑒+𝑁𝑖+𝐶𝑜)(𝑤𝑡.%)× 100 (E4-6)

122
Figure 4-54. Variation of physically lost nickel and grade of the entrapped
ferronickel in slag with excess coal addition.
It is clearly seen that the physical loss of nickel in the slag and the grade of the
entrapped ferronickel followed comparable changes and both decreased when more
excess coal was added. In fact, a decrease in the average grade of the entrapped
ferronickel resulted in the lower physical loss of nickel. In addition, when this figure
is compared with Fig. 4-48, it is seen that the grade of the ferronickel product and the
average grade of the entrapped ferronickel changed in the same manner. It may be
concluded that a decrease in the grade of the ferronickel product accompanied with
the corresponding decrease in the average grade of the entrapped ferronickel and
physical loss of nickel.
- Physical Loss of Cobalt
Physical loss of cobalt was very low and was not much affected by the coal amount as
it varied within a few ppm (see Table 4-16). This was attributed to the low
concentration of cobalt in the ferronickel products.
4.4.2.1.4 Chemical Losses in Slag
Chemical losses of nickel and cobalt decreased with increasing coal addition as
illustrated in Fig. 4-55. Metal (ferronickel) and slag were assumed to be at equilibrium.
Therefore, the activity of a component in the slag should equate its activity in the metal
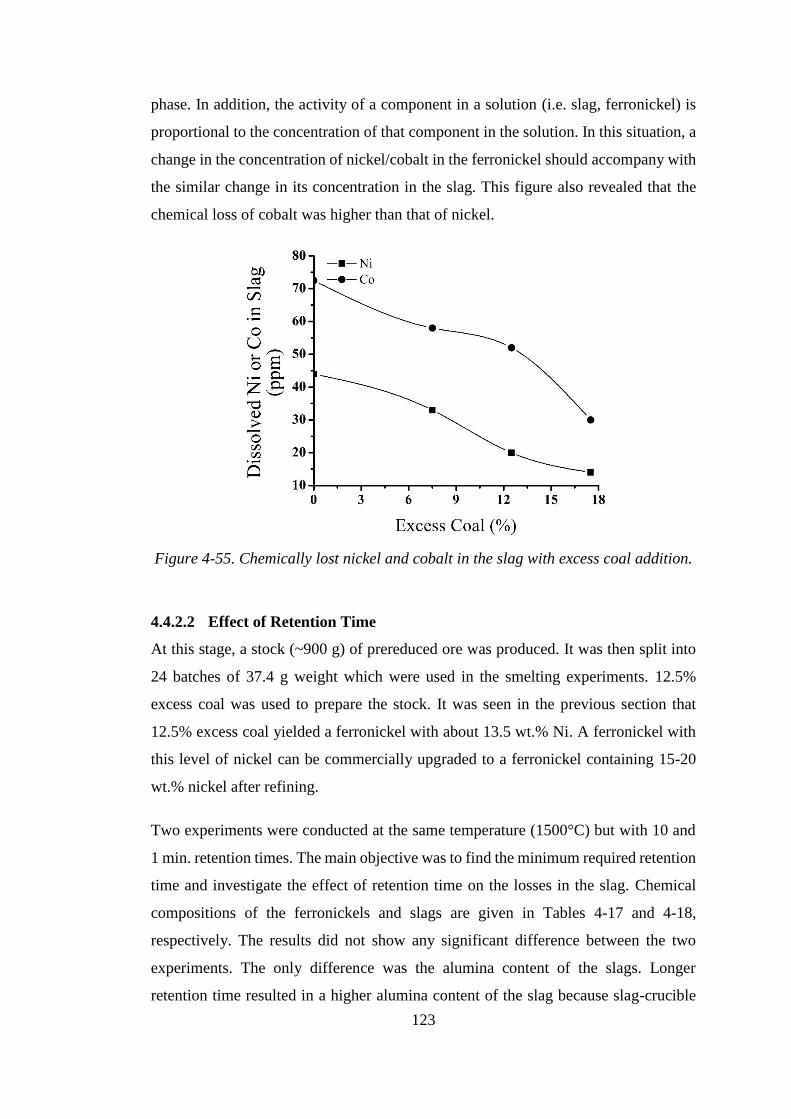
123
phase. In addition, the activity of a component in a solution (i.e. slag, ferronickel) is
proportional to the concentration of that component in the solution. In this situation, a
change in the concentration of nickel/cobalt in the ferronickel should accompany with
the similar change in its concentration in the slag. This figure also revealed that the
chemical loss of cobalt was higher than that of nickel.
Figure 4-55. Chemically lost nickel and cobalt in the slag with excess coal addition.
4.4.2.2 Effect of Retention Time
At this stage, a stock (~900 g) of prereduced ore was produced. It was then split into
24 batches of 37.4 g weight which were used in the smelting experiments. 12.5%
excess coal was used to prepare the stock. It was seen in the previous section that
12.5% excess coal yielded a ferronickel with about 13.5 wt.% Ni. A ferronickel with
this level of nickel can be commercially upgraded to a ferronickel containing 15-20
wt.% nickel after refining.
Two experiments were conducted at the same temperature (1500°C) but with 10 and
1 min. retention times. The main objective was to find the minimum required retention
time and investigate the effect of retention time on the losses in the slag. Chemical
compositions of the ferronickels and slags are given in Tables 4-17 and 4-18,
respectively. The results did not show any significant difference between the two
experiments. The only difference was the alumina content of the slags. Longer
retention time resulted in a higher alumina content of the slag because slag-crucible
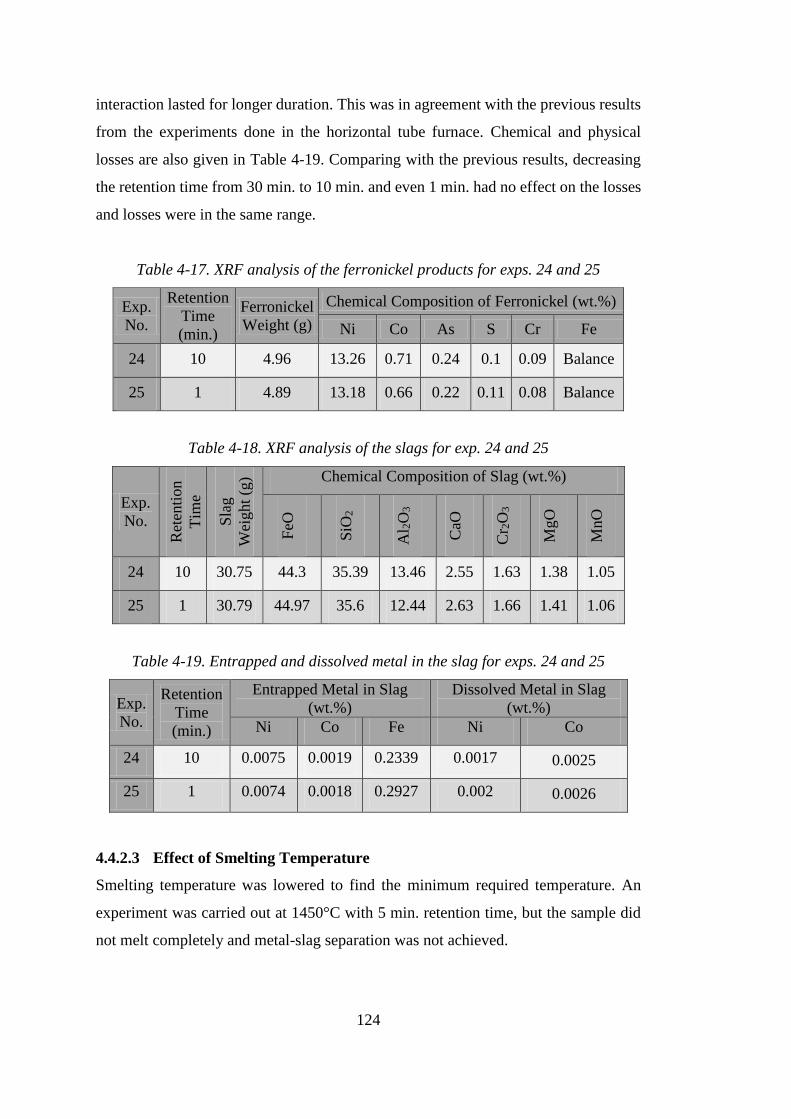
124
interaction lasted for longer duration. This was in agreement with the previous results
from the experiments done in the horizontal tube furnace. Chemical and physical
losses are also given in Table 4-19. Comparing with the previous results, decreasing
the retention time from 30 min. to 10 min. and even 1 min. had no effect on the losses
and losses were in the same range.
Table 4-17. XRF analysis of the ferronickel products for exps. 24 and 25
Exp.
No.
Retention
Time
(min.)
Ferronickel
Weight (g)
Chemical Composition of Ferronickel (wt.%)
Ni Co As S Cr Fe
24 10 4.96 13.26 0.71 0.24 0.1 0.09 Balance
25 1 4.89 13.18 0.66 0.22 0.11 0.08 Balance
Table 4-18. XRF analysis of the slags for exp. 24 and 25
Exp.
No.
Ret
enti
on
Tim
e
(min
.)
Sla
g
Wei
ght
(g) Chemical Composition of Slag (wt.%)
FeO
SiO
2
Al 2
O3
CaO
Cr 2
O3
MgO
MnO
24 10 30.75 44.3 35.39 13.46 2.55 1.63 1.38 1.05
25 1 30.79 44.97 35.6 12.44 2.63 1.66 1.41 1.06
Table 4-19. Entrapped and dissolved metal in the slag for exps. 24 and 25
Exp.
No.
Retention
Time
(min.)
Entrapped Metal in Slag
(wt.%)
Dissolved Metal in Slag
(wt.%)
Ni Co Fe Ni Co
24 10 0.0075 0.0019 0.2339 0.0017 0.0025
25 1 0.0074 0.0018 0.2927 0.002 0.0026
4.4.2.3 Effect of Smelting Temperature
Smelting temperature was lowered to find the minimum required temperature. An
experiment was carried out at 1450°C with 5 min. retention time, but the sample did
not melt completely and metal-slag separation was not achieved.
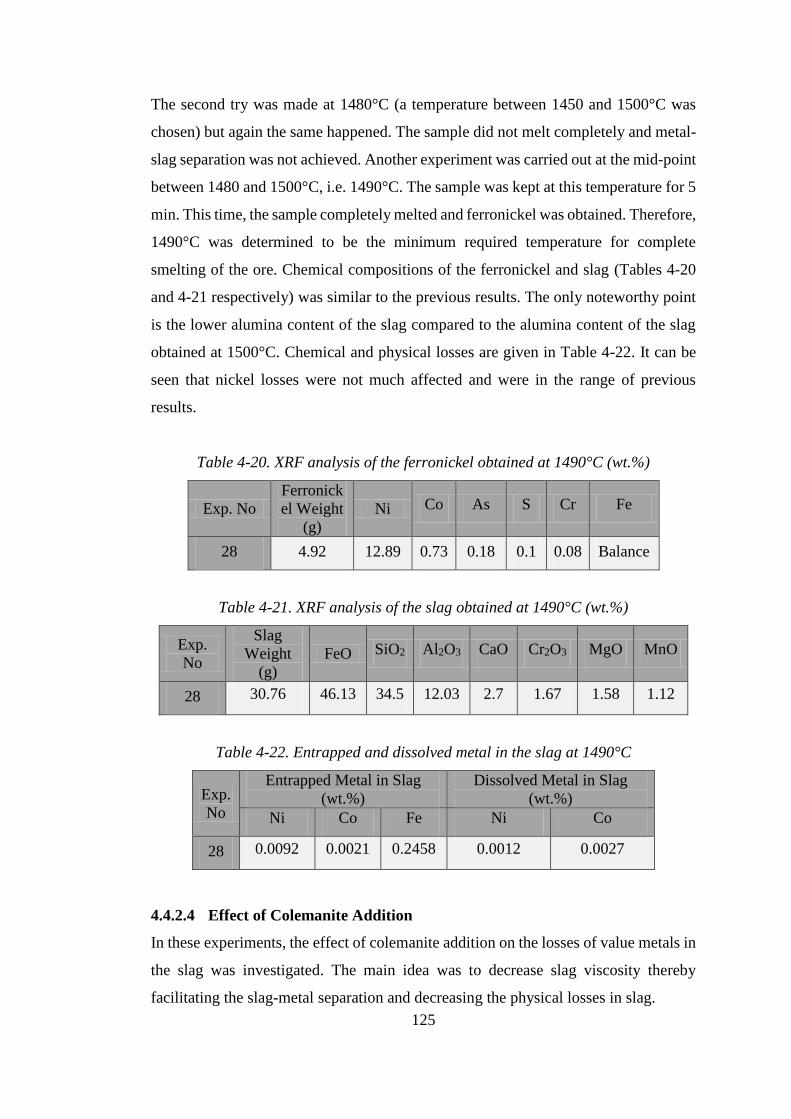
125
The second try was made at 1480°C (a temperature between 1450 and 1500°C was
chosen) but again the same happened. The sample did not melt completely and metal-
slag separation was not achieved. Another experiment was carried out at the mid-point
between 1480 and 1500°C, i.e. 1490°C. The sample was kept at this temperature for 5
min. This time, the sample completely melted and ferronickel was obtained. Therefore,
1490°C was determined to be the minimum required temperature for complete
smelting of the ore. Chemical compositions of the ferronickel and slag (Tables 4-20
and 4-21 respectively) was similar to the previous results. The only noteworthy point
is the lower alumina content of the slag compared to the alumina content of the slag
obtained at 1500°C. Chemical and physical losses are given in Table 4-22. It can be
seen that nickel losses were not much affected and were in the range of previous
results.
Table 4-20. XRF analysis of the ferronickel obtained at 1490°C (wt.%)
Exp. No
Ferronick
el Weight
(g)
Ni Co As S Cr Fe
28 4.92 12.89 0.73 0.18 0.1 0.08 Balance
Table 4-21. XRF analysis of the slag obtained at 1490°C (wt.%)
Exp.
No
Slag
Weight
(g)
FeO SiO2 Al2O3 CaO Cr2O3 MgO MnO
28 30.76 46.13 34.5 12.03 2.7 1.67 1.58 1.12
Table 4-22. Entrapped and dissolved metal in the slag at 1490°C
Exp.
No
Entrapped Metal in Slag
(wt.%)
Dissolved Metal in Slag
(wt.%)
Ni Co Fe Ni Co
28 0.0092 0.0021 0.2458 0.0012 0.0027
4.4.2.4 Effect of Colemanite Addition
In these experiments, the effect of colemanite addition on the losses of value metals in
the slag was investigated. The main idea was to decrease slag viscosity thereby
facilitating the slag-metal separation and decreasing the physical losses in slag.
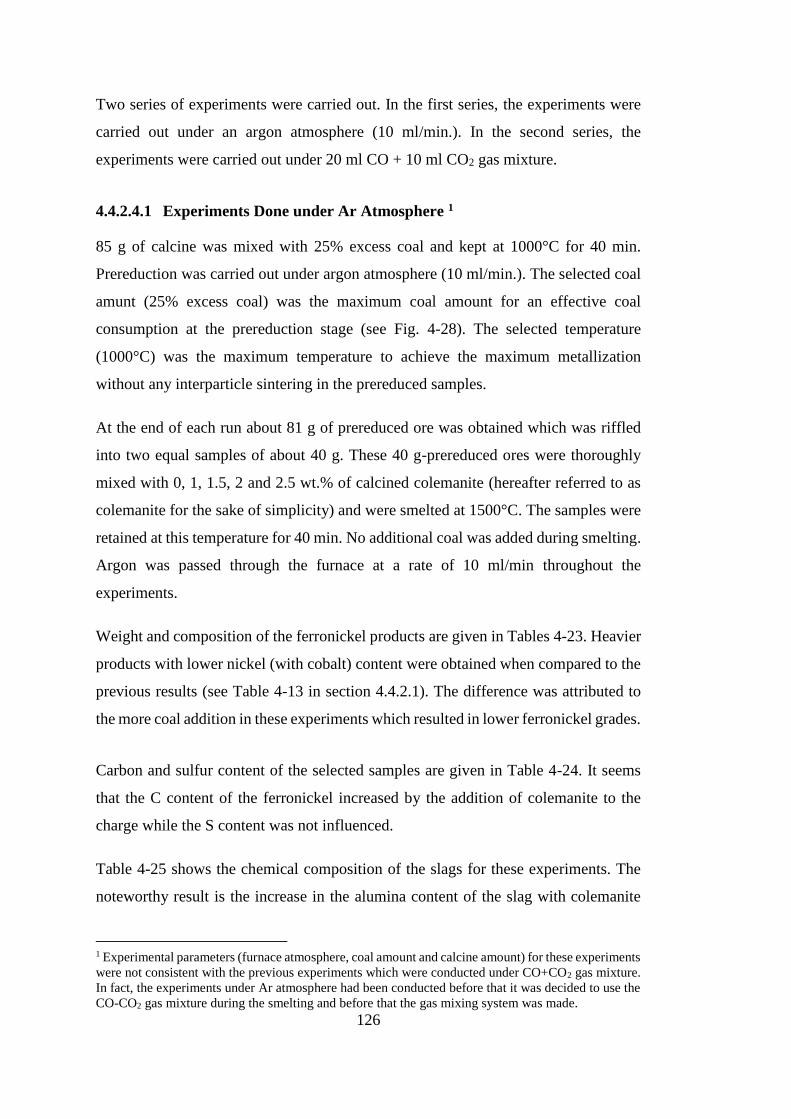
126
Two series of experiments were carried out. In the first series, the experiments were
carried out under an argon atmosphere (10 ml/min.). In the second series, the
experiments were carried out under 20 ml CO + 10 ml CO2 gas mixture.
4.4.2.4.1 Experiments Done under Ar Atmosphere 1
85 g of calcine was mixed with 25% excess coal and kept at 1000°C for 40 min.
Prereduction was carried out under argon atmosphere (10 ml/min.). The selected coal
amunt (25% excess coal) was the maximum coal amount for an effective coal
consumption at the prereduction stage (see Fig. 4-28). The selected temperature
(1000°C) was the maximum temperature to achieve the maximum metallization
without any interparticle sintering in the prereduced samples.
At the end of each run about 81 g of prereduced ore was obtained which was riffled
into two equal samples of about 40 g. These 40 g-prereduced ores were thoroughly
mixed with 0, 1, 1.5, 2 and 2.5 wt.% of calcined colemanite (hereafter referred to as
colemanite for the sake of simplicity) and were smelted at 1500°C. The samples were
retained at this temperature for 40 min. No additional coal was added during smelting.
Argon was passed through the furnace at a rate of 10 ml/min throughout the
experiments.
Weight and composition of the ferronickel products are given in Tables 4-23. Heavier
products with lower nickel (with cobalt) content were obtained when compared to the
previous results (see Table 4-13 in section 4.4.2.1). The difference was attributed to
the more coal addition in these experiments which resulted in lower ferronickel grades.
Carbon and sulfur content of the selected samples are given in Table 4-24. It seems
that the C content of the ferronickel increased by the addition of colemanite to the
charge while the S content was not influenced.
Table 4-25 shows the chemical composition of the slags for these experiments. The
noteworthy result is the increase in the alumina content of the slag with colemanite
1 Experimental parameters (furnace atmosphere, coal amount and calcine amount) for these experiments
were not consistent with the previous experiments which were conducted under CO+CO2 gas mixture.
In fact, the experiments under Ar atmosphere had been conducted before that it was decided to use the
CO-CO2 gas mixture during the smelting and before that the gas mixing system was made.
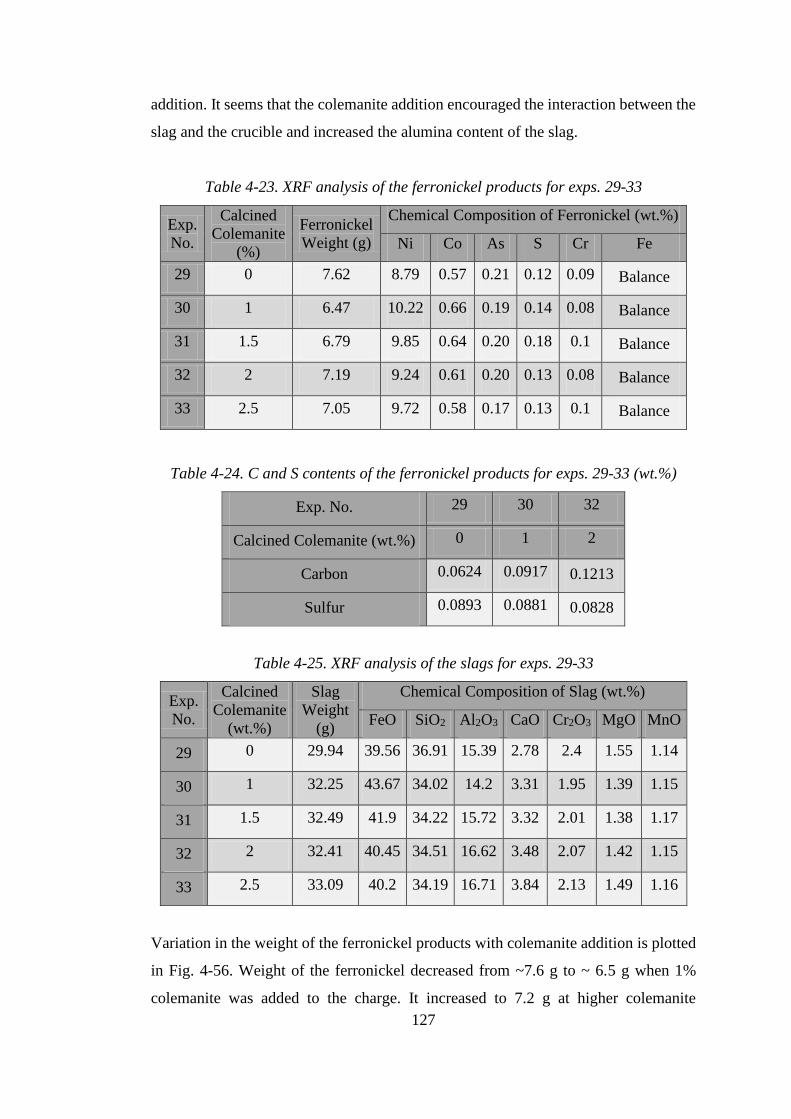
127
addition. It seems that the colemanite addition encouraged the interaction between the
slag and the crucible and increased the alumina content of the slag.
Table 4-23. XRF analysis of the ferronickel products for exps. 29-33
Exp.
No.
Calcined
Colemanite
(%)
Ferronickel
Weight (g)
Chemical Composition of Ferronickel (wt.%)
Ni Co As S Cr Fe
29 0 7.62 8.79 0.57 0.21 0.12 0.09 Balance
30 1 6.47 10.22 0.66 0.19 0.14 0.08 Balance
31 1.5 6.79 9.85 0.64 0.20 0.18 0.1 Balance
32 2 7.19 9.24 0.61 0.20 0.13 0.08 Balance
33 2.5 7.05 9.72 0.58 0.17 0.13 0.1 Balance
Table 4-24. C and S contents of the ferronickel products for exps. 29-33 (wt.%)
Exp. No. 29 30 32
Calcined Colemanite (wt.%) 0 1 2
Carbon 0.0624 0.0917 0.1213
Sulfur 0.0893 0.0881 0.0828
Table 4-25. XRF analysis of the slags for exps. 29-33
Exp.
No.
Calcined
Colemanite
(wt.%)
Slag
Weight
(g)
Chemical Composition of Slag (wt.%)
FeO SiO2 Al2O3 CaO Cr2O3 MgO MnO
29 0 29.94 39.56 36.91 15.39 2.78 2.4 1.55 1.14
30 1 32.25 43.67 34.02 14.2 3.31 1.95 1.39 1.15
31 1.5 32.49 41.9 34.22 15.72 3.32 2.01 1.38 1.17
32 2 32.41 40.45 34.51 16.62 3.48 2.07 1.42 1.15
33 2.5 33.09 40.2 34.19 16.71 3.84 2.13 1.49 1.16
Variation in the weight of the ferronickel products with colemanite addition is plotted
in Fig. 4-56. Weight of the ferronickel decreased from ~7.6 g to ~ 6.5 g when 1%
colemanite was added to the charge. It increased to 7.2 g at higher colemanite
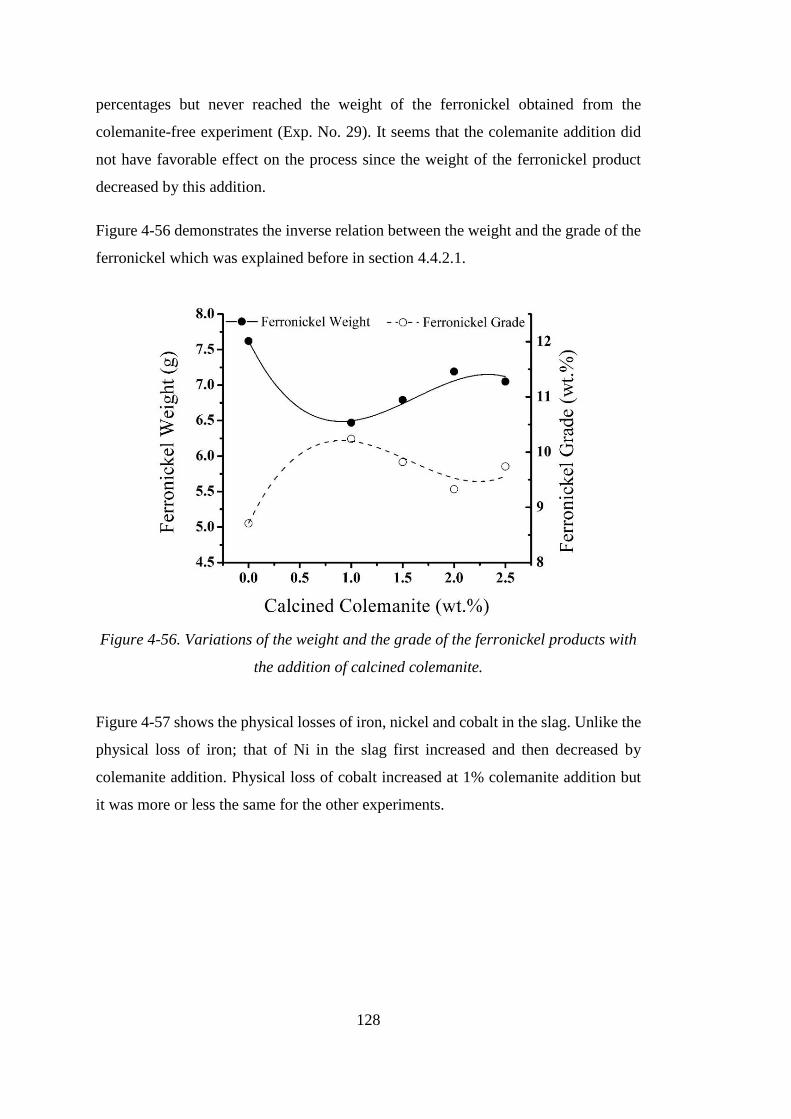
128
percentages but never reached the weight of the ferronickel obtained from the
colemanite-free experiment (Exp. No. 29). It seems that the colemanite addition did
not have favorable effect on the process since the weight of the ferronickel product
decreased by this addition.
Figure 4-56 demonstrates the inverse relation between the weight and the grade of the
ferronickel which was explained before in section 4.4.2.1.
Figure 4-56. Variations of the weight and the grade of the ferronickel products with
the addition of calcined colemanite.
Figure 4-57 shows the physical losses of iron, nickel and cobalt in the slag. Unlike the
physical loss of iron; that of Ni in the slag first increased and then decreased by
colemanite addition. Physical loss of cobalt increased at 1% colemanite addition but
it was more or less the same for the other experiments.
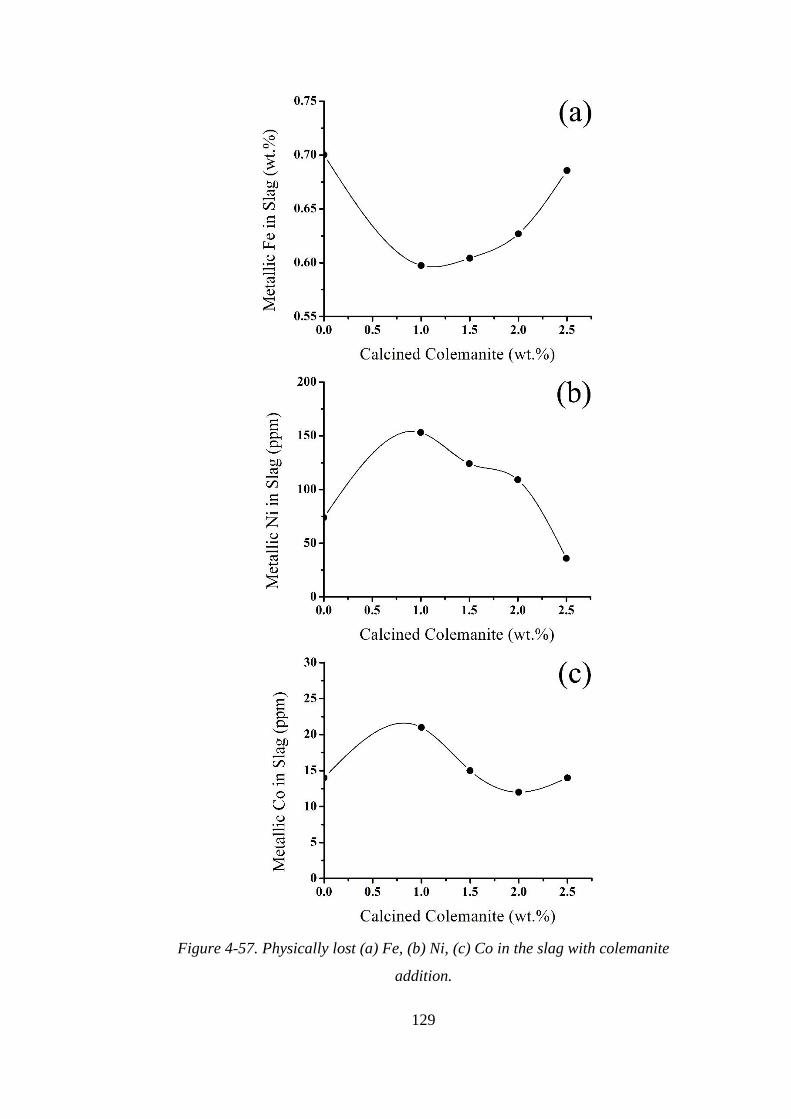
129
Figure 4-57. Physically lost (a) Fe, (b) Ni, (c) Co in the slag with colemanite
addition.
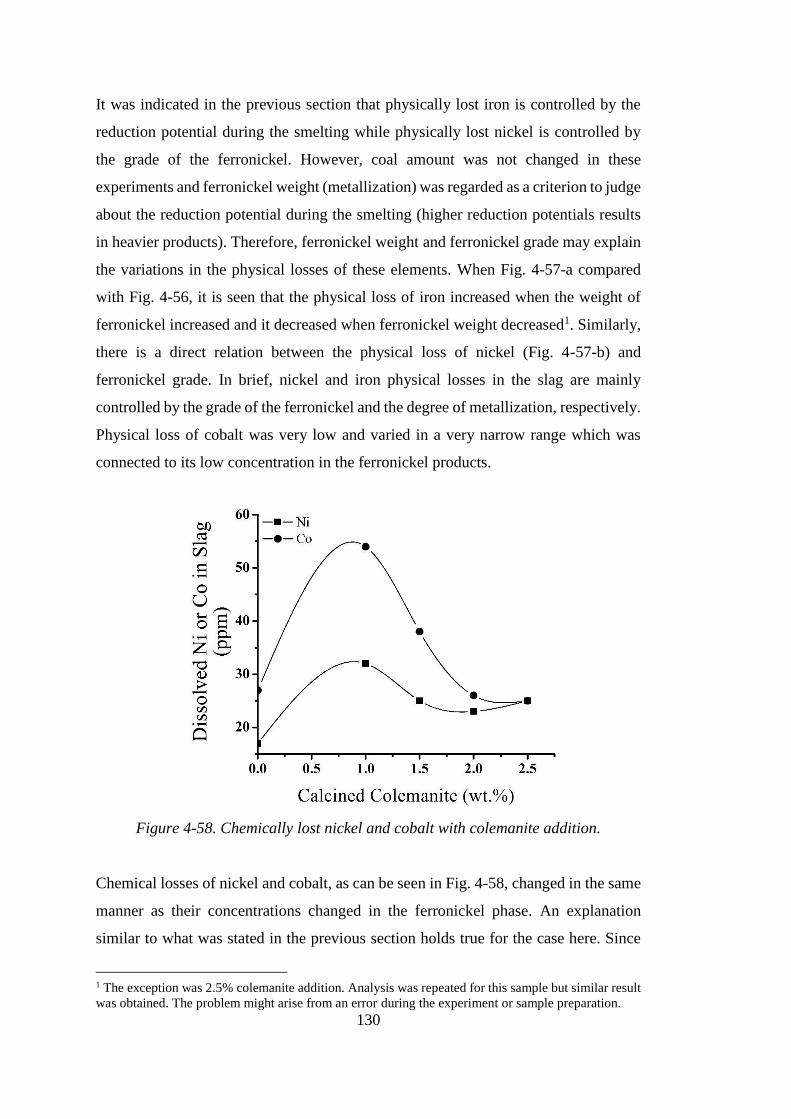
130
It was indicated in the previous section that physically lost iron is controlled by the
reduction potential during the smelting while physically lost nickel is controlled by
the grade of the ferronickel. However, coal amount was not changed in these
experiments and ferronickel weight (metallization) was regarded as a criterion to judge
about the reduction potential during the smelting (higher reduction potentials results
in heavier products). Therefore, ferronickel weight and ferronickel grade may explain
the variations in the physical losses of these elements. When Fig. 4-57-a compared
with Fig. 4-56, it is seen that the physical loss of iron increased when the weight of
ferronickel increased and it decreased when ferronickel weight decreased1. Similarly,
there is a direct relation between the physical loss of nickel (Fig. 4-57-b) and
ferronickel grade. In brief, nickel and iron physical losses in the slag are mainly
controlled by the grade of the ferronickel and the degree of metallization, respectively.
Physical loss of cobalt was very low and varied in a very narrow range which was
connected to its low concentration in the ferronickel products.
Figure 4-58. Chemically lost nickel and cobalt with colemanite addition.
Chemical losses of nickel and cobalt, as can be seen in Fig. 4-58, changed in the same
manner as their concentrations changed in the ferronickel phase. An explanation
similar to what was stated in the previous section holds true for the case here. Since
1 The exception was 2.5% colemanite addition. Analysis was repeated for this sample but similar result
was obtained. The problem might arise from an error during the experiment or sample preparation.
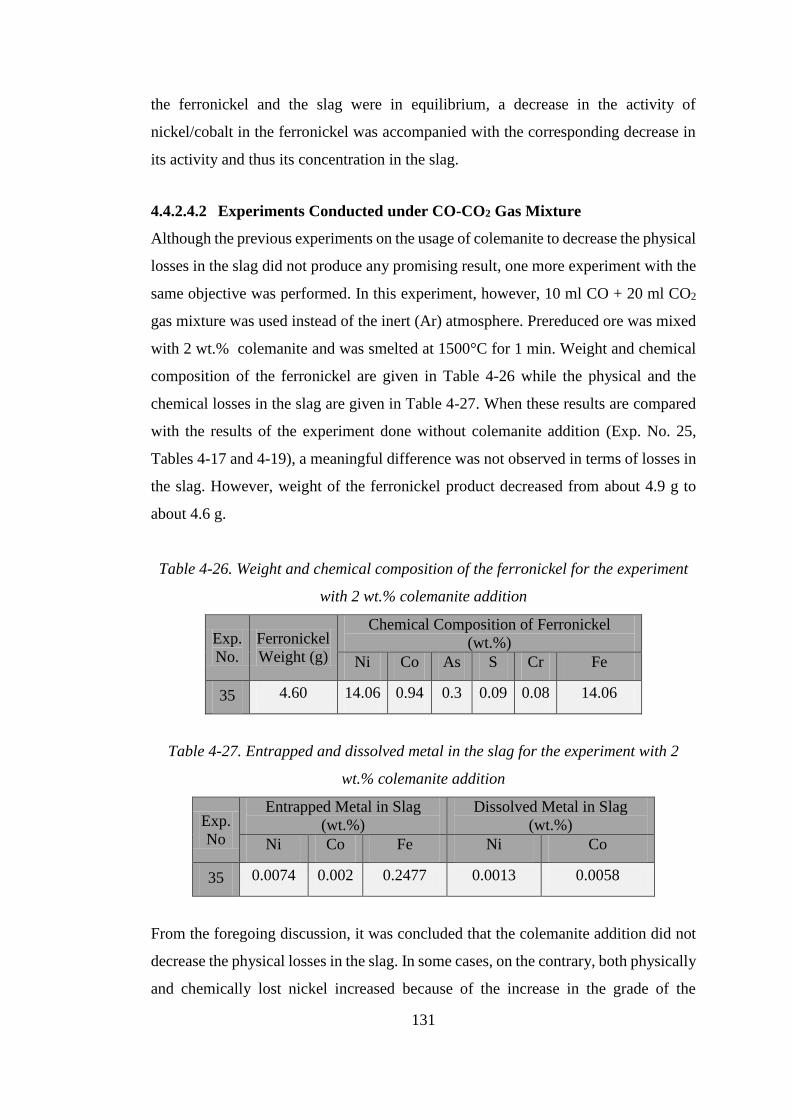
131
the ferronickel and the slag were in equilibrium, a decrease in the activity of
nickel/cobalt in the ferronickel was accompanied with the corresponding decrease in
its activity and thus its concentration in the slag.
4.4.2.4.2 Experiments Conducted under CO-CO2 Gas Mixture
Although the previous experiments on the usage of colemanite to decrease the physical
losses in the slag did not produce any promising result, one more experiment with the
same objective was performed. In this experiment, however, 10 ml CO + 20 ml CO2
gas mixture was used instead of the inert (Ar) atmosphere. Prereduced ore was mixed
with 2 wt.% colemanite and was smelted at 1500°C for 1 min. Weight and chemical
composition of the ferronickel are given in Table 4-26 while the physical and the
chemical losses in the slag are given in Table 4-27. When these results are compared
with the results of the experiment done without colemanite addition (Exp. No. 25,
Tables 4-17 and 4-19), a meaningful difference was not observed in terms of losses in
the slag. However, weight of the ferronickel product decreased from about 4.9 g to
about 4.6 g.
Table 4-26. Weight and chemical composition of the ferronickel for the experiment
with 2 wt.% colemanite addition
Exp.
No.
Ferronickel
Weight (g)
Chemical Composition of Ferronickel
(wt.%)
Ni Co As S Cr Fe
35 4.60 14.06 0.94 0.3 0.09 0.08 14.06
Table 4-27. Entrapped and dissolved metal in the slag for the experiment with 2
wt.% colemanite addition
Exp.
No
Entrapped Metal in Slag
(wt.%)
Dissolved Metal in Slag
(wt.%)
Ni Co Fe Ni Co
35 0.0074 0.002 0.2477 0.0013 0.0058
From the foregoing discussion, it was concluded that the colemanite addition did not
decrease the physical losses in the slag. In some cases, on the contrary, both physically
and chemically lost nickel increased because of the increase in the grade of the

132
ferronickel product. In view of that, it was decided to investigate the effect of
colemanite addition on the process temperature. A decreased process temperature
could lead to energy conservation in electric arc furnace.
The minimum temperature for a successful metal-slag separation had been previously
determined to be 1490°C. An experiment was carried out at 1480°C with 2 wt.%
colemanite addition in the charge to see whether the minimum operation temperature
(1490°C) could be decreased by the addition of colemanite or not. The sample was
kept for 5 min. at this temperature and 20 ml CO + 10 ml CO2 gas mixture was passed
through the furnace during the experiment. The sample did not melt completely
indicating that the colemanite addition did not decrease the process temperature even
by 10°C.
In all of the experiments either under Ar atmosphere or under CO/CO2 gas mixture,
colemanite addition did not revealed any beneficial effects on the process. Colemanite
addition decreased neither the physical losses in the slag nor the minimum required
smelting temperature. In all of the experiments, on the other hand, weight of the
ferronickel product was decreased by the addition of colemanite to the charge. It may
be concluded that the colemanite addition negatively affected the metallization
process.
4.4.2.4.3 Possible Effects of Colemanite Addition
The predominant effect of colemanite was decreasing the amount (weight) of the
ferronickel which, in turn, affected the ferronickel grade (the relation between the
weight and the grade of the ferronickel was explained previously). The preceding
discussions mainly focused on the indirect effect of colemanite addition by examining
the correlation between the ferronickel grade and losses in the slag. However, a critical
question arises when the direct effect of colemanite on the process is considered: Why
the ferronickel weight decreased by colemanite addition? Answering this question
could be challenging because colemanite addition influences the process in various
aspects. The following is the possible effects of colemanite addition in brief.
133
- Effect on viscosity
Ferronickel smelting from laterites yields a large volume of slag (10-15 times as much
as ferronickel weight) and thus, ferronickel droplets have to settle through a deep layer
of slag. Velocity of the settling droplets can be best expressed by the Stokes’ law [93]:
v =2
9×
𝑔𝑐×(𝑑𝑚𝑒𝑡𝑎𝑙−𝑑𝑠𝑙𝑎𝑔)×𝑟2
µ𝑠𝑙𝑎𝑔 (E4-7)
Where v is the settling velocity of the particle, µslag is slag viscosity, r is the radius of
the settling droplet and, gc is the gravitational acceleration, dmetal and dslag are densities
of the metal (ferronickel) and slag, respectively. For any given dmetal and dslag, the
settling velocity of a ferronickel droplet is inversely proportional to the slag viscosity.
In other words, for a given slag depth and settling time, if viscosity of the slag is
decreased, smaller metal droplets can travel through the slag and reach the metal pool.
A calculation based study [64] suggested that the colemanite addition decreased the
melting point and the viscosity of fayalitic slags. Based on this information,
colemanite addition was accepted to decrease the viscosity of the slag, thereby
facilitating the metal-slag separation and decreasing the physical losses in the slag.
Nevertheless, the experimental results implied that colemanite addition did not have
any beneficial effect on the process.
- Effect on slag composition
Colemanite is composed of CaO and B2O3, and its addition changed the compostion
content of the slag. Colemanite addition affected the alumina content of the slag as
well. It intensified the slag-crucible interaction and increased the alumina content of
the slag (see Table 4-25). Composition change influences the physical and chemical
properties of the slag. Figure 4-59 shows the photographs of the samples smelted
without any colemanite addition and with 2.5% colemanite addition. A solid
nonporous slag formed after solidification when no colemanite was added while there
were large shrinkage porosities after 2.5% colemanite addition indicating a change in
slag properties.
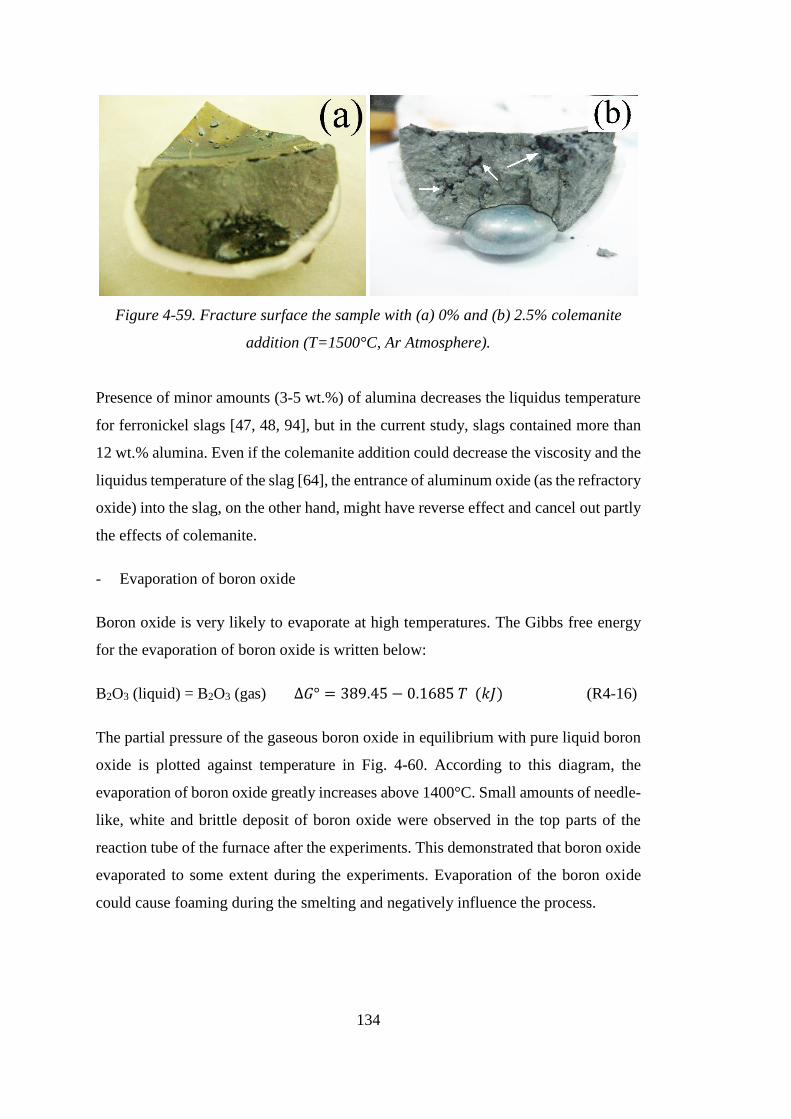
134
Figure 4-59. Fracture surface the sample with (a) 0% and (b) 2.5% colemanite
addition (T=1500°C, Ar Atmosphere).
Presence of minor amounts (3-5 wt.%) of alumina decreases the liquidus temperature
for ferronickel slags [47, 48, 94], but in the current study, slags contained more than
12 wt.% alumina. Even if the colemanite addition could decrease the viscosity and the
liquidus temperature of the slag [64], the entrance of aluminum oxide (as the refractory
oxide) into the slag, on the other hand, might have reverse effect and cancel out partly
the effects of colemanite.
- Evaporation of boron oxide
Boron oxide is very likely to evaporate at high temperatures. The Gibbs free energy
for the evaporation of boron oxide is written below:
B2O3 (liquid) = B2O3 (gas) ∆𝐺° = 389.45 − 0.1685 𝑇 (𝑘𝐽) (R4-16)
The partial pressure of the gaseous boron oxide in equilibrium with pure liquid boron
oxide is plotted against temperature in Fig. 4-60. According to this diagram, the
evaporation of boron oxide greatly increases above 1400°C. Small amounts of needle-
like, white and brittle deposit of boron oxide were observed in the top parts of the
reaction tube of the furnace after the experiments. This demonstrated that boron oxide
evaporated to some extent during the experiments. Evaporation of the boron oxide
could cause foaming during the smelting and negatively influence the process.
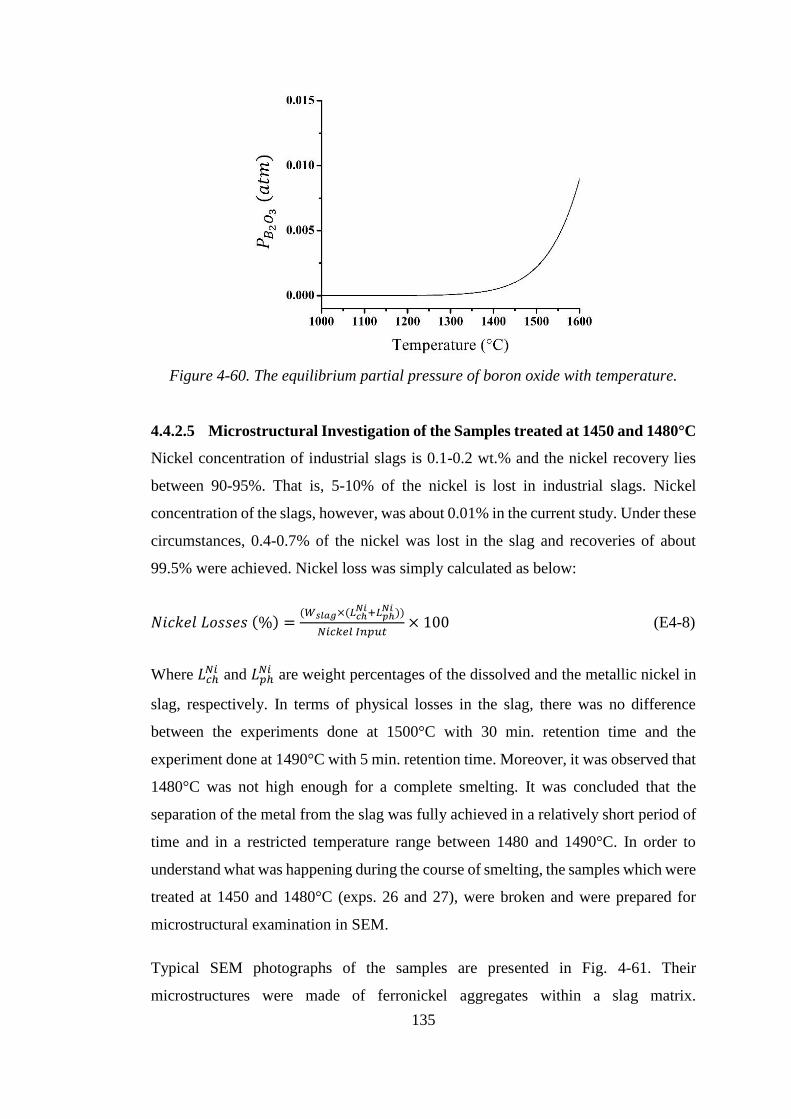
135
Figure 4-60. The equilibrium partial pressure of boron oxide with temperature.
4.4.2.5 Microstructural Investigation of the Samples treated at 1450 and 1480°C
Nickel concentration of industrial slags is 0.1-0.2 wt.% and the nickel recovery lies
between 90-95%. That is, 5-10% of the nickel is lost in industrial slags. Nickel
concentration of the slags, however, was about 0.01% in the current study. Under these
circumstances, 0.4-0.7% of the nickel was lost in the slag and recoveries of about
99.5% were achieved. Nickel loss was simply calculated as below:
𝑁𝑖𝑐𝑘𝑒𝑙 𝐿𝑜𝑠𝑠𝑒𝑠 (%) =(𝑊𝑠𝑙𝑎𝑔×(𝐿𝑐ℎ
𝑁𝑖+𝐿𝑝ℎ𝑁𝑖 ))
𝑁𝑖𝑐𝑘𝑒𝑙 𝐼𝑛𝑝𝑢𝑡× 100 (E4-8)
Where 𝐿𝑐ℎ𝑁𝑖 and 𝐿𝑝ℎ
𝑁𝑖 are weight percentages of the dissolved and the metallic nickel in
slag, respectively. In terms of physical losses in the slag, there was no difference
between the experiments done at 1500°C with 30 min. retention time and the
experiment done at 1490°C with 5 min. retention time. Moreover, it was observed that
1480°C was not high enough for a complete smelting. It was concluded that the
separation of the metal from the slag was fully achieved in a relatively short period of
time and in a restricted temperature range between 1480 and 1490°C. In order to
understand what was happening during the course of smelting, the samples which were
treated at 1450 and 1480°C (exps. 26 and 27), were broken and were prepared for
microstructural examination in SEM.
Typical SEM photographs of the samples are presented in Fig. 4-61. Their
microstructures were made of ferronickel aggregates within a slag matrix.
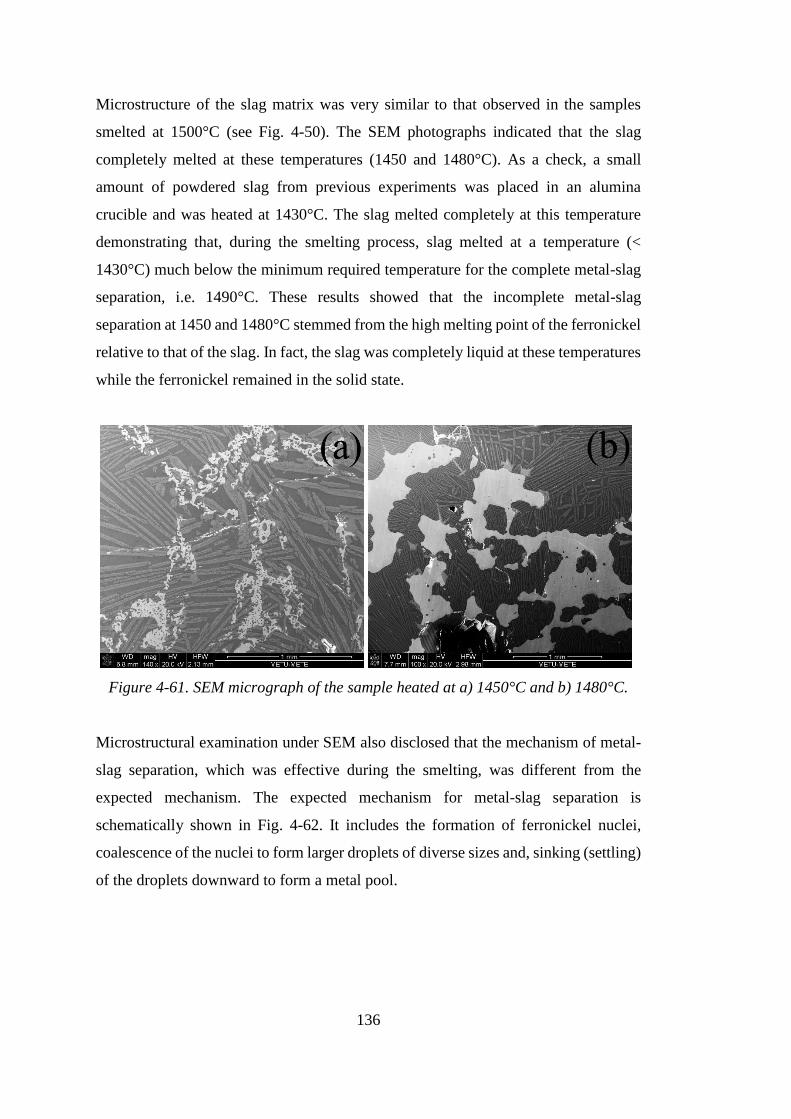
136
Microstructure of the slag matrix was very similar to that observed in the samples
smelted at 1500°C (see Fig. 4-50). The SEM photographs indicated that the slag
completely melted at these temperatures (1450 and 1480°C). As a check, a small
amount of powdered slag from previous experiments was placed in an alumina
crucible and was heated at 1430°C. The slag melted completely at this temperature
demonstrating that, during the smelting process, slag melted at a temperature (<
1430°C) much below the minimum required temperature for the complete metal-slag
separation, i.e. 1490°C. These results showed that the incomplete metal-slag
separation at 1450 and 1480°C stemmed from the high melting point of the ferronickel
relative to that of the slag. In fact, the slag was completely liquid at these temperatures
while the ferronickel remained in the solid state.
Figure 4-61. SEM micrograph of the sample heated at a) 1450°C and b) 1480°C.
Microstructural examination under SEM also disclosed that the mechanism of metal-
slag separation, which was effective during the smelting, was different from the
expected mechanism. The expected mechanism for metal-slag separation is
schematically shown in Fig. 4-62. It includes the formation of ferronickel nuclei,
coalescence of the nuclei to form larger droplets of diverse sizes and, sinking (settling)
of the droplets downward to form a metal pool.
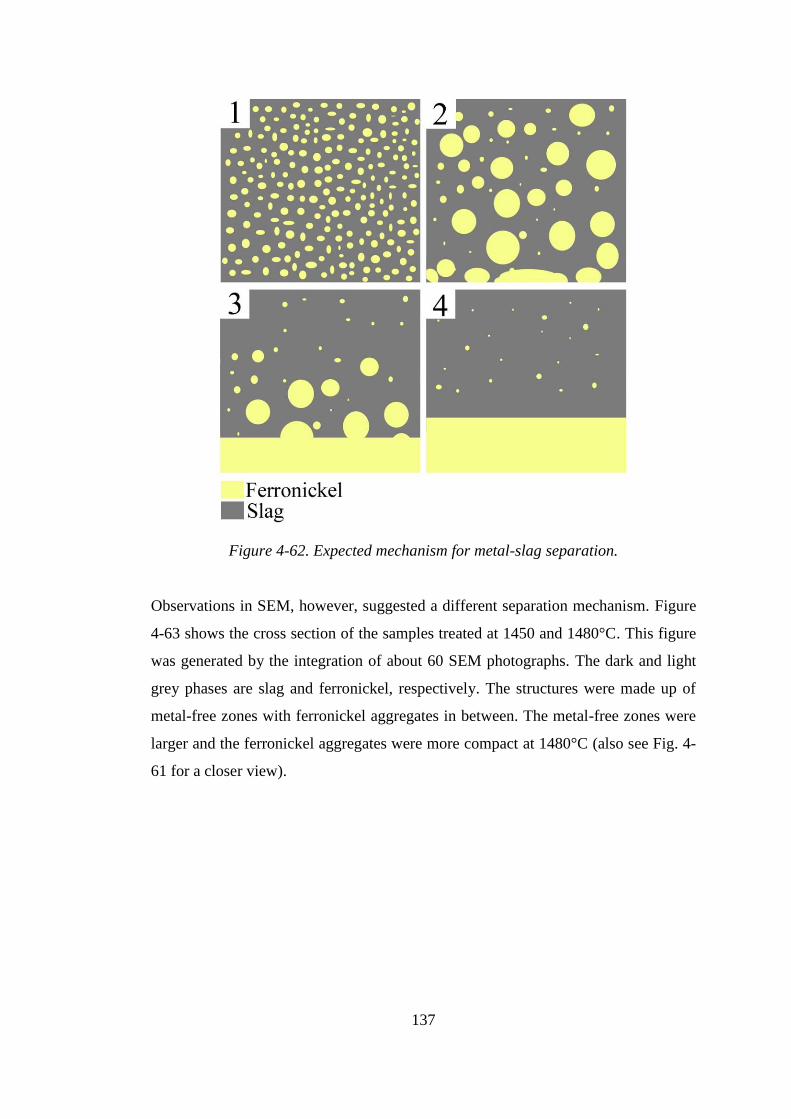
137
Figure 4-62. Expected mechanism for metal-slag separation.
Observations in SEM, however, suggested a different separation mechanism. Figure
4-63 shows the cross section of the samples treated at 1450 and 1480°C. This figure
was generated by the integration of about 60 SEM photographs. The dark and light
grey phases are slag and ferronickel, respectively. The structures were made up of
metal-free zones with ferronickel aggregates in between. The metal-free zones were
larger and the ferronickel aggregates were more compact at 1480°C (also see Fig. 4-
61 for a closer view).
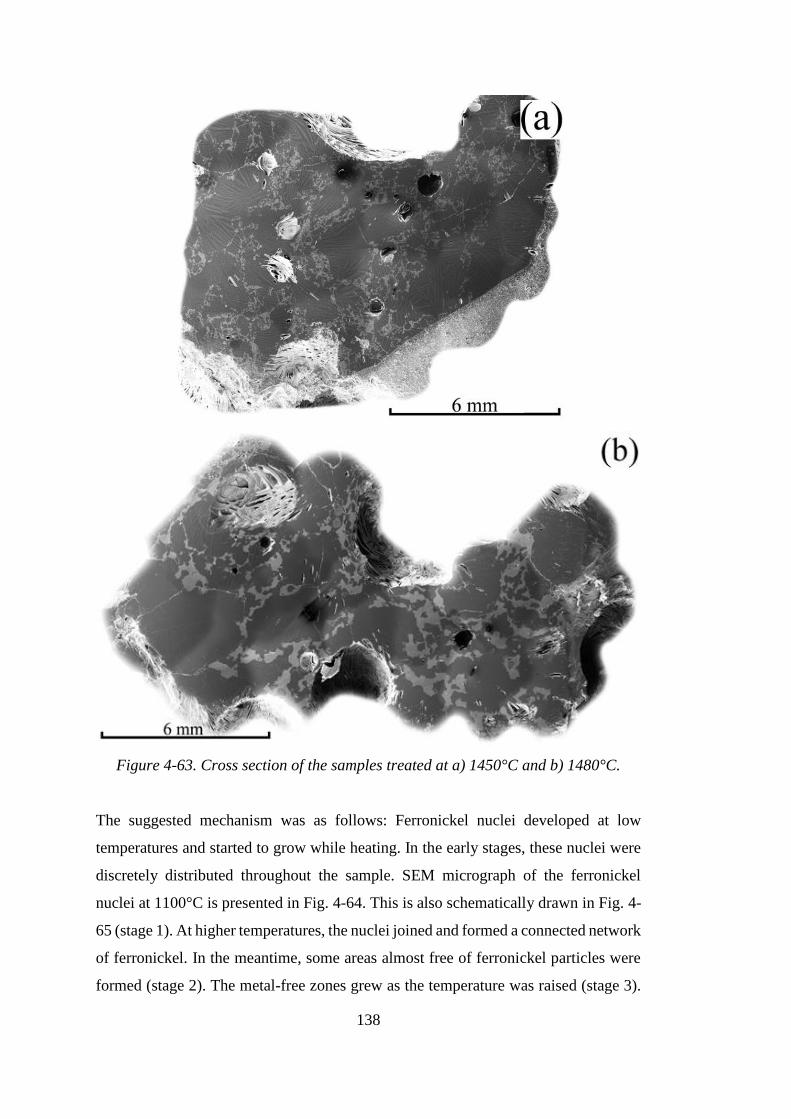
138
Figure 4-63. Cross section of the samples treated at a) 1450°C and b) 1480°C.
The suggested mechanism was as follows: Ferronickel nuclei developed at low
temperatures and started to grow while heating. In the early stages, these nuclei were
discretely distributed throughout the sample. SEM micrograph of the ferronickel
nuclei at 1100°C is presented in Fig. 4-64. This is also schematically drawn in Fig. 4-
65 (stage 1). At higher temperatures, the nuclei joined and formed a connected network
of ferronickel. In the meantime, some areas almost free of ferronickel particles were
formed (stage 2). The metal-free zones grew as the temperature was raised (stage 3).
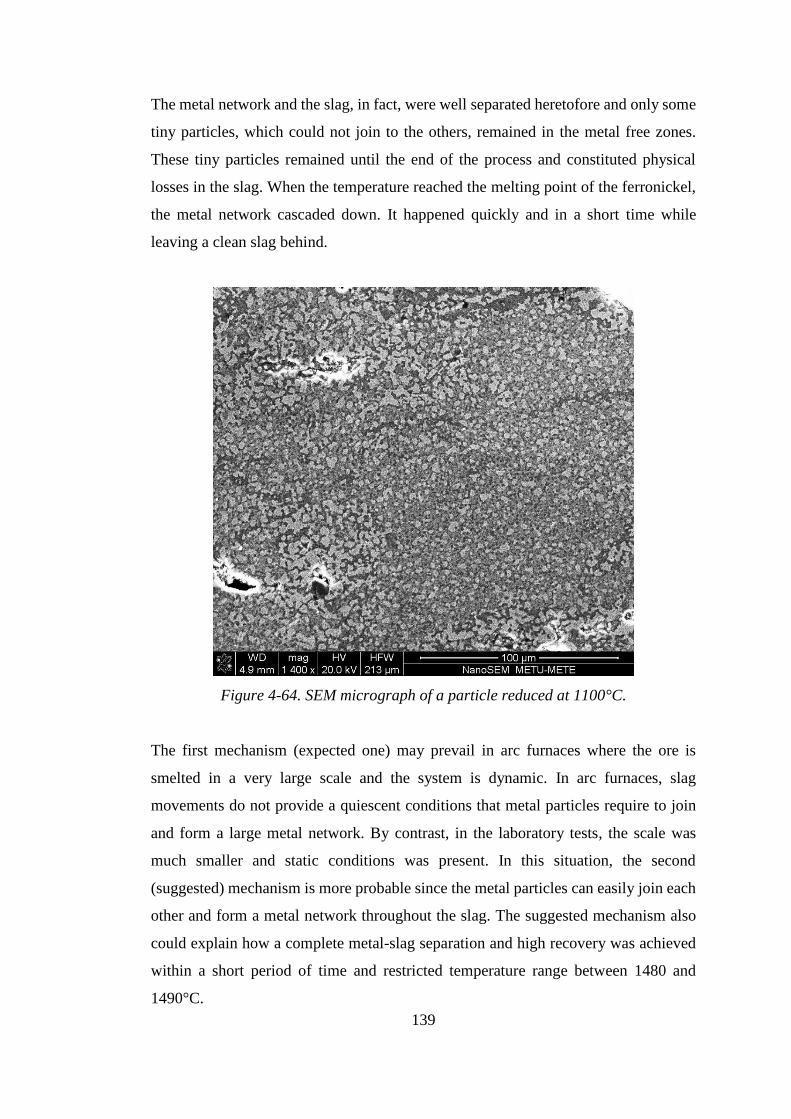
139
The metal network and the slag, in fact, were well separated heretofore and only some
tiny particles, which could not join to the others, remained in the metal free zones.
These tiny particles remained until the end of the process and constituted physical
losses in the slag. When the temperature reached the melting point of the ferronickel,
the metal network cascaded down. It happened quickly and in a short time while
leaving a clean slag behind.
Figure 4-64. SEM micrograph of a particle reduced at 1100°C.
The first mechanism (expected one) may prevail in arc furnaces where the ore is
smelted in a very large scale and the system is dynamic. In arc furnaces, slag
movements do not provide a quiescent conditions that metal particles require to join
and form a large metal network. By contrast, in the laboratory tests, the scale was
much smaller and static conditions was present. In this situation, the second
(suggested) mechanism is more probable since the metal particles can easily join each
other and form a metal network throughout the slag. The suggested mechanism also
could explain how a complete metal-slag separation and high recovery was achieved
within a short period of time and restricted temperature range between 1480 and
1490°C.
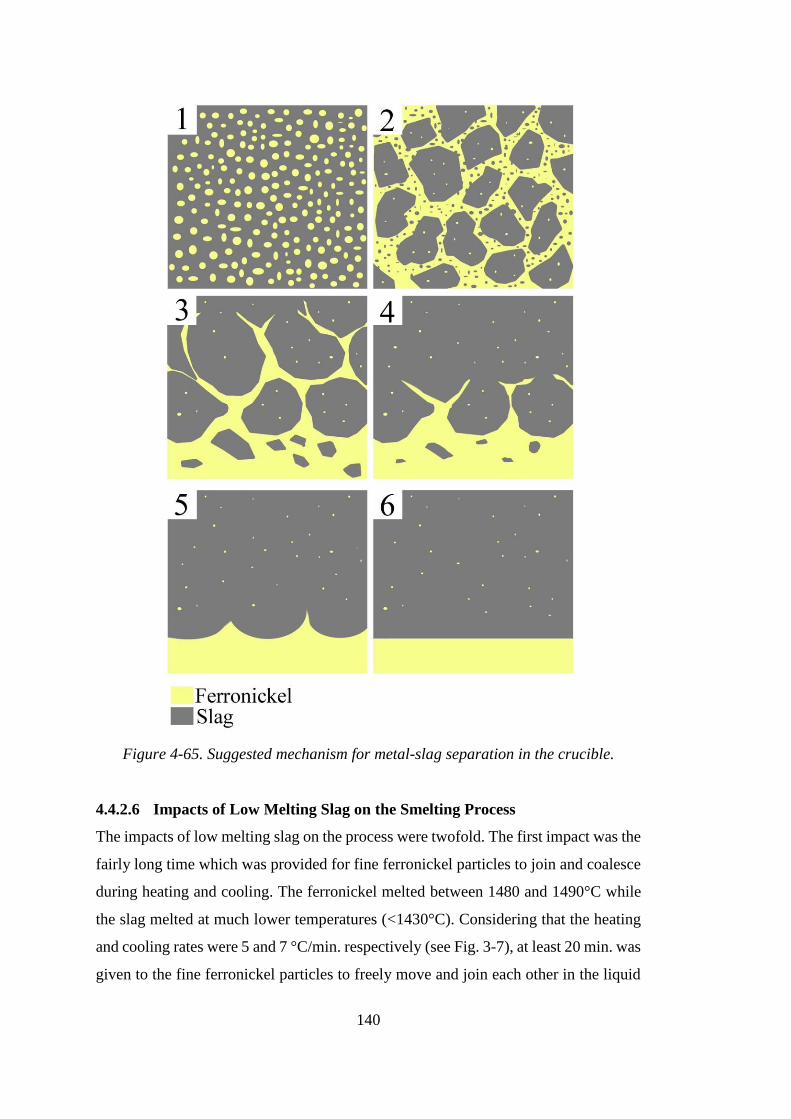
140
Figure 4-65. Suggested mechanism for metal-slag separation in the crucible.
4.4.2.6 Impacts of Low Melting Slag on the Smelting Process
The impacts of low melting slag on the process were twofold. The first impact was the
fairly long time which was provided for fine ferronickel particles to join and coalesce
during heating and cooling. The ferronickel melted between 1480 and 1490°C while
the slag melted at much lower temperatures (<1430°C). Considering that the heating
and cooling rates were 5 and 7 °C/min. respectively (see Fig. 3-7), at least 20 min. was
given to the fine ferronickel particles to freely move and join each other in the liquid
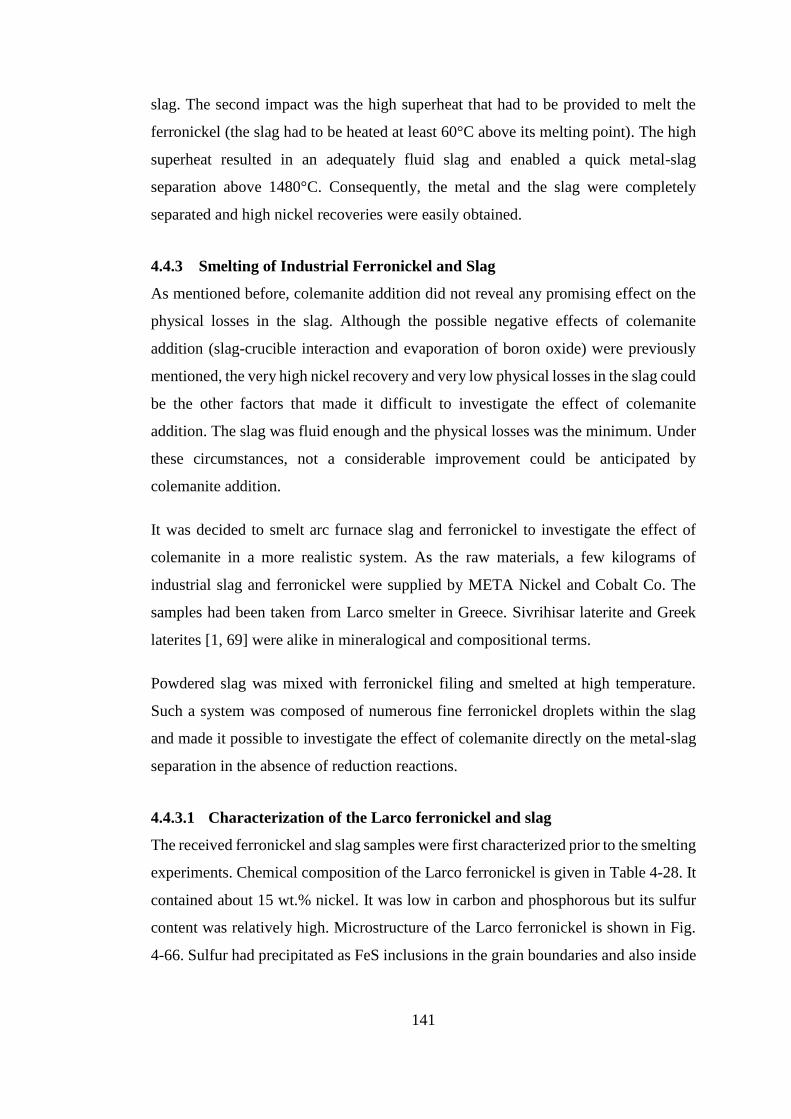
141
slag. The second impact was the high superheat that had to be provided to melt the
ferronickel (the slag had to be heated at least 60°C above its melting point). The high
superheat resulted in an adequately fluid slag and enabled a quick metal-slag
separation above 1480°C. Consequently, the metal and the slag were completely
separated and high nickel recoveries were easily obtained.
4.4.3 Smelting of Industrial Ferronickel and Slag
As mentioned before, colemanite addition did not reveal any promising effect on the
physical losses in the slag. Although the possible negative effects of colemanite
addition (slag-crucible interaction and evaporation of boron oxide) were previously
mentioned, the very high nickel recovery and very low physical losses in the slag could
be the other factors that made it difficult to investigate the effect of colemanite
addition. The slag was fluid enough and the physical losses was the minimum. Under
these circumstances, not a considerable improvement could be anticipated by
colemanite addition.
It was decided to smelt arc furnace slag and ferronickel to investigate the effect of
colemanite in a more realistic system. As the raw materials, a few kilograms of
industrial slag and ferronickel were supplied by META Nickel and Cobalt Co. The
samples had been taken from Larco smelter in Greece. Sivrihisar laterite and Greek
laterites [1, 69] were alike in mineralogical and compositional terms.
Powdered slag was mixed with ferronickel filing and smelted at high temperature.
Such a system was composed of numerous fine ferronickel droplets within the slag
and made it possible to investigate the effect of colemanite directly on the metal-slag
separation in the absence of reduction reactions.
4.4.3.1 Characterization of the Larco ferronickel and slag
The received ferronickel and slag samples were first characterized prior to the smelting
experiments. Chemical composition of the Larco ferronickel is given in Table 4-28. It
contained about 15 wt.% nickel. It was low in carbon and phosphorous but its sulfur
content was relatively high. Microstructure of the Larco ferronickel is shown in Fig.
4-66. Sulfur had precipitated as FeS inclusions in the grain boundaries and also inside
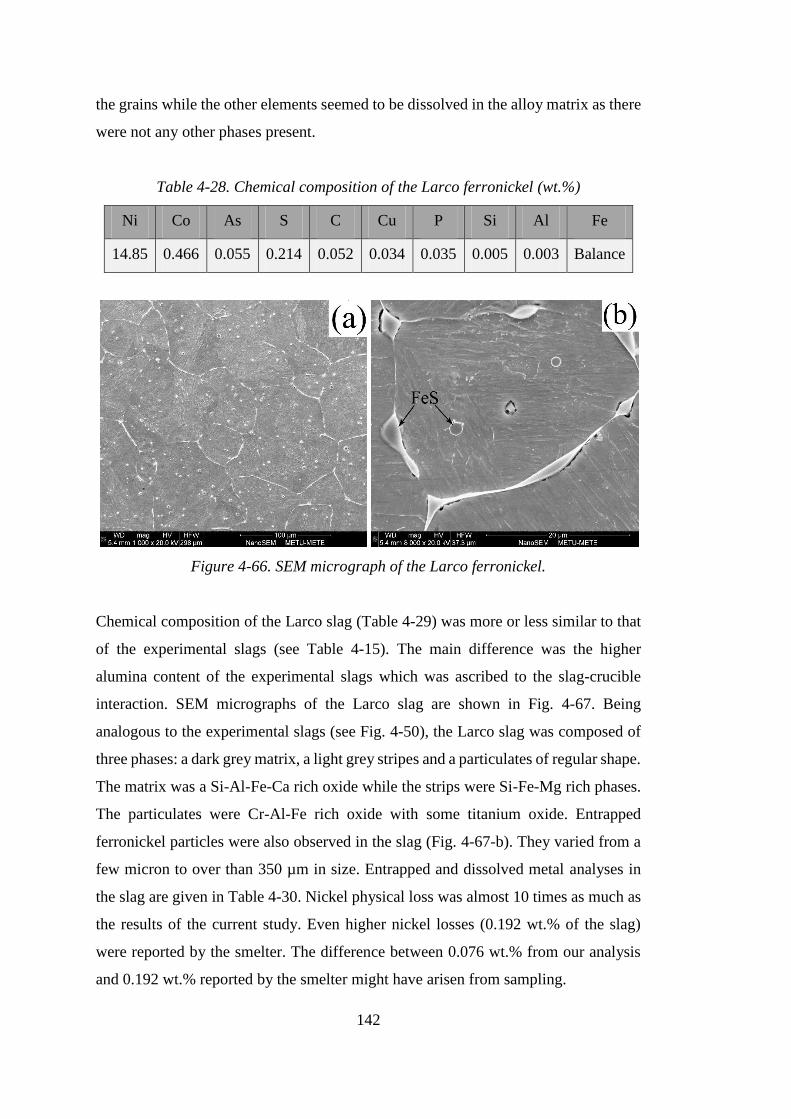
142
the grains while the other elements seemed to be dissolved in the alloy matrix as there
were not any other phases present.
Table 4-28. Chemical composition of the Larco ferronickel (wt.%)
Ni Co As S C Cu P Si Al Fe
14.85 0.466 0.055 0.214 0.052 0.034 0.035 0.005 0.003 Balance
Figure 4-66. SEM micrograph of the Larco ferronickel.
Chemical composition of the Larco slag (Table 4-29) was more or less similar to that
of the experimental slags (see Table 4-15). The main difference was the higher
alumina content of the experimental slags which was ascribed to the slag-crucible
interaction. SEM micrographs of the Larco slag are shown in Fig. 4-67. Being
analogous to the experimental slags (see Fig. 4-50), the Larco slag was composed of
three phases: a dark grey matrix, a light grey stripes and a particulates of regular shape.
The matrix was a Si-Al-Fe-Ca rich oxide while the strips were Si-Fe-Mg rich phases.
The particulates were Cr-Al-Fe rich oxide with some titanium oxide. Entrapped
ferronickel particles were also observed in the slag (Fig. 4-67-b). They varied from a
few micron to over than 350 µm in size. Entrapped and dissolved metal analyses in
the slag are given in Table 4-30. Nickel physical loss was almost 10 times as much as
the results of the current study. Even higher nickel losses (0.192 wt.% of the slag)
were reported by the smelter. The difference between 0.076 wt.% from our analysis
and 0.192 wt.% reported by the smelter might have arisen from sampling.
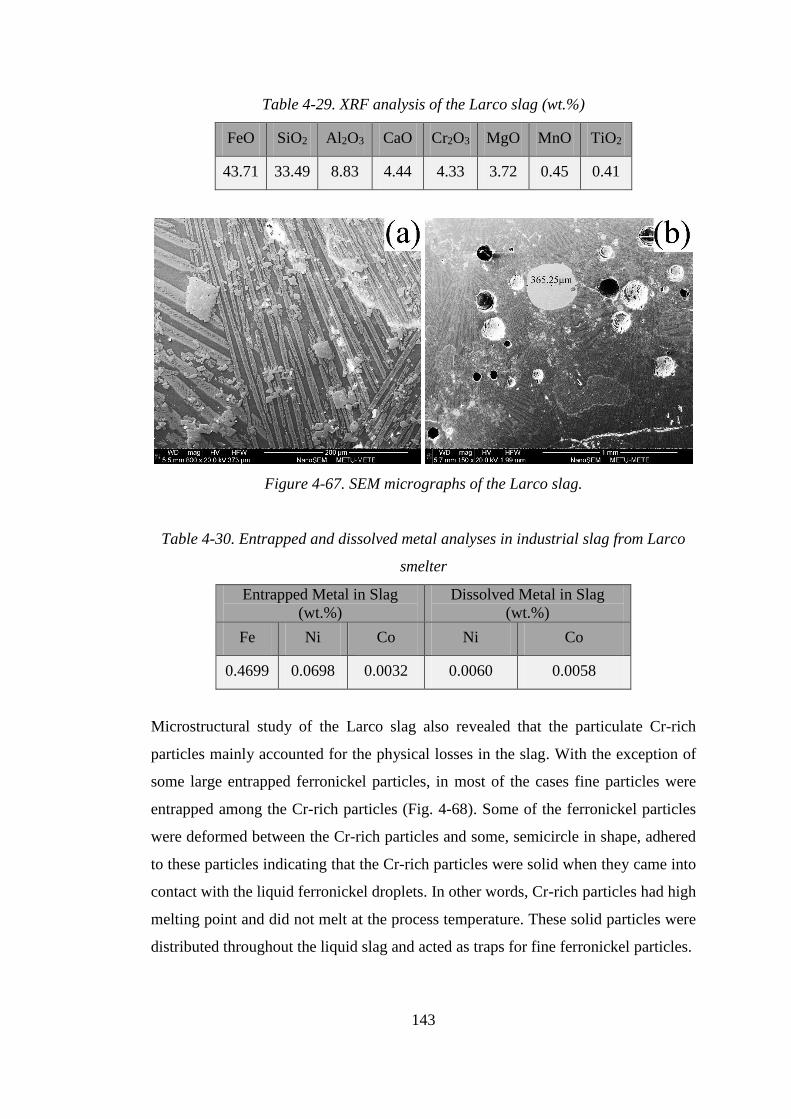
143
Table 4-29. XRF analysis of the Larco slag (wt.%)
FeO SiO2 Al2O3 CaO Cr2O3 MgO MnO TiO2
43.71 33.49 8.83 4.44 4.33 3.72 0.45 0.41
Figure 4-67. SEM micrographs of the Larco slag.
Table 4-30. Entrapped and dissolved metal analyses in industrial slag from Larco
smelter
Entrapped Metal in Slag
(wt.%)
Dissolved Metal in Slag
(wt.%)
Fe Ni Co Ni Co
0.4699 0.0698 0.0032 0.0060 0.0058
Microstructural study of the Larco slag also revealed that the particulate Cr-rich
particles mainly accounted for the physical losses in the slag. With the exception of
some large entrapped ferronickel particles, in most of the cases fine particles were
entrapped among the Cr-rich particles (Fig. 4-68). Some of the ferronickel particles
were deformed between the Cr-rich particles and some, semicircle in shape, adhered
to these particles indicating that the Cr-rich particles were solid when they came into
contact with the liquid ferronickel droplets. In other words, Cr-rich particles had high
melting point and did not melt at the process temperature. These solid particles were
distributed throughout the liquid slag and acted as traps for fine ferronickel particles.

144
Figure 4-68. (a) Low and (b) high magnification SEM photographs of the ferronickel
particles entrapped among the Cr-rich particulate phase.
4.4.3.2 Smelting of the Larco ferronickel and slag
The ferronickel and slag samples were received in large pieces. Ferronickel filings
were produced with a handsaw while the slag was crushed and finely ground. Melting
temperature of the slag was determined to be less than 1450°C and that of metal to be
higher than 1500°C (the slag melted at 1450°C but the ferronickel didn’t melt at
1500°C). Therefore, the experiment temperature was chosen to be 1550°C.
50 g of powdered slag was thoroughly mixed with 4 g of ferronickel fines and smelted
at 1550°C. The mixture was maintained at this temperature for 10 min. to allow the
ferronickel droplets to settle towards the bottom of the crucible and separate from the
slag. As given in Table 4-31, 3.12 g ferronickel settled to the bottom at the end of the
experiment. Two similar experiments were conducted with 1 and 2 wt.% colemanite
additions. Weight of the obtained ferronickel (Table 4-31) decreased when colemanite
was added. Again, it seems that colemanite had a negative effect on metal-slag
separation.
Table 4-31. Weight of the product ferronickel settled at the end of the experiments
done with industrial ferronickel and slag
Exp. No. 36 37 38
Calcined Colemanite (wt.%) 0 1 2
Ferronickel Weight (g) 3.12 3.03 3.04
145
CHAPTER 5
5 CONCLUSIONS
In this Ph.D. thesis, the pyrometallurgical extraction of nickel from Turkish laterite
ore was investigated. It included extensive experimental work and covered a wide
range of topics from the characterization to the smelting of the ore. Limonitic type
laterite ore from Eskişehir/Sivrihisar region was characterized, calcined, prereduced
and smelted to obtain crude ferronickel. It was demonstrated that a ferronickel of
acceptable grade can be produced by a cautious control of the reducing potential
during prereduction and smelting. At the end, the effect of colemanite on the smelting
behavior of the ore was investigated. The main findings of this research work are as
follows:
- Characterization of the ore
The ore was low grade limonitic type laterite with goethite and hematite as the
main nickel bearing minerals. The ROM ore contained 1.26 wt.% Ni.
Distribution of the valuable metals especially nickel was inversely
proportional to the particle size. Accordingly, the ore could be upgraded to
1.405 wt.% Ni by rejecting the large (+50 mm) but low grade particles,
whereupon around 10% of Ni was lost in the rejected particles.
The ROM ore was composed of goethite (53.3%), quartz (20.8%), hematite
(14%), calcite (3.9%), dolomite (3.1%), nontronite (3.8%) and kaolinite
(1.1%). Of these, goethite, hematite and nontronite were the Ni-bearing
minerals with 1.80, 1.59 and 2.07 wt.% Ni, respectively. In view of that, ~ 76%
of Ni was contained in goethite, ~18% in hematite and ~6% in nontronite.
- Calcination experiments
700°C and 40 min. were chosen to be the best calcination conditions for the
particle size used in the present work (-1 mm).
146
The main reactions which took place during the calcination were
dehydroxylation of goethite at about 300°C, dehydroxylation of clays at 400-
600°C and decomposition of calcite/dolomite above 650°C.
Approximately 10 wt.% of the ore was lost after a complete calcination
process.
- Prereduction experiments
Nickel and cobalt oxides were reduced to metal state via a simple and one stage
reaction while iron oxide, which was present as hematite, was first reduced to
magnetite. The magnetite was then reduced to wustite, main part of which,
further combined with silica to form fayalite. Metallic iron was produced by
the reduction of wustite and fayalite.
Metallization of iron was limited until 900°C but increased rapidly at higher
temperatures. Metallization of nickel and cobalt initiated at much lower
temperatures and increased with temperature.
The Boudouard reaction played a key role in the reduction process.
Gasification of coal via this reaction intensely encouraged the reduction
reactions above 1000°C.
Increasing coal amount increased iron metallization at 1000°C but its effect
was more pronounced at 1100°C. Nickel metallization was increased
noticeably and equally at all temperatures (except 700°C) by increasing coal
amount. Cobalt metallization was not affected by increasing coal amount.
Analysis of the unreacted carbon in the reduced samples indicated that there
was an optimum coal amount beyond which unreacted carbon sharply
increased in the samples. At 1000°C and under the experiment conditions of
this study, the optimum coal amount was 25% in excess of the theoretically
calculated amount.
At 1000°C, extended time (60 and 80 min.) increased the degree of
metallization of iron, but did not much affect that of nickel/cobalt. At 1100°C,
reactions were faster and chiefly terminated before 40 min.
At temperatures below 1000°C a reducing gas substantially improved the
reduction process. When the temperature was increased to 1100°C, the gas
mixture (reducing gas) inversely affected the reduction reactions because
147
CO/CO2 ratio in the reducing gas was much lower than the equilibrium
CO/CO2 ratio of the Boudouard reaction.
- Smelting experiments
Smelting of the ore produced a slag low in MgO and high in FeO which
severely interacted with the refractory crucible which was observed from the
increase in alumina content of the slag.
Higher smelting temperatures, extended retention times and higher FeO or
lower MgO contents of slag intensified the slag-crucible interaction.
During the smelting, almost all of the nickel, 90-95% of the cobalt and 30-40%
of the iron in the ore were reduced to yield a ferronickel with ~12-18 (Ni+Co).
The amount of the reductant coal was the major factor which controlled
ferronickel grade. The coal amount to produce a ferronickel containing 15
wt.% nickel+cobalt was 12.5% in excess of the theoretically calculated
amount.
The minimum temperature for the smelting was obtained to be 1490°C. A short
retention time (5 min.) was enough to achieve a complete metal-slag separation
at this temperature.
The physical and the chemical losses of nickel and cobalt in the slag were
directly proportional to the ferronickel grade.
High nickel recoveries (~99.5%) were achieved in the experiments which was
ascribed to the low melting temperature of the slag and the quiescent smelting
conditions.
Experimental results reflected the unsuccessful usage of colemanite to reduce
the physical losses in the slag. Colemanite addition did not much affect the
physical losses in the slag. On the contrary, the process was negatively affected
by this addition since the weight of the ferronickel product decreased.

148
149
CHAPTER 6
6 RECOMMENDATIONS FOR FUTURE STUDIES
Depending on the nickel content of the lateritic ore, a ferronickel with 15-25% nickel
(with cobalt) is commercially produced. Since Sivrihisar limonitic ore was high in iron
and low in nickel, the reducing conditions were adjusted to obtain the minimum
acceptable ferronickel grade (~15%), and in this manner, to diminish iron loss in the
slag. However, the slag still contained a large amount (~30 wt.%) of iron. This amount
is much more than 12-15 wt.% iron [48] which is common in saprolite smelting.
It does not seem reasonable to lose such a high amount of iron in the slag. Considering
that limonitic laterites contain higher chromium compared with saprolitic ores (see
Fig. 1-2), two possibilities are suggested for further investigation to recover iron from
the slag.
The first possibility is to smelt the ore to obtain Fe-Ni-Cr alloy. In a study [95],
limonitic nickel laterite has been called as chromonickel ore. In this study a limonitic
type ore has been melted in a high-temperature Tamman furnace to produce an alloy
with 4-5% Cr and 3-4% Ni which is suitable for the production of special alloy steels.
In the case of limonitic laterite ore from Sivrihisar, an alloy with approximately 4%Ni
and 4% Cr can be produced from the smelting of <50 mm ore assuming that all of the
nickel, iron and chromium in the ore are reduced. The ore may be mixed with
chromium ore in appropriate portion to increase Cr content of the alloy. Smelting to a
Fe-Cr-Ni alloy will reduce nickel losses in the slag and thus will increase nickel
recovery.
The second possibility can be reduction of the ferronickel slag to obtain an Fe-Cr alloy.
Industrially, the hot slag can be transferred into another furnace where flux and coal
150
can be added to reduce the remainder of the iron and chromium. Treatment of the hot
and previously smelted slag can help to the economy of the process.
Some other approaches have been reported in the literature. Pacific Metals Company
(Japan) developed an integrated production process for effective utilization of Fe, Ni
and Cr in the ore. The process used the iron-rich nickel ore and chromium-poor
chromite ore to produce stainless steel. These ores were treated separately through the
RKEF process. The iron-rich nickel ore was smelted to yield an alloy containing 13-
15% Ni and 1-3% Cr. At the mean time chromium-poor ore was smelted to an alloy
containing 1-2% Ni and 40-43% Cr. These melts were mixed to produce an alloy with
8-10% Ni and 18-20% Cr which was transferred to the steelmaking plant. It was
reported that the process led to lower energy consumption and a product with quite
low levels of impurities and nitrogen [96].
151
REFERENCES
[1] I. Halikia, K. Skartados and P. Neou-Syngouna, "Effect of reductive roasting on
smelting characteristics of Greek nickel laterites," Mineral Processing and
Extractive Metallurgy, vol. 111, no. 3, pp. C135-C142, 2002.
[2] D. Smale, "Review and outlook for Copper, Nickel, Lead and Zinc," UNCTAD
- Multi-Year Expert Meeting on Commodities and Development, 20 March
2013.
[3] M. G. King, "Nickel Laterite Technology - Finally a New Dawn?," JOM, pp. 35-
39, July 2005.
[4] P. H. Kuck, "U.S. Geological Survey, Mineral Commodity Summaries,"
January, 2012.
[5] D. G. E. Kerfoot, Ullmann's Encyclopedia of Industrial Chemistry, Wiley-VCH,
2005.
[6] A. Warner, C. Díaz, A. Dalvi, P. Mackey and A. Tarasov, "JOM World
Nonferrous Smelter Survey,Part III: Nickel: Laterite," JOM, vol. 58, no. 4, pp.
11-20, 2006.
[7] D. A.D., B. W.G. and O. R.C., "The past and the future of nickel laterites," in
PDAC 2004 International Convention, Trade Show & Investors Exchange,
March 7-10, 2004.
[8] G. M. Mudd, "Global trends and environmental issues in nickel mining: Sulfides
versus laterites," Ore Geology Reviews, vol. 38, p. 9–26, 2010.
152
[9] Y. Chang, X. Zhai, Y. Fu, L. Ma, B. Li and T. Zhang, "Phase transformation in
reductive roasting of laterite ore with microwave heating," Transactions of
Nonferrous Metals Society of China, vol. 18, no. 4, p. 969–973, 2008.
[10] O. Antola, L. Holappa and P. Paschen, "Nickel Ore Reduction by Hydrogen and
Carbon Monoxide Containing Gases," Mineral Processing and Extractive
Metallurgy Review, vol. 15, pp. 169-179, 1995.
[11] A. R. Çolakoğlu, "Geochemical and Mineralogical Characteristics of Fe-Ni
Laterite Ore of Sarıçimen (Çaldıran-Van) Area in Eastern Anatolia, Turkey,"
Turkish Journal of Earth Sciences, vol. 18, pp. 449-464, 2009.
[12] C. H. Köse and Y. A. Topkaya, "Hydrometallurgical processing of nontronite
type lateritic nickel ores by MHP process," Minerals Engineering, vol. 24, no.
5, pp. 396-415, 2011.
[13] A. Göveli and Ü. Atalay, "Nickel extraction from Gördes laterites by
hydrochloric acid leaching," M. Sc. Thesis, Department of Mining Engineering,
Middle East Technical University, September, 2006.
[14] T. Norgate and S. Jahanshahi, "Low grade ores – Smelt, leach or concentrate?,"
Minerals Engineering, vol. 23, pp. 65-73, 2010.
[15] R. R. Moskalyk and A. M. Alfantezi, "Nickel laterite processing and
electrowinning practice," Minerals Engineering, vol. 15, pp. 593-605, 2002.
[16] C. M. Diaz, C. A. Landolt, A. Vahed, A. E. M. Varner and J. C. Taylor, "A
Review of Nickel Pyrometallurgical Operations," in Extractive Metallurgy of
Nickel and Cobalt, The Metallurgical Society, 1988.
[17] A. Bunjaku, M. Kekkonen and L. Holappa, "Phenomena in thermal treatment of
lateritic nickel ores up to 1300C," Helsinki, Finland, 2010.
153
[18] J. Kim, G. Dodbiba, H. Tanno, K. Okaya, S. Matsuo and T. Fujita, "Calcination
of low-grade laterite for concentration of Ni by magnetic separation," Minerals
Engineering, vol. 23, pp. 282-288, 2010.
[19] M. Kawahara, J. M. Toguri and R. A. Bergman, "Reducibility of Laterite Ores,"
Metallurgical Transaction B, vol. 19B, pp. 181-186, 1988.
[20] T. Connah and G. Hubble, "XII Laterites," Australian Journal of Earth Sciences,
vol. 7, no. 1, pp. 373-386, 1960.
[21] S. Agatzini-Leonardou, I. G. Zafiratos and D. Spathis, "Beneficiation of a Greek
serpentinic nickeliferous ore Part I. Mineral processing," Hydrometallurgy, vol.
74, pp. 259-265, 2004.
[22] R. Thorne, R. Herrington and S. Roberts, "Composition and origin of the Çaldağ
oxide nickel laterite, W. Turkey," Miner Deposita, vol. 44, p. 581–595, 2009.
[23] J. H. Canterford, "The treatment of nickeliferous laterites," Minerals Sci. Eng.,
vol. 7, no. 1, pp. 3-17, 1975.
[24] E. Zevgolis, C. Zografidis and I. Halikia, "The reducibility of the Greek
nickeliferous laterites: a review," Mineral Processing and Extractive
Metallurgy, vol. 119, no. 1, pp. 9-17, 2010.
[25] M. Landers and R. J. Gilkes, "Dehydroxylation and dissolution of nickeliferous
goethite in New Caledonian lateritic Ni ore," Applied Clay Science, vol. 35, pp.
162-172, 2007.
[26] M. A. Rhamdhani, P. C. Hayes and E. Jak, "Nickel laterite Part 1 –
microstructure and phase characterisations during reduction roasting and
leaching," Mineral Processing and Extractive Metallurgy, vol. 118, no. 3, pp.
129-145, 2009.
[27] C. T. Harris, J. G. Peacey and C. A. Pickles, "Thermal Upgrading of
Nickeliferous Laterites-A Review," Sudbury, Ontario, Canada, 2009.
154
[28] I. J. Reinecke and H. Lagendijk, "A Twin-Cathode Dc Arc Smelting Test At
Mintek To Demonstrate The Feasibility Of Smelting FeNi From Calcine
Prepared From Siliceous Laterite Ores From Kazakhstan For Oriel Resources
Plc," in INFACON XI, 2007.
[29] A. Oxley, N. Sirvanci and S. Purkiss, "Çaldağ Nickel laterite atmospheric heap
leach project," Metalurgija - Journal of Metallurgy , vol. 13, pp. 5-10, 2007.
[30] M. Valix and W. H. Cheung, "Study of phase transformation of laterite ores at
high temperature," Minerals Engineering, vol. 15, pp. 607-612, 2002.
[31] H. Purwanto, T. Shimada, R. Takahashi and J. Yagi, "Recovery of Nickel from
Selectively Reduced Laterite Ore by Sulphuric Acid Leaching," ISIJ
International, vol. 43, no. 2, p. 181–186, 2003.
[32] E. N. Zevgolis, "The Evolution of The Greek Ferronickel Production Process,"
in International Laterite Nickel Symposium, TMS 2004, 2004.
[33] C. Walker, S. Kashani-Nejad, A. D. Dalvi, N. Voermann, I. M. Candy and B.
Wasmund, "Nickel Laterite Rotary Kiln- Electric Furnace Plant of the Future,"
in Pyrometallurgy of Nickel and Cobalt, 48th Annual Conference of
Metallurgists of CIM, Sudbury, Ontario, Canada, 2009.
[34] N. Voermann, T. Gerritsen, I. Candy, F. Stober and A. Matyas, "Developments
in furnace technology for ferronickel production," in Tenth International
Ferroalloys Congress; INFACON: 'Transformation through Technology', Cape
Town, South Africa, 2004.
[35] J. R. Kift and C. E. Ferrer, "A historical overview of the Cerro Matoso operation
1980 to 2003," 2004.
[36] L. B. Tsymbulov, M. V. Knyazev and L. S. Tsemekhman, "Oxide nickel ores
smelting of ferronickel in two-zone Vaniukov Furnace," Canadian
Metallurgical Quarterly, vol. 50, no. 2, pp. 135-144, 2011.
155
[37] H. Lagendijk and R. T. Jones, "Production of ferronickel from nickel laterites in
a DC-arc furnace," Sudbury, Canada, 1997.
[38] A. Orth and B. Kerstiens, "Calcination and Reduction of Laterite Nickel Ores,"
in International Laterite Nickel Symposium - TMS 2004, 2004.
[39] F. O’Connor, W. Cheung and M. Valix, "Reduction roasting of limonite ores:
effect of dehydroxylation," Int. J. Miner. Process., vol. 80, p. 88– 99, 2006.
[40] S. Gialanella, F. Girardi, G. Ischia, I. Lonardelli, M. Mattarelli and M.
Montagna, "On the goethite to hematite phase transformation," J Therm Anal
Calorim, vol. 102, pp. 867-873, 2010.
[41] j. Li, X. Li, Q. Hu, Z. Wang, Y. Zhou, J. Zheng, W. Liu and L. Li, "Effect of
pre-roasting on leaching of laterite," Hydrometallurgy, vol. 99, pp. 84-88, 2009.
[42] A. Manceau, G. Galas and A. Decarreau, "Nickel-bearing clay minerals: I.
optical spectroscopic study of nickel crystal chemistry," Clay minerals, vol. 20,
pp. 367-387, 1985.
[43] F. E. Canpbell and P. Roeder, "The stability of olivine and pyroxene in the Ni-
Mg-Si-O system," The American Mineralogist, vol. 53, pp. 257-268, 1968.
[44] A. Bunjaku, M. Kekkonen and P. Taskinen, "Effect of mineralogy on
reducibility of calcined nickel saprolite ore by hydrogen," Mineral Processing
and Extractive Metallurgy, vol. 121, no. 1, pp. 16-22, 2012.
[45] B. Li, H. Wang and W. Yonggang, "The reduction of nickel from low-grade
nickel laterite ore using a solid-state deoxidation method," Minerals
Engineering, vol. 24, pp. 1556-1562, 2011.
[46] C. Pan, X. Lv, C. Bai, X. Liu and D. Li, "Melting features and viscosity of SiO2-
CaO-MgO-Al2O3-FeO nickel slag in laterite metallurgy," J. Min. Metall. Sect.
B-Metall., vol. 49, no. 1, pp. 9-12, 2013.
156
[47] C. P. Broadbent and N. C. Machingawuta, "The physical chemistry of nickel
laterite smelting slags," 1993.
[48] S. Chen, L. Erasmus, S. C. C. Barnett, E. Jak and P. C. Hayes, "Liquidus
Temperatures of Ferro-nickel Smelting Slags," in International Laterite Nickel
Symposium, TMS, 2004.
[49] T. Utigard, "An analysis of slag stratification in nickel laterite smelting furnaces
due to composition and temperature," Metallurgical and Materials Transactions
B, vol. 25B, pp. 491- 496, 1994.
[50] J. G. Park, H. S. Eom, W. W. Huh, Y. S. Lee, D. J. Min and I. Sohn, "A study in
the thermodynamic behavior of nickel in the MgO-SiO 2 -FeO slag system,"
steel research int., vol. 82, no. 4, pp. 415-421, 2011.
[51] A. Çağatay, Y. Altun and B. Arman, "The Mineralogy of Çaldağ (Manisa-
Turgutlu) lateritic iron, nickel – cobalt deposits," Bulletin of the Mineral
Research and Exploration Institute of Turkey, Vols. 95-96, pp. 81-96, 1980-
1981.
[52] E. Büyükakinci and Y. A. Topkaya, "Extraction of nickel from lateritic ores at
atmospheric pressure with agitation leaching," Hydrometallurgy, vol. 97, pp. 33-
38, 2009.
[53] Ş. Kaya and Y. A. Topkaya, "High pressure acid leaching of a refractory lateritic
nickel ore," Minerals Engineering, vol. 24, no. 11, pp. 1188-1197, 2011.
[54] D. G. Eliopoulos, M. Economou-Eliopoulos, A. Apostolikas and J. P. Golightly,
"Geochemical features of nickel-laterite deposits from the Balkan Peninsula and
Gordes, Turkey: The genetic and environmental signi fi cance of arsenic," Ore
Geology Reviews, vol. 48, pp. 413-427, 2012.
[55] J. Andersen, G. Rollinson, B. Snook, R. Herrington and R. Fairhurst, "Use of
Scanning Electron Microscopy-Based Automated Quantitative Mineralogy for
157
the Characterisation of Ni-Rich and Ni-Poor Goethite in Laterites," Brisbane,
QLD, September, 2008.
[56] I. Girgin, A. Obut and A. Üçyildiz, "Dissolution behaviour of a Turkish lateritic
nickel ore," Minerals Engineering, vol. 24, pp. 603-609, 2011.
[57] M. Sezai Timur, E. Özpek, Ö. Gök and İ. Cöcen, "Evaluation of South Anatolian
Nickel Laterites with Sulphuric Acid Leaching," in XIII. International Mineral
Processing Symposium, Bodrum, Turkey, October, 2012.
[58] K. H. Obst and J. Stradtman, "The influence of lime and synthetic lime products
on steel production," The Journal of The South African Institute of Mining and
Metallurgy, vol. January, p. 158–164, 1972.
[59] L. Ozmen and E. Inger, "Colemanite in steel production," in Sohn International
Symposium, TMS, San Diego, 2006.
[60] M. Timuçin, N. Sevınç, Y. A. Topkaya and H. Eric, "Use of colemanite in the
production of iron and steel," Tech. Report, No: 84-04-07-00-13, METU,
Ankara, 1986.
[61] A. Seki, Y. Aso, M. Okubo, F. Sudo and K. Ishizaka, "Development of
Dedusting Prevention Stabilizer for Stainless Steel Slag," Kawasaki Steel
Technical Report No. 15, 16-21, October, 1986.
[62] A. Geveci, "Effects of addition of colemanite and boron oxide on the amount of
copper losses to Murgul Reverbatory slag," in 5.th Science Congress, Turkish
Scientific and Research Council, Ankara, 1975.
[63] A. Ruşen, A. Geveci, Y. A. Topkaya and B. Derin, "Investigation of effect of
colemanite addition on copper losses in matte smelting slag," Canadian
Metallurgical Quarterly, vol. 51, no. 2, pp. 157-169, 2012.
[64] A. Rüşen, A. Geveci and Y. A. Topkaya, "Usage of Boron Compounds in
Copper Production," Ph.D. Thesis, METU, Ankara, 2013.
158
[65] A. C. Larson and R. B. Von Dreele , "General Structure Analysis System
(GSAS)," LAUR 86-748, Los Alamos National Laboratory, 2000.
[66] B. H. Toby, "Expgui, a graphical user interface for gsas," J. Appl. Cryst., vol.
34, pp. 210-213, 2001.
[67] [Online]. Available: http://rruff.geo.arizona.edu/AMS/amcsd.php. [Accessed 18
08 2011].
[68] K. Kinson, J. E. Dickeson and C. B. Belcher, "The Determination of Metallic
Iron, Nickel and Cobalt in Reduced Ores and Oxides," Analytica Chimica Acta,
vol. 41, pp. 107-112, 1968.
[69] E. N. Zevgolis, C. Zografidis, T. Perraki and E. Delvin, "Phase transformations
of nickeliferous laterites during preheating and reduction with carbon
monoxide," J Therm Anal Calorim, vol. 100, p. 133–139, 2010.
[70] D. M. Moore and R. C. Reynolds, X-ray diffraction and the identification and
analysis of clay minerals, New York: Oxford University Press, 1997.
[71] S. W. Bailey, Hydrous Phyllosilicates (exclusive of micas), Washington, D.C.,:
Mineralogical Society of America, 1991.
[72] R. L. Frost, H. Ruan, J. T. Kloprogge and W. P. Gates, "Dehydration and
dehydroxylation of nontronites and ferruginous smectite," Thermochimica Acta,
vol. 346, pp. 63-72, 2000.
[73] A. C. D. Newman, Chemistry of clays and clay minerals, Longman Scientific &
Technical, 1987.
[74] R. C. Mackenzie, The differential thermal investigation of clays, Alden Press
(oxford), 1966.
[75] R. S. Winburn, "Rietveld Analysis of Complex Mixtures. What Can We Do?,"
Adv. X-ray Anal., vol. 46, pp. 210-219, 2003.
159
[76] D. Beruto, A. Searcy and M. Kim, "Microstructure, kinetic, structure,
thermodynamic analysis for calcite decomposition: free-surface and powder bed
experiments," Thermochimica Acta, vol. 424, pp. 99-109, 2004.
[77] R. A. W. Haul and H. Heystek, "Differential thermal analysis of the dolomite
decomposition," American Mineralogist, vol. 37, no. 3, pp. 166-179, 1952.
[78] K. MacKenzie and D. Rogers, "Thermal and Mössbauer studies of iron-
containing hydrous silicates: I. Nontronite," Thermochimica Acta, vol. 18, no. 2,
pp. 177-196, 1977.
[79] S. A. T. Redfern, "The kinetics of dehydroxylation of kaolinite," Clay Minerals,
vol. 22, pp. 447-456, 1987.
[80] F. A. López, M. C. Ramirez, J. A. Pons, A. López-Delgado and F. J. Alguacil,
"Kinetic study of the thermal decomposition of low-grade nickeliferous laterite
ores," Journal of Thermal Analysis and Calorimetry, vol. 94, no. 2, pp. 517-522,
2008.
[81] I. Barin, Thermochemical Data of Pure Substances, 3rd ed., Wiley-VCH, 1997.
[82] P. C. H. a. E. J. M. A. Rhamdhani, "Nickel laterite Part 1 – microstructure and
phase characterisations during reduction roasting and leaching," Vols. 118, No
3: 129-145, 2009.
[83] T. Utigard and R. A. Bergman, "Gaseous Reduction of Laterite Ores,"
Metallurgical Transactions B, vol. 23B, pp. 271-275, 1992.
[84] N. S. Srinivasan and A. K. Lahiri, "Studies on the Reduction of Hematite by
Carbon," Metallurgical Transactions B, vol. 8B, pp. 175-178, March 1977.
[85] S. Mohanty, S. K. Roy and P. K. Sen, "Thermodynamic considerations in
reduction of nickeliferrous laterite by methane," Metallurgical and Materials
Transactions B, vol. 39B, pp. 639-642, 2008.
160
[86] G. Liu, V. Strezov, J. A. Lucas and L. J. Wibberley, "Thermal investigations of
direct iron ore reduction with coal," Thermochimica Acta, vol. 410, p. 133–140,
2004.
[87] J. S. J. Van Deventer and P. R. Visser, "On the role of the boudouard reaction in
the isothermal reduction of iron ore by char and graphite," Thermochimica Acta,
vol. 111, pp. 89-102, 1987.
[88] J. Moon and V. Sahajwalla, "Investigation into the Role of the Boudouard
Reaction in Self-Reducing Iron Oxide and Carbon Briquettes," Metalllurgical
and Materials Transactions B, vol. 37B, pp. 215-221, 2006.
[89] M. C. Kuhn, "The recovery of metal values from nickel-bearing laterite ores by
reductive roast/ammonia leach technology," in Process &
FundumentalConsiderations of Selected Hydrometallurgical System, Society for
Mining Metallurgy & Exploration, April 1981, p. 392.
[90] D. Q. Zhu, Y. Cui, K. Vining, S. Hapugoda, J. Douglas, J. Pan and G. L. Zheng,
"Upgrading low nickel content laterite ores using selective reduction followed
by magnetic separation," International Journal of Mineral Processing, Vols.
106-109, pp. 1-7, 2012.
[91] G. Li, T. Shi, M. Rao, T. Jiang and Y. Zhang, "Beneficiation of nickeliferous
laterite by reduction roasting in the presence of sodium sulfate," Minerals
Engineering, vol. 32, pp. 19-26, 2012.
[92] I. Mulliqi, A. Terzigi, L. Beqiri, B. Bajraktari and I. Ibrahimi, "Usage model of
electrical furnace gases for heating in rotation furnace," in Trends in
Development of Machinery and Associated Technology, Prague, 12-18
September, 2011.
[93] "Wikipedia," [Online]. Available: http://www.wikipedia.com.
161
[94] E. Jak and P. C. Hayes, "Slag phase eqilibria and viscosities in ferronickel
smelting slags," Helsinki, Finland, June 6-9, 2010.
[95] M. Z. Tolymbekov, B. S. Kelamanov, A. S. Baisanov and K. K. Kaskin,
"Processing Kazkahstan’s chromonickel ore," Steel in Translation, vol. 38, no.
8, pp. 660-663, 2008.
[96] K. Yamada and T. Hiyama, "A process for direct stainless steel production from
nickel laterite and chromium ores," International Journal of Mineral Processing,
vol. 19, pp. 215-221, 1987.
[97] M. Gasik, "Chapter 10 - Technology of Ferronickel," in Handbook of
Ferroalloys, Theory and Technology, Butterworth Heinemann, 2013.
[98] Hindustan Produce Company, [Online]. Available:
http://www.hindustanproduceco.com/ferro-nickel.html. [Accessed 14 04 2014].

162
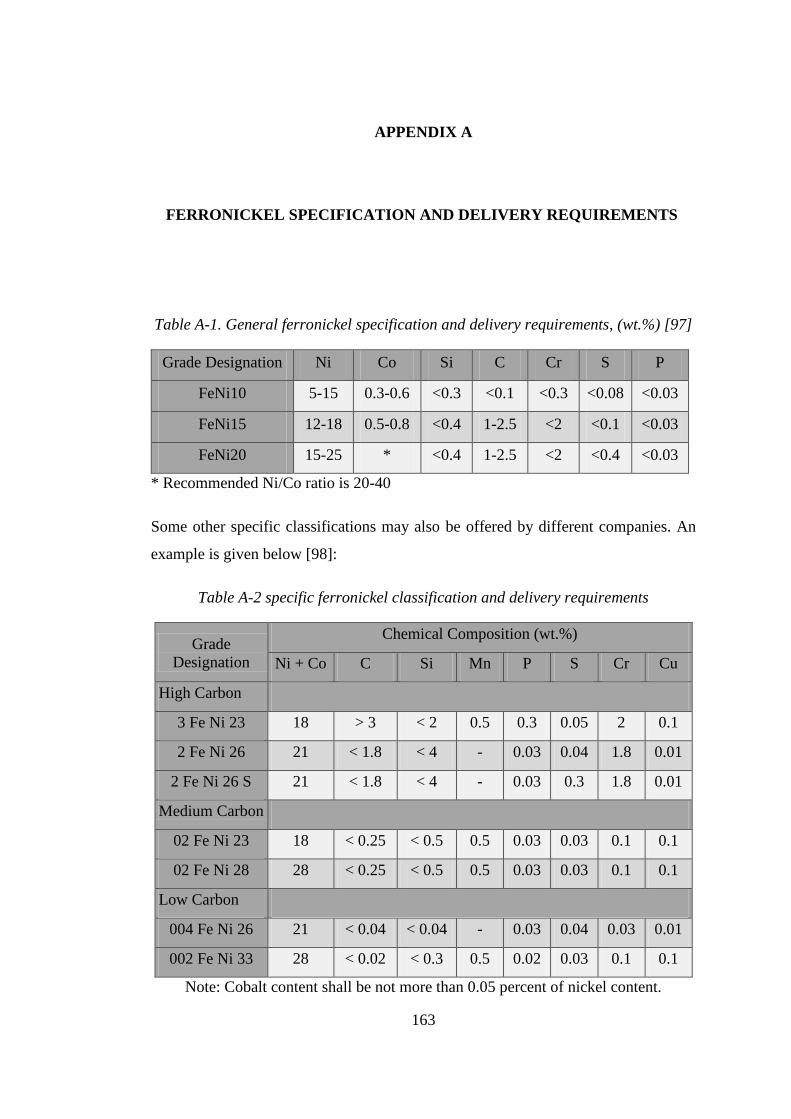
163
APPENDIX A
A. FERRONICKEL SPECIFICATION AND DELIVERY REQUIREMENTS
Table A-1. General ferronickel specification and delivery requirements, (wt.%) [97]
Grade Designation Ni Co Si C Cr S P
FeNi10 5-15 0.3-0.6 <0.3 <0.1 <0.3 <0.08 <0.03
FeNi15 12-18 0.5-0.8 <0.4 1-2.5 <2 <0.1 <0.03
FeNi20 15-25 * <0.4 1-2.5 <2 <0.4 <0.03
* Recommended Ni/Co ratio is 20-40
Some other specific classifications may also be offered by different companies. An
example is given below [98]:
Table A-2 specific ferronickel classification and delivery requirements
Grade
Designation
Chemical Composition (wt.%)
Ni + Co C Si Mn P S Cr Cu
High Carbon
3 Fe Ni 23 18 > 3 < 2 0.5 0.3 0.05 2 0.1
2 Fe Ni 26 21 < 1.8 < 4 - 0.03 0.04 1.8 0.01
2 Fe Ni 26 S 21 < 1.8 < 4 - 0.03 0.3 1.8 0.01
Medium Carbon
02 Fe Ni 23 18 < 0.25 < 0.5 0.5 0.03 0.03 0.1 0.1
02 Fe Ni 28 28 < 0.25 < 0.5 0.5 0.03 0.03 0.1 0.1
Low Carbon
004 Fe Ni 26 21 < 0.04 < 0.04 - 0.03 0.04 0.03 0.01
002 Fe Ni 33 28 < 0.02 < 0.3 0.5 0.02 0.03 0.1 0.1
Note: Cobalt content shall be not more than 0.05 percent of nickel content.

164
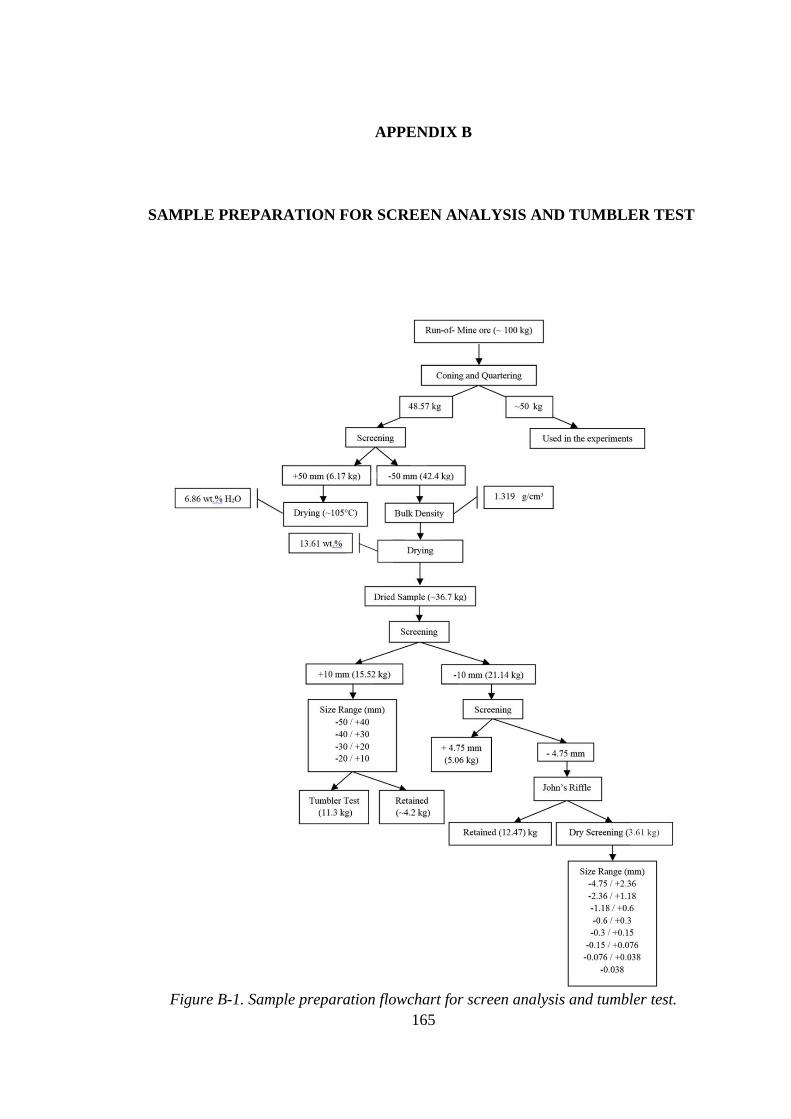
165
APPENDIX B
B. SAMPLE PREPARATION FOR SCREEN ANALYSIS AND TUMBLER TEST
Figure B-1. Sample preparation flowchart for screen analysis and tumbler test.

166

167
APPENDIX C
C. REQUIRED COAL CALCULATION
Base: 100 g calcine
The weight percentages of Fe, Ni and Co in the calcine are 37.1; 1.575 and 0.103,
respectively. However, they are present in the oxide form. The number of moles of
each oxide can be calculated as below:
Fe2O3: 37.1 × (1/(55.845×2)) = 0.3352135 mol Fe2O3 per 100 g of calcine
NiO : 1.575 × (1/58.693) = 0.0265960 mol NiO per 100 g of calcine
CoO : 0.103 × (1/58.933) = 1.7477×10⁻³ mol CoO per 100 g of calcine
It is assumed that NiO and CoO are reduced to the metallic state while Fe2O3 is reduced
to FeO. The involved reduction reactions are:
1. Reduction of Hematite to Wustite
3Fe2O3 + C → 2Fe3O4 + CO
2Fe3O4 + 2C → 6FeO + 2CO
2. Reduction of NiO to Ni
NiO + C → Ni + CO
3. Reduction of CoO to Co
CoO + C → Co + CO
From the reactions above, one mole of carbon per mole of each oxide is consumed.
Therefore, the required coal amount can be calculated as:
(0.3352135 + 0.0265960 + 1.7477×10-3) × 12.01 × (100/76.06) = 5.74 g
where 76.06% is the carbon content of the coal.

168

169
CURRICULUM VITAE
Personal Information
Surname, Name : Pournaderi, Saeid
Nationality : Iranian
Date and Place of Birth: Aug. 31, 1984 – Ardabil, Iran
Marital Status : Married
Address : Department of Metallurgical and Materials Engineering
Middle East Technical University, 06531, Çankaya
Ankara, Turkey
Telephone number : +90 (312) 210 7897
E-mail : [email protected]
Interested Areas
Extractive Metallurgy
Carbothermic reduction
Thermodynamics of Materials
Phase Equilibria
Production of Ferroalloys
Education
2010- 2014 Middle East Technical University, Turkey
Ph.D. in Metallurgical Engineering (GPA: 3.86/4.00)
Major Field: Extractive Metallurgy
Thesis Title: “Optimization of ferronickel production from Sivrihisar nickel
laterite ore and the usage of boron compounds to increase nickel recovery”,
supervised by Prof. Dr. Ahmet Geveci, Prof. Dr. Yavuz A. Topkaya and
Assoc. Prof. Ender Keskinkılıç.
2006-2009 University of Tehran, Iran
M.Sc. in Metallurgical Engineering (GPA: 3.32/4.00)
Major Field: Selection of Engineering Materials
Thesis Title: “Optimization of the In-situ Powder Metallurgy method for
producing Al6061/Al2O3 composites containing different wt.% of alumina”,
170
supervised by Assoc. Prof. Dr. Farshad Akhlaghi and Assoc. Prof. Dr.
Mohammad Ghambari.
2002-2006 Isfahan University of Technology, Iran
B.Sc. in Metallurgical Engineering (GPA: 3.01/4.00)
Major Field: Industrial metallurgy
Thesis Title: “Effects of microstructure and distribution of graphite on
damping capacity of gray and ductile cast iron”, supervised by Assoc. Prof.
Dr. Mohammad Hossein Fathi.
1999-2002 National Organization for Development of Exceptional Talents,
Shahid Beheshti, Ardabil, Iran
High School Diploma: Mathematics-Physics
Journal Papers
Saeid Pournaderi, Ender Keskinkılıç, Ahmet Geveci, Yavuz A. Topkaya,
“Reducibility of Nickeliferous Limonitic Laterite Ore from Central
Anatolia”, Canadian Metallurgist Quarterly, Volume 53 Issue 1 (January
2014), pp. 26-37.
S. Pournaderi, S. Mahdavi, F. Akhlaghi, “Fabrication of Al/Al2O3
composites by in-situ powder metallurgy (IPM)”, Powder Technology,
Volume 229, October 2012, Pages 276-284.
Ender Keskinkılıç, Saeid Pournaderi, Ahmet Geveci, Yavuz A. Topkaya,
“Calcination Characteristics of Laterite Ores from Central Region of
Anatolia”, The Journal of The Southern African Institute of Mining and
Metallurgy, Volume 12, October 2012, 877-882.
Conference Papers
Ender Keskinkılıç, Saeid Pournaderi, Ahmet Geveci, Yavuz A. Topkaya,
“Production of crude ferronickel from Sivrihisar laterite ores of
Turkey”, 2013 TMS Annual Meeting & Exhibition, 4th International

171
Symposium on High-Temperature Metallurgical Processing, March 3-7, San
Antiano, Texas.
Ender Keskinkılıç, Saeid Pournaderi, Ahmet Geveci, Yavuz A. Topkaya,
“Sivrihisar nikel cevherlerinden ferronikel üretimi”, International Iron &
Steel Symposium, 02-04 Nisan 2012, Karabük, Türkiye.
Ender Keskinkılıç, Saeid Pournaderi, Ahmet Geveci, Yavuz A. Topkaya,
“Study of Certain Parameters in Laboratory-Scale Smelting of
Sivrihisar Laterite Ores of Turkey”, 2012 TMS Annual Meeting, 3rd
International Symposium on High Temperature Metallurgical Processing,
March 11-15, Orlando, Florida, USA.
Ender Keskinkılıç, Saeid Pournaderi, Ahmet Geveci, Yavuz A. Topkaya,
“Calcination Behavior of Sivrihisar Laterite ore of Turkey”, 2011 TMS
Annual Meeting, 2nd International Symposium on High Temperature
Metallurgical Processing, February 27 - March 3, San Diego, California,
USA.
Ender Keskinkılıç, Saeid Pournaderi, Ahmet Geveci, Yavuz A. Topkaya,
“Study of Certain Parameters in Laboratory-Scale Prereduction of
Sivrihisar Laterite Ores of Turkey”, ALTA 2011 Nickel/Cobalt/Copper
Conference, Perth, Western Australia, May 2011.
F. Akhlaghi, S. Pournaderi, “Effect of stirring time and processing
temperature on the size distribution of Al6061-Al2O3 powder mixture
produced by In Situ Powder Metallurgy (IPM) method”, The 12th
international conference on aluminum alloys, September 5-9, 2010, Tokyo,
Japan.
F. Akhlaghi ,S. Pournaderi, “Effect of alumina size on the size distribution
of Al6061-alumina powder mixture produced by In situ powder
metallurgy method”, Seventh International Conference on Composite
Science and Technology, American University of Sharjah, United Arab
Emirates, January 20-22, 2009.
S. Pournaderi and F. Akhlaghi, “Effect of alumina content on the size
distribution of Al6061-alumina powder mixture produced by In situ

172
powder metallurgy method”, Fifth International Powder Metallurgy
Conference, Ankara, Turkey, October 8-12, 2008.
S. Pournaderi, M.H. Fathi, “Effect of morphology and distribution of
graphite on damping capacity of cast iron”, 11th Iranian Metallurgical
Engineers Society Annual Congress, 2006 (in Persian).
Awards Received
Apr. 2011-Feb. 2014 Fellowship under TÜBİTAK-BİDEB 2215-PhD
Fellowship Programme.
2002-2003 Scholarship from Isfahan University of Technology as the first
place in entrance exam.
Research & Teaching Experiences
Feb. 2013 - Dec. 2013, Research Assistant, “Optimization of ferronickel
production from Sivrihisar nickel laterite ore and the usage of boron
compounds to increase nickel recovery”, Scientific Research Projects
coordination (Turkey), Project No. BAP-03-08-2012-002. (Extended
project).
Feb. 2012 - Dec. 2012, Research Assistant, “Optimization of ferronickel
production from Sivrihisar nickel laterite ore and the usage of boron
compounds to increase nickel recovery”, Scientific Research Projects
coordination (Turkey), Project No. BAP-03-08-2012-002.
Feb. 2010 - Nov. 2011, Research Assistant, “Production of ferronickel from
Turkish laterites”, The Scientific and Technological Research Council of
Turkey (TÜBİTAK), Project No: 109M068
Sep. 2006 – May. 2007 Teaching Assistant, Solidification Laboratory,
University of Tehran.
Jun. 2005 - Sep. 2005 Internship at Arta Machine Casting Co.:
Manufacturer of some of Automobile cast parts for SAIPA Co. (One of the
most famous company in car industry in Iran)

173
Hands-On experiences
XRD (Rigaku SA-HF3)
SEM (Nova Nano-SEM)
XRF (Bruker, S8 TIGER)