optimization of hydrogen production from pickle bamboo
TRANSCRIPT

205
KMUTNB Int J Appl Sci Technol, Vol. 8, No. 3, pp. 205–212, (2015)
Optimization of Hydrogen Production from Pickle Bamboo Shoot Wastewater by Rhodopseudomonas palustris TN1
Wiboon Riansa-ngawong*, Wanticha Savedboworn Department of Agro-Industry and Management, Faculty of Agro-Industry, King Mongkut’s University of Technology North Bangkok, Prachinburi Campus, Prachin Buri, Thailand
Maneewan SuwansaardDepartment of Biological Sciences, Bowling Green State University, Bowling Green, Ohio 43403, USA
* Corresponding author. E-mail: [email protected] Received: 19 May 2015; Accepted: 22 June 2015; Published online: 16 July 2015© 2015 King Mongkut’s University of Technology North Bangkok. All Rights Reserved.
AbstractA pickle bamboo shoot is a top marketing product in the East of Thailand, especially Prachin Buri province. Vinegar (acetic acid) and sea salt (NaCl) are added during pickle bamboo shoot productions to preserve the color and texture. These high acidity (pH 3–4), high salt concentration (6.0%) and dark-brown color of the pickle bamboo shoot wastewater (PBSW) lead to the difficulty for bioremediation of PBSW treatment. Rhodopseudomonas palustris TN1 was capable of surviving in 3.0% (w v-1) NaCl medium and produce hydrogen under anaerobic-light condition. The Aim of this study is to investigate the ability of biohydrogen production in the PBSW by TN1, the effect of initial pH (6.5, 7.0 and 7.5) and light intensities (1,000, 3,000 and 5,000 lux) were performed under anaerobic-light condition. The hydrogen content in biogas using wastewater as the medium was found to be 98.51%. The optimal condition for the highest hydrogen production was pH 7.12 and light intensity of 3,200 lux at room temperature (30 ± 2ºC) giving hydrogen 73.84 ± 7.12 mL L-1 and dry cell weight (DCW) of 5.49 ± 0.67 g L-1 within 72 hrs. In conclusion, TN1 can consume the PBSW as a carbon source to produce hydrogen.
Keywords: Optimization, Hydrogen production, Pickle bamboo shoot wastewater, Rhodopseudomonas palustris TN1
Please cite this article as: W. Riansa-ngawong, W. Savedboworn, and M. Suwansaard, “Optimization of Hydrogen Production from Pickle Bamboo Shoot Wastewater by Rhodopseudomonas palustris TN1,” KMUTNB Int J Appl Sci Technol, Vol. 8, No. 3, pp. 205–212, July–Sept. 2015, http://dx.doi.org/10.14416/j.ijast.2015.06.004
1 Introduction
Presently, natural energy resources e.g. coal, natural gas and fossil fuel are largely utilized to support global economic growth [1], [2]. However, it will be gone within 20 years as predicted by the OPEC’s energy source decreasing. With respect to this crisis, finding multiple alternative energy resources have been studied [2]–[5]. Hydrogen (H2) is one of new environmental friendly resource as its combustion produces only water [1], [3]–[5] Also, the high energy content of H2
(122 KJ g-1) is comparable to the energy content of hydrocarbon fuels [5]. Hydrogen can be produced by chemical processes via electrophoresis or pyrolysis and biological processes using cyanobacteria, algae, fermentative bacteria and photosynthetic bacteria [1], [2], [6]. Biological processes offer advantages over chemical process for hydrogen production such as mild operation conditions and specific conversions [5]. There are, however, many limitations for biohydrogen production including (i) the cost of media or raw material [5], (ii) limitation of
206
W. Riansa-ngawong et al. / KMUTNB Int J Appl Sci Technol, Vol. 8, No. 3, pp. 205–212, (2015)
organic substances consumption by microorganisms, (iii) technology cost, and (iv) time consumption [6]. In the previous decade, the photosynthetic bacteria are favorable candidates for biohydrogen production because of its high substrate conversion efficiency and ability to use a wide variety of substrates to produce hydrogen [6]. To reduce the impact of medium costs, agro industrial wastewater is easily obtained. It contains high organic compounds and also benefits in the wastewater treatment by producing sustainable bioenergy [5]. Photosynthetic bacteria has been deployed in order to produce biohydrogen in wastewater such as palm oil mill effluents (POME) [1], tofu wastewater [7], sugar refinery wastes [8], straw paper mill effluents [8], and distillery wastewater [5]. Pickled bamboo shoot wastewater (PBSW) from Prachin Buri, a province of Thailand, is one of these sources of wastewater. It has a potential for being a good substrate for hydrogen production because of the large amount of wastewater that is generated annually, and its high acetic acid content [9]. However, this wastewater contains high salt concentration (6%, w/v) that has the effect on bacterial cell growth and biohydrogen production. There are several criteria for biohydrogen production by photosynthetic bacteria including the amount of organic load, pH, and light intensity. Photosynthetic bacteria use light for cell growth and hydrogen production. Photo-hydrogen production by photosynthetic bacteria is catalyzed by nitrogenase activity, which is depended on pH value [10]. Several researches indicated that pH has a considerable influence on both the specific hydrogen production rate and hydrogen yield [11]. Light intensity is also a very important factor in photosynthetic bacteria growth since photosynthetic bacteria convert light energy into chemical energy via anaerobic photosynthesis [12]. The hydrogen production system under variant light intensity than the optimal light intensity had resulted in a decrease in photosynthetic bacteria growth and hydrogen production rate [12], [13]. The system needs to be properly monitored to understand the effects of these factors. To undergo these criteria, biohydrogen productions from PBSW using Rhodopseudomonas palustris TN1 under anaerobic-light conditions with various initial pH and light intensity at room temperature (30±2ºC) were studied.
2 Material and Method
2.1 Pickle bamboo shoot wastewater (PBSW) preparation
Pickle bamboo shoot wastewaters (PBSW) were supported by the local agriculturists in Prachin Buri province, Thailand. PBSW were clarified by filtration process using the whatman filter paper No. 4 and freeze at -20ºC until used.
2.2 Bacteria and culture medium
Pre-cultures of Rps. palustris TN1 were grown anaerobically at pH 7.0 and room temperature (30 ± 2ºC) in GA medium, which is basal medium modified by the addition of 5 mM glutamate as a nitrogen source and 20 mM acetate as a carbon source [1]. PBSW was added 5 mM glutamate and trace elements according to Suwansaard et al [1]. Anaerobic conditions were established by flushing the sealed vials with argon gas. Both PBSW and GA medium were sterilized at 121ºC for 15 minutes by autoclave (Iwaki, ACV-3167N, Japan).
2.3 Optimization of batch conditions
Experiments were carried out by 25 mL vial bottles with working volume of 18 mL PBSW medium and 10% (v v-1) cells inoculum prepared by absorbent determination at 660 nm of 0.5. To investigate the effects of initial pH value (X1) (pH 6.50, 7.00, and 7.50) and light intensity (X2) (1,000, 3,000, and 5,000 lux) on cell growth and hydrogen production, 13 batch experiments (Table 1) were conducted by the central composite design (CCD) for 72 h cultivation time. The variables were coded according to equation (1) whereas a quadratic model (equation 2) was used to evaluate the optimization of environmental parameters and stepwise regression analysis.
(1)
where is the code value of an independent variable, Xi is a real value of an independent variable, Xi* is the real value of an independent variable at the center point of the experiment, and Δ Xi is the step change value.

207
W. Riansa-ngawong et al. / KMUTNB Int J Appl Sci Technol, Vol. 8, No. 3, pp. 205–212, (2015)
Y1 = β0 + β1 X1 + β2 X2 + β11 X 21 + β22 X
22 + β12 X1X2 (2)
where Y1 is the expected response value predicted from the RSM of hydrogen production; bi, bj, and bij are the parameters estimated from regression results. The response variable (Y1) was fitted using a predictive polynomial quadratic equation 2 in order to correlate the response variable to the independent variables. Regression analysis of hydrogen production was illustrated by Design Expert v. 9 (Stat-Ease., Inc., MN, USA) (trial version). The optimum levels of the selected variables were obtained by solving the regression equation and by analyzing the response surface plots. The quality of the fit of the quadratic model was expressed by the coefficient of determination R2 and its statistical significance was checked by the F-test (Table 4). The confirmation of this experiment was conducted by the Design Expert v. 9 (Table 5).
Table 1: Central composite experimental design matrix defining initial pH (X1) and light intensity (lux) (X2) results on the production of hydrogen and dry cell weight
TrialVariables Responses
X1 X2Hydrogen (mL L-1)
Dry cell weight(g L-1)
1 6.50 1,000 22.82 2.452 6.50 5,000 20.81 2.573 6.50 3,000 45.21 3.324 7.00 3,000 75.00 5.525 7.00 5,000 58.22 3.986 7.00 1,000 52.04 3.277 7.00 3,000 72.48 4.878 7.00 3,000 75.21 5.229 7.00 3,000 68.87 5.0710 7.00 3,000 74.67 5.4811 7.50 1,000 48.84 3.0112 7.50 3,000 68.90 4.9513 7.50 5,000 52.11 3.56
2.4 Analytical methods
The cumulative hydrogen yields were measured by a syringe technique for each test [1]. The hydrogen content of the biogas was measured using an Oldham MX-2100 gas detector (Cambridge Sensotec Ltd., England) [1].
Cell growth was determined as dry cell weight (DCW) [14]. The initial cells concentration was adjusted to 0.5 at 660 nm absorbance, and then converted to dry cell weight using a relationship curve between absorbance values and dry cell weights. The light intensity was measured using a digital lux-meter (LX-1010BS, China). The pH value was measured with a calibrated pH meter (Inolab pH, Germany). Acetic acid was determined by GC-FID (HP 6850, Hewlett-Packard) using a Stabilwax® -DA column. The flow rate of helium was 1.2 mL min-1. The temperatures of injection port and detection port were 230ºC and 250ºC, respectively. The injection volume was 1.0 µL. The initial temperature of the oven was 70ºC for 1 min, followed with a ramp of 20ºC min-1 to final temperature of 180ºC and then held for 2 min [15]. Standard acetic acids were run in the same condition. All experiments were studied in triplicate and data were expressed in average values. Statistical values were analyzed using ANOVA (SPSS statistic software version 16, USA).
3 Results and Discussion
3.1 Characteristic of PBSW
Physical and chemical properties of PBSW were studied (Table 2) before using as a substrate for hydrogen production by Rps. palustris TN1. It was found that PBSW was white with a lot of white sediments, sour odour, and initial pH of 3–4 with 6.0% salt (NaCl) concentration. Acetic acid concentration was 6.12 g L-1 used as a carbon source to produce hydrogen gas by Rps. palustris TN1 [1].
Table 2: Characteristic of PBSW before using as a substrate for hydrogen production by Rps. palustris TN1
Parameters Value1. Color white with sediments2. Odour Sour3. pH 3–44. Salt concentration (%) 65. Acetic acid (g L-1) 6.126. COD (g L-1) 19.97. BOD (g L-1) 11.2

208
W. Riansa-ngawong et al. / KMUTNB Int J Appl Sci Technol, Vol. 8, No. 3, pp. 205–212, (2015)
3.2 Optimization of hydrogen production from PBSW
Response surface methodology (RSM) is an efficient tool to create the relationship of the interesting variables with the obtained plots. The data analysis was done by fitting the experimental data in the smooth plot, which was plotted by calculation of the specific predicted plots. Therefore, RSM is more professionally than that of traditional design [15]. The effective variables in the hydrogen production from PBSW by Rps. palustris TN1 were optimized. The results of 13 experiments (Table 1) indicated that hydrogen gas was generated in the range of 20.81–75.21 mL L-1. High hydrogen productions (58.22–75.21 mL L-1) were achieved at an initial pH of 7.00–7.50 and light intensity of 3,000–5,000 lux (trials 4, 5, 7–10 and 12). The maximum hydrogen production (75.21 mL L-1) was achieved under pH 7.0 and light intensity of 3,000 lux (trials 8). The lower initial pH (at 6.50) and the lower light intensity (at 1,000 lux) would cause the unsuitable conditions for cell growth (2.45 g L-1) (trials 1). Light provides the energy support ing photosynthetic bacteria (PSB) growth.Therefore, optimal light intensity should be used to produce the highest hydrogen yield and make PSB cultivation economically sustainable [12]. In this study, the moderate light intensity of 3,000 lux was the optimal
condition produced the highest of hydrogen gas (75.21 mL L-1) with cell concentration of 5.52 g L-1 (Table 1). This result was contrasted to that of bacteriochlorophyll production for growth of Rhodopseudomonas sp., which was found that the optimal light intensity was at 500–1,000 lux and 8,000 lux [12]. Thus, hydrogen production and bacterial growth require an intensive light energy containing specific light wavelength depending on bacteriochlorophylls [13]. Moreover, hydrogen production by PSB is not only dependent on different optimal light intensities, but also on different light sources [13]. The tungsten lamp (used in this study) provides a variety of light wavelength that would be a suitable light source than a long-wavelength light-emitting diode (LW-LED) providing light wavelength ranges of 770–920 nm [13] because the maximum absorbance of bacteriochlorophylls of Rps. palustris TN1 were 380, 477, 504 and 807 nm [16]. However, the best light sources for the growth of Rps. palustris were reported to be LED blue (470 nm) [17] and LED red (650 nm) [18]. On the contrary, hydrogen production rate by Rps. palustris CQK was higher at 590 nm than at 470 nm or 630 nm [19]. Light wavelength ranges of 500–700 nm have more penetrates deeply into the cell suspension than others wavelength [20]. Thus, differences of PSB stains have different light intensities and different light sources as shown in Table 3.
Table 3: Comparisons of the optimal initial pH and light intensity of the different PSB stain used for hydrogen production
PSB stain Optimal initial pH
Optimal light intensity (lux) Light source
Hydrogen productivity (mL L-1 h-1)
Dry cell weight(g L-1)
Reference
Rhodovulum sulfidophilum P5 8.0 7,000 Tungsten lamp 19.40 0.60 [3]
Rhodopseudomonas sp 7.0 500-1,000 and 4,000-8,000 n/a n/a 2.64 [12]
Rhodobacter capsulatus 6.8 30,000 Sodium-vapour lamp 50.00 4.50 [2]
Rhodopseudomonas capsulatus 7.0 4,000 Tungsten lamp 17.60 n/a [11]Rhodopseudomonas palustris - 10,000 n/a 16.12 0.20 [21]Rhodopseudomonas palustris 7.0 6,000 lamplight 16.40 n/a [22]Rhodopseudomonas palustris WP3-5 7.0 2,850* Tungsten lamp 21.20 n/a [23]
Rhodopseudomonas palustris TN1
7.3 3,000 Tungsten lamp 1.02** 5.36 This study
*converted from 95 W m-2
n/a refer to not available
209
W. Riansa-ngawong et al. / KMUTNB Int J Appl Sci Technol, Vol. 8, No. 3, pp. 205–212, (2015)
1000 2000
3000 4000
5000
6.5 6.7
6.9 7.1
7.3 7.5
2
3
4
5
6
A: Initial pHB: Light intensity (Lux)
DC
W (g
/L)
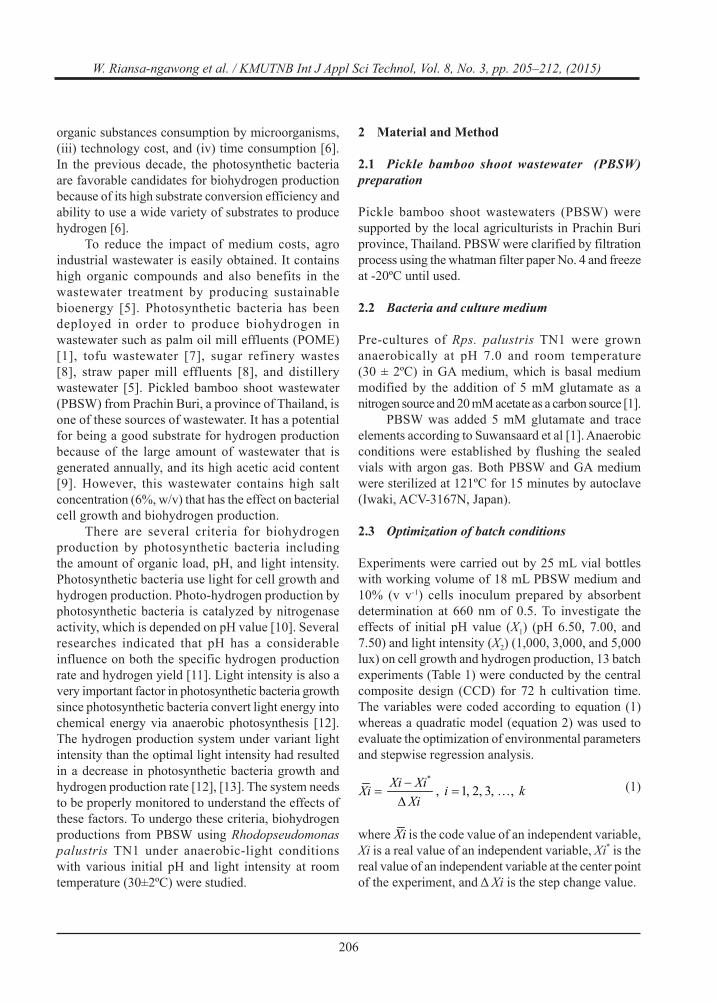
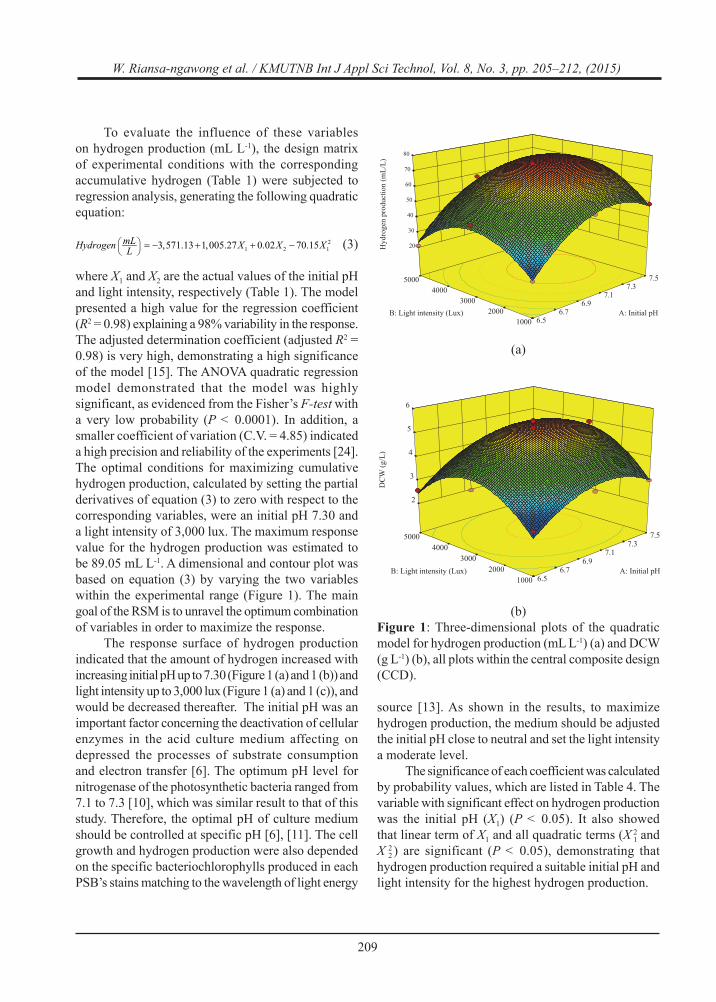
To evaluate the influence of these variables on hydrogen production (mL L-1), the design matrix of experimental conditions with the corresponding accumulative hydrogen (Table 1) were subjected to regression analysis, generating the following quadratic equation:
(3)
where X1 and X2 are the actual values of the initial pH and light intensity, respectively (Table 1). The model presented a high value for the regression coefficient (R2 = 0.98) explaining a 98% variability in the response. The adjusted determination coefficient (adjusted R2 = 0.98) is very high, demonstrating a high significance of the model [15]. The ANOVA quadratic regression model demonstrated that the model was highly significant, as evidenced from the Fisher’s F-test with a very low probability (P < 0.0001). In addition, a smaller coefficient of variation (C.V. = 4.85) indicated a high precision and reliability of the experiments [24]. The optimal conditions for maximizing cumulative hydrogen production, calculated by setting the partial derivatives of equation (3) to zero with respect to the corresponding variables, were an initial pH 7.30 and a light intensity of 3,000 lux. The maximum response value for the hydrogen production was estimated to be 89.05 mL L-1. A dimensional and contour plot was based on equation (3) by varying the two variables within the experimental range (Figure 1). The main goal of the RSM is to unravel the optimum combination of variables in order to maximize the response. The response surface of hydrogen production indicated that the amount of hydrogen increased with increasing initial pH up to 7.30 (Figure 1 (a) and 1 (b)) and light intensity up to 3,000 lux (Figure 1 (a) and 1 (c)), and would be decreased thereafter. The initial pH was an important factor concerning the deactivation of cellular enzymes in the acid culture medium affecting on depressed the processes of substrate consumption and electron transfer [6]. The optimum pH level for nitrogenase of the photosynthetic bacteria ranged from 7.1 to 7.3 [10], which was similar result to that of this study. Therefore, the optimal pH of culture medium should be controlled at specific pH [6], [11]. The cell growth and hydrogen production were also depended on the specific bacteriochlorophylls produced in each PSB’s stains matching to the wavelength of light energy
source [13]. As shown in the results, to maximize hydrogen production, the medium should be adjusted the initial pH close to neutral and set the light intensity a moderate level. The significance of each coefficient was calculated by probability values, which are listed in Table 4. The variable with significant effect on hydrogen production was the initial pH (X1) (P < 0.05). It also showed that linear term of X1 and all quadratic terms (X
21 and
X 22 ) are significant (P < 0.05), demonstrating that
hydrogen production required a suitable initial pH and light intensity for the highest hydrogen production.
(b)Figure 1: Three-dimensional plots of the quadratic model for hydrogen production (mL L-1) (a) and DCW (g L-1) (b), all plots within the central composite design (CCD).
Hyd
roge
n pr
oduc
tion
(mL/
L)
1000 2000
3000 4000
5000
6.5 6.7
6.9 7.1
7.3 7.5
20
30
40
50
60
70
80
A: Initial pHB: Light intensity (Lux)
(a)

210
W. Riansa-ngawong et al. / KMUTNB Int J Appl Sci Technol, Vol. 8, No. 3, pp. 205–212, (2015)
Table 4: Model coefficient and analysis of variance estimated by ANOVA for hydrogen production
ParameterHydrogen production
Coefficient estimate Probability
Intercept 73.63 -
X1 13.50 < 0.0001a
X2 1.24 0.3044
X1 X2 1.32 0.3675
X 21 -17.54 < 0.0001a
X 22 -19.46 < 0.0001a
Model - < 0.0001a
R2b 0.98 -
Adjusted R2b 0.97 -
C.V.c 4.85 -
a Significant level at 95%.b R2 = Regression coefficientc C.V. = coefficient value
Three replicates of batch experiments were performed under the optimal conditions calculated by RSM (Table 5). The confirmation experiments indicate that the experimental value of hydrogen yield (73.84 ± 7.12 mL L-1) was not significantly difference (P < 0.05) from its predicted value (75.67 mL L-1) with desirability of 1.00 (Figure 2). After optimization, hydrogen production slightly decreased compared with the central conditions, but it was not significantly difference (P < 0.05).
Table 5: The confirmation experiments for hydrogen production using the optimal conditions
Trials Conditions X a1 X2
Hydrogen (mL L-1)
Predicted Measured
- Optimalb 7.12 3,200 75.87c 73.84 ± 7.12c
8 Central 7.00 3,000 - 75.21 ± 6.12c
a X1: initial pH and X2: light intensity (lux).b Based on hydrogen production.c Not significant at a level of P < 0.05.
4 Conclusions
The maximum hydrogen production from PBSW by Rps. palustris TN1 was 73.84 ± 7.12 mL L-1 under the optimal conditions of the specific initial pH 7.12 with specific light intensity of 3,200 lux (R2 = 0.98).
Therefore, PBSW could be used as an agro-industrial substrate for production of clean energy product.
Acknowledgements
This research was financially supported by Science and Technology Research Institute (STRI), King Mongkut’s University of Technology North Bangkok, Thailand.
References
[1] M. Suwansaard, W. Choorit, J.H. Zeilstra-Ryalls, and P. Prasertsan, “Isolation of anoxygenic photosynthetic bacteria from Songkhla Lake for use in a two-staged biohydrogen production process from palm oil mill effluent,” Int. J. Hydrogen Energ., vol. 34, pp. 7523–7529, 2009.
[2] J. Obeid, J. P. Magnin, J. M. Flaus, O. Adrot, J. C.
Figure 2: Confirmation graph of the quadratic model for desirability within the central composite design (CCD) of initial pH and light intensity.

211
W. Riansa-ngawong et al. / KMUTNB Int J Appl Sci Technol, Vol. 8, No. 3, pp. 205–212, (2015)
Willison, and R. Zlatev, “Modelling of hydrogen production in batch cultures of the photosynthetic bacterium Rhodobacter capsulatus,” Int. J. Hydrogen Energ., vol. 34, pp. 180–185, 2009.
[3] J. Cai and G. Wang, “Hydrogen production by a marine photosynthetic bacterium, Rhodovulum sulfidophilum P5, isolated from a shrimp pond,” Int. J. Hydrogen Energ., vol. 37, pp. 15070–15080, 2012.
[4] X. Wu, X. Wang, H. Yang, and L. Guo, “A comparison of hydrogen production among three photosynthetic bacterial strains,” Int. J. Hydrogen Energ., vol. 35, pp. 7194–7199, 2010.
[5] S. N. Malik, V. Pugalenthi, A. N. Vaidya, P. C. Ghosh, and S.N. Mudliar, “Kinetics of nano-catalysed dark fermentative hydrogen production from distillery wastewater,” Energy Procedia, vol. 54, pp. 417–430, 2014.
[6] Y. Z. Wang, Q. Liao, X. Zhu, J. Li, and D. J. Lee, “Effect of culture conditions on the kinetics of hydrogen production by photosynthetic bacteria in batch culture,” Int. J. Hydrogen Energ., vol. 36, pp. 14004–14013, 2011.
[7] H. G. Zhu, T. Suzuki, A. A. Tsygankov, Y. Asada, and J. Miyake, “Hydrogen production from tofu wastewater by Rhodobacter sphaeroides immobilized in agar gels,” Int. J. Hydrogen Energ., vol. 24, pp. 305–310, 1999.
[8] M. Vincenzini, R. Materassi, M. R. Tredici, and G. Florenzano, “Hydrogen production by immobilized cells-II H2-photoevolution and wastewater treatment by agar-entrapped cells of Rhodopseudomonas palustris and Rhodospirillum molischianum,” Int. J. Hydrogen Energ., vol. 7, pp. 725–728, 1982.
[9] J. D. Dagoon, Applied Nutrition and Food Technology, Rex Book Store, 1993, pp. 231–233.
[10] H. Koku, I. Eroglu, U. Gunduz, M. Yucel, and L. Turker, “Aspects of the metabolism of hydrogen production by Rhodobacter sphaeroides,” Int. J. Hydrogen Energ., vol. 27, pp. 1315–1329, 2002.
[11] X. Y. Shi, W. W. Li, and H. Q. Yu, “Key parameters governing biological hydrogen production from benzoate by Rhodopseudomonas capsulate,” Appl. Energ., vol. 133, pp. 121–126, 2014.
[12] Q. Zhou, P. Zhang, and G. Zhang, “Biomass and carotenoid production in photosynthetic bacteria
wastewater treatment: Effect of light intensity,” Bioresource Technol., vol. 171, pp. 330–335, 2014.
[13] Y. Kawagoshi, Y. Oki, I. Nakano, A. Fujimoto, and H. Takahashi, “Biohydrogen production by isolated halotolerant photosynthetic bacteria using long-wavelength light-emitting diode (LW-LED),” Int. J. Hydrogen Energ., vol. 35, pp. 13365–13369, 2010.
[14] W. Riansa-ngawong, M. Suwansaard, and P. Prasertsan, “Application of palm pressed fiber as a carrier for ethanol production by Candida shehatae TISTR5843,” Electron. J. Biotechnol., vol. 15, 2012, DOI: 10.2225/vol15-issue6-fulltext-1.
[15] W. Riansa-ngawong and P. Prasertsan, “Optimization of furfural production from hemicellulose extracted from delignified palm pressed fiber using a two-stage process,” Carbohyd. Res., vol. 346, pp. 103–110, 2011.
[16] M. Suwansaard, “Production of hydrogen and 5-aminolevulinic acid by photosynthetic bacteria from palm oil mill effluent,” Thesis, Prince of Songkla University, 2010.
[17] F. S. Kuo, Y. H. Chien, and C. J. Chen, “Effects of light sources on growth and carotenoid content of photosynthetic bacteria Rhodopseudomonas palustris,” Bioresource Technol., vol. 113, pp. 315– 318, 2012.
[18] Q. Zhou, P. Zhang, and G. Zhang, “Biomass and pigments production in photosynthetic bacteria wastewater treatment: Effects of light sources,” Bioresource Technol., vol. 179, pp. 505–509, 2015.
[19] X. Tian, Q. Liao, W. Liu, Y. Z. Wang, X. Zhu, J. Li, and H. Wang, “Photo-hydrogen production rate of a PVA-boric acid gel granule containing immobilized photosynthetic bacteria cells,” Int. J. Hydrogen Energ., vol. 34, pp. 4708–4717, 2009.
[20] E. Nakada, Y. Asada, T. Arai, and J. Miyake, “Light penetration into cell suspensions of photosynthetic bacteria and relation to hydrogen production,” J. Ferment. Bioeng., vol. 80, pp. 53–59, 1995.
[21] J. Fibler, C. Schirra, G. Kohring, and F. Giffhorn, “Hydrogen production from aromatic acids by Rhodopseudomonas palustris,” Appl. Microbiol. Biot., vol. 41, pp. 395–399, 1994.
212
W. Riansa-ngawong et al. / KMUTNB Int J Appl Sci Technol, Vol. 8, No. 3, pp. 205–212, (2015)
[22] H. Su, J. Cheng, J. Zhou, W. Song, and K. Cen, “Improving hydrogen production from cassava starch by combination of dark and photo fermentation,” Int. J. Hydrogen Energ., vol. 34, pp. 1780–1786, 2009.
[23] C. Y. Chen, K. L. Yeh, Y. C. Lo, H. M. Wang, and J. S. Chang, “Engineering strategies for the enhanced photo-H2 production using effluents of dark fermentation processes as substrate,” Int.
J. Hydrogen Energ., vol. 35, pp. 13356–13364, 2010.
[24] S. O-Thong, P. Prasertsan, S. Dhamwichukorn, and N-K. Birkeland, “Optimization of simultaneous thermophilic fermentative hydrogen production and COD reduction from palm oil mill effluent by Thermoanaerobacterium-rich sludge,” Int. J. Hydrogen Energ., vol. 33, pp. 1221–1231, 2008.