optimization of narva district heating network...
TRANSCRIPT

Oil Shale, 2009, Vol. 26, No. 3 Special, pp. 269–282 ISSN 0208-189X doi: 10.3176/oil.2009.3S.09 © 2009 Estonian Academy Publishers
OPTIMIZATION OF NARVA DISTRICT HEATING NETWORK AND ANALYSIS OF COMPETITIVENESS OF OIL SHALE CHP BUILDING IN NARVA
A. HLEBNIKOV*, N. DEMENTJEVA, A. SIIRDE Department of Thermal Engineering, Tallinn University of Technology, 116 Kopli St., 11712 Tallinn, Estonia
AS Narva Elektrijaamad owns two the world’s largest oil shale-fired power plants – Balti Elektrijaam (Balti Power Plant) and Eesti Elektrijaam (Eesti Power Plant). The new fluidized-bed energy block No. 11 of Balti Power Plant is operated in cogeneration mode to provide the district-heating system of Narva. The energy market prices of heat for all consumer groups have increased significantly. High heat losses and poor technical condition of the old district-heating networks decrease the future of centralized heating, and consumers make choice in favor of local heating. High heat losses of Narva district heating are caused by poor thermal insulation and over-dimensioning of pipes. Objective estimation of actual conditions of district-heating net-works and technical-economical argumentation for renovation and expansion of networks should be carried out to increase the share of heat production based on CHP and to decrease fuel consumption. For minimization of heat distribution expenses DH network should be optimized. The opportunities of building heat supply alternatives in Narva are also investigated. Four scenarios of heat supply alternatives were analyzed using energy planning models.
Introduction
At building, capacity of combined heat and power plants (CHP) follows basically from thermal loading. The new fluidized-bed energy block No. 11 of Balti Power Plant is operated in cogeneration mode to provide the district-heating system of Narva.
Poor condition of district-heating (DH) networks and unreliable heat supply can decrease the future of district heating, and consumers have to make choice for different heat supply alternative. Often the decentralized heating is no effective solution for regional heat supply strategy decreasing * Corresponding author: e-mail [email protected]

A. Hlebnikov et al 270
the potential of combined heat and power production. Objective estimation of actual conditions in DH networks and technical-economical argumenta-tion for their renovation and expansion should be carried out to increase the share of heat production based on CHP and decrease fuel consumption. For decreasing the heat distribution cost, DH networks should be optimized.
Main characteristic parameters of the DH network of Narva city and their difference from the optimal values are estimated and compared with the typical Swedish networks [1]. The current comparison gives an example for economic optimization of Narva old unoptimized district-heating network. The purpose of optimization is to get minimal costs of heat distribution. The potential for increasing the efficiency of Narva DH network was established.
For analysis of competitiveness of oil shale CHP the opportunities of building heat supply alternatives in Narva also are investigated. Four scenarios of heat supply alternatives were analyzed using two energy-planning models. The economical reasonability of building new units near Narva city is given.
Methodology Method of estimation of DH networks
The major characteristic parameter for estimating the efficiency of the DH networks is heat loss factor qhlf. The heat loss factor is a ratio of the heat loss to the quantity of heat supplied to the DH network. The heat loss factor does not depend only on the efficiency of pipe insulation. It depends on the following parameters:
– The overall heat transfer coefficient Ko, in W/(m2·K), which charac-terizes the efficiency of pipe insulation;
– The specific surface area of the distribution pipes A/L, in m2/m, which characterizes the average size of the district heating pipes;
– The degree-hour number ∫Θdτ, in °C·h, which indicates the level of water distribution temperature relative to the annual average of the out-door temperature;
– The specific heat supply Q/L, in MWh/m, which characterizes the concentration of the district heating demand.
Where A – surface area of the distribution pipes, m2; L – pipes’ length, m; Θ – difference between water average temperature and outdoor temperature,
°C; τ – duration of difference between average and outdoor temperatures of
water, h; Q – annual quantity of the heat supplied to the district-heating network,
MWh. The overall heat transfer coefficient can be calculated on the basis of
design data of the district networks or estimated from the heat loss measure-

Optimization of Narva District Heating Network ...
271
ments. In the present work the overall heat transfer coefficient is calculated on the basis of the annual heat losses. The annual heat losses are calculated as the difference between the heat supplied to the DH network and the heat measured at the consumers.
The heat loss factor is given by
( / )( / )
ohlfhlf o
K A Θd A L ΘdQq K
Q Q Q Lτ τ⋅ ⋅ ⋅
= = = ⋅∫ ∫ , (1)
where Qhlf – the annual distribution heat loss, MWh. The overall heat transfer coefficient Ko is given by
( / )( / )
hlfo
qK
A L Θ dQ L
τ= ⋅
∫, W/(m2·K). (2)
The average diameter of the district heating pipes da is given by:
/2aA Ld
π=
⋅, m. (3)
For analyzing the efficiency of the DH network, heat loss factor can be divided into two parts: the overall heat transfer coefficient and the distribu-tion parameter. The distribution parameter is given by
( / )( / )
hlfdp
o
A L dqq
K Q Lθ τ⋅
= = ∫ , (m2·K)/W. (4)
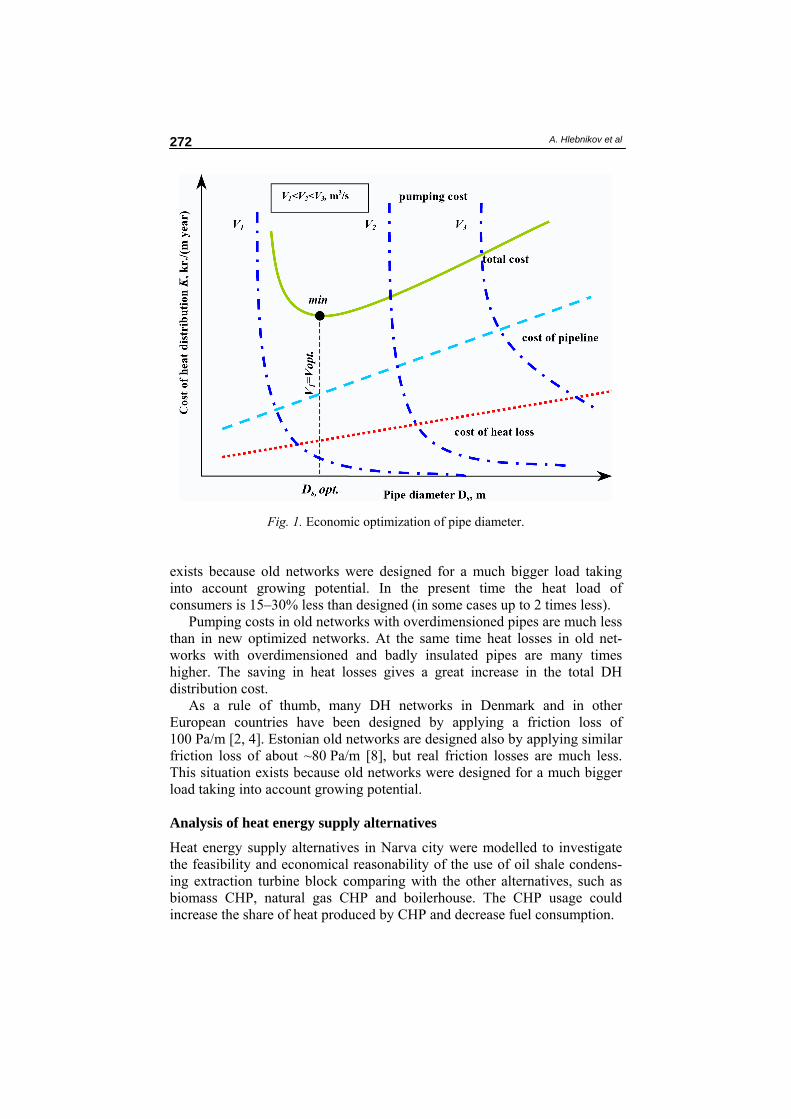
The question how to select the optimal diameter of pipes in which a fluid is transported represents a classical optimization problem [2-4]. Figure 1 shows qualitatively how an economic optimum can be found for the dia-meter of the district-heating pipe. Total cost is the sum of costs for pipeline installation, for heat losses, and for pumping power. Of these three cost elements, the costs of pipeline installation and heat losses increase strongly with diameter, while the pumping power drops rapidly (Kpumping ~Ds
5) with diameter increasing.
Optimization of this kind usually assumes that the flow rate is constant when the diameter is varied. This method was developed to be as simple as possible yet complete and accurate enough for design calculations.
Dynamic simulation models of DH networks today are also very popular. One type of the mathematical model involves a full physical modeling of the network [6] and in the other type of model DH network is replaced by a simplified one [7].
Water velocities and friction losses in pipes of Estonian old DH networks, as a rule, are much lower than their optimum values. This situation
A. Hlebnikov et al 272
Fig. 1. Economic optimization of pipe diameter.
exists because old networks were designed for a much bigger load taking into account growing potential. In the present time the heat load of consumers is 15–30% less than designed (in some cases up to 2 times less).
Pumping costs in old networks with overdimensioned pipes are much less than in new optimized networks. At the same time heat losses in old net-works with overdimensioned and badly insulated pipes are many times higher. The saving in heat losses gives a great increase in the total DH distribution cost.
As a rule of thumb, many DH networks in Denmark and in other European countries have been designed by applying a friction loss of 100 Pa/m [2, 4]. Estonian old networks are designed also by applying similar friction loss of about ~80 Pa/m [8], but real friction losses are much less. This situation exists because old networks were designed for a much bigger load taking into account growing potential.
Analysis of heat energy supply alternatives
Heat energy supply alternatives in Narva city were modelled to investigate the feasibility and economical reasonability of the use of oil shale condens-ing extraction turbine block comparing with the other alternatives, such as biomass CHP, natural gas CHP and boilerhouse. The CHP usage could increase the share of heat produced by CHP and decrease fuel consumption.

Optimization of Narva District Heating Network ...
273
Modeling is one of complicated forecasting methods. Mathematical modeling means the description of economical vision by using mathematical formulas, equations and inequalities. Models become often useful when analyzing complex systems with large amount of data. The most popular tool for new capacity planning is energy planning models, where using comparatively low input data could get reliable results.
Models are built for various purposes and consequently have different characteristics and applications. The energy models could be classified as follows: by purposes of energy models (general and specific), the model structure (internal and external assumptions) and the analytical approach (top-down, bottom-up, hybrid), by the methodology, the mathematical approach (linear, mixed-integer and dynamic), geographical coverage, sectoral coverage, the time horizon and data requirements [9].
In recent years, the total number of available energy models has grown extremely because of the expanding computer possibilities. The main modeling problem has been the lack of baseline data or inexact input data, and the model’s results are used in the case of reliable and accurate baseline data. For investigation of the opportunities of new heat energy supply alternatives in Narva two energy planning models, EnergyPlan and RETScreen® Inter-national models, were reviewed. These models were analysed and the scenarios were calculated for comparing the difference between the results of two chosen models and finding out whether the results are reliable.
The EnergyPlan model is a computer model for energy system analysis. The main purpose of the model is to assist the design of national energy planning strategies on the basis of technical and economic analyses of the consequences of different national energy systems and investments. The model can be used for different kinds of energy system analyses: technical analysis, market exchange analysis and feasibility studies. The EnergyPlan model consists of the following overall structure components: Front page, Input, Cost, Regulation, Output and Settings. Inputs defined by the user are presented in three sections: Input, Cost, and Regulation [10].
RETScreen® International is a clean energy awareness, decision-support and capacity building tool. The core of the tool consists of a standardized and integrated clean energy project analysis software that can be used worldwide to evaluate the energy production, life-cycle costs and green-house gas emission reductions for various types of energy efficient and renewable energy technologies. Five steps of the standard project analysis of RETScreen flow charts are Energy Model, Cost Analysis, Greenhouse Gas Analysis, Financial Summary and Sensitivity & Risk Analysis.
High-quality but low-cost pre-feasibility and feasibility studies are critical to helping the project proponent “screen out” projects that do not make financial sense, as well as to helping focus development and engineering efforts prior to construction. Each step of this process could represent an increase of one order in expenditures and a halving of the uncertainty in the project cost-estimate. This is illustrated in Fig. 2, where the level of un-

A. Hlebnikov et al 274
Fig.
2. T
he u
sual
seve
ral s
teps
of t
he p
roje
ct a
nd a
ccur
acy
of p
roje
ct c
ost e
stim
ate.

Optimization of Narva District Heating Network ...
275
certainty in estimates decreases from ±50% to 0%, while the energy project implementation process is progressing from the pre-feasibility to the commissioning stages [11].
Using these two models four scenarios (pre-feasibility studies) of build-ing new capacity in Narva were generated and analyzed:
− Scenario 1: Oil shale CHP unit at Balti PP. − Scenario 2: CHP unit, where the main fuel is natural gas. − Scenario 3: Boilerhouse, where the main fuel is natural gas. − Scenario 4: Biomass/Peat CHP unit.
First, the selection of scenarios was based on local oil shale availability from this region where oil shale-based Narva Power Plant works, and second on the possibility to compare cogeneration technology and boilerhouse economy.
The annual heat energy demand in Narva is about 475 GWh. Expected thermal capacity of units is about 170–175 MW and electrical capacity about 60–65 MW. The annual electricity production at units in the case of Scenarios 1, 2 and 3 would be approximately 160 GWh. The main input data for these analyses are the production of electricity and heat, fuel types, fuel costs, efficiency of processes and the investments of projects according to the available data. The investment and other costs are informative and needed further research for more accurate analysis. Also the existing library of distribution data of Nord Pool electricity prices in 2006 in the EnergyPlan model was used. For all four scenarios the primary energy consumption, CO2 emissions and production price were calculated and compared.
Using RETScreen Software in the Financial Summary worksheet it is possible to calculate several financial feasibility indicators such as internal rate of return IRR, the net present value (NPV) and simple payback of the projects.
The internal rate of return IRR is the discount rate that causes the NPV of the project to be zero. It is calculated by solving the following formula for IRR:
00
(1 )
Nn
nn
CIRR=
=+∑ , (5)
where N is the project life in years and nC – the cash flow for the year n. The net present value NPV of a project is the value of all future cash
flows, discounted at the discount rate, in today’s currency. It is calculated by discounting all cash flows as given in the following formula:
0 (1 )
Nn
nn
CNPVr=
=+∑%
, (6)
where nC% is the after-tax cash flow, r – the discount rate. The simple payback SP is the number of years it takes for the cash flow
(excluding debt payments) to equal the total investment, which is equal to the sum of the debt and equity:

A. Hlebnikov et al 276
( ) ( )ener capa RE GHC O M fuel
C IGSPC C C C C Cα
−=+ + + − +
, (7)
where C is the total initial cost of the project, IG – the incentives and grants, enerC – the annual energy savings or income, capaC – the annual capacity
savings or income, REC – the annual renewable energy production credit income, GHCC – the GHG reduction income, O MC α – the yearly operation and maintenance costs incurred by the clean energy project, fuelC – the annual cost of fuel or electricity [11].
Results
• The relative heat losses in the Narva old network are about 18–19%. In Swedish typical networks relative heat losses are 7–9%, and there is the similar heat demand concentration than in Narva: 5–7 MWh/m, but much better heat insulation of pipes: overall heat transfer coefficient is 0.9–1.1 W/(m2K) (in Narva 1.8–2.0 W/(m2K)), more than two times less than in Narva network. Efficiency of heat insulation for Narva network, which is estimated by the overall heat transfer coefficient, is about three times less than the same value for the ordinary Swedish networks. Total overall heat transfer coefficients before and after prospective optimiza-tion for Narva DH network are presented in Fig. 3.
0
0.5
1
1.5
2
2.5
3
3.5
0 0.05 0.1 0.15 0.2 0.25 0.3 0.35 0.4
dpipe, m
Ko,
W/(m
2 K)
Preinsulated pipeKesklinna SVRMustamäe SVRLasnamäe SVRLokaalvõrkude SVRordinary Swedish networksTallinna KüteNarva old networkNarva optimized network
Fig. 3. Total overall heat transfer coefficient before and after prospective optimiza-tion for Tallinn and Narva district heating networks.
Optimization of Narva District Heating Network ...
277
• After optimal selection of network pipes’ diameters (new optimal average diameter will be 0.198 m), according to consumers real heat demand and total renovation of pipes (replacing by the preinsulated pipes), relative heat losses drastically decrease. Relative heat losses, for example in Narva network decrease from 17–18% to 7–8%. As we can see, decreasing potential of heat losses is very big. After optimization and total renovation of old networks, heat losses can decrease up to three times. Recently, a considerable tendency for reduction of the overall heat transfer coefficient in the DH networks in Narva was observed (from 2.3 W/(m2K) to 1.8–2.0 W/(m2K)). This reduction is caused by replacement of old thermal insulation of DH network sections with new one (main pipelines TM1 and TM2 in 2003–2005). Several “wet” sections of the network can significantly increase the value of the heat transfer coefficient. Replace-ment of these sections will significantly decrease the overall heat transfer coefficient. Table 1 presents the major characteristic parameters found for Narva old unoptimized DH network. For the observed network also optimization calculations were done, and it was determined, how much these values would improve.
• The calculations made in the EnergyPlan and RETScreen model and their results are presented in simplified tables (Tables 2, 3), and comparison of the results of two energy planning models is presented in Table 4. The simplified tables use the relative information about fuel, investments, primary energy and production prices considering that in the case of changes in fuel and investment costs the price relations will be same. The production prices include the electricity and heat energy production prices and could be put together because of the same combined power plant total output. Generally, the RETScreen model uses a hybrid method for calculation the heat and electrical energy price, where variable costs are shared: fuel, electricity and environmental charges in accordance with the physical method as well as fixed costs in accordance with heat and electricity production. The electricity price could be the input parameter as well. The Energy Plan model uses the existing library of electricity and heat prices. In this case the existing library of distribution data of Nord Pool electricity prices in 2006 was used.
• The difference between the results of EnergyPlan and RETScreen models for production price is approximately 5% in Scenarios 1, 2 and 4, primary energy consumption per production for all scenarios is about 4%, and for CO2 emissions in Scenarios 1, 2 and 3 is 4.3% (see Table 4). The higher production price in Table 3 compared with the results of Table 2 at the same investment and with better use of primary energy is explained by more accuracy and the difference in the characteristics of the equipment of the second model (RETScreen). In this analysis the investment and other costs are informative and need further research for a more accurate analysis.

Oil
Sha
le, 2
009,
Vol
. 26,
No.
3 S
peci
al, p
p. 2
69–2
82
ISS
N 0
208-
189X
do
i: 10
.317
6/oi
l.200
9.3S
.09
© 2
009
Est
onia
n A
cade
my
Pub
lishe
rs
Tabl
e 1.
The
maj
or c
hara
cter
istic
par
amet
ers f
or N
arva
dis
tric
t hea
ting
netw
ork
befo
re a
nd a
fter
pro
spec
tive
optim
izat
ion
and
com
pari
son
with
ord
inar
y Sw
edis
h ne
twor
ks
Ave
rage
year
Su
pplie
d he
at,
MW
h
Use
d he
at,
MW
h
Net
wor
k he
at
loss
es,
MW
h
Net
wor
k he
at
loss
es,
%
Deg
ree-
hour
s 10
5 , °C
h
q hlf
L, m
d a
, mA/
L,
m2 /m
V/L,
m
3 /m
Qsu
ppl/L
, M
Wh/
mQ
used
/L,
MW
h/m
Qsu
ppl/V
, M
Wh/
m3
Qhe
at
loss
/L,
MW
h/m
Ko,
W/(m
2 K)
q jt,
(m2 K
)/W
Nar
va o
ld
netw
ork
577
402
474
400
103
002
17.8
4.
9 0.
178
68 5
690.
249
1.56
0.15
8.
4 6.
9 57
.5
1.5
2.0
0.09
1
Nar
va
new
op
timiz
ed
netw
ork
510
453
474
400
3605
3 7.
1 4.
9 0.
071
68 5
690.
198
1.24
0.06
7.
4 6.
9 12
0.9
0.5
0.7
0.08
2
Ord
inar
y Sw
edis
h ne
twor
ks
5.6
0.07
–0.
085
0.88
–0.
942
0.03
1–0.
035
5–6
16
2–17
00.
35–
0.43
0.
9–1.
1
278 A. Hlebnikov et al

Optimization of Narva District Heating Network .. 279
Table 2. Results of applying EnergyPlan model
EnergyPlan Fuel,kr/MWh
Investments, mln.kr/MW
Production price,
kr/MWh
Primary energy consumption per
production, GWh/GWh
CO2 emission,
Mt
1. Scenario (Oil shale unit at Balti PP)
54 1.3 1 080 1.42 0.33
2. Scenario (CHP – main fuel is nat. gas)
305 1.0 1 165 1.19 0.15
3. Scenario (Boilerhouse – main fuel is nat. gas)
305 0.5 665 0.85 0.11
4. Scenario (Biomass/Peat CHP)
62 1.0 861 1.23 0.00
Table 3. Results of applying RETScreen model
RETScreen Fuel, kr/MWh
Investments, mln.kr/MW
Production price,
kr/MWh
Primary energy consumption per
production, GWh/GWh
CO2 emission,
Mt
1. Scenario (Oil shale unit at Balti PP)
54 1.3 1 255 1.39 0.32
2. Scenario (CHP – main fuel is nat. gas)
305 1.0 1 177 1.15 0.15
3. Scenario (Boilerhouse – main fuel is nat. gas)
305 0.5 665 0.81 0.10
4. Scenario (Biomass/Peat CHP)
62 1.0 870 1.18 0.00
Table 4. Results of comparing EnergyPlan and RETScreen models
EnergyPlan vs. RETScreen Production price, kr/MWh
Primary energy consumption per
production, GWh/GWh
CO2 emission, Mt
1. Scenario (Oil shale unit at Balti PP)
–175 –14.0% 0.03 2.0% 0.01 3.7%
2. Scenario (CHP – main fuel is nat.gas)
–12 –1.1% 0.04 3.3% 0.01 3.5%
3. Scenario (Boilerhouse – main fuel is nat.gas)
0 – 0.04 4.4% 0.01 5.6%
4. Scenario (Biomass/Peat CHP)
–9 –1.1% 0.05 4.2% 0.00 –

A. Hlebnikov et al 280
• The RETScreen energy model has more detailed input requirements for new energy capacity planning and therefore it could be more useful for such kind of analyses. Also the RETScreen model has the possibility of detailed selection of technical equipment and calculation of financial indicators. The EnergyPlan model is more useful for planning the energy balance for the whole country and for the new capacities while it does not enable to calculate the financial feasibility indicators and payback of the project. However, both of the models could be equally used for the pre-feasibility study of new capacity planning projects. The differences in the results of reviewed models are marginal, the models are indicative of scenarios’ development and could be useful for comparing the fundamental technological processes. One of the advantages of using these models is that they allow to get reliable results using comparatively low input data.
• According to the pre-feasibility study, using given input data all of scenarios have positive NPV, IRR and could be applicable for a more detail analysis. For further analysis the additional research of input data is needed. The most attractive scenario is Scenario 4 with building biomass/peat CHP; simple payback is about 7 years. The building of CHP or boilerhouse (Scenario 2, 3) using natural gas could be under consideration, because of the high cost of fuel, despite of less initial investment costs of the project in Scenario 3 the payback is 11 years. The payback of Scenario 2 is 13 years. The usage of oil shale as the main fuel of unit in Scenario 1, where payback period is 9 years, could be competitive and has obvious advantages: availability of the local fuel and stable supply, the possibility to generate electricity additionally, the location of new unit in the existing power plant. The results of the financial feasibility indicators are presented in Fig. 4.
580
90,33523,99513,874
10.3% 10.0% 11.0%12.9%
050,000
100,000150,000200,000250,000
1. S
cena
rio
(Oil
shal
e un
it at
Bal
ti PP
)
2. S
cena
rio(C
HP
- mai
n fu
el is
nat.g
as)
3. S
cena
rio(B
oile
rhou
se -
mai
n fu
el is
nat.g
as)
4. S
cena
rio(B
iom
ass/
Peat
CH
P)
NPV
, kr
0%5%10%15%20%25%
IRR
, %
NPV, kr IRR, %
Fig. 4. Financial indicators.

Optimization of Narva District Heating Network ...
281
Conclusions
This paper presents the estimation of actual conditions of Narva district heating networks, technical-economical argumentation for renovation of district-heating networks and the results of four scenarios modeling heat supply alternatives in Narva using energy-planning models.
After optimization and total renovation of old networks, heat losses can decrease up to three times. The major characteristic parameters for Narva district-heating network before and after prospective optimization are pre-sented, and comparison with ordinary Swedish networks is given.
Modeling of heat energy supply alternatives in Narva is analyzed to compare the economy of oil shale condensing extraction turbine block usage with biomass CHP, natural gas CHP and boilerhouse. The results of reviewed models differ marginally depending on the difference in the characteristics of the equipment of the models. The models are indicative for scenarios’ development and could be useful for comparing the fundamental technological processes. The advantage of using these models is that they allow to get reliable results using comparatively low input data. The financial analysis shows the competitiveness and the advantages of using the oil shale CHP.
REFERENCES
1. Fredriksen, S., Werner, S. Fjärrvärme. District Heating. Theory, Technology and Functioning. – Lund, 1993 [in Swedish].
2. Bøhm, B. Energy-economy of Danish District Heating Systems. A Technical and Economic Analysis. – Technical University of Denmark. Copenhagen, 1988.
3. Frederiksen, S. A Thermodynamic Analysis of District Heating. – Lund Institute of Technology. Lund, 1982.
4. Koskelainen, L. A Model for Optimal Design of District Heating Networks. – Lappeenranta University of Technology. Lappeenranta, 1978.
5. Phetteplace, G. Optimal Design of Piping Systems for District Heating. CRREL Report 95-17. – U.S. Army Corps of Engineers. Cold Regions Research and Engineering Laboratory. Hanover, 1995.
6. Benonysson, A. Dynamic Modelling and Operational Optimization of District Heating Systems. PhD Thesis. – Laboratory of Heating and Air Conditioning. Technical University of Denmark. September 1991.
7. Larsen, H., Pallson, H., Bøhm, B., Ravn, H. Aggregated dynamic simulation model of district heating networks // Energy Convers. Manage. 2002. Vol. 43, No. 8. P. 995–1019.
8. Kozin, V. E. et al. Heat Supply. – Moscow, Vysshaya shkola. 1980 [in Russian]. 9. Van Beeck, N. Classification of Energy Models. – Tilburg University &
Eindhoven University of Technology, 1999. P. 7. 10. Lund, H. EnergyPlan Advanced Energy Systems Analysis Computer Model. –
Denmark, 2008. P. 8. http://www.energyplan.eu/

A. Hlebnikov et al 282
11. Clean Energy Decision Support Centre. Clean Energy Project Analysis RETScreen® Engineering & Cases Textbook. Third Edition. – Canada, 2005. P. 32, 63–64. www.retscreen.net
Received May 5, 2009