optimization of process parameters for automotive paint ...€¦ · optimization of process...
TRANSCRIPT
Optimization of process parameters for automotive paint application
Stephan Blum1, Norman Henkel2, Thomas Lehnhäuser3*, Hans-Joachim Neubauer2
1 DYNARDO – Dynamic Software and Engineering GmbH, Weimar, Germany 2 BMW AG, Munich, Germany
3 ANSYS Germany GmbH, Darmstadt, Germany
Abstract
The quality of the paint application in automotive industry depends on several process parameters. Thus, finding an optimal solution based on experimental configuration is tedious and time consuming. A first step to reduce the effort is to model the application within the framework of a simulation environment. This has been achieved by BMW in previous projects.
However, the variation of influencing parameters is still based on manual work, although corresponding designs can be analyzed efficiently using CFD. Thus, obtaining an optimal configuration is not trivial, if possible at all, since the sensitivities of the parameters on the paint quality is unknown.
In this study, we present an approach for the systematic variation of design pa-rameters of the paint process to quantify their influence on the quality of the paint application. Using that information it is possible to reduce the design space by neglecting the parameters with low impact. Based on this design space we extend the procedure to predict an optimal set of input parameters for an optimal paint application.
Keywords: Optimization, Paint application, CFD
Weimar Optimization and Stochastic Days 6.0 – November 15-16 October, 2009 1
1 Introduction
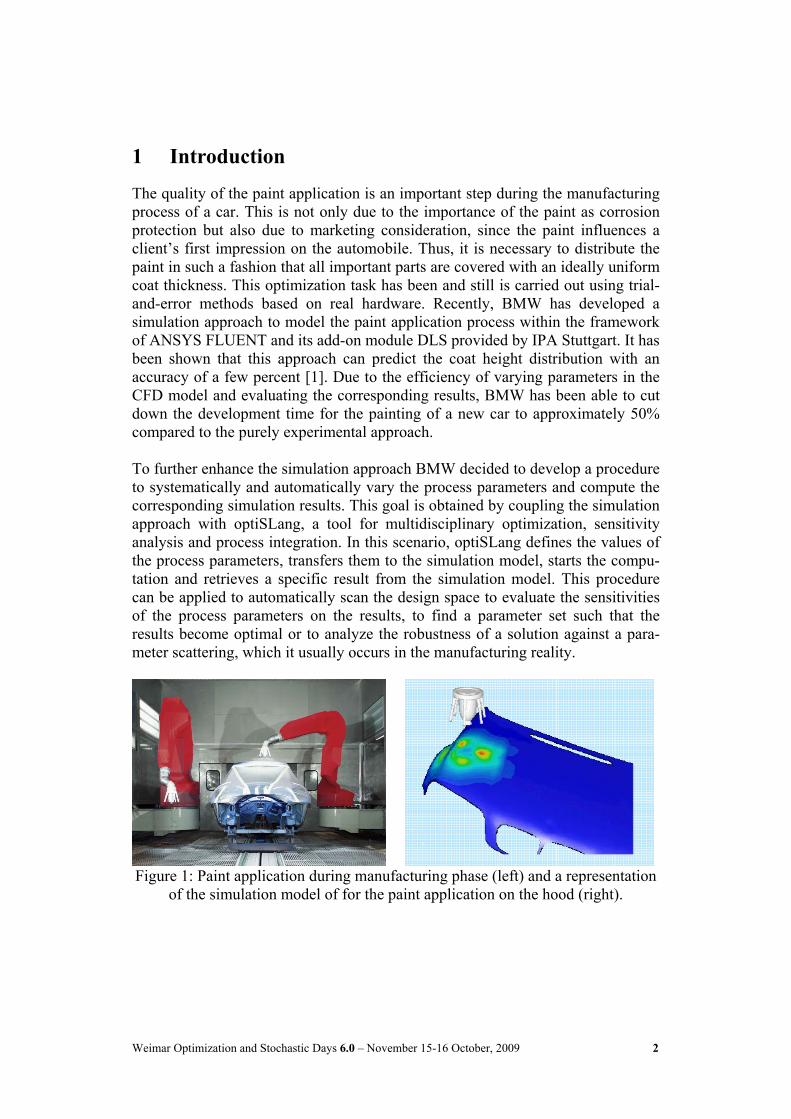
The quality of the paint application is an important step during the manufacturing process of a car. This is not only due to the importance of the paint as corrosion protection but also due to marketing consideration, since the paint influences a client’s first impression on the automobile. Thus, it is necessary to distribute the paint in such a fashion that all important parts are covered with an ideally uniform coat thickness. This optimization task has been and still is carried out using trial-and-error methods based on real hardware. Recently, BMW has developed a simulation approach to model the paint application process within the framework of ANSYS FLUENT and its add-on module DLS provided by IPA Stuttgart. It has been shown that this approach can predict the coat height distribution with an accuracy of a few percent [1]. Due to the efficiency of varying parameters in the CFD model and evaluating the corresponding results, BMW has been able to cut down the development time for the painting of a new car to approximately 50% compared to the purely experimental approach. To further enhance the simulation approach BMW decided to develop a procedure to systematically and automatically vary the process parameters and compute the corresponding simulation results. This goal is obtained by coupling the simulation approach with optiSLang, a tool for multidisciplinary optimization, sensitivity analysis and process integration. In this scenario, optiSLang defines the values of the process parameters, transfers them to the simulation model, starts the compu-tation and retrieves a specific result from the simulation model. This procedure can be applied to automatically scan the design space to evaluate the sensitivities of the process parameters on the results, to find a parameter set such that the results become optimal or to analyze the robustness of a solution against a para-meter scattering, which it usually occurs in the manufacturing reality.
Figure 1: Paint application during manufacturing phase (left) and a representation of the simulation model of for the paint application on the hood (right).
Weimar Optimization and Stochastic Days 6.0 – November 15-16 October, 2009 2
2 Simulation of the paint application process
The modeling within the simulation framework of the dynamic procedure of paint application consists of two principle steps. In the first step, a simulation using ANSYS CFD is employed to obtain a static paint distribution on the part to be painted, i.e. without moving the paint applicator. In a second step the static paint distribution information is integrated along the path of the applicator. In case of a considerable change of the positioning of the paint applicator in relation to the car body, the CFD simulation of the static paint distribution is repeated for this confi-guration and the integration process can be continued using the new static paint distribution. It has been shown, that this approach predicts the paint thickness with high accuracy compared to measurements [1]. Obviously, the overall thickness distribution of paint on the car is directly related to the static paint distribution computed during the stationary CFD simulation, i.e. if the static paint distribution fulfils certain requirements, the integration path can be configured such that the thickness distribution almost uniform. Thus, for un-derstanding the sensitivities of the process or to optimize the input parameters it is sufficient to consider the static CFD simulation only. However, in the scope of the static CFD simulations all the relevant physical effects have to be taken into account. Thus, it is mandatory to understand the real paint application process. It consists of injecting a paint film onto a rapidly rotat-ing bell, which is located at a certain distance from the object to be painted. Due to rotational forces the paint film separates as paint droplets into the air. The size distribution of the resulting droplets depends on the rotational velocity of the bell, the injected mass flow and the material properties of the paint. To orient the drop-lets paths towards the car body, the so called guiding air is produced by the various nozzles. Finally, to maximize the amount of paint impacting on the car body, an electrical field is installed which generates a force on the droplets to-wards the car body. To model this complex situation in simulation software, the surface mesh of the paint bell and the painted part are oriented in a first step. Afterwards, the configu-ration is meshed with a 3D grid. Based on this mesh the numerical model in ANSYS Fluent is set up. This accomplished by taking the droplet size distribution from measurements to define corresponding injections. The electrical field is solved as a set of scalar transport equation. After solving the flow problem, the amount mass per time unit of paint droplets on each surface element of the car body can be evaluated. This information is equivalent to the thickness growth and, therefore, to the coat thickness itself. The entire procedure is designed such that it runs fully automated based on ASCII input files in which all relevant information are specified, in particular, all those parameters which are subject for systematic variation.
Weimar Optimization and Stochastic Days 6.0 – November 15-16 October, 2009 3

3 Coupling the simulation module with optiSLang
The coupling essentially means to allow optiSLang the modification of the input files with respect to the input parameters and the evaluation of the solver output files in which the performance of the design is quantified. Since all input data is specified in the ASCII input files anyway, the first step is straight forward. In this study we consider 5 input parameters:
• Painting distance • Paint mass flow • Rotational velocity of the paint bell • Strength of the electrical field • Mass flow rate of the guiding air
The second step relies on a proper strategy to determine the quality of the result-ing paint thickness on the work piece, represented by one or more numerical value. To do so, the characteristics of an ideal paint distribution are specified and computed for each of the simulated paint results. Figure 2 shows the typical dis-tribution of the static paint distribution as contour plot (left) and as chart representation over a line on the part (right). In contrast to the result of a real configuration, the ideal paint distribution is shaped like a cylinder with a fixed radius, as indicated by the green line in the chart representation. The most obvious differences from the real to the ideal distribution are the zero thickness in the outer region, the inclination of the shoulders and the constant level in the inner part. Typical paint distribution
Ideal paint distribution
Figure 2: Typical paint thickness distribution as contour representation (left) and
as chart over the line on the part (right). In Figure 3, the 3 main paint thickness characteristics for performance quantifica-tion of a design are shown. The first quantity is the so-called sp50-value. It is defined as the diameter of the paint at 50% of the maximum paint thickness. This value is optimal if it is equal to a target diameter. The second characteristic is the
Weimar Optimization and Stochastic Days 6.0 – November 15-16 October, 2009 4
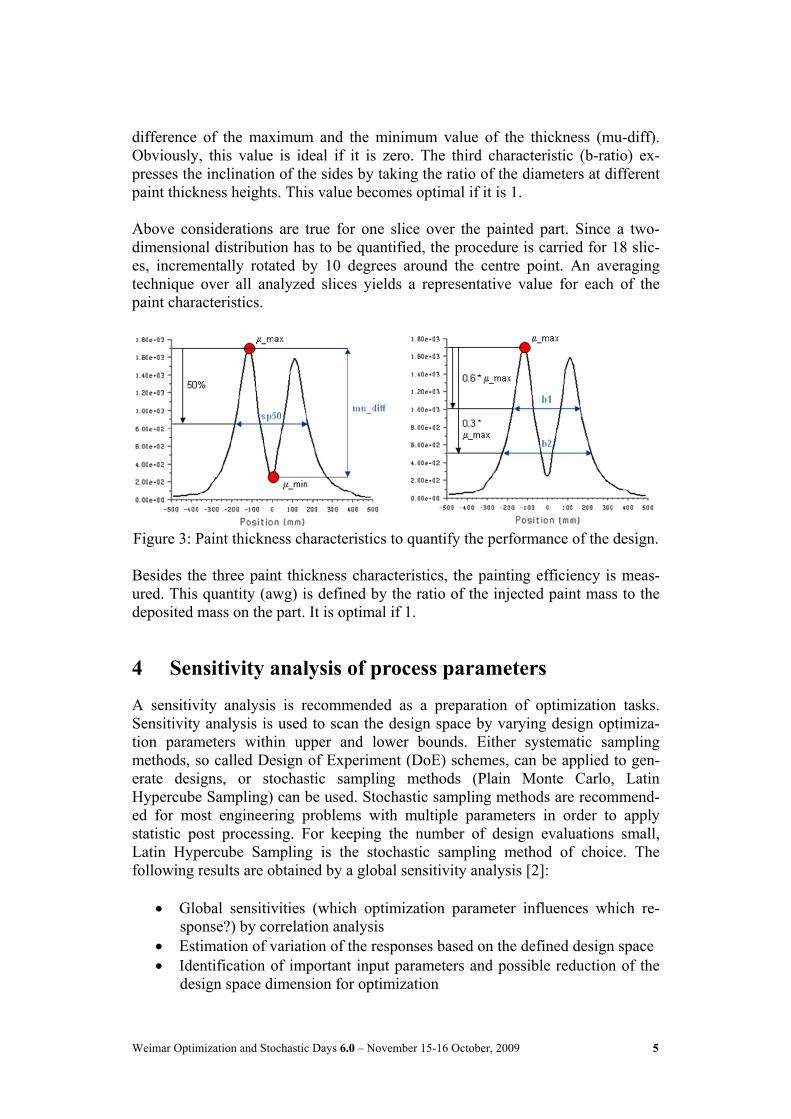
difference of the maximum and the minimum value of the thickness (mu-diff). Obviously, this value is ideal if it is zero. The third characteristic (b-ratio) ex-presses the inclination of the sides by taking the ratio of the diameters at different paint thickness heights. This value becomes optimal if it is 1. Above considerations are true for one slice over the painted part. Since a two-dimensional distribution has to be quantified, the procedure is carried for 18 slic-es, incrementally rotated by 10 degrees around the centre point. An averaging technique over all analyzed slices yields a representative value for each of the paint characteristics.
Figure 3: Paint thickness characteristics to quantify the performance of the design. Besides the three paint thickness characteristics, the painting efficiency is meas-ured. This quantity (awg) is defined by the ratio of the injected paint mass to the deposited mass on the part. It is optimal if 1.
4 Sensitivity analysis of process parameters
A sensitivity analysis is recommended as a preparation of optimization tasks. Sensitivity analysis is used to scan the design space by varying design optimiza-tion parameters within upper and lower bounds. Either systematic sampling methods, so called Design of Experiment (DoE) schemes, can be applied to gen-erate designs, or stochastic sampling methods (Plain Monte Carlo, Latin Hypercube Sampling) can be used. Stochastic sampling methods are recommend-ed for most engineering problems with multiple parameters in order to apply statistic post processing. For keeping the number of design evaluations small, Latin Hypercube Sampling is the stochastic sampling method of choice. The following results are obtained by a global sensitivity analysis [2]:
• Global sensitivities (which optimization parameter influences which re-sponse?) by correlation analysis
• Estimation of variation of the responses based on the defined design space • Identification of important input parameters and possible reduction of the
design space dimension for optimization
Weimar Optimization and Stochastic Days 6.0 – November 15-16 October, 2009 5

• Better understanding of the optimization problem, detecting optimization potential and extracting start designs for optimization
Setting up the sensitivity analysis requires the definition of the design parameter space with the corresponding upper and lower bounds. The process parameters paint mass and rotational speed have been defined as discrete optimization para-meters, each with a corresponding list of discrete values. Possible combinations between these two discrete parameters were generated by means of a list of condi-tional dependencies. The remaining optimization parameters painting distance, potential and steering air were defined as continuous optimization parameters. Table 1 gives an overview about the parameters and the corresponding bounds. Parameter Type Reference Lower bound Upper bound
Paint mass discrete 200 150 400
Rotational speed discrete 50 40 60
Painting distance continuous 300 250 350
Potential continuous -75000 -90000 -70000
Steering air continuous 260.93 212 309
Table 1: Definition of optimization parameters. For the sensitivity analysis of the process parameters 50 design realizations have been created using Latin Hypercube Sampling. For each design all 5 optimization parameters have been varied by optiSLang. After all designs have been calculated, it is possible to apply statistical methods in order to identify sensitivities between design parameters and evaluation criteria. An important result of the sensitivity analysis is the estimation of response varia-tion. Basic statistical measures like minimum, maximum, mean and standard deviation can be determined. This gives valuable information about potential design improvements and is helpful for specifying targets for the optimization. The coefficient of determination (CoD) is a suitable statistical value to quantify, how much of the variation of a response can be explained by a relation to the input parameters. Values for the CoD vary between 0 and 100 % and are calcu-lated for linear, quadratic and monotonic non-linear regression models. The coefficient of important (CoI) quantifies the influence of a single input parameter on a chosen response [3]. Figure 4 illustrates parameter sensitivities of the 5 process parameters on the evaluation criterion mu_diff applying the CoI as impor-tance measure. The analysis of correlation is used to describe the pair wise relation between design parameters and responses. A correlation coefficient is calculated to meas-ure the strength of the relationship between two variables. It is recommended to test for linear, quadratic and monotonic non-linear correlations. Figure 5 shows
Weimar Optimization and Stochastic Days 6.0 – November 15-16 October, 2009 6
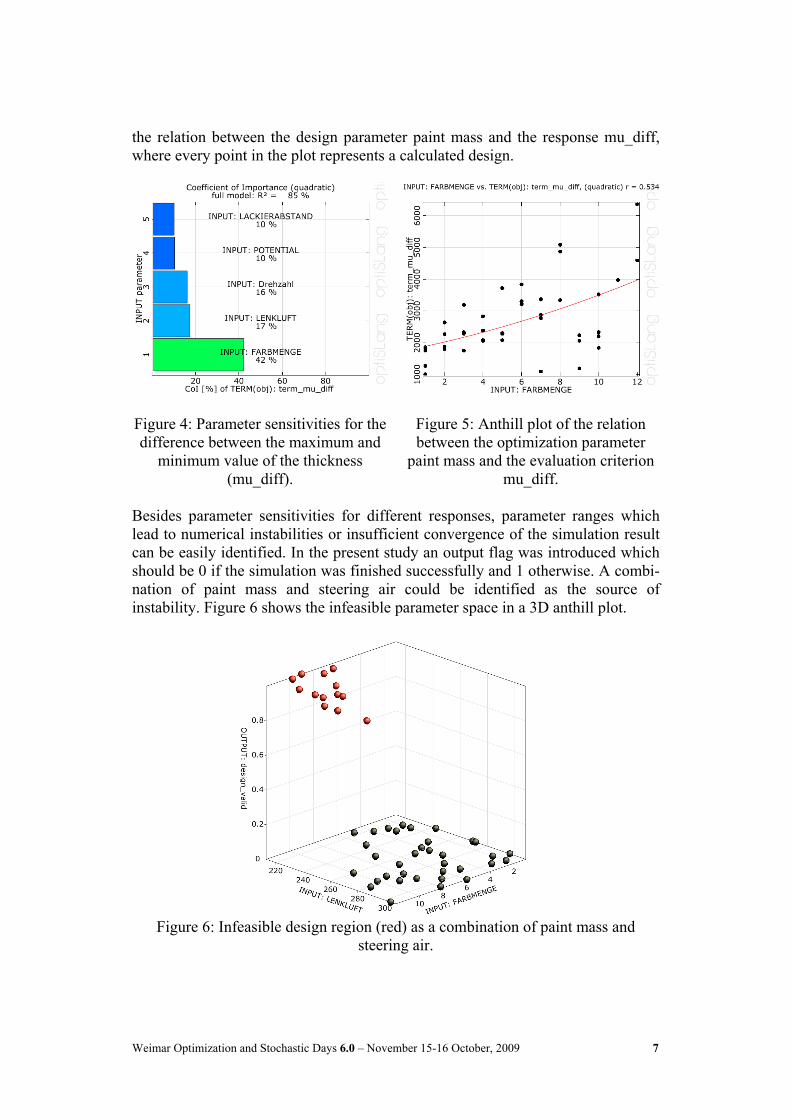
the relation between the design parameter paint mass and the response mu_diff, where every point in the plot represents a calculated design.
Figure 4: Parameter sensitivities for the difference between the maximum and
minimum value of the thickness (mu_diff).
Figure 5: Anthill plot of the relation between the optimization parameter
paint mass and the evaluation criterion mu_diff.
Besides parameter sensitivities for different responses, parameter ranges which lead to numerical instabilities or insufficient convergence of the simulation result can be easily identified. In the present study an output flag was introduced which should be 0 if the simulation was finished successfully and 1 otherwise. A combi-nation of paint mass and steering air could be identified as the source of instability. Figure 6 shows the infeasible parameter space in a 3D anthill plot.
Figure 6: Infeasible design region (red) as a combination of paint mass and
steering air.
Weimar Optimization and Stochastic Days 6.0 – November 15-16 October, 2009 7

5 Optimization of the process parameters
The optimization of parameters of a system requires the definition of an objective function. This function is a sum of weighted terms and results in a single scalar value. Each term may contain arbitrary mathematical expressions and responses. The optimizer tries to minimize the value of the objective function. In order to formulate an objective function for the optimization of paint distribu-tion it is necessary to transfer existing subjective evaluation criteria into numerical measures. The terms of the objective function may then be formulated as absolute values of the difference between the simulation result and the ideal thickness distribution. Because this ideal distribution cannot be reached exactly, there will always be a deviation of the simulation result. The absolute values of these devia-tions are unknown in advance but will significantly influence the convergence behavior of the optimization. Therefore it is recommended to introduce scale factors for the individual objective terms. In the present case, the scale factors were determined as the reciprocal of the corresponding expected value. This implies that the scaled term becomes 1.0 if the optimization reaches the corres-ponding expected value. The specification of the target values requires a comprehensive knowledge of the system and should be well-considered as it influences the optimization result. The formulation of the objective function can be tested on the designs of the sensitivity analysis. A revaluation of the existing 50 designs with an extended problem specification was performed. The revaluation results in a ranking of the designs according to their objective function value. The best design with the smallest objective value should match the best design from the subjective view. Figure 7 shows the thickness distribution in a sectional view for all designs from the sensitivity analysis with the best design from the revaluation highlighted red.
Figure 7: Thickness distribution of the designs from the sensitivity analysis with
the best design (red) according to the objective function formulation.
Weimar Optimization and Stochastic Days 6.0 – November 15-16 October, 2009 8

For the execution of the optimization task, a response surface based method was chosen. The response surface methodology (RSM) is used to approximate res-ponses in a multi-dimensional space. For calculating the response surface as a surrogate model of the real response, both appropriate approximation functions and support points are necessary. Systematic sampling methods are applied to generate optimal support points for the approximation function. Gradient-based optimization methods or evolutionary algorithms can be used for finding optima of the surrogate model. The quality of results depends on the accuracy of the approximation, which is influenced by the number of support points, the kind of approximation function used and the design space itself. The accuracy of the approximation increases if the range of the approximated sub region is decreased. This principle is used for the adaptive response surface method (ARSM) where the approximation of res-ponses is calculated for a sub region of the design space. By adaptively zooming and shifting this sub region, the quality of the approximation is gradually in-creased. The actual optimization was performed for the three continuous process parame-ters painting distance, potential and steering air. The discrete parameters paint mass and rotational speed were set as constant with the values taken from the best design of the sensitivity analysis. D-optimal sampling in combination with a linear approximation of responses was chosen as settings for the ARSM algorithm. The number of iterations was limited to 10 which results in a total number of 71 de-signs. This enables the computational engineer to perform such an optimization task in a reasonable time slot. Starting from the best design of the sensitivity analysis the optimization showed fast convergence of the parameter to optimal values. Figures 8 and 9 illustrate the parameter convergence of the steering air and the painting distance over the number of iterations. The results of the optimization regarding the evaluation criteria of the painting process meet the requirements of an optimal painting result. Especially for the criteria diameter of the paint and painting efficiency, almost ideal results could be achieved. Figure 10 contains the optimized process parameters of the best design and figure 11 shows the corres-ponding values of the objective function and terms.
Weimar Optimization and Stochastic Days 6.0 – November 15-16 October, 2009 9

Figure 8: Parameter convergence and shrinking of parameter bounds over the number of iterations for the steering air.
Figure 9: Parameter convergence and shrinking of parameter bounds over the
number of iterations for the painting distance.
Figure 10: Optimized process parame-ters of the best design.
Figure 11: Objective function and terms of the best design.
6 Summary and conclusions
In this study, the numerical analysis of the spray paint application using ANSYS CFD has been extended to automatically vary input parameters and analyze the performance of the corresponding design with respect to user-defined objectives. This has been achieved by coupling the simulation module with optiSLang, a tool for multidisciplinary optimization, sensitivity analysis and process integration. With the help of this approach the simulation task is not only automated, but also extended to yield additional information which would be tedious to obtain with the manual simulation approach. Beside others, the additional information in-cludes the sensitivities of the input parameters with respect to the objective functions and the optimal settings of the process parameters for the corresponding paint application. The first enhances the basic knowledge of the paint application procedure, while the latter provides directly one of the key results of a simulation driven process development.
Weimar Optimization and Stochastic Days 6.0 – November 15-16 October, 2009 10

Weimar Optimization and Stochastic Days 6.0 – November 15-16 October, 2009 11
References
[1] Q. Ye et al.: Numerical Simulation of Spray Painting in the Automotive Industry, Proceedings of 1st European Automotive CFD Conference (EACC), Bingen, 2003
[2] optiSLang – the Optimizing Structural Language Version 3.0, DYNARDO
GmbH, Weimar, 2008, www.dynardo.de [3] WILL, J.; BUCHER, C.: Statistical Measures for Computational Robust-
ness Evaluations of Numerical Simulation Models, Proceedings of Optimization and Stochastic Days 3.0, Weimar, 2006