optimization of process parameters in turning operation ... · pdf fileoptimization of process...
TRANSCRIPT

Volume 1, Issue 1 (2013) 31-45 ISSN 2347 - 3258 International Journal of Advance Research and Innovation
31 IJARI
Optimization of Process Parameters in Turning Operation
Using Taguchi Method and Anova: A Review
Ranganath M S, Vipin Department of Mechanical Engineering, Delhi Technological University, New Delhi, India
Abstract
This paper investigates the parameters affecting the roughness of
surfaces produced in the turning process for the various materials
studied by researchers. Design of experiments were conducted for the
analysis of the influence of the turning parameters such as cutting
speed, feed rate and depth of cut on the surface roughness. The results
of the machining experiments were used to characterize the main factors affecting surface roughness by the Analysis of Variance
(ANOVA) method Taguchi‟s parametric design is the effective tool for
robust design it offers a simple and systematic qualitative optimal
design to a relatively low cost. The Taguchi method of off-line
(Engineering) quality control encompasses all stages of product/process
development. However the key element for achieving high quality at
low cost is Design of Experiments (DOE). In this paper Taguchi‟s
(DOE) approach used by many researchers to analyze the effect of
process parameters like cutting speed, feed, and depth of cut on Surface
Roughness and to obtain an optimal setting of these parameters that
may result in good surface finish, has been discussed.
1. Introduction
In order to develop and optimize a surface
roughness model, it is essential to understand the
current status of work in this area. The need for
selecting and implementing optimal machining
conditions and most suitable cutting tools has been
felt over few decades. Surface roughness has become the most significant technical requirement and it is an
index of product quality. In order to improve the
tribological properties, fatigue strength, corrosion
resistance and aesthetic appeal of the product, a
reasonably good surface finish is desired. Nowadays,
the manufacturing industries specially are focusing
their attention on dimensional accuracy and surface
finish. In order to obtain optimal cutting parameters to
achieve the best possible surface finish,
manufacturing industries have resorted to the use of
handbook based information and operators‟ experience. This traditional practice leads to improper
surface finish and decrease in the productivity due to
sub-optimal use of machining capability. This causes
high manufacturing cost and low product quality [1].
Corresponding Author, E-mail address: [email protected]
All rights reserved: http://www.ijari.org
Surface roughness is mainly a result of process
parameters such as tool geometry (i.e. nose radius,
edge geometry, rake angle, etc). and cutting
conditions (feed rate, cutting speed, depth of cut,
etc).Surface roughness is harder to attain and track
than physical dimensions are, because relatively many
factors affect surface roughness. Some of these factors
can be controlled and some cannot. Controllable
process parameters include feed, cutting speed, tool geometry, and tool setup. Other factors, such as tool,
work piece and machine vibration, tool wear and
degradation, and work piece and tool material
variability cannot be controlled as easily. The
important cutting parameters discussed here are
cutting speed, feed and depth of cut. It is found in
most of the cases surface roughness decreases with
increase in cutting speed and decrease in feed and
depth of cut. Since these cutting parameters will
decide about the type of chips which we expect at the
time of machining of a single constant material thus
we have to analyze them for no such built-up edge chips formation.
2. Taguchi Method
Article Info
Article history:
Received 1 July 2013
Received in revised form
15 July 2013 Accepted 22 July 2013
Available online 1 August 2013
Keywords
DOE,
TAGUCHI Method, ANOVA,
Surface Roughness,
Turning

Volume 1, Issue 1 (2013) 31-45 ISSN 2347 - 3258 International Journal of Advance Research and Innovation
32 IJARI
Taguchi method is a powerful tool for the design
of high quality systems. It provides simple, efficient
and systematic approach to optimize designs for
performance, quality and cost . Taguchi method is
efficient method for designing process that operates
consistently and optimally over a variety of conditions. To determine the best design it requires the
use of a strategically designed experiment . Taguchi
approach to design of experiments in easy to adopt
and apply for users with limited knowledge of
statistics, hence gained wide popularity in the
engineering and scientific community. The desired
cutting parameters are determined based on
experience or by hand book. Cutting parameters are
reflected. Steps of Taguchi method are as follows:
1. Identification of main function, side effects and failure mode.
2. Identification of noise factor, testing condition and quality characteristics.
3. Identification of the main function to be
optimized.
4. Identification the control factor and their levels.
5. Selection of orthogonal array and matrix
experiment.
6. Conducting the matrix experiment.
7. Analysing the data, prediction of the optimum
level and performance.
8. Performing the verification experiment and planning the future action.
3. Analysis Of The Signal-To-Noise Ratio
Taguchi recommends the use of S/N ratio to
measure the quality characteristic deviation from the
desired values. The term 'Signal' represents the desired value (i.e. mean) for the response and the term
'Noise' represents the undesired value (i.e. SD).
Therefore, S/N ratio is the ratio of the mean to SD.
Usually there are three categories of quality
characteristic in the analysis of S/N ratio, i.e. the
larger-the-better, the smaller-the-better, and the
nominal the-better. Regardless of the category of the
quality characteristic, a greater S/N ratio corresponds
to better quality characteristic. In this experiment, the
S/N ratio for each level of process parameter was
computed based on the smaller-the-better S/N analysis for the surface roughness. The experiments
were conducted aiming at determining the effect of
machine tool condition, in term of vibration
amplitude, on surface roughness of the work piece.
The values of S/N ratio, η, corresponding to the
average surface roughness of each run calculated
using the Equation: η = -10 log [(Σyi 2)/n] (2) Where
η is the S/N ratio, yi is surface roughness
measurements in a run, and n is the number of
replicates. In many of the cases which study
Roughness the S/N ratio is based on the Taguchi
smaller the-better loss function, as the idea is to
minimize the response, i.e. surface roughness. The S/N ratio is a summary statistic which indicates the
value and dispersion of the response. Since the
experimental design is orthogonal, it is then possible
to separate out the effect of each parameter at
different levels. For example, the mean S/N ratio for
the vibration amplitude at levels 1-3 can be calculated
by averaging the S/N ratio for the Experiments 1-3, 4-
6 and 7- 9, respectively. The mean S/N ratio for each
of the other parameter can be computed in the similar
manner. The mean S/N ratio for each level of the
cutting parameters is summarized and called the mean
S/N response table for the surface roughness. The S/N response table and S/N response graph are shown in
Table 5 and Fig. 3, respectively. The appropriate
categories of the S/N ratio are chosen depending on
the nature of the quality characteristic. For example,
the S/N ratio for smaller-the-better criterion is
employed when the aim is to make the response as
small as possible. Ideally, the response would be
equal to zero. Regardless of the category of the
quality characteristics, a greater S/N ratio corresponds
to better quality characteristics, that is, to the smaller
variance of the output characteristic around the desired (target) value.
4. Analysis Of Variance (ANOVA)
The main aim of ANOVA is to investigate the
design parameters and to indicate which parameters
are significantly affecting the output parameters. In
the analysis, the sum of squares and variance are
calculated. F-test value at 95 % confidence level is used to decide the significant factors affecting the
process and percentage contribution is calculated [19].
The ANOVA analysis for percentage calibration is
shown in Table-5
ANOVA can be useful for determining influence
of any given input parameter from a series of
experimental results by design of experiments for
machining process and it can be used to interpret
experimental data. Analysis of variance (ANOVA) is
a collection of statistical models, and their associated
procedures, in which the observed variance in a particular variable is partitioned into components
attributable to different sources of variation. In its
simplest form, ANOVA provides a statistical test of
whether or not the means of several groups are all
equal, and therefore generalizes t-test to more than
two groups. ANOVA is used in the analysis of

Volume 1, Issue 1 (2013) 31-45 ISSN 2347 - 3258 International Journal of Advance Research and Innovation
33 IJARI
comparative experiments, those in which only the
difference in outcomes is of interest. The statistical
significance of the experiment is determined by a ratio
of two variances. This ratio is independent of several
possible alterations to the experimental observations:
Adding a constant to all observations does not alter significance. Multiplying all observations by a
constant does not alter significance. So ANOVA
statistical significance results are independent of
constant bias and scaling errors as well as the units
used in expressing observations.
The analysis of variance (ANOVA) may be used to
investigate which design factors and their interactions
affect the response significantly. Taguchi recommends
analyzing the mean and S/N ratio using two-
dimensional response graphs, instead of ANOVA. The
analysis of means (ANOM) is a statistical approach that
is based on determining the mean S/N ratios for each design factor and each of its levels.
5. Literature Review
Ilhan Asiltürk.et.al.,[ 2011] have presented a paper
on title “Determining The Effect Of Cutting
Parameters On Surface Roughness In Hard Turning
Using The Taguchi Method” [Ref 5] The study focuses
on optimizing turning parameters based on the Taguchi method to minimize surface roughness (Ra and Rz).
Experiments have been conducted using the
L9orthogonal array in a CNC turning machine. Dry
turning tests are carried out on hardened AISI 4140 (51
HRC) with coated carbide cutting tools. Each
experiment is repeated three times and each test uses a
new cutting insert to ensure accurate readings of the
surface roughness. The statistical methods of signal to
noise ratio (SNR) and the analysis of variance
(ANOVA) are applied to investigate effects of cutting
speed, feed rate and depth of cut on surface roughness. Results of this study indicate that the feed rate has the
most significant effect on Ra and Rz. In addition, the
effects of two factor interactions of the feed rate-cutting
speed and depth of cut-cutting speed appear to be
important. S/N ratios and level values were calculated
by using Eq. „„the smaller-the better‟‟ in the MINITAB
14 Program. The results obtained in this study are as
below:
L9 orthogonal array was selected for three different levels of cutting speed, feed rate and
depth of cut, which were cutting factors, by using
the Taguchi method. Asa result, nine experiments
were conducted instead of the full factorial 27
experiments. Ra and Rz‟ S/N ratios were found as
a result of experiments conducted according to the
L9 orthogonal array. The maximum value was
found by using the S/N ratio equation of „„the
smaller-the better,‟‟ the maximum S/N ratio
yielded optimum cutting parameters. Optimum
cutting conditions-which correspond to maximum
2.32 S/N value of the smaller Ra value for the
smaller surface roughness in hard turning
operation (2 1 2) were found to be 120 m/min for the cutting speed, 0.18 mm/rev for the feed rate
and 0.4 mm for the depth of cut. Optimum cutting
conditions-which correspond to maximum 18.75
S/N value of Rz value (3 1 1) were found to be120
m/min for the cutting speed, 0.18 mm/rev for
thefeed rate and 0.4 mm for the depth of cut.
Variance analysis was applied to S/N ratios to
discover interactions between cutting parameters
relating to Ra and Rz. According to the ANOVA
analysis, the feed rate has an effect on Ra and Rz
at a reliability level of 95%. Any difference
(variance) was not observed for the cutting speed
and the depth of cut at the reliability level of 95%.
The numbers of experiments in the same or similar
area in hard turning operations were reduced by
using the Taguchi experimental design to
determine optimum cutting conditions. Satisfying
results were obtained so that they may be used in
future academic and industrial studies.
Their study suggest that developed model can be
used in the metal machining industries in order to
determine the optimum cutting parameters for
minimum surface roughness.
M Kaladhara .et.al.[2012], have presented a paper
on title ”Determination Of Optimum Process
Parameters During Turning Of AISI 304 Austenitic
Stainless Steels Using Taguchi Method ANOVA” [Ref
9].They have tried to Investigate the process parameters
on surface finish and Material Removal Rate to obtain
the optimal setting of these parameters. They have used
ANOVA to analyze the influence of cutting parameters
during machining. In their work AISI 304 Austenitic
Stainless Steels work pieces were turned on CNC lathe
by using physical vapour deposition coated ceramic insert (TiCN-TIN) of 0.4, and 0.8 Nose Radii. The
analysis has been made with the help of a software
package MINITAB 14.Their result revealed that the
feed and Nose radius is the most significant process
parameter on work piece surface roughness and the
depth of cut and feed are the significant factor on
MRR. They have also predicted optimal range and
optimal level of parameters for responses with
TAGUCHI Approach.
Ananthakumar.P et.al.,[ 2013] have presented a
paper on title “Optimization Of Turning Process
Parameters Using Multivariate Statistical Method-PCA Coupled With Taguchi Method[Ref 3]The work applies

Volume 1, Issue 1 (2013) 31-45 ISSN 2347 - 3258 International Journal of Advance Research and Innovation
34 IJARI
to optimize the process parameter for turning medium
carbon steel bar using HSS tool bit via conventional
machining. Optimizing one quality attribute may lead
to loss of other quality attribute. Hence in order to
simultaneously satisfy all the three quality requirements
a multi objective optimization is required. To achieve this exploration of grey relational theory, utility
concepts are attempted. To meet the basic assumption
of taguchi method that quality attributes should be
uncorrelated the study applies PCA based multivariate
statistical method and eliminates correlation that exists
in between the responses. Experiments have been
conducted based on taguchi‟s L9 Orthogonal array
design with different combinations of process control
parameters: (Cutting speed, Feed, Depth of cut).
Surface roughness, Material removal rate, Tool Flank
wear are the response parameters that will be
optimized. The obtained result will be verified through confirmatory test. This work highlights the
effectiveness of proposed method for solving multi
objective optimization of turning process. The above
said methodology has been found fruitful in the cases
where simultaneous optimization of huge responses is
required. Back rack angle 10°,Side rack angle 12°,Side
relief angle 07°,End relief angle 07°,Major cutting edge
15°,Minor cutting edge 15°,Nose radius 0.8 mm, Size
of square tool bit 12 *12 mm2,Length of tool bit 100
mm. In this experiment HSS TOOL BITS with 10%
Cobalt (SAE T42) is used. This quality of tool bits retains its hardness even at very high temperatures and
is recommended where the generation of heat is very
high and the tool should not get blunt at high
temperatures. Work piece of standard dimensions was
used for machining. Diameter of work piece: 38 mm,
length of work piece: 100 mm. length of turning: 40
mm. AISI: 1040(ISO 683-1:C40) medium carbon steel
is selected for work piece material because it is used
wide variety of general purpose engineering.
Fig.1 Cutting Tool Nomenclature [Ref 3]
These steels are of particular importance because
of unique combination of strength and toughness after
heat treat treatment. Medium Carbon Steels are similar
to low carbon steel except that the carbon ranges from
0.30 to 0.60 & the manganese from 0.50 to 0.90%. The
instrument used to measure surface roughness was “Time surface roughness tester TR 100”. Surface
roughness readings were recorded at three locations on
the work piece and the average value was used for
analysis Specifications of Instrument used: Tracing
length 6 mm, tracing speed 1 mm/sec, cutoff lengths
0.25 mm/0.8 mm/ 2.5 mm. Measuring range Ra:0.05-
10μm, Rz:0.1-50μm. Metzer tool maker‟s microscope
is used to measure the cutting tool flank wear. All
statistical works and including principal component
analysis with proposed algorithm are performed with
the help of MINITAB R14 statistical software. At the
end, results of proposed algorithm are compared with the results of confirmatory test and existing methods.
Here larger the better criterion is used for optimizing
the overall MP Index.
From the analyses, the following conclusions have been
given
1. Here the application of PCA with grey or utility based taguchi method has been recommended for
the optimization of manufacturing processes like
turning processes which are having correlated
multiple responses to find the optimum
combination of process parameters with
experimental objectives.
2. PCA has been utilized here to eliminate the
correlation between the responses by converting
correlated responses in to uncorrelated quality
indices called principal components to meet the
basic assumption of taguchi optimization. 3. By comparing the existing taguchi based multi
response optimization method the proposed
approach meet the objectives of multiple responses
simultaneously and produce best optimum
combination of process parameter.
4. Over all multi response performance index based
on PCA serves as a single response for solving
multi response problem, really it will helpful
where large number of responses to be optimized
simultaneously.
5. From the experimentation and analysis depth of cut
and feed showing greater influence than speed on surface roughness tool flank wear & material
removal rate simultaneously.
6. The proposed approach can be recommended for
off line quality control of process and product to
improving the quality.
Muhammad Munawar.et.al.,[ 2009] have presented
a paper on title ”Optimization Of Surface Finish In
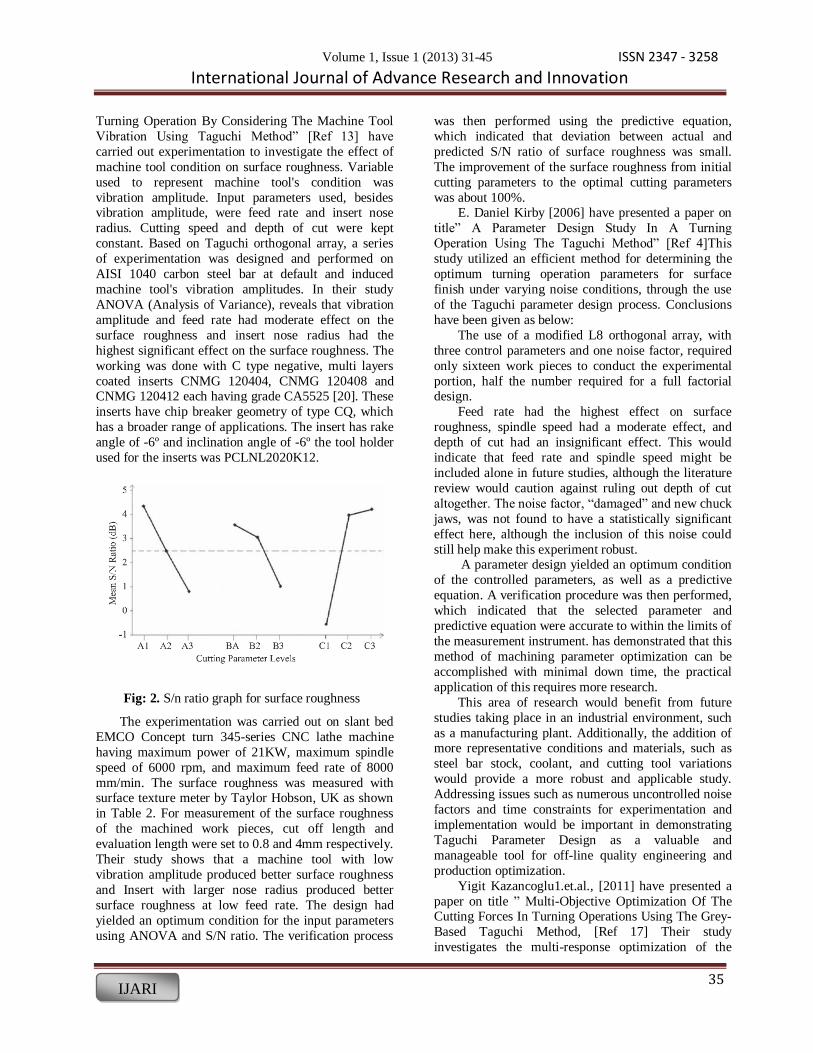
Volume 1, Issue 1 (2013) 31-45 ISSN 2347 - 3258 International Journal of Advance Research and Innovation
35 IJARI
Turning Operation By Considering The Machine Tool
Vibration Using Taguchi Method” [Ref 13] have
carried out experimentation to investigate the effect of
machine tool condition on surface roughness. Variable
used to represent machine tool's condition was
vibration amplitude. Input parameters used, besides vibration amplitude, were feed rate and insert nose
radius. Cutting speed and depth of cut were kept
constant. Based on Taguchi orthogonal array, a series
of experimentation was designed and performed on
AISI 1040 carbon steel bar at default and induced
machine tool's vibration amplitudes. In their study
ANOVA (Analysis of Variance), reveals that vibration
amplitude and feed rate had moderate effect on the
surface roughness and insert nose radius had the
highest significant effect on the surface roughness. The
working was done with C type negative, multi layers
coated inserts CNMG 120404, CNMG 120408 and CNMG 120412 each having grade CA5525 [20]. These
inserts have chip breaker geometry of type CQ, which
has a broader range of applications. The insert has rake
angle of -6º and inclination angle of -6º the tool holder
used for the inserts was PCLNL2020K12.
Fig: 2. S/n ratio graph for surface roughness
The experimentation was carried out on slant bed
EMCO Concept turn 345-series CNC lathe machine
having maximum power of 21KW, maximum spindle
speed of 6000 rpm, and maximum feed rate of 8000
mm/min. The surface roughness was measured with surface texture meter by Taylor Hobson, UK as shown
in Table 2. For measurement of the surface roughness
of the machined work pieces, cut off length and
evaluation length were set to 0.8 and 4mm respectively.
Their study shows that a machine tool with low
vibration amplitude produced better surface roughness
and Insert with larger nose radius produced better
surface roughness at low feed rate. The design had
yielded an optimum condition for the input parameters
using ANOVA and S/N ratio. The verification process
was then performed using the predictive equation,
which indicated that deviation between actual and
predicted S/N ratio of surface roughness was small.
The improvement of the surface roughness from initial
cutting parameters to the optimal cutting parameters
was about 100%. E. Daniel Kirby [2006] have presented a paper on
title” A Parameter Design Study In A Turning
Operation Using The Taguchi Method” [Ref 4]This
study utilized an efficient method for determining the
optimum turning operation parameters for surface
finish under varying noise conditions, through the use
of the Taguchi parameter design process. Conclusions
have been given as below:
The use of a modified L8 orthogonal array, with
three control parameters and one noise factor, required
only sixteen work pieces to conduct the experimental
portion, half the number required for a full factorial design.
Feed rate had the highest effect on surface
roughness, spindle speed had a moderate effect, and
depth of cut had an insignificant effect. This would
indicate that feed rate and spindle speed might be
included alone in future studies, although the literature
review would caution against ruling out depth of cut
altogether. The noise factor, “damaged” and new chuck
jaws, was not found to have a statistically significant
effect here, although the inclusion of this noise could
still help make this experiment robust. A parameter design yielded an optimum condition
of the controlled parameters, as well as a predictive
equation. A verification procedure was then performed,
which indicated that the selected parameter and
predictive equation were accurate to within the limits of
the measurement instrument. has demonstrated that this
method of machining parameter optimization can be
accomplished with minimal down time, the practical
application of this requires more research.
This area of research would benefit from future
studies taking place in an industrial environment, such
as a manufacturing plant. Additionally, the addition of more representative conditions and materials, such as
steel bar stock, coolant, and cutting tool variations
would provide a more robust and applicable study.
Addressing issues such as numerous uncontrolled noise
factors and time constraints for experimentation and
implementation would be important in demonstrating
Taguchi Parameter Design as a valuable and
manageable tool for off-line quality engineering and
production optimization.
Yigit Kazancoglu1.et.al., [2011] have presented a
paper on title ” Multi-Objective Optimization Of The Cutting Forces In Turning Operations Using The Grey-
Based Taguchi Method, [Ref 17] Their study
investigates the multi-response optimization of the

Volume 1, Issue 1 (2013) 31-45 ISSN 2347 - 3258 International Journal of Advance Research and Innovation
36 IJARI
turning process for an optimal parametric combination
to yield the minimum cutting forces and surface
roughness with the maximum material-removal rate
(MRR) using a combination of a Grey relational
analysis (GRA) and the Taguchi method. Nine
experimental runs based on an orthogonal array of the Taguchi method were performed to derive objective
functions to be optimized within the experimental
domain. A Phynix TR-100 model surface-roughness
tester was used to measure the surface roughness of the
machined samples. The cut-off length (_) was chosen
as 0.3 for each roughness measurement. An average of
six measurements of the surface roughness was taken to
use in the multi-criteria optimization. They have
selected objective functions in relation to the
parameters of the cutting process: cutting force, surface
roughness and MRR. The Taguchi approach was
followed by the Grey relational analysis to solve the multi-response optimization problem. They have also
evaluated quantitatively using the analysis-of-variance
method (ANOVA)the significance of the factors on the
overall quality characteristics of the cutting process
Optimal results were verified through additional
experiments. They concluded that a proper selection
of the cutting parameters produces a high material-
removal rate with a better surface roughness and a
lower cutting force.
Jitendra Verma.et.al., [2012] have presented a
paper on title “Turning Parameter Optimization for Surface Roughness of ASTM A242 Type-1 Alloys
Steel by Taguchi Method” [Ref 6]. This research paper
is focused on the analysis of optimum cutting
conditions to get lowest surface roughness in turning
ASTM A242 Type-1 ALLOYS STEEL by Taguchi
method. Experiment was designed using Taguchi
method and 9 experiments were conducted by this process. The results have been analyzed using analysis
of variance (ANOVA) method. Taguchi method has
shown that the cutting speed has significant role to play
in producing lower surface roughness about 57.47%
followed by feed rate about 16.27%. The Depth of Cut
has lesser role on surface roughness from the tests. The
results obtained by this method are concluded to be
useful to other researches for similar type of study and
may be eye opening for further research on tool
vibrations, cutting forces etc .In this study ASTM A242
TYPE-1 ALLOY steel and 250 mm long with 50 mm
diameter was used as work material for experimentation using a lathe turning machine. Cutting
speed, feed rate and depth of cut were selected as the
machining parameters to analyze their effect on surface
roughness. A total of 9 experiments based on Taguchi‟s
orthogonal array were carried out with different
combinations of the levels of the input parameters.
Among them, the settings of cutting speed include 100,
125 and 150 rpm; those of feed rate include 0.05, 0.1,
0.15 mm rev-1; the depth of cut is set at 0.5, 1.0 and 1.5
mm.
Table: 1. Cutting parameters [Ref 6]
Table: 2. Experimental Results [Ref 6]

Volume 1, Issue 1 (2013) 31-45 ISSN 2347 - 3258 International Journal of Advance Research and Innovation
37 IJARI
Table 3 Result of ANOVA for Surface Roughness contribution [Ref 6]
The conclusions drawn based on the tests
conducted from the ANOVA, Table and the P value,
the cutting speed is the only significant factor which
contributes to the surface roughness i.e. 57.47 %
contributed by the cutting speed on surface roughness.
The second factor which contributes to surface
roughness is the feed rate having 23.46 %. The third factor which contributes to surface roughness is the
depth of cut having 16.27%. The Validation
experiment confirms that the error occurred was less
than 2.79% between equation and actual value. It is
recommended from the results that cutting of 18.30 to
15.78 m/min can be used to get lowest surface
roughness. Taguchi gives systematic simple approach
and efficient method for the optimum operating
conditions. This research has also suggested using
Taguchi‟s parameter design to obtain optimum
condition with lowest cost, minimum number of
experiments and industrial engineers can use this method.
Marinković Velibor et.al.,[ 2011] have presented
a paper on title “Optimization Of Surface Roughness
In Turning Alloy Steel By Using Taguchi Method”
[Ref 12] In this study the Taguchi robust parameter
design for modelling and optimization of surface
roughness in dry single-point turning of cold rolled
alloy steel 42CrMo4/AISI 4140 using TiN-coated
tungsten carbide inserts has been presented. Three
cutting parameters, the cutting speed (80, 110, 140
m/min), the feed rate (0.071, 0.196, 0.321 mm/rev), and the depth of cut (0.5, 1.25, 2 mm), have been used
in the experiment. Each of the other parameters was
taken as constant. The average surface roughness (Ra)
was chosen as a measure of surface quality. The
experiment was designed and carried out on the basis
of standard L27 Taguchi orthogonal array. The data
set from the experiment was employed for conducting
the optimization procedures, according to the
principles of the Taguchi method. The results of
calculations were in good agreement with the
experimental data. A certain discrepancy between the experimental results and calculations could be
interpreted as the presence of measurement errors,
many irregularities and deficiencies in the turning
process, as well as environmental effects. The results
presented in this work confirm the effectiveness of
Taguchi‟s technique in optimization of cutting
processes. For that purpose, the experimental results
should be transformed into the S/N ratios. There are
three categories of the S/N ratio (Phadke, 1989;
Taguchi et al., 2005):
(a) Smaller-the-better,
(b) Larger-the-better,
(c) Nominal-the-best,
The S/N ratio for smaller-the-better criterion is
employed when the aim is to make the response as
small as possible. Ideally, the response would be equal
to zero. The statistical analysis was also performed by
using ANOVA. This analysis was prepared using
software MINITAB. The response graphs and
ANOVA results show that the effects of two-way
interactions of these cutting parameters are
statistically insignificant, that is, can be neglected. As
shown in this study, the Taguchi method provides a systematic, efficient and easy-to-use approach for the
cutting process optimization.

Volume 1, Issue 1 (2013) 31-45 ISSN 2347 - 3258 International Journal of Advance Research and Innovation
38 IJARI
Fig: 2. Steps in the Taguchi method. [Ref 12]
1 Recognize the Problem
2 Formulate the Objective(s) of the Experiment
3 Define the Quality Characteristics (QC)
4 Identify the Sound and Noise Factors that may affect the QC
5 Select the Levels for Control and Noise Factor
7 Select the appropriate Taguchi Matrix Orthogonal Arrays (OAs)
for control factors according to the objectives of expt.
8 Assign the control factors and Factor Interactions to adopted OA columns
9 Select the appropriate category of S/N ratio
6 Select the Factor Interactions that may affect the QC
10 Conduct the Experiment according to adapted OA
11 Transform the Experimental data into S/N ratio
13 Identify the Optimal Control factorLevels and predict performance under these
factor levels
14 Conduct the Confirmation Experiment with optimal conditions
15 Adopt the suggested optimal conditions or perform the
additional analysis and redevelop the experiment
12 Analyze the Results using response tables,Graphs and ANOVA

Volume 1, Issue 1 (2013) 31-45 ISSN 2347 - 3258 International Journal of Advance Research and Innovation
39 IJARI
Fig: 4. Comparison of measured and predicted values : [Ref 12]
(a) For S/N ratio; (b) For Ra
Rodrigues L.L.R et.al.,[ 2012] have presented a
paper on title “Effect Of Cutting Parameters On
Surface Roughness And Cutting Force In Turning
Mild Steel” [Ref 15] They studied the effect of speed,
feed and depth of cut on surface roughness (Ra) and
cutting force (Fc) in turning mild steel using high
speed steel cutting tool. Experiments conducted on a
precision centre lathe and the influence of cutting

Volume 1, Issue 1 (2013) 31-45 ISSN 2347 - 3258 International Journal of Advance Research and Innovation
40 IJARI
parameters were studied using analysis of variance
(ANOVA)based on adjusted approach. Based on the
main effects plots obtained through full factorial
design, optimum level for surface roughness and
cutting force were chosen from the three levels of
cutting parameters considered. Linear regression equation of cutting force has revealed that feed, depth
of cut, and the interaction of feed and depth of cut
significantly influenced the variance. In case of
surface roughness, the influencing factors were found
to be feed and the interaction of speed and feed. As
turning of mild steel using HSS is one among the
major machining operations in manufacturing
industry, the revelation made in this research
significantly contribute to the cutting parameters‟
optimization.
A.V.N.L.Sharma.et.al., [2013]” have presented a
paper on title Parametric Analysis And Multi Objective Optimization Of Cutting Parameters In
Turning Operation Of EN353 – With CVD Cutting
Tool Using Taguchi Method” [Ref 1] This paper
discusses an investigation into the use of Taguchi
parameter Design and Regression analysis to predict
and optimize the surface roughness and metal removal
rate in turning operations using CVD cutting tool. In
this study EN353 work material, with 300 mm long
and 50mm diameter was used for experimentation
using a lathe machine. 50 mm was held in the chuck
and 250 mm was turned in dry condition. During measuring 5mm was set as the cut of length.
The results obtained in this study lead to following
conclusions
1. From the results obtained by experiment, the
influence of surface roughness (Ra), and Material
Removal Rate (MRR) by the cutting parameters
like speed, feed, DOC is (a) the feed rate has the
variable effect on surface roughness, cutting
speed and depth of cut an approximate decreasing trend. (b) Cutting speed, feed rate and depth of
cut for Material Removal Rate have increasing
trend.
2. The design of experiments (DOE), Taguchi
method is applied for optimization of cutting
parameters and Analysis of Variance (ANOVA)
is done and found that (a) The optimal
combination of process parameters for minimum
surface roughness is obtained at 580 m/min cutting speed, 0.07 mm/rev feed, 0.20 mm of
depth of cut. (b) The optimal combination of
process parameters for maximum material
removal rate is obtained at 740 m/min cutting
speed, 0.09 mm/rev feed, 0.25 mm of depth of
cut.
3. ANOVA shows that the depth of cut has great
influence for the response surface roughness
(Ra), cutting speed has great influence for the
response Material removal rate (MRR) .The percentage contribution values for the responses
Ra, and MRR are as follows: (a) In case of Ra
response the depth of cut 87.68% is significant
one followed by cutting speed. (b) In case of
MRR response the cutting speed 48.03% is
significant one followed by depth of cut.
4. The interaction of cutting parameters is also
studied for the three responses Ra, and MRR as
follows: (a) The interaction for the cutting parameters is found that speed and depth of cut
have great influence on the response Ra and the
percentage contribution of speed and depth of cut
is 4.84% followed by feed and depth of cut with
0.66%, speed and feed with 0.26%. (b) The
interaction for the cutting parameters is found
that speed and depth of cut have great influence
on the response MRR and the percentage
contribution of speed and depth of cut is 6.80%
followed by speed and feed with 2.46%, feed and
depth of cut with 1.23%.
5. Using the experimental data, a multi linear
regression model is developed and the values
obtained for the responses Ra and MRR are
compared with measured values. A graph was
plotted between Regression predicted values and
experimentally measured values and shows that
the models are adequate without any violation of
independence or constant assumption.
Vipin.et.al.,[ 2009 ] have presented a paper on title “Surface Roughness Prediction Model By Design
Of Experiments For Turning Leaded Gun Metal” [Ref
16]In this study The surface roughness models have
been developed for turning leaded gun metal under
dry conditions. The models have been developed in
terms of cutting speed, feed rate and depth of cut
obtained experimentally. The Experimental data has
been used to develop the models with the aid of
regression analysis. The effects of cutting variables
(cutting speed, feed and depth of cut) on surface
roughness have been investigated by Central
composite Design. The first-order model was developed by an experimental design consisting of 12
experiments. Twelve experiments constitute Eight
experiments (23 factorial designs) and Four
experiments (an added centre point repeated four
times) as shown in Fig.2. This was done to predict the
„b‟ parameters as used in the Equation. The blocks
provide the confidence interval of the parameters and
help in the analysis of variance. A second-order model
is developed by adding six augment points to the

Volume 1, Issue 1 (2013) 31-45 ISSN 2347 - 3258 International Journal of Advance Research and Innovation
41 IJARI
factorial design. Depending on the capacity of the
machine, an augment length of ±1 was chosen. The
augment points consist of three levels for each of the
independent variables denoted by -1, 0, and 1. These
six experiments were repeated twice to develop the
second-order model. The resulting 12 or 24
experiments form the central composite design Fig. 2 shows 23 designs. The results conclude that the
surface roughness equation shows that the feed is the
main influencing factor on the surface roughness,
followed by cutting speed and depth of cut in the
operation model. Increasing any of these three cutting
variables increases the surface roughness. Dual-
response contours provide useful information about
the maximum attainable surface roughness for a given
metal removal rate as a function of all three
independent cutting variables.
K. Mani Lavanya1.et.al.,[ 2013] have presented a
paper on title “Optimization Of Process Parameters In Turning Operation Of AISI-1016 Alloy Steels With
CBN Using Taguchi Method And Anova” [Ref 7]This
study investigates the parameters affecting the
roughness of surfaces produced in the turning process
for the material AISI-1016 Steel. Design of
experiments have been conducted for the analysis of
the influence of the turning parameters such as cutting
speed, feed rate and depth of cut on the surface
roughness. The results of the machining experiments
for AISI-1016 have been used to characterize the main factors affecting surface roughness by the
Analysis of Variance (ANOVA) method. The
experiment was conducted using work piece material
AISI-1016. The cutting tool used was Cubic Boron
Nitrite. CBN is the second only to diamond in the
hardness. The tests were carried for a length of
300mm in a PSGA141 Conventional lathe.AISI-1016
steel is used as a work piece material for carrying out
the experimentation to optimize the surface
roughness. The bars used are of 50mm diameter and
300mm length. From ANOVA Table and Response
Table for Signal to noise ratios, based on the ranking it can be concluded that Speed has a greater influence
on the Surface Roughness followed by Feed. Depth of
Cut had least influence on Surface Roughness.
Conclusion says that the feed rate is found to be the
most significant parameter influencing the surface
roughness in the turning process.

Volume 1, Issue 1 (2013) 31-45 ISSN 2347 - 3258 International Journal of Advance Research and Innovation
42 IJARI
Fig: 5. MINI Tab Results: [Ref 7]
Philip Selvaraj.et.al., have presented a paper on
title “ Optimization Of Surface Roughness Of Aisi
304 Austenitic Stainless Steel In Dry Turning
Operation Using Taguchi Design Method “ [Ref 14]
This paper presents the influence of cutting parameters like cutting speed, feed rate and depth of
cut on the surface roughness of austenitic stainless
steel during dry turning. A plan of experiments based
on Taguchi‟s technique has been used to acquire the
data. An orthogonal array, the signal to noise (S/N)
ratio and the analysis of variance (ANOVA) are
employed to investigate the cutting characteristics of
AISI 304 austenitic stainless steel bars using TiC and
TiCN coated tungsten carbide cutting tool. Finally the
confirmation tests that have been carried out to
compare the predicted values with the experimental
values confirm its effectiveness in the analysis of surface roughness the cutting tests were made on
medium duty Kirloskar Turn master-35 Lathe. A tool
holder with a general specification PSBNR 2525M12
was used in this experiment. Carbide insert (Tagutec
make) with a general specification of SNMG 120408
MT TT5100 coated with TiC and TiCN was used as
the cutting tool insert. The experiments were
conducted as per the orthogonal array and the surface
roughness for various combinations of parameters
was measured using TR-100 surface roughness tester.
The measurement accuracy meets the ISO and DIN standards. The Piezoelectric stylus and cut-off (2.5
mm) was used for taking the surface roughness
measurements. The experimentations were conducted
without the application of cutting fluid (dry turning).
The experiments were planned using Taguchi‟s
orthogonal array in the design of experiments, which
helps in reducing the number of experiments. The
experiments were conducted according to a 3-level L9
orthogonal array. The cutting parameters identified
were cutting speed, feed and depth of cut. The results
of the cutting experiments were studied using the S/N
and ANOVA analyses. Based on the results of the S/N and ANOVA analyses, optimal cutting
parameters for surface roughness were obtained and
verified. They have concluded that the Taguchi
optimization method was applied to find the optimal
process parameters, which minimizes the surface
roughness during the dry turning of AISI 304
Austenitic Stainless Steel. A Taguchi orthogonal
array, the signal to noise (S/N) ratio and the analysis
of variance (ANOVA) were used for the optimization
of cutting parameters. ANOVA results shows that
feed rate, cutting speed and depth of cut affects the surface roughness by 51.84%, 41.99% and 1.66%
respectively. A confirmation experiment was also
conducted and verified the effectiveness of the
Taguchi optimization method.
M. Kaladhar.et.al., [2011] have presented a paper
on title “Application Of Taguchi Approach And
Utility Concept In Solving The Multi-Objective Problem When Turning AISI 202 Austenitic Stainless
Steel” [Ref 10] In this work, a multi-characteristics
response optimization model based on Taguchi and
Utility concept is used to optimize process
parameters, such as speed, feed, depth of cut, and
nose radius on multiple performance characteristics,
namely, surface roughness (Ra) and material removal
rate (MRR) during turning of AISI 202 austenitic
stainless steel using a CVD coated cemented carbide
tool. Taguchi‟s L8 orthogonal array (OA) is selected
for experimental planning. The experimental result
analysis showed that the combination of higher levels of cutting speed, depth of cut, and nose radius and
lower level of feed is essential to achieve
simultaneous maximization of material removal rate
and minimization of surface roughness. The ANOVA
and F-tests are used to analyze the results. Further, the
confirmation tests are conducted and the results are
found to be within the confidence interval. Coated
carbide tools have shown better performance when
compared to the uncoated carbide tools [14]. For this
reason, commonly available Chemical Vapor
Deposition (CVD) of Ti (C, N) +Al2O3 coated cemented carbide inserts of 0.8 and 0.4mm as nose
radius are used in the present experimental
investigation. They have concluded that based on the
ANOVA and F-test analysis, the most statistical
significant and percent contribution of the process
parameters for multiple performances are depth of cut,
cutting speed, whereas feed and nose radius are less
effective. In both the stages the interaction effect of
process parameters is negligible. Table12 shows the
results comparison. The validation experiment
confirmed that the adequacy of law of additively is
justified. It is also found that the proposed model based on Taguchi approach and Utility concept is
simple, useful and provides an appropriate solution
for multi-response optimization problems.
Alexandru STANIMIR.et.al., [2011] have presented a
paper on title “Regressions Modelling Of Surface
Roughness In Finish Turning Of Hardened 205cr115
Steel Using Factorial Design Methodology”[Ref 2] In
this study, in order to find out a mathematical relation
of polynomial second degree type which describe, in
finish turning of hardened 205 Cr115 steel, the
roughness parameter Ra dependence on cutting edge wear, depth of cut, feed rate and cutting speed, a
factorial design methodology was used. The

Volume 1, Issue 1 (2013) 31-45 ISSN 2347 - 3258 International Journal of Advance Research and Innovation
43 IJARI
experimental tests were done according to a
composed, central, four-factor five-level factorial
program.
Fig: 6. Roughness surface variation with depth of cut
and feed rate
Fig: 7. Roughness surface variation with cutting speed
and flank wear
The established second degree polynomial
relationship for the Ra calculus as a function of the
cutting conditions and the flank wear approximate in
a satisfactory way the studied phenomena. The main
influence on the surface roughness is exerting by the feed rate and flank wear. However, we have to notice
that the cutting speed and the depth of cut influence
indirectly the roughness surface because the increase
of this parameters result in increased chemical wear of
PCBN cutting tool. Also, the interactions of some
parameters as feed rate and flank wear have a great
influence on the roughness values of the machined
surface.
Karin Kandananond [2009] have presented a
paper on title ” The Determination Of Empirical
Model For Surface Roughness In Turning Process
Using Design Of Experiment” [Ref 8] The purpose of
this research is to determine the empirical model for
surface roughness in a turning process. This process is
performed in the final assembly department at a
manufacturing company which supplies fluid dynamic
bearing (FDB) spindle motors for hard disk drives
(HDDs). The work pieces used were the sleeves of FDB motors made of ferritic stainless steel, grade
AISI 12L14. A 2k factorial experiment was used to
characterize the effects of machining factors, depth of
cut, spindle speed and feed rate on the surface
roughness of the sleeve. The results show that the
surface roughness is minimized when the spindle
speed and feed rate are set to the highest levels while
the depth of cut is set to the lowest level. Even though
the results from this research are process specific, the
methodology deployed can be
Fig.7 Geometric view of 23 factorial designs
readily applied to different turning processes. As a
result, practitioners have guidelines for achieving the
highest possible performance potential. The purpose
of this research is to quantify the effect of depth of
cut, spindle speed and feed rate on surface roughness
of the FDB sleeve in HDD. The factorial design was
utilized to obtain the best cutting condition which leads to the minimization of the surface roughness.
The half normal plot and ANOVA indicate that the
feed rate (C) is the most significant factor followed by
spindle speed (B) and feed rate (A). Moreover, it is
interesting to note that there are interactions among
these three factors with the highest order term, ABC.
Regarding the model validation, the regression model
developed proves to be accuracy and has the
capability to predict the value of response within the
limits of factors investigated. After the optimal
cutting condition is implemented, the surface roughness is significantly reduced about 8 percent. In
addition to the factorial design experiment, the RSM
and Taguchi design are proved to be potential
methodologies to develop an empirical model and
optimize the surface roughness of the metal work
pieces.

Volume 1, Issue 1 (2013) 31-45 ISSN 2347 - 3258 International Journal of Advance Research and Innovation
44 IJARI
Manish Kumar Yadav.et.al.,[ 2009] have
presented a paper on title ” Paper On A Comparative
Study Of Surface Roughness In Multi Tool Turning
With Single Tool Turning Through Factorial Design
Of Experiments” [Ref 11] The paper focus on
embryonic a few criterion on the basis of which a range of control parameters can be selected in order to
attain the desired level of the surface finish on the
material for development of techniques using factorial
design of experiments for acquiring appropriate
surface finish by multi tool machining. Throughout
real machining process there are different factors
which unfavorably impinge on the finish and
therefore, the proper mythological concern of these
factors appear to be most crucial for achieve the
appropriate and preferred level of surface finish. The
present paper will attempt to a comparative study of
surface roughness in Multi tool turning with single tool turning through factorial design of experiments
on AISI-1018.The conclusions made from their
experimental investigation shows that Surface finish
obtained at low cutting feeds is better than higher
cutting feed and Higher depth of cut gives less surface
finish with respect to at lower depth of Cut. There is
fluctuation in surface roughness with cutting speed.
Surface finish Obtained at higher cutting speed is
better than lower cutting speed. Surface finish
obtained at low shear plane area is better than higher
shear Plane area.
6. Conclusions
On the basis of the experimental results and
derived analysis, one can conclude that cutting speed
has the most dominant effect on the observed surface
roughness, followed by feed rate and depth of cut,
whose influences on surface roughness are smaller.
The surface roughness is continuously improved with
the increase in cutting speed, but increase in feed rate
and depth of cut causes a significant deterioration of surface roughness. The results obtained using the
Taguchi optimization method revealed that cutting
speed should be kept at the highest level, while both
feed rate and depth of cut should be kept at the lowest
level. The response graphs and ANOVA results show
that the effects of two-way interactions of these
cutting parameters are statistically insignificant, that
is, can be neglected. As shown in this study, the
Taguchi method provides a systematic, efficient and
easy-to-use approach for the cutting process
optimization.
Reference
[1] A.V.N.L.Sharma.et.al.,” Parametric Analysis and
Multi Objective Optimization of Cutting Parameters in Turning Operation of EN353 –
With CVD Cutting Tool Using Taguchi Method”
Journal of Engineering and Innovative
Technology (IJEIT) 2, ISSN: 2277-3754 ISO
9001:2008, 2013
[2] Alexandru STANIMIR.et.al., “Regressions
Modelling Of Surface Roughness In Finish
Turning Of Hardened 205cr115 Steel Using
Factorial Design Methodology” Fiabilitate Si
Durabilitate - Fiability & Durability No 1(7)/
2011,Editura “Academic Brâncuşi” , Târgu Jiu,
ISSN 1844 – 640X, 2011 [3] Ananthakumar. P et.al, “Optimization of Turning
Process Parameters Using Multivariate Statistical
Method-PCA Coupled with Taguchi Method
International Journal of Scientific Engineering
and Technology (ISSN: 2277-1581) 2(4), PP:
263-267 1 April 2013 IJSET@2013 Page 263
[4] E. Daniel Kirby, “A Parameter Design Study In a
Turning Operation Using The Taguchi Method”
The Technology
Interface/Kirby,[email protected], 2006
[5] Ilhan Asiltürk.et.al., “Determining the Effect of Cutting Parameters on Surface Roughness in
Hard Turning Using the Taguchi Method”
Measurement 44 (2011) 1697–1704, Journal
Homepage: Www.Elsevier.Com/
Locate/Measurement, 2011
[6] Jitendra Verma.et.al., “Turning Parameter
Optimization for Surface Roughness of Astm
A242 Type-1 Alloys Steel by Taguchi Method”,
International Journal of Advances in Engineering & Technology, March ©IJAET ISSN: 2231-
1963, 255, 3(1), Pp. 255-261, 2012
[7] K. Mani Lavanya1.et.al., “Optimization Of
Process Parameters In Turning Operation Of
AISI-1016 Alloy Steels With CBN Using
Taguchi Method And Anova” IOSR Journal Of
Mechanical And Civil Engineering (IOSR-
JMCE) E-ISSN: 2278-1684,P-ISSN: 2320-334X,
7(2) PP 24-27 Www.Iosrjournals.Org
[8] Karin Kandananond, “The Determination of
Empirical Model for Surface Roughness in
Turning Process Using Design Of Experiment” ISSN: 1109-2777 1135 10(8), 2009
[9] M Kaladhara .et.al, “Determination of Optimum
Process Parameters during Turning of AISI 304
Austenitic Stainless Steels Using Taguchi
Method ANOVA”
[10] M. Kaladhar.et.al., “Application of Taguchi
Approach and Utility Concept in Solving the
Multi-Objective Problem When Turning AISI
202 Austenitic Stainless Steel” Journal of

Volume 1, Issue 1 (2013) 31-45 ISSN 2347 - 3258 International Journal of Advance Research and Innovation
45 IJARI
Engineering Science and Technology Review 4
(1) 55-61, 2011
[11] Manish Kumar Yadav.et.al., “Paper On A
Comparative Study Of Surface Roughness In
Multi Tool Turning With Single Tool Turning
Through Factorial Design Of Experiments” International Journal Of Scientific & Engineering
Research 3(8), August-2012 1 ISSN 2229-5518
IJSER © 2012 Http://Www.Ijser.Org, 2009
[12] Marinković Velibor et.al., “Optimization Of
Surface Roughness In Turning Alloy Steel By
Using Taguchi Method” Scientific Research And
Essays Vol. 6(16), Pp. 3474-3484, 19 August,
2011 , ISSN 1992-2248 ©2011 Academic
Journals
[13] Muhammad Munawar.et.al., “Optimization of
Surface Finish in Turning Operation by
Considering the Machine Tool Vibration Using Taguchi Method”, 2009
[14] Philip Selvaraj.et.al., “ Optimization Of Surface
Roughness Of Aisi 304 Austenitic Stainless Steel
In Dry Turning Operation Using Taguchi Design
Method “Journal Of Engineering Science And
Technology, 5(3), 2010, 293 - 301
[15] Rodrigues L. L. R et.al, “Effect of Cutting
Parameters on Surface Roughness and Cutting
Force in Turning Mild Steel” Research Journal
Of Recent Sciences International Science
Congress Association, 1(10), 19-26, October, 2012 Res. J. Recent Sci ISSN 2277-2502
[16] Vipin.et.al., “Surface Roughness Prediction
Model by Design of Experiments for Turning
Leaded Gun Metal” International Journal of
Applied Engineering Research ISSN 0973-4562
4(12) Pp. 2621–2628, 2009
[17] Yigit Kazancoglu1.et.al., “Multi-Objective
Optimization of The Cutting Forces In Turning
Operations Using The Grey-Based Taguchi
Method, Original Scientific Article/ Izvirni
Znanstveni ~Lanek MTAEC9, 45(2)105, ISSN
1580-2949, 2011