optimization of salt adsorption rate in membrane
TRANSCRIPT

ww.sciencedirect.com
wat e r r e s e a r c h 4 7 ( 2 0 1 3 ) 1 9 4 1e1 9 5 2
Available online at w
journal homepage: www.elsevier .com/locate/watres
Optimization of salt adsorption rate in membranecapacitive deionization
R. Zhao a,b,*, O. Satpradit b, H.H.M. Rijnaarts a, P.M. Biesheuvel a,b, A. van der Wal a
aDepartment of Environmental Technology, Wageningen University, Bornse Weilanden 9, 6708 WG Wageningen, The NetherlandsbWetsus, Centre of Excellence for Sustainable Water Technology, Agora 1, 8934 CJ Leeuwarden, The Netherlands
a r t i c l e i n f o
Article history:
Received 15 September 2012
Received in revised form
9 January 2013
Accepted 13 January 2013
Available online 24 January 2013
Keywords:
Membrane capacitive deionization
Ion exchange membrane
Desalination
Water recovery
Salt adsorption rate
Porous electrode model
Constant current operation
Constant voltage operation
* Corresponding author. Department of EnvirThe Netherlands. Tel.: þ317483339.
E-mail address: [email protected] (R. Z0043-1354/$ e see front matter ª 2013 Elsevhttp://dx.doi.org/10.1016/j.watres.2013.01.025
a b s t r a c t
Membrane capacitive deionization (MCDI) is a water desalination technique based on
applying a cell voltage between two oppositely placed porous electrodes sandwiching
a spacer channel that transports the water to be desalinated. In MCDI, ion-exchange
membranes are positioned in front of each porous electrode to prevent co-ions from
leaving the electrode region during ion adsorption, thereby enhancing the salt adsorption
capacity. MCDI can be operated at constant cell voltage (CV), or at a constant electrical
current (CC).
In this paper, we present both experimental and theoretical results for desalination
capacity and rate in MCDI (both in the CV- and the CC-mode) as function of adsorption/
desorption time, salt feed concentration, electrical current, and cell voltage. We demon-
strate how by varying each parameter individually, it is possible to systematically optimize
the parameter settings of a given system to achieve the highest average salt adsorption rate
and water recovery.
ª 2013 Elsevier Ltd. All rights reserved.
1. Introduction efficient (Anderson et al., 2010; Cipollina, 2009). To treat
Lack of access to fresh water is one of the most severe issues
for humanity in the 21st century (Cipollina, 2009). Two-third
of the world population will be facing water scarcity by 2025
(Buerkle, 2007). Desalination technologies are used to generate
fresh water from sea water and brackish water. The state-of-
the-art desalination technology, namely Reverse Osmosis
(RO), extracts fresh water from salt water by pressurizing the
feed water on one side of a semi-permeable membrane. RO is
considered to be energy-efficient for treating high salinity
streams. However, to treat streams with lower salt concen-
tration, say below w5000 ppm, RO becomes relatively less
onmental Technology, W
hao).ier Ltd. All rights reserved
brackish water, Capacitive Deionization (CDI) serves as an
efficient alternative, which extracts the ions from the feed
solution instead of extracting the water. A CDI cell consists of
two conductive porous electrodes, which are materials with
a high internal surface area around w1000 m2/g, two graphite
current collectors that facilitate electron transport in and out
of the electrodes, and a spacer channel in between the elec-
trodes for the transport of the water, see Fig. 1. In a practical
CDI unit, several parallel cells are assembled into one stack.
When an electrical voltage is applied across the cell, ions in
the spacer channel are transported towards the electrodes
and adsorb in the electrical double layers (EDLs) formed
ageningen University, Bornse Weilanden 9, 6708 WG Wageningen,
.

Water
Current collector Carbon electrode
1
2
CationAnion
1
2exchange membrane Spacer
Vcell-+
Fig. 1 e Schematic view of the membrane capacitive
deionization (MCDI) process. Influenced by an applied
electrical field, cations in the water flowing through the
spacer channel migrate through the cation-exchange
membrane and are stored inside the adjacent porous
electrode; simultaneously, anions are stored in the
opposite electrode.
Table 1 e Reference settings for MCDI-CC operation inZVD mode.
Influent salt concentration (NaCl) 20 mM
Adsorption current (applied until
the cell voltage reaches Vcell ¼ 1.6 V)
1 A (w37 A/m2)
Water flowrate (stack) 60 mL/min
Desorption time 500 s
wat e r r e s e a r c h 4 7 ( 2 0 1 3 ) 1 9 4 1e1 9 5 21942
within the micropores in the porous electrode structure
(Arnold and Murphy, 1961; Avraham et al., 2011; Haro et al.,
2011; Humplik et al., 2011; Seo et al., 2010; Suss et al., 2012;
Zou et al., 2010).
A Membrane Capacitive Deionization (MCDI) cell has
a similar configuration as a conventional CDI cell, but in
addition contains anion and cation-exchange membranes
which are positioned between the spacer channel and the
anode, and between the spacer channel and the cathode,
respectively (Biesheuvel et al., 2011b; Kim et al., 2010; Kim and
Choi, 2010; Lee et al., 2006, 2011; Li et al., 2008; Li and Zou, 2011;
Nie et al., 2011; Park et al., 2011), see Fig. 1. It is also possible to
use only one membrane, in front of only one electrode (Kim
and Choi, 2010; Porada et al., 2012a). Because the mem-
branes block transport of co-ions, the macropores within the
electrode structure become available as extra storage space
for ions, andMCDI can removemore salt than CDI (Biesheuvel
et al., 2011b; Porada et al., 2012b; Zhao et al., 2012a). The exact
mechanism of ion adsorption in CDI and MCDI will be
explained in detail in the theory section.
So far, the overwhelming majority of CDI and MCDI
research has focused on applying a constant cell voltage (CV)
between the electrodes during the adsorption step, followed
by short-circuiting of the electrodes, or reversing the voltage,
during the desorption step. Recently it has been demonstrated
that in MCDI charging and discharging the electrodes at con-
stant current (CC) can have several major advantages in
comparison with CV, such as a constant (i.e., not varying in
time) and adjustable effluent concentration (Zhao et al.,
2012a).
For all desalination technologies, it is essential to max-
imize the desalination performance, i.e., the extent of
desalination per unit time, besides optimizing the water re-
covery (WR), which is the ratio of the flow of freshwater rel-
ative to the flow of feed water. In the present manuscript, we
focus exclusively on MCDI and analyse the influence of sev-
eral process parameters such as adsorption time, water
flowrate, and adsorption current, to investigate the influence
of each parameter on two key performance indicators in
MCDI, namely the average salt adsorption rate (ASAR) and
water recovery, WR. We discuss both the CC operational
mode, as well as CV operation. The aim of our work is to
demonstrate how the average salt adsorption rate and the
water recovery can be systematically optimized for a given
MCDI system.
2. Materials and methods
Experimental details of the MCDI stack design used in this
work have been outlined previously (Biesheuvel et al., 2011b;
Porada et al., 2012b; Zhao et al., 2010) and will be briefly
summarized here. Materials used are graphite current col-
lectors (thickness d ¼ 250 mm), porous carbon electrodes (Ma-
terials & Methods LLC., PACMM� 203, Irvine, CA, de ¼ 362 mm,
anion and cation-exchange membranes (Neosepta AMX,
dmem¼ 140 mm, andNeosepta CMX, dmem¼ 170 mm, Tokuyama,
Japan) and a polymer spacer (Glass fibre prefilter, Millipore,
Ireland, dsp ¼ 250 mm). In the MCDI stack, we use N ¼ 8 cells,
with total electrode mass of 10.8 g. The salt solution flows
from all four sides of the stack into the square 6$6 cm2 spacer
channel of each of the N cells, and leaves from a hole
(1.5$1.5 cm2) in the middle of each cell. After assembly, all
layers in the stack are compressed and placed in a PTFE
housing. The stack is fed from a 10 L vessel with NaCl as the
electrolyte, to which the effluent is recycled. The conductivity
of the effluent of the stack is measured in-line and is con-
verted into salt concentration according to a calibration curve.
Effluent pH is alsomeasured and used to correct themeasured
conductivity. The electrical current through the cell is applied
using a potentiostat (Iviumstat standard, Ivium Technologies,
The Netherlands) which can simultaneously apply and mea-
sure the cell voltage and the electrical current between the
two electrodes. Reference electrodes are not used in our
experiments.
In this paper, experimental and theoretical work of MCDI is
reported as function of several input parameters. In the ex-
periments, we vary each of them in turn, while keeping the
others at their reference settings, see Tables 1 and 2. For
constant current operation (CC), the reference settings for the
whole stack are defined as follows: during ion adsorption we
apply an electrical current of 1 A to the entire stack, until the
cell voltage reaches Vcell ¼ 1.6 V. At this moment we switch
from the ion adsorption step to the ion desorption step
by changing either the voltage or the current. Note that an
electrical current of 1 A is equal to a current density of
w37 A per m2 electrode area. During desorption, we either
immediately switch off the cell voltage to Vcell ¼ 0 V for a fixed
period of time (500 s) (as if short-circuiting the cell), which is
the zero-volt desorption mode (ZVD), see Table 1, or we apply
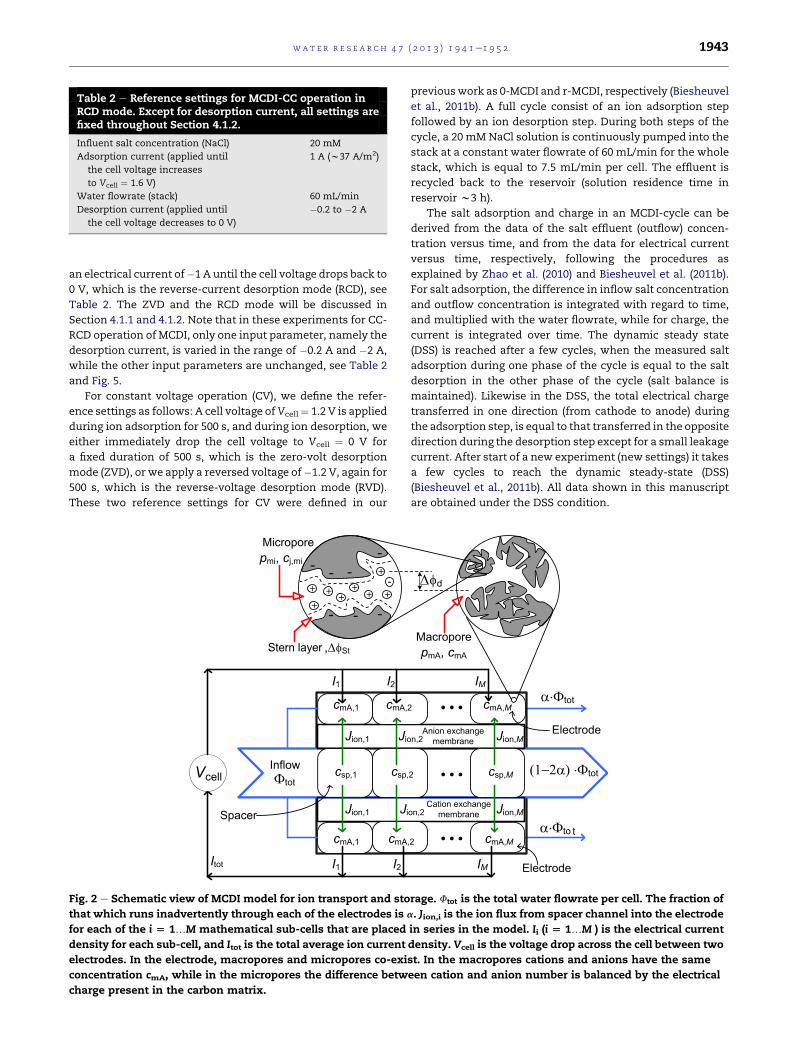
Table 2 e Reference settings for MCDI-CC operation inRCD mode. Except for desorption current, all settings arefixed throughout Section 4.1.2.
Influent salt concentration (NaCl) 20 mM
Adsorption current (applied until
the cell voltage increases
to Vcell ¼ 1.6 V)
1 A (w37 A/m2)
Water flowrate (stack) 60 mL/min
Desorption current (applied until
the cell voltage decreases to 0 V)
�0.2 to �2 A
wat e r r e s e a r c h 4 7 ( 2 0 1 3 ) 1 9 4 1e1 9 5 2 1943
an electrical current of�1 A until the cell voltage drops back to
0 V, which is the reverse-current desorption mode (RCD), see
Table 2. The ZVD and the RCD mode will be discussed in
Section 4.1.1 and 4.1.2. Note that in these experiments for CC-
RCD operation of MCDI, only one input parameter, namely the
desorption current, is varied in the range of �0.2 A and �2 A,
while the other input parameters are unchanged, see Table 2
and Fig. 5.
For constant voltage operation (CV), we define the refer-
ence settings as follows: A cell voltage of Vcell¼ 1.2 V is applied
during ion adsorption for 500 s, and during ion desorption, we
either immediately drop the cell voltage to Vcell ¼ 0 V for
a fixed duration of 500 s, which is the zero-volt desorption
mode (ZVD), or we apply a reversed voltage of�1.2 V, again for
500 s, which is the reverse-voltage desorption mode (RVD).
These two reference settings for CV were defined in our
Fig. 2 e Schematic view of MCDI model for ion transport and sto
that which runs inadvertently through each of the electrodes is a
for each of the i [ 1.M mathematical sub-cells that are placed
density for each sub-cell, and Itot is the total average ion current
electrodes. In the electrode, macropores and micropores co-exi
concentration cmA, while in the micropores the difference betw
charge present in the carbon matrix.
previouswork as 0-MCDI and r-MCDI, respectively (Biesheuvel
et al., 2011b). A full cycle consist of an ion adsorption step
followed by an ion desorption step. During both steps of the
cycle, a 20 mMNaCl solution is continuously pumped into the
stack at a constant water flowrate of 60 mL/min for the whole
stack, which is equal to 7.5 mL/min per cell. The effluent is
recycled back to the reservoir (solution residence time in
reservoir w3 h).
The salt adsorption and charge in an MCDI-cycle can be
derived from the data of the salt effluent (outflow) concen-
tration versus time, and from the data for electrical current
versus time, respectively, following the procedures as
explained by Zhao et al. (2010) and Biesheuvel et al. (2011b).
For salt adsorption, the difference in inflow salt concentration
and outflow concentration is integrated with regard to time,
and multiplied with the water flowrate, while for charge, the
current is integrated over time. The dynamic steady state
(DSS) is reached after a few cycles, when the measured salt
adsorption during one phase of the cycle is equal to the salt
desorption in the other phase of the cycle (salt balance is
maintained). Likewise in the DSS, the total electrical charge
transferred in one direction (from cathode to anode) during
the adsorption step, is equal to that transferred in the opposite
direction during the desorption step except for a small leakage
current. After start of a new experiment (new settings) it takes
a few cycles to reach the dynamic steady-state (DSS)
(Biesheuvel et al., 2011b). All data shown in this manuscript
are obtained under the DSS condition.
rage. Ftot is the total water flowrate per cell. The fraction of
. Jion,i is the ion flux from spacer channel into the electrode
in series in the model. Ii (i [ 1.M ) is the electrical current
density. Vcell is the voltage drop across the cell between two
st. In the macropores cations and anions have the same
een cation and anion number is balanced by the electrical

(a) (b)
(c) (d)
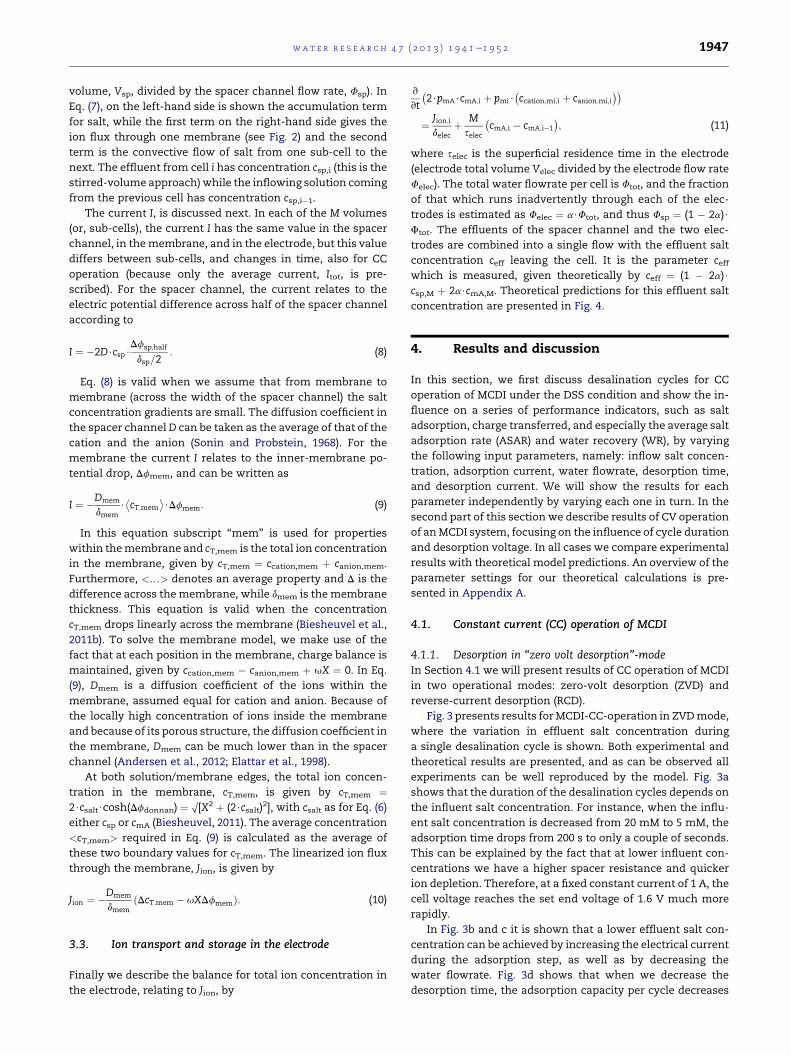
Fig. 3 e Effluent salt concentration during a dynamic steady-state cycle for CC-MCDI in ZVD-mode as function of
experimental parameters varied around the reference settings, see Table 1: (a) influent salt concentration, (b) adsorption
current, (c) water flowrate, and (d) desorption time. The dotted lines are experiments, and the solid lines are theory.
wat e r r e s e a r c h 4 7 ( 2 0 1 3 ) 1 9 4 1e1 9 5 21944
3. Theory
To describe the desalination performance of MCDI, we use
a theoretical model for the MCDI process that takes into ac-
count many geometrical and experimental details. To
describe ion adsorption in the porous electrode during
capacitive charging, we use the two-porosity model that
considers the two types of porosity in the electrodes, namely
the macropores (transport pathways) in between the porous
activated carbon particles, and the micropores (intraparticle
porosity) within the carbon particles, see Fig. 2 (Biesheuvel
et al., 2011a, 2011b; 2012; Porada et al., 2012c; Zhao et al.,
2012b). In MCDI, after an electrical current or voltage is
applied, counterions will pass through the membrane into
the electrode, and move via the macropores into the micro-
pores, where they will be stored in the electrical double layers
(EDLs). Simultaneously, co-ions are expelled from the mi-
cropores, but are prevented from leaving the electrode region
because of the ion-exchange membranes placed in front of
the electrodes; these ions will therefore end up in the mac-
ropores of the electrode. Because the macropores are always
electrically neutral (which implies that the amount of co-ions
there equals the amount of counterions), additional coun-
terions can migrate from the spacer channel into the
macropores, thereby enlarging the salt storage capacity when
membranes are used, i.e., when MCDI is used instead of CDI.
These effects of micro- and macropores, and the membrane,
are included in the present model. In the model we describe
the plug-flow character of the spacer channel by placing
a certain number (M ) of ideally stirred volumes, or ‘sub-cells’
in series.
3.1. Electrostatic double layers in porous electrodes andoverall cell voltage balance
In the two-porosity model (Biesheuvel et al., 2011b), the
transport of ions across the electrode takes place through the
macropores which form the space in between the carbon
particles (typical dimension of the order of one to several mm)
with porosity of pmA (macropore volume per unit total elec-
trode volume). The micropores are where the counterions are
preferentially stored in the electrical double layers (EDLs). The
pore size of the micropores is typically a few nanometres or
less.
In the macropores, ccation has the same concentration as
canion and thus a salt concentration csalt (per unit of macropore
volume) can be defined. Micropores are the pores inside
the carbon particles, which have a porosity of pmi (micropore
volume per unit total electrode volume), in which the
0
0.1
0.2
0.30
0.2
0.4
0.6
0.8
1
0 0.5 1 1.5 2 0 20 40 60 80 0 100 200 300 400 500
0
0.1
0.2
0.30
0.2
0.4
0.6
0.8
1
0
0.1
0.2
0
0.1
0.2
0.3
0
0.2
0.4
0.6
0.8
1
0
0.1
0.2
0
0.2
0.4
0.6
0
0.2
0.4
0.6
0.8
1
20
0
10
20
30
0
10
20
10
0
10
20
30
0
0
0.1
0.2
0.3
0.4
0 50 100 150 2000
0.1
0.2
0.3
Charge
Saltadsorption Salt
adsorption
Saltadsorption
ChargeSaltadsorption
Charge
Water recovery(left y-axis)
Cycle time (s)(right y-axis)
Salt adsorption(mmol/g)(left y-axis)
Charge (C/g)(right y-axis)
ASAR (µmol/g/s)
Charge
ASAR
ASARASARASAR
Water recoveryWater recovery
Water recovery
Water recovery
800
600
400
200
0
800
600
400
200
0
800
600
400
200
0
Influent salt concentration (mM) Adsorption current (A) Flowrate (mL/min) Desorption time (s)
tcycletcycle
tcycle
tcycleA
B
C
I II III IV
0
3000
2000
1000
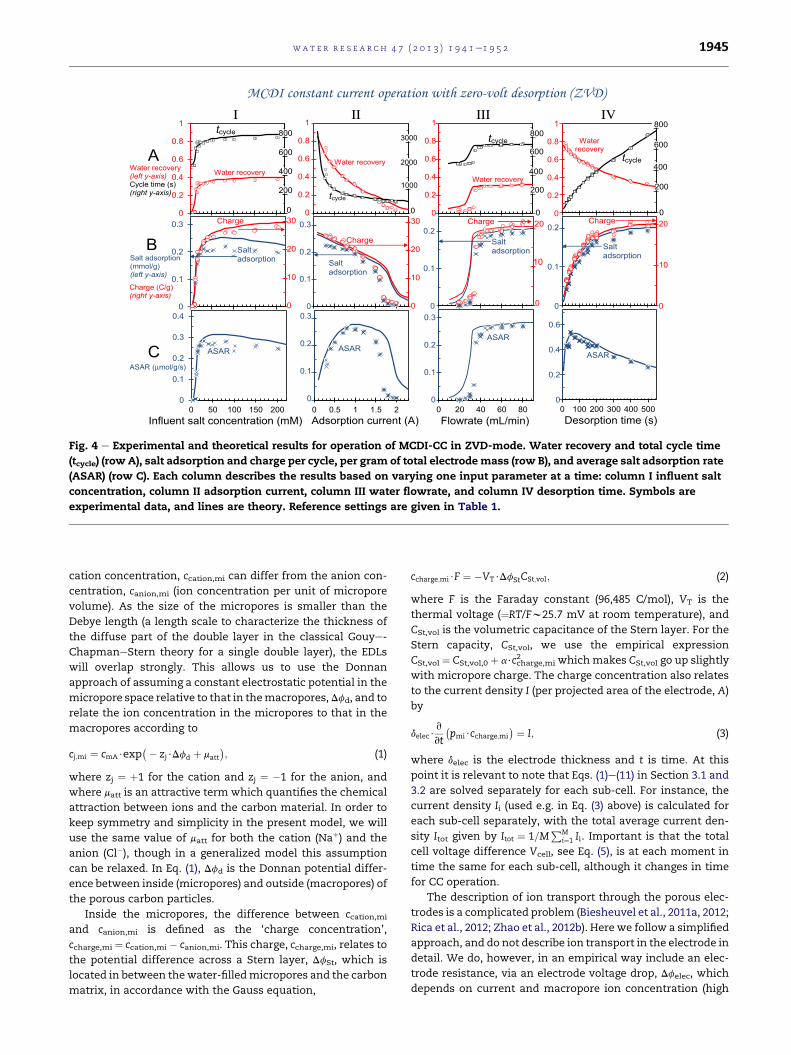
Fig. 4 e Experimental and theoretical results for operation of MCDI-CC in ZVD-mode. Water recovery and total cycle time
(tcycle) (row A), salt adsorption and charge per cycle, per gram of total electrodemass (row B), and average salt adsorption rate
(ASAR) (row C). Each column describes the results based on varying one input parameter at a time: column I influent salt
concentration, column II adsorption current, column III water flowrate, and column IV desorption time. Symbols are
experimental data, and lines are theory. Reference settings are given in Table 1.
wat e r r e s e a r c h 4 7 ( 2 0 1 3 ) 1 9 4 1e1 9 5 2 1945
cation concentration, ccation,mi can differ from the anion con-
centration, canion,mi (ion concentration per unit of micropore
volume). As the size of the micropores is smaller than the
Debye length (a length scale to characterize the thickness of
the diffuse part of the double layer in the classical Gouye-
ChapmaneStern theory for a single double layer), the EDLs
will overlap strongly. This allows us to use the Donnan
approach of assuming a constant electrostatic potential in the
micropore space relative to that in themacropores,Dfd, and to
relate the ion concentration in the micropores to that in the
macropores according to
cj;mi ¼ cmA$exp�� zj$Dfd þ matt
�; (1)
where zj ¼ þ1 for the cation and zj ¼ �1 for the anion, and
where matt is an attractive term which quantifies the chemical
attraction between ions and the carbon material. In order to
keep symmetry and simplicity in the present model, we will
use the same value of matt for both the cation (Naþ) and the
anion (Cl�), though in a generalized model this assumption
can be relaxed. In Eq. (1), Dfd is the Donnan potential differ-
ence between inside (micropores) and outside (macropores) of
the porous carbon particles.
Inside the micropores, the difference between ccation,mi
and canion,mi is defined as the ‘charge concentration’,
ccharge,mi ¼ ccation,mi � canion,mi. This charge, ccharge,mi, relates to
the potential difference across a Stern layer, DfSt, which is
located in between thewater-filledmicropores and the carbon
matrix, in accordance with the Gauss equation,
ccharge;mi$F ¼ �VT$DfStCSt;vol; (2)
where F is the Faraday constant (96,485 C/mol), VT is the
thermal voltage (¼RT/Fw25.7 mV at room temperature), and
CSt,vol is the volumetric capacitance of the Stern layer. For the
Stern capacity, CSt,vol, we use the empirical expression
CSt,vol ¼ CSt,vol,0 þ a$ccharge,mi2 whichmakes CSt,vol go up slightly
with micropore charge. The charge concentration also relates
to the current density I (per projected area of the electrode, A)
by
delec$v
vt
�pmi$ccharge;mi
� ¼ I; (3)
where delec is the electrode thickness and t is time. At this
point it is relevant to note that Eqs. (1)e(11) in Section 3.1 and
3.2 are solved separately for each sub-cell. For instance, the
current density Ii (used e.g. in Eq. (3) above) is calculated for
each sub-cell separately, with the total average current den-
sity Itot given by Itot ¼ 1=MPM
i¼1 Ii. Important is that the total
cell voltage difference Vcell, see Eq. (5), is at each moment in
time the same for each sub-cell, although it changes in time
for CC operation.
The description of ion transport through the porous elec-
trodes is a complicated problem (Biesheuvel et al., 2011a, 2012;
Rica et al., 2012; Zhao et al., 2012b). Here we follow a simplified
approach, and do not describe ion transport in the electrode in
detail. We do, however, in an empirical way include an elec-
trode resistance, via an electrode voltage drop, Dfelec, which
depends on current and macropore ion concentration (high
0
10
20
30
40
0 100 200 300 400
0
0.1
0.2
0 0.5 1 1.5 20
0 0.5 1 1.5 20
200
400
600
800
0
0.2
0.4
0.6
0.8
1
10
20
-1.4 A-0.8 A
-0.2 A
Charge
tcycle
Water recovery
Desorption current
Efflu
ent c
once
ntra
tion
(mM
)
Wat
er re
cove
ry
Salt
adso
rptio
n (m
mol
/g)
ASAR
(µ
mol
/g/s
)
Time (s) Desorption current (A)
Tim
e (s
)
Desorption current (A) Desorption current (A)
(a) (b)
(c)
- -- -
Salt adsorption
----
0-- --0 0.5 1 1.5 2
0.6
0.4
0.2
Charge (C/g)
ASAR
(d)
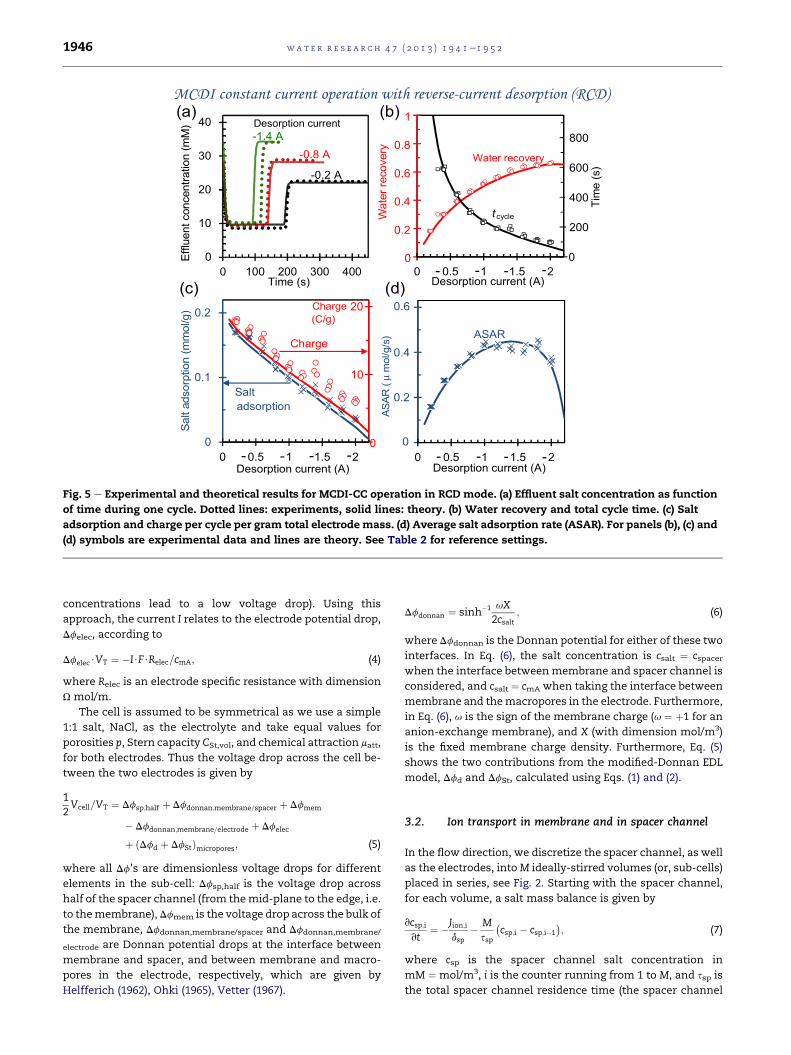
Fig. 5 e Experimental and theoretical results for MCDI-CC operation in RCD mode. (a) Effluent salt concentration as function
of time during one cycle. Dotted lines: experiments, solid lines: theory. (b) Water recovery and total cycle time. (c) Salt
adsorption and charge per cycle per gram total electrode mass. (d) Average salt adsorption rate (ASAR). For panels (b), (c) and
(d) symbols are experimental data and lines are theory. See Table 2 for reference settings.
wat e r r e s e a r c h 4 7 ( 2 0 1 3 ) 1 9 4 1e1 9 5 21946
concentrations lead to a low voltage drop). Using this
approach, the current I relates to the electrode potential drop,
Dfelec, according to
Dfelec$VT ¼ �I$F$Relec=cmA; (4)
where Relec is an electrode specific resistance with dimension
U mol/m.
The cell is assumed to be symmetrical as we use a simple
1:1 salt, NaCl, as the electrolyte and take equal values for
porosities p, Stern capacity CSt,vol, and chemical attraction matt,
for both electrodes. Thus the voltage drop across the cell be-
tween the two electrodes is given by
12Vcell=VT ¼ Dfsp;half þ Dfdonnan;membrane=spacer þ Dfmem
� Dfdonnan;membrane=electrode þ Dfelec
þ ðDfd þ DfStÞmicropores; (5)
where all Df’s are dimensionless voltage drops for different
elements in the sub-cell: Dfsp,half is the voltage drop across
half of the spacer channel (from themid-plane to the edge, i.e.
to themembrane),Dfmem is the voltage drop across the bulk of
the membrane, Dfdonnan,membrane/spacer and Dfdonnan,membrane/
electrode are Donnan potential drops at the interface between
membrane and spacer, and between membrane and macro-
pores in the electrode, respectively, which are given by
Helfferich (1962), Ohki (1965), Vetter (1967).
Dfdonnan ¼ sinh�1 uX2csalt
; (6)
where Dfdonnan is the Donnan potential for either of these two
interfaces. In Eq. (6), the salt concentration is csalt ¼ cspacerwhen the interface betweenmembrane and spacer channel is
considered, and csalt ¼ cmA when taking the interface between
membrane and themacropores in the electrode. Furthermore,
in Eq. (6), u is the sign of the membrane charge (u ¼ þ1 for an
anion-exchange membrane), and X (with dimension mol/m3)
is the fixed membrane charge density. Furthermore, Eq. (5)
shows the two contributions from the modified-Donnan EDL
model, Dfd and DfSt, calculated using Eqs. (1) and (2).
3.2. Ion transport in membrane and in spacer channel
In the flow direction, we discretize the spacer channel, as well
as the electrodes, intoM ideally-stirred volumes (or, sub-cells)
placed in series, see Fig. 2. Starting with the spacer channel,
for each volume, a salt mass balance is given by
vcsp;ivt
¼ �Jion;idsp
� Mssp
�csp;i � csp;i�1
�; (7)
where csp is the spacer channel salt concentration in
mM ¼ mol/m3, i is the counter running from 1 to M, and ssp is
the total spacer channel residence time (the spacer channel
wat e r r e s e a r c h 4 7 ( 2 0 1 3 ) 1 9 4 1e1 9 5 2 1947
volume, Vsp, divided by the spacer channel flow rate, Fsp). In
Eq. (7), on the left-hand side is shown the accumulation term
for salt, while the first term on the right-hand side gives the
ion flux through one membrane (see Fig. 2) and the second
term is the convective flow of salt from one sub-cell to the
next. The effluent from cell i has concentration csp,i (this is the
stirred-volume approach) while the inflowing solution coming
from the previous cell has concentration csp,i�1.
The current I, is discussed next. In each of the M volumes
(or, sub-cells), the current I has the same value in the spacer
channel, in themembrane, and in the electrode, but this value
differs between sub-cells, and changes in time, also for CC
operation (because only the average current, Itot, is pre-
scribed). For the spacer channel, the current relates to the
electric potential difference across half of the spacer channel
according to
I ¼ �2D$csp$Dfsp;half
dsp=2: (8)
Eq. (8) is valid when we assume that from membrane to
membrane (across the width of the spacer channel) the salt
concentration gradients are small. The diffusion coefficient in
the spacer channelD can be taken as the average of that of the
cation and the anion (Sonin and Probstein, 1968). For the
membrane the current I relates to the inner-membrane po-
tential drop, Dfmem, and can be written as
I ¼ �Dmem
dmem$�cT;mem
�$Dfmem: (9)
In this equation subscript “mem” is used for properties
within themembrane and cT,mem is the total ion concentration
in the membrane, given by cT,mem ¼ ccation,mem þ canion,mem.
Furthermore, <.> denotes an average property and D is the
difference across themembrane, while dmem is themembrane
thickness. This equation is valid when the concentration
cT,mem drops linearly across the membrane (Biesheuvel et al.,
2011b). To solve the membrane model, we make use of the
fact that at each position in the membrane, charge balance is
maintained, given by ccation,mem � canion,mem þ uX ¼ 0. In Eq.
(9), Dmem is a diffusion coefficient of the ions within the
membrane, assumed equal for cation and anion. Because of
the locally high concentration of ions inside the membrane
and because of its porous structure, the diffusion coefficient in
the membrane, Dmem can be much lower than in the spacer
channel (Andersen et al., 2012; Elattar et al., 1998).
At both solution/membrane edges, the total ion concen-
tration in the membrane, cT,mem, is given by cT,mem ¼2$csalt$cosh(Dfdonnan) ¼ O[X2 þ (2$csalt)
2], with csalt as for Eq. (6)
either csp or cmA (Biesheuvel, 2011). The average concentration
<cT,mem> required in Eq. (9) is calculated as the average of
these two boundary values for cT,mem. The linearized ion flux
through the membrane, Jion, is given by
Jion ¼ �Dmem
dmemðDcT;mem � uXDfmemÞ: (10)
3.3. Ion transport and storage in the electrode
Finally we describe the balance for total ion concentration in
the electrode, relating to Jion, by
v
vt
�2$pmA$cmA;i þ pmi$
�ccation;mi;i þ canion;mi;i
��
¼ Jion;idelec
þ Mselec
�cmA;i � cmA;i�1
�; (11)
where selec is the superficial residence time in the electrode
(electrode total volume Velec divided by the electrode flow rate
Felec). The total water flowrate per cell is Ftot, and the fraction
of that which runs inadvertently through each of the elec-
trodes is estimated as Felec ¼ a$Ftot, and thus Fsp ¼ (1 � 2a)$
Ftot. The effluents of the spacer channel and the two elec-
trodes are combined into a single flow with the effluent salt
concentration ceff leaving the cell. It is the parameter ceffwhich is measured, given theoretically by ceff ¼ (1 � 2a)$
csp,M þ 2a$cmA,M. Theoretical predictions for this effluent salt
concentration are presented in Fig. 4.
4. Results and discussion
In this section, we first discuss desalination cycles for CC
operation of MCDI under the DSS condition and show the in-
fluence on a series of performance indicators, such as salt
adsorption, charge transferred, and especially the average salt
adsorption rate (ASAR) and water recovery (WR), by varying
the following input parameters, namely: inflow salt concen-
tration, adsorption current, water flowrate, desorption time,
and desorption current. We will show the results for each
parameter independently by varying each one in turn. In the
second part of this section we describe results of CV operation
of anMCDI system, focusing on the influence of cycle duration
and desorption voltage. In all cases we compare experimental
results with theoretical model predictions. An overview of the
parameter settings for our theoretical calculations is pre-
sented in Appendix A.
4.1. Constant current (CC) operation of MCDI
4.1.1. Desorption in “zero volt desorption”-modeIn Section 4.1 we will present results of CC operation of MCDI
in two operational modes: zero-volt desorption (ZVD) and
reverse-current desorption (RCD).
Fig. 3 presents results forMCDI-CC-operation in ZVDmode,
where the variation in effluent salt concentration during
a single desalination cycle is shown. Both experimental and
theoretical results are presented, and as can be observed all
experiments can be well reproduced by the model. Fig. 3a
shows that the duration of the desalination cycles depends on
the influent salt concentration. For instance, when the influ-
ent salt concentration is decreased from 20 mM to 5 mM, the
adsorption time drops from 200 s to only a couple of seconds.
This can be explained by the fact that at lower influent con-
centrations we have a higher spacer resistance and quicker
ion depletion. Therefore, at a fixed constant current of 1 A, the
cell voltage reaches the set end voltage of 1.6 V much more
rapidly.
In Fig. 3b and c it is shown that a lower effluent salt con-
centration can be achieved by increasing the electrical current
during the adsorption step, as well as by decreasing the
water flowrate. Fig. 3d shows that when we decrease the
desorption time, the adsorption capacity per cycle decreases

wat e r r e s e a r c h 4 7 ( 2 0 1 3 ) 1 9 4 1e1 9 5 21948
and consequently the adsorption time also becomes shorter.
This is because a decrease in the desorption time leads to
incomplete release of counterions from the electrodes and
consequently leads to a lower ion removal in the next
adsorption step.
It can be observed in Fig. 3b and c that by varying the
current during ion adsorption and/or by varying the water
flowrate, the salt concentration in the effluent can either be
increased or decreased, and therefore in the CC mode it is
possible to fine-tune the salt concentration in the effluent
water stream to a desired level (Zhao et al., 2012a).
Data such as obtained for the experiments shown in Fig. 3
are presented in aggregate form in Fig. 4 with each panel (aed)
in Fig. 3 corresponding to one column (IeIV) in Fig. 4. In Fig. 4
row A we present the total cycle time (tcycle) and the water
recovery (WR) as function of influent salt concentration (col-
umn I), adsorption current (column II), water flowrate (column
III), and desorption time (IV). WR indicates the fraction of the
salt stream which is reclaimed as freshwater. WR can be cal-
culated according to:
WR ¼ F$tadsF$tads þ F$tdes
¼ tadstcycle
(12)
whereF is the water flowrate, tads the adsorption time, tdes the
desorption time, and tcycle is the sum of tads and tdes. As in our
examples F is always the same for the adsorption and
desorption step, we can use a simplified expression for WR
(¼tads/tcycle).
Results of salt adsorption and charge per cycle are given in
row B both experimentally and theoretically, as function of
the same four parameters (column IeIV). Fig. 4BeI shows that
when the influent salt concentration is increased from close
to zero to around 20 mM, the salt adsorption and charge
rapidly increase, but after that the salt adsorption again
slightly decreases whereas the charge still increases. Fig. 4B-II
shows that when the electrical current during adsorption is
increased, both salt adsorption and charge decrease and
when the electrical current is above 1.5 A, the decrease is
even faster. Fig. 4B-III shows the existence of two regions,
one of low charge and salt adsorption at a low flow rate
F < 35 mL/min, and one of high charge and salt adsorption for
F > 35 mL/min. All the experimental data can be reproduced
very well with our theoretical model. However, some phe-
nomena, for instance the rapid increase of salt adsorption
when the influent salt concentration increases from zero to
w20 mM, or when the flowrate is increased beyond w35 mL/
min, do not have a single and easy explanation and must be
due to the interplay of various process parameters.
For commercial use of an MCDI system it is important to
have maximum salt removal within a given period of time.
Therefore, in order to evaluate how quickly salt can be adsor-
bed, we introduce a new performance indicator, namely the
average salt adsorption rate (ASAR) (see Fig. 4 row C), which is
the salt adsorption per cycle, per gram of total electrode mass
(Fig. 4-row B), divided by the cycle time (Fig. 4-row A). ASAR is
ameasure of the ‘speed’, or rate, of salt adsorption. The data in
Fig. 4-row C demonstrate that when we vary each input
parameter in turn, optimal values for ASAR are obtained in
each case. ThehighestASARcanbe achieved at an influent salt
concentration of around 20 mM (Fig. 4C-I), at an adsorption
current of 1A (Fig. 4C-II), at awater flowratehigher than 40mL/
min (Fig. 4C-III), and for a desorption time of 50 s (Fig. 4C-IV).
Note that these optimized input parameters depend on the
specific device, its operational mode, and values for other pa-
rameters. A general conclusion that can, however, be drawn is
that the input parameter settings that lead to the highest salt
adsorption per cycle do not always lead to the highest ASAR.
In addition, closer inspection of the results in Fig. 4 shows
that for most cases, the trends in WR and ASAR as function of
each input parameter are different. For instance, the highest
ASAR can be achieved when the adsorption current of 1 A is
used (Fig. 4C-II). However, for this condition the WR is less
than 0.4 (Fig. 4A-II). Only when increasing the water flowrate,
F, we find for the whole range of F simultaneously a higher
ASAR and higher water recovery, see Fig. 4C-III.
In brief, we have demonstrated that in the CC-ZVD mode,
variation of input parameters has a great impact on salt
adsorption and electrical charge per cycle, and also onWR and
ASAR, which are the two most important indicators to eval-
uate the performance of an MCDI system.
4.1.2. Desorption in “reverse current desorption”-modeIn a different operational mode, we apply a reversed current
during desorption until Vcell becomes zero again (RCD mode).
Fig. 5a shows that by applying a less negative current during
the desorption step, we extend the period of desorption and
consequently also extend the duration of the adsorption step.
This leads to more salt removal per cycle, see Fig. 5c. However,
Fig. 5b shows that less negative desorption currents decrease
theWR and increase the total cycle time. Combination of these
effects is shown in Fig. 5d, where we show that as the desorp-
tion current becomes more negative, ASAR first increases and
then decreases again. Thus, for this system, it is found that the
highest ASAR is at a desorption current between �0.8 and
�1.8 A, while theWR is highest at a desorption current of�2 A.
4.2. Constant voltage (CV) operation of MCDI
4.2.1. Desorption in “zero volt desorption”-mode and in“reverse voltage desorption”-modeNext, we discuss CV operation of MCDI, which implies that
during the adsorption step a constant voltage is applied,
instead of a constant current. Constant Voltage (CV) is the
classical operation mode of CDI and MCDI. CV operation can
be done in the ZVD and the RVD mode, the difference to be
discussed below. For all CV experiments, during salt adsorp-
tion a cell voltage of Vcell ¼ 1.2 V is applied for a fixed period of
time. During desorption in ZVD-modewe short-circuit the cell
(i.e., apply Vcell ¼ 0 V) for the same period. For the RVD-mode,
we apply Vcell ¼ �1.2 V (which is the reverse of the adsorption
voltage) during desorption, also for the same period as
adsorption. In both operational modes, because the water
flowrate is the same in a complete cycle (60mL/min for the full
stack of N ¼ 8 cells), and we set the adsorption time equal to
the desorption time (both are half of the cycle time, which is
varied in Fig. 6), thewater recovery is always 50%. In Fig. 6 data
for MCDI operation in CV-ZVD and CV-RVD mode are pre-
sented as function of cycle time. In Fig. 6(a) and (c), salt
adsorption and charge per cycle per gram of total electrode
mass are shown both experimentally and theoretically. As

wat e r r e s e a r c h 4 7 ( 2 0 1 3 ) 1 9 4 1e1 9 5 2 1949
Fig. 6 shows, when the cycle time exceeds 500 s, for both
operational modes, salt adsorption and charge level off.
However, ASAR peaks in both modes at a much shorter cycle
time, around 200 s, indicating that in the present setup such
a low cycle time of 200 s is the optimum value to achieve the
highest ASAR (Fig. 6b and d).
4.2.2. MCDI-CV operation with varying desorption voltageAs can be inferred from Fig. 6a, c (similar to Fig. 4 in Biesheuvel
et al., 2011a), by applying a negative cell voltage during
desorption, it is possible to achieve about 20% more salt
adsorption per cycle than simply by short-circuiting the cell
during the desorption step, which is the classical operational
mode of CDI and MCDI.
In order to find the optimal desorption voltage to achieve
the maximum in ASAR, we performed a further series of CV
experiments, where we vary the desorption voltage. An
adsorption voltage of þ1.2 V was applied for 500 s, and during
desorption, the cell voltage was varied between 0 V and �2 V,
also for a duration of 500 s. As the total cycle time for each
experiment is 1000 s, ASAR follows the same trend as the salt
adsorption per cycle shown in Fig. 7 and consequently is not
shown. Both experimental data and results of theoretical cal-
culations of salt adsorption and charge are presented in Fig. 7.
It is observed that salt adsorption and charge increase slightly
with desorption voltage, with for instance at a value of �1.4 V,
approximately 20%more salt adsorption than for desorption at
0 V. However, at voltages more negative than �1.0 V, the
0
10
20
30
0
0.1
0.2
0.3
0 500 1000 1500 2000
0
10
20
30
0
0.1
0.2
0.3
(a)
(c)
Cycle time (s)
Salt
adso
rptio
n p
er c
ycle
(mm
ol/g
)
Cha
rge
per c
ycle
(C/g
)
Salt adsorption
Salt adsorption
Charge
Charge
MCDI-CV-ZVD
MCDI-CV-RVD
Fig. 6 e Experimental and theoretical results for MCDI-CV opera
charge. (b, d) Average salt adsorption rate (ASAR) in ZVD and R
Vcell [ 1.2 V, and during desorption Vcell [ 0 V for ZVD and Vcell
the same, and the cycle time is the sum of these two. Lines: th
charge per cycle increases strongly, which is not predicted by
the model. For CDI, a similar observation was made when
increasing the cell voltageduringadsorption (Bouhadanaet al.,
2011). We believe the effect is due to Faradaic reactions, e.g.
water splitting, at high desorption voltages. As a result, MCDI
operated at very negative desorption cell voltages utilizes
more charge, resulting in a less energy-efficient salt adsorption
process, and is therefore not recommended.
4.3. Discussion
The interesting question is what can exactly be inferred from
the data. Starting at Fig. 4, a comprehensive data set for MCDI-
CC operation in the ZVD-mode is presented, focusing on the
two key performance indicators for MCDI, namely water re-
covery (WR) and average salt adsorption rate (ASAR). As can be
observed, varying influent salt concentration (column I), water
flowrate (III), or desorption time (IV), in all cases leads to
a similar trend in WR and in ASAR, both either going up or
down with a change in one of the parameter settings. A dif-
ference is found in the dependence of ASAR and WR on the
adsorption current (II), where the former has a maximum at
an adsorption current around 1 A, while to achieve the highest
WR, the adsorption current must be minimized.
Next, Fig. 5 summarizes data forMCDI-CC in the RCD-mode
of operation. In this case we also find that ASAR and WR have
a different dependency on the input parameter that is varied,
being in this case the adsorption current, with ASAR being at
0
0.2
0.4
0.6
0 500 1000 1500 2000
0
0.2
0.4
0.6
(d)
(b)
Cycle time (s)
ASAR
(µm
ol/g
/s)
ASAR
ASAR
MCDI-CV-ZVD
MCDI-CV-RVD
tion for ZVD and RVD mode. (a, c) Salt adsorption and
VD mode. For each experiment, during adsorption
[ L1.2 V for RVD. Periods of adsorption and desorption are
eory; symbols: experimental data.
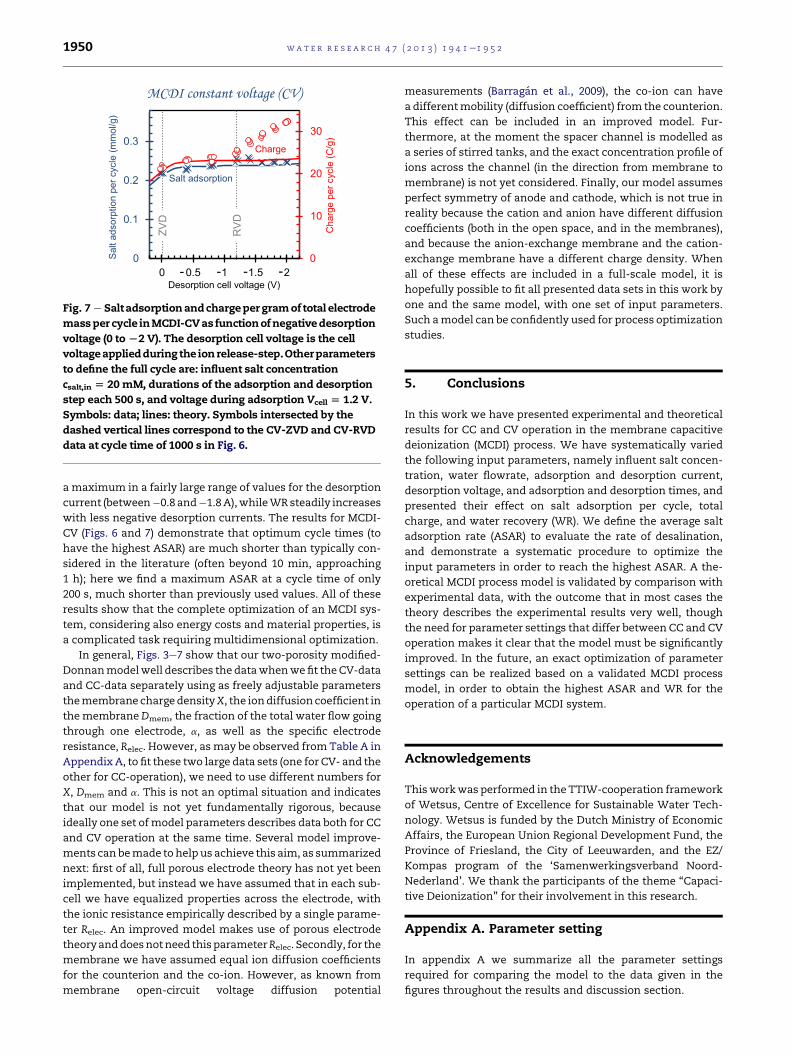
Fig. 7 e Saltadsorptionandchargepergramof total electrode
massper cycle inMCDI-CVas functionofnegativedesorption
voltage (0 toL2 V). The desorption cell voltage is the cell
voltageappliedduring the ionrelease-step.Otherparameters
to define the full cycle are: influent salt concentration
csalt,in [ 20mM, durations of the adsorption and desorption
step each 500 s, and voltage during adsorption Vcell [ 1.2 V.
Symbols: data; lines: theory. Symbols intersected by the
dashed vertical lines correspond to the CV-ZVD and CV-RVD
data at cycle time of 1000 s in Fig. 6.
wat e r r e s e a r c h 4 7 ( 2 0 1 3 ) 1 9 4 1e1 9 5 21950
a maximum in a fairly large range of values for the desorption
current (between�0.8 and�1.8A),whileWRsteadily increases
with less negative desorption currents. The results for MCDI-
CV (Figs. 6 and 7) demonstrate that optimum cycle times (to
have the highest ASAR) are much shorter than typically con-
sidered in the literature (often beyond 10 min, approaching
1 h); here we find a maximum ASAR at a cycle time of only
200 s, much shorter than previously used values. All of these
results show that the complete optimization of an MCDI sys-
tem, considering also energy costs and material properties, is
a complicated task requiring multidimensional optimization.
In general, Figs. 3e7 show that our two-porosity modified-
Donnanmodelwell describes the datawhenwefit the CV-data
and CC-data separately using as freely adjustable parameters
themembrane chargedensityX, the iondiffusioncoefficient in
themembraneDmem, the fraction of the total water flow going
through one electrode, a, as well as the specific electrode
resistance, Relec. However, asmay be observed from Table A in
Appendix A, to fit these two large data sets (one for CV- and the
other for CC-operation), we need to use different numbers for
X, Dmem and a. This is not an optimal situation and indicates
that our model is not yet fundamentally rigorous, because
ideally one set ofmodel parameters describes data both for CC
and CV operation at the same time. Several model improve-
ments can bemade tohelp us achieve this aim, as summarized
next: first of all, full porous electrode theory has not yet been
implemented, but instead we have assumed that in each sub-
cell we have equalized properties across the electrode, with
the ionic resistance empirically described by a single parame-
ter Relec. An improved model makes use of porous electrode
theoryanddoesnotneed thisparameterRelec. Secondly, for the
membrane we have assumed equal ion diffusion coefficients
for the counterion and the co-ion. However, as known from
membrane open-circuit voltage diffusion potential
measurements (Barragan et al., 2009), the co-ion can have
a differentmobility (diffusion coefficient) from the counterion.
This effect can be included in an improved model. Fur-
thermore, at the moment the spacer channel is modelled as
a series of stirred tanks, and the exact concentration profile of
ions across the channel (in the direction from membrane to
membrane) is not yet considered. Finally, our model assumes
perfect symmetry of anode and cathode, which is not true in
reality because the cation and anion have different diffusion
coefficients (both in the open space, and in the membranes),
and because the anion-exchange membrane and the cation-
exchange membrane have a different charge density. When
all of these effects are included in a full-scale model, it is
hopefully possible to fit all presented data sets in this work by
one and the same model, with one set of input parameters.
Such amodel can be confidently used for process optimization
studies.
5. Conclusions
In this work we have presented experimental and theoretical
results for CC and CV operation in the membrane capacitive
deionization (MCDI) process. We have systematically varied
the following input parameters, namely influent salt concen-
tration, water flowrate, adsorption and desorption current,
desorption voltage, and adsorption and desorption times, and
presented their effect on salt adsorption per cycle, total
charge, and water recovery (WR). We define the average salt
adsorption rate (ASAR) to evaluate the rate of desalination,
and demonstrate a systematic procedure to optimize the
input parameters in order to reach the highest ASAR. A the-
oretical MCDI process model is validated by comparison with
experimental data, with the outcome that in most cases the
theory describes the experimental results very well, though
the need for parameter settings that differ between CC and CV
operation makes it clear that the model must be significantly
improved. In the future, an exact optimization of parameter
settings can be realized based on a validated MCDI process
model, in order to obtain the highest ASAR and WR for the
operation of a particular MCDI system.
Acknowledgements
Thisworkwas performed in the TTIW-cooperation framework
of Wetsus, Centre of Excellence for Sustainable Water Tech-
nology. Wetsus is funded by the Dutch Ministry of Economic
Affairs, the European Union Regional Development Fund, the
Province of Friesland, the City of Leeuwarden, and the EZ/
Kompas program of the ‘Samenwerkingsverband Noord-
Nederland’. We thank the participants of the theme “Capaci-
tive Deionization” for their involvement in this research.
Appendix A. Parameter setting
In appendix A we summarize all the parameter settings
required for comparing the model to the data given in the
figures throughout the results and discussion section.

Fig. B e Electrical circuit analogue for MCDI cell combined
with external capacity. Here, Imax is the constant applied
electrical current, part of which, Icap, will be used to charge
the external capacitor, Ccap, which represents external
wires and connections. Itot depicts the electrical current
going into the MCDI cell, CEDL represents the electric double
layer capacitance, and Rcell represents the cell resistance.
wat e r r e s e a r c h 4 7 ( 2 0 1 3 ) 1 9 4 1e1 9 5 2 1951
Appendix B. Electrical circuit analogue of MCDIsystem
In appendix B we present a schematic diagram of the electric
circuit analogue of the MCDI system, see Fig. B. To avoid the
numerical problem that occurs when we apply a step change
in current to the MCDI cell, we have placed a very small
capacitance in the external circuit, Ccap ¼ 2 mF/m2, parallel to
the MCDI cell, so the applied electrical current, Imax, will first
saturate the small capacitor and then charge the system with
current Itot, according to
vVcell
vt¼ F$
Imax � ItotCcap
: (13)
Initially, because of the spacer channel resistance, all the
applied current, Imax, goes to the external capacitor, thus ini-
tially the current to the MCDI cell will be zero, Itot ¼ 0. How-
ever, in time, when the external capacity saturates, Icapbecomes zero, and the average current into the MCDI cell, Itot,
will approach the value of Imax. Note that in the model Itotdistributes self-consistently over the M numerical sub-cells,
see Fig. 2. Another method to avoid the numerical dis-
continuity after each sudden change in current (at time t*) is to
solve jointly Eqs. (4), (5), (8) and (9) for all sub-cells 1.M,
together with Itot ¼ 1=MPM
i¼1 Ii, with Dfdonnan and
(Dfd þ DfSt)mi in each sub-cell unvarying at t*, to calculate in
this way the cell voltage and currents Ii right after t*.
Table A e Parameter settings for theoretical MCDItransport model. Numbers with subscripts cc are forconstant current operation (Figs. 3e5) and subscripts cvdenote constant voltage operation (Figs. 6 and 7).
Symbols Value Dimension
pmA Porosity of macropores 0.30
pmi Porosity of micropores 0.30
CSt,vol,0 Volumetric Stern layer
capacitance (low charge limit)
0.12 GF/m3
a Parameter to describe
non-linear part of Stern capacity
17.3 F m3/mol2
Relec Specific electrode resistance 0.12cc0.108cv
U mol/m
X Fixed membrane charge
density
3000cc8000cv
mol/m3
D Ion diffusion coefficient in
the spacer channel
1.68 10�9 m2/s
Dmem Ion diffusion coefficient in the
membrane
1.12cc0.168cv
10�9 m2/s
Vsp Total volume of one spacer
channel
0.147 mL
Velec Total volume of one electrode 0.153 mL
a Fraction of total flow going
through one electrode
1 %cc
0.25 %cv
matt Chemical attraction term
between ions and carbon
1.4 kT
M Number of sub-cells in
the model
6
Ccap Capacitance in the
external circuit
2 mF/m2
r e f e r e n c e s
Andersen, M.B., van Soestbergen, M., Mani, A., Bruus, H.,Biesheuvel, P.M., Bazant, M.Z., 2012. Current-inducedmembrane discharge. Physical Review Letters 109 (10), 108301.
Anderson, M.A., Cudero, A.L., Palma, J., 2010. Capacitivedeionization as an electrochemical means of saving energyand delivering clean water. Comparison to presentdesalination practices: will it compete? Electrochimica Acta 55(12), 3845e3856.
Arnold, B.B., Murphy, G.W., 1961. Studies on electrochemistry ofcarbon and chemically modified carbon surfaces. Journal ofPhysical Chemistry 65 (1), 135.
Avraham, E., Noked, M., Cohen, I., Soffer, A., Aurbach, D., 2011.The dependence of the desalination performance in capacitivedeionization processes on the electrodes PZC. Journal of theElectrochemical Society 158 (12), P168eP173.
Barragan, V.M., Villaluenga, J.P.G., Godino,M.P., Izquierdo-Gil,M.A.,Ruiz-Bauza, C., Seoane, B., 2009. Experimental estimation ofequilibrium and transport properties of sulfonated cation-exchange membranes with different morphologies. Journal ofColloid and Interface Science 333 (2), 497e502.
Biesheuvel, P.M., Fu, Y., Bazant, M.Z., 2011a. Diffuse charge andFaradaic reactions in porous electrodes. Physical Review E 83(6), 061507.
Biesheuvel, P.M., Zhao, R., Porada, S., van der Wal, A., 2011b.Theory of membrane capacitive deionization including theeffect of the electrode pore space. Journal of Colloid andInterface Science 360 (1), 239e248.
Biesheuvel, P.M., 2011. Two-fluid model for the simultaneous flowof colloids and fluids in porous media. Journal of Colloid andInterface Science 355 (2), 389e395.
Biesheuvel, P.M., Fu, Y., Bazant, M.Z., 2012. Electrochemistry andcapacitive charging of porous electrodes in asymmetricmulticomponent electrolytes. Russian Journal ofElectrochemistry 48 (6), 580e592.
Bouhadana, Y., Ben-Tzion, M., Soffer, A., Aurbach, D., 2011.A control system for operating and investigating reactors: thedemonstration of parasitic reactions in the water desalinationby capacitive de-ionization. Desalination 268 (1e3), 253e261.
wat e r r e s e a r c h 4 7 ( 2 0 1 3 ) 1 9 4 1e1 9 5 21952
Buerkle, T., 14 Feb. 2007. Making Every Drop Count. http://www.fao.org/newsroom/en/news/2007/1000494/index.html.
Cipollina, A., 2009. Seawater Desalination: Conventional andRenewable Energy Processes. Springer, Berlin.
Elattar, A., Elmidaoui, A., Pismenskaia, N., Gavach, C.,Pourcelly, G., 1998. Comparison of transport properties ofmonovalent anions through anion-exchange membranes.Journal of Membrane Science 143 (1e2), 249e261.
Haro, M., Rasines, G., Macias, C., Ania, C.O., 2011. Stability ofa carbon gel electrode when used for the electro-assistedremoval of ions from brackish water. Carbon 49 (12),3723e3730.
Helfferich, F.G., 1962. Ion Exchange. Dover.Humplik, T., Lee, J., O’Hern, S.C., Fellman, B.A., Baig, M.A.,
Hassan, S.F., Atieh, M.A., Rahman, F., Laoui, T., Karnik, R.,Wang, E.N., 2011. Nanostructured materials for waterdesalination. Nanotechnology 22 (29), 292001.
Kim, Y.-J., Hur, J., Bae, W., Choi, J.-H., 2010. Desalination ofbrackish water containing oil compound by capacitivedeionization process. Desalination 253 (1e3), 119e123.
Kim, Y.-J., Choi, J.-H., 2010. Improvement of desalinationefficiency in capacitive deionization using a carbon electrodecoated with an ion-exchange polymer. Water Research 44 (3),990e996.
Lee, J.-B., Park, K.-K., Eum, H.-M., Lee, C.-W., 2006. Desalination ofa thermal power plant wastewater by membrane capacitivedeionization. Desalination 196 (1e3), 125e134.
Lee, J.-Y., Seo, S.-J., Yun, S.-H., Moon, S.-H., 2011. Preparation ofion exchanger layered electrodes for advanced membranecapacitive deionization (MCDI). Water Research 45 (17),5375e5380.
Li, H., Gao, Y., Pan, L., Zhang, Y., Chen, Y., Sun, Z., 2008.Electrosorptive desalination by carbon nanotubes andnanofibres electrodes and ion-exchange membranes. WaterResearch 42 (20), 4923e4928.
Li, H.B., Zou, L., 2011. Ion-exchange membrane capacitivedeionization: a new strategy for brackish water desalination.Desalination 275 (1e3), 62e66.
Nie, C.Y., Zhan, Y.K., Pan, L.K., Li, H.B., Sun, Z., 2011.Electrosorption of different cations and anions withmembrane capacitive deionization based on carbonnanotube/nanofiber electrodes and ion-exchangemembranes. Desalination and Water Treatment 30 (1e3),266e271.
Ohki, S., 1965. Rectification by a double membrane. Journal of thePhysical Society of Japan 20 (9), 1674e1685.
Park, B.-H., Kim, Y.-J., Park, J.-S., Choi, J., 2011. Capacitivedeionization using a carbon electrode prepared with water-soluble poly(vinyl alcohol) binder. Journal of Industrial andEngineering Chemistry 17 (4), 717e722.
Porada, S., Sales, B.B., Hamelers, H.V.M., Biesheuvel, P.M., 2012a.Water desalination with wires. The Journal of PhysicalChemistry Letters 3 (12), 1613e1618.
Porada, S., Weinstein, L., Dash, R., van der Wal, A., Bryjak, M.,Gogotsi, Y., Biesheuvel, P.M., 2012b. Water desalination usingcapacitive deionization with microporous carbon electrodes.ACS Applied Materials & Interfaces 4 (3), 1194e1199.
Porada, S., Bryjak, M., van der Wal, A., Biesheuvel, P.M., 2012c.Effect of electrode thickness variation on operation ofcapacitive deionization. Electrochimica Acta 75, 148e156.
Rica, R.A., Brogioli, D., Ziano, R., Salerno, D., Mantegazza, F., 2012.Ions transport and adsorption mechanisms in porouselectrodes during capacitive-mixing double layer expansion(CDLE). The Journal of Physical Chemistry C 116 (32),16934e16938.
Seo, S.-J., Jeon, H., Lee, J.K., Kim, G.-Y., Park, D., Nojima, H., Lee, J.,Moon, S.-H., 2010. Investigation on removal of hardness ionsby capacitive deionization (CDI) for water softeningapplications. Water Research 44 (7), 2267e2275.
Sonin, A.A., Probstein, R.F., 1968. A hydrodynamic theory ofdesalination by electrodialysis. Desalination 5 (3), 293e329.
Suss, M.E., Baumann, T., Bourcier, B., Spadaccini, C., Rose, K.A.,Santiago, J.G., Stadermann, M., 2012. Capacitive desalinationwith flow-through electrodes. Energy & EnvironmentalScience 5, 9511e9519.
Vetter, K.J., 1967. Electrochemical Kinetics. Academic Press.Zhao, R., Biesheuvel, P.M., van der Wal, A., 2012a. Energy
consumption and constant current operation in membranecapacitive deionization. Energy & Environmental Science 5,9520e9527.
Zhao, R., Biesheuvel, P.M., Miedema, H., Bruning, H., van derWal, A., 2010. Charge efficiency: a functional tool to probe thedouble-layer structure inside of porous electrodes andapplication in the modeling of capacitive deionization. TheJournal of Physical Chemistry Letters 1 (1), 205e210.
Zhao, R., van Soestbergen, M., Rijnaarts, H.H.M., van der Wal, A.,Bazant, M.Z., Biesheuvel, P.M., 2012b. Time-dependent ionselectivity in capacitive charging of porous electrodes. Journalof Colloid and Interface Science 384 (1), 38e44.
Zou, L., Li, L., Song, H., Morris, G., 2010. Improving the capacitivedeionisation performance by optimising pore structures of theelectrodes. Water Science and Technology 61 (5), 1227e1233.