optimization of the operation strategy and parameters … · optimization of the operation strategy...
TRANSCRIPT

ERAD 2012 - THE SEVENTH EUROPEAN CONFERENCE ON RADAR IN METEOROLOGY AND HYDROLOGY
INSERT
PICTURE
HERE
Optimization of the operation strategy and
parameters of Euskalmet weather radar
Maruri M.1,2, Hernaez I.4, Aranda JA3, Gaztelumendi S1,2
1.-Basque Meteorology Agency (EUSKALMET). Parque tecnológico de Álava. Avda. Albert Einstein 44 Ed. 6 Of. 303, 01510 Miñano, Álava, Spain. [email protected]
2.-TECNALIA, Meteo Unit. Parque tecnológico de Álava. Avda. Albert Einstein 44 Ed. 6 Of. 303, 01510 Miñano, Álava, Spain. [email protected]
3.-Basque Government, Department of the Interior, Directorate of Emergencies and Meteorology. C/ Portal de Foronda 41, 01010 Vitoria-Gasteiz, Álava, Spain
4.- Adasa Sistemas, Environmental Quality Division. C/ José Agustín Goytisolo 30-32, 08908, L’Hospitalet de Llobregat, Barcelona, Spain
(Dated: 30 May 2012)
Presenting author
Name
1. Introduction
Since its installation in 2005 (Aranda et al, 2006), the operation of the polarimetric doppler C-band weather radar of the
Basque meteorological agency (Euskalmet) has suffered several changes if compared to the original configuration
(Gaztelumendi et al, 2006). The optimization strategy is explained in this paper.
In many cases, this type of weather radar has a potential which is often far from being completely used (Meischnner et al,
1997). The motivation of the work is an interest on improving the operation of the system, taking into account the complexity
of the installation, the topography of the Basque Country and the study/analysis of the historical data set on episodes of
severe weather with high probability of flooding.
In addition, in recent years there is an increasing social demand of information of short-term potential risks caused by
weather. The Department of the Interior, specifically the Directorate of Emergencies and Meteorology (DAEM), assumes this
responsibility in the Basque Country. A special effort has been made on improving the radar's ability to describe dangerous
situations in three main most populated areas, Bilbao, San Sebastián and Gasteiz, (NEXRAD, 2005).
Although the operation at the time of installation was defined according to standards to provide a quality database as
complete as possible, the daily experience and knowledge of our system and its capabilities to describe weather has led to an
optimization process that is described in this paper. This work could be extrapolated to other systems operating in complex
terrain, regardless if they are new or not. These operating systems have great technological capabilities (Doviak et Zrnic,
1984) to be discovered with experience and with the help of the manufacturer (Rainbow, 2005). The operation is always
dynamic and should be open to improvements.
2. Description of the system
The Euskalmet polarimetric weather radar is sited on top of a mountain of 1221.2 m height ASL. Despite it is a
polarimetric radar, the signal processor only allows recording differential reflectivity. This is a limitation in comparison with
the operational possibilities that offer conventional polarimetric radars. The main technological features that describe the
system are: 0.7º 3dB beam width, 6m diameter parabolic reflector, ASPEN digital signal processor and Version 5 of the
Gematronik software Rainbow.
The scan strategy is repeated in a 10 minutes loop. During this period the following scans are performed:
1. A 300 km range volumetric scan, with a radial resolution of 1 km, in order to get a first look of the weather situation. The
recorded variables are Z (corrected reflectivity) and ZDR (differential reflectivity).
2. A 100 km range volumetric scan, with a radial resolution of 250 m, in order to have a more detailed view of the Basque
country. In this scan Doppler information (V and W) is collected together with Z and ZDR.
3. Two elevation scans, both of them oriented to the west (NW and SW respectively). The definition of the azimuths was
based on the climatology of the region (circulation makes most phenomena come from the west), the storm surveillance
necessities, the topographic blockages and the aim of completing the meteorological information of the volumetric scans in
the most populated area next to the coast. In this scans Z, ZDR, V and W are also collected.

ERAD 2012 - THE SEVENTH EUROPEAN CONFERENCE ON RADAR IN METEOROLOGY AND HYDROLOGY
Fig. 1. Diagram showing the location of the radar (K) and the three main cities (Bilbao, San Sebastian and Vitoria). The
shadowed area represents the 100 km range and the black lines the azimuths of the elevation scans.
3. Methodology
The methodology is based on the study of the system's ability to describe different weather conditions and on daily data
monitoring. Deep analyses of the meteorological episodes address to necessary improvements that affect the coverage and
therefore the quality of the raw data. The monitoring reveals the weaknesses of the operation, which leads to the design of
further improvements. All of these changes are focused on obtaining a better database and on improving the stability of the
system and therefore the availability of raw data.
The methodology considers all the incidences registered in the monitoring task and the analysis of meteorological episodes
from the first and a half year of operation, where the maintenance was performed by the manufacturer.
1) Detect problems in operation
The study of data availability, system monitoring (system logs) and routine visual inspection of the data reveal recurring
problems. The correlation between data availability and the incidences that appear in the BiTE (Built-in Test Equipment)
logs is studied.
The methodology looks for an answer associated to each data file lost. If the cause is recurrent or if it is related to a critical
element of the system, then a solution is proposed. In general, the study of the possible causes presents alternatives and new
procedures for monitoring the system that enable better preventive maintenance.
2) Detect weaknesses in the database
This work considers different weather conditions, both clear air (under different temperature profiles) and precipitation
(under different types of precipitation), in order to detect weaknesses in the meteorological description of these situations and
to make improvements that can be applied to the system in operation. The errors are cataloged together with the
meteorological situations. An analysis of the degradation of the data is reported for further studies.
3.1 Operating parameters
The operating parameters are classified into different levels depending on their proximity to the system itself. We work
with them both independently and globally to evaluate potential interactions that may lead to conflict.
ERAD 2012 - THE SEVENTH EUROPEAN CONFERENCE ON RADAR IN METEOROLOGY AND HYDROLOGY
Operating parameters associated to the coverage and the quality of the database.
-Geometry of the system. The study focuses on identifying the optimum elevations that allow a better coverage of a region
with a very complex topography. Previous studies of the propagation of the beam over a digital terrain map have been
considered. To reduce scan time and to improve the stability, an optimal range is defined for each elevation.
-Quality parameters associated with the raw data. A revision of the quality parameters of the system has been done
(manual), focusing on the CCOR thresholding, the signal quality index (SQI) and the LOG threshold.
-Parameters to improve system stability. On one hand, the study of the availability of data shows repeated patterns of data
loss. Most of them were associated to the server instability caused by an increase in the internal memory consumption.
Thus, the scan strategy needed more idle time between consecutive loops, especially when calibration programs such as
Zero Check (average noise measurement) or the Single Point Calibration (calibration of the reception chain) are applied,
because they require 40 to 60 seconds.
-Identification of operation incompatibilities in the system. This part of the study was carried during a testing period itself.
We proceeded to review the system and the procedures available to filter common errors such as second trips. At this
point, the system presents incompatibilities between ZDR and some quality procedures. Besides, it is not possible to
collect ZDR an uncorrected Z simultaneously.
Operating parameters at product level.
Each product is defined with a set of input parameters (meteorological and non meteorological). The effort has been made
on generating the best possible product, considering our geometry, the radar location and the typical observable weather
phenomena. Special care has been taken in order not to make changes that may destabilize the system due to the processing
work required.
Operating parameters at application level.
New mechanisms to adapt the raw or processed data to warning and alarm systems have been developed.
All these modifications were tested under non-critical weather conditions before being introduced into regular operation. It
is crucial to check the system stability before bringing on any of the proposed changes.
Other problems of availability, such as those related to communications, are not taken into account in this work, as it is
considered to be outside the system operation. However, those communication problems must be considered for regular
operation because a lack of data can cause problems in the generation of real time products, and it can also affect decision
making in critical situations.
4. Results and discussion
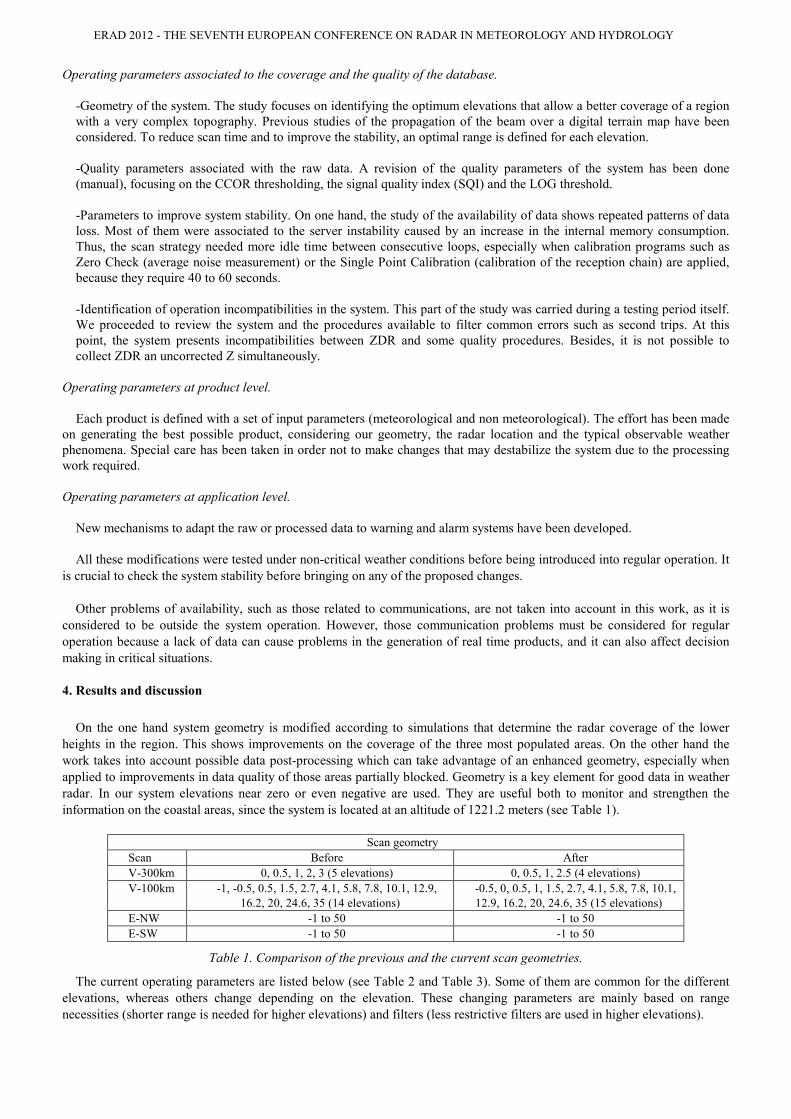
On the one hand system geometry is modified according to simulations that determine the radar coverage of the lower
heights in the region. This shows improvements on the coverage of the three most populated areas. On the other hand the
work takes into account possible data post-processing which can take advantage of an enhanced geometry, especially when
applied to improvements in data quality of those areas partially blocked. Geometry is a key element for good data in weather
radar. In our system elevations near zero or even negative are used. They are useful both to monitor and strengthen the
information on the coastal areas, since the system is located at an altitude of 1221.2 meters (see Table 1).
Scan geometry
Scan Before After
V-300km 0, 0.5, 1, 2, 3 (5 elevations) 0, 0.5, 1, 2.5 (4 elevations)
V-100km -1, -0.5, 0.5, 1.5, 2.7, 4.1, 5.8, 7.8, 10.1, 12.9,
16.2, 20, 24.6, 35 (14 elevations)
-0.5, 0, 0.5, 1, 1.5, 2.7, 4.1, 5.8, 7.8, 10.1,
12.9, 16.2, 20, 24.6, 35 (15 elevations)
E-NW -1 to 50 -1 to 50
E-SW -1 to 50 -1 to 50
Table 1. Comparison of the previous and the current scan geometries.
The current operating parameters are listed below (see Table 2 and Table 3). Some of them are common for the different
elevations, whereas others change depending on the elevation. These changing parameters are mainly based on range
necessities (shorter range is needed for higher elevations) and filters (less restrictive filters are used in higher elevations).

ERAD 2012 - THE SEVENTH EUROPEAN CONFERENCE ON RADAR IN METEOROLOGY AND HYDROLOGY
Volumetric Scan 300 km
Nº Elevation
(º) DopplerF
1 0 12
2 0,5 12
3 1 11
4 2,5 10
Common operational parameters
Range (km) 300
Radial Resolution (km) 1
Radial Samples 4
PRF 375
Pulse Long
A. Speed (m/s) 18
Ray Samples 21
Angular Resolution (º) 1
CSR 30
SQI 0,3
LOG 2
Speckle Yes
Table 2. Operating parameters of the 300 km range volume scan.
Volumetric Scan 100 km
Nº Elevation (º) Range (km) PRF Doppler
F
A. Speed (m/s)
1 -0,5 100 900 / 675 10 16 Common operational parameters
2 0 100 750 / 600 11 14 Radial Resol. (km) 0,25
3 0,5 100 750 / 600 11 14 Radial Samples 4
4 1 100 750 / 600 10 14 Pulse Short
5 1,5 100 750 / 600 10 14 Ray Samples 13
6 2,7 100 900 / 675 8 16 Angular Resolution (º) 1
7 4,1 100 900 / 675 8 16 CSR 30
8 5,8 100 900 / 675 8 16 SQI 0,3
9 7,8 100 900 / 675 8 16 LOG 2
10 10,1 100 900 / 675 8 16 Speckle Yes
11 12,9 87,3 900 / 675 8 16
12 16,2 68,8 1100 / 825 7 21
13 20 54,9 1100 / 825 7 21
14 24,6 43,7 1100 / 825 7 21
15 35 28,6 1100 / 825 7 21
Table 3. Operating parameters of the 100 km range volume scan.
The lowest elevations of the volumetric scans have been changed to meet a better resolution of the lower layers. In
addition, some of them are similar in both scans to allow better correlations. In relation with this, the azimuth step of both
volume scans has been set to 1º, what provides an easier manipulation of the raw data.
The quality parameters (SQI, CSR, LOG, Speckle remover) are set according to the recommendation of the manufacturer
and other experiences reflected on bibliography. To enhance the clutter correction, the application of a dynamic clutter
(Hernaez et al.) map based on the statistical behaviour of the clutter and on the simulation of the propagation is under study.
The depth of the doppler filters was increased in order to remove the clutter remaining in the lower elevations, specially
that in the 0.5 degree elevation, which is used for surveillance and QPE. These filters are stronger for lower elevations,
because they are more affected by clutter.
For the PRFs two main reasons have been considered. The first condition is to reduce the effect of the second trip echoes
by an increase on the frequency. Another condition is to reduce the scan time for a better stability the system, what can be
done also by increasing the frequency. This last idea can also be improved with shorter ranges for higher elevations that meet
the tropopause, because a higher PRF can be used.

ERAD 2012 - THE SEVENTH EUROPEAN CONFERENCE ON RADAR IN METEOROLOGY AND HYDROLOGY
At this point we have studied the most common mistakes and possible improvements through the operation.
Calibration techniques, monitoring tools and other issues
The main objective was to optimize the time of the scans to achieve a reduction of the instabilities of the system. Many
conflicts were detected between the scan strategy and the calibration procedures such as Single Point Calibration (SPC) and
Zero Check. The range reduction in those elevations crossing the tropopause reduces time in the volumetric scans and
therefore increases the stability of the system.
In order to be closer to the system and to facilitate the real time monitoring, several proprietary tools have been developed
for an enhanced system check. They use the information provided by the BiTE sensors which can be correlated with the
behaviour of the radar data acquisition chain.
a) b)
Fig. 2. Outputs (a) DRX voltages and temperatures and b) TX power, current and temperature) of the system monitoring tools developed.
Fig. 3. Sun ZDR Monitoring. Large differences caused by an increase in the temperature of the radar can be seen.
Fig. 4. Visual inspection of ZDR before and after SPC

ERAD 2012 - THE SEVENTH EUROPEAN CONFERENCE ON RADAR IN METEOROLOGY AND HYDROLOGY
5. Conclusion
Generally, in conventional weather radar, any lack of information in the database must be studied. Besides, the analysis of
the performance of the weather radar in different meteorological episodes is good to identify the limitations of the system. It
becomes even more necessary in radar sites covering a complex terrain.
It is also important to maintain the stability of the system since every non-data bin or a poor quality data set can be very
expensive, talking in terms of flooding or other severe weather episode. The behaviour of the stability variables over time
should be controlled as a measure of the necessity of a preventive maintenance. Monitoring “log system files” and reported
suspicious behaviour has been very useful to detect problems at early stages. In this regard, additional tools have been
developed to monitor the system, some of which are presented in this paper. Quality parameters should be reviewed from
time to time to see if they can be modified for an improvement in the data quality.
The optimal operation of a polarimetric radar in complex terrain is not a task that must be done once, but regular reviews
should be established.
Currently many efforts are being made to incorporate new procedures to improve product quality and therefore the
precipitation estimates (QPE). These procedures are as important as the operational parameters. Many of them must be
adapted depending on the weather radar under study.
Optimizing the operating parameters is not an easy work and it has many interactions. The final decision must be a
compromise between the different points of view, and flexible enough to be changed over time.
Acknowledgment
We would like to thank the Directorate of Emergencies and Meteorology of the Basque Government for its support.
We would like to thank the University of the Basque Country and the group of remote sensing of the school of engineering
for the propagation simulations.
References
Aranda J.A., Morais A., 2006: The new weather-radar of the Basque meteorology agency (Euskalmet): site selection, construction and
installation. 4th European Conference on Radar in Meteorology and Hydrology, Barcelona (Spain)
Gaztelumendi S., Egaña J., Gelpi I.R., Otxoa de Alda K., Maruri M., Hernandez R., 2006: The new radar of Basque meteorology Agency:
Configuration and some considerations for its operative use. 4th European Conference on Radar in Meteorology and Hydrology, Barcelona (Spain)
Meischnner P., Collier C, Illingworth A., Joss J. Randeu W, (1997). “Advanced Weather Radar Systems in Europe: The Cost 75 Action”
Vol 78, No 7, July 1997, pp 1411-1430. Bulletin of the American Meteorological Society
Doviak R.J., Zrnić D.S., 1984: Doppler radar and weather observations. Academic Press, USA
Committee to assess NEXRAD Flash Flood Forecasting Capabilities at Suphur Mountain California, 2005: Flash Flood Forecasting Over
Complex Terrain: With an Assessment of the Sulphur Mountain NEXRAD in Southern California. National Research Council flash, National Academies Press (USA)
Hernaez I., Maruri M., Lopez J., 2012: Adaptive clutter filtering using statistical radar data and atmospheric propagation conditions. 7th
European Conference on Radar in Meteorology and Hydrology, Toulouse (France)
Selex-Gematronik, 2005a. “Rainbow® User guide” Release 5.090.
Selex-Gematronik, 2005b. “Rainbow® Quick guide” Release 5.090.
Selex-Gematronik, 2005c. “Rainbow® Products & Algorithms” Release 5.090