optimization of tribological properties of al … of tribological properties of al-6082/sic metal...
TRANSCRIPT

International Journal of Scientific & Engineering Research, Volume 5, Issue 12, December-2014 629 ISSN 2229-5518
IJSER © 2014 http://www.ijser.org
Optimization of Tribological properties of Al-6082/SiC Metal Matrix Composite by
Grey-Taguchi’s Method Vijayanand Dharanikota
Abstract- Tribological behavior of aluminium alloy Al-6082 reinforced with silicon carbide particles (0%,5% & 10% Volume percentage of SiC) fabricated by powder metallurgy was investigated . In this paper the optimization of dry sliding performances on the aluminum hybrid metal matrix composite was done using grey relational analysis in the Taguchi method. Different loads, sliding speeds, sliding distances and varying percentage of Silicon Carbide are selected as control factors. The multiple responses to evaluate the dry sliding performances are specific wear rate and coefficient of friction. A series of L27 orthogonal array of experiments for three different samples of Al-6082 SiC MMCs have been conducted on pin-on-disc wear tester apparatus, the volume loss and frictional force are measured. Based on grey relational analysis, the optimum level parameters for specific wear rate and coefficient of friction have been identified. Analysis of Variance (ANOVA) had given the impact of individual factors on the specific wear rate as well as the coefficient of friction. The results indicated that the four test parameters had a significant role in controlling the friction and wear behavior of composites out of which %vol. was identified as most influential parameter followed by load for specific wear rate and load for coefficient of friction.
Index Terms— Aluminum hybrid metal matrix composite, Gray relation –taguchi’s Method, L27 orthogonal array , pin-on-disc wear tester Dry sliding wear behavior, Analysis of variance.
—————————— ——————————
1 INTRODUCTION
oday our modern technologies require materials with unusual combinations of properties that cannot
be met by conventional ceramics, polymeric materials and metal alloys. This is true, especially for the material needed in transportation, aerospace and under water applications. These combinations of material properties are achieved by development of composites. These ma-terials fulfill the demand of almost all the engineering application due to their tremendous physical and me-chanical properties i.e. light weight, high strength, im-proved density and hardness, high wear and high corro-sion resistance. Al and Al alloys became attractive candidate for the application in aerospace, defense and automotive industries owing to their versatile properties. A major requirement for such applications is the high strength along with reasonable ductility. There has been a con-stant effort to enhance the mechanical properties of Al alloys by alloying additions, heat treatment, thermo me-chanical processing, and severe plastic deformations and so on. The advantage of utilizing the beneficial properties of the constituent materials, to satisfy the specific demands, is the driving force for the develop-ment of composites. In this paper, our focus will be on the metal matrix composites (MMCs) and more especial-ly on the aluminium metal matrix composites. _______________________________________________ Vijayanand Dharanikota, graduated from NIT Warangal, And presently pursuing Masters in Industrial Engineering at Arizona State University, PH: +1-480-358-8930, Email Id: [email protected]
Fabrication of MMCs has several challenges like porosity formation, poor wettability and improp-er distribution of reinforcement. The fabrication tech-niques of MMCs play a major role in the improve-ment of mechanical and tribological properties. The performance characteristics of Al alloy reinforced Achieving uniform distribution of reinforcement is the foremost important work. The size and type of reinforcement also has a significant role in determining the mechanical and tribo-logical properties of the composites. The effect of type of reinforcements such as SiC whisker, alumina fiber and SiC particle fabricated by Powder Metallurgy on the properties of MMCs has been investigated. It was found that there existed a strong dependence on the kind of reinforcement and its volume fraction. The results re-vealed that particulate reinforcement is most beneficial for improving the wear resistance of MMC[1]. There is a growing interest worldwide in man-ufacturing hybrid metal matrix composites [HMMCs] which possesses combined properties of its reinforce-ments and exhibit improved physical, mechanical and tribological properties. Aluminium matrix composites reinforced silicon carbide was developed using powder metallurgy techniques. The reinforcements were varied by 0%,5% and 10% by volume. The composite was test-ed for dry sliding wear characteristics. The tribological properties of MMCs are also increased by increasing reinforcements at all applied conditions[2].
T IJSER

International Journal of Scientific & Engineering Research, Volume 5, Issue 12, December-2014 630 ISSN 2229-5518
IJSER © 2014 http://www.ijser.org
2 DESIGN OF EXPERIMENTS Design of Experiment is one of the important and pow-erful statistical techniques to study the effect of multiple variables simultaneously and involves a series of steps which must follow a certain sequence for the experiment to yield an improved understanding of process perfor-mance [3]. All designed experiments require a certain number of combinations of factors and levels be tested in order to observe the results of those test conditions. Taguchi approach relies on the assignment of factors in specific orthogonal arrays to determine those test com-binations. The DOE process is made up of three main phases: the planning phase, the conducting phase, and the analysis phase. A major step in the DOE process is the determination of the combination of factors and lev-els which will provide the desired information [4]. Analysis of the experimental results uses a signal to noise ratio to aid in the determination of the best pro-cess designs. This technique has been successfully used by researchers in the study of dry sliding wear behavior of composites. In the present work, a plan order for per-forming the experiments was generated by Taguchi method using orthogonal arrays [5]. Analysis of data from these designed experiments yields significance of influence of a factor or the interaction of factors on a particular output response and their % contribution.
3 GREY-RELATIONAL ANALYSIS Grey relational analysis was proposed by Deng in 1989, is widely used for measuring the degree of relationship between sequences by grey relational grade. Grey rela-tional analysis is applied by several researchers to opti-mize control parameters having multi-responses through grey relational grade [6]. The use of Taguchi method with grey relational analysis to optimize the specific wear rate and co-efficient of friction with multi-ple process parameters. A. Data Pre-Processing In grey relational analysis, the data pre-processing is the first step performed to normalize the random grey data with different measurement units to transform them to dimensionless parameters. Thus, data pre-processing converts the original sequences to a set of comparable sequences. Different methods are employed to pre-process grey data depending upon the quality character-istics of the original data. The original reference sequence and pre-processed data (comparability sequence) are represent-ed by x0(0)(k) and xi(0)(k) i =1,2,….,m; k =1,2,.....,n respec-tively, where m is the number of experiments and n is the total number of observations of data. Depending upon the quality characteristics, the three main catego-ries for normalizing the original sequence are identified
as follows: If the original sequence data has quality characteristic as ‘larger-the-better’ then the original data is preprocessed as ‘larger-the-best’:
(1) If the original data has the quality characteristic as ‘smaller the better’, then original data is pre-processed as ‘smaller-the best’:
(2) However, if the original data has a target optimum val-ue (OV) then quality characteristic is ‘nominal-the-better’ and the original data is pre-processed as ‘nomi-nal-the-better’:
(3) Also, the original sequence is normalized by a simple method in which all the values of the sequence are di-vided by the first value of the sequence.
(4) where max xi(0)(k) and min xi(0)(k) are the maximum and minimum values respectively of the original sequence xi(0)(k). Comparable sequence xi*(k) is the normalized sequence of original data. B. Grey Relation Grade Next step is the calculation of deviation sequence, (k) from the reference sequence of pre-processes data xi*(k) and the comparability sequence xi*(k). The grey rela-tional coefficient is calculated from the deviation se-quence using the following relation:
(5) where (k) is the deviation sequence of the reference sequence x0*(k) and comparability sequence xi*(k).
IJSER

International Journal of Scientific & Engineering Research, Volume 5, Issue 12, December-2014 631 ISSN 2229-5518
IJSER © 2014 http://www.ijser.org
𝜉 is the distinguishing coefficient 𝜉 ∈ [0,1]. The distin-guishing coefficient (𝜉) value is chosen to be 0.5. A grey relational grade is the weighted average of the grey rela-tional coefficient and is defined as follows:
(6) The grey relational grade , represents the de-gree of correlation between the reference and compara-bility sequences. If two sequences are identical, then grey relational grade value equals unity. The grey rela-tional grade implies that the degree of influence related between the comparability sequence and the reference sequence. In case, if a particular comparability sequence has more influence on the reference sequence than the other ones, the grey relational grade for comparability and reference sequence will exceed that for the other grey relational grades. Hence, grey relational grade is an accurate measurement of the absolute difference in data between sequences and can be applied to appropriate the correlation between sequences.
4 MATERIAL SELECTION
4.1 Aluminium alloy Al6082:
In the present investigation, Al-6082 alloy was chosen as the base matrix as it has the excellent corrosion re-sistance and high strength in 6000 series alloys. In plate form, Aluminium alloy 6082 is the alloy most commonly used for machining. As a relatively new alloy, the higher strength of Aluminium alloy 6082 has seen it replace 6061 in many applications. The addition of a large amount of manganese controls the grain structure which in turn results in a stronger alloy. After the addition of SiC, due to the property of high hardness and high thermal conductivity, SiC accommodates in soft ductile aluminium base matrix, which enhance the wear resist-ing behavior of the Al – SiC metal matrix composite. Element Si Fe Cu Mn Mg Zn Ti Cr
% 0.7-1.3
0.0-0.5
0.0-0.1
0.4-1.0
0.6-1.2
0.0-0.2
0.0-0.1
0.0-0.25
Table 1 Chemical Composition of Al-6082 alloy The above table gives us the chemical composi-tion of Al6082 the rest is aluminium.
4.2 Aluminium Silicon Carbide (Al-6082 Sic):
Aluminium Silicon Carbide (Al SiC) metal matrix com-posite (MMC) materials have a unique set of material
properties that are ideally suited for all electronic pack-aging applications requiring thermal management. The Al-SiC coefficient of thermal expansion (CTE) value is compatible with direct IC device attachment for the maximum thermal dissipation through the 170 – 200 W/mK thermal conductivity value material. Additional-ly, the low material density of AlSiC makes it ideal for weight sensitive applications such as portable devices.
Figure 1 Al-6082 SiC Microstructure
The ideal AlSiC material properties and the Al-SiC net-shape fabrication process provide low-cost high performance functional thermal management packaging solutions.
Material Density Thermal
Conductivity Bend
Strength Young’s Modulus
AlSiC 68v%SiC
3 g/cm3 170-200 W/mK
450 MPa 175 GPa
Table 2 Properties of Al-6082 SiC
Figure 2 Al-6082 Sic Samples of Different Compositions used
for Wear test
5 EXPERIMENTAL DETAILS The aim of the experiment is to find the im-portant factors and combination of factors influenc-ing the wear process to achieve the minimum wear rate and coefficient of friction. The experiments were developed based on an orthogonal array, with the
IJSER

International Journal of Scientific & Engineering Research, Volume 5, Issue 12, December-2014 632 ISSN 2229-5518
IJSER © 2014 http://www.ijser.org
aim of relating the influence of sliding speed, applied load and sliding distance and Volume% . And the wear test is carried out using Pin-on-Disc wear device according to ASTM G99 standards. It consist of a rotary horizontal steel disc driven by variable speed motor A stationary test specimen with a defined normal force is pressed against the surface of another test specimen placed on the rotary disk.
During the test, the pin was held pressed against a rotating disc by applying load that acts as counterweight and balances the pin. The load, sliding speed and sliding distance were varied in the range given in Table 3. A LVDT (load cell) on the lever arm helps determine the wear at any point of time by monitoring the movement of the arm. Once the sur-face in contact wears out, the load pushes the arm to remain in contact with the disc. This movement of the arm generates a signal which is used to determine the maximum wear and the coefficient of friction is moni-tored continuously as wear occurs and graphs be-tween co-efficient of friction and time was monitored for \ the specimens i.e.,0 %, 5% and 10% vol. SiC/ Al-6082 MMCs. Further, weight loss of each specimen was obtained by weighing the specimen before and after the experiment by a single pan electronic weigh-ing machine
Figure 3 Pin-On-Disc Friction and Wear tester
5 PLAN OF EXPERIMENTS In full factorial design, the number of experimental runs exponentially increases with the increase in the number of factors as well as their levels. This results in huge ex-perimentation cost and considerable time period. So, in order to compromise these two adverse factors and to search for the optimal process condition through a lim-ited number of experimental runs Taguchi’s L27 orthog-onal array consisting of 27 runs was selected to optimize the tribological properties of Al-6082 Sic alloy. Experi-ments were conducted with the Factor levels as given in Table 3.
Symbol Experimental Variables
Level 1 Level 2 Level 3
A Sliding Distance (m)
1000 2000 3000
B Load (N) 9.81 29.42 49.03
C Sliding Speed (m/s)
1 2 3
D Volume % 0 5 10 Table 3 Experimental Factors And Their Levels
Selected design matrix shown in Table 4 based on the Taguchi L27 orthogonal array consisting of 27 sets of coded conditions and the experimental results for the responses of specific wear rate (ws) and coefficient of friction (µa). All these data are used for the analysis and evaluation of the optimal parameters combination. The specific wear rate and co-efficient of friction is calculated using following formulas: Sliding Speed (m/s) = (2πN) /60
Sliding Distance (m) = πD * number of revolutions Time (sec) = Sliding Speed / Sliding Distance Wear Rate (g/s) = Weight loss / Time Weight Loss = Initial Weight – Final Weight Density (kg/mm3) = Mass / Volume Specific Wear Rate (mm3/N-m) = V/ L*D Coefficient of friction = Ft/ Fn
Where, N = Speed of disc in rpm D = Wear track diameter in m
S. No Load
(A) Slid-ing
Speed (B)
Vol% (C)
Slid-ing Dis-tance (D)
Spe-cific wear rate x 10-5
(mm3/Nm)
Coeffi-cient of friction
1 9.81 1 0 1000 39.837 0.3999 2 9.81 1 5 2000 7.198 0.4998 3 9.81 1 10 3000 22.478 0.6998 4 9.81 2 0 3000 22.522 0.7991 5 9.81 2 5 1000 9.338 0.6998 6 9.81 2 10 2000 7.841 0.7997 7 9.81 3 0 2000 12.107 0.4998
8 9.81 3 5 3000 10.375 0.2999
9 9.81 3 10 1000 6.273 0.5998 10 29.42 1 0 3000 14.846 0.2667
11 29.42 1 5 1000 1.946 0.1999 12 29.42 1 10 2000 6.406 0.3333 13 29.42 2 0 2000 23.051 0.3667 14 29.42 2 5 3000 4.8 0.2333
IJSER
International Journal of Scientific & Engineering Research, Volume 5, Issue 12, December-2014 633 ISSN 2229-5518
IJSER © 2014 http://www.ijser.org
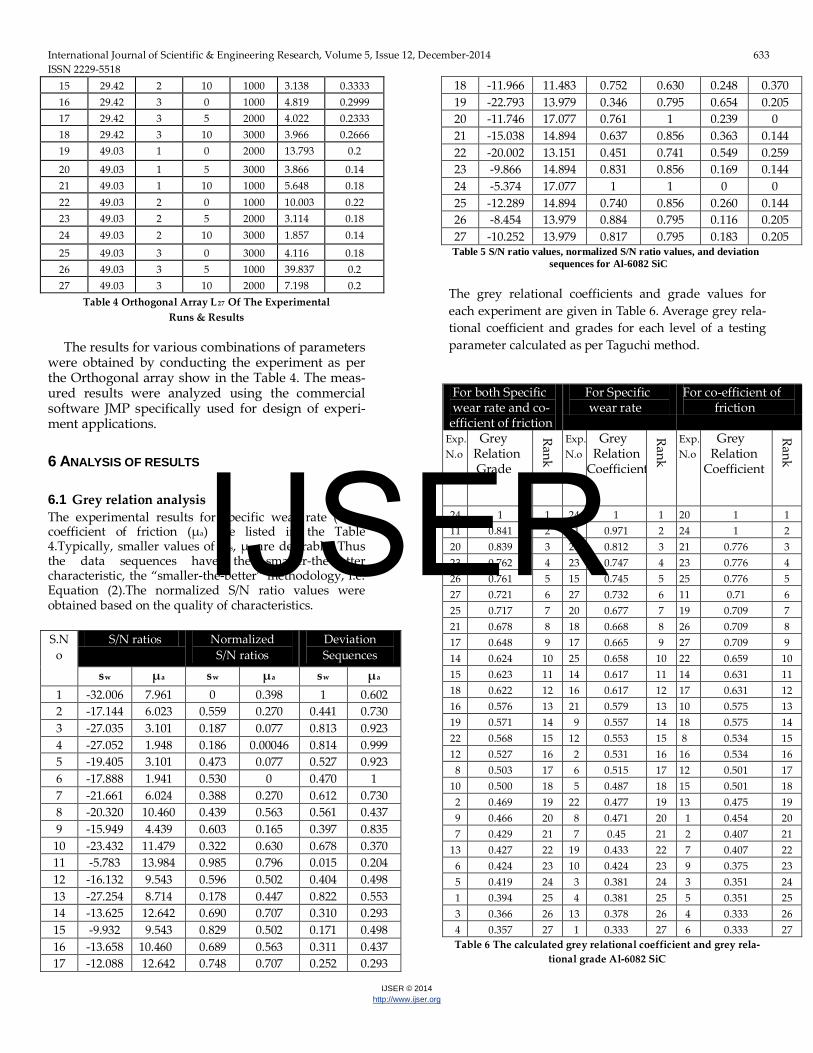
15 29.42 2 10 1000 3.138 0.3333 16 29.42 3 0 1000 4.819 0.2999 17 29.42 3 5 2000 4.022 0.2333 18 29.42 3 10 3000 3.966 0.2666 19 49.03 1 0 2000 13.793 0.2
20 49.03 1 5 3000 3.866 0.14 21 49.03 1 10 1000 5.648 0.18 22 49.03 2 0 1000 10.003 0.22 23 49.03 2 5 2000 3.114 0.18 24 49.03 2 10 3000 1.857 0.14
25 49.03 3 0 3000 4.116 0.18 26 49.03 3 5 1000 39.837 0.2 27 49.03 3 10 2000 7.198 0.2
Table 4 Orthogonal Array L27 Of The Experimental Runs & Results
The results for various combinations of parameters
were obtained by conducting the experiment as per the Orthogonal array show in the Table 4. The meas-ured results were analyzed using the commercial software JMP specifically used for design of experi-ment applications.
6 ANALYSIS OF RESULTS 6.1 Grey relation analysis The experimental results for specific wear rate (ws) , coefficient of friction (µa) are listed in the Table 4.Typically, smaller values of ws, µa are desirable. Thus the data sequences have the smaller-the-better characteristic, the “smaller-the-better” methodology, i.e. Equation (2).The normalized S/N ratio values were obtained based on the quality of characteristics. S.N
o S/N ratios Normalized
S/N ratios Deviation Sequences
sw µa sw µa sw µa 1 -32.006 7.961 0 0.398 1 0.602 2 -17.144 6.023 0.559 0.270 0.441 0.730 3 -27.035 3.101 0.187 0.077 0.813 0.923 4 -27.052 1.948 0.186 0.00046 0.814 0.999 5 -19.405 3.101 0.473 0.077 0.527 0.923 6 -17.888 1.941 0.530 0 0.470 1 7 -21.661 6.024 0.388 0.270 0.612 0.730 8 -20.320 10.460 0.439 0.563 0.561 0.437 9 -15.949 4.439 0.603 0.165 0.397 0.835 10 -23.432 11.479 0.322 0.630 0.678 0.370 11 -5.783 13.984 0.985 0.796 0.015 0.204 12 -16.132 9.543 0.596 0.502 0.404 0.498 13 -27.254 8.714 0.178 0.447 0.822 0.553 14 -13.625 12.642 0.690 0.707 0.310 0.293 15 -9.932 9.543 0.829 0.502 0.171 0.498 16 -13.658 10.460 0.689 0.563 0.311 0.437 17 -12.088 12.642 0.748 0.707 0.252 0.293
18 -11.966 11.483 0.752 0.630 0.248 0.370 19 -22.793 13.979 0.346 0.795 0.654 0.205 20 -11.746 17.077 0.761 1 0.239 0 21 -15.038 14.894 0.637 0.856 0.363 0.144 22 -20.002 13.151 0.451 0.741 0.549 0.259 23 -9.866 14.894 0.831 0.856 0.169 0.144 24 -5.374 17.077 1 1 0 0 25 -12.289 14.894 0.740 0.856 0.260 0.144 26 -8.454 13.979 0.884 0.795 0.116 0.205 27 -10.252 13.979 0.817 0.795 0.183 0.205
Table 5 S/N ratio values, normalized S/N ratio values, and deviation sequences for Al-6082 SiC
The grey relational coefficients and grade values for each experiment are given in Table 6. Average grey rela-tional coefficient and grades for each level of a testing parameter calculated as per Taguchi method.
For both Specific wear rate and co- efficient of friction
For Specific wear rate
For co-efficient of friction
Exp. N.o
Grey Relation Grade
Rank
Exp. N.o
Grey Relation Coefficient
Rank
Exp. N.o
Grey Relation
Coefficient
Rank
24 1 1 24 1 1 20 1 1 11 0.841 2 11 0.971 2 24 1 2 20 0.839 3 26 0.812 3 21 0.776 3 23 0.762 4 23 0.747 4 23 0.776 4 26 0.761 5 15 0.745 5 25 0.776 5 27 0.721 6 27 0.732 6 11 0.71 6 25 0.717 7 20 0.677 7 19 0.709 7 21 0.678 8 18 0.668 8 26 0.709 8 17 0.648 9 17 0.665 9 27 0.709 9 14 0.624 10 25 0.658 10 22 0.659 10 15 0.623 11 14 0.617 11 14 0.631 11 18 0.622 12 16 0.617 12 17 0.631 12 16 0.576 13 21 0.579 13 10 0.575 13 19 0.571 14 9 0.557 14 18 0.575 14 22 0.568 15 12 0.553 15 8 0.534 15 12 0.527 16 2 0.531 16 16 0.534 16 8 0.503 17 6 0.515 17 12 0.501 17
10 0.500 18 5 0.487 18 15 0.501 18 2 0.469 19 22 0.477 19 13 0.475 19 9 0.466 20 8 0.471 20 1 0.454 20 7 0.429 21 7 0.45 21 2 0.407 21
13 0.427 22 19 0.433 22 7 0.407 22 6 0.424 23 10 0.424 23 9 0.375 23 5 0.419 24 3 0.381 24 3 0.351 24 1 0.394 25 4 0.381 25 5 0.351 25 3 0.366 26 13 0.378 26 4 0.333 26 4 0.357 27 1 0.333 27 6 0.333 27 Table 6 The calculated grey relational coefficient and grey rela-
tional grade Al-6082 SiC
IJSER

International Journal of Scientific & Engineering Research, Volume 5, Issue 12, December-2014 634 ISSN 2229-5518
IJSER © 2014 http://www.ijser.org
The following are the response tables for specific wear rate, coefficient of friction, and for both specific wear rate and coefficient of friction.
A B C D Levels
1 0.4562 0.5424 0.4612 0.6198 2 0.6264 0.5941 0.6642 0.556 3 0.6794 0.6256 0.6367 0.5863
Delta 0.2232 0.0832 0.203 0.0638 Rank 1 3 2 4
Avg. grey relation grade = 0.5874 Table 7 Response Table for specific wear rate of Al-6082 SiC
A B C D Levels
1 0.3939 0.6092 0.5469 0.5632 2 0.5703 0.5621 0.6388 0.5498 3 0.7904 0.5833 0.569 0.6417
Delta 0.3965 0.0471 0.0919 0.0919 Rank 1 4 3 2
Avg. grey relation grade = 0.5849 Table 8 Response Table for Coefficient of Friction Al-6082 SiC
A B C D
Levels 1 0.4252 0.5761 0.5043 0.5918 2 0.5987 0.5782 0.6518 0.5914 3 0.7561 0.6048 0.603 0.6142
Delta 0.3309 0.0287 0.1475 0.0228 Rank 1 4 2 3
Avg. grey relation grade = 0.5913 Table 9 Response Table for both specific wear rate and
coefficient of friction of Al-6082 SiC The bold characters are shown to denote the opti-
mum value of grey relational coefficient and grade in Tables 7, 8, 9. The effects of the testing parameter level versus the grey relational grade and grey relational coef-ficient values are given below for Al SiC MMCs.
Graph 1 Effects of dry sliding parameter levels on specific wear
rate of Al-6082 SiC
Graph 2 Effects of dry sliding parameter levels on coefficient of
friction of Al-6082 SiC
Graph 3 Effects of dry sliding parameter levels for both specific
wear rate and coefficient of friction of Al-6082 SiC
By using the grey relational coefficient values and grey relational grade values, the graphs are plotted for different parameter levels and grey relations. The optimum values are also drawn from the graphs.
The grey relation grades in Table 7-9 can be fur-ther arranged in matrix form shown as follows: γ(W,A) γ(W,B) γ(W,C) γ(W,D) γ = γ(Cf,A) γ(C f,B) γ(C f C) γ(Cf,D) γ(WC f,A) γ(WC f,B) γ(WC f,C) γ(WC f,D)
IJSER

International Journal of Scientific & Engineering Research, Volume 5, Issue 12, December-2014 635 ISSN 2229-5518
IJSER © 2014 http://www.ijser.org
0.6794 0.6256 0.6642 0.6198 = 0.7904 0.6092 0.6388 0.6417 0.7561 0.6048 0.6518 0.6142 In grey relation analysis, the maximum analysis, the maximum value in each row represents the most influ-ential factors that affect the output variables. By compar-ing Row 1, Row 2, Row 3, Row 4, some conclusion from this matrix. In the first row, γ(W,A) > γ(W,C) > γ(W,B) > γ(W,D), it means that the order of importance for the controllable factor Specific wear rate (W), in sequence is the factor A,C,B,D. In the second row γ(C f,A) > γ(C f,D) > γ(C f,C) > γ(C f,B), the order of importance for the con-trollable factors to Coefficient of friction (Cf) in the se-quence is the factor A,D,C,B. Similarly , based on the third row, γ(WC f,A) > γ(WC f,C) > γ(WC f,D) > γ(WC f,B) , The order of importance for the controllable factors to both specific Wear rate and Coefficient of friction (WCf), in the sequence is the factor A,C,D,B
6.2 Analysis Of Variance (ANOVA) The experimental results were analyzed with Analysis of Variance (ANOVA) which is used to investigate the in-fluence of the considered wear parameters namely, slid-ing distance , applied load, sliding speed, and Sic vol-ume% that significantly affect the performance measures. By performing analysis of variance, it can be decided which independent factor dominates over the other and the percentage contribution of that particular independent variable. Table (6&7) SiC MMCs of the ANOVA results for wear rate and coefficient of friction for four factors varied at three levels and interactions of those factors. This analysis is carried out for a signifi-cance level of α=0.05, i.e. for a confidence level of 95%. Sources with a P-value less than 0.05 were considered to have a statistically significant contribution to the per-formance measures. After performing initial analysis on residuals it is found out that data need to be trans-formed to Stabilize the variance and interpret the results currently .
Specific Wear rate: = 1og(
Co-efficient of friction: = 1/( )
S. No Load (A)
Slid-ing
Speed (B)
Vol% (C)
Slid-ing Dis-tance (D)
1ogS
w
1/µa
1 9.81 1 0 1000 1.600 2.501
2 9.81 1 5 2000 0.857 2.001 3 9.81 1 10 3000 1.352 1.429 4 9.81 2 0 3000 1.353 1.251 5 9.81 2 5 1000 0.970 1.429 6 9.81 2 10 2000 0.894 1.250 7 9.81 3 0 2000 1.083 2.001
8 9.81 3 5 3000 1.016 3.334
9 9.81 3 10 1000 0.797 1.667 10 29.42 1 0 3000 1.172 3.750
11 29.42 1 5 1000 0.289 5.003 12 29.42 1 10 2000 0.807 3.000 13 29.42 2 0 2000 1.363 2.727 14 29.42 2 5 3000 0.681 4.286 15 29.42 2 10 1000 0.497 3.000 16 29.42 3 0 1000 0.683 3.334 17 29.42 3 5 2000 0.604 4.286 18 29.42 3 10 3000 0.598 3.751 19 49.03 1 0 2000 1.140 5.000
20 49.03 1 5 3000 0.587 7.143 21 49.03 1 10 1000 0.752 5.556 22 49.03 2 0 1000 1.000 4.545 23 49.03 2 5 2000 0.493 5.556 24 49.03 2 10 3000 0.269 7.143
25 49.03 3 0 3000 0.614 5.556 26 49.03 3 5 1000 0.423 5.000 27 49.03 3 10 2000 0.513 5.000
Table 10 Experimental Data after Transformation
Table 11 gives the results of analysis of variance (ANO-VA) for specific wear rate of Al-6082 Sic using JMP Soft-ware. According to table 11, the factor C i.e. Vol% of Sic with 25.73% of contribution is the most significant con-trolled parameters for dry sliding performance, followed by load with 21.25% contribution, and the last signifi-cant factor is interaction term between Load(A) and slid-ing distance(D) with 9.21% contribution for the minimi-zation of specific wear rate. Source DF SS MS F Ra-
tio Prob>F %P
Load(A) 1 0.669 0.669 12.128 0.005* 21.25 Sliding Speed
(B)
1 0.149 0.149 2.7 0.126 4.73
Vol. % [C]
1 0.81 0.81 14.674 0.002* 25.73
Sliding Distance
(D)
1 0.033 0.033 0.602 0.453 1.05
A*B 1 0.104 0.104 1.879 0.196 3.3 A*C 1 0.058 0.058 1.06 0.324 1.84 A*D 1 0.29 0.29 5.262 0.041* 9.21 B*C 1 0.246 0.246 4.463 0.056 7.81 B*D 1 0.068 0.068 1.226 0.29 2.16 C*D 1 0.098 0.098 1.769 0.208 3.11
IJSER

International Journal of Scientific & Engineering Research, Volume 5, Issue 12, December-2014 636 ISSN 2229-5518
IJSER © 2014 http://www.ijser.org
A*B*C 1 0.018 0.018 0.33 0.577 0.57 A*B*D 1 0.126 0.126 2.277 0.157 4 A*C*D 1 0.146 0.146 2.647 0.13 4.64 B*C*D 1 0.137 0.137 2.49 0.141 4.35 Error 12 0.662 0.552 21.03 Total 26 3.148 100
Table 11 ANOVA for specific wear rate
Graph 4 Main Factors v/s Specific Wear rate
Sw Load(A)
Sliding Distance(D)
Graph 5 Interaction between load & Sliding distance v/s Specific Wear rate
From Table 11 A*D interaction is significant and from graphs 4 & 5 to obtain minimum specific Wear rate Load ,sliding speed, Vol% and sliding distance should main-tained at high level (i.e. 49.03N, 3m/s ,10%, 3000m re-spectively). Source DF SS MS F Ratio Prob>F %P
Load(A) 1 59.423 59.423 112.774 <.0001* 76.1 Sliding Speed
(B)
1 0.069 0.069 0.131 0.724 0.1
Vol. % [C]
1 0.317 0.317 0.602 0.453 0.4
Sliding Distance
(D)
1 2.227 2.227 4.227 0.062 2.9
A*B 1 1.343 1.343 2.549 0.136 1.7 A*C 1 0.496 0.496 0.942 0.351 0.6 A*D 1 0.485 0.485 0.92 0.356 0.6 B*C 1 0.06 0.06 0.113 0.742 0.1 B*D 1 0.101 0.101 0.192 0.669 0.1 C*D 1 0.446 0.446 0.846 0.376 0.6
A*B*C 1 0.596 0.596 1.132 0.308 0.8
A*B*D 1 1.064 1.064 2.019 0.181 1.4 A*C*D 1 0.046 0.046 0.088 0.772 0.1 B*C*D 1 0.233 0.233 0.442 0.519 0.3 Error 12 6.323 0.527 14.2 Total 26 78.06 100
Table 12 ANOVA for Co-efficient of friction
Graph 6 Main Factors v/s Co-efficient of friction Table 12 gives the results of analysis of variance (ANO-VA) for Co-efficient of Al-6082 Sic using JMP software. According to table 12, the factor A i.e. Load with 76.1% of contribution is the most significant controlled param-eters for dry sliding performance, for the minimization of Co-efficient of friction and no interaction terms are significant. And to obtain to obtain minimum Co-efficient of friction Load , Vol% and sliding distance should maintained at low level (i.e. 9.81N, , 0%, 1000m respectively) and sliding speed at high level (i.e. 3m/s) .
6.2.1 Multiple Linear Regression Model A multiple linear regression model is developed using statistical software “JMP”. This model gives the relationship between an independent / predicted variable & a response variable by fitting a linear equation to observe data. Regression equation thus generated establishes correlation between the signifi-cant terms obtained from ANOVA analysis namely applied load, sliding speed, Vol% & sliding distance. The reduced regression equation developed for Al-6082 SiC MMCs wear rate and coefficient of friction are as follows: Sw = 1.37-0.012A-0.039C-0.000004(A-29.42)*(D-2000) -- Eq(7)
µa = 0.919+0.0953A ----- Eq(8) From Eq (7), it is observed that the load, Vol%, Sliding distance increases, it will be decrease the wear rate But in case of coefficient of friction Eq (8), load
IJSER

International Journal of Scientific & Engineering Research, Volume 5, Issue 12, December-2014 637 ISSN 2229-5518
IJSER © 2014 http://www.ijser.org
plays a major role. Overall regression equation gives the clear indication about coefficient of friction is highly influenced by load.
7 CONCLUSION Following are the conclusions drawn from the study on dry sliding wear test using Taguchi’s technique.
1) For the lowest specific wear rate, 49.03 N ap-plied load, 2 m/s sliding speed, 3000m sliding distance and 10 Vol.% Silicon Carbide percent-age are used as optimal combination.
2) For the lowest coefficient of friction, 49.03 N applied load, 1 m/s sliding speed, 3000m sliding distance and 5 Vol.% Silicon Carbide percentage are used as optimal combination.
3) For both specific wear rate and coefficient of friction, the lowest values given are 49.03 N ap-plied load, 2 m/s sliding speed, 3000m sliding distance and 10 Vol.% Silicon Carbide percent-age.
4) Based on the ANOVA, Silicon Carbide volume percentage (25.73%) followed load (21.25%) , in-teraction t between load and sliding distance (9.21%) exert a significant influence on specific wear rate of Aluminium composites.
5) Based on the ANOVA, load(76.1%) exert a sig-nificant influence on coefficient of friction of Aluminium composites.
6) The order of importance for controllable factors to the minimum specific wear rate, in sequence, is Vol% of Sic, load, sliding Speed and sliding distance; order to the coefficient of friction, in sequence is load, sliding distance, Vol.% of SiC sliding speed.
7) However, it is observed through ANOVA that the applied load is the most influential control factor among the four dry sliding performance input parameters of Al SiC.
ACKNOWLEDGMENT The wish to thank Prof. Dr. N. Selvaraj, Head, Depart-ment of Mechanical Engineering, National Institute of Technology, Warangal, Mr. Jeevan, PhD Scholar, NITW, and Prof. Rong Pan, Associate Professor, Arizona State Univer-sity .
REFERENCES [1] Ashok Kr. Mishra, Rakesh Sheokand, Dr. R K Srivastava ,
Tribological Behaviour of Al-6061 / SiC Metal Matrix Compo-site by Taguchi’s Techniques, ijsrp Vol.2, Issue 10, ISSN 2250-3153
[2] Manoj Singla, D. Deepak Dwivedi, Development of Alumini-um Based Silicon Carbide Particulate Metal Matrix Composite Journal of Minerals & Materials Characterization & Engineer-ing, Vol. 8, No.6, pp 455-467.
[3] G. Taguchi, introduction to quality engineering, Asian productivity organization, 1990
[4] R. A. Fisher, Design of Experiments, Oliver & Boyd, Edin-burgh, UK, 1951
[5] P. J. Ross, Taguchi Technique for Quality Engineering, McGraw Hill, New York, NY, USA, 2nd edition1996
[6] Sadasiva Rao T., Rajesh V., Venu Gopal A, Taguchi based Grey Relational Analysis to Optimize Face Milling Process with Multiple Performance Characteristics, ICTIME'2012, March 24-25, 2012 Dubai
[7] JMP User Manual 8 Design of Experiments Guide, Second Edition Cary, NC: SAS Institute Inc.
[8] S. Dharmalingam, R. Subramanian, Optimization of Tribolog-ical Properties in Aluminum Hybrid Metal Matrix Composites Using Gray-Taguchi Method, JMEPEG (2011) 20:1457–1466.
[9] Hui-Hui Fu, Wear properties of Saffil/Al, Saffil/Al2O3/Al and Saffil/SiC/Al Hybrid metal matrix composites, Wear 256 (2004) 705–713.
[10] Design and Analysis of experiments , Douglas C.Montgomery, Wiley student 8th edition.
[11] N.Radhika,R.Subramanian, Tribological Behaviour of alumin-ium / Alumina / Graphite Hybrid Metal Matrix Composite Using Taguchi‟s Techniques, Journal of Minerals & materials Characterization & Engineering, Vol. 10, No.5, pp.427-443, 2011.
[12] T. Sritharan, L.S. Chan , A feature of the reaction between Al and SiC particles in an MMC, Materials Characterization 47 (2001) 75– 77.
[13] P.K.Rohatgi, B.F.Schultz, Tribological performance of A206 aluminum alloy containing silica sand particles , Tribology In-ternational 43 (2010) 455–466.
[14] S. Basavarajappa, G. Chandramohan , Application of Taguchi techniques to study dry sliding wear behaviour of metal ma-trix composites, Materials and Design 28 (2007) 1393–1398
IJSER