optimization review: velsicol chemical corporation ... · the velsicol chemical corporation...
TRANSCRIPT

Office of Solid Waste and EPA-540-R-013-015 Emergency Response (5102G) January 29 2013
Optimization Review Velsicol Chemical Corporation
Hardeman County Landfill Superfund Site
Toone Tennessee
httpwwwclu-inorgoptimization httpwwwepagovsuperfundcleanuppostconstructionoptimizehtm
OPTIMIZATION REVIEW
VELSICOL CHEMICAL CORPORATION
HARDEMAN COUNTY LANDFILL
SUPERFUND SITE
TOONE TENNESSEE
Report of the Optimization Review Site Visit Conducted at the Velsicol Chemical Corporation
Hardeman County Landfill Superfund Site on January 18 2012
January 29 2013
EXECUTIVE SUMMARY
The US Environmental Protection Agencyrsquos (EPA) working definition of optimization is as follows
ldquoEfforts at any phase of the removal or remedial response to identify and implement actions that improve the actionrsquos effectiveness and cost-efficiency Such actions may also improve the remedyrsquos protectiveness and long-term implementability which may facilitate progress towards site completion To identify these opportunities regions may use a systematic site review by a team of independent technical experts apply techniques or principles from green remediation or Triad or apply some other approach to identify opportunities for greater efficiency and effectiveness Contractors states tribes the public and potentially responsible parties (PRP) are also encouraged to put forth opportunities for the Agency to considerrdquo
An optimization evaluation considers the goals of the remedy available site data conceptual site model (CSM) remedy performance protectiveness cost-effectiveness and exit strategy A strong interest in sustainability has also developed in the private sector and within Federal State and Municipal governments Consistent with this interest optimization now routinely considers green remediation and environmental footprint reduction during optimization evaluations An optimization evaluation includes reviewing site documents interviewing site stakeholders potentially visiting the site for one day and compiling a report that includes recommendations in the following categories
Protectiveness Cost-effectiveness Technical improvement Site closure exit strategy Environmental footprint reduction
The recommendations are intended to help the site team identify opportunities for improvements in these areas In many cases further analysis of a recommendation beyond that provided in this report may be needed prior to implementation of the recommendation Note that the recommendations are based on an independent evaluation and represent the opinions of the evaluation team These recommendations do not constitute requirements for future action but rather are provided for consideration by the Region and other site stakeholders Also note that while the recommendations may provide some details to consider during their implementation the recommendations are not meant to replace other more comprehensive planning documents such as work plans sampling plans and quality assurance project plans
i
Site-Specific Scope of Optimization Review
The optimization review of the Velsicol Chemical Corporation Hardeman County Landfill Superfund Site (the Site) includes a comprehensive review of the CSM existing soil and waste remedies soil vapor extraction (SVE) pilot studies and potential remedial alternatives for soil In particular the review covers the following
Review of the existing Records of Decision (ROD) Five-Year Reviews 2007 Feasibility Study SVE pilot test results 2011 draft Focused Feasibility Study for landfills progress reports geophysical data soil gas data landfill cap and characterization information
Review of SVE as a potential Site-wide soil remedy Considerations for SVE design and implementation Consideration of other potential remedial alternatives
While the focus of this review is on potential soil and waste remediation an initial review of potential groundwater remediation is also considered
Site-Specific Background
The Velsicol Chemical Corporation Hardeman County Landfill Superfund Site is located in a rural area near the town of Toone in western Tennessee The Site includes approximately 24 acres of capped landfill area within a 237 acre property parcel Between 130000 and 300000 drums of chemical wastes from Velsicolrsquos pesticide manufacturing plant in Memphis were disposed of in unlined trenches at the Site between 1964 and 1973 Using the low end of this estimate and multiplying by 55 gallons per drum this equates to an estimate of over 7 million gallons of chemical waste The drums and other containers of waste were dumped in the trenches and the trenches were backfilled Years later (in 1980) a clay cap was placed over the disposal areas and even later (1997) a multi-layer composite cap was placed over the clay cap per the ROD for Operable Unit 2 (OU2 waste and soils)
The wastes included pesticides and chemicals used in the production of pesticides Carbon tetrachloride and other volatile organic compounds (VOCs) made up a substantial portion of the wastes (a PRP contractor Environ estimates 1 percent to 5 percent of the total volume) and have been the most mobile contaminants at the Site Pesticides and semi-volatile organic compounds (SVOCs) are also contaminants of concern (COCs) primarily for soil within and below the buried waste
An SVE pilot test was conducted at one of the disposal areas in 2009-2011 The SVE system proved effective at removing substantial VOC mass SVE is being considered as a new full-scale remedy for OU21
1 Since completion of the optimization review and the initial draft of this report a ROD amendment has been completed for OU2 specifying SVE in all disposal areas
ii
A 1700-acre groundwater plume emanates from the disposal areas and discharges into downgradient streams and wetlands The primary contaminant in groundwater is carbon tetrachloride which has a maximum contaminant level (MCL) of 5 micrograms per liter (microgL) Measured concentrations over a large portion of the plume (900 acres) exceed 5000 microgL and concentrations as high as 64000 microgL have been recorded The plume appears to be almost entirely within an upper unconfined aquifer layer that is approximately 50 feet thick There is limited contamination in the underlying leaky confined aquifer It has been noted in previous documents (including the 2011 Five-Year Review report) that the plume is stable in size The plume has already reached lateral and downgradient discharge locations at streams and streamside seeps and wetlands
Per the ROD for OU1 (groundwater) a Groundwater Extraction and Treatment System (GETS) was constructed in 1996 It operated for 6 years removing 110000 pounds VOCs while treating 796 million gallons of water The average withdrawal rate of less than 250 gallons per minute (gpm) was much less than the design objective of 465 gpm The GETS proved difficult to operate and the EPA determined that groundwater remediation goals would not be met in a reasonable time frame The system was shut down in 2003
There are approximately 35 residences located within the area of the groundwater plume (the groundwater beneath these residences has concentrations that exceed remediation goals) A clean public water supply has been made available to the plume-area residents and institutional controls to prevent groundwater use have been obtained for 56 of 60 parcels within the plume covering approximately 86 of the plume area
Ambient air and indoor air concentrations of carbon tetrachloride are elevated relative to background within the plume area and indoor-air mitigation systems have been installed at two residences (in 2007) Some measured concentrations in ambient air have been above calculated risk-based action levels based on an excess cancer risk of 10-4 (the upper end of the EPArsquos acceptable risk range)
Concentrations are also elevated in surface water near plume discharge locations The concentrations are above Tennessee surface water quality criteria However Site-specific risk assessments have concluded that surface-water exposure routes do not present significant human health or environmental risks
Summary of Conceptual Site Model
The CSM consists of contaminant source areas at the disposal areas a groundwater plume emanating from the disposal areas and migrating to the north and northwest in the unconfined aquifer discharge to downgradient surface waters and volatilization of VOC contaminants to ambient and indoor air The CSM is succinctly depicted in Figure B-4 of the 2011 Five-Year Review report (included in Attachment A prepared by Environ)
iii
Humans may be exposed to Site contaminants through direct contact with waste or contaminated soil through consumption of contaminated groundwater through contact with (or ingestion of) contaminated surface water through inhalation of ambient or indoor air within the plume area or through consumption of organisms (for example fish) from Site-area habitats
All of these exposure pathways have been evaluated through risk assessments and several of the more critical pathways have been addressed through institutional and engineering controls
Summary of Findings
Based on a technical review of the information provided to the Optimization Team the Site visit conducted on January 18 2012 and interviews with persons knowledgeable about the Site several findings have been identified The observations provided below are the technical interpretations of the Optimization Team They are not intended to imply a deficiency in the work of the site managers but are offered as constructive information and opinions in the best interest of the EPA and the public The main findings of the Optimization Team are listed below with additional supporting details provided in Section 5 of this report
Approximately 9 million pounds of VOCs are present at the Site2 It is clear from Site data that most of the contaminant mass is within the footprint of the largest landfill area the North Disposal Area (NDA) Based on concentrations present in the groundwater the size of the plume and the likely presence of non-aqueous phase liquid (NAPL) in groundwater it is estimated that at least 7 percent (and perhaps well over 10 percent) of the total mass buried at the Site has already migrated to the saturated zone much in NAPL form
A primary issue with the source areas is that they act as a continuing long-term source for groundwater contamination The source areas also likely contribute directly to ambient air contamination especially near the source areas
There remains the potential for future human exposure to groundwater with concentrations well in excess of MCLs The institutional controls that are in place help reduce the likelihood of future human exposure to contaminated groundwater
Despite the fact that surface-water concentrations exceed MCLs and certain surface-water criteria potential risks for recreational users exposed to surface water and fish at the Site were found to be acceptable in 2011 risk assessments The affected surface waters are not currently used as a water-supply source
2 This estimate of 9 million pounds is consistent with a draft Focused Feasibility Study for OU2 (Environ January 2012) reviewed by the Optimization Team Environ has since reduced their mass estimate to 68 million pounds
iv
The ambient (outdoor) air at the Site has elevated levels of carbon tetrachloride A few measurements of ambient air concentrations in 2007-2008 exceeded risk-based screening levels based on a 10-4 excess cancer risk Within the immediate area of the disposal areas (on the landfill property) elevated ambient air concentrations are likely caused by vapors emanating from the buried waste the contaminated soil in the vadose zone below the buried waste and (probably to a lesser extent) vapors emanating from contaminated saturated-zone groundwater Immediately adjacent to the landfill property (for example along Old Toone Road due west of the disposal areas) it is likely that ambient air concentrations are caused by volatilization from the waste and vadose zone at the source areas and by volatilization from groundwater and nearby surface seeps North of the landfill property it is likely that the most elevated ambient air concentrations are caused primarily by volatilization from contaminated surface water and groundwater
The vapor mitigation systems that were installed at two homes are effective at mitigating indoor air risk There remains a future risk of indoor air exposure at homes within the plume including homes that may be built in the future without vapor mitigation systems
In the opinion of the Optimization Team the measures that have been taken at the Site to reduce the potential for human exposure to Site contaminants (for example past land acquisition groundwater use restrictions provision of an alternate water supply and fencing around the disposal areas) have been prudent and effective
The January 2012 draft OU2 Focused Feasibility Study (FFS) provides a summary of several feasible remedial technologies that is helpful for assessing the relative merits of different potential remedial approaches This draft FFS also provides a feasibility-level evaluation of remedial alternatives relative to National Oil and Hazardous Substances Pollution Contingency Plan (NCP) criteria The technologies and alternatives presented in the FFS cover an appropriate range of potential remediation approaches for this operable unit The Optimization Team reviewed the draft FFS in developing technical comments on SVE as a full-scale remedy for OU2 relative to other potential remedial alternatives
In the opinion of the Optimization Team based on technical experience at other sites and a review of Site documents the remedial alternative involving SVE only (SA-4) is better than the alternative involving excavation and on-Site disposal with SVE (SA-5) when evaluated relative to the NCP criteria
SVE is a cost-effective and implementable technology for removing VOC mass While SVE will remove contaminant mass it will not lead to complete Site restoration without other actions to address saturated-zone contamination SVE alone is not expected to offer substantial overall risk reduction for the Site for the next several decades at least There is a tradeoff involved when deciding between the SVE alternative (SA-4) and a more limited and much less costly alternative (SA-2) not including SVE It is appropriate for the EPA and other stakeholders to evaluate the expected remedy cost and the expected mass-removal effectiveness when making a remedy decision
v
None of the alternatives presented in the FFS would result in meeting the remediation goals established in the original OU2 ROD for soil and groundwater concentrations
The SVE pilot test at the Southwest Disposal Area (SWDA) was successful at removing substantial mass and provides useful information for full-scale design
Based on experience at other similar sites with SVE systems the VOC mass removal from SVE is likely to be significant but considerably lower than the PRP consultantrsquos estimate of 85 percent
The cost estimate for full-scale SVE implementation as presented in the draft FFS could be improved the actual present-value cost of implementing SA-4 is expected to be closer to $40 million
Most of the potential human health and environmental risks at the Site appear to be related to the groundwater contamination In addition to the potential future use of contaminated groundwater as a drinking water source groundwater continues to supply contaminants to Pugh Creek Clover Creek other tributaries and wetlands Also a large portion of the ambient and indoor air risks are driven by volatilization from contaminated groundwater and from groundwater-fed surface water
The GETS design was not optimal and operation was challenging and costly
A more optimal design of the pump and treat remedy for hydraulic containment is feasible and should be considered as a potential remedial alternative for OU1 An improved treatment process design should be included in this alternative
Several other potentially viable alternatives exist for containing the groundwater plume nearer the source areas (for example funnel-and-gate with permeable reactive barriers (PRBs) and others)
Based on the Optimization Teamrsquos understanding of the CSM and past reviews of many other sites with pump and treat remediation systems a well-designed and operated groundwater containment remedy could substantially reduce concentrations downgradient of the system and lower concentrations could be realized throughout the plume within 30 years While it would likely take a much longer period of time to reach MCLs downgradient of the containment system risks (from groundwater surface water and air exposure) would be substantially reduced sooner
The overall exit strategy for this Site is unclear According to the RODs the goals are to reduce concentrations to MCLs outside the disposal area footprints and to reduce soil concentrations to concentrations that will not cause future MCL exceedances below the disposal areas With the GETS out of operation there is no current remedial action for groundwater and it does not appear that SVE systems contemplated for OU2 will achieve all remedial goals
vi
The SVE systems contemplated for OU2 will result in significant energy usage and there will be an environmental footprint associated with implementing this remedy
The SVE remedy presents job safety hazards for field teams that are more significant than many sites such as the requirement for protective suits and supplied air during drilling at the disposal areas Various measures can be implemented to address those risks
Summary of Recommendations
Recommendations are provided to improve remedy effectiveness reduce cost provide technical improvement and assist with accelerating the Site exit strategy The recommendations in these areas are as follows
Improving Effectiveness
Select and implement an OU2 remedy that will address risks posed by the source material present at the Site Remedial action objectives should be developed based on policy and what can be technically achieved
Evaluate groundwater remedial alternatives and implement an OU1 remedy Continue to improve property controls through institutional controls Continue a monitoring program for ambient and indoor air
Reducing Cost
Evaluate OU2 implementation costs during remedial design Set performance goals for SVE so that the systems can be turned off when the rate of
mass removal is no longer significant
Technical Improvement
Define and document action levels for ambient air and indoor air Define and implement an ongoing groundwater monitoring program Develop and utilize a central data management system for environmental data
Site Exit Strategy
Develop a Site exit strategy that includes practical remedial measures at OU2 and OU1 along with remedial action objectives that are both protective and practical
Also it is recommended that the Site team consider ways that the environmental footprint of remedy implementation can be limited for OU1 and OU2
vii
NOTICE
Work described herein was performed by Tetra Tech for the US Environmental Protection Agency (EPA) Work conducted by Tetra Tech including preparation of this report was performed under Work Assignment 2-48 of the EPArsquos Contract No EP-W-07-078 with Tetra Tech Mention of trade names or commercial products does not constitute endorsement or recommendation for use
viii
PREFACE
This report was prepared as part of a national strategy to expand Superfund optimization from remedial investigation to site completion implemented by the US Environmental Protection Agency (EPA) Office of Superfund Remediation and Technology Innovation (OSRTI) The project contacts are as follows
Organization Key Contact Contact Information
EPA Office of Superfund Remediation and Technology Innovation (OSRTI)
Jennifer Edwards US Environmental Protection Agency Construction amp Post Construction Management Branch 1200 Pennsylvania Ave NW Washington DC 20460 edwardsjenniferepagov Phone 703-603-8762
Tetra Tech EM Inc (Contractor to EPA)
Therese Gioia Tetra Tech EM Inc 1881 Campus Commons Drive Suite 200 Reston VA 20191 theresegioiatetratechcom phone 815-923-2368
Tetra Tech (GEO) (Subcontractor to Tetra Tech EM Inc)
Doug Sutton PhD PE
Tetra Tech 2 Paragon Way Freehold NJ 07728 phone 732-409-0344 dougsuttontetratechcom
ix
LIST OF ACRONYMS AND ABBREVIATIONS
microgkg Micrograms per kilogram microgL Micrograms per liter microgm3 mmicrograms per cubic meter ARARs Applicable or relevant and appropriate requirements bgs Below ground surface CERCLA Comprehensive Environmental Response Compensation and Liability Act cfm Cubic feet per minute COC Contaminant of concern CSM Conceptual site model DNAPL Dense non-aqueous phase liquid EPA US Environmental Protection Agency FFS Focused feasibility study FS Feasibility study ft Feet FTL Fruit-of-the-Loom Custodial Trust GAC Granular activated carbon GETS Groundwater Extraction and Treatment System gpm Gallons per minute HP Horsepower KW Kilowatt LTM Long-term monitoring MCL Maximum contaminant level MDA Middle Disposal Area NAPL Non-aqueous phase liquid NCP National Oil and Hazardous Substances Pollution Contingency Plan NDA North Disposal Area NPL National Priorities List OampM Operation and maintenance OSRTI Office of Superfund Remediation and Technology Innovation OU Operable unit PampT Pump and treat ppbv Parts per billion by volume PRP Potentially Responsible Party RAO Remedial action objective RCRA Resource Conservation and Recovery Act RI Remedial investigation ROD Record of Decision RSE Remediation system evaluation
x
SAL Soil action level SEDA Southeast Disposal Area SVE Soil vapor extraction SVOC Semi-volatile organic compound SWDA Southwest Disposal Area SWSWDA Southwest-Southwest Disposal Area TDEC Tennessee Department of Environment and Conservation UAO Unilateral Administrative Order USGS United States Geological Survey VGAC Vapor granular activated carbon VOC Volatile organic compound yr Year
xi
TABLE OF CONTENTS
EXECUTIVE SUMMARY i NOTICE viii PREFACE ix LIST OF ACRONYMS AND ABBREVIATIONS x
10 INTRODUCTION 1
11 PURPOSE 1 12 SITE-SPECIFIC SCOPE OF OPTIMIZATION 3 13 TEAM COMPOSITION 3 14 DOCUMENTS REVIEWED 4 15 QUALITY ASSURANCE5 16 PERSONS CONTACTED5
20 SITE BACKGROUND7
21 LOCATION 7 22 SITE HISTORY 7
221 HISTORIC LAND USE AND OPERATIONS 7 222 CHRONOLOGY OF ENFORCEMENT AND REMEDIAL ACTIVITIES 8
23 POTENTIAL HUMAN AND ECOLOGICAL RECEPTORS 9 24 EXISTING DATA AND INFORMATION 10
241 SOURCES OF CONTAMINATION10 242 GEOLOGIC SETTING AND HYDROGEOLOGY10 243 SOIL CONTAMINATION11 244 GROUNDWATER CONTAMINATION 11 245 SURFACE-WATER CONTAMINATION 11 246 AMBIENT AIR AND INDOOR AIR CONTAMINATION 12
30 DESCRIPTION OF PLANNED OR EXISTING REMEDIES13
31 REMEDY AND REMEDY COMPONENTS 13 311 ALTERNATIVE WATER SUPPLY 13 312 LANDFILL CAPS 13 313 GROUNDWATER PUMP AND TREAT SYSTEM 13 314 INSTITUTIONAL CONTROLS AND ACCESS CONTROLS 14 315 VAPOR MITIGATION SYSTEMS 14 316 SVE14
32 RAOS AND STANDARDS 14 33 PERFORMANCE MONITORING PROGRAMS 15
40 CONCEPTUAL SITE MODEL 16
41 CSM OVERVIEW16 42 CSM DETAILS AND EXPLANATION 16
421 SOURCE AREAS16
xii
422 CONTAMINANT MIGRATION PATHWAYS 16 423 CONTAMINANT FATE 17 424 POTENTIAL EXPOSURE ROUTES 17
43 DATA COMPLETENESS 18
50 FINDINGS19
51 CONTAMINANT MASS AND LOCATION 19 52 RISKS FROM DIFFERENT AREAS OF CONTAMINATION 20
521 SOURCE AREAS20 522 GROUNDWATER 20 523 SURFACE WATER 21 524 AMBIENT AIR21 525 INDOOR AIR 22
53 EXISTING RISK-MITIGATION MEASURES 22 54 POTENTIAL ADDITIONAL MEASURES TO ADDRESS LANDFILL SOURCES (OU2)23
541 OU2 FEASIBILITY STUDY 23 542 COMPARING EFFECTIVENESS FOR ALTERNATIVES SA-4 AND SA-5 24 543 ARAR COMPLIANCE AND WAIVERS 25 544 SVE PILOT TEST25 545 ASSESSMENT OF SVE BENEFITS AND SHORTCOMINGS 25 546 SELECTION OF SVE AS OU2 FINAL REMEDY 26 547 FS COST ESTIMATE FOR SA-4 26
55 GROUNDWATER CONTAINMENT AND RESTORATION (OU1) 28 551 IMPORTANCE OF THE GROUNDWATER PATHWAY28 552 PRIOR PUMP AND TREAT REMEDY 28 553 IMPROVED PUMP AND TREAT ALTERNATIVE 29 554 OTHER ALTERNATIVES FOR OU129 555 EXPECTED EFFECTIVENESS 30
56 SITE EXIT STRATEGY 30 57 ENVIRONMENTAL FOOTPRINTS OF REMEDIAL MEASURES 30 58 HEALTH AND SAFETY 30
60 RECOMMENDATIONS31
61 RECOMMENDATIONS TO IMPROVE EFFECTIVENESS31 611 COMPLETE THE OU2 REMEDY DECISION WITH CLEAR RAOS 31 612 EVALUATE GROUNDWATER REMEDIAL ALTERNATIVES AND IMPLEMENT AN
OU1 REMEDY 32 613 CONTINUE TO IMPROVE PROPERTY CONTROLS 33 614 CONTINUE TO MONITOR AMBIENT AIR AND INDOOR AIR 33
62 RECOMMENDATIONS TO REDUCE COSTS33 621 EVALUATE OU2 IMPLEMENTATION COSTS DURING REMEDIAL DESIGN34 622 SET PERFORMANCE GOALS FOR SVE34
63 RECOMMENDATIONS FOR TECHNICAL IMPROVEMENT 34 631 DEFINE AND DOCUMENT ACTION LEVELS FOR AMBIENT AIR AND INDOOR
AIR 34 632 DEFINE A GROUNDWATER MONITORING PROGRAM35 633 ESTABLISH AND USE A DATA MANAGEMENT SYSTEM 35
xiii
64 CONSIDERATIONS FOR ACHIEVING SITE CLOSE OUT 35 641 DEVELOP A SITE EXIT STRATEGY 35 642 UPDATE THE OU1 AND OU2 RODS35
65 RECOMMENDATIONS RELATED TO GREEN REMEDIATION36 66 SUGGESTED APPROACH TO IMPLEMENTING RECOMMENDATIONS36
List of Tables
Table 5-1 Remedial Alternatives Summary from the Draft FFS 24 Table 6-1 Recommendations Summary 37
Attachments
Attachment A Site Figures provided by Environ
xiv
10 INTRODUCTION
11 PURPOSE
During fiscal years 2000 and 2001 independent Remediation System Evaluations (RSEs) were conducted at 20 operating pump and treat (PampT) sites (those sites with PampT systems funded and managed under Superfund by the US Environmental Protection Agency [EPA] other federal agencies and by the States) Due to the opportunities for system optimization that arose from those RSEs the EPA Office of Superfund Remediation and Technology Innovation (OSRTI) has incorporated RSEs into a larger post-construction completion strategy for Fund-lead remedies as documented in OSWER Directive No 92831-25 Action Plan for Ground Water Remedy Optimization Concurrently the EPA developed and applied the Triad Approach to optimize site characterization strategies methods and technologies including the increased use of conceptual site models (CSMs) as the basis for identifying project data gaps and using those gaps to guide the development of site characterization objectives and work plans The EPA has since expanded the reach of optimization to encompass reviews at the investigation stage of projects The EPArsquos definition of optimization is as follows
ldquoEfforts at any phase of the removal or remedial response to identify and implement actions that improve the actionrsquos effectiveness and cost-efficiency Such actions may also improve the remedyrsquos protectiveness and long-term implementability which may facilitate progress towards site completion To identify these opportunities regions may use a systematic site review by a team of independent technical experts apply techniques or principles from green remediation or Triad or apply some other approach to identify opportunities for greater efficiency and effectiveness Contractors states tribes the public and potentially responsible parties (PRPs) are also encouraged to put forth opportunities for the Agency to considerrdquo
The Strategy also encourages other activities designed to facilitate better site characterization remedy selection and design and construction by applying various techniques and optimization lessons learned to improve a given projectrsquos scope schedule and cost
As stated in the definition optimization refers to a ldquosystematic site reviewrdquo indicating that the site as a whole is often considered in the review Optimization can be applied to a specific aspect of the remedy (such as focus on long-term monitoring [LTM] optimization or focus on one particular operable unit [OU]) but other site or remedy components are still considered to the degree that they affect the focus of the optimization An optimization evaluation considers the goals of the remedy available site data CSM remedy performance protectiveness cost-effectiveness and exit strategy A strong interest in sustainability has also developed in the private sector and within Federal State and Municipal governments Consistent with this interest OSRTI has developed a Green Remediation Primer (httpcluinorggreenremediation) and now routinely considers green remediation and environmental footprint reduction during optimization evaluations The evaluation includes reviewing site documents potentially visiting the site for one day and compiling a report that includes recommendations in the following categories
1
Protectiveness Cost-effectiveness Technical improvement Site exit strategy Environmental footprint reduction
The recommendations are intended to help the site team identify opportunities for improvements in these areas In many cases further analysis of a recommendation beyond that provided in this report may be needed prior to implementation of the recommendation Note that the recommendations are based on an independent evaluation and represent the opinions of the evaluation team These recommendations do not constitute requirements for future action but rather are provided for consideration by the Region and other site stakeholders Also note that while the recommendations may provide some details to consider during implementation the recommendations are not meant to replace other more comprehensive planning documents such as work plans sampling plans and quality assurance project plans
The national optimization strategy includes a system for tracking consideration and implementation of the optimization recommendations and includes a provision for follow-up technical assistance from the Optimization Team as mutually agreed upon by the site management team and EPA OSRTI staff
The Velsicol Chemical Corporation Hardeman County Landfill Superfund Site (Site) is located in a rural area near the town of Toone in western Tennessee The Site includes approximately 24 acres of capped landfill area within a 237 acre property parcel Between 130000 and 300000 drums of chemical wastes from Velsicolrsquos pesticide manufacturing plant in Memphis were disposed of in unlined trenches at the Site between 1964 and 1973 The drums and other containers of waste were dumped in the trenches and the trenches were backfilled Years later (in 1980) a clay cap was placed over the disposal areas and even later (1997) a multi-layer composite cap was placed over the clay cap
The wastes included pesticides and chemicals used in the production of pesticides Carbon tetrachloride and other volatile organic compounds (VOCs) made up a substantial portion of the wastes (a PRP contractor Environ estimates 1 percent to 5 percent of the total volume) and have been the most mobile contaminants at the Site Pesticides and semi-volatile organic compounds (SVOCs) are also chemicals of concern (COCs) primarily for soil within and below the buried waste
A 1700-acre groundwater plume emanates from the disposal areas and discharges into downgradient streams and wetlands The primary contaminant in groundwater is carbon tetrachloride which has a maximum contaminant level (MCL) of 5 micrograms per liter (microgL) Measured concentrations over a large portion of the plume (900 acres) exceed 5000 microgL and concentrations as high as 64000 microgL have been recorded The plume is almost entirely within an upper unconfined aquifer layer that is approximately 50 feet (ft) thick There is limited contamination in the underlying leaky confined aquifer The plume is stable in size because it has already reached its lateral and downgradient discharge locations
2
There are approximately 35 residences located within the area of the groundwater plume (the groundwater beneath these residences has concentrations that exceed remediation goals) Ambient air and indoor air concentrations of carbon tetrachloride are elevated relative to background within the plume area and indoor-air mitigation systems have been installed at two residences (in 2007) Some measured concentrations in ambient air have been above calculated risk-based screening levels based on an excess cancer risk of 10-4 (the upper end of the EPArsquos acceptable risk range)
Concentrations are also elevated in surface water near plume discharge locations The concentrations are above Tennessee surface water quality criteria However Site-specific risk assessments have concluded that surface-water exposure routes do not present significant human health or environmental risks
12 SITE-SPECIFIC SCOPE OF OPTIMIZATION
The optimization review of this Site includes a comprehensive review of the CSM existing soil and waste remedies soil vapor extraction (SVE) pilot studies and potential remedial alternatives for soil In particular the review covers the following
Review of the existing Records of Decision (RODs) Five-Year Reviews 2007 Feasibility Study SVE pilot test results 2011 draft Focused Feasibility Study for landfills progress reports geophysical data soil gas data landfill cap and characterization information
Review of SVE as a potential Site-wide soil remedy Considerations for SVE design and implementation Consideration of other potential remedial alternatives
While the focus of this review is on potential soilwaste remediation an initial review of potential groundwater remediation is also considered
13 TEAM COMPOSITION
The Optimization Team consisted of the following individuals
Name Affiliation Phone Email
Jennifer Hovis EPA HQOSRTI 703-603-8888 hovisjenniferepagov Edward Gilbert EPA HQOSRTI 703-603-8883 gilbertedwardepagov Greg Council Tetra Tech 770-619-9950 gregcounciltetratechcom Peter Rich Tetra Tech 410-990-4607 peterrichtetratechcom
In addition Doug Sutton from Tetra Tech assisted with project direction
3
14 DOCUMENTS REVIEWED
The following documents were scanned or reviewed The reader is directed to these documents for additional Site information that is not provided in this report
Operable Unit 1 ROD (EPA - June 1991) Operable Unit 2 ROD (EPA - September 1995) Five-Year Review (EPA - September 2000) Second Five-Year Review (EPA - September 2006) Third Five-Year Review (EPA - April 2011) Post Second Five-Year Review Feasibility Study (Environ - June 2007) Supplemental Remedial Alternative Evaluation Letter (Environ - April 2010) Annual Progress Report-2010 (Environ - 2011) Revised Human Health Risk Assessment (Environ - March 2011) Superfund Fact Sheets (Environ - 2004 thru 2011) Third Quarter Progress Report-2010 Velsicol Chemical Corp Hardeman County
Landfill OUs 1 and 2 (Environ - March 2011) Fourth Quarter Progress Report-2010 Velsicol Chemical Corp Hardeman County
Landfill OUs 1 and 2 (Environ - March 2011) Revised First Quarter Progress Report-2011 Velsicol Chemical Corp Hardeman
County LandfillOUs 1 and 2 (Environ - September 2011) Second Quarter Progress Report-2011Velsicol Chemical Corp Hardeman County
Landfill OUs 1 and 2 (Environ - August 2011) Third Quarter Progress Report-2011Velsicol Chemical Corp Hardeman County
Landfill OUs 1 and 2 (Environ - October 2011) Summary of Surface Geophysical Investigation Results for the SW SWDA (Environ - May
2011) Summary of Surface Geophysical Investigation Results Suspect Trench Areas - Areas 1
through 9 (Environ - June 2011) Summary of Surface Geophysical Investigation Results Suspect Trench Areas - Areas 1
through 9 (Environ - September 2011) Soil Vapor Extraction Pilot Test Options (Environ - April 2008) Soil Vapor Extraction Pilot Test Study Work Plan Part 1 Pre-Design Activities (Environ -
September 2008) Soil Vapor Extraction Pilot Test Study Work Plan Part 2 Design and Installation
(Environ - March 2009) 2008 Soil Gas Sampling Results Technical Memorandum (Environ - February 2010) Soil Vapor Extraction Pilot Test Operation Maintenance and Monitoring Manual
(Environ - January 2011) Soil Vapor Extraction Pilot Test Construction Completion Report (Environ - January
2011) Phase II SVE Pilot Test Conceptual Design and Cost Estimate (Environ - September
2011) Phase II SVE Pilot Test Design Submittal 1 Well Installation and Sampling Velsicol
Chemical Corp Hardeman County Landfill OU 2 (Environ - November 2011)
4
Phase II SVE Pilot Test Design Submittal 3 Soil Gas Sampling amp System Startup (Environ - January 2012)
Landfill Cap as Built Plans (Conestoga-Rovers amp Associates - December 1980) Feasibility Study (Conestoga-Rovers amp Associates - April 1991) Remedial Investigation Report Volume I ndash Text (Conestoga-Rovers amp Associates - April
1991) Landfill Waste Sampling and Data Evaluation Report (Conestoga-Rovers amp Associates -
May 1993) Feasibility Study (Conestoga-Rovers amp Associates - June 1995) Landfill RCRA Cap Technical Memorandum- Electromagnetic Survey Results for OU2
(Conestoga-Rovers amp Associates - July 1996) Landfill Cap Construction Report (Conestoga-Rovers amp Associates - January 1998) Groundwater Flow amp Particle Tracking Analysis (EPA - 2006) 2008 Ambient Air Sampling Report for the Velsicol Chemical Corp Hardeman County
Landfill Site (Environ - September 2009) Draft Focused Feasibility Study OU2 Landfill Disposal Areas (Environ - January 2012) Phase II SVE Pilot Test Design Submittal 1 Design Basis and Mechanical Component
Specifications Velsicol Chemical Corp Hardeman County Landfill OU 2 (Environ -December 2011)
Soil Gas and Indoor Air Investigation Technical Memorandum (Environ - February 2006)
August 2007 Air Sampling Results Update (Environ - September 2007) October 2007 Air Sampling Results Update (Environ - January 2008)
15 QUALITY ASSURANCE
This optimization review utilizes existing environmental data to interpret the CSM evaluate remedy performance and make recommendations to improve the remedy The quality of the existing data is evaluated by the Optimization Team prior to using the data for these purposes The evaluation for data quality includes a brief review of how the data were collected and managed (where practical the site Quality Assurance Project Plan is considered) the consistency of the data with other site data and the use of the data in the optimization review Data that are of suspect quality are either not used as part of the optimization review or are used with the quality concerns noted Where appropriate this report provides recommendations made to improve data quality
16 PERSONS CONTACTED
A stakeholders meeting was held on January 18 2012 at the Site and at the Jackson field office of the Tennessee Department of Environment and Conservation (TDEC) In addition to the Optimization Team the following persons were present for the stakeholders meeting and Site visit
5
Name Affiliation Email Address
John Nolen EPA Region 4 (Project Manager) nolenjohnepagov Ron Sells TDEC jamesronsellstngov Jay Steinberg Fruit-of-the-Loom Custodial Trust (FTL) (not given) David Heidlauf Environ (consultant for FTL) dheidlaufenvironcorpcom Michael Bradley United States Geological Survey (USGS) mbradleyusgsgov
Don Sprinkle of TDEC was also present for a portion of the meeting at the TDEC office
Mr Heidlauf was subsequently contacted by the Optimization Team with a few follow-up questions A conference call was also held between the Optimization Team and Site stakeholders on February 15 2012 to discuss preliminary findings of the Optimization Team
6
20 SITE BACKGROUND
21 LOCATION
The Site is located in a hilly rural area of Hardeman County Tennessee approximately 2 miles north-northeast of the town of Toone and approximately 60 miles east-northeast of Memphis There are five defined landfills at the Site called the North Disposal Area (NDA) the Middle Disposal Area (MDA) the Southeast Disposal Area (SEDA) the Southwest Disposal Area (SWDA) and the Southwest-Southwest Disposal Area (SWSWDA) The relatively small SWSWDA was recently discovered the other landfill areas have been capped These landfill areas occupy approximately 24 acres of a 237-acre parcel just east of Old Toone Road about 1 mile north of state route 100 The NDA is by far the largest disposal area and most significant contaminant source
A groundwater plume of carbon tetrachloride and other contaminants emanates from the landfills and stretches northward and northwestward for a distance of over 15 miles The groundwater plume ends at natural discharge points along and near Clover Creek (northern plume boundary) Pugh Creek (eastern plume boundary) and other tributaries (for example the unnamed creek along the western plume boundary) The plume covers approximately 1700 acres It has been noted in previous documents (including the 2011 Five-Year Review report) that the plume is stable in size The plume is stable because it has already reached lateral and downgradient discharge locations at streams and streamside seeps and wetlands There are approximately 35 residences within the groundwater plume area Most of the area is forested there are significant areas of wetlands in the lowlands along the streams and some of the land is used for agriculture
22 SITE HISTORY
221 HISTORIC LAND USE AND OPERATIONS
Between 130000 and 300000 drums of chemical wastes from Velsicolrsquos pesticide manufacturing plant in Memphis were disposed of in unlined trenches at the Site between 1964 and 1973 Using the low end of this estimate and multiplying by 55 gallons per drum this equates to an estimate of over 7 million gallons of chemical waste The drums and other containers of waste were dumped in the trenches and the trenches were backfilled Later (in 1980) a clay cap was placed over the disposal areas and even later (1997) a multi-layer composite cap was placed over the clay cap
The wastes included pesticides and chemicals used in the production of pesticides Carbon tetrachloride and other volatile organic compounds (VOCs) made up a substantial portion of the wastes (a PRP contractor Environ estimates 1 percent to 5 percent of the total volume) and have been the most mobile contaminants at the Site Pesticides and semi-volatile organic compounds (SVOCs) are also chemicals of concern (COCs)
7
222 CHRONOLOGY OF ENFORCEMENT AND REMEDIAL ACTIVITIES
The USGS identified the likelihood of waste releases to groundwater at the Site by 1967 In 1979 after groundwater was found to be contaminated Velsicol began providing an alternative water source to affected residents A clay cap was constructed over the disposal areas in 1980 by a Velsicol contractor The Site was added to the National Priorities List (NPL) in 1983
Two operable units (OUs) were defined for the Site
OU1 is contaminated groundwater OU2 is the waste and underlying contaminated soil
In 1991 a ROD was finalized by the EPA for OU1 specifying a groundwater pump and treat remedy Velsicol was directed to design and implement the selected groundwater remedy through a Unilateral Administrative Order (UAO)
Velsicolrsquos contractor began construction of a Groundwater Extraction and Treatment System (GETS) north of the disposal areas in 1995 The system became fully operational in November 1997 and operated until November 2003 (approximately six years) at an average flow of less than 250 gallons per minute (gpm) which was approximately half of the design flow Several of the GETS wells extracted some water from the leaky confined aquifer which was relatively clean compared with the shallower unconfined aquifer A total of 796 million gallons of water were treated by the GETS and 110000 pounds of VOCs were removed The average influent concentration of VOCs was approximately 17000 microgL
Numerous difficulties were experienced in GETS operation The system was also not as effective as expected in reducing plume concentrations to remedial goals and an EPA analysis suggested that it would take 100 years or more to reach MCLs in the downgradient portion of the plume even with effective hydraulic containment near the sources and assuming no non-aqueous phase liquid (NAPL) in groundwater
In 1995 a ROD was finalized for OU2 and a RCRA-style multi-layer composite cap (on top of the existing clay cap) was specified as the remedy for the known disposal areas (NDA MDA SEDA and SWDA) The cap was intended to eliminate the ongoing source of contamination to groundwater and prevent direct human contact with waste or soil exceeding risk-based soil action levels (SALs) Velsicol was directed to design and implement the source-area remedy through a UAO The caps were constructed in 1997
By 2001 through corporate transactions the Sitersquos potentially responsible party (PRP) became Fruit-of-the-Loom Corporation In 2002 a bankruptcy settlement established the Fruit-of-the-Loom Custodial Trust (FTL) and this entity became the Site PRP
In 2007 vapor mitigation systems were installed by Environ (the current PRP consultant and contractor) at two homes located within the area of the groundwater plume that were found to have indoor air concentrations in excess of risk-based action levels The mitigation systems include crawlspace vapor barriers vapor collection pipes below the barriers vent pipes and fans
8
Over a period of many years institutional controls to prevent groundwater use have been obtained for 56 of 60 parcels within the groundwater plume covering approximately 86 percent of the plume area
In 2009-2011 an SVE pilot test was conducted at the SWDA over a period of 28 months The SVE pilot test removed approximately 31000 pounds of VOCs from the waste zone and the underlying vadose zone
The EPA issued five-year review reports in 2000 2006 and 2011 The 2011 five-year review concluded that neither OU1 nor OU2 have been remediated as intended in their respective RODs and that as a result the Site remedies implemented are not protective of human health and the environment
As this optimization review was being conducted the EPA was contemplating a full-scale SVE remedy for OU2 based on results of the recent pilot test and a draft Focused Feasibility Study (FFS) for OU2 issued by Environ on behalf of the PRP in January 20123 A Feasibility Study (FS) that included remedial alternatives for both OU1 and OU2 was previously prepared by Environ in 2007
The EPA has not fully developed a new remedial strategy for OU1 The EPA expects to address OU1 after finalizing a new ROD for OU2
23 POTENTIAL HUMAN AND ECOLOGICAL RECEPTORS
The primary receptors of potential concern are current and future residents within the area of the groundwater plume The residents may potentially be exposed to groundwater surface water ambient air and indoor air with elevated concentrations of VOCs primarily carbon tetrachloride Other recreational users such as hunters and fisherman are also potential receptors Organisms in the streams and wetlands are potential ecological receptors
The Toone public water supply (not impacted by the Site) is available to residents in the plume area and institutional controls have been established to prevent current and future residents from using contaminated groundwater at most (but not all) properties within the plume The PRP also owns a substantial portion of the plume-area property
Vapor mitigation systems have been installed at the two homes within the plume where indoor air concentrations of carbon tetrachloride have been found to be of potential concern These systems require continuous fan operation and periodic inspection and maintenance
At several locations ambient air concentrations have been measured near and above calculated risk-based action levels for carbon tetrachloride Slightly different action levels have been used or proposed by Environ for ambient air and indoor air based on different sets of exposure assumptions and updated toxicity assessments All of these action levels are based on an excess
3 Since completion of the optimization review and the initial draft of this report the FFS has been revised and a ROD amendment has been completed for OU2 The ROD specifies SVE in all disposal areas
9
cancer risk of 10-4 which is the upper end of USEPArsquos risk range Based on the available data when averaged over time and space ambient air concentrations in the plume areas likely less than concetnrations associated with the 10-4 risk level
Risk assessments completed prior to the original RODs for the Site as well as subsequent risk assessments from Environ indicate that
(1) Ecological receptors are not expected to be adversely impacted by Site contaminants (2) Exposures associated with occasional recreational uses of the streams and land above the
plume are not likely to lead to significant increased human health risk and (3) Consumption of fish from impacted streams is not likely to lead to significant increased
human health risk
24 EXISTING DATA AND INFORMATION
The information provided in this section is intended to represent data already available from existing Site documents Interpretation included in this section is generally interpretation from the document from which the information is obtained The Optimization Teamrsquos interpretation of this data is discussed in Sections 40 and 50 of this report
241 SOURCES OF CONTAMINATION
Buried wastes at the five disposal areas (NDA MDA SEDA SWDA and SWSWDA) are the sources of contamination at the Site The wastes are buried in the interval from approximately 5 to 20 feet below the current land surface (which is the top of the cap in most places) Contaminated soil and NAPL in the vadose zone below the waste is a secondary source that can leach contaminants to the underlying saturated groundwater zone The water table is approximately 90-100 feet below land surface at the disposal areas
242 GEOLOGIC SETTING AND HYDROGEOLOGY
The following descriptions of the Site geology and hydrogeology are obtained from the 1991 Remedial Investigation report the OU1 ROD and more recent reports by Environ
The Site is located on alluvialfluvialdeltaic deposits near the eastern edge of the Mississippi Embayment within the Gulf Coastal Plain The uppermost Quaternary alluvial deposits and underlying Claiborne and Wilcox Formations have similar compositions mostly interbedded quartz sand with discontinuous strata of silts and clays Some thin kaolin layers are present in these formations These sandy units are over 100 feet thick at the Site and are underlain by the Porterrsquos Creek Clay
At the time of the OU1 ROD the entire saturated portion of the combined Claiborne-Wilcox Formation was thought to be a single continuous aquifer unit bounded at the base by the Porterrsquos Creek Clay aquitard Subsequent hydrogeologic investigations revealed that this aquifer unit was more accurately described by an upper unconfined aquifer layer and an underlying leaky confined aquifer with limited transmission of water between the two layers due to the presence
10
of a clayey semi-confining layer The semi-confining layer is found throughout most of the plume area but is suspected to be absent or discontinuous in at least one location north of the NDA near the original GETS source-control extraction wells
The groundwater contamination at the Site is much greater in the unconfined aquifer layer above the semi-confining layer The unconfined aquifer layer is approximately 50 ft thick on average The lower leaky confined aquifer layer does have some areas of groundwater contamination especially near the suspected discontinuity in the overlying semi-confining unit however contaminant concentrations are much lower in the leaky confined aquifer layer than in the unconfined aquifer layer
243 SOIL CONTAMINATION
As part of the 1995 OU2 ROD Soil Action Levels (SALs) were set for Site COCs for direct contact and for prevention of leaching to groundwater that would likely lead to an exceedance of groundwater remediation levels Data collected in 2005 indicate that the SALs protective of groundwater are exceeded outside cap areas at multiple locations for four VOCs carbon tetrachloride chloroform methylene chloride and acetone
244 GROUNDWATER CONTAMINATION
A 1700-acre plume of contamination emanates from the disposal areas and is bounded at surface-water discharge locations (streams and stream-side wetlands) Based on 2008 measurements concentrations of carbon tetrachloride in groundwater exceed 5000 microgL (1000 times the MCL) over approximately 900 acres and concentrations exceed 30000 microgL at three wells north of the NDA (two that were previously part of the GETS)
245 SURFACE-WATER CONTAMINATION
The highest concentrations of carbon tetrachloride in surface water are found in Pugh Creek and small tributaries into Pugh Creek north of the source areas In 2010-2011 a concentration of 26000 microgL was measured in a small tributary to Pugh Creek A concentration of 6100 microgL was measured in 2004-2005 at Pugh Creek less than 1000 ft northwest of the NDA At that time concentrations persisted near and above 100 microgL from that point to the confluence with Clover Creek However concentrations in Clover Creek downgradient of the groundwater plume discharge locations were below MCLs and below water quality criteria for all surface-water use designations For carbon tetrachloride Tennessee water quality criteria are 5 microgL for surface water that may be used as a domestic water supply 16 microgL for recreational use (including fishing) of surface water (organisms only criteria) and 23 microgL for surface waters designated for both domestic and recreational use other water use designations do not have specific criteria for carbon tetrachloride
11
246 AMBIENT AIR AND INDOOR AIR CONTAMINATION
The ambient (outdoor) air at the Site has elevated levels of carbon tetrachloride A few measurements of ambient air concentration in 2007-2008 exceeded the risk-based screening level of 52 parts per billion by volume (ppbv) (which represented a 10-4 cancer risk using certain exposure and toxicity assumptions) presented in the 2008 Annual Ambient Air Report This ambient-air screening level was twice the presented indoor-air screening level of 26 ppbv based on an assumption that ambient air exposure is only applicable outdoors and that 12 hours per day are spent outdoors The OU2 FFS provides an updated risk-based criterion of 65 ppbv for carbon tetrachloride in ambient and indoor air based on updated toxicity information
12
30 DESCRIPTION OF PLANNED OR EXISTING REMEDIES
The information provided in this section is intended to represent information available from existing Site documents Interpretation included in this section is generally interpretation from the document from which the information is obtained The Optimization Teamrsquos interpretation of this information and evaluation of remedy components are discussed in Sections 40 and 50 of this report
31 REMEDY AND REMEDY COMPONENTS
The Site remedy has consisted of several remedy components specified in the 1991 ROD for OU1 the 1995 ROD for OU2 and additional interim measures These components are described in the following subsections
311 ALTERNATIVE WATER SUPPLY
Velsicol began providing an alternative source of water to plume-area residents in 1979 The water supply system from the City of Toone has been expanded to provide a replacement source for well-water users in the groundwater plume
312 LANDFILL CAPS
In 1980 a clay cap was installed over the disposal areas (except the SWSWDA) on top of the existing waste covers and backfill A majority of the area above disposal areas was capped at that time Pursuant to the OU2 ROD a more impermeable multi-layer composite cap was installed in 1997 This cap included a low-density polyethylene (LDPE) liner drainage layer and well-vegetated soil cover The caps limit infiltration and thus reduce the potential for leaching from the wastes and underlying soils into groundwater However migration to groundwater can still occur via NAPL drainage and soil-vapor transport
313 GROUNDWATER PUMP AND TREAT SYSTEM
The GETS was constructed in 1996 and operated for 6 years It removed 110000 pounds of VOCs while treating 796 million gallons of water The average withdrawal rate of less than 250 gpm was much less than the design objective of 465 gpm The extraction wells were screened in both the unconfined aquifer and in the underlying and relatively clean confined aquifer The average concentration of VOCs in the influent was approximately 17000 microgL
The GETS treatment system consisted of in-well chlorination (to prevent biofouling) air stripping and granular activated carbon (GAC) polishing GETS effluent was discharged to Pugh Creek Vapors were treated in a vapor-phase regenerative GAC (VGAC) Operation and maintenance of the groundwater treatment system was challenging and costly
The GETS has been shut down since 2003
13
314 INSTITUTIONAL CONTROLS AND ACCESS CONTROLS
Fences have been installed around the disposal areas to limit human access to the source areas
Institutional controls in the form of deed restrictions to prevent groundwater use have been obtained for 56 of 60 parcels within the plume covering approximately 86 percent of the plume area
315 VAPOR MITIGATION SYSTEMS
In 2007 indoor vapor mitigation systems were installed to control indoor air concentrations at two homes approximately 1 mile north of the NDA in a low-lying area where the vadose zone is thin The mitigation systems include crawlspace vapor barriers vapor collection pipes below the barriers vent pipes and fans
316 SVE
An SVE pilot test was conducted with eight SVE well nests and one additional SVE well at the SWDA over a period of 28 months (approximately 10000 operation hours) The SVE pilot test removed approximately 31000 pounds of VOCs from the area and provided Site-specific data for design at the other disposal areas
32 RAOS AND STANDARDS
Page 6 of the 1991 OU1 ROD indicates that the scope of the response action is ldquoto address the off-Site groundwater contamination and prevent additional contamination from leaving the disposal areas via migration through the groundwaterrdquo This section of the ROD further states that the selected remedy for OU1 will address the remediation of contamination in the groundwater beyond the disposal-area boundaries prior to discharge into the nearby surface water bodies of Clover and Pugh Creeks
Section 24 of 1995 OU2 ROD identifies two remedial action objectives for the waste disposal areas including soils directly beneath the wastes
i) Prevent human exposure through direct contact or ingestion of landfill wastes or soils directly beneath the wastes which have chemical constituent concentrations in excess of calculated risk-based direct-contact criteria levels (identified in Table 28 of the OU2 ROD) and
ii) Prevent further degradation of the groundwater beneath and downgradient of the waste disposal areas by chemical constituents found within the waste
The OU1 and OU2 RODs identify applicable or relevant and appropriate requirements (ARARs) and list associated concentration standards as remediation goals
14
1 The OU1 ROD identifies MCLs as ARARs and sets groundwater cleanup levels to MCLs for all COCs with MCLs For carbon tetrachloride the remediation goal in groundwater is 5 microgL Remediation goals for contaminants without an MCL were based on risk calculations at a 10-6 excess risk level
2 The OU1 ROD also identifies certain Tennessee in-stream water-quality criteria as ARARs and lists these criteria as interim surface-water discharge limits for several COCs For carbon tetrachloride the discharge concentration limits were listed as 5 microgL and 44 microgL for chronic and acute exposures respectively
3 The OU2 ROD identifies soil action levels (SALs) for both protection of groundwater and for direct-contact exposure The direct-contact SALs are applicable only to surface soil and do not apply to covered or capped waste and soil The groundwater-protection SALs were calculated for both the waste zone and underlying soil zone based on preventing leachate concentrations that would lead to an MCL exceedance with only a clay cap (prior to the OU2 cap) In general the groundwater-protection SALs are lower (more stringent) than the direct-contact SALs For carbon tetrachloride the groundwater-protection SALs are 1121 micrograms per kilogram (microgkg) for the waste zone and 1054 microgkg for soil
33 PERFORMANCE MONITORING PROGRAMS
The OU1 ROD specifies that groundwater monitoring be conducted to evaluate remedy performance and verify that groundwater remediation goals (MCLs or other specified standards) are attained downgradient of the extraction wells near the source areas
GETS operation was ceased in 2003 for a variety of reasons related to system design effectiveness and operation Groundwater remediation goals have not been attained
There is no defined groundwater monitoring program currently in place for the Site though monitoring activities do take place from time to time The last comprehensive round of groundwater monitoring was conducted in July 2012
The 1995 OU2 ROD specified periodic inspection and maintenance of the composite caps Cap maintenance activities have been performed by Environ
15
40 CONCEPTUAL SITE MODEL
This section discusses the Optimization Teamrsquos interpretation of existing characterization and remedy operation data and Site visit observations to explain how historic events and Site characteristics have led to current conditions This CSM may differ from that described in other Site documents CSM elements discussed are based on data discussed in the preceding sections of this report This section is intended to include interpretation of the CSM only It is not intended to provide findings related to remedy performance or recommendations for improvement The findings and recommendations are provided in Sections 50 and 60 respectively
41 CSM OVERVIEW
The CSM consists of contaminant source areas at the disposal areas a groundwater plume emanating from the disposal areas and migrating to the north and northwest in the unconfined aquifer discharge to lateral and downgradient surface waters and volatilization of VOC contaminants to ambient and indoor air The CSM is succinctly depicted in Figure B-4 of the 2011 Five-Year Review report (included in Attachment A prepared by Environ)
42 CSM DETAILS AND EXPLANATION
421 SOURCE AREAS
The source areas refer to the five known landfill areas NDA MDA SEDA SWDA and SWSWDA These areas cover a total area of approximately 24 acres within a contiguous land parcel covering approximately 237 acres Significant quantities of buried waste remain in these disposal areas The contamination in the buried waste is an ongoing primary source of contamination to groundwater surface water and air
In addition highly contaminated vadose-zone soil around and below the buried waste at the disposal areas represents a significant secondary contaminant source That is even if all of the buried waste were removed the remaining highly contaminated soil would continue to act as a source of contamination to groundwater surface water and air
NAPL in the vadose and saturated zones also acts as a continuing source of contaminants to groundwater and air Some of the NAPL may be mobile while much is likely in a residual immobile form Contaminants can slowly dissolve from NAPL into groundwater and partition into vadose-zone air vapor
422 CONTAMINANT MIGRATION PATHWAYS
Groundwater at the Site is contaminated with carbon tetrachloride and other VOCs Carbon tetrachloride has been detected at concentrations up to 64000 microgL and has an MCL of 5 microgL While other VOCs SVOCs and pesticides have been detected at the Site carbon tetrachloride is clearly the groundwater contaminant of greatest concern
16
A groundwater plume exceeding the carbon tetrachloride MCL of 5 microgL covers 1700 acres extending north and northwest of the source areas The plume extends from the source areas to areas of groundwater discharge to surface water along Pugh Creek Clover Creek other tributaries and wetlands Contamination primarily exists in the upper unconfined portion of the saturated groundwater zone (approximately 50 ft thick)
Groundwater discharge to surface water results in elevated levels of contaminants (especially carbon tetrachloride) in streams However the processes of volatilization dilution and biodegradation result in reduced concentrations within short distances from the discharge areas and concentrations of Site contaminants are not detected above relevant criteria downstream (west) of the plume in Clover Creek surface water
423 CONTAMINANT FATE
Volatilization of carbon tetrachloride and other VOCs to the atmosphere represents the most important natural contaminant sink for the Site This volatilization occurs directly from the waste areas and underlying vadose-zone soils (escaping along the edges of the landfill caps) from the groundwater (especially in low-lying plume areas where the vadose zone is thin) and from the wetlands and streams There is also some biodegradation that occurs for carbon tetrachloride (with chloroform methylene chloride and other degradation products potentially formed) near discharge locations but it appears that volatilization is a much more significant contaminant sink
In the present system the volatilization that occurs largely at groundwater seeps and in the streams can be thought of conceptually as a natural air stripper
Once in the atmosphere VOCs become widely dispersed and concentrations decrease rapidly to background levels away from the areas of volatilization Carbon tetrachloride is fairly stable in the troposphere but can escape to the stratosphere where it is broken down by photolysis
The non-VOC contaminants at the Site are likely to remain sequestered by sorption within wastes soils and sediments at the Site for a very long time These contaminants to different degrees may eventually biodegrade Some volatilization of SVOCs will also occur
424 POTENTIAL EXPOSURE ROUTES
Humans may be exposed to Site contaminants through direct contact with waste or contaminated soil through consumption of contaminated groundwater through contact with (or ingestion of) contaminated surface water through inhalation of ambient or indoor air within the plume area or through consumption of organisms (including fish) from Site-area habitats
All of these exposure pathways have been evaluated through risk assessments and several of the more critical pathways have been addressed through institutional and engineering controls (see Sections 23 and 31)
17
43 DATA COMPLETENESS
While the available data do not precisely quantify the mass of buried waste the amount of NAPL present or the mass of contamination in the groundwater the data are sufficient to generally describe the conceptual site model including the delineation of contamination
18
50 FINDINGS
The observations provided below are the technical interpretations of the Optimization Team They are not intended to imply a deficiency in the work of the site managers but are offered as constructive information and opinions in the best interest of the EPA and the public
51 CONTAMINANT MASS AND LOCATION
Based on the draft FFS it is estimated that there are approximately 9 million pounds of VOCs present at the Site4 This total includes 88 million pounds for the North Disposal Area (NDA) 008 to 015 million pounds for the MDA and lower masses from the smaller disposal areas
By far most of the contaminant mass is within the footprint of the largest landfill area the NDA
At each landfill area the contamination is present within the buried waste which is approximately 5 to 20 ft below ground surface (bgs) Some of the contamination likely remains within intact or partially intact drums in the waste zone (Contamination within drums has been encountered during past drilling activities) The vadose-zone soil and saturated zone groundwater beneath the waste zone also have substantial contamination
A VOC plume in groundwater emanates from the landfill areas The plume covers 1700 acres and extends from the source areas to downgradient surface discharge points at creeks and wetlands
During its 6-year operation the GETS removed 796 million gallons of water and 110000 pounds of VOCs Thus on average the extracted water contained approximately 17000 microgL VOCs Based on the FFS plume map the portion of the plume between 2000 microgL and 40000 microgL (or higher) is approximately 950 acres If it is assumed that the average concentration in this part of the plume is 17000 microgL (the average concentration removed by the GETS) that the plume thickness is 50 ft and that the porosity is 30 percent the amount of VOC mass in the saturated zone is approximately 660000 pounds This does not include the mass present as NAPL in the saturated zone
NAPL is present at the Site in the vadose-zone and saturated zone This finding is based on the following facts
NAPL waste has been encountered during investigation Measured groundwater concentrations for carbon tetrachloride routinely exceed 1 percent
of solubility (8000 microgL) in many monitoring wells (some far from the source)
4 The mass estimates presented in this paragraph come from a draft Focused Feasibility Study for OU2 (Environ January 2012) reviewed by the Optimization Team and supported by independent calculations of reasonableness Environ has since reduced their mass estimate to 68 million pounds the basis for this reduction has not been reviewed by the Optimization Team
19
Deep vadose-zone soil gas concentrations are significantly elevated relative to background and ambient concentrations (particularly at the NDA)
The method of burial (drums of liquid waste from a chemical plant were dumped in trenches) would easily lead to widespread NAPL presence and
Carbon tetrachloride is denser than water (DNAPL) and thus tends to migrate down to and below the water table
It is difficult to estimate the mass of NAPL in the saturated zone Based on experience at other NAPL sites the mass of VOCs present in the saturated zone as NAPL may be similar to or greater than the mass present in dissolved form Thus it is possible that over 1 million pounds of VOCs are present in the saturated zone (dissolved plus NAPL mass) It is therefore estimated that at least 7 percent (dissolved only) and perhaps well over 10 percent of the total mass buried at the Site has already migrated to the saturated zone
52 RISKS FROM DIFFERENT AREAS OF CONTAMINATION
521 SOURCE AREAS
Human health direct exposure risks are low at the source areas because covers and caps are present over most of the buried waste and contaminated soil and because access to the area is limited by fencing and institutional controls
The SWSWDA does not yet have a multi-layer composite cap The PRPrsquos consultant (Environ) also recently noted that geophysical studies have identified some additional buried waste outside the previously-known waste footprint that has not been capped
A primary issue with the source areas is that they act as a continuing long-term source for groundwater contamination The source areas also contribute directly to ambient-air contamination especially close to the source areas
522 GROUNDWATER
Groundwater is contaminated above MCLs with carbon tetrachloride (primary risk driver) and chloroform between the source areas and the downgradient creek and wetland system which acts as a groundwater sink Concentrations of carbon tetrachloride are three to four orders of magnitude greater than the MCL throughout much of the plume (approximately 900 acres)
The groundwater plume is stable in size because the plume has already reached natural discharge locations groundwater beyond the bounding creeks (such as north of Clover Creek and east of Pugh Creek) is not contaminated and is not expected to become contaminated
There are approximately 35 homes currently within the plume boundary These homes have been provided with a clean public water supply and are not withdrawing groundwater for household use Institutional controls prohibiting use of groundwater (through property deed restrictions) have been implemented for most but not all of the properties within the plume
20
523 SURFACE WATER
Groundwater discharges to streams and streamside wetlands with concentrations of carbon tetrachloride above MCLs Dilution volatilization and (probably) biodegradation reduce concentrations measured in the streams
The highest concentrations of carbon tetrachloride in surface water are found in Pugh Creek and tributaries to Pugh Creek north of the source areas In 2010-2011 a concentration of 26000 microgL was measured in a small tributary to Pugh Creek A concentration of 6100 microgL was measured in 2004-2005 in Pugh Creek less than 1000 ft northwest of the NDA At that time concentrations persisted near and above 100 microgL from that point to the confluence with Clover Creek However concentrations in Clover Creek downgradient of the groundwater plume discharge locations were below MCLs and below water quality criteria for all surface-water use designations For carbon tetrachloride Tennessee water quality criteria are 5 microgL for surface water that may be used as a domestic water supply 16 microgL for recreational use (including fishing) of surface water (organisms only criteria) and 23 microgL for surface waters designated for both domestic and recreational use other water use designations do not have specific criteria for carbon tetrachloride
Despite the fact that surface-water concentrations exceed MCLs and certain surface-water criteria potential risks for recreational users exposed to surface water and fish at the Site were found to be acceptable in a 2011 risk assessment The affected surface waters are not used as a water-supply source
At least one residential property within the plume area has a pond that is filled (in part) using potentially contaminated water from Pugh Creek Residential exposure to contaminated ponds has not been fully evaluated as a potential exposure route
524 AMBIENT AIR
The ambient (outdoor) air at the Site has elevated levels of carbon tetrachloride A few measurements of ambient air concentration in 2007-2008 exceeded the risk-based screening level of 52 ppbv (which represents a 10-4 cancer risk using certain exposure and toxicity assumptions) presented in the 2008 Annual Ambient Air Report This ambient-air screening level was twice the presented indoor-air screening level of 26 ppbv based on an assumption that ambient air exposure is only applicable outdoors and that 12 hours per day are spent outdoors The OU2 FFS provides an updated risk-based criterion of 65 ppbv for ambient and indoor air based on a revised toxicity assessment for carbon tetrachloride published by the EPA in the Integrated Risk Information System in 2010
Within the immediate vicinity of the disposal areas (that is on the landfill property) elevated ambient air concentrations are likely caused by vapors emanating from the buried waste the contaminated soil in the vadose zone below the buried waste and (probably to a lesser extent) vapors emanating from contaminated saturated-zone groundwater Immediately adjacent to the landfill property (for instance along Old Toone Road due west of the disposal areas) it is likely that ambient air concentrations are caused by volatilization from groundwater and by
21
volatilization from the waste and vadose zone at the source areas It is noted that soil-gas samples near and west of the disposal areas show elevated concentrations in shallow soil gas and often show increasing soil-gas concentrations with depth suggesting volatilization from groundwater is potentially important
North of the landfill property it is likely that elevated ambient air concentrations are caused primarily by volatilization from contaminated groundwater and surface water Concentrations are generally higher in low-lying areas where the water table is relatively shallow and concentrations do not appear to be significantly correlated to either distance from the source areas or to wind direction There is little evidence to suggest that vapors emanating from the source areas contribute significantly to ambient air concentrations distant from the sources
Exposure to elevated ambient air concentrations can be controlled at the landfill property and at other PRP-owned land through access restrictions It is difficult or impossible to control exposure to ambient air at properties not owned or controlled by either the PRP or government
525 INDOOR AIR
Concentrations of carbon tetrachloride were detected above risk-based action levels at two homes within the groundwater plume Subsequently vapor mitigation systems were installed at each of these homes using a crawlspace vapor barrier and active venting to the atmosphere These systems are effective at mitigating indoor air risk for these two homes
A thorough set of indoor air monitoring data have been collected At present there are no other homes that have indoor air issues at the Site There remains a future risk of indoor air exposure at homes within the plume including homes that may be built in the future without vapor mitigation systems
53 EXISTING RISK-MITIGATION MEASURES
Several measures have been taken at the Site to reduce the potential for human exposure to Site contaminants These measures include
A clay cap was installed over the disposal areas on top of the existing waste cover to prevent direct exposure to the waste and to limit infiltration through the waste and underlying contaminated soil a multi-layer RCRA cap was subsequently installed on top of the clay cap to further isolate the waste and limit infiltration
Fences have been installed around the disposal areas to limit human access to the source areas
A public water supply was extended to the Site area to provide a clean water source for residents within the groundwater plume
Institutional controls to prevent groundwater use have been obtained for 56 of 60 parcels within the plume covering approximately 86 percent of the plume area
Indoor vapor mitigation systems have been installed to control indoor air concentrations at two homes
22
Each of these actions has had a positive effect in reducing the potential human exposure to Site contaminants particularly carbon tetrachloride The low-permeability landfill caps also reduce the amount of contaminant leaching to groundwater
54 POTENTIAL ADDITIONAL MEASURES TO ADDRESS LANDFILL SOURCES
(OU2)
541 OU2 FEASIBILITY STUDY
The January 2012 draft OU2 FFS provides a summary of several feasible remedial technologies that is helpful for assessing the relative merits of different potential remedial approaches The draft FFS also provides a feasibility-level evaluation of remedial alternatives relative to the NCP criteria The technologies and alternatives presented in the FFS cover an appropriate range of potential remediation approaches for this operable unit The Optimization Team reviewed the draft FFS in developing technical comments on SVE as a full-scale remedy for OU2 relative to other potential remedial alternatives
With the exception of cost the evaluations are presented in qualitative terms in the draft FFS comparisons of alternatives relative to each NCP criteria are presented in narrative form and summarized in a table (the alternatives are scored as good moderate or poor at meeting NCP criteria) Table 5-1 on the following page is a summary of the feasible remedial alternatives taken directly from the draft FFS5 with a few cells highlighted by the Optimization Team
With the exception of the no-action alternative (SA-1) all of the alternatives include construction of a cap over the SWSWDA maintenance of the landfill caps and controls to prevent access to the disposal areas (fences and property ownership with institutional controls) SA-4 includes these actions plus operation of SVE to remove a substantial portion of the VOCs present in the waste and vadose zones at all disposal areas SA-5 includes excavation of the waste layer with SVE for the underlying vadose zone the excavated waste would be consolidated in a new on-site engineered disposal cell with appropriate bottom liner and cap for more effective isolation
5 This table has been updated by Environ subsequently after Environ review of a draft of this report
23
Table 5-1 Remedial Alternatives Summary from the Draft FFS
Alternative SA-1 SA-2 SA-4 SA-5
Description No Action Access
Restriction amp Cap Maintenance
SA-2 + SVE
SA-4 + Excavation amp On-
Site Disposal Overall Protection of
Human Health and the Environment
Moderate Good Good Good
Compliance with ARARs Poor Poor Poor Poor
Long-Term Effectiveness and Permanence Poor Good Good Good
Reduction of Toxicity Mobility and Volume
through Treatment Poor Poor Moderate Moderate
Short-Term Effectiveness Poor Moderate Moderate Moderate
Implementability Good Moderate Moderate Poor
Total Present Value Cost of Alternative $02 M $15 M $545 M $3055 M
The draft FFS does not present a preferred alternative but discussions with the Site team have indicated that SA-4 (SVE with access restriction and cap maintenance) is the preferred alternative for a new OU2 Proposed Plan and ROD6
SVE has already been implemented in the SWDA as a pilot test and another SVE pilot test has begun at the SEDA and SWSWDA
542 COMPARING EFFECTIVENESS FOR ALTERNATIVES SA-4 AND SA-5
Environmental professionals are likely to differ in opinions regarding how the different alternatives compare to one another in relation to the NCP criteria and the qualitative ratings in the draft FFS table above do not fully elucidate the differences between alternatives although the FFS provides a discussion of many of the differences between the alternatives in the text In particular it may be useful to describe more fully the relative merits of alternatives SA-4 (SVE) and SA-5 (Excavation amp SVE) in a few of the categories where the two alternatives have identical ratings as highlighted in orange in the table above
6 Since completion of the optimization review and the initial draft of this report a ROD amendment has been completed for OU2 specifying SVE in all disposal areas
24
As indicated in the FFS evaluation the excavation action would in the long term result in a more certain and permanent isolation of much of the contamination present at the Site While the excavation would more permanently immobilize much of the mass there would actually be less mass treated (by SVE) under alternative SA-5
543 ARAR COMPLIANCE AND WAIVERS
The second criterion in the table Compliance with ARARs is also a threshold criterion under the NCP and CERCLA Any ARAR that cannot be met by a selected remedial alternative is required to be documented in an appropriate waiver The evaluation of ldquopoorrdquo for all alternatives in this category (blue highlighted cells in above table) requires additional explanation and a description of the type of waiver(s) that would be sought for the particular ARAR(s) not met While it is clear that neither SA-1 nor SA-2 will result in meeting the OU2 Soil Action Levels (SALs) the FFS text should provide further discussion especially for SA-4 and SA-5
It would be appropriate to state that none of the alternatives will result in meeting SALs for pesticides or SVOCs While SA-4 and (more so) SA-5 will result in significant long-term reductions in VOC concentrations it is also unlikely (in the opinion of the Optimization Team based on experience at and reviews of other sites) that SALs will be achieved permanently throughout the entirety of OU2 If the Site team believes that SALs will be met soil concentrations should be included as a measure of SVE performance
Since the OU2 remedial alternatives would not address existing groundwater contamination it would also be appropriate to note that groundwater surface-water ambient air and indoor air ARARs and cleanup levels will not be met by any of the alternatives but that these ARARs and levels will be addressed during selection of a remedy for OU1
544 SVE PILOT TEST
The SVE pilot test conducted from eight SVE well nests and at one additional SVE well at the SWDA over a period of 28 months (approximately 10000 operation hours) achieved significant contaminant mass removal The SVE pilot test removed approximately 31000 pounds of VOCs from the area and provided Site-specific data for design at the other disposal areas Based on the most recent information the Site team provided the effective lateral radius of influence was greater than expected (much greater than 100 ft)
545 ASSESSMENT OF SVE BENEFITS AND SHORTCOMINGS
The main benefit of SVE is to reduce the mass of VOCs in the waste and underlying vadose zone Based on preliminary information from the pilot test the PRPrsquos consultant estimates that approximately 85 percent of VOC mass at the source areas can be removed from the waste and vadose zone with SVE While the amount of mass removal will be substantial this removal percentage is higher than measured at other somewhat similar SVE sites and thus the Optimization Team believes that this estimate of mass removal is optimistic A more realistic estimate is 75 percent or less
25
A significant mass of VOCs as well as non-volatile contaminants will be left in place The remaining VOCs will continue to be a source of groundwater contamination through (1) vapor migration which is limited laterally by topography and vertically by the thick vadose zone and (2) liquid migration and leaching which is limited by the landfill caps
Due to the fact that a diminished source will remain and considering that there is already substantial mass in the saturated zone (some as DNAPL) it is unlikely that SVE will result in meaningful reductions in groundwater concentrations or consequent potential risks for present and future downgradient receptors for a period of many decades at least
546 SELECTION OF SVE AS OU2 FINAL REMEDY
The Optimization Team concurs with the Site team that SVE is the most cost-effective and implementable means by which contaminant mass can be removed at this Site
The Optimization Team also concurs with the Site team preference for SA-4 (SVE only) over SA-5 (excavation and SVE) based on the five balancing criteria long-term effectiveness and permanence short-term effectiveness reduction in toxicity mobility or volume of contaminants through treatment implementability and cost The Optimization Team also concurs that SA-4 will result in significant reduction in mass of VOCs at the Site and therefore addresses the NCP criteria for reducing contaminant toxicity mobility or volume through treatment whereas SA-2 does not
The significant cost increase for SA-4 relative to SA-2 would result in a significant reduction in VOC mass but would not be likely to reduce downgradient risks over a reasonable time frame The EPA TDEC PRP and other stakeholders may consider whether the benefit of reduced VOC mass with SVE is worth the substantial cost of implementation Per the NCP a remedy shall be deemed cost-effective if its costs are proportional to its overall effectiveness Cost effectiveness is determined by evaluating three of the balancing criteria (1) long-term effectiveness and permanence (2) reduction of toxicity mobility or volume through treatment and (3) short-term effectiveness to determine overall effectiveness and then overall effectiveness is compared to cost to ensure that the remedy is cost-effective
547 FS COST ESTIMATE FOR SA-4
The Optimization Team agrees with the relative total costs of alternatives and comparative analysis of costs in the draft FFS (shaded in green in Table 5-1) However our review suggests that the cost estimate could be refined and that overall costs should be significantly lower for SVE (SA-4) The overall reduction in cost (to perhaps $40M total net present value for SA-4) would increase the favorability of SA-4 relative to other alternatives
26
The following specific comments are provided for the SA-4 cost estimate presented in the draft FFS7
1 No source quote or discussion is provided for the $15 million thermal oxidization unit More detail should be provided including a vendor quote and backup information should be provided for estimated natural gas and maintenance labor costs The FFS should provide some rationale for use of thermal oxidation for the vapors at the NDA rather than VGAC with regeneration
2 No source or quote is provided for the blower units and there is some discrepancy between Table 8-4 and Appendix D of the draft FFS The $12 million capital cost and $889000year (yr) power costs are higher than the Optimization Team would expect based on experience The power costs are equivalent to greater than 1200 kilowatts (KW) at $008KW in continuous operation Assuming 75 percent motor efficiency this translates to three 400 horsepower (HP) motors This seems large for the flow rate (the vacuum was not specified but we assume it is about 60-in H2O) The Optimization Team is working at another site with three Tuthill Competitor Plus Model 6015-21L2 rotary blowers with 25 HP motors that provide 1000 cubic feet per minute (cfm) at 55-in H2O vacuum These cost less than $30000 each complete in 2007 and could be available for much less now A Roots 624 blower with a 100 HP motor could provide approximately 3000 cfm and could be purchased for under $50000 each
3 The MDA plus NDA phase 1 2 and 3 costs include about $790000 for on-landfill gas-probe monitoring points in addition to the 102 extraction wells per phase The cost estimate should provide a basis for the number of wells and probes taking into account the results of the SVE pilot test and the potential for extraction wells to serve also as monitoring points Fewer SVE wells and probes may be appropriate
4 Other costs that should be checked for MDA and the 3 NDA phases combined
a $270000 for security during drilling at a remote fenced site b $300000 for fencing around wells at a Site that already has a fence c $265000 for laboratory analysis of soil samples but it appears that only soil gas
levels during operation will be relevant for demonstrating performance
5 The construction management level of 32 is very high ($5 million total) We understand that the percentage is based on experience during the pilot test but the level of effort should decrease considerably for full-scale installation of the larger systems by more efficient contractor scheduling and higher production
7 Environ has subsequently modified some cost estimates and lowered the overall net-present-value cost estimate for SA-4 from $55 million to $50 million The FFS was finalized in June 2012 but the final FFS was not reviewed as part of this optimization review
27
6 $513000 of remedial design is included in Phase 2 and 3 of the NDA It is not clear why this would be needed after the blower and oxidizer will have been installed and well details are the same as the previous phases
7 The $98000month (page 2 of Table 8-4) cost for monitoring and reporting at the SDA MDA and NDA for the first 8 years of operation on top of two full-time operators at the NDA is very high It could be in the $50000month range
8 Generally the capital and operation and maintenance (OampM) costs are much higher than expected for the SVE system The total OampM costs (without discount) should probably be approximately $40 million
9 The 7 discount factor used from the 2000 FS guidance should be presented but it is too high for current economic conditions Thus an additional net-present-value calculation with a more reasonable discount factor should also be presented The Optimization Team has used 3 in recent work and 5 is the maximum that could be considered reasonable
55 GROUNDWATER CONTAINMENT AND RESTORATION (OU1)
Though not the main focus of this optimization review a few findings are presented below relative to OU1
551 IMPORTANCE OF THE GROUNDWATER PATHWAY
Most of the potential health and environmental risks at the Site are related to the groundwater contamination In addition to the potential future use of contaminated groundwater as a water source groundwater continues to supply contaminants to Pugh Creek Clover Creek other tributaries and wetlands Also a significant portion of the ambient and indoor air risks are driven by volatilization from contaminated surface water and groundwater
Even if the OU2 remedy is very effective at reducing VOC mass at the source areas the groundwater in OU1 will likely remain an issue for many years to come because
DNAPL is very likely present in the saturated zone and will remain a long-term source through dissolution and
The OU2 remedy will not completely remove the source of contamination to the saturated zone
552 PRIOR PUMP AND TREAT REMEDY
The GETS operated for 6 years (1997-2003) and removed 110000 pounds VOCs while treating 796 million gallons of water The average withdrawal rate of less than 250 gpm was much less than the design objective of 465 gpm
28
The extraction wells were screened in both the unconfined aquifer and in the underlying and relatively clean confined aquifer This design was not optimal and it resulted in withdrawal of a significant amount of clean water and may have contributed to the limited amount of contamination observed in the confined aquifer near the extraction wells Still the average concentration of VOCs in the influent was approximately 17000 microgL
The GETS treatment system consisted of in-well chlorination (to prevent biofouling) air stripping and GAC polishing GETS effluent was discharged to Pugh Creek Vapors were treated in a regenerative VGAC Operation and maintenance of the groundwater treatment system was challenging and costly
553 IMPROVED PUMP AND TREAT ALTERNATIVE
A pump and treat remedy for hydraulic containment is feasible However design changes should be considered if pump and treat is selected as a remedy A revised design would set up a hydraulic containment barrier line downgradient (north and northwest) of the source areas in the unconfined zone only As indicated in a draft EPA groundwater analysis memorandum approximately 400 gpm would be needed to capture the plume The aquifer can support this total pumping rate from multiple wells
The general treatment scheme used in the prior GETS would be appropriate but most of the existing equipment would likely be unusable due to age and inefficiency or would not be needed and the system should be redesigned and rebuilt for the expected flow rates and concentrations A more detailed review of operation and maintenance records from the prior GETS system could help define a more optimal treatment process design
The Optimization Team understands that the GETS VGAC regeneration system was no longer working and the system had solids filtering issues prior to its shutdown These issues could be addressed A non-regenerative VGAC system may be considered or even treatment of the water with GAC alone (no air stripper) These options would result in high GAC costs but system labor and maintenance would be reduced The solids filtration issue could be addressed by adding parallel bag filter sets before and after the air stripper
554 OTHER ALTERNATIVES FOR OU1
Other potentially viable alternatives likely exist for containing the groundwater plume nearer the source areas or otherwise preventing human exposure to groundwater Reasonable possibilities are presented in the 2007 Site-wide FS These alternatives include
A funnel-and-gate system using vertical barriers and permeable reactive barriers (PRBs) and
Acquisition of property within the plume
29
555 EXPECTED EFFECTIVENESS
Containment of the groundwater plume nearer the source through pump and treat or another remedy should be feasible However contamination will remain downgradient of the containment boundary and it will take a long time for MCLs to be attained The EPA estimates in a draft modeling memo that the time to reach MCLs downgradient of the containment boundary will be 100 years or more
Based on prior experience the Optimization Team would expect significantly reduced concentrations downgradient of a well-designed and well-operated containment system within a reasonable time frame Based on estimated groundwater travel time of 200 ftyr some positive effects (lower concentrations) of plume containment near the source areas could be realized throughout the plume within 30 years While it would likely take a very long time to reach MCLs downgradient of the containment system risks (from groundwater surface-water and air exposure) would be substantially reduced much sooner
56 SITE EXIT STRATEGY
The overall exit strategy for this Site is unclear According to the RODs the goal is to reduce concentrations to MCLs and reduce soil concentrations to SALs (at least outside the caps) These goals would take many decades (at least) to attain With the GETS out of operation there is no current remedial action for groundwater and it does not appear that SVE systems contemplated for OU2 will achieve all remedial goals without other actions It is likely that any remedy will take at least a few decades to achieve all remediation goals
57 ENVIRONMENTAL FOOTPRINTS OF REMEDIAL MEASURES
Environmental footprints are typically evaluated for operating remedies (such as pump and treat systems) in an effort to determine if operations can be adjusted in a manner that will reduce the ongoing environmental footprint (such as through reduced energy use) At this Site there are no ongoing energy-intensive operations and no long-term operations are planned The SVE systems contemplated for OU2 will result in significant energy usage and there will be an environmental footprint associated with this remedy However it would be premature to estimate the environmental footprint prior to remedy selection and design
58 HEALTH AND SAFETY
This Site presents substantial job safety hazards for the Site field teams that must be managed The presence of hazardous contaminants in buried waste presents both a direct exposure and explosive-vapors threat Level B personal protective equipment (PPE) which includes supplied-air respirators is used for subsurface-disturbance activities within the disposal areas and soil vapors must be monitored for potentially explosive conditions
The use of Level B PPE limits the mobility and senses of the field personnel presenting practical hazards that must be taken into account when developing and implementing work tasks
30
60 RECOMMENDATIONS
Several recommendations are provided in this section related to remedy effectiveness cost control technical improvement and site exit strategy The recommendations are listed in Table 6-1 Note that the recommendations are based on an independent technical review and represent the opinions of the Optimization Team and in no way commit the EPA to accept or implement such recommendations These recommendations do not constitute requirements for future action but rather are provided for consideration by the Region While the recommendations provide some details to consider during implementation the recommendations are not meant to replace other more comprehensive planning documents such as work plans sampling plans and quality assurance project plans
Cost estimates provided herein have levels of certainty comparable to those done for CERCLA feasibility studies (+50-30 percent) and these cost estimates have been prepared in a manner generally consistent with EPA 540-R-00-002 A Guide to Developing and Documenting Cost Estimates During the Feasibility Study July 2000 The costs presented do not include potential costs associated with community involvement activities that may be conducted prior to field activities
61 RECOMMENDATIONS TO IMPROVE EFFECTIVENESS
As noted in the 2011 Five-Year Review Report the selected remedies for OU1 and OU2 did not meet their stated remedial goals and are not protective of human health and the environment Therefore for both OUs a new remedial strategy is needed
611 COMPLETE THE OU2 REMEDY DECISION WITH CLEAR RAOS
A new remedy for OU2 is needed The EPA has progressed on this and is close to formally proposing SVE as the new OU2 remedy along with a cap over the SWSWDA and other uncapped material maintenance of all caps and access restrictions8 SVE has already been implemented as a pilot study and interim measure for the SWDA
It may be appropriate to implement the SWSWDA cap portion of the remedy as an interim measure to avoid potential administrative delays Also it would be appropriate to cap any newly discovered area of buried waste outside the existing cap footprints (Based on communication from Environ there has been such a discovery since the Site visit by the Optimization Team)
Implementing SVE at all disposal areas will result in a significant reduction in VOC mass but (absent other actions) will not be likely to reduce downgradient risks for the next several decades
8 Since completion of the optimization review and the initial draft of this report a ROD amendment has been completed for OU2 specifying these remedial actions
31
An important part of the remedy decision for OU2 will be setting remedial action objectives (RAOs) that are consistent with the overall Site remedy strategy are achievable and are protective of human health and the environment If the RAOs are set to achieve SALs similar to those set in the original OU2 ROD or if RAOs are set to attain MCLs in groundwater near the sources then it is unlikely that any OU2 remedy will meet these RAOs The remedy at OU2 should also not be counted on to eliminate ambient-air risks outside the landfill property
One goal of the remedy should be to eliminate any potential direct contact risk at the source areas This goal will be met by the OU2 remedy through capping maintenance and access restriction An additional goal would be to reduce the mass of VOCs at the source areas to the extent practicable Based on the analysis in the draft FFS and the review of the Optimization Team SVE would be the cost-effective way to attain this goal and would allow performance objectives to be stated in terms of achieving attainable mass removal rates and stopping SVE operation when mass removal rates are very low
If SVE is implemented the Site team should consider whether SVE shutoff should be based on removing a certain number of pore volumes or rather on reaching a point of negligible mass removal rate as compared to that observed in the pilot test or observed during the initial period of SVE operation
612 EVALUATE GROUNDWATER REMEDIAL ALTERNATIVES AND IMPLEMENT AN OU1
REMEDY
The GETS that was constructed and operated per the OU1 ROD operated for six years and was shut down in 2003 As explained in Section 552 that system had design flaws and operational issues There is presently no system to remediate groundwater or to reduce ongoing discharges of groundwater contamination to surface waters and the ambient air
The FS completed by Environ in 2007 included assembly and evaluation of several remedial alternatives to address groundwater contamination That FS is a good starting point for an updated evaluation of potential remedies for OU1
Data and modeling show that it may not be technically practicable to meet MCLs downgradient of the landfill property for several decades However it should be possible to substantially decrease the potential risks to current and future receptors through implementation of a well-designed OU1 remedy
In particular the Optimization Team believes the EPA should give careful consideration to the following general remedial actions (see Sections 553 and 554)
1 Limitation of access to properties within the plume area and to the adjoining streams (Note This consideration is provided by the Optimization Team In discussions during the optimization process the EPA and TDEC stated that they are not considering this as a potential option)
2 In-situ groundwater treatment and containment using a PRB in a funnel-and-gate system
32
3 Redesigned pump and treat system near the downgradient end of the landfill property with approximately 400 gpm extraction for hydraulic capture and a redesigned treatment system
613 CONTINUE TO IMPROVE PROPERTY CONTROLS
Exposures can effectively be eliminated by controlling access to property and contaminated media within the property To that end it is appropriate for the EPA and PRP to continue to seek institutional controls for the remaining few properties in the plume that do not yet have such a control The PRP may also consider acquiring additional property
614 CONTINUE TO MONITOR AMBIENT AIR AND INDOOR AIR
The ambient air data collected in 2008 suggest that residential air exposures are likely within the -6 -4 acceptable 10 to 10 risk range when concentrations are appropriately averaged over time and
over reasonable exposure areas However there were several instances where measurements of ambient-air concentration exceeded the previous risk based action level set at a 10-4 risk level As noted in Section 631 action levels for ambient and indoor air should be clearly established
Also given high soil-gas concentrations in the plume area and given some elevated indoor-air concentrations periodic monitoring of indoor air would be appropriate for existing and future buildings in the plume area
It would likely be prudent to install vapor barriers for any new buildings constructed in the plume area
Additional air quality data should be gathered to supplement the data collected in 2008 in order to better define the potential human health risks from ambient air and indoor air See also Section 631
62 RECOMMENDATIONS TO REDUCE COSTS
In a typical optimization review ongoing annual costs incurred by the sponsoring organization are reviewed and recommendations are made on ways these costs can be reduced through optimization In this case the sponsoring organization (the EPA) is not the Site operator furthermore there are no systems currently in place requiring significant long-term operation and maintenance effort or cost
However since the EPA Superfund program may end up with significant financial obligations at this Site during and after implementation of new remedies for OU2 and OU1 the Optimization Team does make two recommendations for controlling costs during future remedial actions
33
621 EVALUATE OU2 IMPLEMENTATION COSTS DURING REMEDIAL DESIGN
As noted in Section 547 the optimization review identified several items in the draft FFS cost estimate for SA-4 (SVE with SWSWDA cap cap maintenance and access controls) that should be checked carefully for potential opportunities to substantially reduce costs during implementation of SVE9
While it may not be important for the FFS to be more accurate on costs (because improved accuracy would not likely change the remedy decision) it will be important for the financially responsible organization(s) to carefully consider these costs during the remedial design and procurement process Actual costs for this remedy should be considerably lower than listed in the draft FFS
622 SET PERFORMANCE GOALS FOR SVE
As discussed in Section 611 it will be important to set reasonable performance measures for SVE (if implemented) so that the system can be shut down when it is no longer serving the purpose of substantially reducing VOC mass The Site team should consider whether SVE shutoff should be based on removing a certain number of pore volumes or rather on reaching a point of negligible mass removal rate as compared to that observed in the pilot test or observed during the initial period of SVE operation
63 RECOMMENDATIONS FOR TECHNICAL IMPROVEMENT
A few recommendations are provided that could help in interpreting and managing data associated with the Site and with assisting future evaluations
631 DEFINE AND DOCUMENT ACTION LEVELS FOR AMBIENT AIR AND INDOOR AIR
In various documents the risk-based criteria for ambient air and indoor air have been changed apparently based on different exposure assumptions and a recent (2010) update to the EPArsquos toxicity information (see Section 524) The acceptable air concentrations particularly for carbon tetrachloride should be formally set by the EPA In setting these levels for ambient air it may be appropriate to consider the validity of an assumption that had previously been made when developing such criteria that time spent indoors but within the groundwater plume area can be ignored (even where there is no vapor mitigation system installed) Such an assumption can lead to a higher acceptable concentration for ambient air than for indoor air which is counterintuitive
The carbon tetrachloride concentration of 65 ppbv (41 micrograms per cubic meter [microgm3] at 25degCelcius) identified as the appropriate risk-based criterion by Environ in the OU2 FFS is
-4 -6 estimated to result in a 10 excess cancer risk and therefore within the CERCLA risk range (10to 10-4) this value is calculated based on toxicity information in IRIS and an assumption of 30 years of exposure for 350 daysyear and 24 hoursday
9 After reviewing a draft of this optimization review Environ lowered the cost estimate for SA-4
34
632 DEFINE A GROUNDWATER MONITORING PROGRAM
A defined groundwater monitoring program should be documented and followed The goal of the monitoring would be to confirm that the plume remains stable Annual sampling of a subset of available monitoring wells would be appropriate The monitoring program could be adapted in the future as needed
633 ESTABLISH AND USE A DATA MANAGEMENT SYSTEM
Data from the Site including relevant data collected by PRP contractors USGS and TDEC should be stored in an electronic data management system to improve data availability and accessibility This will improve the efficiency for any future technical evaluations at the Site The cost for setting up the data management system should be less than $10000 Management of the system will require some labor but it is expected that additional labor costs will be entirely offset by improved efficiency in reporting of analyses
64 CONSIDERATIONS FOR ACHIEVING SITE CLOSE OUT
The effectiveness recommendations listed in Section 61 were selected because they are likely to be helpful in initiating progress toward exiting the Site Additional exit-strategy-related recommendations are provided below
641 DEVELOP A SITE EXIT STRATEGY
The overall Site exit strategy should involve either
1 Mitigation of potential risks to existing and future receptors through reduction of groundwater concentrations downgradient of source areas to the extent practicable or
2 Elimination of long-term exposures (to residences) in the plume area and at discharge waters with land-use controls
In either case the exit strategy will involve ongoing plume monitoring and management to ensure that the plume does not expand and ongoing source management (such as through cap maintenance)
642 UPDATE THE OU1 AND OU2 RODS
New RODs should be developed for both OU1 and OU2 These RODs should be clear in RAOs about how the implemented remedies will protect human health and the environment and should indicate where and why certain ARARs (such as MCLs) can or cannot be achieved If it is found to be technically impracticable to achieve the MCL it may be appropriate to seek an ARAR waiver
By documenting the Site strategy and clear RAOs in new RODs it will be possible to execute remedial actions at the Site and later demonstrate successful remediation
35
65 RECOMMENDATIONS RELATED TO GREEN REMEDIATION
No specific recommendations are provided for improved green and sustainable remediation at this Site However the Site team should consider means for minimizing the footprint of remedies considered for OU1 and OU2 During remedy implementation preference should be given to green remedial measures such as technologies and options that will result in lower energy use lower atmospheric emissions of contaminants and lower waste volumes that would minimize the footprint of the selected remedy
66 SUGGESTED APPROACH TO IMPLEMENTING RECOMMENDATIONS
A preliminary decision on Site exit strategy (see Section 641) should be made in the near term base on available information by weighing the costs benefits policy compliance and stakeholder perceptions associated with different conceptual approaches At the time this review was conducted the decision document for OU2 (source control) had not yet been finalized10
Formalizing and implementing a groundwater monitoring program (see Section 632) should also be completed in the near term
Recommendations in Section 611 622 and 642 should be considered when formalizing the remedy decisions and establishing RAOs During OU2 design there will likely be opportunities to reduce costs (see Section 621) and reduce the environmental footprint of the remedial action (see Section 65)
A remedy decision for OU1 may require additional evaluation and perhaps additional studies such as for effectiveness of PRB media) that could take 12 to 18 months to complete The recommendations in Sections 612 and 642 should be taken into account when developing RAOs and formalizing the remedy decision
An ongoing ambient and indoor air monitoring program (see Section 614) could be established within a few months This should be done in concert with defining an acceptable ambient air concentration (see Section 631)
Establishment of a data management system (Section 633) should be implemented in the near term and used as the central repository for past and future environmental data This action will be more time critical if and when the EPA Superfund program takes on greater responsibility for remedy implementation
Improvement of property controls (Section 613) should be on ongoing activity
10 Since completion of the optimization review and the initial draft of this report a ROD amendment has been completed for OU2
36
Table 6-1 Recommendations Summary
Recommendation Reason Change in Cost
611 Complete the OU2 Remedy Decision with Clear Effectiveness Not Quantified RAOs 612 Evaluate Groundwater Remedial Alternatives and Effectiveness Not Quantified Implement an OU1 Remedy
613 Continue to Improve Property Controls Effectiveness Not Quantified
614 Continue to Monitor Ambient Air and Indoor Air Effectiveness Not Quantified
621 Evaluate OU2 Implementation Costs during Cost Reduction See Section 547 Remedial Design
622 Set Performance Goals for SVE Cost Reduction Not Quantified
631 Define and Document Action Levels for Ambient Technical Not Quantified Air and Indoor Air Improvement Technical 632 Define a Groundwater Monitoring Program Not Quantified Improvement Technical 633 Establish and Use a Data Management System Not Quantified Improvement
641 Develop a Site Exit Strategy Site Close Out Not Quantified
642 Update the OU1 and OU2 RODs Site Close Out Not Quantified
65 Consider Green Remediation Measures to Minimize Green Remediation Not Quantified the Footprint of the Selected Remedy
Due to the nature of this review cost impacts were generally not quantified An OU2 ROD has been issued since this report was drafted
37
ATTACHMENT A
L0
0_C
AD
FIL
ES
21
LeP
etm
n Fe
asib
ility
Stu
dy U
pdat
e 21
-110
10B
441
-1_S
ite L
ocat
ion
Map
dw
g
SITE LOCATIONSITE LOCATION OLD TOONE RDOLD TOONE RD
TREATMENT PLANT
NORTHNORTH DISPOSAL AREADISPOSAL AREA
MIDDLEMIDDLEAA DISPOSAL AREADISPOSAL AREA
SOUTHEASTSOUTHEAST DISPOSAL AREADISPOSAL AREA
SOUTHWEST-SOUTHWESTSOUTHWEST-SOUTHWEST SOUTHWESTSOUTHWESTDISPOSAL AREADISPOSAL AREA DISPOSAL AREADISPOSAL AREA
1 12 0 1 MILE
2000 0 2000 4000 6000 FEET
1 0 1 KILOMETER
CONTOUR INTERVAL 20 FEETSOURCE USGS 7minute series topographicTeagueTennessee 161Photorevised 11Bolivar EastTennessee 161Photorevised 13
Figure SITE LOCATION MAP
HARDEMAN COUNTY LANDFILL
Drafter APRELS Date 11612 Contract Number 21-11010B44 Approved DTH Revised
1-1
TOONE
ROAD
OLD
PUGH CREEK OLD TOONE ROAD
PUGH CREEK
GRAVEL ROAD FORMER ILLINOIS
GULF RAILROAD
GRAVEL ROAD
FORMER ILLINOIS GULF RAIL
CLOVER CREEK
CLO
VER C
REEK
GETS TREATMENT PLANT
EW-1
EW-3
EW-4A EW-4BEW-10M
EW-5M
EW-6M
EW-7
EW-8M
EW-9
LEGEND
LL
oop
Pro
ject
File
s00
_CA
D F
ILE
S2
1Le
Pet
mn
Third
Fiv
e-Y
ear R
evie
w 2
1-11
010B
40F
igur
es_F
eb 2
011
B-3
_GE
TS E
xrac
tion
Wel
l Lay
outd
wg
EW-1
EW-7
EW-4B
237 ACRE LANDFILL PROPERTY BOUNDARY
SITE BOUNDARY
DISPOSAL AREAS
ABANDONED EXTRACTION WELL
UNCONFINED AQUIFER EXTRACTION WELL
CONFINED AQUIFER EXTRACTION WELL
EXTRACTION WELL FORCEMAINS
SOURCE CONTROL EXTRACTION WELLSSCALE IN FEET
PLUME REDUCTION EXTRACTION WELLS 0 1600
Figure GETS EXTRACTION WELL LAYOUT
HARDEMAN COUNTY LANDFILL B-3 Drafter APRELS Date 022211 Contract Number 21-11010B40 Approved DTH Revised
OLD TOONE RD
PUGH CREEK
PUGH CREEK
VADOSE ZONE UNSATURATED SAND
1000S OF FEET
1000S OF FEET
GROUND WATER FLOW DIRECTION
LOWER CLAY UNIT
UPPER CLAY UNIT
LOWER CLAY UNIT
UPPER CLAY UNIT
UNCONFINED AQUIFER
LOWER SAND UNIT WITH
WATER UNDER PRESSURE
BASAL AQUITARD
INTERMEDIATE AQUITARD UNCONFINED AQUIFER
CONFINED AQUIFER
LOWER SAND UNIT WITH
WATER UNDER PRESSURE
UPPER SAND UNIT WITH WATER
BASAL AQUITARD
LEAKY CONFINED AQUIFER
INTERMEDIATE AQUITARD UPPER SAND UNIT WITH WATER
DISPOSAL
LANDFILL CAP
WASTE
VOCs OFF-GASSING FROM WASTE DISPOSAL AREA AT
LANDFILL CAP FLANKS
VOCs OFF-GASSING FROM GROUND WATER SEEPS
AND SURFACE WATER
CONTAMINATION
VOCS OFF-GASSING FROM CONTAMINATED GROUND WATER
CUTAWAY VIEW CLOVER CREEK
LEGEND
WATER TABLE
VOLATILE ORGANIC COMPOUND (VOC) CONTAMINATION 125-250 FEET
VADOSE ZONE - UNSATURATED SAND
AQUIFER - SAND UNIT WITH WATER
INTERMEDIATE AQUITARD - UPPER CLAY UNIT
BASAL AQUITARD - LOWER CLAY UNIT
LL
oop
Pro
ject
File
s00
_CA
D F
ILE
S2
1Le
Pet
mn
Third
Fiv
e-Y
ear R
evie
w 2
1-11
010B
40F
igur
es_F
eb 2
011
B-4
_Site
Con
cept
ual V
iew
(3-D
)-A
ltern
ate
dwg
NOT TO SCALE
Figure SITE CONCEPTUAL MODEL HARDEMAN COUNTY LANDFILL B-4
Drafter APRELS Date 22311 Contract Number 21-11010B40 Approved DTH Revised
OLD
PUGH CREEK
OLD TOONE ROAD
PUGH CREEK
CLOVER CREEK
CLO
VER C
REEK
E
N S
GETS TREATMENT PLANT
W
LEGEND
SITE BOUNDARY
DISPOSAL AREA
GROUNDWATER USE AND SUBSURFACE DISTURBANCE RESTRICTION AGREEMENT - SIGNED
TOONE GROUNDWATER USE RESTRICTION AGREEMENT - SIGNED
PROPERTY OWNERS UNWILLING TO GRANT LAND USE DEED RESTRICTIONS
TRUST OWNED PROPERTY
PENDING GROUND-WATER USE RESTRICTION AGREEMENT
LL
oop
Pro
ject
File
s00
_CA
D F
ILE
S2
1Le
Pet
mn
Feas
ibili
ty S
tudy
Upd
ate
21-1
1010
B44
2-3
_GW
Use
Res
trict
ion
Pro
perty
Map
dw
g
APPROX SCALE (ft)
0 2000
Figure GROUNDWATER USE RESTRICTION PROPERTY MAP
HARDEMAN COUNTY LANDFILL 2-3 Drafter ELS Date 41712 Contract Number 21-11010B44 Approved DTH Revised
A
LL
oop
Pro
ject
File
s00
_CA
D F
ILE
S2
1Le
Pet
mn
Third
Fiv
e-Y
ear R
evie
w 2
1-11
010B
40F
igur
es_F
eb 2
011
B-9
_SW
DA
SV
E P
ilot T
est L
ayou
tdw
g
LEGEND
THREE 6Oslash HDPE SDR-11 SVE MAIN
THREE 6Oslash HDPE SDR-11 SVE LATERAL
CHAIN LINK FENCE
SHALLOW SVE WELLWELL HEAD CONNECTION WITH CLEAN OUT
INTERMEDIATE SVE WELLWELL HEAD CONNECTION WITH CLEAN OUT
DEEP SVE WELLWELL HEAD CONNECTION WITH CLEAN OUT
0
APPROX SCALE (ft)
60
SOIL GAS MONITORING PROBE
VAPOR FLOW DIRECTION
SWDA SVE PILOT TEST LAYOUT HARDEMAN COUNTY LANDFILL
Figure
B-9 Drafter ELS Date 22311 Contract Number 21-11010B40 Approved DTH Revised
500
0
5000
ROAD
OLD
PUGH CREEK
OLD TOONE ROAD
PUGH CREEK
GRAVEL ROAD FORMER ILLINOIS GULF RAILROAD
GRAVEL ROAD
FORMER ILLINOIS GULF RAILROAD
CLOVER CREEK
CLO
VER C
REEK
5
5 00
5 0
5 0 0
5
50
GETS TREATMENT PLANT
GM-3EMW-10 EPZ-4A1
EPZ-1B EPZ-4A2 EPZ-1A R RES-58CRA-6BEPZ-5B CRA-6A EMW-7 EMW-6EPZ-5A1 EMW-9 CRA-3BEPZ-5A2 GM-9AEPZ-2A EMW-8
CRA-16EPZ-3A1 EW-4ACRA-8BEPZ-3A2 GM-5 CRA-12BCRA-8A
EW-10M EW-5M EW-7
EW-6MGM-1
EMW-2EMW-3 EMW-16CRA-1B
CRA-2A EMW-1CRA-2B EMW-15 EMW-12
EMW-4EW-8M EMW-14
CRA-17B RES-15 R
TOONE
EMW-13 EMW-17
CRA-19B EMW-5CRA-19A GM-2
CRA-11B RRES-60
CRA-20B LEGEND
CRA-14B
237 ACRE LANDFILL PROPERTY BOUNDARY
gt 5000 ȝgL
SITE BOUNDARY
EMW-11 DISPOSAL AREAS 500 - 5000 ȝgL
MONITORING WELL
EXTRACTION WELL 50 - 500 ȝgL
APPROX SCALE (ft)
1800
R RESIDENTIAL WELL 5 - 50 ȝgL
PIEZOMETER
LL
oop
Pro
ject
File
s00
_CA
D F
ILE
S2
1Le
Pet
mn
Third
Fiv
e-Y
ear R
evie
w 2
1-11
010B
40F
igur
es_F
eb20
11B
-13_
CT
Unc
onfin
ed A
quife
r Iso
con
Plum
e M
ap 2
008-
2010
dw
g
NOTE CARBON TETRACHLORIDE PLUME DRAWN USING PROFESSIONAL JUDGEMENT QUADRANGLE 1961 PHOTOREVISED 1981 USGS TOPOGRAPHIC MAPS SOURCE BO LIVAR EAST QUADRANGLE 1961 PHOTOREVISED 1983 AND TEAGUE
BASED ON 2008 2009 AND 2010 SAMPLING DATA
FigureCARBON TETRACHLORIDE UNCONFINED AQUIFER ISOCONCENTRATION
PLUME MAP 2008 -2 010 HARDEMAN COUNTY LANDFILL
Drafter APRELS Date 22311 Contract Number 21-11010B40 Approved DTH Revised
B-13
0
TOONE
ROAD
OLD
PUGH CREEK
OLD TOONE ROAD
PUGH CREEK
GRAVEL ROAD FORMER ILLINOIS GULF RAILROAD
GRAVEL ROAD
FORMER ILLINOIS GULF RAILROAD
CLOVER CREEK
CLO
VER C
REEK
560
ESB-9 GM-9A EMW-7 ESB-4 ESB-3 ESB-16 05
ESB-12 CRA-16 EW-7 CRA-6B ESB-7 EMW-8 8800 5400 2700 380005 03 05 05 340 05 05 31010000 3800 10000 11000 2800 70000505 05 03 05
940005 08 1004800 12000 16000 1800008 08 05 08 110008920008
CRA-10A CRA-10B
GETS TREATMENT ESB-6 PLANT 05 260
EPZ-5A1 EMW-10EPZ-4A1 EPZ-1A EPZ-4A2
10 GM-3 GM-9A CRA-4ACRA-7EPZ-3A1 EPZ-1B CRA-3A CRA-4B EMW-7 CRA-3B10 93 EPZ-5A1EPZ-2A CRA-6B
EMW-6EPZ-3A2 ESB-9CRA-18B EMW-8 ESB-2 10 620 05 230EW-3EPZ-3A1 CRA-16CRA-8A ESB-12EPZ-3A2CRA-8B ESB-7CRA-8B EMW-2
210005EW-4A05 79 ESB-4EMW-10M08 014 U 540008
EW-7 CRA-12AEW-5M10 061 J
CRA-8A GM-5 CRA-12B ESB-1
2100GM-1 05EW-6M ESB-6 ESB-2ESB-3 ESB-16480005 CRA-1B
03 670 2300 EMW-3 EMW-208
ESB-1270010
EMW-10M 350005EMW-12 EMW-16 330008EW-8MCRA-9140003 CRA-2A EMW-4 CRA-1B EMW-14CRA-17A EMW-1CRA-2BCRA-17B EMW-1EMW-12
EMW-15 05 12 08 340 09 160
05 59 08 42
EW-8M CRA-19B EMW-13120003 EMW-17EMW-5 GM-2CRA-17B
03 1100 05 640 08 870
CRA-11A CRA-17A CRA-11B
03 140
CRA-19B 03 3000 CRA-20B
05 2800 08 5900 CRA-14A
CRA-20B 03 460 05 590
CRA-14B CRA-13A CRA-13B
LEGEND
237 ACRE LANDFILL PROPERTY 08 1100
EW-4A EW-5M GM-2 GM-1 EW-6M GM-05 CRA-2A EMW-5 EMW-3 EMW-4 BOUNDARY
03 08
14000 40000
08 EMW-11
37000 03 470 05 420 08 450
03 05 08
5000 6300
19000
08 5200 03 05 08
3500 19000 33000
03 05 08
280 17
100
05 08
10 U 130
05 08
180 190
05 08
2700 1400
SITE BOUNDARY
DISPOSAL AREAS
CRA-2B 2100 =DETECTED RESULT IS ABOVE THE MONITORING WELL500003 GRL OF 5 μgL410005 SOIL BORING 500008 μgL =MICROGRAMS PER LITER
PIEZOMETER
LL
oop
Pro
ject
File
s00
_CA
D F
ILE
S2
1Le
Pet
mn
Third
Fiv
e-Y
ear R
evie
w 2
1-11
010B
40F
igur
es_F
eb 2
011
B-1
5_C
T U
ncon
fined
Aqu
ifer G
W R
esul
ts fo
r 200
3-20
10d
wg
APPROX SCALE (ft) GRL =GROUNDWATER REMEDIATION NO DETECTION ORLEVEL FROM RECORD OF DECISIONNOTE GRL FOR CARBON TETRACHLORIDE IS 5 μgL WHICH IS DETECTION BELOW GRL
0 2000 EQUIVALENT TO THE USEPA MAXIMUM CONTAMINANT LEVEL (MCL) FOR OPERABLE UNIT No 1
FigureCARBON TETRACHLORIDE UNCONFINED AQUIFER GROUNDWATER RESULTS FOR 2003 - 2010 B-15HARDEMAN COUNTY LANDFILL
Drafter ELS Date 22411 Contract Number 21-11010B40 Approved Revised
TOONE
ROAD
OLD
PUGH CREEK
OLD TOONE ROAD
PUGH CREEK
GRAVEL ROAD FORMER ILLINOIS GULF RAILROAD
GRAVEL ROAD
FORMER ILLINOIS GULF RAILROAD
CLOVER CREEK
CLO
VER C
REEK
CRA-5A EW-4B 290003 87 03 320005 180 08
08 220
GETS TREATMENT PLANT
CRA-6A CRA-5A
CRA-18A
EW-4B EW-10OBS1
CRA-1A
CRA-19A
CRA-20A
LEGEND2100 =DETECTED RESULT IS ABOVE THE GRL OF 5 μgL 237 ACRE LANDFILL PROPERTY
BOUNDARY
SITE BOUNDARYμgL =MICROGRAMS PER LITER DISPOSAL AREAS
LL
oop
Pro
ject
File
s00
_CA
D F
ILE
S2
1Le
Pet
mn
Third
Fiv
e-Y
ear R
evie
w 2
1-11
010B
40F
igur
es_F
eb 2
011
B-1
6_C
T Le
aky
Con
fined
Aqu
ifer G
W R
esul
ts fo
r 200
3-20
10d
wg
APPROX SCALE (ft) GRL =GROUNDWATER REMEDIATION MONITORING WELL
LEVEL FROM RECORD OF DECISION NO DETECTION ORNOTE GRL FOR CARBON TETRACHLORIDE IS 5 μgL WHICH IS FOR OPERABLE UNIT No 1 DETECTION BELOW GRL0 2000 EQUIVALENT TO THE USEPA MAXIMUM CONTAMINANT LEVEL (MCL)
FigureCARBON TETRACHLORIDE LEAKY CONFINED AQUIFER GROUNDWATER RESULTS FOR 2003 - 2010 B-16HARDEMAN COUNTY LANDFILL
Drafter ELS Date 22411 Contract Number 21-11010B40 Approved DTH Revised
GRAVEL ROAD
FORMER ILLINOIS GULF RAILROAD
O L D T O O N E R O A D
PUGH CREEK
LL
oop
Pro
ject
File
s00
_CA
D F
ILE
S2
1Le
Pet
mn
Third
Fiv
e-Y
ear R
evie
w 2
1-11
010B
40F
igur
es_F
eb 2
011
B-1
9_Lo
catio
ns o
f OU
2 V
ados
e Zo
ne S
AL
Exc
eeda
nces
dw
g
NS-01 NORTH DISPOSAL AREA
(NDA)
MIDDLE DISPOSAL AREA (MDA)
ESB-4
SOUTHEAST DISPOSAL AREA
ESB-6 (SEDA)
ESB-3 ESB-17 ESB-16 ESB-2
SOUTHWEST DISPOSAL AREA (SWDA)
ESB-1
LEGEND
237 ACRE LANDFILL PROPERTY BOUNDARY
SITE BOUNDARY
DISPOSAL AREAS
ESB-1 2005 SOIL BORING
0
APPROX SCALE (ft)
800
NS-01 DEEP NESTED SOIL MONITORING PROBE (3 DEPTHS)
LOCATIONS OF OU2 VADOSE ZONE SAL EXCEEDANCES HARDEMAN COUNTY LANDFILL
Figure
B-19 Drafter ELS Date 22311 Contract Number 21-11010B40 Approved DTH Revised
022 AA-32
011 AA-31
LL
oop
Pro
ject
File
s00
_CA
D F
ILE
S2
1Le
Pet
mn
Third
Fiv
e-Y
ear R
evie
w 2
1-11
010B
40F
igur
es_F
eb 2
011
B-2
0_S
umm
ary
of M
ean
CT
AA
Res
ults
dw
g
043 AA-30
LEGEND
237-ACRE LANDFILL PROPERTY023 AA-29 036 AA-27 038 AA-43 031 AA-26 BOUNDARY
018 AA-28
SITE BOUNDARY
028 AA-01 MIDDLE LANDFILLNORTH LANDFILL DISPOSAL AREAS
AA-40 061 DISPOSAL AREADISPOSAL AREA MEAN CARBON TETRACHLORIDEAA-23 SOUTH LANDFILL CONCENTRATION15AA-08 25 AA-21 DISPOSAL AREA27 AA-22AA-02 093 24 AA-47
0 - 075 ppbv 073 11 AA-04
10 AA-24 AA-1812 AA-2061 AA-48 AA-03 24 075 - 15 ppbv
AA-06 064 AA-25 031 37 AA-51048 032 AA-44014 AA-09 AA-19 096079 AA-05 22 13 AA-16
27 AA-15 gt 15 ppbvAA-17 076 AA-10
083AA-50054 082080 AA-11 NOTES020 AA-45 AA-12 AA-49 1 RESULTS ARE IN PARTS PER BILLION BY070 AA-39 070 AA-13 VOLUME (ppbv)
2 CALCULATED USING THE 95 UCL OF THE057 AA-33 056 AA-42 MEAN ( t 5 DETECTIONS OF CARBON
TETRACHLORIDE PER LOCATION)023 AA-34
3 = MAXIMUM DETECTION USED (lt 5 DETECTIONS OF CARBON TETRACHLORIDE
034 AA-46 PER LOCATION)
16 AA-38
038 AA-35
18 AA-14 0094AA-41 065 AA-36
055 AA-37 APPROX SCALE (ft)
0 2500
FigureSUMMARY OF ARITHMETIC MEAN CARBON TETRACHLORIDE AMBIENT AIR RESULTS B-20HARDEMAN COUNTY LANDFILL
Drafter ELS Date 22311 Contract Number 21-11010B40 Approved DTH Revised
069 063 23
20
18
14 25
10 095
099
86
18
90
14
31
061
61
020
062
0094
038
11
055
18
16
070
076
33
057 14
023
24
36
16
13 36
55
032
061 031
036
018
043
022
012
023
093
014
60
24
AA-32
AA-31
AA-30
AA-43AA-29 AA-27 AA-26 LEGENDAA-28
237-ACRE LANDFILL PROPERTY AA-01 BOUNDARY
NORTH LANDFILLAA-40 DISPOSAL AREA SITE BOUNDARY
AA-23 MIDDLE LANDFILL AA-08 DISPOSAL AREASAA-21 DISPOSAL AREAAA-22AA-02 AA-47AA-04 PEAK CARBON TETRACHLORIDE
CONCENTRATIONAA-24 SOUTH LANDFILLAA-18AA-20AA-48 DISPOSAL AREAAA-03 AA-51AA-25 0 - 1 ppbvAA-44AA-06 AA-09 AA-19AA-05 AA-16
AA-15AA-17 1-3 ppbv
AA-10 AA-50
AA-11 gt 3 ppbvAA-45 AA-12 AA-49
AA-39 AA-13
NOTES
AA-42AA-33 1 RESULTS ARE IN PARTS PER BILLION BY VOLUME (ppbv)
AA-34
2 VALUES SHOWN ARE MAXIMUM DETECTED CONCENTRATIONS OF CARBON
AA-46 TETRACHLORIDE
AA-38
AA-35
AA-41AA-14 AA-36
AA-37 APPROX SCALE (ft)
0 2500
Figure
LL
oop
Pro
ject
File
s00
_CA
D F
ILE
S2
1Le
Pet
mn
Third
Fiv
e-Y
ear R
evie
w 2
1-11
010B
40F
igur
es_F
eb 2
011
B-2
1_S
umm
ary
of P
eak
CT
AA
Res
ults
dw
g
SUMMARY OF PEAK CARBON TETRACHLORIDE AMBIENT AIR RESULTS HARDEMAN COUNTY LANDFILL B-21
Drafter ELS Date 22311 Contract Number 21-11010B40 Approved DTH Revised

TOONE
ROAD
OLD
PUGH CREEK OLD TOONE ROAD
PUGH CREEK
GRAVEL ROAD FORMER ILLINOIS
GULF RAILROAD
GRAVEL ROAD
FORMER ILLINOIS GULF RAIL
CLOVER CREEK
CLO
VER C
REEK
GETS TREATMENT PLANT
EW-1
EW-3
EW-4A EW-4BEW-10M
EW-5M
EW-6M
EW-7
EW-8M
EW-9
LEGEND
LL
oop
Pro
ject
File
s00
_CA
D F
ILE
S2
1Le
Pet
mn
Third
Fiv
e-Y
ear R
evie
w 2
1-11
010B
40F
igur
es_F
eb 2
011
B-3
_GE
TS E
xrac
tion
Wel
l Lay
outd
wg
EW-1
EW-7
EW-4B
237 ACRE LANDFILL PROPERTY BOUNDARY
SITE BOUNDARY
DISPOSAL AREAS
ABANDONED EXTRACTION WELL
UNCONFINED AQUIFER EXTRACTION WELL
CONFINED AQUIFER EXTRACTION WELL
EXTRACTION WELL FORCEMAINS
SOURCE CONTROL EXTRACTION WELLSSCALE IN FEET
PLUME REDUCTION EXTRACTION WELLS 0 1600
Figure GETS EXTRACTION WELL LAYOUT
HARDEMAN COUNTY LANDFILL B-3 Drafter APRELS Date 022211 Contract Number 21-11010B40 Approved DTH Revised
OLD TOONE RD
PUGH CREEK
PUGH CREEK
VADOSE ZONE UNSATURATED SAND
1000S OF FEET
1000S OF FEET
GROUND WATER FLOW DIRECTION
LOWER CLAY UNIT
UPPER CLAY UNIT
LOWER CLAY UNIT
UPPER CLAY UNIT
UNCONFINED AQUIFER
LOWER SAND UNIT WITH
WATER UNDER PRESSURE
BASAL AQUITARD
INTERMEDIATE AQUITARD UNCONFINED AQUIFER
CONFINED AQUIFER
LOWER SAND UNIT WITH
WATER UNDER PRESSURE
UPPER SAND UNIT WITH WATER
BASAL AQUITARD
LEAKY CONFINED AQUIFER
INTERMEDIATE AQUITARD UPPER SAND UNIT WITH WATER
DISPOSAL
LANDFILL CAP
WASTE
VOCs OFF-GASSING FROM WASTE DISPOSAL AREA AT
LANDFILL CAP FLANKS
VOCs OFF-GASSING FROM GROUND WATER SEEPS
AND SURFACE WATER
CONTAMINATION
VOCS OFF-GASSING FROM CONTAMINATED GROUND WATER
CUTAWAY VIEW CLOVER CREEK
LEGEND
WATER TABLE
VOLATILE ORGANIC COMPOUND (VOC) CONTAMINATION 125-250 FEET
VADOSE ZONE - UNSATURATED SAND
AQUIFER - SAND UNIT WITH WATER
INTERMEDIATE AQUITARD - UPPER CLAY UNIT
BASAL AQUITARD - LOWER CLAY UNIT
LL
oop
Pro
ject
File
s00
_CA
D F
ILE
S2
1Le
Pet
mn
Third
Fiv
e-Y
ear R
evie
w 2
1-11
010B
40F
igur
es_F
eb 2
011
B-4
_Site
Con
cept
ual V
iew
(3-D
)-A
ltern
ate
dwg
NOT TO SCALE
Figure SITE CONCEPTUAL MODEL HARDEMAN COUNTY LANDFILL B-4
Drafter APRELS Date 22311 Contract Number 21-11010B40 Approved DTH Revised
OLD
PUGH CREEK
OLD TOONE ROAD
PUGH CREEK
CLOVER CREEK
CLO
VER C
REEK
E
N S
GETS TREATMENT PLANT
W
LEGEND
SITE BOUNDARY
DISPOSAL AREA
GROUNDWATER USE AND SUBSURFACE DISTURBANCE RESTRICTION AGREEMENT - SIGNED
TOONE GROUNDWATER USE RESTRICTION AGREEMENT - SIGNED
PROPERTY OWNERS UNWILLING TO GRANT LAND USE DEED RESTRICTIONS
TRUST OWNED PROPERTY
PENDING GROUND-WATER USE RESTRICTION AGREEMENT
LL
oop
Pro
ject
File
s00
_CA
D F
ILE
S2
1Le
Pet
mn
Feas
ibili
ty S
tudy
Upd
ate
21-1
1010
B44
2-3
_GW
Use
Res
trict
ion
Pro
perty
Map
dw
g
APPROX SCALE (ft)
0 2000
Figure GROUNDWATER USE RESTRICTION PROPERTY MAP
HARDEMAN COUNTY LANDFILL 2-3 Drafter ELS Date 41712 Contract Number 21-11010B44 Approved DTH Revised
A
LL
oop
Pro
ject
File
s00
_CA
D F
ILE
S2
1Le
Pet
mn
Third
Fiv
e-Y
ear R
evie
w 2
1-11
010B
40F
igur
es_F
eb 2
011
B-9
_SW
DA
SV
E P
ilot T
est L
ayou
tdw
g
LEGEND
THREE 6Oslash HDPE SDR-11 SVE MAIN
THREE 6Oslash HDPE SDR-11 SVE LATERAL
CHAIN LINK FENCE
SHALLOW SVE WELLWELL HEAD CONNECTION WITH CLEAN OUT
INTERMEDIATE SVE WELLWELL HEAD CONNECTION WITH CLEAN OUT
DEEP SVE WELLWELL HEAD CONNECTION WITH CLEAN OUT
0
APPROX SCALE (ft)
60
SOIL GAS MONITORING PROBE
VAPOR FLOW DIRECTION
SWDA SVE PILOT TEST LAYOUT HARDEMAN COUNTY LANDFILL
Figure
B-9 Drafter ELS Date 22311 Contract Number 21-11010B40 Approved DTH Revised
500
0
5000
ROAD
OLD
PUGH CREEK
OLD TOONE ROAD
PUGH CREEK
GRAVEL ROAD FORMER ILLINOIS GULF RAILROAD
GRAVEL ROAD
FORMER ILLINOIS GULF RAILROAD
CLOVER CREEK
CLO
VER C
REEK
5
5 00
5 0
5 0 0
5
50
GETS TREATMENT PLANT
GM-3EMW-10 EPZ-4A1
EPZ-1B EPZ-4A2 EPZ-1A R RES-58CRA-6BEPZ-5B CRA-6A EMW-7 EMW-6EPZ-5A1 EMW-9 CRA-3BEPZ-5A2 GM-9AEPZ-2A EMW-8
CRA-16EPZ-3A1 EW-4ACRA-8BEPZ-3A2 GM-5 CRA-12BCRA-8A
EW-10M EW-5M EW-7
EW-6MGM-1
EMW-2EMW-3 EMW-16CRA-1B
CRA-2A EMW-1CRA-2B EMW-15 EMW-12
EMW-4EW-8M EMW-14
CRA-17B RES-15 R
TOONE
EMW-13 EMW-17
CRA-19B EMW-5CRA-19A GM-2
CRA-11B RRES-60
CRA-20B LEGEND
CRA-14B
237 ACRE LANDFILL PROPERTY BOUNDARY
gt 5000 ȝgL
SITE BOUNDARY
EMW-11 DISPOSAL AREAS 500 - 5000 ȝgL
MONITORING WELL
EXTRACTION WELL 50 - 500 ȝgL
APPROX SCALE (ft)
1800
R RESIDENTIAL WELL 5 - 50 ȝgL
PIEZOMETER
LL
oop
Pro
ject
File
s00
_CA
D F
ILE
S2
1Le
Pet
mn
Third
Fiv
e-Y
ear R
evie
w 2
1-11
010B
40F
igur
es_F
eb20
11B
-13_
CT
Unc
onfin
ed A
quife
r Iso
con
Plum
e M
ap 2
008-
2010
dw
g
NOTE CARBON TETRACHLORIDE PLUME DRAWN USING PROFESSIONAL JUDGEMENT QUADRANGLE 1961 PHOTOREVISED 1981 USGS TOPOGRAPHIC MAPS SOURCE BO LIVAR EAST QUADRANGLE 1961 PHOTOREVISED 1983 AND TEAGUE
BASED ON 2008 2009 AND 2010 SAMPLING DATA
FigureCARBON TETRACHLORIDE UNCONFINED AQUIFER ISOCONCENTRATION
PLUME MAP 2008 -2 010 HARDEMAN COUNTY LANDFILL
Drafter APRELS Date 22311 Contract Number 21-11010B40 Approved DTH Revised
B-13
0
TOONE
ROAD
OLD
PUGH CREEK
OLD TOONE ROAD
PUGH CREEK
GRAVEL ROAD FORMER ILLINOIS GULF RAILROAD
GRAVEL ROAD
FORMER ILLINOIS GULF RAILROAD
CLOVER CREEK
CLO
VER C
REEK
560
ESB-9 GM-9A EMW-7 ESB-4 ESB-3 ESB-16 05
ESB-12 CRA-16 EW-7 CRA-6B ESB-7 EMW-8 8800 5400 2700 380005 03 05 05 340 05 05 31010000 3800 10000 11000 2800 70000505 05 03 05
940005 08 1004800 12000 16000 1800008 08 05 08 110008920008
CRA-10A CRA-10B
GETS TREATMENT ESB-6 PLANT 05 260
EPZ-5A1 EMW-10EPZ-4A1 EPZ-1A EPZ-4A2
10 GM-3 GM-9A CRA-4ACRA-7EPZ-3A1 EPZ-1B CRA-3A CRA-4B EMW-7 CRA-3B10 93 EPZ-5A1EPZ-2A CRA-6B
EMW-6EPZ-3A2 ESB-9CRA-18B EMW-8 ESB-2 10 620 05 230EW-3EPZ-3A1 CRA-16CRA-8A ESB-12EPZ-3A2CRA-8B ESB-7CRA-8B EMW-2
210005EW-4A05 79 ESB-4EMW-10M08 014 U 540008
EW-7 CRA-12AEW-5M10 061 J
CRA-8A GM-5 CRA-12B ESB-1
2100GM-1 05EW-6M ESB-6 ESB-2ESB-3 ESB-16480005 CRA-1B
03 670 2300 EMW-3 EMW-208
ESB-1270010
EMW-10M 350005EMW-12 EMW-16 330008EW-8MCRA-9140003 CRA-2A EMW-4 CRA-1B EMW-14CRA-17A EMW-1CRA-2BCRA-17B EMW-1EMW-12
EMW-15 05 12 08 340 09 160
05 59 08 42
EW-8M CRA-19B EMW-13120003 EMW-17EMW-5 GM-2CRA-17B
03 1100 05 640 08 870
CRA-11A CRA-17A CRA-11B
03 140
CRA-19B 03 3000 CRA-20B
05 2800 08 5900 CRA-14A
CRA-20B 03 460 05 590
CRA-14B CRA-13A CRA-13B
LEGEND
237 ACRE LANDFILL PROPERTY 08 1100
EW-4A EW-5M GM-2 GM-1 EW-6M GM-05 CRA-2A EMW-5 EMW-3 EMW-4 BOUNDARY
03 08
14000 40000
08 EMW-11
37000 03 470 05 420 08 450
03 05 08
5000 6300
19000
08 5200 03 05 08
3500 19000 33000
03 05 08
280 17
100
05 08
10 U 130
05 08
180 190
05 08
2700 1400
SITE BOUNDARY
DISPOSAL AREAS
CRA-2B 2100 =DETECTED RESULT IS ABOVE THE MONITORING WELL500003 GRL OF 5 μgL410005 SOIL BORING 500008 μgL =MICROGRAMS PER LITER
PIEZOMETER
LL
oop
Pro
ject
File
s00
_CA
D F
ILE
S2
1Le
Pet
mn
Third
Fiv
e-Y
ear R
evie
w 2
1-11
010B
40F
igur
es_F
eb 2
011
B-1
5_C
T U
ncon
fined
Aqu
ifer G
W R
esul
ts fo
r 200
3-20
10d
wg
APPROX SCALE (ft) GRL =GROUNDWATER REMEDIATION NO DETECTION ORLEVEL FROM RECORD OF DECISIONNOTE GRL FOR CARBON TETRACHLORIDE IS 5 μgL WHICH IS DETECTION BELOW GRL
0 2000 EQUIVALENT TO THE USEPA MAXIMUM CONTAMINANT LEVEL (MCL) FOR OPERABLE UNIT No 1
FigureCARBON TETRACHLORIDE UNCONFINED AQUIFER GROUNDWATER RESULTS FOR 2003 - 2010 B-15HARDEMAN COUNTY LANDFILL
Drafter ELS Date 22411 Contract Number 21-11010B40 Approved Revised
TOONE
ROAD
OLD
PUGH CREEK
OLD TOONE ROAD
PUGH CREEK
GRAVEL ROAD FORMER ILLINOIS GULF RAILROAD
GRAVEL ROAD
FORMER ILLINOIS GULF RAILROAD
CLOVER CREEK
CLO
VER C
REEK
CRA-5A EW-4B 290003 87 03 320005 180 08
08 220
GETS TREATMENT PLANT
CRA-6A CRA-5A
CRA-18A
EW-4B EW-10OBS1
CRA-1A
CRA-19A
CRA-20A
LEGEND2100 =DETECTED RESULT IS ABOVE THE GRL OF 5 μgL 237 ACRE LANDFILL PROPERTY
BOUNDARY
SITE BOUNDARYμgL =MICROGRAMS PER LITER DISPOSAL AREAS
LL
oop
Pro
ject
File
s00
_CA
D F
ILE
S2
1Le
Pet
mn
Third
Fiv
e-Y
ear R
evie
w 2
1-11
010B
40F
igur
es_F
eb 2
011
B-1
6_C
T Le
aky
Con
fined
Aqu
ifer G
W R
esul
ts fo
r 200
3-20
10d
wg
APPROX SCALE (ft) GRL =GROUNDWATER REMEDIATION MONITORING WELL
LEVEL FROM RECORD OF DECISION NO DETECTION ORNOTE GRL FOR CARBON TETRACHLORIDE IS 5 μgL WHICH IS FOR OPERABLE UNIT No 1 DETECTION BELOW GRL0 2000 EQUIVALENT TO THE USEPA MAXIMUM CONTAMINANT LEVEL (MCL)
FigureCARBON TETRACHLORIDE LEAKY CONFINED AQUIFER GROUNDWATER RESULTS FOR 2003 - 2010 B-16HARDEMAN COUNTY LANDFILL
Drafter ELS Date 22411 Contract Number 21-11010B40 Approved DTH Revised
GRAVEL ROAD
FORMER ILLINOIS GULF RAILROAD
O L D T O O N E R O A D
PUGH CREEK
LL
oop
Pro
ject
File
s00
_CA
D F
ILE
S2
1Le
Pet
mn
Third
Fiv
e-Y
ear R
evie
w 2
1-11
010B
40F
igur
es_F
eb 2
011
B-1
9_Lo
catio
ns o
f OU
2 V
ados
e Zo
ne S
AL
Exc
eeda
nces
dw
g
NS-01 NORTH DISPOSAL AREA
(NDA)
MIDDLE DISPOSAL AREA (MDA)
ESB-4
SOUTHEAST DISPOSAL AREA
ESB-6 (SEDA)
ESB-3 ESB-17 ESB-16 ESB-2
SOUTHWEST DISPOSAL AREA (SWDA)
ESB-1
LEGEND
237 ACRE LANDFILL PROPERTY BOUNDARY
SITE BOUNDARY
DISPOSAL AREAS
ESB-1 2005 SOIL BORING
0
APPROX SCALE (ft)
800
NS-01 DEEP NESTED SOIL MONITORING PROBE (3 DEPTHS)
LOCATIONS OF OU2 VADOSE ZONE SAL EXCEEDANCES HARDEMAN COUNTY LANDFILL
Figure
B-19 Drafter ELS Date 22311 Contract Number 21-11010B40 Approved DTH Revised
022 AA-32
011 AA-31
LL
oop
Pro
ject
File
s00
_CA
D F
ILE
S2
1Le
Pet
mn
Third
Fiv
e-Y
ear R
evie
w 2
1-11
010B
40F
igur
es_F
eb 2
011
B-2
0_S
umm
ary
of M
ean
CT
AA
Res
ults
dw
g
043 AA-30
LEGEND
237-ACRE LANDFILL PROPERTY023 AA-29 036 AA-27 038 AA-43 031 AA-26 BOUNDARY
018 AA-28
SITE BOUNDARY
028 AA-01 MIDDLE LANDFILLNORTH LANDFILL DISPOSAL AREAS
AA-40 061 DISPOSAL AREADISPOSAL AREA MEAN CARBON TETRACHLORIDEAA-23 SOUTH LANDFILL CONCENTRATION15AA-08 25 AA-21 DISPOSAL AREA27 AA-22AA-02 093 24 AA-47
0 - 075 ppbv 073 11 AA-04
10 AA-24 AA-1812 AA-2061 AA-48 AA-03 24 075 - 15 ppbv
AA-06 064 AA-25 031 37 AA-51048 032 AA-44014 AA-09 AA-19 096079 AA-05 22 13 AA-16
27 AA-15 gt 15 ppbvAA-17 076 AA-10
083AA-50054 082080 AA-11 NOTES020 AA-45 AA-12 AA-49 1 RESULTS ARE IN PARTS PER BILLION BY070 AA-39 070 AA-13 VOLUME (ppbv)
2 CALCULATED USING THE 95 UCL OF THE057 AA-33 056 AA-42 MEAN ( t 5 DETECTIONS OF CARBON
TETRACHLORIDE PER LOCATION)023 AA-34
3 = MAXIMUM DETECTION USED (lt 5 DETECTIONS OF CARBON TETRACHLORIDE
034 AA-46 PER LOCATION)
16 AA-38
038 AA-35
18 AA-14 0094AA-41 065 AA-36
055 AA-37 APPROX SCALE (ft)
0 2500
FigureSUMMARY OF ARITHMETIC MEAN CARBON TETRACHLORIDE AMBIENT AIR RESULTS B-20HARDEMAN COUNTY LANDFILL
Drafter ELS Date 22311 Contract Number 21-11010B40 Approved DTH Revised
069 063 23
20
18
14 25
10 095
099
86
18
90
14
31
061
61
020
062
0094
038
11
055
18
16
070
076
33
057 14
023
24
36
16
13 36
55
032
061 031
036
018
043
022
012
023
093
014
60
24
AA-32
AA-31
AA-30
AA-43AA-29 AA-27 AA-26 LEGENDAA-28
237-ACRE LANDFILL PROPERTY AA-01 BOUNDARY
NORTH LANDFILLAA-40 DISPOSAL AREA SITE BOUNDARY
AA-23 MIDDLE LANDFILL AA-08 DISPOSAL AREASAA-21 DISPOSAL AREAAA-22AA-02 AA-47AA-04 PEAK CARBON TETRACHLORIDE
CONCENTRATIONAA-24 SOUTH LANDFILLAA-18AA-20AA-48 DISPOSAL AREAAA-03 AA-51AA-25 0 - 1 ppbvAA-44AA-06 AA-09 AA-19AA-05 AA-16
AA-15AA-17 1-3 ppbv
AA-10 AA-50
AA-11 gt 3 ppbvAA-45 AA-12 AA-49
AA-39 AA-13
NOTES
AA-42AA-33 1 RESULTS ARE IN PARTS PER BILLION BY VOLUME (ppbv)
AA-34
2 VALUES SHOWN ARE MAXIMUM DETECTED CONCENTRATIONS OF CARBON
AA-46 TETRACHLORIDE
AA-38
AA-35
AA-41AA-14 AA-36
AA-37 APPROX SCALE (ft)
0 2500
Figure
LL
oop
Pro
ject
File
s00
_CA
D F
ILE
S2
1Le
Pet
mn
Third
Fiv
e-Y
ear R
evie
w 2
1-11
010B
40F
igur
es_F
eb 2
011
B-2
1_S
umm
ary
of P
eak
CT
AA
Res
ults
dw
g
SUMMARY OF PEAK CARBON TETRACHLORIDE AMBIENT AIR RESULTS HARDEMAN COUNTY LANDFILL B-21
Drafter ELS Date 22311 Contract Number 21-11010B40 Approved DTH Revised

OLD
PUGH CREEK
OLD TOONE ROAD
PUGH CREEK
CLOVER CREEK
CLO
VER C
REEK
E
N S
GETS TREATMENT PLANT
W
LEGEND
SITE BOUNDARY
DISPOSAL AREA
GROUNDWATER USE AND SUBSURFACE DISTURBANCE RESTRICTION AGREEMENT - SIGNED
TOONE GROUNDWATER USE RESTRICTION AGREEMENT - SIGNED
PROPERTY OWNERS UNWILLING TO GRANT LAND USE DEED RESTRICTIONS
TRUST OWNED PROPERTY
PENDING GROUND-WATER USE RESTRICTION AGREEMENT
LL
oop
Pro
ject
File
s00
_CA
D F
ILE
S2
1Le
Pet
mn
Feas
ibili
ty S
tudy
Upd
ate
21-1
1010
B44
2-3
_GW
Use
Res
trict
ion
Pro
perty
Map
dw
g
APPROX SCALE (ft)
0 2000
Figure GROUNDWATER USE RESTRICTION PROPERTY MAP
HARDEMAN COUNTY LANDFILL 2-3 Drafter ELS Date 41712 Contract Number 21-11010B44 Approved DTH Revised
A
LL
oop
Pro
ject
File
s00
_CA
D F
ILE
S2
1Le
Pet
mn
Third
Fiv
e-Y
ear R
evie
w 2
1-11
010B
40F
igur
es_F
eb 2
011
B-9
_SW
DA
SV
E P
ilot T
est L
ayou
tdw
g
LEGEND
THREE 6Oslash HDPE SDR-11 SVE MAIN
THREE 6Oslash HDPE SDR-11 SVE LATERAL
CHAIN LINK FENCE
SHALLOW SVE WELLWELL HEAD CONNECTION WITH CLEAN OUT
INTERMEDIATE SVE WELLWELL HEAD CONNECTION WITH CLEAN OUT
DEEP SVE WELLWELL HEAD CONNECTION WITH CLEAN OUT
0
APPROX SCALE (ft)
60
SOIL GAS MONITORING PROBE
VAPOR FLOW DIRECTION
SWDA SVE PILOT TEST LAYOUT HARDEMAN COUNTY LANDFILL
Figure
B-9 Drafter ELS Date 22311 Contract Number 21-11010B40 Approved DTH Revised
500
0
5000
ROAD
OLD
PUGH CREEK
OLD TOONE ROAD
PUGH CREEK
GRAVEL ROAD FORMER ILLINOIS GULF RAILROAD
GRAVEL ROAD
FORMER ILLINOIS GULF RAILROAD
CLOVER CREEK
CLO
VER C
REEK
5
5 00
5 0
5 0 0
5
50
GETS TREATMENT PLANT
GM-3EMW-10 EPZ-4A1
EPZ-1B EPZ-4A2 EPZ-1A R RES-58CRA-6BEPZ-5B CRA-6A EMW-7 EMW-6EPZ-5A1 EMW-9 CRA-3BEPZ-5A2 GM-9AEPZ-2A EMW-8
CRA-16EPZ-3A1 EW-4ACRA-8BEPZ-3A2 GM-5 CRA-12BCRA-8A
EW-10M EW-5M EW-7
EW-6MGM-1
EMW-2EMW-3 EMW-16CRA-1B
CRA-2A EMW-1CRA-2B EMW-15 EMW-12
EMW-4EW-8M EMW-14
CRA-17B RES-15 R
TOONE
EMW-13 EMW-17
CRA-19B EMW-5CRA-19A GM-2
CRA-11B RRES-60
CRA-20B LEGEND
CRA-14B
237 ACRE LANDFILL PROPERTY BOUNDARY
gt 5000 ȝgL
SITE BOUNDARY
EMW-11 DISPOSAL AREAS 500 - 5000 ȝgL
MONITORING WELL
EXTRACTION WELL 50 - 500 ȝgL
APPROX SCALE (ft)
1800
R RESIDENTIAL WELL 5 - 50 ȝgL
PIEZOMETER
LL
oop
Pro
ject
File
s00
_CA
D F
ILE
S2
1Le
Pet
mn
Third
Fiv
e-Y
ear R
evie
w 2
1-11
010B
40F
igur
es_F
eb20
11B
-13_
CT
Unc
onfin
ed A
quife
r Iso
con
Plum
e M
ap 2
008-
2010
dw
g
NOTE CARBON TETRACHLORIDE PLUME DRAWN USING PROFESSIONAL JUDGEMENT QUADRANGLE 1961 PHOTOREVISED 1981 USGS TOPOGRAPHIC MAPS SOURCE BO LIVAR EAST QUADRANGLE 1961 PHOTOREVISED 1983 AND TEAGUE
BASED ON 2008 2009 AND 2010 SAMPLING DATA
FigureCARBON TETRACHLORIDE UNCONFINED AQUIFER ISOCONCENTRATION
PLUME MAP 2008 -2 010 HARDEMAN COUNTY LANDFILL
Drafter APRELS Date 22311 Contract Number 21-11010B40 Approved DTH Revised
B-13
0
TOONE
ROAD
OLD
PUGH CREEK
OLD TOONE ROAD
PUGH CREEK
GRAVEL ROAD FORMER ILLINOIS GULF RAILROAD
GRAVEL ROAD
FORMER ILLINOIS GULF RAILROAD
CLOVER CREEK
CLO
VER C
REEK
560
ESB-9 GM-9A EMW-7 ESB-4 ESB-3 ESB-16 05
ESB-12 CRA-16 EW-7 CRA-6B ESB-7 EMW-8 8800 5400 2700 380005 03 05 05 340 05 05 31010000 3800 10000 11000 2800 70000505 05 03 05
940005 08 1004800 12000 16000 1800008 08 05 08 110008920008
CRA-10A CRA-10B
GETS TREATMENT ESB-6 PLANT 05 260
EPZ-5A1 EMW-10EPZ-4A1 EPZ-1A EPZ-4A2
10 GM-3 GM-9A CRA-4ACRA-7EPZ-3A1 EPZ-1B CRA-3A CRA-4B EMW-7 CRA-3B10 93 EPZ-5A1EPZ-2A CRA-6B
EMW-6EPZ-3A2 ESB-9CRA-18B EMW-8 ESB-2 10 620 05 230EW-3EPZ-3A1 CRA-16CRA-8A ESB-12EPZ-3A2CRA-8B ESB-7CRA-8B EMW-2
210005EW-4A05 79 ESB-4EMW-10M08 014 U 540008
EW-7 CRA-12AEW-5M10 061 J
CRA-8A GM-5 CRA-12B ESB-1
2100GM-1 05EW-6M ESB-6 ESB-2ESB-3 ESB-16480005 CRA-1B
03 670 2300 EMW-3 EMW-208
ESB-1270010
EMW-10M 350005EMW-12 EMW-16 330008EW-8MCRA-9140003 CRA-2A EMW-4 CRA-1B EMW-14CRA-17A EMW-1CRA-2BCRA-17B EMW-1EMW-12
EMW-15 05 12 08 340 09 160
05 59 08 42
EW-8M CRA-19B EMW-13120003 EMW-17EMW-5 GM-2CRA-17B
03 1100 05 640 08 870
CRA-11A CRA-17A CRA-11B
03 140
CRA-19B 03 3000 CRA-20B
05 2800 08 5900 CRA-14A
CRA-20B 03 460 05 590
CRA-14B CRA-13A CRA-13B
LEGEND
237 ACRE LANDFILL PROPERTY 08 1100
EW-4A EW-5M GM-2 GM-1 EW-6M GM-05 CRA-2A EMW-5 EMW-3 EMW-4 BOUNDARY
03 08
14000 40000
08 EMW-11
37000 03 470 05 420 08 450
03 05 08
5000 6300
19000
08 5200 03 05 08
3500 19000 33000
03 05 08
280 17
100
05 08
10 U 130
05 08
180 190
05 08
2700 1400
SITE BOUNDARY
DISPOSAL AREAS
CRA-2B 2100 =DETECTED RESULT IS ABOVE THE MONITORING WELL500003 GRL OF 5 μgL410005 SOIL BORING 500008 μgL =MICROGRAMS PER LITER
PIEZOMETER
LL
oop
Pro
ject
File
s00
_CA
D F
ILE
S2
1Le
Pet
mn
Third
Fiv
e-Y
ear R
evie
w 2
1-11
010B
40F
igur
es_F
eb 2
011
B-1
5_C
T U
ncon
fined
Aqu
ifer G
W R
esul
ts fo
r 200
3-20
10d
wg
APPROX SCALE (ft) GRL =GROUNDWATER REMEDIATION NO DETECTION ORLEVEL FROM RECORD OF DECISIONNOTE GRL FOR CARBON TETRACHLORIDE IS 5 μgL WHICH IS DETECTION BELOW GRL
0 2000 EQUIVALENT TO THE USEPA MAXIMUM CONTAMINANT LEVEL (MCL) FOR OPERABLE UNIT No 1
FigureCARBON TETRACHLORIDE UNCONFINED AQUIFER GROUNDWATER RESULTS FOR 2003 - 2010 B-15HARDEMAN COUNTY LANDFILL
Drafter ELS Date 22411 Contract Number 21-11010B40 Approved Revised
TOONE
ROAD
OLD
PUGH CREEK
OLD TOONE ROAD
PUGH CREEK
GRAVEL ROAD FORMER ILLINOIS GULF RAILROAD
GRAVEL ROAD
FORMER ILLINOIS GULF RAILROAD
CLOVER CREEK
CLO
VER C
REEK
CRA-5A EW-4B 290003 87 03 320005 180 08
08 220
GETS TREATMENT PLANT
CRA-6A CRA-5A
CRA-18A
EW-4B EW-10OBS1
CRA-1A
CRA-19A
CRA-20A
LEGEND2100 =DETECTED RESULT IS ABOVE THE GRL OF 5 μgL 237 ACRE LANDFILL PROPERTY
BOUNDARY
SITE BOUNDARYμgL =MICROGRAMS PER LITER DISPOSAL AREAS
LL
oop
Pro
ject
File
s00
_CA
D F
ILE
S2
1Le
Pet
mn
Third
Fiv
e-Y
ear R
evie
w 2
1-11
010B
40F
igur
es_F
eb 2
011
B-1
6_C
T Le
aky
Con
fined
Aqu
ifer G
W R
esul
ts fo
r 200
3-20
10d
wg
APPROX SCALE (ft) GRL =GROUNDWATER REMEDIATION MONITORING WELL
LEVEL FROM RECORD OF DECISION NO DETECTION ORNOTE GRL FOR CARBON TETRACHLORIDE IS 5 μgL WHICH IS FOR OPERABLE UNIT No 1 DETECTION BELOW GRL0 2000 EQUIVALENT TO THE USEPA MAXIMUM CONTAMINANT LEVEL (MCL)
FigureCARBON TETRACHLORIDE LEAKY CONFINED AQUIFER GROUNDWATER RESULTS FOR 2003 - 2010 B-16HARDEMAN COUNTY LANDFILL
Drafter ELS Date 22411 Contract Number 21-11010B40 Approved DTH Revised
GRAVEL ROAD
FORMER ILLINOIS GULF RAILROAD
O L D T O O N E R O A D
PUGH CREEK
LL
oop
Pro
ject
File
s00
_CA
D F
ILE
S2
1Le
Pet
mn
Third
Fiv
e-Y
ear R
evie
w 2
1-11
010B
40F
igur
es_F
eb 2
011
B-1
9_Lo
catio
ns o
f OU
2 V
ados
e Zo
ne S
AL
Exc
eeda
nces
dw
g
NS-01 NORTH DISPOSAL AREA
(NDA)
MIDDLE DISPOSAL AREA (MDA)
ESB-4
SOUTHEAST DISPOSAL AREA
ESB-6 (SEDA)
ESB-3 ESB-17 ESB-16 ESB-2
SOUTHWEST DISPOSAL AREA (SWDA)
ESB-1
LEGEND
237 ACRE LANDFILL PROPERTY BOUNDARY
SITE BOUNDARY
DISPOSAL AREAS
ESB-1 2005 SOIL BORING
0
APPROX SCALE (ft)
800
NS-01 DEEP NESTED SOIL MONITORING PROBE (3 DEPTHS)
LOCATIONS OF OU2 VADOSE ZONE SAL EXCEEDANCES HARDEMAN COUNTY LANDFILL
Figure
B-19 Drafter ELS Date 22311 Contract Number 21-11010B40 Approved DTH Revised
022 AA-32
011 AA-31
LL
oop
Pro
ject
File
s00
_CA
D F
ILE
S2
1Le
Pet
mn
Third
Fiv
e-Y
ear R
evie
w 2
1-11
010B
40F
igur
es_F
eb 2
011
B-2
0_S
umm
ary
of M
ean
CT
AA
Res
ults
dw
g
043 AA-30
LEGEND
237-ACRE LANDFILL PROPERTY023 AA-29 036 AA-27 038 AA-43 031 AA-26 BOUNDARY
018 AA-28
SITE BOUNDARY
028 AA-01 MIDDLE LANDFILLNORTH LANDFILL DISPOSAL AREAS
AA-40 061 DISPOSAL AREADISPOSAL AREA MEAN CARBON TETRACHLORIDEAA-23 SOUTH LANDFILL CONCENTRATION15AA-08 25 AA-21 DISPOSAL AREA27 AA-22AA-02 093 24 AA-47
0 - 075 ppbv 073 11 AA-04
10 AA-24 AA-1812 AA-2061 AA-48 AA-03 24 075 - 15 ppbv
AA-06 064 AA-25 031 37 AA-51048 032 AA-44014 AA-09 AA-19 096079 AA-05 22 13 AA-16
27 AA-15 gt 15 ppbvAA-17 076 AA-10
083AA-50054 082080 AA-11 NOTES020 AA-45 AA-12 AA-49 1 RESULTS ARE IN PARTS PER BILLION BY070 AA-39 070 AA-13 VOLUME (ppbv)
2 CALCULATED USING THE 95 UCL OF THE057 AA-33 056 AA-42 MEAN ( t 5 DETECTIONS OF CARBON
TETRACHLORIDE PER LOCATION)023 AA-34
3 = MAXIMUM DETECTION USED (lt 5 DETECTIONS OF CARBON TETRACHLORIDE
034 AA-46 PER LOCATION)
16 AA-38
038 AA-35
18 AA-14 0094AA-41 065 AA-36
055 AA-37 APPROX SCALE (ft)
0 2500
FigureSUMMARY OF ARITHMETIC MEAN CARBON TETRACHLORIDE AMBIENT AIR RESULTS B-20HARDEMAN COUNTY LANDFILL
Drafter ELS Date 22311 Contract Number 21-11010B40 Approved DTH Revised
069 063 23
20
18
14 25
10 095
099
86
18
90
14
31
061
61
020
062
0094
038
11
055
18
16
070
076
33
057 14
023
24
36
16
13 36
55
032
061 031
036
018
043
022
012
023
093
014
60
24
AA-32
AA-31
AA-30
AA-43AA-29 AA-27 AA-26 LEGENDAA-28
237-ACRE LANDFILL PROPERTY AA-01 BOUNDARY
NORTH LANDFILLAA-40 DISPOSAL AREA SITE BOUNDARY
AA-23 MIDDLE LANDFILL AA-08 DISPOSAL AREASAA-21 DISPOSAL AREAAA-22AA-02 AA-47AA-04 PEAK CARBON TETRACHLORIDE
CONCENTRATIONAA-24 SOUTH LANDFILLAA-18AA-20AA-48 DISPOSAL AREAAA-03 AA-51AA-25 0 - 1 ppbvAA-44AA-06 AA-09 AA-19AA-05 AA-16
AA-15AA-17 1-3 ppbv
AA-10 AA-50
AA-11 gt 3 ppbvAA-45 AA-12 AA-49
AA-39 AA-13
NOTES
AA-42AA-33 1 RESULTS ARE IN PARTS PER BILLION BY VOLUME (ppbv)
AA-34
2 VALUES SHOWN ARE MAXIMUM DETECTED CONCENTRATIONS OF CARBON
AA-46 TETRACHLORIDE
AA-38
AA-35
AA-41AA-14 AA-36
AA-37 APPROX SCALE (ft)
0 2500
Figure
LL
oop
Pro
ject
File
s00
_CA
D F
ILE
S2
1Le
Pet
mn
Third
Fiv
e-Y
ear R
evie
w 2
1-11
010B
40F
igur
es_F
eb 2
011
B-2
1_S
umm
ary
of P
eak
CT
AA
Res
ults
dw
g
SUMMARY OF PEAK CARBON TETRACHLORIDE AMBIENT AIR RESULTS HARDEMAN COUNTY LANDFILL B-21
Drafter ELS Date 22311 Contract Number 21-11010B40 Approved DTH Revised
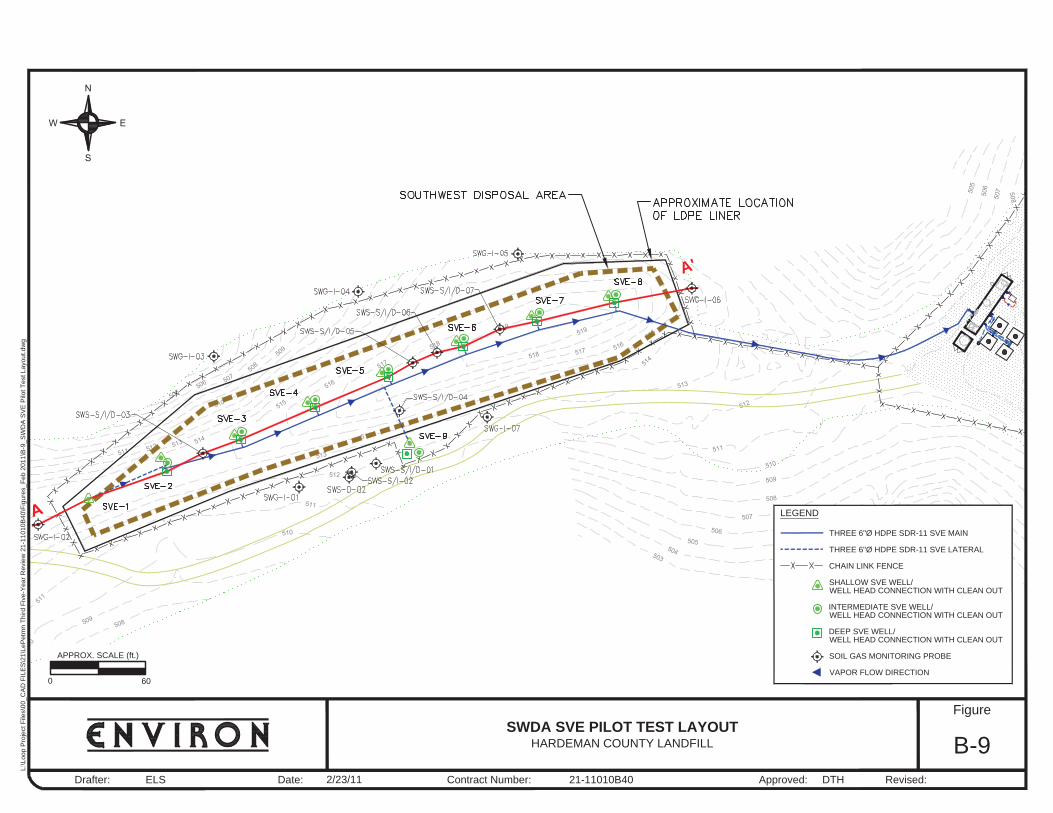

TOONE
ROAD
OLD
PUGH CREEK
OLD TOONE ROAD
PUGH CREEK
GRAVEL ROAD FORMER ILLINOIS GULF RAILROAD
GRAVEL ROAD
FORMER ILLINOIS GULF RAILROAD
CLOVER CREEK
CLO
VER C
REEK
CRA-5A EW-4B 290003 87 03 320005 180 08
08 220
GETS TREATMENT PLANT
CRA-6A CRA-5A
CRA-18A
EW-4B EW-10OBS1
CRA-1A
CRA-19A
CRA-20A
LEGEND2100 =DETECTED RESULT IS ABOVE THE GRL OF 5 μgL 237 ACRE LANDFILL PROPERTY
BOUNDARY
SITE BOUNDARYμgL =MICROGRAMS PER LITER DISPOSAL AREAS
LL
oop
Pro
ject
File
s00
_CA
D F
ILE
S2
1Le
Pet
mn
Third
Fiv
e-Y
ear R
evie
w 2
1-11
010B
40F
igur
es_F
eb 2
011
B-1
6_C
T Le
aky
Con
fined
Aqu
ifer G
W R
esul
ts fo
r 200
3-20
10d
wg
APPROX SCALE (ft) GRL =GROUNDWATER REMEDIATION MONITORING WELL
LEVEL FROM RECORD OF DECISION NO DETECTION ORNOTE GRL FOR CARBON TETRACHLORIDE IS 5 μgL WHICH IS FOR OPERABLE UNIT No 1 DETECTION BELOW GRL0 2000 EQUIVALENT TO THE USEPA MAXIMUM CONTAMINANT LEVEL (MCL)
FigureCARBON TETRACHLORIDE LEAKY CONFINED AQUIFER GROUNDWATER RESULTS FOR 2003 - 2010 B-16HARDEMAN COUNTY LANDFILL
Drafter ELS Date 22411 Contract Number 21-11010B40 Approved DTH Revised
GRAVEL ROAD
FORMER ILLINOIS GULF RAILROAD
O L D T O O N E R O A D
PUGH CREEK
LL
oop
Pro
ject
File
s00
_CA
D F
ILE
S2
1Le
Pet
mn
Third
Fiv
e-Y
ear R
evie
w 2
1-11
010B
40F
igur
es_F
eb 2
011
B-1
9_Lo
catio
ns o
f OU
2 V
ados
e Zo
ne S
AL
Exc
eeda
nces
dw
g
NS-01 NORTH DISPOSAL AREA
(NDA)
MIDDLE DISPOSAL AREA (MDA)
ESB-4
SOUTHEAST DISPOSAL AREA
ESB-6 (SEDA)
ESB-3 ESB-17 ESB-16 ESB-2
SOUTHWEST DISPOSAL AREA (SWDA)
ESB-1
LEGEND
237 ACRE LANDFILL PROPERTY BOUNDARY
SITE BOUNDARY
DISPOSAL AREAS
ESB-1 2005 SOIL BORING
0
APPROX SCALE (ft)
800
NS-01 DEEP NESTED SOIL MONITORING PROBE (3 DEPTHS)
LOCATIONS OF OU2 VADOSE ZONE SAL EXCEEDANCES HARDEMAN COUNTY LANDFILL
Figure
B-19 Drafter ELS Date 22311 Contract Number 21-11010B40 Approved DTH Revised
022 AA-32
011 AA-31
LL
oop
Pro
ject
File
s00
_CA
D F
ILE
S2
1Le
Pet
mn
Third
Fiv
e-Y
ear R
evie
w 2
1-11
010B
40F
igur
es_F
eb 2
011
B-2
0_S
umm
ary
of M
ean
CT
AA
Res
ults
dw
g
043 AA-30
LEGEND
237-ACRE LANDFILL PROPERTY023 AA-29 036 AA-27 038 AA-43 031 AA-26 BOUNDARY
018 AA-28
SITE BOUNDARY
028 AA-01 MIDDLE LANDFILLNORTH LANDFILL DISPOSAL AREAS
AA-40 061 DISPOSAL AREADISPOSAL AREA MEAN CARBON TETRACHLORIDEAA-23 SOUTH LANDFILL CONCENTRATION15AA-08 25 AA-21 DISPOSAL AREA27 AA-22AA-02 093 24 AA-47
0 - 075 ppbv 073 11 AA-04
10 AA-24 AA-1812 AA-2061 AA-48 AA-03 24 075 - 15 ppbv
AA-06 064 AA-25 031 37 AA-51048 032 AA-44014 AA-09 AA-19 096079 AA-05 22 13 AA-16
27 AA-15 gt 15 ppbvAA-17 076 AA-10
083AA-50054 082080 AA-11 NOTES020 AA-45 AA-12 AA-49 1 RESULTS ARE IN PARTS PER BILLION BY070 AA-39 070 AA-13 VOLUME (ppbv)
2 CALCULATED USING THE 95 UCL OF THE057 AA-33 056 AA-42 MEAN ( t 5 DETECTIONS OF CARBON
TETRACHLORIDE PER LOCATION)023 AA-34
3 = MAXIMUM DETECTION USED (lt 5 DETECTIONS OF CARBON TETRACHLORIDE
034 AA-46 PER LOCATION)
16 AA-38
038 AA-35
18 AA-14 0094AA-41 065 AA-36
055 AA-37 APPROX SCALE (ft)
0 2500
FigureSUMMARY OF ARITHMETIC MEAN CARBON TETRACHLORIDE AMBIENT AIR RESULTS B-20HARDEMAN COUNTY LANDFILL
Drafter ELS Date 22311 Contract Number 21-11010B40 Approved DTH Revised
069 063 23
20
18
14 25
10 095
099
86
18
90
14
31
061
61
020
062
0094
038
11
055
18
16
070
076
33
057 14
023
24
36
16
13 36
55
032
061 031
036
018
043
022
012
023
093
014
60
24
AA-32
AA-31
AA-30
AA-43AA-29 AA-27 AA-26 LEGENDAA-28
237-ACRE LANDFILL PROPERTY AA-01 BOUNDARY
NORTH LANDFILLAA-40 DISPOSAL AREA SITE BOUNDARY
AA-23 MIDDLE LANDFILL AA-08 DISPOSAL AREASAA-21 DISPOSAL AREAAA-22AA-02 AA-47AA-04 PEAK CARBON TETRACHLORIDE
CONCENTRATIONAA-24 SOUTH LANDFILLAA-18AA-20AA-48 DISPOSAL AREAAA-03 AA-51AA-25 0 - 1 ppbvAA-44AA-06 AA-09 AA-19AA-05 AA-16
AA-15AA-17 1-3 ppbv
AA-10 AA-50
AA-11 gt 3 ppbvAA-45 AA-12 AA-49
AA-39 AA-13
NOTES
AA-42AA-33 1 RESULTS ARE IN PARTS PER BILLION BY VOLUME (ppbv)
AA-34
2 VALUES SHOWN ARE MAXIMUM DETECTED CONCENTRATIONS OF CARBON
AA-46 TETRACHLORIDE
AA-38
AA-35
AA-41AA-14 AA-36
AA-37 APPROX SCALE (ft)
0 2500
Figure
LL
oop
Pro
ject
File
s00
_CA
D F
ILE
S2
1Le
Pet
mn
Third
Fiv
e-Y
ear R
evie
w 2
1-11
010B
40F
igur
es_F
eb 2
011
B-2
1_S
umm
ary
of P
eak
CT
AA
Res
ults
dw
g
SUMMARY OF PEAK CARBON TETRACHLORIDE AMBIENT AIR RESULTS HARDEMAN COUNTY LANDFILL B-21
Drafter ELS Date 22311 Contract Number 21-11010B40 Approved DTH Revised