optimization st mary s w treatment plant
TRANSCRIPT

TM31670902001.docx
XCG File No.: 3-167-09-02 October 26, 2016
OPTIMIZATION STUDY OF THE ST. MARY'S WASTEWATER TREATMENT PLANT
Prepared for:
B.M. ROSS & ASSOCIATES LIMITED 62 North Street
Goderich, Ontario N7A 2T4
Prepared by:
XCG CONSULTANTS LTD. Suite 300, 2620 Bristol Circle
Oakville, Ontario L6H 6Z7

Optimization Study of the St. Mary's WWTP
TABLE OF CONTENTS
TM31670902001.docx ii
TABLE OF CONTENTS 1. INTRODUCTION ..............................................................................................................1
2. OBJECTIVES ...................................................................................................................2
3. EXISTING WASTEWATER TREATMENT .........................................................................3 3.1 Treatment Objectives and Compliance Requirements ....................................5
4. SUMMARY OF HISTORIC REVIEW AND CAPACITY ASSESSMENT .................................6 4.1 Recent Developments ......................................................................................8
4.1.1 Industrial Wastewater ................................................................................... 8 4.1.2 Fertilizer Registration .................................................................................. 9
5. INTENSIVE SAMPLING .................................................................................................10 5.1 Intensive Sampling Results ...........................................................................10
6. SECONDARY CLARIFIER STRESS TESTING .................................................................15 6.1 Stress Test Results .........................................................................................16
6.1.1 Baseline Conditions .................................................................................... 16 6.1.2 Large Secondary Clarifier .......................................................................... 17 6.1.3 Small Secondary Clarifier .......................................................................... 22
7. BIOLOGICAL PROCESS MODELLING ...........................................................................29 7.1 Model Setup ...................................................................................................29 7.2 Model Calibration and Validation .................................................................30 7.3 Determining Design SRT ..............................................................................34
8. OPPORTUNITIES FOR OPTIMIZATION .........................................................................36 8.1 Secondary Treatment Capacity ......................................................................36 8.2 Solids Treatment Capacity ............................................................................40
8.2.1 WAS Thickening .......................................................................................... 40 8.2.2 Anaerobic Digestion ................................................................................... 40 8.2.3 Dewatering ................................................................................................. 41
8.3 General Recommendations ............................................................................41
9. SUMMARY ....................................................................................................................43
10. REFERENCES ................................................................................................................46
Optimization Study of the St. Mary's WWTP
TABLE OF CONTENTS
TM31670902001.docx iii
TABLES Table 3.1 ECA Objectives and Compliance Limits ........................................................5 Table 4.1 Summary of Historic Review and Capacity Assessment (XCG, 2014) ............6 Table 4.2 Equivalent Capacity of Sludge Treatment Unit Processes ..............................8 Table 5.1 Intensive Sampling Results - Liquid Treatment Train ..................................13 Table 5.2 Intensive Sampling Results - Solids Treatment Train ...................................14 Table 6.1 Baseline Secondary Clarifier Performance ...................................................16 Table 7.1 BioWin™ Model Calibration Results ...........................................................31 Table 7.2 Summary of Modelled Raw Wastewater Quality ..........................................35 Table 8.1 Recommended Supplementary Sampling ......................................................42 Table 9.1 Recommended Supplementary Sampling ......................................................44 Table 9.2 Updated Capacity Assessment of the St. Mary’s WWTP ...............................45
FIGURES Figure 3.1 Process Flow Diagram of the St. Mary's WWTP ............................................4 Figure 5.1 Process Flow Diagram of the St. Mary's WWTP ..........................................11 Figure 6.1 Peak Flow Testing - Large Secondary Clarifier Effluent TSS ......................17 Figure 6.2 Peak Flow Testing - Large Secondary Clarifier Effluent TP ........................18 Figure 6.3 Peak Flow Testing - Large Secondary Clarifier SOR and SLR ....................19 Figure 6.4 Peak Flow Testing - Large Secondary Clarifier Sludge Blanket Profiles ..19 Figure 6.5 Sustained Peak Flows - Large Secondary Clarifier Effluent TSS .................21 Figure 6.6 Sustained Peak Flows - Large Secondary Clarifier Effluent TP ...................21 Figure 6.7 Sustained Peak Flows - Large Secondary Clarifier Sludge Blanket
Profiles ...........................................................................................................22 Figure 6.8 Peak Flow Testing - Small Secondary Clarifier Effluent TSS ......................23 Figure 6.9 Peak Flow Testing - Small Secondary Clarifier Effluent TP ........................24 Figure 6.10 Peak Flow Testing - Small Secondary Clarifier SOR and SLR ....................25 Figure 6.11 Peak Flow Testing - Small Secondary Clarifier Sludge Blanket Profiles ..25 Figure 6.12 Sustained Peak Flows - Small Secondary Clarifier Effluent TSS .................26 Figure 6.13 Sustained Peak Flows - Small Secondary Clarifier Effluent TP ...................27 Figure 6.14 Sustained Peak Flows - Small Secondary Clarifier Sludge Blanket
Profiles ...........................................................................................................28 Figure 7.1 Schematic of BioWin™ Model Set Up for the St. Mary's WWTP ...............29 Figure 7.2 Historic and Model Predicted Final Effluent cBOD5 Concentrations ...........33 Figure 7.3 Historic and Model Predicted Final Effluent TAN Concentrations ..............34 Figure 7.4 Model Predicted Effluent TAN Concentration v. SRT .................................35 Figure 8.1 Optimal Operating Point for Secondary Treatment at Historic Average
BOD5 Concentration ......................................................................................37 Figure 8.2 MLSS Concentrations and Secondary Treatment Capacities at Varying BOD5
Concentrations ...............................................................................................38 Figure 8.3 MLSS Concentrations at 5,560 m3/d and Varying BOD5 Concentrations ....39
APPENDICES Appendix A Intensive Sampling Program Laboratory Analysis Results Appendix B Stress Testing Laboratory Analysis Results

Optimization Study of the St. Mary's WWTP
INTRODUCTION
TM31670902001.docx 1
1. INTRODUCTION The St. Mary's Wastewater Treatment Plant (WWTP) is owned by the Town of St. Mary's (the Town) and operated by the Ontario Clean Water Agency (OCWA), and provides secondary treatment for wastewater from the Town. The plant is operated under amended Environmental Compliance Approval (ECA) No. 7828-9VLLLP, amended April 22, 2015. The plant is rated for an average day flow (ADF) capacity of 5,560 m3/d and a peak flow capacity of 14,250 m3/d. The Town had initiated a Class Environmental Assessment (Class EA) to identify a preferred alternative to address projected growth in the Town. Over the course of the Class EA, it was identified that the projected growth did not necessitate any increase in plant capacity beyond the average day rated capacity. Consequently, the Town determined that the future treatment needs of the Town of St. Mary's could potentially be addressed through optimization of the existing plant. B.M. Ross and Associates Limited (BM Ross), in association with XCG Consultants Ltd. (XCG), were retained by the Town to undertake an Optimization Study of the St. Mary's WWTP.

Optimization Study of the St. Mary's WWTP
OBJECTIVES
TM31670902001.docx 2
2. OBJECTIVES The objectives of the Optimization Study are the following: • To develop a better understanding of the practical capacities of individual key unit
processes at the St. Mary's WWTP (i.e. bioreactors, secondary clarifiers); • To identify opportunities to increase the capacities of these key unit processes through
process or operational changes; and, • To identify opportunities to increase the capacities of key unit processes through
physical changes or modifications.

Historic Review and Capacity Assessment St. Mary's WWTP
EXISTING WASTEWATER TREATMENT
TM31670902001.docx 3
3. EXISTING WASTEWATER TREATMENT The St. Mary's WWTP is a modified Ludzack-Ettinger (MLE) biological nutrient removal (BNR) process with integrated sludge management that consists of headworks processes, an MLE activated sludge process, disinfection and sludge management. Raw wastewater passes through an automatically cleaned bar screen prior to being pumped to a detritor tank (grit removal) and comminutor. A grit classifier removes excess water prior to disposal. The plant was designed such that during wet weather and other high flow events, flows in excess of the plant capacity can bypass the entire plant at the lift station downstream of the mechanical screen and flow directly to the Thames River outfall. Historically, extremely high flows correspond with high river levels, limiting the ability to physically bypass the plant. Preliminary treated wastewater flows from the headworks to two continuously mixed anoxic tanks. Mixed liquor from the anoxic tanks flows to an inlet chamber, where flow is equally split to three rectangular aeration tanks, each equipped with tapered fine bubble diffusers. Mixed liquor is recycled to the anoxic tank by two internal recirculation pumps. The St. Mary's WWTP was originally designed to allow secondary bypass in the event of high flows; however, plant hydraulics were modified when the plant was converted to the BNR process. Consequently, gates that would formerly allow secondary bypass are kept closed. Secondary clarification of the mixed liquor occurs in four circular secondary clarifiers, two large (diameter = 15.24 m) and two small (diameter = 10.67 m) clarifiers. Flows to the secondary clarifiers are controlled by a flow splitting mechanism to control hydraulic and solids loading to each clarifier. Return activated sludge (RAS) is directed to a RAS splitter box, which controls the flow split to the anoxic tanks. Waste activated sludge (WAS) flow is controlled by adjusting the overflow weir in the RAS splitter box. Disinfection of secondary effluent is by UV disinfection, with backup chlorination in case emergency disinfection of plant effluent is required. Final plant effluent is discharged to the Thames River. WAS is stored in the WAS equalization tanks prior to thickening by a rotary drum thickener (RDT). The thickened WAS (TWAS) is sent to the TWAS storage/transfer tank prior to stabilization in the anaerobic digesters. Stabilized sludge (biosolids) is withdrawn from the secondary digester, dewatered by a centrifuge and stored in the dewatered sludge tank prior to further treatment in the Lystek process. Polymer can be added upstream of the RDT or the centrifuge to increase solids removal. The Lystek-processed biosolids are stored in the existing sludge storage tanks prior to removal. A portion of the Lystek product is recycled to the anoxic tanks and to the anaerobic digesters (approximately 2 m3/d and 3 m3/d, respectively) to enhance the performance of the BNR and stabilization processes. The digester supernatant, RDT filtrate and centrifuge centrate are returned to the anoxic tanks. Additional detail on the historic operation and performance of the St. Mary’s WWTP can be found in the Historic Review and Capacity Assessment of the St. Mary's WWTP (XCG, 2014) completed as part of the Class EA. A flow schematic of the St. Mary's WWTP is provided in Figure 3.1.

Historic Review and Capacity Assessment St. Mary's WWTP
EXISTING WASTEWATER TREATMENT
TM31670902001.docx 4
Figure 3.1 Process Flow Diagram of the St. Mary's WWTP

Historic Review and Capacity Assessment St. Mary's WWTP
EXISTING WASTEWATER TREATMENT
TM31670902001.docx 5
3.1 Treatment Objectives and Compliance Requirements The St. Mary's WWTP operates under amended ECA Number 7828-9VLLLP amended April 22, 2015. It has a rated ADF capacity of 5,560 m3/d and peak capacity of 14,250 m3/d. The ECA specifies effluent concentration objectives for carbonaceous biochemical oxygen demand (cBOD5), total suspended solids (TSS), total phosphorus (TP), total ammonia nitrogen (TAN), dissolved oxygen (DO) and E. coli. Monthly and daily concentration compliance limits are included for cBOD5, TSS, TP, and TAN. The effluent compliance limit for E. coli is 200 organisms/100 mL (monthly geometric mean density) from May 1 to November 30, although E. coli objectives are specified year round. The effluent objectives, monthly and daily compliance limits are shown in Table 3.1.
Table 3.1 ECA Objectives and Compliance Limits
Parameter Effluent Objectives Compliance Limits
Monthly Average Concentration Daily Concentration
cBOD5 10.0 mg/L 15 mg/L 25 mg/L
TSS 10.0 mg/L 15 mg/L 25 mg/L
TP 0.7 mg/L 1.0 mg/L 1.0 mg/L
TAN 2.5 mg/L 6.0 mg/L 8.0 mg/L
DO (1) 4.0 mg/L - -
E. Coli (2)
May 1 to November 30 December 1 to April 30
100 organisms / 100 mL
200 organisms / 100 mL
200 organisms / 100 mL
-
- -
pH 6.0 – 8.5 6.0 – 9.5
Notes: 1. Minimum concentration objective. 2. Based on monthly geometric mean density.

Historic Review and Capacity Assessment St. Mary's WWTP
SUMMARY OF HISTORIC REVIEW AND CAPACITY ASSESSMENT
TM31670902001.docx 6
4. SUMMARY OF HISTORIC REVIEW AND CAPACITY ASSESSMENT As part of the Class EA, a Historical Review and Capacity Assessment of the St. Mary's WWTP was completed based on available data. Table 4.1 summarizes the results of the capacity assessment. Additional detail on the capacity assessment can be found in the Historic Review and Capacity of the St Mary's WWTP (XCG, 2014)
Table 4.1 Summary of Historic Review and Capacity Assessment (XCG, 2014)
Treatment Unit Capacity Assessment
Average Day Flow Max Day Flow Peak Flow
Headworks - - 14,250 m3/d (1)
Bioreactors 5,220 m3/d (2) - -
Secondary Clarifiers - 14,410 m3/d 20,050 m3/d
RAS Pumping 8,840 m3/d - -
Oxygenation 83,300 m3/d - -
Disinfection - - 14,250 m3/d (1)
WAS Thickening 4,130 m3/d (2) - -
Anaerobic Digestion 2,625 m3/d (2) - -
Biosolids Dewatering 3,270 m3/d (2) - -
Lystek Process 25,000 m3/d (2) - -
Biosolids Storage 3,300 m3/d
Overall Capacity 2,625 m3/d 14,410 m3/d 14,250 m3/d
Notes: 1. Based on ECA rated peak flow capacity. Capacity should be confirmed during preliminary design. 2. Based on maximum month BOD5 loading.
Based on Table 4.1, the St. Mary's WWTP has an equivalent ADF capacity of 2,625 m3/d limited based on the anaerobic digestion process. It should be noted that the sludge management does not determine the capacity of the liquid treatment process, which is about 5,220 m3/d based on the bioreactor capacity. The liquid treatment train has a maximum daily flow (MDF) capacity of 14,410 m3/d, limited by the secondary clarifiers, which is equivalent to an ADF of approximately 5,620 m3/d (based on the equivalent peak factor of 2.56 using the ECA rated plant ADF and peak flow capacities). The peak flow capacity of the liquid treatment train is 14,250 m3/d based on the ECA rated capacity of the existing headworks and UV disinfection system. The equivalent ADF capacity of the existing headworks and UV disinfection system is approximately 5,560 m3/d, which is equivalent to the current ECA rated ADF capacity of the plant. The following points summarize key findings of the historic review of the St. Mary's WWTP: • Industrial wastewater accounted for approximately 18% of raw wastewater flows to the
St. Mary's WWTP. Wastewater quality from these industries are not typically

Historic Review and Capacity Assessment St. Mary's WWTP
SUMMARY OF HISTORIC REVIEW AND CAPACITY ASSESSMENT
TM31670902001.docx 7
monitored; however, based on the surcharge agreements with some of the industries, a large portion of the loading to the plant (potentially up to 2/3 in the case of BOD5) may be from industrial sources. The actual wastewater strength from major industries should be verified through an industrial wastewater sampling and characterization program;
• Historically, the bioreactors have operated at annual average MLSS concentrations ranging 4,540 mg/L in 2011 to 5,419 mg/L in 2012, for an average of approximately 5,000 mg/L from 2010 to 2012. The historic MLSS concentration is well above the typical design range for an MLE process of 1,500 - 4,000 mg/L (WEF, 2010). Operation at the elevated MLSS concentration may be a result of the high organic loading to the plant and maintaining the system SRT, but does not appear to have negatively impacted performance of the plant.
• The capacity of the bioreactors is about 5,220 m3/d based on a design solids retention time (SRT) of 10 days, and a MLSS concentration of 4,600 mg/L. The capacity is lower than the ECA rated capacity of 5,560 m3/d primarily due to historically high organic loading to the bioreactors;
• Based on a design surface overflow rate (SOR) of 37 m3/m2·d, the clarifiers have a (peak hourly flow) PHF capacity of 20,054 m3/d. Based on a design max day solids loading rate (SLR) of 170 kg/m2∙d, the MDF capacity of the secondary clarifiers is 14,410 m3/d;
• The historic average alum dosage of 33 mg/L was well below the typical alum dosage range of 110 to 225 mg/L (MOE, 2008) while the effluent TP from the St. Mary's WWTP consistently met daily and monthly effluent TP objectives and limits. In part, this could be due to the ratio of influent BOD5 to TP in the raw wastewater closely matching nutrient requirements for biomass growth of 1 g of phosphorus per 100 g of BOD5 (Metcalf and Eddy, 2003);
• The estimated equivalent ADF capacity of the RDT is 4,130 m3/d. This is lower than the ECA rated capacity of the plant and is likely due to the high historic organic loading to the St. Mary's WWTP and its impact on the WAS mass generation rate;
• The equivalent ADF capacity of the anaerobic digester is estimated at 2,625 m3/d, which is less than half of the ECA rated ADF capacity of the plant. The historic WAS mass generation rate is much higher per unit of wastewater treated than typical values, which negatively impacts the equivalent ADF capacity of the digesters;
• Due to limited historic sampling data from process streams between unit processes, it is not possible to assess the performance of the anaerobic digesters or Lystek process in terms of volatile solids (VS) destruction, nor is it possible to quantify the impact of recycling of the Lystek product on the performance of the digester. Sampling of the intermediate sludge and biosolids product between unit processes is recommended to better assess the performance of the individual unit processes with respect to VS destruction;
• The estimated equivalent ADF capacity of the centrifuge is 4,580 m3/d. This is lower than the ECA rated capacity of 5,560 m3/d and is likely due to the high historic organic loading to the St. Mary's WWTP and its impact on the WAS mass generation rate;
• Based on the minimum cycle time and operation 8 hours per day, 5 days per week, the equivalent ADF capacity of the Lystek process is 25,000 m3/d; and,

Historic Review and Capacity Assessment St. Mary's WWTP
SUMMARY OF HISTORIC REVIEW AND CAPACITY ASSESSMENT
TM31670902001.docx 8
• Based on providing 240 days of onsite storage at a solids concentration of 7.4% total solids (TS), the equivalent ADF capacity of the biosolids storage is approximately 3,300 m3/d. A reduction in the BOD5 loading to the plant would increase the equivalent ADF capacity of the biosolids storage. Additionally, according to the conceptual design, the sludge storage was sized based on a minimum solids concentration of 10% TS in the Lystek biosolids product. Increasing the solids concentration in the Lystek product to 10% would result in approximately 25% additional equivalent capacity.
4.1 Recent Developments
4.1.1 Industrial Wastewater As part of the Historic Review and Capacity Assessment (XCG, 2014), it was noted that as much as 18 percent of the wastewater flow to the St. Mary's WWTP was attributed to industries, potentially representing up to 2/3 of the BOD5 loading to the plant. Industrial loading, however, is dependent on the industries currently in operation and discharging to the collection system, (seasonal) variations in production and changing operations. Since the completion of the Historic Review and Capacity Assessment, the Town has been working with industries to reduce their loadings to the plant. According to Operations Staff, these efforts combined with changes to the industries discharging to the St. Mary's WWTP, have resulted in a reduction in BOD5 concentrations by almost 13 percent (down from 390 mg/L to approximately 340 mg/L) in 2015. A reduction in BOD5 concentration and loading would result in an increase in secondary treatment capacity as well as in the equivalent capacities of the sludge management unit processes (i.e. WAS thickening, anaerobic digestion, biosolids dewatering, the Lystek process and biosolids storage). Based solely on a reduction in raw wastewater BOD5 concentration from 390 mg/L to 340 mg/L, the equivalent capacities of the sludge treatment unit processes increased by 13% as compared to the equivalent capacities estimated in the Historic Review and Capacity Assessment. Table 4.2 presents the equivalent ADF capacities of the sludge treatment unit processes at a raw wastewater BOD5 concentration of 340 mg/L. The equivalent capacities from the Historic Review and Capacity Assessment are included in the table for comparison.
Table 4.2 Equivalent Capacity of Sludge Treatment Unit Processes
Treatment Unit Equivalent ADF Capacity (1)
Reduced BOD Loading Historic Review and Capacity Assessment
WAS Thickening 4,679 m3/d 4,130 m3/d
Anaerobic Digestion 2,972 m3/d 2,625 m3/d
Biosolids Dewatering 3,705 m3/d 3,270 m3/d
Lystek Process 28,311 m3/d 25,000 m3/d
Biosolids Storage 3,786 m3/d 3,300 m3/d
Notes: 1. Based on maximum month BOD5 loading.
Historic Review and Capacity Assessment St. Mary's WWTP
SUMMARY OF HISTORIC REVIEW AND CAPACITY ASSESSMENT
TM31670902001.docx 9
Based on Table 4.2, with a reduced BOD5 concentration of 340 mg/L, the capacities of the WAS thickening, anaerobic digestion and biosolids dewatering unit processes are all still lower than the ECA rated ADF capacity of 5,560 m3/d. The impact of the reduced BOD5 loading on bioreactor capacity is discussed in Section 7.
4.1.2 Fertilizer Registration In October 2015, the Lystek product generated at the St. Mary's WWTP, called LysteGroTM, was registered as a biofertilizer under the Canadian Food Inspection Agency (CFIA). Registration as a fertilizer under the CFIA is site-specific, and includes a detailed review and evaluation of the product over a period of a year or longer. As a registered fertilizer, the LysteGroTM product is not considered a sewage sludge waste product and therefore is not subject to the same restrictions as biosolids with respect to land application and storage. Consequently, LysteGroTM may be land applied year round, and may be stored with no specific storage or permitting requirements. The removal of restrictions with respect to storage of the biofertilizer produced at the St. Mary's WWTP eliminates the impact of biosolids storage limitations on the capacity of the plant.

Historic Review and Capacity Assessment St. Mary's WWTP
INTENSIVE SAMPLING
TM31670902001.docx 10
5. INTENSIVE SAMPLING An intensive sampling program was conducted at the St. Mary's WWTP over seven business days from February 9, 2015 to February 15, 2015 as part of the optimization study. The objective of the intensive sampling program was to evaluate the performance of individual unit processes and to characterize the wastewater throughout the plant. The data were also used for the purposes of biological modelling to review the biological treatment capacity of the St. Mary's WWTP. Figure 5.1 presents the sampling locations in the liquid and solid treatment trains at the St. Mary's WWTP. Of the locations shown, samples of the raw wastewater, blended internal recycle, and secondary effluent were 24-hour composite samples collected using an autosampler. All other samples were discrete grab samples collected manually. • A number of samples collected from Day 4 to Day 7 were analyzed as a sludge matrix
rather than as a wastewater matrix. This had an impact on the parameters and the units in which the results were reported;
• Anoxic tank effluent and MLE recycle streams were not decanted prior to bottling, which may have impacted the laboratory results due to continued biological activity;
• RDT filtrate on Day 6 was notably higher than the rest of the results and may be due to a polymer delivery issue at the RDT. Similarly, no TWAS sample was collected on that day as the unit was taken offline; and,
• No biosolids sample was collected on Day 7 due to inadequate flow to the sampling location.
• A list of the various parameters analyzed as part of this study is included below. • Total COD (tCOD), filtered COD (fCOD) and flocculated and filtered COD
(ffCOD) • Total BOD5 (tBOD5), carbonaceous BOD5 (cBOD5) and filtered cBOD5 (fcBOD5) • Total phosphorus (TP) and dissolved reactive phosphorus • Total Kjeldahl nitrogen (TKN), total ammonia nitrogen (TAN), Nitrate + Nitrite
Nitrogen • Alkalinity (CaCO3 equivalent) • Total suspended solids (TSS) and volatile suspended solids (VSS) • pH • Dissolved Oxygen (DO)
5.1 Intensive Sampling Results Table 5.1 summarizes the results of the liquid treatment train sampling. Table 5.2 summarizes the results of the intensive sampling of the solids treatment train. The laboratory analysis results from the intensive sampling program are included in Appendix A. The following general observations were based on the results of the intensive sampling program. • The raw wastewater concentrations are representative of a high strength wastewater
with respect to BOD5, and medium strength with respect to TSS, TKN and TP (Metcalf & Eddy, 2003). The results of the sampling program were consistent with the Historic

Historic Review and Capacity Assessment St. Mary's WWTP
INTENSIVE SAMPLING
TM31670902001.docx 11
Review and Capacity Assessment with respect to BOD5 and TSS, and higher strength for TKN and TP.
• As discussed in Section 4.1.1, the Town has been working with industries to reduce the loading to the plant. Since the completion of the intensive sampling program, preliminary results indicate a reduction in BOD5 concentrations to approximately 340 mg/L. Although still considered a high strength wastewater in terms of BOD5 concentration, this is a significant reduction as compared to the results of the intensive sampling program as well as historic values.
• Figure 5.1 Process Flow Diagram of the St. Mary's WWTP • The impact of industrial wastewater on the raw wastewater quality is dependent on the
industries currently in operation and discharging to the collection system, (seasonal) variations in production and changes to operations. As a result, where wastewater composition includes significant industrial contributions, raw wastewater strength and composition can vary significantly throughout the year. Therefore, the duration of the program (7 days) may be insufficient to adequately capture the variability inherent in the type of wastewater treated at the St. Mary's WWTP and obtain representative wastewater characterization.
• Based on estimated flows, recycle streams (RDT filtrate, centrate and Lystek recycle) are equivalent to approximately 5% of the raw wastewater organic (BOD5 and TKN) loading to the plant.
• Based on Table 5.2 and assuming that supernatant was not withdrawn from the primary digester, the VS destruction in the primary digester was about 25%, and 36% through primary and secondary digestion, which are lower than the typical value of 56% at an hydraulic retention time (HRT) of 15 days.

Historic Review and Capacity Assessment St. Mary's WWTP
INTENSIVE SAMPLING
TM31670902001.docx 12
• The primary purpose of the intensive sampling program was to collect data on the sludge processes. At the time of the intensive sampling program, there were operational issues that resulted in the high MLSS. However, the elevated MLSS would have limited impact on the results of the sludge sampling as the effects on the sludge treatment train would not be observed immediately, but only under consistent operation at elevated MLSS concentrations over an extended period of approximately 2 weeks or longer, equivalent to the retention of solids in the bioreactors (or SRT).

Historic Review and Capacity Assessment St. Mary's WWTP
INTENSIVE SAMPLING
TM31670902001.docx 13
Table 5.1 Intensive Sampling Results - Liquid Treatment Train
Parameter Average Concentration (mg/L)
Raw Wastewater
Secondary Effluent
RDT Filtrate Centrate Lystek
Recycle Anoxic Tank
MLE Recycle MLSS RAS
tCOD 843 40.3 2,500 3,627 51,000 (1) 8,433 9,300 - 12,333
fCOD 470 - - - - - - - -
ffCOD 363 - - - - - - - -
tBOD5 454 9.9 813 90 3,800 (1) 2,367 2,600 - 3,200
cBOD5 420 5.4 533 68 3,900 (1) 1,667 1,700 - 2,167
fcBOD5 276 - - - - - - - -
TSS 246 21.0 3,157 8,867 65,714 7,214 7,943 7,871 10,214
VSS 219 19.3 1,886 6,291 40,486 5,610 5,887 6,224 7,937
TKN 43.1 9.4 - - 3,372 484 - - -
TAN 23.4 6.4 15.4 508 479 473 16.8 - 16.7
Nitrite 0.01 0.15 - - - - 0.38 - 0.34
Nitrate 0.10 1.31 - - - - 3.14 - 3.14
Nitrite + Nitrate 0.10 1.46 - - - - 3.21 - 3.14
TP 6.69 0.39 66.10 287 2,292 163 169 - 247
Orthophosphate 2.30 0.01 0.19 51 - 0.28 0.24 - 0.36
pH 7.30 7.76 7.42 7.79 10.00 7.05 7.11 7.13 7.15
Alkalinity 381 356 317 2,200 6,300 (1) - 360 663 (2) 357
Notes: Unless otherwise noted, sample results based on 3 samples analyzed as wastewater matrices and 4 samples analyzed as sludge matrices.
1. Based on the results of 1 sample analyzed as wastewater matrices. 2. Based on the results of 3 samples analyzed as wastewater matrices.

Historic Review and Capacity Assessment St. Mary's WWTP
INTENSIVE SAMPLING
TM31670902001.docx 14
Table 5.2 Intensive Sampling Results - Solids Treatment Train
Parameter
Average Concentration (TS, VS - %, Alkalinity mg/L as CaCO3)
TWAS RDT Filtrate Biosolids Centrate Hauled Biosolids (1)
Lystek Recycle (2)
Primary Digested Sludge
Dewatered Biosolids (3) WAS
TS 2.97 0.32 2.09 0.89 2.83 6.57 2.27 9.77 1.02
VS 81.9 45.5 68.0 71.5 67.0 61.7 74.9 69.0 78.2
pH 6.82 7.42 7.70 7.79 - 70.0 7.50 - 7.17
Alkalinity - 317 (3) 3,633 (3) 2,200 (3) - 6,300 - - 350 (1)
Notes: Unless otherwise noted, sample results based on 3 samples analyzed as wastewater matrices and 4 samples analyzed as sludge matrices.
1. Based on 2 samples analyzed as wastewater matrices and 4 samples analyzed as sludge matrices. 2. Based on 6 samples analyzed as sludge matrices and 1 sample analyzed as a wastewater matrix. 3. Based on 7 samples analyzed as sludge matrices.

Historic Review and Capacity Assessment St. Mary's WWTP
SECONDARY CLARIFIER STRESS TESTING
TM31670902001.docx 15
6. SECONDARY CLARIFIER STRESS TESTING Hydraulic stress testing was conducted to measure the performance of the secondary clarifiers under high flow and solids loading conditions, and to estimate the maximum hydraulic loading rates permissible before clarifier failure is observed. Over a five day period from November 2 to November 6, 2015, stress testing was completed on one each of the small and large secondary clarifiers at the St. Mary's WWTP. Target stress testing conditions were met by closing gates and directing flow preferentially to the test clarifier. In order to supplement the flows to the plant, wastewater stored in the offline secondary clarifiers were returned to the aeration tanks using the plant's RAS pumps. The following summarizes the stress testing conducted on each day of testing: • Baseline sampling of the small and large secondary clarifiers was conducted on
November 2, 2015. • Peak flow testing on the small secondary clarifier was carried out from approximately
9:00 AM to 2:00 PM on November 3, 2015. • Peak flow testing on the large secondary clarifier from 8:30 AM to 2:00 PM on
November 4, 2015. • Sustained peak flow testing of the large secondary clarifier was conducted from 8:30
AM to 3:00 PM on November 5, 2015. • Sustained peak flow testing of the small secondary clarifier was conducted from 8:30
AM to 3:00 PM on November 6, 2015. During the testing period, the following sampling and monitoring activities were performed: • Flows through the secondary clarifiers were monitored by installing a temporary
velocity-area (VA) flowmeter in the effluent trough of the secondary clarifiers, and flows were recorded throughout the course of the stress tests;
• An automatic sampler was installed in the effluent channel of each test secondary clarifier to collect secondary effluent samples. During baseline and sustained peak flow testing, each sample consisted of four 15 minute “sub-samples” to obtain a 1 hour composite sample. During peak flow testing, each sample consisted of two 15 minute “sub-samples” to obtain a 30 minute composite sample. Each sample was submitted to an accredited laboratory for cBOD5, TSS and TP analyses, and analyzed onsite for ortho-phosphorus and ultraviolet transmittance (UVT). The results of the laboratory analysis are included in Appendix B;
• Grab samples of mixed liquor were also submitted to an accredited laboratory for total TSS analysis; and,
• A sludge judge was used to monitor the radial profile of the sludge blanket in the test secondary clarifiers. Measurements were taken at 3 points along the radius of the secondary clarifiers.
It should be noted that individual RAS flow (from each secondary clarifier) or concentration data were unavailable for this study. For the purpose of calculating secondary

Historic Review and Capacity Assessment St. Mary's WWTP
SECONDARY CLARIFIER STRESS TESTING
TM31670902001.docx 16
clarifier SLR values, it was assumed that the RAS flow from each secondary clarifier was proportional to their relative surface area.
6.1 Stress Test Results
6.1.1 Baseline Conditions Preliminary data were collected by XCG staff on November 2, 2015 to obtain a baseline of the operation and performance of the secondary clarifiers under normal operating conditions prior to the initiation of stress testing. At the current flows, the plant is typically operated with the two large secondary clarifiers in service. The two small secondary clarifiers are brought online to provide additional capacity during wet weather events. In order to obtain a baseline of the performance of the small secondary clarifier, one unit was brought online in advance of the stress test. Table 6.1 presents the mixed liquor suspended solids (MLSS) concentration and effluent quality with respect to TSS and TP as well as the onsite measurements of ortho-phosphorus and UVT.
Table 6.1 Baseline Secondary Clarifier Performance Sample Location Small Secondary Clarifier Large Secondary Clarifier
MLSS 2,800 mg/L
Effluent TSS 11 mg/L <10 mg/L
Effluent TP 0.20 0.14 mg/L
Effluent Ortho-Phosphorus 0.08 mg/L 0.03 mg/L
Effluent Turbidity 5.65 NTU 1.83 NTU
Effluent UVT 71.3% 74.7%
Measured flow through the small secondary clarifier was approximately 443 m3/d on November 2, 2015, which resulted in an average SOR of approximately 5.0 m3/m2·d, and a SLR of approximately 55 kg/m2·d. Concurrently, the flow to the large secondary clarifier was 3,678 m3/d, which resulted in an average SOR of approximately 20.2 m3/m2·d, and a SLR of approximately 98 kg/m2·d. At these average SOR and SLR values, the average effluent TSS from the small secondary clarifier was 11 mg/L and the sludge blanket depths ranged from approximately 1.0 to 2.5 feet across the radius of the clarifier. The effluent TSS from the large clarifier was less than 10 mg/L and the sludge blanket depths ranged from approximately 0.25 to 1 feet. The TSS values corresponded to low effluent turbidities of 5.65 and 1.83 Nephelometric Turbidity Units (NTU) in the small and large secondary clarifier, respectively, resulting in UVT values of 71.3% and 74.7%. The secondary effluent TP was 0.20 mg/L and 0.14 mg/L from the small and large secondary clarifiers, respectively, which are in compliance with the daily effluent TP limit of 1.0 mg/L, and is below the effluent objective of 0.7 mg/L.

Historic Review and Capacity Assessment St. Mary's WWTP
SECONDARY CLARIFIER STRESS TESTING
TM31670902001.docx 17
6.1.2 Large Secondary Clarifier Peak Flow Testing A pre-stress test sample was collected to document the secondary clarifier performance before initiation of the stress test. Effluent TSS and TP were consistent with the baseline sampling, with a TSS value of less than 10 mg/L and a TP concentration of 0.11 mg/L. Figure 6.1 presents the secondary effluent TSS concentrations over the course of the peak flow testing of the large secondary clarifier and the recorded peak flows. Where sample results were less than the minimum detection limit of 10 mg/L, Figure 6.2 presents effluent TP and ortho-phosphorus concentrations and peak flows over the course of the peak flow testing.
Figure 6.1 Peak Flow Testing - Large Secondary Clarifier Effluent TSS
As shown in Figure 6.1, effluent TSS concentrations were relatively stable with a majority of results being less than 10 mg/L over the course of the stress test. Generally, the effluent TSS exceeded the effluent objective TSS concentration of 10 mg/L at hourly flows surpassing 8,000 m3/d, but remained below the daily compliance limit of 25 mg/L throughout the entire stress test. The highest recorded effluent TSS was 21 mg/L, at a peak hourly flow of approximately 8,200 m3/d. The secondary clarifier was pushed to a peak instantaneous flow of approximately 10,500 m3/d and a sustained flow of 9,400 m3/d before the test was discontinued due to hydraulic limitations resulting in a backup of floating sludge and scum in the secondary clarifier distribution chamber.

Historic Review and Capacity Assessment St. Mary's WWTP
SECONDARY CLARIFIER STRESS TESTING
TM31670902001.docx 18
Figure 6.2 Peak Flow Testing - Large Secondary Clarifier Effluent TP The effluent TP remained well below the objective of 0.7 mg/L over the course of the stress test, averaging 0.2 mg/L with a high of 0.3 mg/L. Throughout the stress test, ortho-phosphorus remained relatively constant with an average concentration of 0.06 mg/L, and represented anywhere from 20% to 90% of the measured effluent TP. This indicates that the secondary clarifier continued to operate consistently over the course of the stress test and was able to maintain performance with respect to effluent phosphorus. In the post stress test period, the effluent TP and ortho-phosphorus increased, which was inconsistent with the effluent TSS in the post stress test period. It is unclear what the cause of this may have been, but it may have been due to the release of the floating sludge from the distribution chamber once the stress test was discontinued. Figure 6.3 presents the SOR and SLR observed in the secondary clarifier during the peak flow testing. Figure 6.4 presents the sludge blanket profile at various flows over the course of the stress test.

Historic Review and Capacity Assessment St. Mary's WWTP
SECONDARY CLARIFIER STRESS TESTING
TM31670902001.docx 19
Figure 6.3 Peak Flow Testing - Large Secondary Clarifier SOR and SLR
Figure 6.4 Peak Flow Testing - Large Secondary Clarifier Sludge Blanket Profiles

Historic Review and Capacity Assessment St. Mary's WWTP
SECONDARY CLARIFIER STRESS TESTING
TM31670902001.docx 20
At an hourly flow of 8,200 m3/d, the peak hourly SOR was 45 m3/m2·d, which is higher than the MOE Design Guidelines value of 37 m3/m2·d for an activated sludge plant with chemical addition and no primary clarification. Although effluent performance was maintained at flows exceeding 8,200 m3/d, hydraulic issues in the distribution chamber prevented continued testing beyond these flows. At a MLSS concentration of 2,900 mg/L, the equivalent peak hourly SLR was estimated at 187 kg/m2·d, which is higher than the typical design maximum day SLR value 170 kg/m2·d for a nitrifying activated sludge plant with chemical addition and no primary clarification (MOE, 2008). As can be seen in Figure 6.4, the sludge blanket in the secondary clarifier did not vary significantly over the course of the peak flow testing, remaining at depths of less 3 feet or less throughout the stress test at all three measurement points. This confirms that the secondary clarifier did not fail during the peak flow testing as would have been evident through a sharp rise in sludge blanket depth, loss of sludge blanket definition, and sudden increase in effluent TSS concentration. Sustained Peak Flow Testing The objective of the sustained peak flow test was to demonstrate the performance of the secondary clarifier during a sustained peak flow event. A pre-stress test sample was collected to document the secondary clarifier performance before initiation of the stress test. Effluent TSS and TP concentrations were consistent with the baseline sampling, with a TSS value of less than 10 mg/L and a TP value of 0.14 mg/L. Figure 6.5 presents the effluent TSS concentration from the secondary clarifier over the course of the sustained peak flow testing and Figure 6.6 presents effluent TP and ortho-phosphorus concentrations over the same period. The average flow over the course of the sustained peak flow testing was 7,150 m3/d, resulting in a SOR of 39 m3/m2·d and a SLR of approximately 197 kg/m2·d with an average MLSS concentration of 3,120 mg/L. Over the duration of the test, no effluent TSS concentrations exceeding 10 mg/L were recorded. Similarly, effluent TP concentrations averaged 0.1 mg/L, which is well below the objective of 0.7 mg/L and the daily limit of 1.0 mg/L. Based on the sustained peak testing, the large secondary clarifiers are capable of maintaining effluent quality with respect to TSS and TP at an SLR of 197 kg/m2·d, which is higher than the typical value of 170 kg/m2·d for a nitrifying activated sludge plant with chemical addition and no primary clarification (MOE, 2008).

Historic Review and Capacity Assessment St. Mary's WWTP
SECONDARY CLARIFIER STRESS TESTING
TM31670902001.docx 21
Figure 6.5 Sustained Peak Flows - Large Secondary Clarifier Effluent TSS
Figure 6.6 Sustained Peak Flows - Large Secondary Clarifier Effluent TP

Historic Review and Capacity Assessment St. Mary's WWTP
SECONDARY CLARIFIER STRESS TESTING
TM31670902001.docx 22
Figure 6.7 presents the sludge blanket levels in the large secondary clarifier over the course of the sustained peak flow testing.
Figure 6.7 Sustained Peak Flows - Large Secondary Clarifier Sludge Blanket Profiles As can be seen in Figure 6.7, the sludge blanket in the secondary clarifier did not vary significantly over the course of the sustained peak flow testing, remaining at depths of less than 3 feet throughout the stress test at all three measurement points. This suggests that the secondary clarifier did not fail and was able to maintain performance over the course of the sustained peak flow testing.
6.1.3 Small Secondary Clarifier Peak Flow Testing A pre-stress test sample was collected to document the secondary clarifier performance before initiation of the stress test. Effluent TSS was consistent with the baseline sampling, with a TSS value of less than 10 mg/L. The measured effluent TP was slightly elevated as compared to the baseline sample at 0.19 mg/L. Figure 6.8 presents the secondary effluent TSS concentrations over the course of the peak flow testing of the small secondary clarifier and the recorded peak flows.

Historic Review and Capacity Assessment St. Mary's WWTP
SECONDARY CLARIFIER STRESS TESTING
TM31670902001.docx 23
Figure 6.8 Peak Flow Testing - Small Secondary Clarifier Effluent TSS
As shown in Figure 6.8, effluent TSS concentrations were relatively stable with a majority of results being less than 10 mg/L over the course of the stress test, and a peak of 15 mg/L occurring during the second hour of the stress test at a flow of approximately 1,400 m3/d. The effluent TSS exceeded the effluent objective TSS concentration of 10 mg/L two times over the course of the stress test despite hourly flows exceeding 3,500 m3/d, while remaining below the daily compliance limit of 25 mg/L. The small secondary clarifier was pushed to a peak instantaneous flow of approximately 4,565 m3/d before the test was discontinued due to the hydraulic limitations in the secondary clarifier distribution chamber. Figure 6.9 presents effluent TP and ortho-phosphorus concentrations and peak flows over the course of the peak flow testing. The effluent TP were consistently below the objective of 0.7 mg/L over the course of the stress test, averaging 0.27 mg/L with a high of 0.34 mg/L. Throughout the stress test, ortho-phosphorus remained relatively consistent with an average concentration of 0.06 mg/L, and represented anywhere from 12% to 35% of the measured effluent TP. This indicates that the secondary clarifier continued to operate consistently over the course of the stress test and was able to maintain performance with respect to effluent phosphorus.

Historic Review and Capacity Assessment St. Mary's WWTP
SECONDARY CLARIFIER STRESS TESTING
TM31670902001.docx 24
Figure 6.9 Peak Flow Testing - Small Secondary Clarifier Effluent TP In the post stress test period, the effluent TP decreased to below pre-stress test levels, which was expected. This is unlike the effluent response from the large clarifier. The cause for the variation in the post-stress test performance of the two clarifiers is unclear. Figure 6.10 presents the SOR and SLR observed in the secondary clarifier during the peak flow testing. At an hourly flow of 3,521 m3/d, the peak hourly SOR was 40 m3/m2·d, which is higher than the MOE Design Guidelines value of 37 m3/m2·d for an activated sludge plant with chemical addition and no primary clarification plant. Although effluent performance was maintained at flows of up to 3,521 m3/d, hydraulic issues in the distribution chamber prevented continued testing beyond these flows. At a MLSS concentration of 2,700 mg/L, the equivalent peak hourly SLR was estimated at 135 kg/m2·d assuming that the proportion of RAS from the secondary clarifiers is proportional to their respective surface areas. Figure 6.11 presents the sludge blanket profile at various flows over the course of the stress test.

Historic Review and Capacity Assessment St. Mary's WWTP
SECONDARY CLARIFIER STRESS TESTING
TM31670902001.docx 25
Figure 6.10 Peak Flow Testing - Small Secondary Clarifier SOR and SLR
Figure 6.11 Peak Flow Testing - Small Secondary Clarifier Sludge Blanket Profiles

Historic Review and Capacity Assessment St. Mary's WWTP
SECONDARY CLARIFIER STRESS TESTING
TM31670902001.docx 26
As can be seen in Figure 6.11, the sludge blanket in the secondary clarifier did not vary significantly over the course of the peak flow testing, with an average depth of slightly over 2 feet, with maximum measured depths of 3.5 feet. This confirms that the secondary clarifier did not fail during the peak flow testing as would have been evident through a sharp rise in sludge blanket depth, loss of sludge blanket definition, and sudden increase in effluent TSS concentration. Sustained Peak Flow Testing A pre-stress test sample was collected to document the secondary clarifier performance before initiation of the stress test. Effluent TSS and TP were consistent with the baseline sampling, with a TSS value of less than 10 mg/L and a TP value of 0.16 mg/L. Figure 6.12 presents the effluent TSS concentration from the secondary clarifier over the course of the sustained peak flow testing and Figure 6.13 presents effluent TP and ortho-phosphorus concentrations over the testing period.
Figure 6.12 Sustained Peak Flows - Small Secondary Clarifier Effluent TSS The average flow over the course of the sustained peak flow testing was 3,228 m3/d, resulting in a SOR of 36 m3/m2·d and a SLR of approximately 176 kg/m2·d with an average MLSS concentration of 2,920 mg/L. Over the duration of the test, no effluent TSS concentrations exceeding 10 mg/L were recorded. Similarly, effluent TP concentrations averaged 0.10 mg/L with a peak reading of 0.16 mg/L. The effluent TP was well below the objective of 0.7 mg/L and the daily limit of 1 mg/L. The post test sample showed an elevated TP concentration of 0.49 mg/L. This is inconsistent with the post stress test ortho-phosphorus and TSS concentrations, both of which decreased after the termination of the stress test. Because the ortho-phosphorus did not increase post stress, the soluble fraction of the TP is unlikely to have the increase in TP. If the elevated TP was a result of the release of floating sludge from the distribution chamber, then the TSS would be expected to be

Historic Review and Capacity Assessment St. Mary's WWTP
SECONDARY CLARIFIER STRESS TESTING
TM31670902001.docx 27
elevated as well. As this was not the case, the accuracy of this analytical result is uncertain, and the discrepancy may have been the result of sampling or analytical error. Based on the sustained peak testing, the small secondary clarifiers are capable of maintaining effluent quality with respect to TSS and TP at an SLR of 176 kg/m2·d, which is consistent with the typical value of 170 kg/m2·d for an activated sludge plant with chemical addition and no primary clarification (MOE, 2008).
Figure 6.13 Sustained Peak Flows - Small Secondary Clarifier Effluent TP
Figure 6.14 presents the sludge blanket profile at various flows over the course of the sustained peak flow testing. As can be seen in Figure 6.14, the sludge blanket in the secondary clarifier did not vary significantly over the course of the sustained peak flow testing, remaining at depths of less than 3.5 feet throughout the stress test at all three measurement points. This suggests that the secondary clarifier did not fail and was able to maintain performance over the course of the sustained peak flow testing.

Historic Review and Capacity Assessment St. Mary's WWTP
SECONDARY CLARIFIER STRESS TESTING
TM31670902001.docx 28
Figure 6.14 Sustained Peak Flows - Small Secondary Clarifier Sludge Blanket Profiles
Historic Review and Capacity Assessment St. Mary's WWTP
BIOLOGICAL PROCESS MODELLING
TM31670902001.docx 29
7. BIOLOGICAL PROCESS MODELLING
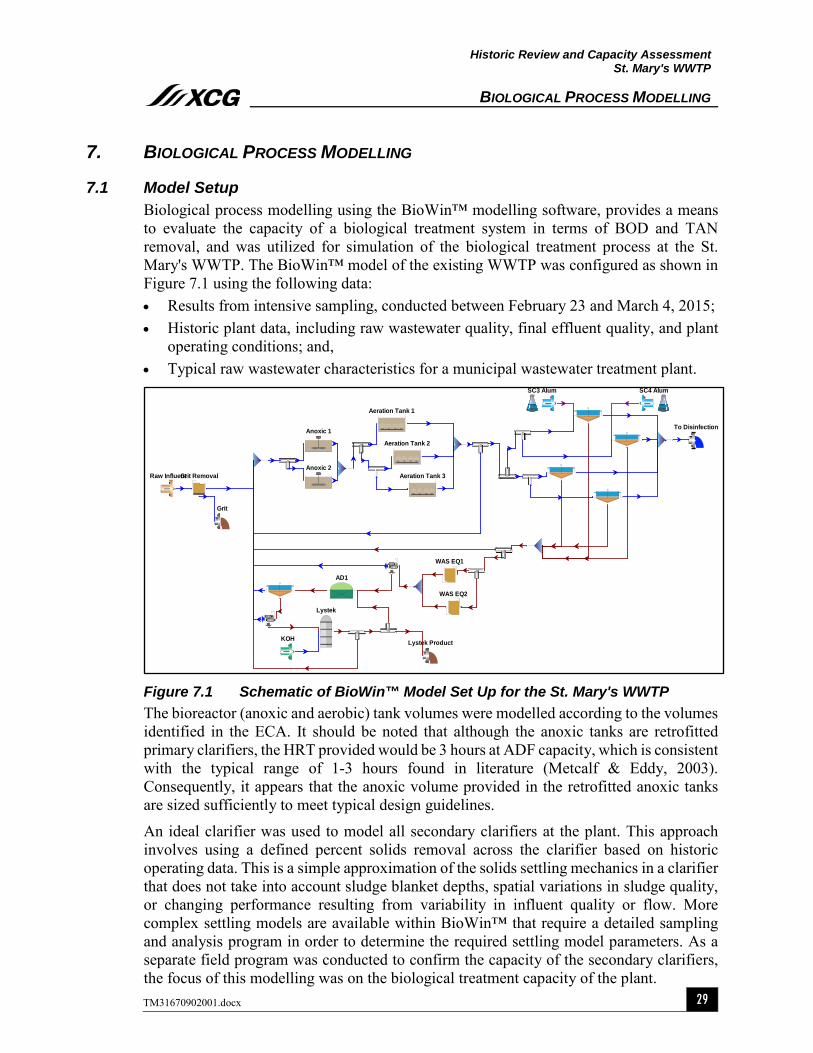
7.1 Model Setup Biological process modelling using the BioWin™ modelling software, provides a means to evaluate the capacity of a biological treatment system in terms of BOD and TAN removal, and was utilized for simulation of the biological treatment process at the St. Mary's WWTP. The BioWin™ model of the existing WWTP was configured as shown in Figure 7.1 using the following data: • Results from intensive sampling, conducted between February 23 and March 4, 2015; • Historic plant data, including raw wastewater quality, final effluent quality, and plant
operating conditions; and, • Typical raw wastewater characteristics for a municipal wastewater treatment plant.
Figure 7.1 Schematic of BioWin™ Model Set Up for the St. Mary's WWTP The bioreactor (anoxic and aerobic) tank volumes were modelled according to the volumes identified in the ECA. It should be noted that although the anoxic tanks are retrofitted primary clarifiers, the HRT provided would be 3 hours at ADF capacity, which is consistent with the typical range of 1-3 hours found in literature (Metcalf & Eddy, 2003). Consequently, it appears that the anoxic volume provided in the retrofitted anoxic tanks are sized sufficiently to meet typical design guidelines.
An ideal clarifier was used to model all secondary clarifiers at the plant. This approach involves using a defined percent solids removal across the clarifier based on historic operating data. This is a simple approximation of the solids settling mechanics in a clarifier that does not take into account sludge blanket depths, spatial variations in sludge quality, or changing performance resulting from variability in influent quality or flow. More complex settling models are available within BioWin™ that require a detailed sampling and analysis program in order to determine the required settling model parameters. As a separate field program was conducted to confirm the capacity of the secondary clarifiers, the focus of this modelling was on the biological treatment capacity of the plant.
Anoxic 1
Anoxic 2Aeration Tank 3
Aeration Tank 2
Aeration Tank 1
Raw InfluentGrit Removal
To Disinfection
Grit
AD1
WAS EQ1
WAS EQ2
Lystek
Lystek Product
SC4 AlumSC3 Alum
KOH
Historic Review and Capacity Assessment St. Mary's WWTP
BIOLOGICAL PROCESS MODELLING
TM31670902001.docx 30
Dewatering units were used to model the rotary drum thickener and centrifuge. In BioWin™ dewatering units are simple processes that model the physical process of separation of solids from the liquid phase based on user input for solids capture percentage, and underflow rate (i.e. filtrate or centrate). Operation of these units was defined based on typical parameters (M&E, 2003) in conjunction with sample results from the intensive sampling program. The Lystek process was modelled using the thermal hydrolysis process unit available in version 4.1 of BioWin™. This is a complex process which simulates the breakdown of particulate material in the digested sludge into soluble components. For the purposes of modelling the St. Mary's WWTP, default parameters were used for the thermal hydrolysis unit.
7.2 Model Calibration and Validation The model was calibrated according to the procedure for model calibration as detailed in Methods for Wastewater Characterization in Activated Sludge Modelling (WEF, 2003), based on historic plant operating and performance data collected between January and March, 2010, and results from an intensive sampling program (conducted between February 23 to March 4, 2015). Historic plant information was used as the source of data for all streams except solids concentrations for the RDT filtrate, centrate, Lystek influent, and Lystek effluent streams, which were based on data from the intensive sampling program. As noted in Section 5, an intensive sampling program of the St. Mary's WWTP was conducted to characterize the wastewater throughout the plant and to evaluate unit process performance where historic data were unavailable. This data were used in the calibration of the biological model to define the performance of unit processes in the liquid and solids treatment trains. Although the intensive sampling program included samples of raw wastewater, the duration of the program (7 days) was insufficient to adequately capture the variability inherent in the type of wastewater treated at the St. Mary's WWTP and to obtain wastewater fractions that are representative of the average conditions at the plant. Additionally, the Town has been working with industries to reduce the loading to the plant, with preliminary results showing a reduction in BOD5 strength by as much as 13 percent since the intensive sampling program was conducted. These changes may have also impacted the raw wastewater fractions. Therefore, due to the uncertainty with the industrial impact on the raw wastewater characteristics, and for purposes of modelling, historic raw wastewater quality data and the default BioWin™ fractions were used to characterize the raw wastewater. The following assumptions were also made for the purposes of modelling at the St. Mary's WWTP: • RAS and WAS flows were modelled based on historic operating data; • MLE and Lystek recycle flows were set to constant values based on input from
Operations Staff; • Recycle flows from the RDT, secondary digester, and centrifuge were adjusted to
achieve target solids concentrations based on results from the intensive sampling program;

Historic Review and Capacity Assessment St. Mary's WWTP
BIOLOGICAL PROCESS MODELLING
TM31670902001.docx 31
• The review of the oxygenation system, as part of the Historic Review and Capacity Assessment (XCG, 2014), identified that the blowers have capacity in excess of the ECA rated capacity of the plant. As such, it was assumed that a target DO concentration of 2.0 mg/L could be maintained at future plant flows;
• In practice, digested biosolids are mixed with steam and potassium hydroxide (KOH) in the Lystek reactor, which works to reduce the solids concentration. For modelling purposes, an extra stream was added to the Lystek inlet to simulate KOH flow, and adjusted to achieve target concentrations in the Lystek product stream. This stream had no impact on the pH of the Lystek product; and,
• The influent alkalinity was adjusted as required to achieve the target pH measured through the treatment processes.
Nutrient limitation errors were encountered during calibration and validation, resulting in elevated effluent TAN concentrations, which was inconsistent with the historic performance of the plant. In order to correct the nutrient deficiencies in the model, and to achieve target final effluent TP and orthophosphate concentrations, modelled alum dosages were lower than historic reported values to ensure sufficient soluble phosphorus concentrations in the bioreactors for biological growth. Results of the model calibration are presented in Table 7.1 alongside historic recorded values for comparison.
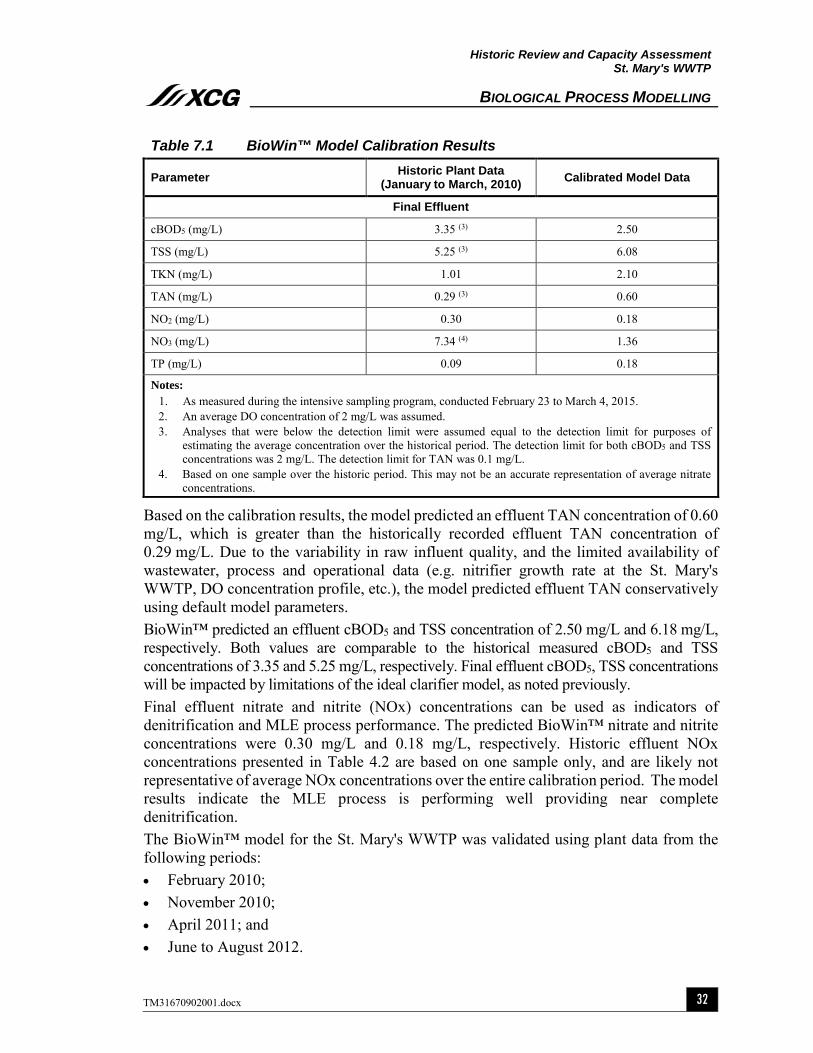
Table 7.1 BioWin™ Model Calibration Results
Parameter Historic Plant Data (January to March, 2010) Calibrated Model Data
Raw Wastewater
Flow (m3/d) 3,372 3,372
BOD5 (mg/L) 389 389
TSS (mg/L) 241 241
TKN (mg/L) 23.9 23.9
TP (mg/L) 4.38 4.38
Plant Operating Data
MLSS (mg/L) 5,494 5,467
MLVSS (mg/L) 4,427 4,811
DO (mg/L) - 2.0 (2)
Temperature (°C) - 10
RAS Flow (m3/d) 4,093 4,018
RAS TSS (mg/L) - 9,905
WAS Flow (m3/d) 133 130
RDT Filtrate TSS (mg/L) 2,500 - 3,000 (1) 1,435
Centrate TSS (mg/L) 8,900 (1) 9,930
Lystek Feed TS% 10.0% (1) 9.2%
Lystek Product TS% 6.5% (1) 5.8%
Historic Review and Capacity Assessment St. Mary's WWTP
BIOLOGICAL PROCESS MODELLING
TM31670902001.docx 32
Table 7.1 BioWin™ Model Calibration Results
Parameter Historic Plant Data (January to March, 2010) Calibrated Model Data
Final Effluent
cBOD5 (mg/L) 3.35 (3) 2.50
TSS (mg/L) 5.25 (3) 6.08
TKN (mg/L) 1.01 2.10
TAN (mg/L) 0.29 (3) 0.60
NO2 (mg/L) 0.30 0.18
NO3 (mg/L) 7.34 (4) 1.36
TP (mg/L) 0.09 0.18
Notes: 1. As measured during the intensive sampling program, conducted February 23 to March 4, 2015. 2. An average DO concentration of 2 mg/L was assumed. 3. Analyses that were below the detection limit were assumed equal to the detection limit for purposes of
estimating the average concentration over the historical period. The detection limit for both cBOD5 and TSS concentrations was 2 mg/L. The detection limit for TAN was 0.1 mg/L.
4. Based on one sample over the historic period. This may not be an accurate representation of average nitrate concentrations.
Based on the calibration results, the model predicted an effluent TAN concentration of 0.60 mg/L, which is greater than the historically recorded effluent TAN concentration of 0.29 mg/L. Due to the variability in raw influent quality, and the limited availability of wastewater, process and operational data (e.g. nitrifier growth rate at the St. Mary's WWTP, DO concentration profile, etc.), the model predicted effluent TAN conservatively using default model parameters. BioWin™ predicted an effluent cBOD5 and TSS concentration of 2.50 mg/L and 6.18 mg/L, respectively. Both values are comparable to the historical measured cBOD5 and TSS concentrations of 3.35 and 5.25 mg/L, respectively. Final effluent cBOD5, TSS concentrations will be impacted by limitations of the ideal clarifier model, as noted previously. Final effluent nitrate and nitrite (NOx) concentrations can be used as indicators of denitrification and MLE process performance. The predicted BioWin™ nitrate and nitrite concentrations were 0.30 mg/L and 0.18 mg/L, respectively. Historic effluent NOx concentrations presented in Table 4.2 are based on one sample only, and are likely not representative of average NOx concentrations over the entire calibration period. The model results indicate the MLE process is performing well providing near complete denitrification. The BioWin™ model for the St. Mary's WWTP was validated using plant data from the following periods: • February 2010; • November 2010; • April 2011; and • June to August 2012.

Historic Review and Capacity Assessment St. Mary's WWTP
BIOLOGICAL PROCESS MODELLING
TM31670902001.docx 33
Validation periods were selected to in order to assess the capability of the model to simulate the plant performance under a range of influent characteristics and operating conditions (i.e. temperature). For each validation period, raw influent concentrations and RAS rates were adjusted based on plant data. However, operational parameters of other unit treatment processes were maintained as per the calibrated model. The model predicted final effluent TAN and cBOD5 concentrations are shown in Figure 7.1 and Figure 7.2, respectively. Historic plant data as well as the ECA effluent objective are also shown in each figure for comparison. In Figure 7.2, the model predicted effluent cBOD5 concentrations are (slightly) lower than the historic values, but are within the typical level of accuracy for cBOD5 measurements. Based on results of the calibration and validation, it appears the BioWin™ model provides an adequate prediction of historical biological treatment performance on an average basis. It should be noted that variability in the quantity, strength and composition of industrial wastewater to the St. Mary's WWTP will impact the raw wastewater characteristics and the performance of the treatment plant, and may not have been captured in the model simulations due to the limited availability of historic characterization data to accurately simulate the impact and variation in industrial wastewater.
Figure 7.2 Historic and Model Predicted Final Effluent cBOD5 Concentrations
0
2
4
6
8
10
February 2010 November 2010 April 2011 June - August 2012
Fina
l Effl
uent
cBO
D 5Co
ncen
trat
ion
(mg/
L)
Historical Plant Average BioWin™ Predicted
Final Effluent cBOD5 Objective (10 mg/L)

Historic Review and Capacity Assessment St. Mary's WWTP
BIOLOGICAL PROCESS MODELLING
TM31670902001.docx 34
Figure 7.3 Historic and Model Predicted Final Effluent TAN Concentrations
7.3 Determining Design SRT Nitrifier growth rate, and therefore nitrification performance, is dependent on the wastewater temperature. Consequently, it is important to select a design minimum month winter temperature that provides a reasonable basis for design, but is not overly conservative. Insufficient data on wastewater temperature were available for the purposes of biological modelling. Based on experience at similar plants, a conservative minimum monthly average winter temperature of 9°C was selected. The modelled raw wastewater quality for the St. Mary's WWTP was based on average values from 2010 to 2012 as presented in the WWTP Annual Reports. For the purposes of model simulations, the influent TP concentration was adjusted (increased) to ensure nutrient limited conditions would not negatively affect the model predicted nitrification performance. This is a reasonable assumption since the plant does not appear to have historically been affected by nutrient limited conditions. The developers of the modelling software (EnviroSim) were consulted and confirmed this approach did not invalidate the model results with respect to effluent cBOD5 or TAN. It is important to note that the ratio of BOD:TKN:TP in the wastewater can impact the biological treatment performance of the plant and its ability to meet effluent objectives and limits. A summary of the design raw wastewater quality is presented in Table 7.2. The biological treatment capacity of a WWTP is typically limited by its ability to meet effluent TAN objectives (if applicable). The effluent TAN objective at the St. Mary's WWTP is 2.5 mg/L, and was used to define maximum allowable effluent TAN concentrations for modelling purposes.
0.0
0.5
1.0
1.5
2.0
2.5
February 2010 November 2010 April 2011 June - August 2012
Fina
l Effl
uent
TAN
Conc
entr
atio
n (m
g/L)
Historical Plant Average BioWin™ Predicted
Final Effluent TAN Objective (2.5 mg/L)

Historic Review and Capacity Assessment St. Mary's WWTP
BIOLOGICAL PROCESS MODELLING
TM31670902001.docx 35
Table 7.2 Summary of Modelled Raw Wastewater Quality Parameter (1) Value
Influent BOD5 424 mg/L
Influent TSS 254 mg/L
Influent TKN 24 mg/L
Influent TP (2) 5.0 mg/L
Notes: 1. Based on annual reports (2010 - 2012). 2. Adjusted to ensure reaction conditions are not limited by the availability of nutrients.
Modelling the St. Mary's WWTP at various flow and mixed liquor concentrations was completed to establish the relationship between SRT and effluent TAN concentrations, which was used to determine the minimum SRT required to achieve the effluent TAN objective of 2.5 mg/L. Figure 7.4 presents the relationship between the model predicted average effluent TAN concentration (vertical axis) and the SRT (horizontal axis) at the design minimum month temperature of 9°C, and at the ECA rated ADF flow of 5,560 m3/d.
Figure 7.4 Model Predicted Effluent TAN Concentration v. SRT Based on Figure 5.1, the minimum SRT required to meet the effluent TAN objective of 2.5 mg/L at 9°C is 5.4 days. In order to provide an allowance for variations in temperature and organic loading, a factor of 1.7 was applied to the minimum SRT based on historic maximum month BOD5 loading factor of just over 1.5 and a safety factor of 15%, to obtain a target SRT of 9.2 days. This target SRT is marginally greater than the value of 8.5 days identified in the St. Mary's WWTP pilot plant study (CRA, 2007).
0.0
1.0
2.0
3.0
4.0
5.0
6.0
0.0 1.0 2.0 3.0 4.0 5.0 6.0 7.0 8.0 9.0
Efflu
ent T
AN (m
g/L)
SRT (days)
Mininum
SRT = 5.4 days
Effluent TAN Objective = 2.5 mg/L

Historic Review and Capacity Assessment St. Mary's WWTP
OPPORTUNITIES FOR OPTIMIZATION
TM31670902001.docx 36
8. OPPORTUNITIES FOR OPTIMIZATION 8.1 Secondary Treatment Capacity
The capacity of the bioreactors is based on the bioreactor volume, design BOD5 loading and SRT, solids yield and design MLSS concentration. The design MLSS concentration also directly affects the design secondary clarifier SLR, impacting the MDF capacity. Increasing the MLSS concentration results in an increase in bioreactor capacity while decreasing the equivalent secondary clarifier capacity (i.e. due to higher SLR), and vice versa. Therefore, an optimum operating point can be determined that maximizes the ADF capacity of the bioreactors and the MDF capacity of the secondary clarifiers at a specific MLSS concentration. The optimal operating MLSS concentration was determined by plotting the bioreactor ADF capacity and secondary clarifier MDF capacity against MLSS concentration. The ADF and MDF capacities at varying MLSS concentrations were plotted on the same graph based on the ECA rated MDF peak factor of 2.56. The intersection of the two operating lines is the optimal operating mixed liquor concentration that simultaneously maximizes the ADF and MDF capacities of the secondary treatment processes. Figure 8.1 presents the optimum operating point for secondary treatment at the St. Mary's WWTP based on the following: • An influent BOD5 concentration of 340 mg/L; • A MDF peak factor of 2.56 based on the ECA; • A design SRT of 9.2 days as determined through BioWin™ modelling; and, • A maximum day SLR values of 176 kg/m2∙d for the small secondary clarifiers and
197 kg/m2∙d for the large secondary clarifiers as determined through stress testing.

Historic Review and Capacity Assessment St. Mary's WWTP
OPPORTUNITIES FOR OPTIMIZATION
TM31670902001.docx 37
Figure 8.1 Optimal Operating Point for Secondary Treatment at Historic Average BOD5 Concentration
As shown in Figure 8.1, the ADF capacity of the bioreactors increases proportionally with the MLSS while the MDF capacity of the secondary clarifiers decreases with increasing MLSS concentrations. Based on Figure 8.1, the optimal MLSS concentration for the St. Mary's WWTP is about 4,500 mg/L. At this MLSS concentration, the ADF capacity of the bioreactors is 6,415 m3/d and the MDF capacity of the plant is 16,440 m3/d, which are higher than the ECA rated ADF and peak flow capacities of the plant. As noted, the optimal MLSS concentration maximizes the ADF and MDF capacities of the secondary treatment unit processes. Increasing the MLSS will increase the bioreactor capacity while simultaneously reducing the clarifier capacity and vice versa. A lower target MLSS concentration may be selected that ensures that the ADF capacity is consistent with the ECA rated capacity while providing some safety for the operation of the secondary clarifiers by increasing their MDF capacity. Selecting a target MLSS concentration of 4,000 mg/L, which is consistent with the high end of the typical range of MLSS concentrations of an MLE process (Metcalf & Eddy, 2003), would result in a bioreactor capacity of 5,690 m3/d and a secondary clarifier MDF capacity of 18,529 m3/d. It should be noted that the optimal MLSS concentration, and the resulting ADF and MDF capacities, are based on an average raw wastewater BOD5 concentration of 340 mg/L. At different wastewater strengths, the optimal operating point (MLSS concentration) for the bioreactors will also change.

Historic Review and Capacity Assessment St. Mary's WWTP
OPPORTUNITIES FOR OPTIMIZATION
TM31670902001.docx 38
Figure 8.2 presents the Optimal MLSS concentrations and the resulting ADF and MDF capacities of the bioreactors and secondary clarifiers at different raw wastewater BOD5 concentrations.
Figure 8.2 MLSS Concentrations and Secondary Treatment Capacities at Varying BOD5 Concentrations As can be seen in Figure 8.2, the optimal MLSS concentration increases as BOD5 increases, resulting in lower ADF and MDF capacities of the secondary treatment unit processes. At a typical BOD5 concentration of 170 mg/L for domestic wastewater, the ADF and MDF capacities would be 9,075 m3/d and 23,260 m3/d, respectively, at a MLSS concentration of about 3,200 mg/L. At a BOD5 concentration of 450 mg/L, the ADF capacity would be 5,580 m3/d with a required MLSS concentration of nearly 5,200 mg/L. The MDF capacity at this MLSS concentration would be about 14,300 m3/d. Alternatively, if the target ADF capacity equivalent to the ECA rated capacity of 5,560 m3/d is maintained, lower target MLSS concentrations may be selected to provide additional MDF capacity in the secondary clarifiers. The MLSS concentrations required to maintain the target SRT and bioreactor capacity would vary according to the influent BOD5 concentration as discussed previously. Figure 8.2 presents the minimum MLSS concentration required to maintain a biological treatment capacity of 5,560 m3/d at an SRT of 9.2 days at different influent BOD5 concentrations.

Historic Review and Capacity Assessment St. Mary's WWTP
OPPORTUNITIES FOR OPTIMIZATION
TM31670902001.docx 39
Figure 8.3 MLSS Concentrations at 5,560 m3/d and Varying BOD5 Concentrations As shown in Figure 8.3, at a typical BOD5 concentration of 170 mg/L for domestic wastewater, the minimum MLSS required for a bioreactor capacity of 5,560 m3/d is about 2,000 mg/L. At a BOD5 concentration of 450 mg/L, an MLSS concentration in excess of 5,000 mg/L would be required to provide the existing ECA rated ADF capacity of the plant. At these lower MLSS concentrations, the equivalent MDF capacities of the secondary clarifiers would range from 14,340 m3/d at a BOD5 concentration of 450 mg/L, to over 47,000 m3/d at a typical domestic BOD5 concentration of 170 mg/L, at which point the capacity would be limited by the SOR value as discussed below. Based on the results of the stress testing, the small secondary clarifiers have an SOR of 40 m3/m2∙d, and the large secondary clarifiers have an SOR of 45 m3/m2∙d. With a total surface area of 542 m2 (i.e. total surface are of 178 m2 - small (2) and 364 m2 - large (2)), the secondary clarifiers have a PHF capacity of 23,500 m3/d. Additional metering equipment and flow controls may be required in order to achieve this maximum PHF capacity. A hydraulic analysis should be conducted in order to verify the hydraulics through the plant, and what controls would be required to control peak flows to the secondary clarifiers.

Historic Review and Capacity Assessment St. Mary's WWTP
OPPORTUNITIES FOR OPTIMIZATION
TM31670902001.docx 40
8.2 Solids Treatment Capacity
8.2.1 WAS Thickening Based on operation 24 hours per day, 7 days per week, and a reduced raw influent wastewater BOD5 concentration of 340 mg/L, the equivalent ADF capacity of the RDT could be as high as 7,861 m3/d, which is higher than the ECA rated capacity of the plant. This estimate was based on historic MLVSS:MLSS ratios, historic maximum month BOD5 loading factor of 1.52, and typical WAS yield and WAS concentration of 9,000 mg/L (MOE, 2008). According to Operations Staff, WAS is thickened to approximately 2% due to the limited ability of the existing transfer pumps to handle higher concentration TWAS. The historically low TWAS concentrations have a negative impact on the capacity of downstream unit processes. Replacement of the existing transfer pumps with equipment that is capable of pumping thicker sludge would allow for increased TWAS concentrations of 4% TS or higher (typical TWAS concentrations of 4-8% TS (MOE, 2008)), which would increase the capacities of the anaerobic digester and centrifuge.
8.2.2 Anaerobic Digestion At a raw wastewater BOD5 concentration of 340 mg/L, the equivalent ADF capacity of the anaerobic digester is approximately 2,972 m3/d, limited by a design HRT of 15 days. If the average TWAS concentration was increased to 4% TS, the anaerobic digester capacity based on HRT would increase to over 5,900 m3/d. At that point, the digester would be limited by the design VS loading of 1,600 g/m3∙d, to an equivalent ADF capacity of 4,429 m3/d. According to Metcalf & Eddy (2003), anaerobic digesters can be designed with VS loading rates as high as 4,800 g/m3∙d, as determined by the accumulation of toxic material such as ammonia, in the digesters. At an equivalent ADF capacity of 5,560 m3/d, the estimated maximum month VS loading rate to the anaerobic digesters is 2,009 g/m3∙d, which is higher than the MOE Design Guidelines value of 1,600 g/m3∙d but well below the maximum value of 4,800 g/m3∙d from Metcalf & Eddy (2003). Historically, the estimated max month VS loading rates have approached the MOE Design Guidelines value with no report of negative impacts on the solids treatment train. This is likely due to the fact that digester performance is not as critical at the St. Mary's WWTP since the Lystek process provides complete stabilization of the biosolids to a fertilizer rated product. It is anticipated that overall solids treatment train at the St. Mary's WWTP would continue to meet the requirements for solids stabilization at the projected digester VS loading rate of 2,009 g/m3∙d at the ECA rated ADF capacity of the plant; however, as flows approach the plant's rated capacity, digester performance should be monitored. Operation of anaerobic digesters outside of design parameters can lead to digester souring and process upset, which could negatively impact the performance of downstream unit processes. In the event that the digester performance is negatively impacted by the VS loading, and is negatively impacting the overall solids treatment train performance, the following three options that would address the VS loading capacity limitation of the anaerobic digester: • Further reduction in BOD5 loading - Additional reductions in BOD5 loading realized
through continued efforts with industrial contributors would further reduce sludge generation at the St. Mary's WWTP, increasing the equivalent capacity of the anaerobic digester;

Historic Review and Capacity Assessment St. Mary's WWTP
OPPORTUNITIES FOR OPTIMIZATION
TM31670902001.docx 41
• Provide additional primary digester volume - This may be achieved by converting the secondary digester to be able to operate as a primary digester. The modifications may include new gas recirculation pumping and appurtenances, provisions for heating the secondary digester, modifications to feed piping and mixing equipment; and,
• Partial bypass of anaerobic digestion - Modify piping and solids treatment train operation to allow for the bypass of TWAS in excess of the digester capacity directly to the centrifuge for processing in the Lystek system.
8.2.3 Dewatering Based on a reduced raw wastewater BOD5 concentration of 340 mg/L, the equivalent ADF capacity of the centrifuge could be as high as 3,705 m3/d, which is lower than the ECA rated capacity of the plant. This estimate was based on operation 8 hours per day, 5 days per week, historic MLVSS:MLSS ratios, historic maximum month BOD5 loading factor of 1.52, typical WAS yield and WAS concentration of 9,000 mg/L (MOE, 2008), and assumed RDT solids capture of 95 % and TWAS solids concentration of 2.0%. If the average TWAS concentration was increased to 4% TS, the centrifuge capacity would increase to nearly 7,409 m3/d. If a TWAS concentration of 4.0 % TS is not feasible, weekly centrifuge runtime could be increased in order to increase the equivalent centrifuge capacity. At a design throughput capacity of 3.3 L/s and a TS concentration of 2.0 % TS, the centrifuge would need to operate for approximately 60 hours per week in order to process the estimated weekly volume of biosolids generated at the St. Mary's WWTP. Modifying the operating schedule of the centrifuges (i.e. increase the operation to 12 hours per day, 5 days per week) would provide sufficient centrifuge operating time at the ECA rated ADF capacity of the plant. Alternatively, biosolids (or TWAS) flow exceeding the capacity of the centrifuge can be bypassed directly to the Lystek process and blended with dewatered biosolids prior to stabilization. This would involve modifications to piping and solids treatment train operation.
8.3 General Recommendations The following general recommendations were made in order to improve plant operation/performance/capacity by addressing possible deficiencies or by providing Operations Staff with additional data to enhance decision making and process control. • Long term wastewater characterization sampling - The duration of the intensive
sampling program (7 days) completed as part of this study was insufficient to adequately capture the variability inherent in the type of wastewater treated at the St. Mary's WWTP. Expansion of the existing raw wastewater sampling program currently conducted at the plant to include more detailed analysis/characterization of the raw wastewater composition would provide additional data that could allow for a better understanding of the impacts of wastewater composition on plant operations and performance, and to adjust plant operations accordingly. In the long term, the goal would be to use the data to correlate trends in plant performance to changes in wastewater composition. This information could then be used to anticipate conditions at the plant;

Historic Review and Capacity Assessment St. Mary's WWTP
OPPORTUNITIES FOR OPTIMIZATION
TM31670902001.docx 42
• Sample intermediate sludge and recycle streams - Currently, intermediate sludge (RDT TWAS, biosolids, dewatered biosolids) and internal recycle (RDT filtrate, supernatant, centrate) streams are not sampled on a regular basis. Consequently, it is not possible to assess the operation and/or performance of some of these unit processes or the current impact on the liquid treatment train. Expanding the current sampling program to include sampling from these streams would allow for a better understanding of the current operation of individual unit processes, and allow for targeted operational changes based on the current conditions and performance; and,
Table 8.1 summarizes the recommended supplementary sampling, including locations, sampling frequency and parameters for analysis. It should be noted that the table includes parameters that are already collected and analyzed for weekly, but are included for completeness.
Table 8.1 Recommended Supplementary Sampling
Parameter Raw Wastewater
Secondary Effluent, MLE Recycle, RAS
Anoxic Tank RDT Filtrate,
Centrate, Lystek
Recycle
WAS, TWAS, Biosolids,
Hauled Biosolids, Primary Digested Sludge,
Dewatered Biosolids
tCOD Weekly Weekly Weekly Weekly
fCOD, ffCOD Weekly
tBOD5, cBOD5 Weekly Weekly Weekly Weekly
fcBOD5 Weekly
TSS, VSS Weekly Weekly Weekly Weekly
TKN Weekly Weekly
TAN Weekly Weekly Weekly Weekly
Nitrite, Nitrite Weekly Weekly
TP, Orthophosphate
Weekly Weekly Weekly Weekly
pH Weekly Weekly Weekly Weekly Weekly
Alkalinity Weekly Weekly Weekly Weekly Weekly
TS, VS Weekly Weekly
• Based on the observations during stress testing, there appears to be a hydraulic bottleneck at the secondary clarifier distribution chamber resulting in the accumulation of floating sludge and scum in the secondary clarifier distribution chamber at elevated flows. A hydraulic evaluation of the St. Mary's WWTP is recommended in order to identify the location of any hydraulic bottlenecks in the liquid treatment train that could impact plant operation or performance at peak flows. If any bottlenecks are identified, the Town can proceed to develop solutions to address the issues.

Historic Review and Capacity Assessment St. Mary's WWTP
SUMMARY
TM31670902001.docx 43
9. SUMMARY The results of the optimization study are summarized below. • Since January 2015, efforts by the Town to work with industries to reduce loading to
the plant, in combination with changes to the industries discharging to the St. Mary's WWTP, have resulted in a reduction in BOD5 concentrations by almost 13 percent (down from 390 mg/L to approximately 340 mg/L);
• In October 2015, the Lystek product generated at the St. Mary's WWTP, called LysteGro, was registered as a biofertilizer under the Canadian Food Inspection Agency (CFIA). The removal of restrictions with respect to storage of the biofertilizer produced at the St. Mary's WWTP eliminates the impact of biosolids storage limitations on the capacity of the plant;
• Based on the results of the intensive sampling program, recycle streams (RDT filtrate, centrate and Lystek recycle) represent a relatively minimal impact on the liquid treatment train, equivalent to approximately 5% of the raw wastewater organic (BOD5 and TKN) loading to the plant;
• Expansion of the existing sampling program would provide additional data that could allow for a better understanding of the operation of individual unit processes and the impacts of wastewater composition on plant operations and performance. It would allow for targeted operational changes. In the long term, the goal would be to use the data to correlate trends in plant performance to changes in wastewater composition. This information could then be used to anticipate conditions at the plant;
The recommended sampling program is summarized in Table 9.1.

Historic Review and Capacity Assessment St. Mary's WWTP
SUMMARY
TM31670902001.docx 44
Table 9.1 Recommended Supplementary Sampling
Parameter Raw Wastewater
Secondary Effluent, MLE Recycle, RAS
Anoxic Tank RDT Filtrate,
Centrate, Lystek
Recycle
WAS, TWAS, Biosolids,
Hauled Biosolids, Primary Digested Sludge,
Dewatered Biosolids
tCOD Weekly Weekly Weekly Weekly
fCOD, ffCOD Weekly
tBOD5, cBOD5 Weekly Weekly Weekly Weekly
fcBOD5 Weekly
TSS, VSS Weekly Weekly Weekly Weekly
TKN Weekly Weekly
TAN Weekly Weekly Weekly Weekly
Nitrite, Nitrite Weekly Weekly
TP, Orthophosphate
Weekly Weekly Weekly Weekly
pH Weekly Weekly Weekly Weekly Weekly
Alkalinity Weekly Weekly Weekly Weekly Weekly
TS, VS Weekly Weekly
• Based on the results of BioWinTM modelling, the bioreactors have an ADF capacity of
up to 6,405 m3/d at the reduced BOD5 concentration of 340 mg/L, design SRT of 9.2 days and MLSS concentration of about 4,500 mg/L. Operating at a MLSS concentration of 4,000 mg/L would provide an ADF capacity of 5,690 m3/d, which is higher than the current ECA capacity and would increase the secondary clarifier MDF capacity;
• Based on the results of secondary clarifier stress testing the secondary clarifiers have a peak flow capacity of 23,500 m3/d. At a design MLSS concentration of 4,000 mg/L, the secondary clarifiers have a MDF capacity of 18,529 m3/d;
• Replacement of the existing TWAS transfer pumps with equipment that is capable of pumping thicker sludge would allow for increased TWAS concentrations of 4% TS or higher (typical TWAS concentrations of 4-8% TS (MOE, 2008)), which would increase the capacities of the anaerobic digester and centrifuge;
• At a raw wastewater BOD5 concentration of 340 mg/L, it is anticipated that the solids treatment train at the St. Mary's WWTP can continue to meet the requirements for solids stabilization despite a projected digester VS loading rate that exceeds the MOE Design Guideline value. However, as flows approach the plant's rated capacity, digester performance should be monitored to ensure that the solids treatment train continues to operate sufficiently. It should be noted that complete stabilization in the anaerobic

Historic Review and Capacity Assessment St. Mary's WWTP
SUMMARY
TM31670902001.docx 45
digesters is not required at the St. Mary's WWTP as the Lystek process will provide complete stabilization of the biosolids;
• In the event that the digester performance is negatively impacted by the VS loading, the Town could consider working with industries to further reduce BOD5 loading to the plant, or modifying the secondary digester to operate as a primary digester, providing additional capacity, or bypassing the digester altogether;
• At a raw wastewater BOD5 concentration of 340 mg/L, and a TWAS concentration of 4.0 % TS, the centrifuge capacity would increase to nearly 7,409 m3/d. If a TWAS concentration of 4.0 % TS is not feasible, weekly centrifuge runtime could be increased to approximately 60 hours per week in order to process the estimated weekly volume of biosolids generated at the St. Mary's WWTP; and,
• A hydraulic evaluation of the St. Mary's WWTP is recommended in order to identify the location of any hydraulic bottlenecks in the liquid treatment train that could impact plant operation or performance at peak flows. If any bottlenecks are identified, the Town can proceed to develop solutions to address the issues.
Table 9.2 presents an updated capacity assessment based on implementation of the recommendations from the optimization study.
Table 9.2 Updated Capacity Assessment of the St. Mary’s WWTP
Treatment Unit Capacity Assessment
Average Day Flow Max Day Flow Peak Flow
Headworks - - 14,250 m3/d
Bioreactors 6,405 m3/d (5,220 m3/d) - -
Secondary Clarifiers - 18,529 m3/d (14,410 m3/d)
23,500 m3/d (20,050 m3/d)
RAS Pumping 8,840 m3/d - -
Oxygenation 83,300 m3/d - -
Disinfection - - 14,250 m3/d
WAS Thickening 7,861 m3/d (4,130 m3/d) - -
Anaerobic Digestion 5,560 m3/d (2,625 m3/d) - -
Biosolids Dewatering 5,560 m3/d (3,270 m3/d) - -
Lystek Process 25,000 m3/d (2) - -
Biosolids Storage n/a - -
Overall Capacity 5,560 m3/d 18,529 m3/d 23,500 m3/d
Notes: Values in parentheses are the capacities from the previous Historical Review and Capacity Assessment, and are included for comparison purposes.

Historic Review and Capacity Assessment St. Mary's WWTP
REFERENCES
TM31670902001.docx 46
10. REFERENCES Conestoga Rovers and Associates. St. Mary's Wastewater Treatment Plant Pilot Plant Study. January 2007. Conestoga Rovers and Associates. Sludge Management (BNR/Lystek) Process and Logic Description. August 2007. Metcalf & Eddy. Wastewater Engineering: Treatment and Reuse. Fourth Edition. Toronto. 2003. Ministry of the Environment. Design Guidelines for Sewage Works. 2008. XCG Consultants Ltd. Historic Review and Capacity Assessment St. Mary’s Wastewater Treatment Plant. June 2014.