optimized hybrid learning for multi disease prediction
TRANSCRIPT
Optimized hybrid learning for multi disease prediction enabled by lionwith butterfly optimization algorithm
ANIL KUMAR DUBEY
ABES Engineering College Ghaziabad, Uttar Pradesh, Ghaziabad 201 009, India
e-mail: [email protected]
MS received 23 October 2020; revised 5 January 2021; accepted 9 January 2021
Abstract. As there is a rapid growth in healthcare systems and biomedical data. Machine learning algorithms
are utilized in many researches for predicting the risk of the diseases. The major intuition of the present paper is
to plan for a novel methodology for multi-disease prediction using deep learning. The overall prediction
methodology involves several steps such as ‘‘(a) Data Acquisition, (b) Optimal Feature selection, (c) Statistical
feature Extraction, and (d) prediction’’. In the initial step, the medical datasets of diverse diseases is gathered
from multiple benchmark sources. Further, the optimal feature selection is applied to the available set of
attributes. This is accomplished by hybridizing two meta-heuristic algorithms such as Lion Algorithm (LA), and
Butterfly Optimization Algorithm (BOA). In these prediction algorithms, the hidden neuron count of NN and
DBN is finely tuned or optimized by the same hybrid Lion-based BOA (L-BOA). The experimental evaluation
of various medical datasets validates that the prediction rate of the developed model outperforms several
traditional methods.
Keywords. Disease prediction; multiple disease; Kaggle dataset; UCI repository dataset; optimal feature
selection; lion-based butterfly optimization algorithm; Neural network; deep belief network; comparative
analysis.
1. Introduction
Electronic Medical Information has become more famous
in several cities in the entire world like EMR for substi-
tuting the conventional medical record papers, online
reports, and appointments, thus large amount of healthcare
data accumulation has happened as there is rapid growth in
internet usage [1]. Big data in healthcare sector involves
broad regions, and all the information is related to health-
care directly or indirectly comes under this class. Most of
the usual classes involve several data like biomedical data
[2], public health data [3], health statistics, health insurance
data, healthcare services data [4], environmental data,
management and medical research data [5], and population
management data. Based on machine learning algorithms
[6], diverse methods are introduced in this field, which is
generally employed for tackling with the problems like
regression, feature extraction, and classification [7].
Healthcare is the basic requirement to be provided for the
society [8]. When the big data in the healthcare sector
acquired in time, maintained properly, and efficiently
evaluated, it has significant importance for enhancing the
diagnosis capability, improving lifestyle, and effective
treatment, quality of medical service, optimization of the
medical system, and accelerating drug research and
development. Disease is predicted by using machine
learning in the medical field [9, 10]. The disease prediction
might help the patient in conducting tests on targeted
medicine by specifying the probable diseases, or else the
patients might skip substantial medical tests due to the lack
of medical information that leads to severe problems of
health.
In healthcare field, recent developments in machine
learning concentrate on model interpretability [4]. In some
healthcare applications, the accuracy is most significant
than interpretability. In many cases, the interpretability is
selected in spite of the loss of accuracy. The most signifi-
cant need in healthcare sector is to provide prognosis and
more knowledge on disease classification. Moreover, cir-
cRNA disease, Alzheimer’s Disease [7], cancer Chronic
Disease [3], Parkinson’s Disease [6], miRNAs disease [11],
cardiovascular disease, Neurological Diseases [12],
Chronic Renal Disease, circRNA disease [13], Hepatitis C,
Dengue, lung cancer [14], Malaria, Dengue, Hepatitis C,
Tuberculosis, and Hepatitis B are several kinds of diseases.
For detecting the eye infections effectively image pro-
cessing is used [15, 16].
In machine learning algorithms, the developments reveal
the benefits of discriminative classifiers for detecting the
diseases automatically [17]. From the medical investigation
Sådhanå (2021) 46:63 � Indian Academy of Sciences
https://doi.org/10.1007/s12046-021-01574-8Sadhana(0123456789().,-volV)FT3](0123456789().,-volV)

reports related to the patient, machine learning learns for
disease prediction or detection, which enhances the per-
formance since it accumulates more experience by evalu-
ating the medical investigation reports of more number of
patients. The performance is computed by the number of
disease detection and accurate prediction cases as validated
by experienced medical experts. In many fields, machine
learning algorithms [18] such as social media services,
crime prediction through video surveillance system, E-mail
spam filtering, BoTs (chat bots for online customer sup-
port), search engine result refining, agriculture advisory,
online fraud prediction, medical diagnosis, share market
prediction, product recommendation, online transportation
network, traffic prediction, computer games, pattern
recognition, natural language processing, data mining, vir-
tual personal assistants, and robotics [19]. In general,
machine learning algorithms tackle three problems such as
regression, clustering, and classification [20]. One approach
needs to be selected from the available approaches based on
the availability of types and categories. NN and other
machine learning algorithms like KNN [20], Bagging, DT
[14], SVM [2], supervised learning [21], NB [14], BF tree,
unsupervised learning, RBF networks, Multilayer Percep-
tron [22], Random Forest tree, and deep learning models
are developed for detecting and predicting the diseases.
Many algorithms are joined to introduce hybrid optimiza-
tion algorithm [23], which offers the high performance than
the individual algorithms.
1.1 Motivation
Disease prediction is the complex problem that should be
required for an individual before it reaches critical stage.
Once the disease is predicted, the risk of those individuals
is reduced. The early stage prediction is also a significant
cost value. In the multi disease prediction model, the pre-
diction of more than one disease is possible. The need for
more models is not required in this multi disease prediction.
Hence, the time is reduced and the chance for mortality rate
is also reduced. Hence, this paper proposes a disease pre-
diction model for predicting the multiple diseases.
The contribution of the entire paper as designed is given
below.
• To predict multiple diseases, different disease datasets
such as ‘‘Heart disease, Dermatology dataset, Thyroid
disease dataset, breast cancer, Alzheimer’s disease,
Parkinson’s disease, and lung cancer’’ are gathered
from various standards.
• To overcome the complexity of feature selection, and
improve processing speed, optimal feature selection
needs to be performed, which is done by the hybrid
L-BOA algorithm.
• To overcome the redundant information, statistical
features like ‘‘mean, median, standard deviation,
minimum value and maximum value’’ are extracted.
• To extract high level features from the input data, deep
learning algorithm uses several layers. For attaining
huge prediction accuracy, hybrid learning algorithm is
used with the combination of NN and DBN.
• To enhance the disease prediction performance using
hybrid NN and DBN classifier, in which the hidden
neuron counts are optimized by the proposed L-BOA
algorithm.
The paper is arranged as follows. : The review on mul-
tiple disease prediction is shown in section 2. The multi-
disease prediction based on hybrid learning concept is
explained in section 3. Section 4 specifies the combined
feature extraction for multi-disease prediction model. In
section 5, the novel L-BOA for optimal feature selection
and hybrid learning is shown. The hybrid learning for
multi-disease prediction is specified in section 6. Section 7
speaks about the results and discussion of the entire paper.
Finllay, the conclusions are given in section 8.
2. Literature review
2.1 Related works
In 2019, Mohan et al [24] have suggested a new approach
that intended in recognizing the important characteristics
by employing machine learning algorithms resulted in
enhancement of prediction accuracy of cardiovascular dis-
ease. By using discrete accumulation of features and many
known classification models, the prediction method was
developed. By merging the features of LM and RF,
HRFLM was introduced. The aim of the developed tech-
nique was to improve the prediction accuracy of heart
disease [25]. Several researches were done, which resulted
in the feature selection constraints for algorithmic purpose.
By not having any constraints related to feature selection,
HRFLM employed all the features. For recognizing the
features of machine learning algorithms with the hybrid
model, the test analysis was used.
In 2019, Xiao et al [26] have introduced a novel inte-
grated approach named MRLDC for predicting the diseases
related to circRNA candidates. The main intuition of the
developed algorithm was to consistently forecast the cor-
responding candidates of circRNA for the diseases, which
was helpful for minimizing the expenses of circRNA
research with the help of experimental technique. In this,
MRLDC prioritized the circRNAs infected with disease
purely based on the relative constrained associations of
circRNA-disease acquired from this disease [13]. Initially,
for circRNAs and diseases, the computation of GIP kernel
similarity was done. Later, it has shown the lost circRNA-
disease associations in the respective bi-layer
63 Page 2 of 27 Sådhanå (2021) 46:63

heterogeneous network that included three sub networks
such as known ‘‘circRNA-disease association network,
disease similarity network, and circRNA similarity
network’’.
In 2019, Yang et al [27] have recommended a novel
approach called EPDP for e-healthcare system. Initially, for
protecting the privacy, OU cryptosystem was utilized that
served based on the proposed EPDP. In order to decrease
the communication and computational overheads, a super-
increasing series was developed and by considering the
benefits of Naive Bayesian classifier, the symptom vector
set of each disease was extracted in disease model training
phase. Furthermore, the disease prediction outcome was
acquired on the basis of the symptom vector sets that were
extracted using the effective Bloom filter approach. The
results have shown that the proposed EPDP attained best
performance in predicting the diseases.
In 2019, Vasquez-Morales Yang et al [28] have designeda NN-based classifier for predicting whether the person has
the chances of occurring CKD, which was trained by the
medical care and demographic information of two groups
such as people’s sample without disease diagnosis. Next,
the performance measures were subjected to classification
algorithms, and when the test data set was employed, the
proposed model has attained best performance for making
the disease prognosis reliable. However, in spite of the
demonstrated efficiency of NN for predicting CKD,
machine-learning algorithm was opaque for the experts
concerning the resultant explanation. The present research
on explainable artificial intelligence introduced twin sys-
tems, in which the black-box machine learning algorithm
was adjusted by other white-box approach, which offered
about the predicted value explanation.
In 2018, Minhas et al [29] have presented a machine
learning algorithm [25] in order to forecast the disease
increment from MCI to Alzheimer’s disease [30] up to
three years. As mentioned above, both NM and MRI
biomarkers were used. The longitudinal training informa-
tion was provided by autoregressive parameters. From the
baseline, the unknown longitudinal biomarker values were
assessed and selected the multimodal biomarkers. In order
to compute the linear prediction coefficients, three
approaches were introduced that employed one of the
predictors named individual or multiple predictors. More-
over, it has been recorded that the accumulation of many
predictors offered more precise prediction of further clini-
cal modifications. Later, the marker trajectories acquired
were fed into SVM classifier for MCI segregation.
In 2019, Haq et al [2] have offered a machine learning-
oriented prediction model for an accurate diagnosis of PD.
Especially, the PD diagnosis was quite complex and con-
sumes more time in its initial phases. For predicting the PD,
SVM was used in the developed model. For appropriate
feature selection, L1-Norm SVM was employed, whereas
for healthy people and precise target classification of PD,
highly related feature selection was employed. Based on the
feature weight value, a new feature subset was produced by
the L1-Norm SVM from the dataset of PD.
In 2019, Sierra-Sosa et al [5] have employed two com-
putation models namely parallel and distributed for efficient
analysis of healthcare data with the help of deep learning
models. The major intution of the suggested algorithm was
to determine the association among medical and laboratory
assessment variables by acquiring the above specified
methods and its forecast with machine learning models. In
order to treat the patients in time by averting complications,
enhancing the situation from patients, and reducing more
expenses for the healthcare system, the early prediction of
diseases in patients having Type 2 Diabetes Mellitus was
permitted for the medical personnel. Moreover, the research
was done on the occurrence of the avoidable adverse events
significant from Type 2 diabetes mellitus and a scalable
healthcare evaluation model in order to predict these
events. Some of the deep learning algorithms like RNN,
and machine learning algorithms like LDA, and Logistic
Regression, SVMs, and QDA were implemented, which
provided the employed data’s nature.
In 2019, Arunkumar and Ramakrishnan [31] have
introduced a novel approach named FRQR, which was
employed for providing the minimal reduced set. For cus-
tomized similarity measure, the proposed FRQR was used,
whereas, for dimensionality reduction, entropy based filter
method was employed. Moreover, a customized model was
applied on the proposed FRQR algorithm for selecting the
attributes. With the help of Synthetic Minority Oversam-
pling Technique, the unbalanced data was balanced. By
using the correlation-based filter, the huge dimensionality
related to cancer data was minimized. In order to calculate
the last minimal reduct set, the dimensionality minimized
gene subset was utilized with the customized fuzzy trian-
gular norm operator on FRQR algorithm. For computing
the fuzzy approximation, the customized fuzzy triangular
norm operator was employed using Lukasiewicz fuzzy
implicator. The selection of the least count of informative
genes was done by the customized operator from the
dimensionality reduced datasets.
In 2018, Karim et al [32] have developed an approach on
the basis of DSAE and ESD to extract more efficient fea-
tures in short period of time. This framework develops
features in short period than conventional frameworks. The
DSAE architecture speeds up by reducing the dimensions
of data. This architecture reduces unnecessary features for
training. This framework provides superior and encourag-
ing results. ESD provides fast feature extraction and reli-
able performance. The DSAE and ESD have weak low
dimensional data.
In 2020, Abdullah Asim Yilmaz et al [33] have devel-
oped a deep learning-oriented architecture for predicting
and identifying human actions. The important goal is to
develop an optimized framework for recognizing the
human activities. It develops a hybrid architecture that joins
four wide-ranging pre-trained network techniques in a well-
Sådhanå (2021) 46:63 Page 3 of 27 63

defined way. A performance evaluation is done using
benchmark datasets to authenticate the priority of suggested
architecture over conventional methods. The training time
is high, owing to the feature vector size. The computational
power of this framework is two times better than the
remaining methods.
In 2013, Mirjalili et al [34] have developed a meta
heuristic algorithm called GWO. This algorithm was
developed by the characteristics of the wolves. It consists of
four types, they are alpha, beta, delta, and omega. These
four types are used to imitate the leadership quality. The
main goal of the wolves is searching the prey, hunting,
circling the prey, and catching the prey. The hunting was
implemented by the alpha. GWO required more operators
affirm exploration. The performance of GWO is very high.
The solving precision of GWO is very slow. Also, the
searching ability of the GWO is very slow.
In 2016, Mirjalili et al [35] have developed an opti-
mization algorithm called the WOA. This algorithm was
developed by the characteristics of humpback whales. The
most intriguing thing about the humpback whales was their
extraordinary chasing technique. This behavior is called
bubble-net feeding method. This algorithm was influenced
by bubble-net hunting strategy. WOA was serious with
meta-heuristic optimizers and better over conventional
techniques. WOA was tried with 29 mathematical opti-
mization problems and then with 6 structural design prob-
lems. The advantages of this technique are effortlessness
and low expense. WOA increases the computational time
for difficult problems.
In 2018, Boothalingam et al [36] motivated with the aid
of the obligation of having optimization algorithms, an
optimization algorithm based on a lion’s particular social
behavior has been offered. This paper consists of four
different suites. The first suite had assessment with pub-
lished outcomes of evolutionary and few renowned opti-
mization algorithms, while the second suite ends in a
comparative observe with contemporary optimization
algorithms. The test suite 3 takes the massive-scale opti-
mization problems, while test suite 4 considers benchmark
engineering problems. It affords a circle-shaped neighbor-
hood around the solutions and allows opportunity for hunter
to shut to prey from exceptional directions and provides a
possibility for answers to get away from local optima.
Inspite of the lion set of rules is incompetent to solve sphere
and rosenbrock features.
In 2018, Arora and Singh [37] present another nature-
inspired algorithm, BOA that emulates food search and
mating conduct of butterflies, to settle worldwide opti-
mization issues. The structure is mostly founded on the
scrounging technique of butterflies, which use their smell to
decide the area of nectar or mating accomplice. BOA is
reasonably simple and easy to execute. The value of BOA
is also increases by solving three engineering design
problems, spring design, welded beam design, and gear
train design. They have different objective functions,
constraints and decision variables. The exploitation ability
of BOA is very poor (table 1).
2.2 Review
Several studies have been done for the prediction of dis-
eases in medical sector. The disease predictions are not an
easy task in the medical sector. HRFLM [24] method is
used for heart disease prediction, which improves the per-
formance with accuracy. This method has the stronger
ability of the disease prediction. This method also needs
further improvement for prediction models and feature
selection techniques. MRLDC [26] has the high efficiency
of identifying the diseases. This MRLDC tool has the high
potential for exploring the implied relationships among
diseases and circRNAs. It faces challenges like link pre-
diction issues and searching of parameters for diverse
datasets. EPDP [27] algorithm is more efficient based on
the computational and communication overheads. This
algorithm is more suitable for the real-time applications.
Some of the issues need to be addressed for this algorithm
like attaining the message integrity, and development of
access control. The CBR [28] is used for attaining predic-
tion of the risk of CKD and the prediction accuracy and
convergence speed is enhanced. The CBR poses some
issues such as the associated values for the considered level
are needs additional development and the user based
assessment is essential for real time applications. The
machine learning [29] framework is used for better pre-
diction method, which is MRI and NM measures are joined
for best prediction of short term MCI in contrast, the NM is
more dominant for predictions of long term MCI develop-
ment. This is limiting the longitudinal setting for the MRI
measures and duration (3 years). SVM [2] is applied for
reducing the estimation time by feature selection. The
overall performance and classification accuracy are
improved. The following challenges are faced in SVM like
for huge set of data, SVM is not suitable. SVM is not
executed well, while noise is predicted at data set. The
classical machine learning algorithm [5] was used for
analyzing the health care data efficiently and to improve
prediction accuracy. For big data sets the scalability is
allowed. ML is also having issues like hidden data are not
classified and the understanding of outcomes is compli-
cated. The Customized FRQR [31] was enhancing the
accuracy of classification. Feature sets and dimensionality
of the data sets are reduced. This algorithm also having
issues like for dissimilar data sets, this method cannot be
used. Power consumption is high. These features and
challenges are considered for the disease prediction
method. The DSAEs and ESD [32] reduces training for
unnecessary features. ESD provides fast feature extraction
and reliable performance. The dimensional data of DSAE
and ESD were weak and low. The Deep learning based
architecture [33] integrates four pre-trained network model
63 Page 4 of 27 Sådhanå (2021) 46:63

Table
1.
Featuresandchallenges
oftraditional
disease
predictiontechniques.
Author[citation]
Methodology
Features
Challenges
Mohan
etal[24]
HRFLM
Theperform
ance
level
isincreasedin
term
sof
accuracy.
Thepredictionofdiseaseshas
strongpotential.
Thepredictionmethodsareneedsfurther
improvem
ent.
New
Feature
selectionmethodsrequired
for
development.
Xiaoet
al[26]
MRLDC
Itidentifies
thediseasesfaster.
Exploringoftheim
plicitrelationshipsishigh.
Linkpredictionissueisraised.
Lookingforappropriateparam
etersfordiverse
datasetsischallenging.
Yanget
al[27]
EPDP
Itismore
efficientbased
onthecomputational
andcommunicationoverheads.
Thisalgorithm
issuitable
forthereal-tim
e
applications.
Attainingthemessageintegrity
istedious
process.
Theaccess
controlneedsadditional
expansion.
Vasquez-M
oralesYang
etal[28]
CBR
Itcanefficientlypredicttherisk
ofCKD.
Thepredictionaccuracy
andconvergence
speed
isenhanced.
Theassociated
values
fortheconsidered
levelare
needsadditional
development.
Theuserbased
assessmentisessential
forreal
timeapplications.
Minhas
etal[29]
Machinelearning
MRIandNM
measuresarejoined
forbest
predictionofshortterm
.
NM
has
thehighpotential
forpredictionoflong
term
MCIdevelopment.
Inlongitudinal
setting,theMRImeasuresare
failed
toexecute
well.
Duration(3
years)islimited.
Haq
etal[2]
SVM
Thefeature
selectionreducestheestimationtime.
Theoverallperform
ance
andclassification
accuracy
isim
proved.
SVM
algorithm
isnotappropriateforhugesetof
data.
SVM
isnotexecutedwell,whilenoiseis
predictedat
dataset.
Sierra-Sosa
etal[5]
Classical
machinelearning
Thehealthcare
dataisanalyzedefficientlyand
predictionaccuracy
isim
proved.
Forbig
datasets
thescalabilityis
allowed.
TheMLisnotusedto
classify
thehidden
data.
Theunderstandingofthegenerated
outcomes
isa
difficultjob.
Arunkumar
and
Ram
akrishnan
[31]
Customized
FRQR
Accuracy
ofclassificationisenhanced.
Feature
sets
anddim
ensionalityofthedatasets
arereduced.
Fordissimilar
datasets,this
methodcannotbe
used.
Power
consumptionis
high.
Karim
etal[32]
DeepSparse
Auto-Encoder
Architecture
and
EnergySpectral
Density
DSAEreducesunnecessary
featuresfortraining.
ESD
provides
fastfeature
extractionandreliable
perform
ance
DSAEandESDhaveweaklowdim
ensionaldata.
Sådhanå (2021) 46:63 Page 5 of 27 63

in a well-defined manner. This method has issue that
training time is high due to size of feature vectors. The
GWO [34] provides the high competitive results. This
algorithm has issues like solving precision and searching
ability of GWO is very slow. The WOA [35] works
effortlessly and the computational expense is very low.
The computational time of this method is very high. The
LA [36] provides a possibility for answers to get away
from local optima. The lion set of rules is incompetent to
solve sphere and rosenbrock features. The BOA [37] is
reasonably simple and easy to execute. The challenge in
this method is the exploitation ability of BOA is very poor.
3. Multi-disease prediction based on hybridlearning concept
3.1 Proposed architecture
Due to digitization, data is increasing rapidly in all regions
in the recent years. One among them is big data, which is
used mainly and it is not able to process with regular
computers. In analyzing huge datasets, big data analytics is
the advanced version used for discovering new perspec-
tives, interest, and hidden patterns. Moreover, it is used in
many applications such as detection of fraud and risk,
healthcare, weather prediction, and logistic delivery. There
are many reasons for predicting the risk related to various
diseases. These reasons are required to determine the risk
of an individual for planning the investigation effectively
to attain best accuracy and safety of the patient and less
computational cost to the healthcare system. In addition, it
is quite significant as suggested medicine has been used
Medical datasets
Alzemier disease
Breast Cancer
Dermatology
Alzemier disease
Breast Cancer
Dermatology
First order statistical features
Optimal feature extraction
Combined features
Prediction
DBN NN Predicted Outcome
Proposed L-BOA
AND
Figure 1. Diagrammatic illustration of developed multi-disease
prediction.Table
1continued
Author[citation]
Methodology
Features
Challenges
Yilmaz
etal[33]
Deeplearningbased
architecture
Itintegratesfourpre-trained
network
model
ina
well-defined
manner.
Trainingtimeishighdueto
size
offeature
vectors
Mirjaliliet
al[34]
GWO
Itprovides
thehighcompetitiveresults.
ThesolvingprecisionofGWO
isveryslow.
ThesearchingabilityoftheGWO
isveryslow.
Mirjaliliet
al[35]
WOA
Itworkseffortlessly.
Thecomputational
expense
isverylow.
Thecomputational
timeisveryhigh.
Boothalingam
etal[36]
LA
Itprovides
apossibilityforansw
ersto
get
away
from
localoptima.
Thelionsetofrulesisincompetentto
solve
sphereandrosenbrock
features.
Arora
andSingh
BOA
Itis
reasonably
simple
andeasy
toexecute.
TheexploitationabilityofBOA
isverypoor.
63 Page 6 of 27 Sådhanå (2021) 46:63

widely. However, the researchers also require the capability
for predicting the risk for public health services. In this
case, machine learning algorithms might help for analyzing
the algorithms, which employ huge datasets for learning,
generalizing and predicting. The proposed multi disease
prediction is diagrammatically represented in figure 1.
The proposed method employs many diseases namely
‘‘Alzheimer’s disease, Breast Cancer, Dermatology, Heart
disease, Lung Cancer, PD, Thyroid diseases’’ for predic-
tion. At first, different types of diseases are collected from
standard sources and these are subjected for optimal feature
selection. During feature extraction, the first order statisti-
cal features like ‘‘mean, median, standard deviation, mini-
mum value, and maximum value’’ are extracted. From the
set of feature attributes of dataset, the optimal feature
selection is done. Here, it is performed by the proposed
meta-heuristic algorithm named L-BOA. Further, first order
features from the datasets are merged with the optimally
selected features. Once the features are combined, those
combined features are given to a hybrid classifier having
DBN and NN. In both NN and DBN, the hidden neuron
count is optimized by the same recommended L-BOA
algorithm for accuracy maximization. The outcome of the
optimized classifier is the decision regarding that the
patient is affected with disease or not corresponding to the
entire disease datasets.
4. Combined feature extraction for multi-diseaseprediction model
4.1 Optimal Feature Selection
It is performed on the feature attributes of the original
datasets, which is performed by the proposed L-BOA
algorithm. The whole number of features is denoted as Fsn,where the term n ¼ 1; 2; . . .;N and the overall features
count is represented as N. Figure 2 portrays the solution
encoding of the optimal feature.
The term Fsoptn� denotes the optimally selected features,
where the term n� ¼ 1; 2; . . .;N� and the total number of
optimally selected features are denoted as N�.
4.2 First order statistical features
The statistical features like ‘‘mean, median, standard
deviation, minimum value, and maximum value’’ are
extracted from each datasets.
Mean: ‘‘summing up all the numbers in the data set and
dividing it by the total number of numbers exists in the
dataset’’. The corresponding mean equation is expressed in
Eq. (1), where mean is defined as g. Here, the term np refersto the data count available in the dataset, the numbers or
data is denoted as gi, and the sum of the whole numbers is
given byP
gi.
g ¼ 1
np
Xnpi¼1
gi ð1Þ
Median: ‘‘The average of a group of numbers, which
means the middle number’’. Eq. (2) is used for the even
number of pixels and it other cases Eq. (3) is employed.
Med ¼ averageofnp
2
th; and
npþ 2
2
� �th
ð2Þ
Med ¼ sizeofnpþ 1
2
� �th
ð3Þ
Standard Deviation: It is a ‘‘statistic, which measures the
diffusion of a dataset corresponding to its mean and cal-
culated its square root of variance’’. Eq. (4) represents the
numerical formula of standard deviation. Here, the discrete
number that is available in the data set is described as gi.
sd ¼ 1
np
Xnpi¼1
gi � gð Þ2 ð4Þ
Minimum Value: It specifies the minimum value of the
entire data and it is denoted Eq. (5).
Min Val ¼ Min gið Þ ð5ÞMaximum Value: It specifies the maximum value of the
whole data and it is displayed in Eq. (6).
Max Val ¼ Max gið Þ ð6ÞThus, the first order statistical features are denoted as
Fss tan dne , which are used for further processing.
4.3 Combined Features
Here, both the optimally selected features and the statistical
features are combined. These are further subjected to the
classifiers named NN and DBN. The combined features are
mathematically represented in Eq. (7).
Fscomj ¼ Fsoptn� þ Fss tan dne ð7ÞFigure 2. Solution encoding related to the optimal feature
selection.
Sådhanå (2021) 46:63 Page 7 of 27 63

The combined features are denoted as Fscomj , in which the
term j ¼ 1; 2; � � � ; J and the term J represents the entire
count of combined features and it is applied for further
processing for effective prediction of multiple diseases.
5. Novel lion-based butterfly optimizationalgorithm for optimal fearure selection and hybridlearning
5.1 Conventional butterfly optimization algorithm
BOA [37] resembles the behaviour of butterflies in
searching for food and mating. The reason behind the
survival of these butterflies for many years is due to their
senses. They can sight, touch, smell, hear, and taste
searching for mating partner and food. In order to move
from one place to other place, these senses are very useful.
Smell is the most unique sense among all the senses as it
helps the butterfly for foraging the food, generally nectar
even in long distances. The general process of butterflies is
on the basis of two problems majorly the formulation of frand variation of A. Here, the term fr represents fragrance,
whereas the term A refers to the stimulus intensity. The
magnitude of actual stimulus A of butterfly is related to the
encoded objective function. However, the fragrance fr is
relative, which is sensed by the remaining butterflies. The
fragrance in this BOA algorithm is described as a function
of the stimulus intensity, which is mathematically repre-
sented in Eq. (8).
fr ¼ smApe ð8ÞIn Eq. (8), the sensory modality is denoted as sm, the
power exponent based on modality is denoted as pe that
represents the varying absorption degree. In many cases,
the terms sm and pe lies in between 0 and 1 in the tradi-
tional BOA algorithm. The characteristics of butterflies is
idealized as shown in the below points.
• Some fragrance that is emitted from all the butterflies
will enable the butterflies for attracting each other.
• In order to emit fragrance, each butterfly will move at
random or towards the best butterfly.
• With the objective function, the butterfly’s stimulus
intensity is affected.
In conventional BOA, there are three steps namely
‘‘Initialization phase, Iteration phase, and Final phase’’. The
initialization phase is executed in each iteration, later
searching is done iteratively and in the last step, the algo-
rithm is finished until the optimal solution is acquired.
During initialization, the solution space and the objective
function is determined. Moreover, the parameters that are
used here are also allotted. Later, create the butterfly’s
initial population for performing optimization. During
simulation, the whole count of butterflies remains
unchanged and a fixed memory space is assigned for storing
the data. In search space, the butterfly’s locations are
generated at random along with their fragrance and fitness
values computed and preserved.
During iteration phase, the count of iterations is done
using the conventional BOA algorithm. All the butterflies
present in the solution space in each iteration for moving to
the new locations and their fitness values are computed. In
the solution space, the algorithm first computes the fitness
values of all the butterflies on discrete locations. Later,
these butterflies will produce the fragrance in their loca-
tions by Eq. (8). Local and global search phases are the two
primary phases in the model. The butterfly takes the step in
the path of the best solution p� and the related equation is
shown in Eq. (9).
Liitþ1i ¼ Liiti þ rd2 � p� � Liiti
� �� fri ð9ÞIn Eq. (9), the solution vector is given by Liiti for ith
butterfly in it iterations, the present best solution from all
the solutions in the present round is given by p�, the randomnumber between 0 and 1 is given by rd and the fragrance of
ith butterfly is denoted as fri. The mathematical equation
related to local search phase is expressed in Eq. (10). Here,
from the solution space, jth and kth butterflies in iteration it
are given by Liitj and Liitk , respectively.
Liitþ1i ¼ Liiti þ rd2Liitj � Liitm
� �� fri ð10Þ
In both local and global scale, mating partner and
searching for food by butterflies are occurred. In BOA, the
switch probability sp is used for switching among the
common global search for intensive local search.
5.2 Conventional lion algorithm
In both NN and DBN, the proposed L-BOA algorithm is
used for hidden neuron optimization. The major motivation
of LA [36] is acquired from nature, in which the usual
lion’s behaviours are territorial takeover and territorial
defense. The traditional LA algorithm includes six pro-
cessing steps and each step is described briefly here.
Pride Generation: The territorial lion and its lioness are
initialized by the terms LiMa and LiFm, and the nomadic lion
is denoted as LiNom. This nomadic lion doesn’t belong to the
pride generation family. The lion’s representation is quite
similar to the representation of solution vector, thus the
lion’s and lioness’s vector elements are given by liMaEl ,li
FmEl
and the term liNomEl represents the nomadic lion that are the
arbitrary integers among the boundaries if a[ 1, where
El ¼ 1; 2; � � � ; Lng. Moreover, the lion’s length is repre-
sented as Lng, which is denoted in Eq. (11).
Lng ¼ a; if a[ 1
b; otherwise
�ð11Þ
63 Page 8 of 27 Sådhanå (2021) 46:63

In the above equation, the terms a and b represent the
integers used for finding the length of the lions. When
a ¼ 1, the algorithm has to search using the binary encoded
lion, thus the vector elements are formed as 1 or 0, other-
wise it is measured by Eq. (12).
vlcty liElð Þ 2 liminEl ; limax
El
� � ð12ÞFertility Evaluation: Once the pride generation step is
done fertility evaluation is performed. Here, the lion is the
laggard and the respective laggardness rate is termed as
LagRt, which is improved by one. If ft LiMað Þ is improving,
then the reference fitness is termed as ftref . When the lag-
gardness rate is exceeding LagmaxRt , the territorial defense is
occurred. In addition, the lioness’s fertility is determined by
the sterility rate strRt and it is improved by 1 when strRt thatexceeds strmax
Rt . In such case, the lioness is updated by
Eq. (13), Eq. (14), and Eq. (15).
liFeþEl ¼ liFeþfl if El ¼ fl
liFeEl otherwise
�ð13Þ
liFeþfl ¼ min limaxfl ;max limin
fl ;Dfl
� �h ið14Þ
Dfl ¼ liFefl þ 0:1rnd2 � 0:05ð Þ liMafl � rnd1li
Fefl
� �h ið15Þ
As per the above equations, the random number that lies
in between 1 and Lng, which is denoted as fl, the term Dindicates the female update function, and the random
numbers that lie in between 0 and 1 are indicated by rnd1and rnd2. The mating is performed because of improvement
when the altered lioness LiFeþ is taken as LiFe. At the same
time, the process of update is performed until the female
generation count fgnco reaches fgnmaxco . Once the update
process is done, when LiFeþ is not there to substitute LiFe, it
is verified that LiFe is the fertile one in order to provide best
cubs.
Mating: It involves two primary steps and one supple-
mentary step. Here, the primary steps are mutation and
crossover, whereas the supplementary step is called as the
gender clustering.
Territory Defense: This is the easy procedure for
searching the solution space, and at the same time it is
helpful for the algorithm to prevent the local optimal point
and finding discrete solutions with the similar fitness val-
ues. The nomadic lion LiNom is selected when the conditions
specified in Eq. (16), Eq. (17), and Eq. (18) are satisfied.
ft LiNom� �
\ft LiMa� � ð16Þ
ft LiNom� �
\ft Limcb� � ð17Þ
ft LiNom� �
\ft Lifcb� � ð18Þ
Termination: The algorithm is finished only if any one
of the equations mentioned in Eq. (19) and Eq. (20) are
reached.
it[ itmax ð19Þ
ft LiMa� �� ft LiOpt
� � � erthrs ð20ÞIn the above equations, the count of generations is
denoted as it that is initialized as 0, and it is improved by 1
when territorial takeover is obtained. The term erthrs rep-
resents the error threshold.
Initialization of population
Initialize stimulus probability, sensor modality, switch
probability, and power exponent
For each butterfly bfin population
Compute the fragrance for bf by
Find the best butterflybf
For each butterfly bfin population
Generate the random number rd from 0 to 1
if d(r p)s<The female lion
update process is done by Eq. (15)
All the butterflies will move towards the best butterfly with Eq(9)
Update the value ofpe
Returns the best solution
No
Yes
Figure 3. Flowchart of proposed L-BOA.
Sådhanå (2021) 46:63 Page 9 of 27 63
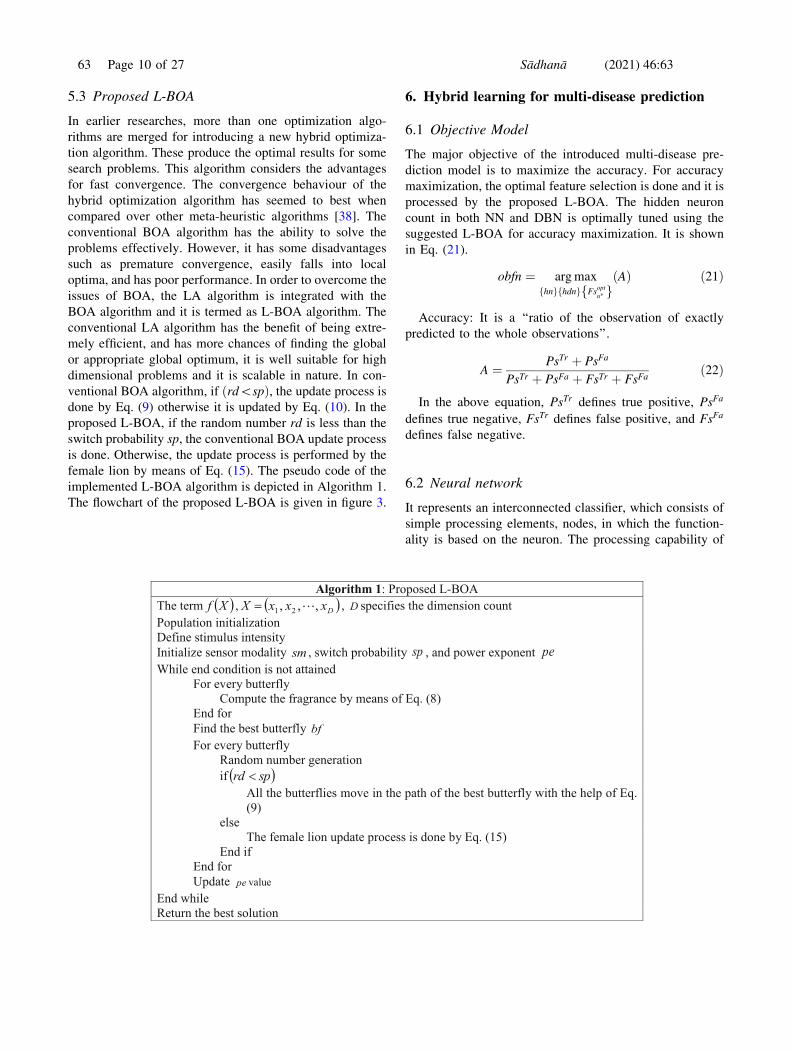
5.3 Proposed L-BOA
In earlier researches, more than one optimization algo-
rithms are merged for introducing a new hybrid optimiza-
tion algorithm. These produce the optimal results for some
search problems. This algorithm considers the advantages
for fast convergence. The convergence behaviour of the
hybrid optimization algorithm has seemed to best when
compared over other meta-heuristic algorithms [38]. The
conventional BOA algorithm has the ability to solve the
problems effectively. However, it has some disadvantages
such as premature convergence, easily falls into local
optima, and has poor performance. In order to overcome the
issues of BOA, the LA algorithm is integrated with the
BOA algorithm and it is termed as L-BOA algorithm. The
conventional LA algorithm has the benefit of being extre-
mely efficient, and has more chances of finding the global
or appropriate global optimum, it is well suitable for high
dimensional problems and it is scalable in nature. In con-
ventional BOA algorithm, if rd\spð Þ, the update process isdone by Eq. (9) otherwise it is updated by Eq. (10). In the
proposed L-BOA, if the random number rd is less than the
switch probability sp, the conventional BOA update process
is done. Otherwise, the update process is performed by the
female lion by means of Eq. (15). The pseudo code of the
implemented L-BOA algorithm is depicted in Algorithm 1.
The flowchart of the proposed L-BOA is given in figure 3.
6. Hybrid learning for multi-disease prediction
6.1 Objective Model
The major objective of the introduced multi-disease pre-
diction model is to maximize the accuracy. For accuracy
maximization, the optimal feature selection is done and it is
processed by the proposed L-BOA. The hidden neuron
count in both NN and DBN is optimally tuned using the
suggested L-BOA for accuracy maximization. It is shown
in Eq. (21).
obfn ¼ argmaxhnf g hdnf g Fsopt
n�f gðAÞ ð21Þ
Accuracy: It is a ‘‘ratio of the observation of exactly
predicted to the whole observations’’.
A ¼ PsTr þ PsFa
PsTr þ PsFa þ FsTr þ FsFað22Þ
In the above equation, PsTr defines true positive, PsFa
defines true negative, FsTr defines false positive, and FsFa
defines false negative.
6.2 Neural network
It represents an interconnected classifier, which consists of
simple processing elements, nodes, in which the function-
ality is based on the neuron. The processing capability of
63 Page 10 of 27 Sådhanå (2021) 46:63

network is kept in the interunit connection strength,
acquired by the adaptation process, training pattern set. The
structure of NN is composed of three layers namely ‘‘input,
hidden and output layers’’. The input data is given by Fscomj ,
and the input layer is given by ip, hidden layer is given by
hd, and the output layer is given by op. In this, the hidden
layer’s output is calculated by Eq. (23).
HHð Þ ¼ Acf ~B
ðHÞðbhdÞ þ
XInpðcntÞip¼1
~BðHÞðiphdÞFs
comj
!ð23Þ
In Eq. (23), the bias weight to the hidden neuron is
shown by ~BðHÞðbhdÞ, whereas the weight from the input to the
hidden neuron is given by ~BðHÞðiphdÞ. The activation function is
termed as Acf , the input neuron count is denoted as
InpðcntÞ. The complete result of the network is measured
by Eq. (24).
Gop ¼ Acf ~BðGÞðbopÞ þ
XOptðcntÞhd¼1
~BðGÞðhdopÞH
ðHÞ !
ð24Þ
In the above equation, the bias weight to the output
neuron is portrayed as ~BðGÞðbopÞ, and the weight from the
hidden to the output neuron is depicted by ~BðGÞðhdopÞ. The
count of output neurons is shown by OptðcntÞ.The hidden neuron optimization is done by the proposed
L-BOA algorithm in order to provide best performance.
6.3 Deep belief network
DBN consists of several RBMs such that hidden layer of
every RBM function as visible layer to the next RBM. The
RBM is the visible layer of DBN and all the other layers are
DBN’s hidden layers, which is trained by training an
individual RBM in one iteration. The input data given to the
NN is only considered as the input to the DBN. In general,
DBN [39] is composed of distinct layers, which is identical
to NN. The input and output layers include visible and
hidden neurons, respectively. DBN utilizes Boltzmann
Network for attaining effective outcomes. The outcome
acquired from DBN is described as opt, which captures
binary format. In addition, the result consists of the sinu-
soidal function probability BZprb kð Þ� �, which is mathe-
matically denoted in Eq. (25), and Eq. (26).
opt ¼ 1 with 1� BZprb kð Þ0 with BZprb kð Þ
�ð25Þ
BZprb kð Þ ¼ 1
1þ e�kpst
ð26Þ
In Eq. (26), the term pst represents the pseudo temper-
ature parameter and it controls the noise level of
probability. In Eq. (27), the stochastic system is specified.
Boltzmann model is designed with the accurate modelling
of input patterns based on Boltzmann distribution. Eq. (28)
represents the Boltzmann’s energy model for configuring
the neuron states, in which the term nes represents the
neuron state, and the weight among the neurons is given by
C�
c;d, and the term b represents the neuron’s biases.
limpst!0þ
BZprb kð Þ ¼ limpst!0þ
1
1þ e�kpst
¼0 for k\01
2for k ¼ 0
1 for k[ 0
8><>: ð27Þ
Beðnes1Þ ¼Xc\d
_Cc;dnescnesd � bcnesc ð28Þ
In DBN, the Boltzmann model encircles the neurons with
Eq. (29). Moreover, the configuration among the hidden
and the visible neurons with respect to the energy provided
by Eq. (30), Eq. (31), and Eq. (32). Here, the terms vsc andhdnd represents the binary state of visible as well as the
hidden neurons, respectively, and the bias weights of both
visible as well as the hidden neurons are given by vwc and
hwd , respectively. The terms Bi�c , and Bi�d denotes the
considered biases.
DBe ecð Þ ¼Xd
nesc _Cc;d þ bc ð29Þ
Beðvs0; hdnÞ ¼ �Xc;dð Þ
_Cc;dvschdnd �Xc
vscBi�c �
Xd
hdndhwd
ð30Þ
DBe vsc; hdn!� �
¼Xd
_Cc;dhdnd þ Bi�c ð31Þ
DBE vs!; hdnd
� �¼Xd
_Cc;dvsc þ Bi�c ð32Þ
RBM is capable of allotting the probability with the help
gained from the energy function as mentioned in Eq. (33),
in which the partition function PRT and it mathematically
represented in Eq. (34). The benchmark Boltzmann
machine is automatically defining the hidden or visible
neurons by measuring difference of energy between them,
which is not similar to RBM.
R0 vs0; hdnð Þ ¼ 1
PRTe�F vs0;hdnð Þ ð33Þ
PRT ¼Xvs!;hdn!e�F0 vs0;hdnð Þ ð34Þ
Moreover, RBM classifies the data with an unsupervised
learning and it is effective in data recreation in an unsu-
pervised manner. The time to attain the association by the
recommended model is quite compound, so that CD
Sådhanå (2021) 46:63 Page 11 of 27 63

method is chosen and the proposed algorithm for CD is
mentioned below.
1. Select the training sample of vs and link with the visible
neurons.
2. By multiplying the visible vector with weight matrix
WM, the probability of hidden neuron pbhdn is measured.
3. Hidden states are sampled hdn from the probabilities
pbhdn.4. The outer product of vectors vs and pbhdn must be
measured, which is termed as positive gradient
uþ ¼ vs � pbFhdn.5. From the hidden states hdn0ð Þ, visible states sample
recreation vs0ð Þ is done. Later, the hidden states are
resample from the visible state recreation.
6. The outer product of vs0ð Þ and hdn0ð Þ is computed and it
is termed as negative gradient u� ¼ vs � pbFhdn.7. The positive gradient is subtracted from the negative
gradient DWM ¼ g uþ � u�ð Þ for computing the weight
updates.
8. The weights are modified by means of the novel values
w�c;d ¼ Dwc;d þ wc;d.
Here, the optimization of hidden neurons is done by the
proposed L-BOA algorithm.
6.4 Hybrid classifier
In this, the combination of NN and DBN is taken into
consideration for effective prediction of several diseases.
The developed L-BOA is used for hidden neuron opti-
mization in NN and DBN. By using the AND operation,
output of both NN and DBN are combined for providing the
hybrid output. The working procedure of the proposed
hybrid algorithm-based multi-disease prediction is shown
in figure 4.
7. Results and discussions
7.1 Experimental setup
The implementation of the suggested strategy is carried out
in MATLAB with the help of PC with Windows 10 OS,
4GB RAM, and Intel i3 core processor. For the experiment,
Figure 4. Hybrid Classifier for multi-disease prediction.
63 Page 12 of 27 Sådhanå (2021) 46:63

the population size was considered as 10, and the maximum
iteration count considered was 25. The performance anal-
ysis of the proposed L-BOA-NN?DBN was compared over
meta-heuristic algorithms namely GWO-NN?DBN [34],
WOA-NN?DBN [35], LA-NN?DBN [36], and BOA-
NN?DBN [37] and the analysis was compared over few
machine learning algorithms like SVM [40], KNN [41], NN
[42] [43], DBN [39], and NN?DBN [42] [39]. The eval-
uation metrics considered were ‘‘accuracy, sensitivity,
specificity, precision, FPR, FNR, NPV, FDR, F1 score, and
MCC’’. The information regarding the different test cases is
shown in table 2.
7.2 Description of datasets
The datasets such as ‘‘Alzheimer’s disease, Breast cancer,
Dermatology, Heart disease, Lung cancer, PD, and Thyroid
diseases’’ are considered for analysis associated with mul-
tiple disease prediction.
Alzheimer’s disease [44]: Here, the longitudinal MRI
data is used, which includes 150 subjects and persons who
are aged from 60 to 96. Each person is right-handed and
each subject is scanned at least once. In the complete
research, 72 subjects are termed as Non-demented and 64
subjects are termed as demented during the initial visits. In
non-demented category, 14 subjects are grouped in initial
visit and later characterized as demented in the next visit,
which comes under converted category.
Breast cancer [45]: ‘‘From a digitized image of fine
needle aspirate of breast mass, features are computed,
which determine the features of cell nuclei existing in the
image’’. This consists of attributes like ID number, diag-
nosis whether the person is suffering from malignant and
benign, texture, radius, area, perimeter, smoothness, con-
cavity, symmetry, compactness, fractal dimensions, and
concave points.
Dermatology [46]: It consists of the information related
to skin diseases and it involves 35 columns related to der-
matology data. Some of the attributes are erythryma,
scaling, definite borders, itching, Koebner_phenomenon,
age, and class.
Heart Disease [47]: It consists of 76 attributes, but all
published tests referred for employing the subset of 14
among them. Especially, Cleveland dataset has been used
by the researchers until today.
Lung cancer [48]: ‘‘It is employed by Hong and Young
for demonstrating the power of the optimal discriminant
plane even in ill-posed settings. The data is demonstrated
in three types of pathological lung cancers’’. It includes
the attributes like class and the other predictive attributes
are nominal, and considering the integer values from 0 to
3.
Parkinson disease [49]: It consists of ‘‘biomedical voice
measurements ranges from 31 people, 23 with Parkinson’s
disease. In table, each column is a specific voice metric, and
each row with respect to one of 195 voice recording from
these individuals. The aim of the data is for discriminating
healthy persons from those with Parkinson disease as per
status column and it is set to 0 for healthy and 1 for
infected’’.
Thyroid disease [50]: It includes the attributes like fnl-
wgt, age, marital-status, workclass, education-num, occu-
pation, relationship, native-country, sex, capital-loss,
education, hours-per-week, race, and capital-gain.
7.3 Evaluation Metrics
In this, the evaluation metrics are taken into consideration
for evaluating the performance.
(a) Accuracy: It is denoted in Eq. (22).
(b) Sensitivity: ‘‘the number of true positives, which are
recognized exactly’’.
Sensitivity ¼ PsTr
PsTr þ FsFað35Þ
(c) Specificity: ‘‘the number of true negatives, which are
determined precisely’’.
Table 2. Overall Performance analysis of the suggested and existing heuristic-oriented NN?DBN for disease prediction for test case 1
Performance
Measures
GWO-NN?DBN
[34]
WOA-NN?DBN
[35]
LA-NN?DBN
[36]
BOA-NN?DBN
[37]
L-BOA-
NN?DBN
‘‘Accuracy’’ .92 .91733 .91467 .90133 .93333
‘‘Sensitivity’’ .65333 .66667 .65333 .58667 .74667
‘‘Specificity’’ .98667 .98 .98 .98 .98
‘‘Precision’’ .92453 .89286 .89091 .88 .90323
‘‘FPR’’ .013333 .02 .02 .02 .02
‘‘FNR’’ .34667 .33333 .34667 .41333 .25333
‘‘NPV’’ .98667 .98 .98 .98 .98
‘‘FDR’’ .075472 .10714 .10909 .12 .096774
‘‘F1-Score’’ .76563 .76336 .75385 .704 .81752
‘‘MCC’’ .73486 .72574 .71609 .66679 .78245
Sådhanå (2021) 46:63 Page 13 of 27 63

Specificity ¼ PsFa
FsTrð36Þ
(d) Precision: ‘‘the ratio of positive observations that are
predicted exactly to the total number of observations
that are positively predicted’’.
Pr ecision ¼ PsTr
PsTr þ FsTrð37Þ
(e) FPR: ‘‘the ratio of count of false positive predictions to
the entire count of negative predictions’’.
FPR ¼ FsTr
FsTr þ PsFað38Þ
(f) FNR: ‘‘the proportion of positives which yield negative
test outcomes with the test’’.
FNR ¼ FsFa
FsFa þ PsTrð39Þ
(g) NPV: ‘‘ the probability that subjects with a negative
screening test truly don’t have the disease’’.
NPV ¼ FsFa
FsFa þ PsFað40Þ
(h) FDR: ‘‘the number of false positives in all of the
rejected hypotheses’’.
FDR ¼ FsTr
FsTr þ PsTrð41Þ
(i) F1 score: ‘‘harmonic mean between precision and
recall. It is used as a statistical measure to rate
performance’’.
F1score ¼ Sensitivity � Pr ecisionPr ecisionþ Sensitivity
ð42Þ
(j) MCC: ‘‘correlation coefficient computed by four
values’’.
MCC ¼ PsTr � PsFa � FsTr � FsFaffiffiffiffiffiffiffiffiffiffiffiffiffiffiffiffiffiffiffiffiffiffiffiffiffiffiffiffiffiffiffiffiffiffiffiffiffiffiffiffiffiffiffiffiffiffiffiffiffiffiffiffiffiffiffiffiffiffiffiffiffiffiffiffiffiffiffiffiffiffiffiffiffiffiffiffiffiffiffiffiffiffiffiffiffiffiffiffiffiffiffiffiffiffiffiffiffiffiffiffiffiffiffiffiffiffiffiPsTr þ FsTrð Þ PsTr þ FsFað Þ PsFa þ FsTrð Þ PsFa þ FsFað Þp
ð43Þ
7.4 Effect of optimized DBN in terms of accuracy
In figure 5, the analysis of the introduced L-BOA-
NN?DBN and the traditional meta-heuristic-based
NN?DBN with respect to accuracy for all test cases is
given. From figure 5 (a) the accuracy of L-BOA-NN?DBN
for test case 1 is acquiring the best performance when
compared over various optimized NN?DBN. The accuracy
of the developed L-BOA-NN?DBN is 1.1% superior to
BOA, 1.6% progressed than LA, 4.5% progressed than
WOA, and 10.9% progressed than GWO-NN?DBN when
the learning percentage is taken as 85. Moreover, the
accuracy of the L-BOA-NN?DBN is accurately predicting
the disease for test case 3 and it is shown in figure 5 (c). At
learning percentage 35, the accuracy of the offered L-BOA-
NN?DBN is 0.3% improved than LA, 0.4% improved than
WOA, 0.5% improved than GWO, and 0.9% better than
BOA-NN?DBN. Hence, it is assured that the suggested
L-BOA-NN?DBN are performing better in attaining best
results for predicting the disease with high accuracy.
7.5 Effect of optimized DBN in terms of precision
Figure 6 shows the performance analysis of the recom-
mended L-BOA-NN?DBN and the traditional NN?DBNs
with respect to precision for all 7 test cases. The precision
of the improved L-BOA-NN?DBN for test case 2 at
learning percentage 75 is 2% higher than GWO, 7.6%
higher than WOA, and 15.2% higher than BOA. When
considering any of the learning percentage, the introduced
L-BOA-NN?DBN is acquiring best performance and it is
shown in figure 6 (b). It is 1.9% improved than BOA, 5.2%
progressed than WOA, and 7.5% progressed than LA at
learning percentage 85. Thus, the recommended L-BOA-
NN?DBN are performing well in predicting the disease
precisely.
7.6 Effect of optimized DBN in terms of F1-score
In figure 7, the analysis of the introduced L-BOA-
NN?DBN and the existing algorithms in terms of perfor-
mance measure F1 score for all test cases is depicted. When
considering the learning percentage as 85, the accuracy of
L-BOA-NN?DBN is 50% advanced than GWO, 57.8%
advanced than BOA, and 100% advanced than WOA,
which is portrayed in figure 7 (e). Further, the f1 score of
the developed L-BOA-NN?DBN for test case 7 is 2%
progressed than BOA and 3.1% progressed than LA at
learning percentage 35, which is displayed in figure 7 (g).
Therefore, it is assured that the recommended L-BOA-
NN?DBN is accurately predicting the disease.
7.7 Overall performance analysis for optimizedDBN
The overall performance of the developed L-BOA-
NN?DBN and the existing meta-heuristic algorithms for
all the 7 test cases is shown from tables 3, 4, 5, 6, 7, 8 and 9.
In table 3, the accuracy of the implemented L-BOA-
NN?DBN is 1.4% improved than GWO, 1.7% better than
WOA, 2% better than LA, and 3.5% better than BOA-
NN?DBN for test case 1. For test case 2, the precision of
the improved L-BOA-NN?DBN from table 4 is 1.5%
upgraded than GWO, 4.7% upgraded than WOA, 85.8%
63 Page 14 of 27 Sådhanå (2021) 46:63

Figure 5. Performance analysis of developed and conventional meta-heuristic-oriented NN?DBN for multi-disease prediction
concerning accuracy for all the datasets namely ‘‘(a) Test case 1, (b) Test case 2, (c) Test case 3, (d) Test case 4, (e) Test case 5, (f) Test
case 6, (g) Test case 7’’.
Sådhanå (2021) 46:63 Page 15 of 27 63

Figure 6. Performance analysis of suggested and conventional meta-heuristic-oriented NN?DBN for multi-disease prediction
concerning precision for all the datasets namely ‘‘(a) Test case 1, (b) Test case 2, (c) Test case 3, (d) Test case 4, (e) Test case 5, (f) Test
case 6, (g) Test case 7’’.
63 Page 16 of 27 Sådhanå (2021) 46:63

Figure 7. Performance analysis of suggested and conventional meta-heuristic-oriented NN?DBN for multi-disease prediction
concerning f1 score for all the datasets namely ‘‘(a) Test case 1, (b) Test case 2, (c) Test case 3, (d) Test case 4, (e) Test case 5, (f) Test
case 6, (g) Test case 7’’.
Sådhanå (2021) 46:63 Page 17 of 27 63

upgraded than LA, and 12.7% upgraded than BOA.
Moreover, from table 5, the accuracy of the suggested
L-BOA-NN?DBN for test case 3 is 1.5% enhanced than
GWO, 1.7% higher than WOA, 2% higher than LA, and
1.9% higher than BOA. The precision of the developed
L-BOA-NN?DBN for test case 4 is performing well, which
is shown in table 6. It is 2.8% better than WOA, and LA. In
table 7, the accuracy of L-BOA-NN?DBN for test case 5
is 22.2% higher than GWO, and WOA, 15.7% higher than
LA, and 29.4% higher than BOA. For test case 6, the
Table 3. Overall Performance analysis of the suggested and existing heuristic-oriented NN?DBN for disease prediction for test case 1.
Performance
Measures
GWO-NN?DBN
[34]
WOA-NN?DBN
[35]
LA-NN?DBN
[36]
BOA-NN?DBN
[37]
L-BOA-
NN?DBN
‘‘Accuracy’’ .92 .91733 .91467 .90133 .93333
‘‘Sensitivity’’ .65333 .66667 .65333 .58667 .74667
‘‘Specificity’’ .98667 .98 .98 .98 .98
‘‘Precision’’ .92453 .89286 .89091 .88 .90323
‘‘FPR’’ .013333 .02 .02 .02 .02
‘‘FNR’’ .34667 .33333 .34667 .41333 .25333
‘‘NPV’’ .98667 .98 .98 .98 .98
‘‘FDR’’ .075472 .10714 .10909 .12 .096774
‘‘F1-Score’’ .76563 .76336 .75385 .704 .81752
‘‘MCC’’ .73486 .72574 .71609 .66679 .78245
Table 4. Overall Performance analysis of the recommended and existing heuristic-based NN?DBN for disease prediction for test case
2.
Performance
Measures
GWO-NN?DBN
[34]
WOA-NN?DBN
[35]
LA-NN?DBN
[36]
BOA-NN?DBN
[37]
L-BOA-
NN?DBN
‘‘Accuracy’’ .95421 .94505 .83516 .9304 .96337
‘‘Sensitivity’’ .75824 .72527 .12088 .69231 .8022
‘‘Specificity’’ .99341 .98901 .97802 .97802 .9956
‘‘Precision’’ .95833 .92958 .52381 .86301 .97333
‘‘FPR’’ .006593 .010989 .021978 .021978 .004396
‘‘FNR’’ .24176 .27473 .87912 .30769 .1978
‘‘NPV’’ .99341 .98901 .97802 .97802 .9956
‘‘FDR’’ .041667 .070423 .47619 .13699 .026667
‘‘F1-Score’’ .84663 .81481 .19643 .76829 .87952
‘‘MCC’’ .82791 .79145 .19166 .73405 .86374
Table 5. Overall Performance analysis of the suggested and existing heuristic-based NN?DBN for disease prediction for test case 3.
Performance
Measures
GWO-NN?DBN
[34]
WOA-NN?DBN
[35]
LA-NN?DBN
[36]
BOA-NN?DBN
[37]
L-BOA-
NN?DBN
‘‘Accuracy’’ .96646 .96456 .96139 .96203 .98101
‘‘Sensitivity’’ .94684 .94684 .9443 .94177 .96962
‘‘Specificity’’ .98608 .98228 .97848 .98228 .99241
‘‘Precision’’ .98551 .98163 .97772 .98153 .99223
‘‘FPR’’ .013924 .017722 .021519 .017722 .007595
‘‘FNR’’ .053165 .053165 .055696 .058228 .03038
‘‘NPV’’ .98608 .98228 .97848 .98228 .99241
‘‘FDR’’ .014493 .018373 .02228 .01847 .007772
‘‘F1-Score’’ .96578 .96392 .96072 .96124 .98079
‘‘MCC’’ .93363 .9297 .92332 .92481 .96228
63 Page 18 of 27 Sådhanå (2021) 46:63

precision of L-BOA-NN?DBN is 9.2% surpassed than
GWO, 17.3% surpassed than WOA, 9.6% surpassed than
LA, and 10.6% surpassed than BOA and it is shown in
table 8. In table 9, for test case 7, the accuracy of the
offered L-BOA-NN?DBN is 0.3% progressed than GWO,
1.1% improved than WOA, 4.2% improved than LA, and
1.5% improved than BOA. From the analysis, the proposed
L-BOA-NN?DBN are efficient in predicting the multi-
disease when compared over conventional meta-heuristic
improved NN?DBN.
Table 6. Overall Performance analysis of the suggested and existing heuristic-based NN?DBN for disease prediction for test case 4.
Performance
measures
GWO-NN?DBN
[34]
WOA-NN?DBN
[35]
LA-NN?DBN
[36]
BOA-NN?DBN
[37]
L-BOA-
NN?DBN
‘‘Accuracy’’ .97989 .96264 .96552 .97989 .99138
‘‘Sensitivity’’ .93913 .91304 .92174 .93913 .97391
‘‘Specificity’’ 1 .98712 .98712 1 1
‘‘Precision’’ 1 .97222 .97248 1 1
‘‘FPR’’ 0 .012876 .012876 0 0
‘‘FNR’’ .06087 .086957 .078261 .06087 .026087
‘‘NPV’’ 1 .98712 .98712 1 1
‘‘FDR’’ 0 .027778 .027523 0 0
‘‘F1-Score’’ .96861 .9417 .94643 .96861 .98678
‘‘MCC’’ .95485 .91524 .92175 .95485 .98058
Table 7. Overall performance analysis of the suggested and existing heuristic-oriented NN?DBN for disease prediction for test case 5.
Performance
Measures
GWO-NN?DBN
[34]
WOA-NN?DBN
[35]
LA-NN?DBN
[36]
BOA-NN?DBN
[37]
L-BOA-
NN?DBN
‘‘Accuracy’’ .75 .75 .79167 .70833 .91667
‘‘Sensitivity’’ .25 .375 .625 .375 .75
‘‘Specificity’’ 1 .9375 .875 .875 1
‘‘Precision’’ 1 .75 .71429 .6 1
‘‘FPR’’ 0 .0625 .125 .125 0
‘‘FNR’’ .75 .625 .375 .625 .25
‘‘NPV’’ 1 .9375 .875 .875 1
‘‘FDR’’ 0 .25 .28571 .4 0
‘‘F1-Score’’ .4 .5 .66667 .46154 .85714
‘‘MCC’’ .4264 .39528 .51856 .29019 .8165
Table 8. Overall Performance analysis of the recommended and existing heuristic-based NN?DBN for disease prediction for test case
6.
Performance
Measures
GWO-NN?DBN
[34]
WOA-NN?DBN
[35]
LA-NN?DBN
[36]
BOA-NN?DBN
[37]
L-BOA-
NN?DBN
‘‘Accuracy’’ .8125 .79167 .80208 .84375 .94792
‘‘Sensitivity’’ .70833 .72917 .6875 .79167 .91667
‘‘Specificity’’ .91667 .85417 .91667 .89583 .97917
‘‘Precision’’ .89474 .83333 .89189 .88372 .97778
‘‘FPR’’ .083333 .14583 .083333 .10417 .020833
‘‘FNR’’ .29167 .27083 .3125 .20833 .083333
‘‘NPV’’ .91667 .85417 .91667 .89583 .97917
‘‘FDR’’ .10526 .16667 .10811 .11628 .022222
‘‘F1-Score’’ .7907 .77778 .77647 .83516 .94624
‘‘MCC’’ .63902 .58794 .62068 .69126 .89759
Sådhanå (2021) 46:63 Page 19 of 27 63

7.8 Different machine learning algorithmsfor multi-disease prediction in terms of accuracy
The analysis of the suggested L-BOA-NN?DBN and the
state-of-the-art machine learning algorithms for all the 7 test
cases concerning the accuracy is depicted in figure 8. In
figure 8 (b), the accuracy of the introduced L-BOA-
NN?DBN accurately predicts the disease at any of the
learning percentage. At learning percentage 85, the accuracy
of the introduced L-BOA-NN?DBN is 15.8% advanced than
NN?DBN, 14.4% superior to DBN, 5.5% advanced than
NN, 11.7% advanced than KNN, and 6.7% advanced than
SVM for test case 2. From figure 8 (d), the accuracy of
L-BOA-NN?DBN at learning percentage 35 is 1% pro-
gressed than NN?DBN and NN, 19.5% progressed than
DBN, 4.2% progressed than KNN, and 3.1% progressed than
SVM for test case 4. Thus, it is proved that L-BOA-
NN?DBN are doing better in multi-disease prediction when
compared over traditional machine learning algorithms.
7.9 Different machine learning algorithmsfor multi-disease prediction in terms of precision
The precision of the proposed L-BOA-NN?DBN and the
classifiers for all seven test cases is shown in figure 9. For
test case 1, the precision of the recommended L-BOA-
NN?DBN at learning percentage 65 is 9.1% higher than
NN?DBN, 78.9% enhanced than DBN, 58.3% progressed
than NN, 90% progressed than KNN, and 18.7% progressed
than SVM and it is portrayed in figure 9 (a). Moreover, the
precision of the suggested L-BOA-NN?DBN for test case
3 is gaining the best performance when compared over
state-of-the-art classifiers. In figure 8 (c), the precision of
L-BOA-NN?DBN is 2% improved than NN?DBN, 4.1%
better than DBN and KNN, 3% progressed than NN, and
5.2% progressed than SVM at learning percentage 35.
Therefore, it is confirmed that the prediction of the disease
is accurately done by the proposed L-BOA-NN?DBN
through precision analysis.
7.9.a Different machine learning algorithms for multi-dis-ease prediction in terms of F1-score: Here, the predic-
tion analysis of L-BOA-NN?DBN and the traditional
classifiers in terms of the learning percentage for the
measure F1 score is given in figure 10. In figure 10 (f),
the f1 score of the implemented L-BOA-NN?DBN for
the test case 6 is 5.2% progressed than NN?DBN,
17.6% progressed than DBN and NN, 21.9% progressed
than KNN, and 28.2% progressed than SVM at learning
percentage 35. When considering the learning percent-
age as 35, the f1 score of the suggested L-BOA-
NN?DBN for test case 7 is 5.2% superior to NN?DBN,
17.6% superior to DBN, 13.6% higher than NN, 25%
higher than KNN, and 20.4% higher than SVM and it is
displayed in figure 10 (g). Hence, the performance of
L-BOA-NN?DBN is superior to traditional classifiers in
predicting the disease.
7.9.b Overall performance analysis by comparing differentmachine learning algorithms: From tables 10, 11, 12,
13 and 14, the overall analysis of the developed
L-BOA-NN?DBN and the existing classifiers is shown.
In table 10, the accuracy of L-BOA-NN?DBN is 6%
progressed than SVM, 15.5% progressed than KNN,
8.3% advanced than NN, 14% advanced than DBN, and
3.2% advanced than NN?DBN for test case 1. More-
over, the precision of the proffered L-BOA-NN?DBN
for test case 3 is 6.2% better than SVM, 94.1% better
than KNN, 1.6% better than NN, 4.6% better than DBN,
and 3.4% better than NN?DBN. For test case 5, the
accuracy of L-BOA-NN?DBN is 12.1% higher than
SVM and KNN, 37.4% higher than NN and DBN, and
22.2% upgraded than NN?DBN. In addition, the pre-
cision of the implemented L-BOA-NN?DBN for test
case 7 is 20% surpassed than SVM, 31.1% surpassed
than KNN, 3.6% surpassed than NN, 8.3% surpassed
than DBN, and 6.7% surpassed than NN?DBN. Thus, it
is affirmed that the implemented L-BOA-NN?DBN is
precisely predicting the disease over conventional
learning algorithms (tables 15, 16).
Table 9. Overall Performance analysis of the introduced and existing heuristic-based NN?DBN for disease prediction for test case 7.
Performance
Measures
GWO-NN?DBN
[34]
WOA-NN?DBN
[35]
LA-NN?DBN
[36]
BOA-NN?DBN
[37]
L-BOA-
NN?DBN
‘‘Accuracy’’ .96416 .95699 .92832 .95341 .96774
‘‘Sensitivity’’ .91398 .89247 .82796 .88172 .93548
‘‘Specificity’’ .98925 .98925 .97849 .98925 .98387
‘‘Precision’’ .97701 .97647 .95062 .97619 .96667
‘‘FPR’’ .010753 .010753 .021505 .010753 .016129
‘‘FNR’’ .086022 .10753 .17204 .11828 .064516
‘‘NPV’’ .98925 .98925 .97849 .98925 .98387
‘‘FDR’’ .022989 .023529 .049383 .02381 .033333
‘‘F1-Score’’ .94444 .93258 .88506 .92655 .95082
‘‘MCC’’ .91915 .90306 .83753 .89504 .92711
63 Page 20 of 27 Sådhanå (2021) 46:63

Figure 8. Analysis of improved and existing machine learning algorithms for multi-disease prediction concerning accuracy for all the
datasets namely ‘‘(a) Test case 1, (b) Test case 2, (c) Test case 3, (d) Test case 4, (e) Test case 5, (f) Test case 6, (g) Test case 7’’.
Sådhanå (2021) 46:63 Page 21 of 27 63

Figure 9. Analysis of developed and traditional machine learning algorithms for multi-disease prediction concerning precision for all
the datasets namely ‘‘(a) Test case 1, (b) Test case 2, (c) Test case 3, (d) Test case 4, (e) Test case 5, (f) Test case 6, (g) Test case 7’’.
63 Page 22 of 27 Sådhanå (2021) 46:63

Figure 10. Analysis of developed and traditional machine learning algorithms for multi-disease prediction concerning f1 score for all
the datasets namely ‘‘(a) Test case 1, (b) Test case 2, (c) Test case 3, (d) Test case 4, (e) Test case 5, (f) Test case 6, (g) Test case 7’’.
Sådhanå (2021) 46:63 Page 23 of 27 63

Table 10. Overall analysis of the suggested and existing machine learning algorithms for disease prediction for test case 1.
Performance Measures SVM [40] KNN [41] NN [42] DBN [39] NN?DBN [42] [39] L-BOA-NN?DBN
‘‘Accuracy’’ .88 .808 .86133 .81867 .904 .93333
‘‘Sensitivity’’ .48 .52 .41333 .54667 .62667 .74667
‘‘Specificity’’ .98 .88 .97333 .88667 .97333 .98
‘‘Precision’’ .85714 .52 .79487 .54667 .85455 .90323
‘‘FPR’’ .02 .12 .026667 .11333 .026667 .02
‘‘FNR’’ .52 .48 .58667 .45333 .37333 .25333
‘‘NPV’’ .98 .88 .97333 .88667 .97333 .98
‘‘FDR’’ .14286 .48 .20513 .45333 .14545 .096774
‘‘F1-Score’’ .61538 .52 .54386 .54667 .72308 .81752
‘‘MCC’’ .58345 .4 .50667 .43333 .6784 .78245
Table 11. Overall analysis of the recommended and conventional machine learning algorithms for disease prediction for test case 2.
Performance Measures SVM [40] KNN [41] NN [42] DBN [39] NN?DBN [42] [39] L-BOA-NN?DBN
‘‘Accuracy’’ .89744 .88645 .89744 .84615 .85897 .96337
‘‘Sensitivity’’ .41758 .65934 .49451 .53846 .17582 .8022
‘‘Specificity’’ .99341 .93187 .97802 .90769 .9956 .9956
‘‘Precision’’ .92683 .65934 .81818 .53846 .88889 .97333
‘‘FPR’’ .006593 .068132 .021978 .092308 .004396 .004396
‘‘FNR’’ .58242 .34066 .50549 .46154 .82418 .1978
‘‘NPV’’ .99341 .93187 .97802 .90769 .9956 .9956
‘‘FDR’’ .073171 .34066 .18182 .46154 .11111 .026667
‘‘F1-Score’’ .57576 .65934 .61644 .53846 .29358 .87952
‘‘MCC’’ .58119 .59121 .5851 .44615 .35781 .86374
Table 12. Overall analysis of the suggested and conventional machine learning algorithms for disease prediction for test case 3.
Performance Measures SVM [40] KNN [41] NN [42] DBN [39] NN?DBN [42] [39] L-BOA-NN?DBN
‘‘Accuracy’’ .93987 .95657 .98101 .9481 .9519 .98101
‘‘Sensitivity’’ .93423 .9525 .98608 .9481 .9443 .96962
‘‘Specificity’’ .94462 .96 .97595 .9481 .95949 .99241
‘‘Precision’’ .93423 .9525 .97619 .9481 .95887 .99223
‘‘FPR’’ .055385 .04 .024051 .051899 .040506 .007595
‘‘FNR’’ .065773 .047503 .013924 .051899 .055696 .03038
‘‘NPV’’ .94462 .96 .97595 .9481 .95949 .99241
‘‘FDR’’ .065773 .047503 .02381 .051899 .041131 .007772
‘‘F1-Score’’ .93423 .9525 .98111 .9481 .95153 .98079
‘‘MCC’’ .87884 .9125 .96207 .8962 .9039 .96228
Table 13. Overall analysis of the introduced and conventional machine learning algorithms for disease prediction for test case 4.
Performance Measures SVM [40] KNN [41] NN [42] DBN [39] NN?DBN [42] [39] L-BOA-NN?DBN
‘‘Accuracy’’ .95213 .94681 .98851 .83046 .97126 .99138
‘‘Sensitivity’’ .90411 .89726 .98261 1 .91304 .97391
‘‘Specificity’’ .9689 .96411 .99142 .74678 1 1
‘‘Precision’’ .91034 .89726 .98261 .66092 1 1
‘‘FPR’’ .0311 .035885 .008584 .25322 0 0
‘‘FNR’’ .09589 .10274 .017391 0 .086957 .026087
‘‘NPV’’ .9689 .96411 .99142 .74678 1 1
‘‘FDR’’ .089655 .10274 .017391 .33908 0 0
‘‘F1-Score’’ .90722 .89726 .98261 .79585 .95455 .98678
‘‘MCC’’ .87497 .86138 .97403 .70254 .93567 .98058
63 Page 24 of 27 Sådhanå (2021) 46:63

8. Conclusion
This paper has tried a novel approach for predicting several
diseases using deep learning. The developed disease pre-
diction was done by considering several diseases from
Kaggle or UCI repository such as Heart disease, Derma-
tology dataset, Thyroid disease dataset, breast cancer,
Parkinson’s disease, lung cancer, and Alzheimer’s disease.
From many sources, the medical datasets of various dis-
eases were collected. The optimal feature selection was
implemented for the attribute set of the entire datasets,
which was performed by the same hybrid algorithm named
as L-BOA. The first order statistical features were com-
puted and it was merged with the optimally extracted fea-
tures. These feature set were applied for both NN and DBN,
in which the hidden neuron count was optimized by the
L-BOA algorithm. From the analysis, the accuracy of the
recommended L-BOA-NN?DBN was 6% progressed than
SVM, 15.5% progressed than KNN, 8.3% surpassed than
NN, 14% surpassed than DBN, and 3.2% surpassed than
NN?DBN for test case 1. Thus, it is concluded that the
introduced L-BOA-NN?DBN has attained best prediction
Table 14. Overall analysis of the developed and conventional machine learning algorithms for disease prediction for test case 5.
Performance Measures SVM [40] KNN [41] NN [42] DBN [39] NN?DBN [42] [39] L-BOA-NN?DBN
‘‘Accuracy’’ .8172 .8172 .66667 .66667 .75 .91667
‘‘Sensitivity’’ .36364 .48485 .5 .5 .375 .75
‘‘Specificity’’ .91503 .88889 .75 .75 .9375 1
‘‘Precision’’ .48 .48485 .5 .5 .75 1
‘‘FPR’’ .084967 .11111 .25 .25 .0625 0
‘‘FNR’’ .63636 .51515 .5 .5 .625 .25
‘‘NPV’’ .91503 .88889 .75 .75 .9375 1
‘‘FDR’’ .52 .51515 .5 .5 .25 0
‘‘F1-Score’’ .41379 .48485 .5 .5 .5 .85714
‘‘MCC’’ .31211 .37374 .25 .25 .39528 .8165
Table 15. Overall analysis of the introduced and conventional machine learning algorithms for disease prediction for test case 6.
Performance Measures SVM [40] KNN [41] NN [42] DBN [39] NN?DBN [42] [39] L-BOA-NN?DBN
‘‘Accuracy’’ .81679 .85115 .82292 .85417 .78125 .94792
‘‘Sensitivity’’ .68493 .73973 .85417 .85417 .72917 .91667
‘‘Specificity’’ .86772 .89418 .79167 .85417 .83333 .97917
‘‘Precision’’ .66667 .72973 .80392 .85417 .81395 .97778
‘‘FPR’’ .13228 .10582 .20833 .14583 .16667 .020833
‘‘FNR’’ .31507 .26027 .14583 .14583 .27083 .083333
‘‘NPV’’ .86772 .89418 .79167 .85417 .83333 .97917
‘‘FDR’’ .33333 .27027 .19608 .14583 .18605 .022222
‘‘F1-Score’’ .67568 .73469 .82828 .85417 .76923 .94624
‘‘MCC’’ .54815 .63128 .6471 .70833 .56558 .89759
Table 16. Overall analysis of the recommended and conventional machine learning algorithms for disease prediction for test case 7.
Performance Measures SVM [40] KNN [41] NN [42] DBN [39] NN?DBN [42] [39] L-BOA-NN?DBN
‘‘Accuracy’’ .89569 .85941 .94265 .92832 .91398 .96774
‘‘Sensitivity’’ .80508 .73729 .89247 .89247 .82796 .93548
‘‘Specificity’’ .92879 .90402 .96774 .94624 .95699 .98387
‘‘Precision’’ .80508 .73729 .93258 .89247 .90588 .96667
‘‘FPR’’ .071207 .095975 .032258 .053763 .043011 .016129
‘‘FNR’’ .19492 .26271 .10753 .10753 .17204 .064516
‘‘NPV’’ .92879 .90402 .96774 .94624 .95699 .98387
‘‘FDR’’ .19492 .26271 .067416 .10753 .094118 .033333
‘‘F1-Score’’ .80508 .73729 .91209 .89247 .86517 .95082
‘‘MCC’’ .73388 .64131 .87003 .83871 .80395 .92711
Sådhanå (2021) 46:63 Page 25 of 27 63

results in predicting the multiple diseases in healthcare
sector.
AbbreviationsLA Lion algorithm
BOA Butterfly optimization algorithm
NN Neural network
DBN Deep belief network
L-BOA Lion-based BOA
SVM Support vector machine
EMR Electronic medical records
MCI Mild cognitive impairment
PD Parkinson’s disease
KNN K-nearest neighbor
NB Naive Bayesian
EPDP Efficient and privacy-preserving disease risk
prediction scheme
FPR False positive rate
LM Linear method
RF Random forest
DSAE Deep sparse auto-encoder architecture
ESD Energy spectral density
HRFLM Hybrid random forest with linear model
circRNA CircularRibo nucliec acid
FNR False negative rate
GIP Gaussian interaction profile
GWO Grey Wolf optimizer
MCC Matthew’s correlation coefficient
FDR False discover rate
OU Okamoto-Uchiyama
CKD Chronic kidney disease
NPV Negative predictive value
LDA Linear discriminate analysis
DT Decision tree
WOA Whale optimization algorithm
DBN Deep belief network
FRQR Fuzzy rough quick reduct
RBM Restricted Boltzmann machine
QDA Quadratic discriminate analysis
RNN Recurrent neural network
CD Contrast divergence
References
[1] Hong W, Xiong Z, Zheng N and Weng Y 2019 A medical-
history-based potential disease prediction algorithm; IEEEAccess. 7 131094–131101
[2] Haq A Q, Li J P, Memon M H, Khan J, Malik A, Ahmad T,
Ali A, Nazir S, Ahad I and Shahid M 2019 Feature selection
based on L1-norm support vector machine and effective
recognition system for Parkinson’s disease using voice
recordings; IEEE Access 7: 37718–37734
[3] Brisimi T S, Xu T, Wang T, Dai W, Adams W G and
Paschalidis I C 2018 Predicting chronic disease hospitaliza-
tions from electronic health records: an interpretable classi-
fication approach; Proc. IEEE. 106 690–707
[4] Abacha A B and Zweigenbaum P 2015 Means: a medical
question answering system combining nlp techniques and
semantic web technologies; Inform. Process Manag. 51570–594
[5] Sierra-Sosa D, Garcia-Zapirain M B, Castillo C, Oleagordia
I, Nuno-Solinis R, Urtaran-Laresgoiti M, Elmaghraby A
2019 Scalable healthcare assessment for diabetic patients
using deep learning on multiple GPUs; IEEE T. Ind. Inform.15: 5682–5689
[6] Lei H, Huang Z, Zhou F, Elazab A, Tan E-L, Li H, Qin J, Lei
B 2019 Parkinson’s disease diagnosis via joint learning from
multiple modalities and relations; IEEE J. Biomed. Health.23: 1437–1449
[7] Tong T, Gao Q, Guerrero R, Ledig C, Chen L, Rueckert D,
Alzheimer’s Disease Neuroimaging Initiative 2017 A novel
grading biomarker for the prediction of conversion from mild
cognitive impairment to Alzheimer’s disease; IEEE T Bio-Med. Eng. 64: 155–165
[8] Vijayalaxmi A, Sridevi S, Sridhar N, Ambesange S 2020
Multi-disease prediction with artificial intelligence from core
health parameters measured through non-invasive technique,
IEEE Access, 1252-1258[9] Patil P B, Shastry P M and Ashokumar P S 2020 Machine
learning based algorithm for risk prediction of cardio
vascular disease (Cvd); J. Crit. Rev. 7 836–844
[10] Saranya G and Pravin A 2020 A comprehensive study on
disease risk predictions in machine learning; Int. J. Elec.Comput. Eng. 10 4217–4225
[11] Luo J, Ding P, Liang C, Cao B and Chen X 2017 Collective
prediction of disease-associated miRNAs based on transduc-
tion learning; IEEE ACM T Comput. Biol. 14 1468–1475
[12] Benba A., Jilbab A and Hammouch A 2016 Discriminating
between patients with Parkinson’s and neurological diseases
using cepstral analysis; IEEE T. Neur. Sys. Reh. 241100–1108
[13] Zhao Z, Wang K Y, Wu F, Wang W, Zhang K N, Hu H M,
Liu Y W and Jiang T 2018 circRNA disease: a manually
curated database of experimentally supported circRNA-
disease associations, Cell Death Dis. 9[14] Alahmari S S, Cherezov D, Goldgof D B, Hall L O, Gillies R
J and Schabath M B 2018 Delta radiomics improves
pulmonary nodule malignancy prediction in lung cancer
screening; IEEE Access. 6 77796–77806
[15] Jadhav A S, Patil P B and Biradar S 2020 Computer-aided
diabetic retinopathy diagnostic model using optimal thresh-
olding merged with neural network; Int. J. Intell. Comput,Cybernet
[16] Jadhav A S, Patil P B and Biradar S 2020 Optimal featureselection-based diabetic retinopathy detection usingimproved rider optimization algorithm enabled with deeplearning; Evol, Intel
[17] Tao R, Zhang S, Huang X, Tao M, Ma J, Ma S, Zhang C,
Zhang T, Tang F, Lu J, Shen C and Xie X 2019
Magnetocardiography-based ischemic heart disease detec-
tion and localization using machine learning methods; IEEET Bio-Med. Eng. 66: 1658–1667
63 Page 26 of 27 Sådhanå (2021) 46:63

[18] Zhang J, Li Z, Pu Z and Xu C 2018 Comparing prediction
performance for crash injury severity among various
machine learning and statistical methods; IEEE Access. 660079–60087
[19] Jiang S, Zhu X and Wang L 2015 EPPS: efficient and
privacy-preserving personal health information sharing in
mobile healthcare social networks; Sensors. 15 22419–22438[20] Samanthula B K, Elmehdwi Y and Jiang W 2015 k-nearest
neighbor classification over semantically secure encrypted
relational data; IEEE Trans. Knowl. Data Eng. 271261–1273
[21] Zhu H, Liu X, Lu R and Li H 2017 Efficient and privacy-
preserving online medical prediagnosis framework using
nonlinear SVM; IEEE J. Biomed. Health 21 838–850
[22] Yi W, Park J and Kim J 2020 GeCo: Classification restricted
boltzmann machine hardware for on-chip semi-supervised
learning and bayesian inference ; IEEE T Neur Net. Learn.31 53–65
[23] Prakaash A S and Sivakumar K 2020 Optimized Recurrent
Neural Network with Fuzzy Classifier for Data Prediction
using Hybrid Optimization Algorithm: Scope towards
Diverse Applications, Int. J. Wavelets Multi.[24] Mohan S, Thirumalai C and Srivastava G 2019 Effective
heart disease prediction using hybrid machine learning
techniques; IEEE Access. 7 81542–81554
[25] Haq A U, Li J P, Memon M H, Nazir S and Sun R 2018 A
hybrid intelligent system framework for the prediction of
heart disease using machine learning algorithms; Mob. Inf.Syst. 2018: 21–22
[26] Xiao Q, Luo J and Dai J 2019 Computational prediction of
human disease- associated circRNAs based on manifold
regularization learning framework; IEEE J. Biomed. Health.23 2661–2669
[27] Yang X, Lu R, Shao J, Tang X and Yang H 2019 An efficient
and privacy-preserving disease risk prediction scheme for
E-healthcare; IEEE Internet Things. 6 3284–3297
[28] Vasquez-Morales G R, Martınez-Monterrubio S M, Moreno-
Ger P and Recio-Garcıa J A 2019 Explainable prediction of
chronic renal disease in the colombian population using
neural networks and case-based reasoning; IEEE Access. 7152900–152910
[29] Minhas S, Khanum A, Riaz F, Khan S A and Alvi A 2018
Predicting progression from mild cognitive impairment to
Alzheimer’s disease using autoregressive modelling of
longitudinal and multimodal biomarkers; IEEE J. Biomed.Health. 22 818–825
[30] Escudero J, Ifeachor E, Zajicek J P, Green C, Shearer J and
Pearson S 2013 Machine learning-based method for person-
alized and cost-effective detection of Alzheimer’s disease ;
IEEE T Bio-Med Eng. 60 164–168
[31] Arunkumar C and Ramakrishnan S 2019 Prediction of cancer
using customised fuzzy rough machine learning approaches;
Hlthc. Tech. Le. 6 13–18
[32] Karim A M, Guzel M S, Tolun M R, Kaya H and Celebi F V
2018 A new framework using deep auto-encoder and energy
spectral density for medical waveform data classification and
processing; Biocybern. Biomed. Eng. 39 1–12
[33] Yilmaz A A, Guzel M S, Bostanci E and Askerzade I 2020 A
novel action recognition framework based on deep-learning
and genetic algorithms; IEEE Access. 8 1–16
[34] Mirjalili S, Mirjalili S M and Lewis, 2014 A grey wolf
optimizer; Adv. Eng. Softw. 69 46–61
[35] Mirjalili S and Lewis A 2016 The whale optimization
algorithm; Adv Eng Softw. 95 51–67
[36] Boothalingam R 2018 Optimization using lion algorithm: a
biological inspiration from lion’s social behavior; Evol. Intel.11 31–52
[37] Arora S and Singh S 2018 Butterfly optimization algorithm:
a novel approach for global optimization, Soft Comput.715–734
[38] Beno M. M., Valarmathi I. R., Swamy S. M. and Rajakumar
B. R. 2014 Threshold prediction for segmenting tumour from
brain MRI scans; Int. J. Imag. Syst. Tech. 24 129–137
[39] Liu Y, Zhou H, Tsung F and Zhang S 2019 Real-time quality
monitoring and diagnosis for manufacturing process profiles
based on deep belief networks; Comput. Ind. Eng. 136494–503
[40] Yu S, Tan K K, Sng B L, Li S and Sia A T H 2015 Lumbar
Ultrasound Image Feature Extraction and Classification with
Support Vector Machine; Ultrasound Med. Biol. 412677–2689
[41] Chen Y, Hu X, Fan W, Shen L, Zhang Z, Liu X, Du J, Li H,
Chen Y and Li H 2019 Fast density peak clustering for large
scale data based on kNN. Knowl-Based Syst.[42] Fernandez-Navarro F, Carbonero-Ruz M, Alonso D B and
Torres-Jimenez M 2017 Global Sensitivity estimates for
neural network classifiers; IEEE T Neur. Netw. Learn. 282592–2604
[43] Preetha N S N, Brammya G, Ramya R, Praveena S, Binu D
and Rajakumar B R 2018 Grey wolf optimisation-based
feature selection and classification for facial emotion recog-
nition; IET Biom. 7 490–499
[44] Alzheimer dataset, https://www.kaggle.com/hyunseokc/
detecting-early-alzheimer-s/data.
[45] Breast cancer dataset, https://archive.ics.uci.edu/ml/datasets/
Breast?Cancer?Wisconsin?(Diagnostic).
[46] Dermatology, https://www.kaggle.com/syslogg/dermatol
ogy-dataset.
[47] Heart disease, http://archive.ics.uci.edu/ml/datasets/
Heart?Disease.
[48] Lung cancer, http://archive.ics.uci.edu/ml/datasets/
Lung?Cancer.
[49] Parkinson’s disease, https://archive.ics.uci.edu/ml/datasets/
Parkinsons.
[50] Thyroid, https://www.kaggle.com/kumar012/hypothyroid#
hypothyroid.csv.
Sådhanå (2021) 46:63 Page 27 of 27 63