optimizing customer experience through operational excellence · operational excellence 1....
TRANSCRIPT
Cisco IBSG Copyright © 2009 Cisco Systems, Inc. All rights reserved.
Survey Report
Optimizing Customer Experience through Operational Excellence
AuthorsCarlos CorderoRob Rowello
March 2009
Cisco Internet Business Solutions Group (IBSG)

Cisco IBSG Copyright © 2009 Cisco Systems, Inc. All rights reserved.
Cisco IBSG Copyright © 2009 Cisco Systems, Inc. All rights reserved.
Introduction Since its inception in 1948, the cable television industry has focused primarily on delivering video services to the home. In the past seven to 10 years, however, the industry has undergone a significant transition: multiservice operators (MSOs) have branched out, extending their offerings to “triple-play” (video, voice, and data) services to grow RGUs (revenue-generating units) and reduce customer churn.
This transition has resulted in a proliferation of product features and a dramatic increase in operational complexity, which has led to a greater number of post-installation-related issues, many of which occur within 30 days of installation. Issues related to post-installation will continue, as MSOs deploy “Connected Life”1 services to succeed triple-play offerings. Because of this, support costs likely will grow irreversibly, pushing MSOs into the red and, ultimately, threatening their sustainability.
Fortunately, a workable solution is at hand. Following a recent study conducted by the Cisco® Internet Business Solutions Group (IBSG), we estimate that MSOs could achieve a 30 percent to 35 percent reduction in technical support costs by improving their product-installation processes. Several factors contribute to installation-related support costs, including poor-quality workmanship by technicians, complicated product designs that are neither intuitive to customers nor user-friendly, and processes that are ineffective in educating customers. Installation-related support costs total more than $2 billion per year for the U.S. cable industry alone, according to IBSG estimates. One can safely assume that these problems are not unique to the U.S. cable industry.
Survey Report
1
Optimizing Customer Experience through Operational Excellence
1. Today’s consumers have access to various content and services from PCs, mobile devices, and televisions. The Connected Life reflects the growing trend of having a consistent “experience” across all services and devices virtually anytime, anywhere.
Cisco IBSG Copyright © 2009 Cisco Systems, Inc. All rights reserved.2
Project OverviewIn December 2007, a senior executive at a major U.S. cable MSO asked IBSG to perform a detailed study of its technical support costs. Specifically, the MSO wanted to identify key drivers of support costs from a product and process perspective. Intense compe-tition from both satellite providers and traditional incumbent local exchange carriers often led the MSO to accelerate (and sometimes undertest) the launch of advanced voice/video/data services and customer premises equipment (CPE). The company often was first to market with new and innovative service offerings. Customers, however, experienced CPE, software, and network stability issues, which added strain and cost to the MSO’s downstream support operations.
The IBSG study needed to find definitive answers to several fundamental questions, specifically:
1. What are the key drivers of customer support costs attributable to product installation, and what are the related root causes?
2. How can product installation be improved to reduce downstream customer support costs?
As a result of our initial conversations with the MSO, we assembled a team of experts with deep knowledge of the cable industry, operations, product strategy, and analytics. We identified an appropriate market on which to focus the analysis: one with a high proportion of next-generation products and services atop a stable architecture. We then worked closely with the MSO’s local call centers (multiple tiers), field technicians, and network engineers to carry out the project. Finally, the team identified the service-installation process as a major area for improvement, and IBSG recommended a series of actions the MSO could take to eliminate or reduce costs attributed to product installation.
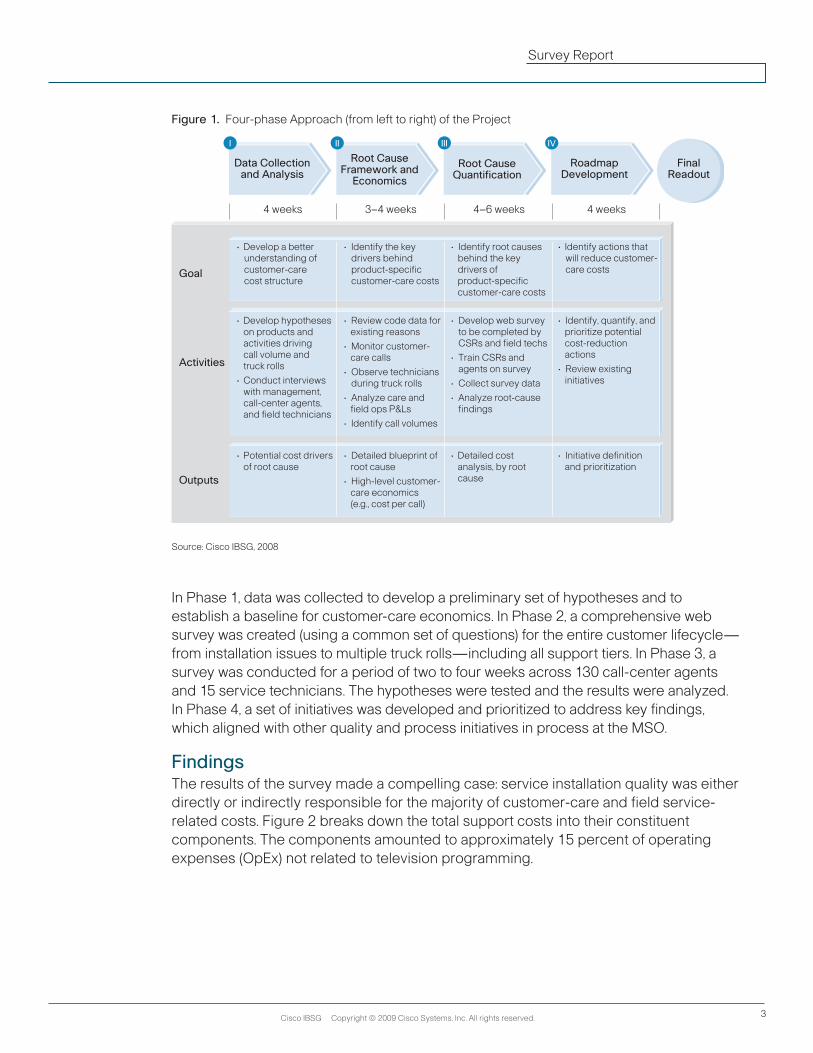
MethodologyIBSG deployed a web-based survey tool across multiple tiers of support, from the front-line customer-care call center to field operations. Using this tool, we analyzed a statistically significant sample of customer calls and “truck rolls”2 to determine which elements were affecting costs in the areas of customer care and operational support. By combining this data with interactive voice-response call statistics, profit and loss data, and product inventories, we acquired significant insight into the true costs of the root causes. The methodology consisted of four phases, shown in Figure 1, spanning 14 to 18 weeks.
2. A truck roll is the dispatch of a truck or vehicle to an offsite location to install or repair a service.
Cisco IBSG Copyright © 2009 Cisco Systems, Inc. All rights reserved. 3
Survey Report
Figure 1. Four-phase Approach (from left to right) of the Project
Source: Cisco IBSG, 2008
In Phase 1, data was collected to develop a preliminary set of hypotheses and to establish a baseline for customer-care economics. In Phase 2, a comprehensive web survey was created (using a common set of questions) for the entire customer lifecycle—from installation issues to multiple truck rolls—including all support tiers. In Phase 3, a survey was conducted for a period of two to four weeks across 130 call-center agents and 15 service technicians. The hypotheses were tested and the results were analyzed. In Phase 4, a set of initiatives was developed and prioritized to address key findings, which aligned with other quality and process initiatives in process at the MSO.
FindingsThe results of the survey made a compelling case: service installation quality was either directly or indirectly responsible for the majority of customer-care and field service-related costs. Figure 2 breaks down the total support costs into their constituent components. The components amounted to approximately 15 percent of operating expenses (OpEx) not related to television programming.
Goal
• Develop a better understanding of customer-care cost structure
• Identify the key drivers behind product-specific customer-care costs
• Identify root causes behind the key drivers of product-specific customer-care costs
• Identify actions that will reduce customer-care costs
4 weeks
Data Collection and Analysis
3–4 weeks 4–6 weeks 4 weeks
Activities
• Develop hypotheses on products and activities driving call volume and truck rolls
• Conduct interviews with management, call-center agents, and field technicians
• Review code data for existing reasons
• Monitor customer-care calls
• Observe technicians during truck rolls
• Analyze care and field ops P&Ls
• Identify call volumes
• Develop web survey to be completed by CSRs and field techs
• Train CSRs and agents on survey
• Collect survey data
• Analyze root-cause findings
• Identify, quantify, and prioritize potential cost-reduction actions
• Review existing initiatives
Outputs
• Potential cost drivers of root cause
• Detailed blueprint of root cause
• High-level customer-care economics (e.g., cost per call)
• Detailed cost analysis, by root cause
• Initiative definition and prioritization
Root CauseFramework and
Economics
Root CauseQuantification
RoadmapDevelopment
FinalReadout
I II III IV
Cisco IBSG Copyright © 2009 Cisco Systems, Inc. All rights reserved.
Cisco IBSG Copyright © 2009 Cisco Systems, Inc. All rights reserved.
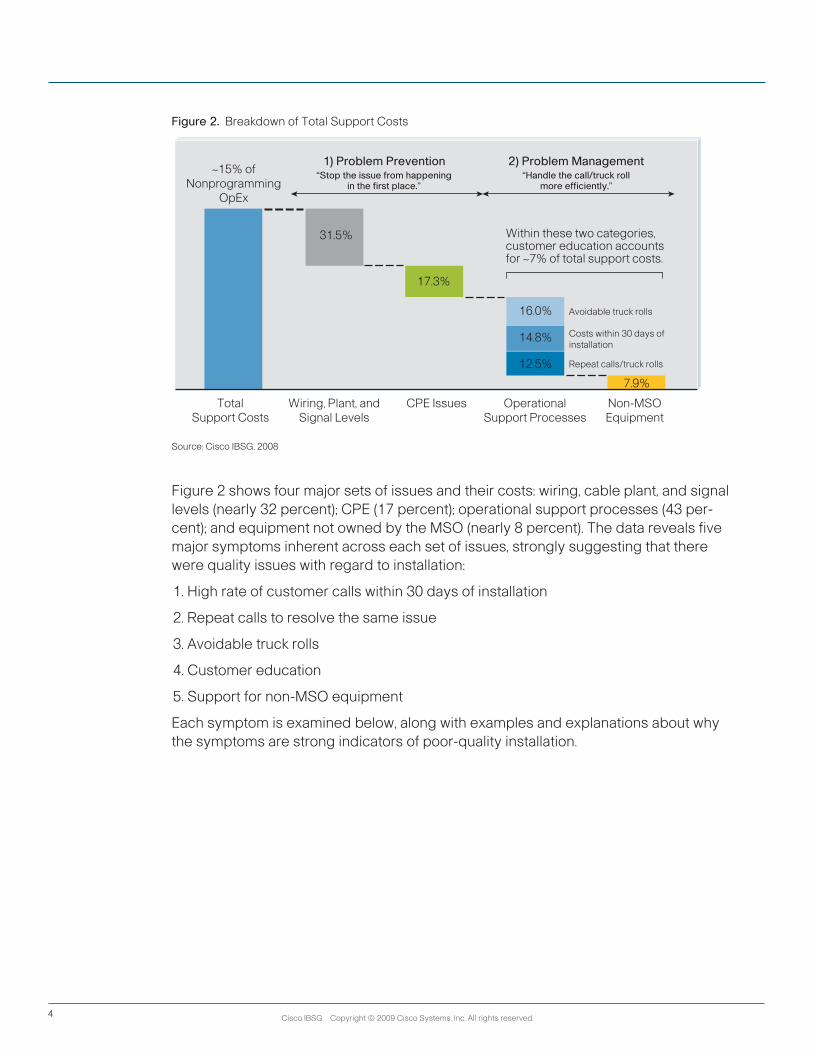
Figure 2. Breakdown of Total Support Costs
Source: Cisco IBSG, 2008
Figure 2 shows four major sets of issues and their costs: wiring, cable plant, and signal levels (nearly 32 percent); CPE (17 percent); operational support processes (43 per-cent); and equipment not owned by the MSO (nearly 8 percent). The data reveals five major symptoms inherent across each set of issues, strongly suggesting that there were quality issues with regard to installation:
1. High rate of customer calls within 30 days of installation
2. Repeat calls to resolve the same issue
3. Avoidable truck rolls
4. Customer education
5. Support for non-MSO equipment
Each symptom is examined below, along with examples and explanations about why the symptoms are strong indicators of poor-quality installation.
4
TotalSupport Costs
Wiring, Plant, andSignal Levels
CPE Issues OperationalSupport Processes
Non-MSOEquipment
1) Problem Prevention“Stop the issue from happening
in the first place.”
2) Problem Management“Handle the call/truck roll
more efficiently.”
~15% ofNonprogramming
OpEx
31.5%
17.3%
16.0%
14.8%
12.5%
7.9%
Avoidable truck rolls
Costs within 30 days of installation
Within these two categories,customer education accountsfor ~7% of total support costs.
Repeat calls/truck rolls
Cisco IBSG Copyright © 2009 Cisco Systems, Inc. All rights reserved. Cisco IBSG Copyright © 2009 Cisco Systems, Inc. All rights reserved. 5
Survey Report
High Rate of Customer Calls within 30 Days of InstallationWe discovered that many issues that manifest within a short period after service installation tend to be related to installation quality. Costs associated with quality were relatively high: the survey indicated that 15 percent of total customer support OpEx was related to issues identified within 30 days of the original service installation. This was a profound observation. A sampling of the root causes exposed quality issues related to provisioning; defective home wiring, connectors, splitters, and CPE; and a lack of product knowledge on the part of the user. Each of these issues could have been either avoided or minimized by focusing more on installation quality. This confirmed our hypothesis that a high rate of customer calls within 30 days of installation was a strong indicator of systemic installation issues.
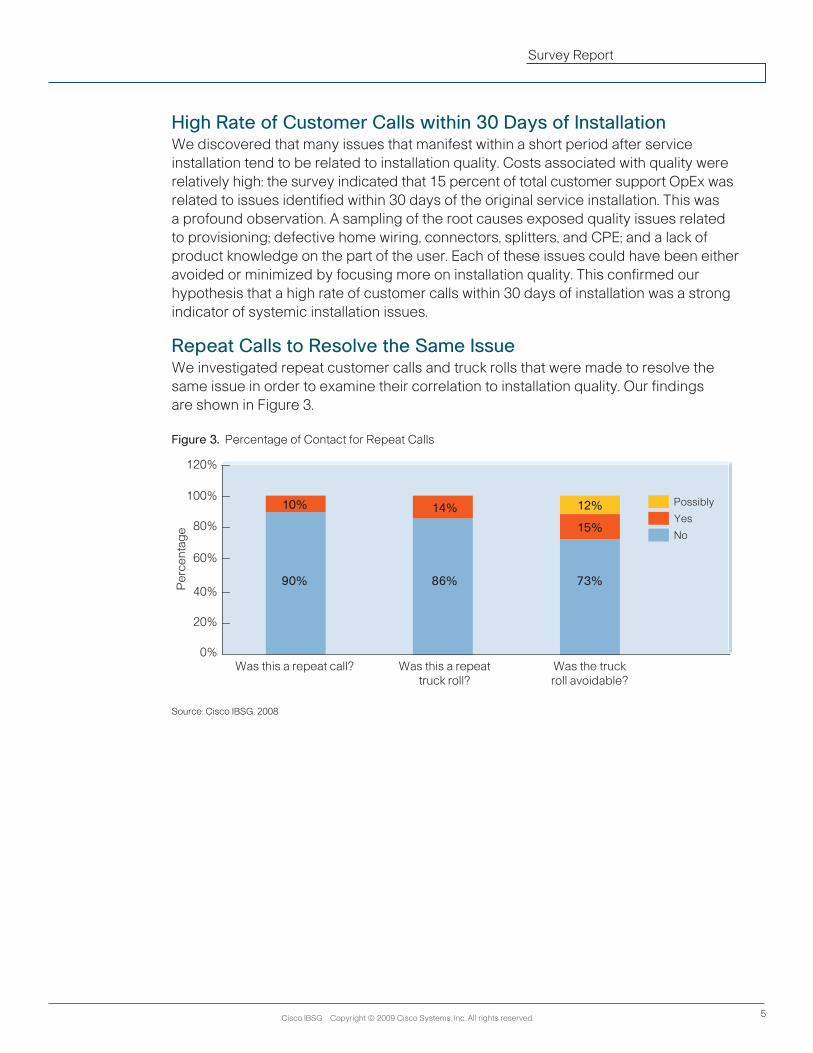
Repeat Calls to Resolve the Same IssueWe investigated repeat customer calls and truck rolls that were made to resolve the same issue in order to examine their correlation to installation quality. Our findings are shown in Figure 3.
Figure 3. Percentage of Contact for Repeat Calls
Source: Cisco IBSG, 2008
Was this a repeat call? Was this a repeattruck roll?
Was the truckroll avoidable?
90%
120%
Per
cent
age
100%
80%
60%
40%
20%
0%
10%
86%
14%
73%
15%
12% Possibly
Yes
No
Cisco IBSG Copyright © 2009 Cisco Systems, Inc. All rights reserved.6
We determined that approximately 10 percent of all customer calls and more than 14 percent of all truck rolls were repeats for the same issue. The latter percentage is remarkably high, given the fact that truck rolls represented 72 percent of total support OpEx based on our analysis. This implies that a modest improvement in technician quality could have a profound impact on the MSO’s bottom line.
The top three issues related to repeat calls were 1) faulty CPE; 2) faulty subscriber-owned equipment such as TVs, PCs, or landlines; and 3) home wiring. All three could have been either detected or prevented by the installation technician or through preinstallation quality and audit procedures. For example, a set-top box could be checked for quality at the warehouse prior to installation, especially if it had been in service previously. The installer could also spend more time checking to see if the subscriber’s TV set is working properly and is receiving all of the subscribed channels. Given this, we confirmed that repeat subscriber calls to resolve a common problem were a good indicator of installation quality issues.
Avoidable Truck RollsThe survey determined that 15 percent of truck rolls definitely could have been avoided, and 12 percent of truck rolls possibly could have been avoided—a potential avoidance factor of 27 percent. As mentioned earlier, truck rolls represent 72 percent of total support OpEx. Therefore, 19 percent of support OpEx could have been avoided simply by preventing the occurrence of truck rolls. Again, we found that faulty home cabling and connections were the primary root causes linked directly to poor-quality installation. Because of this, a high metric for avoidable truck rolls would indicate opportunities for improvements in installation quality.
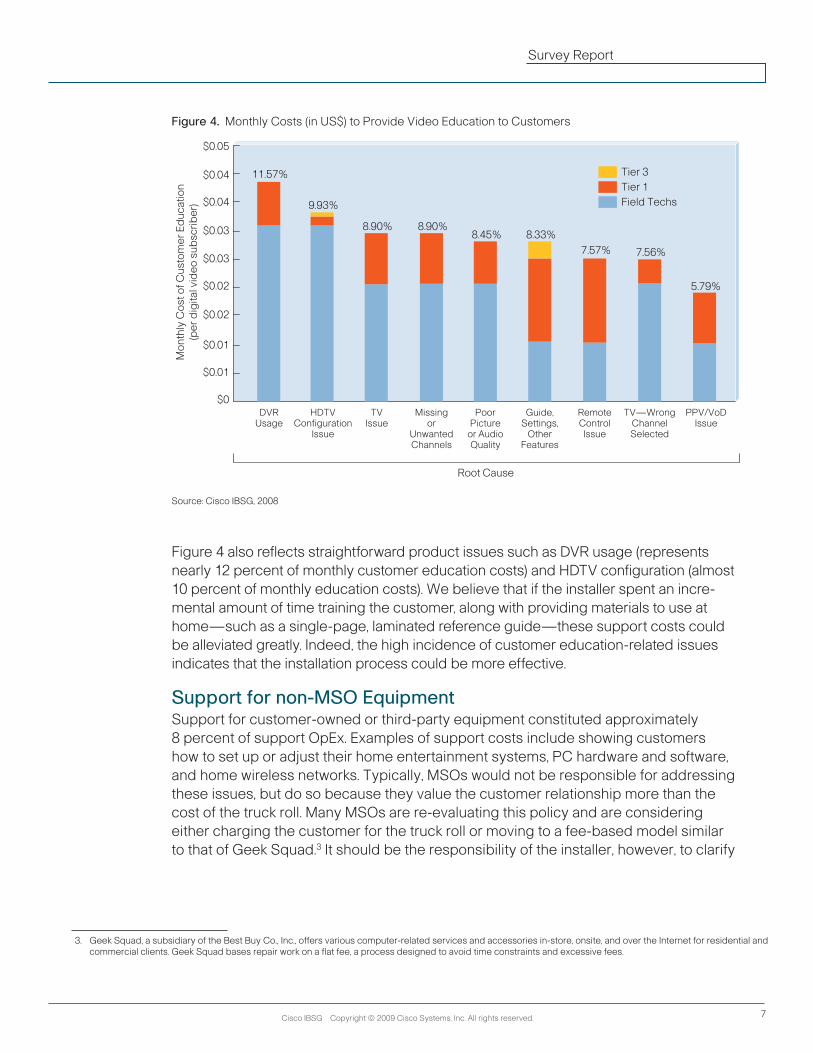
Customer Education According to the survey, 7 percent of total support costs came from issues attributed directly to the customer’s lack of product knowledge. For example, in regard to video, customers had difficulty navigating the interactive program guide, using the remote control, and ordering pay-per-view and on-demand programming, among other features. Figure 4 summarizes our findings for video only, but additional IBSG analysis for data and digital voice services showed comparable results.
Figure 4 breaks down cost by type of issue and is color-coded by support tier. Based on additional analysis, the total cost per digital video subscriber was approximately $0.50, which is an appreciable percentage of average revenue per user for a typical MSO.
Cisco IBSG Copyright © 2009 Cisco Systems, Inc. All rights reserved. Cisco IBSG Copyright © 2009 Cisco Systems, Inc. All rights reserved. 7
Survey Report
Figure 4. Monthly Costs (in US$) to Provide Video Education to Customers
Source: Cisco IBSG, 2008
Figure 4 also reflects straightforward product issues such as DVR usage (represents nearly 12 percent of monthly customer education costs) and HDTV configuration (almost 10 percent of monthly education costs). We believe that if the installer spent an incre-mental amount of time training the customer, along with providing materials to use at home—such as a single-page, laminated reference guide—these support costs could be alleviated greatly. Indeed, the high incidence of customer education-related issues indicates that the installation process could be more effective.
Support for non-MSO EquipmentSupport for customer-owned or third-party equipment constituted approximately 8 percent of support OpEx. Examples of support costs include showing customers how to set up or adjust their home entertainment systems, PC hardware and software, and home wireless networks. Typically, MSOs would not be responsible for addressing these issues, but do so because they value the customer relationship more than the cost of the truck roll. Many MSOs are re-evaluating this policy and are considering either charging the customer for the truck roll or moving to a fee-based model similar to that of Geek Squad.3 It should be the responsibility of the installer, however, to clarify
DVRUsage
$0.03
$0.04
$0.04
$0.05
Mon
thly
Cos
t of C
usto
mer
Ed
ucat
ion
(per
dig
ital v
ideo
sub
scrib
er)
$0.03
$0.02
$0.02
$0.01
$0.01
$0
11.57%
HDTVConfiguration
Issue
9.93%
TVIssue
8.90%
Missingor
UnwantedChannels
8.90%
Root Cause
PoorPicture
or AudioQuality
8.45%
Guide,Settings,
OtherFeatures
8.33%
RemoteControl
Issue
7.57%
TV—WrongChannelSelected
7.56%
PPV/VoDIssue
5.79%
Tier 3Tier 1Field Techs
3. Geek Squad, a subsidiary of the Best Buy Co., Inc., offers various computer-related services and accessories in-store, onsite, and over the Internet for residential and commercial clients. Geek Squad bases repair work on a flat fee, a process designed to avoid time constraints and excessive fees.
Cisco IBSG Copyright © 2009 Cisco Systems, Inc. All rights reserved.8
with the customer the scope of the service and offer support alternatives for non-MSO equipment. Therefore, issues of this nature arising in calls to the call center or during a truck roll would indicate that problems could have been addressed at the time of service installation, at a much lower cost.
Recommended Actions IBSG discovered that 30 percent to 35 percent of support costs were the direct result of installation-related issues, and recommended five actions the MSO could pursue immediately to achieve significant reductions in OpEx support:
1. Improve the quality of installations
• Implementaquality-trackingprogramtomeasurethetechnician’sworkincustomers’ homes, and hold technicians accountable for the quality of their installations
• Developandimplementanincentiveprogramtorewardtechniciansforexcellentinstallation quality
• Re-evaluatetherolesofbothin-housetechniciansandcontractinstallers
• Re-evaluatethetrainingprovidedtoinstallationtechnicians,andensurethattheright skill sets are considered in the hiring process
2. Exploit self-installations better
• Identifywaystoincreasethepercentageofself-installationsforallproducts
• Ensurethatself-installkitscontainhighlyintuitiveandclearinstructions
• Ensurethatproductsareproperlydesignedforself-installation(legibledesigns,intuitive packaging, and more)
• Makeimprovementstoserviceprovisioningprocesses(automated, preprovisioning, and point of sale)
3. Improve customer education
• Allowinstallationtechnicianstospendmoretimewithcustomerstoeducatethem on how to use the product and/or service
• ProvideintuitivelabelingofcomponentsonCPEsuchasset-topboxes,modems,and EMTAs (embedded multimedia terminal adapters)
• Evaluateandoverhaulrequiredmaterials(welcomekits,educationandlaminatedcollateral for home use, bilingual materials, and more)
4. Optimize product design for easy installation
• UsesimplecablingsuchasHDMI(high-definitionmulitmediainterface)insteadof composite cables
• Deploy“plug-and-play”technology
Cisco IBSG Copyright © 2009 Cisco Systems, Inc. All rights reserved. Cisco IBSG Copyright © 2009 Cisco Systems, Inc. All rights reserved. 9
Survey Report
• Usecolor-codedportsandcablingtoidentifycomponentseasily
• Minimizeproductcomplexity(forexample,provideuser-friendlysoftware, and do not create extra ports or standby buttons)
5. Deploy a model similar to that of Geek Squad to service non-MSO equipment
• Identifyopportunitiestopartner,outsource,orgrowthiscapabilityin-house
The MSO with whom we worked has turned these five recommendations into a set of quality initiatives that are being implemented as part of both existing programs and new ones. In particular, installation-quality initiatives will position the MSO to offer advanced Connected Life services such as online video, collaboration, and home-security monitoring more profitably.
ConclusionThroughout this project, IBSG saw the potential ripple effect that installation-related issues can have on overall customer-care OpEx. To reiterate, these costs manifest in five areas:
1. High call rate within 30 days of installation
2. Repeat calls to resolve the same issue
3. Avoidable truck rolls
4. Customer education
5. Support for non-MSO equipment
It is clear that investments in capital and resources will be required to reduce these costs by implementing the key recommendations described above, which will result in higher-quality installations, increased customer satisfaction, and reduced customer churn and support costs.
Although the results outlined in this paper were specific to one MSO, we are confident that these actions will result in positive business cases for other service providers globally. IBSG’s analysis can assist MSOs and service providers in identifying the key drivers of technical support costs that can be addressed through improved installations. The actions we recommend will help them recover these costs and improve their positioning to tackle other operational challenges.
More InformationThe Cisco Internet Business Solutions Group (IBSG), the global strategic consulting arm of Cisco, helps CXOs and public sector leaders transform their organizations—first by designing innovative business processes, and then by integrating advanced technologies into visionary roadmaps that address key CXO concerns.
For further information about IBSG, visit http://www.cisco.com/go/ibsg
Cisco has more than 200 offices worldwide. Addresses, phone numbers, and fax numbers are listed on the Cisco website at www.cisco.com/go/offices.
CCDE, CCENT, Cisco Eos, Cisco HealthPresence, the Cisco logo, Cisco Lumin, Cisco Nexus, Cisco StadiumVision, Cisco TelePresence, Cisco WebEx, DCE, and Welcome to the Human Network are trademarks; Changing the Way We Work, Live, Play, and Learn and Cisco Store are service marks; and Access Registrar, Aironet, AsyncOS, Bringing the Meeting To You, Catalyst, CCDA, CCDP, CCIE, CCIP, CCNA, CCNP, CCSP, CCVP, Cisco, the Cisco Certified Internetwork Expert logo, Cisco IOS, Cisco Press, Cisco Systems, Cisco Systems Capital, the Cisco Systems logo, Cisco Unity, Collaboration Without Limitation, EtherFast, EtherSwitch, Event Center, Fast Step, Follow Me Browsing, FormShare, GigaDrive, HomeLink, Internet Quotient, IOS, iPhone, iQuick Study, IronPort, the IronPort logo, LightStream, Linksys, MediaTone, MeetingPlace, MeetingPlace Chime Sound, MGX, Networkers, Networking Academy, Network Registrar, PCNow, PIX, PowerPanels, ProConnect, ScriptShare, SenderBase, SMARTnet, Spectrum Expert, StackWise, The Fastest Way to Increase Your Internet Quotient, TransPath, WebEx, and the WebEx logo are registered trademarks of Cisco Systems, Inc. and/or its affiliates in the United States and certain other countries.
All other trademarks mentioned in this document or website are the property of their respective owners. The use of the word partner does not imply a partnership relationship between Cisco and any other company.
(0812R) CB/LW15471 0309
Americas HeadquartersCisco Systems, Inc.San Jose, CA
Asia Pacific HeadquartersCisco Systems (USA) Pte. Ltd.Singapore
Europe HeadquartersCisco Systems International BVAmsterdam, The Netherlands