optimizing water’tr plant performance usin composite correction program … · 2016-12-21 ·...
TRANSCRIPT

Optimizing Water’TrPlant Performance UsinComposite CorrectionP r o g r a m
1998 Edition
United StatesEnvironmental Protection Agency
Office of Research andDevelopmentWashington DC 20460
Office ofWaterWashington DC 20460
EPA/625/6-91/027Revised August 1998

EPA/625/6-9 l/O27Revised August 1998
Handbook
Optimizing Water Treatment PlantPerformance Using the
Composite Correction Program
1998 Edition
Technical Support CenterStandards and Risk Management DivisionOffice of Ground Water and Drinking Water
Office of WaterCincinnati, Ohio 45268
Center for Environmental Research InformationTechnology Transfer and Support Division
National Risk Management Research LaboratoryOffice of Reasearch and DevelopmentU.S. Environmental Protection Agency
Cincinnati, Ohio 45268
@ Printed on Recycled Paper

No the
This document has been reviewed in accordance with the U.S. EnvironmentalProtection Agency’s peer and administrative review policies and approved forpublication. Mention of trade names or commercial products does not constituteendorsement or recommendation for use.

Acknowledgments
This handbook was prepared for the United States Environmental Protection Agency (U.S. EPA) byProcess Applications, Inc. Although many individuals contributed to the preparation and review of thisdocument, the assistance of the individuals listed below is especially acknowledged.
Major Authors:Bob A. Hegg and Larry D. DeMers, Process Applications, Inc., Fort Collins, ColoradoJon H. Bender, Eric M. Bissonette, and Richard J. Lieberman, U.S. EPA Office of Groundwater and
Drinking Water (OGWDW) Technical Support Center (TSC), Cincinnati, Ohio
Project Managers:James E. Smith, Jr., U.S. EPA Office of Research and Development, Technology Transfer and
Support Division, National Risk Management Research Laboratory (NRMRL)Jon H. Bender, U.S. EPA OGWDW, TSC, Cincinnati, Ohio
Reviewers:Frank Evans, U.S. EPA, NRMRL, Cincinnati, OhioJulie Z. LeBlanc, U.S. Army Corps of Engineers, New Orleans, LouisianaDavid Parker, U.S. EPA, Region IV, Atlanta, GeorgiaChuck Schwarz, Texas Natural Resource Conservation Commission, Tyler, TexasJeff Robichaud, U.S. EPA, OGWDW, Washington, D.C.
Editing and Production:M. Lynn Kelly, Process Applications, Inc., Fort Collins, Colorado
. . .III

Contents
Chapter Page
Acknowledgments ........................................................................................................................III
List of Figures ............................................................................................................................ X
List of Tables ............................................................................................................................ xi
1 Introduction ............................................................................................................. 11.1 Purpose .................................................................................................................... 11.2 Background ..............................................................................................................
1.2.1 Wastewater Treatment Compliance ..................................................................11
1.2.2 Water Treatment Optimization ......................................................................... 21.2.3 Broad-Scale Application of CCP Concepts ......................................................... 2
1.3 Scope ......................................................................................................................1.3.1 Update of the CCP Approach and Implementation ..............................................
33
1.3.2 Support for Future Regulations ........................................................................ 31.3.3 Technical Resource for the Partnership for Safe Water........................................ 41.3.4 Considerations for Total System Optimization .................................................... 4
1.4 Using the Manual ...................................................................................................... 41.5 References ............................................................................................................... 4
2 Protection Of Public Health From Microbial Pathogens .................................................. 7
2.1 Background ..............................................................................................................2.2 Waterborne Disease History ........................................................................................
77
2.3 Relationship Between Optimized Performance and Public Health Protection ....................... 82.3.1 Multiple Barrier Strategy ................................................................................. a2.3.2 Basis for Optimization Goals ............................................................................ 9
2.4 Optimization Performance Goals ................................................................................. 102.4.1 Minimum Data Monitoring Requirements ......................................................... .lO2.4.2 Individual Sedimentation Basin Performance Goals ............................................ 102.4.3 Individual Filter Performance Goals ................................................................. .lO2.4.4 Disinfection Performance Goal ........................................................................ 11
112.5 Role of the Water Treatment Plant Staff in Public Health Protection .................................112.6 References ..............................................................................................................
3 13Assessing Composite Correction Program Application .................................................3.1 Introduction ............................................................................................................. 13
3.2 Optimization Program Experience ................................................................................ 13143.3 Area-Wide Optimization Model ...................................................................................143.3.1 Status Component ........................................................................................143.3.2 Evaluation Component ..................................................................................
Follow-Up Component .................................................................................. -143.3.33.3.4 Maintenance Component ............................................................................... 14
143.4 Implementation of an Area-Wide Model .......................................................................163.4.1 Establish Criteria to Prioritize Water Systems ....................................................
3.4.2 Assess Water System Performance Relative to Optimization Goals .................... ..16
3.5
173.4.3 Prioritize Water Systems Based on Selected Criteria ..........................................ia3.4.4 Assess Response to Prioritized Water Systems .................................................
References .............................................................................................................. 19
V

Con tents (continued)
Chapter Page
4 Comprehensive Performance Evaluation ....................................................................4.1 Introduction .............................................................................................................
2121
4.2 CPE Methodology ..................................................................................................... 214.2.1 Assessment of Plant Performance ................................................................... 21
4.2.2
4.2.1 .l Review and Trend Charting of Plant Operating Records ...................... ..2 14.2.1.2 Supplemental Data Collection ........................................................... 22Evaluation of Major Unit Processes ................................................................. 254.2.2.1 Overview ....................................................................................... 254.2.2.2 Approach .......................................................................................4.2.2.3 Determining Peak Instantaneous Operating Flow ..................................4.2.2.4 Rating Individual Unit Processes ........................................................
Flocculation ................................................................................
27282930
Sedimentation ............................................................................ 30Filtration .................................................................................... 31Disinfection ................................................................................ 32
Post-Disinfection .................................................................. .32Pre-Disinfection ..................................................................... 34
4.2.3 Identification and Prioritization of Performance Limiting Factors ......................... -354.2.3.1 Identification of Performance Limiting Factors ..................................... 35
Identification of Administrative Factors ......................................... .36Policies ................................................................................. 37Budgeting ............................................................................. 38Staffing ................................................................................ 38
Identification of Design Factors ..................................................... 38Identification of Operational Factors .............................................. 39
Plant Flow Rate and Number of Basins in Service.. .................... .39Chemical Dose Control ........................................................... 39Filter Control ......................................................................... 40Process Control Activities ....................................................... 41Other Controls ....................................................................... 42
Identification of Maintenance Factors ........................................... ..4 24.2.3.2 Prioritization of Performance Limiting Factors ...................................... 42
4.2.4 Assessment of the Applicability of a CTA ...................................................... ..4 44.2.5 CPE Report .................................................................................................. 44
4.3 Conducting a CPE ..................................................................................................... 444.3.1 Overview ..................................................................................................... 494.3.2 Initial Activities ............................................................................................ 49
4.3.2.1 Key Personnel ................................................................................. 504.3.2.2 CPE Resources ................................................................................ 50
4.3.34.3.2.3 Scheduling ..................................................................................... 50On-Site Activities ......................................................................................... 514.3.3.1 Kick-Off Meeting ............................................................................ .514.3.3.2 Plant Tour ...................................................................................... 51
Pretreatment .............................................................................. 52Mixing/Flocculation/Sedimentation ................................................. 52Chemical Feed Facilities ............................................................... 53Filtration .................................................................................... 53Disinfection ................................................................................ 54Backwash Water and Sludge Treatment and Disposal.. ................... ..5 4Laboratory ................................................................................. 54Maintenance ............................................................................... 54
vi

Con tents (continued)
Chaljter Page
4.3.3.3 Data Collection Activities ................................................................ -544.3.3.4 Evaluation of Major Unit Processes .................................................... 554.3.3.5 Performance Assessment ................................................................ .554.3.3.6 Field Evaluations ............................................................................. 554.3.3.7 Interviews ..................................................................................... .574.3.3.8 Evaluation of Performance Limiting Factors.. ...................................... .574.3.3.9 Exit Meeting ................................................................................... 58
4.3.4 CPE Report .................................................................................................. 604.4 Case Study .............................................................................................................. 60
4.4.1 Facility Information ....................................................................................... 604.4.2 Performance Assessment .............................................................................. .614.4.3 Major Unit Process Evaluation ....................................................................... .61
4.4.3.1 Flocculation Basin Evaluation ........................................................... .6l4.4.3.2 Sedimentation Basin Evaluation ......................................................... 624.4.3.3 Filter Evaluation .............................................................................. 624.4.3.4 Disinfection Process Evaluation ......................................................... 62
4.4.4 Performance Limiting Factors ......................................................................... 634.4.5 Assessing Applicability of a CTA .................................................................... 644.4.6 CPE Results ................................................................................................. 64
4.5 References .............................................................................................................. 64
5 Comprehensive Technical Assistance ........................................................................ 675.1 Objective.. ............................................................................................................... 675.2 Conducting CTAs ..................................................................................................... 68
5.2.1 Overview ..................................................................................................... 685.2.2 Implementation ............................................................................................ 69
5.2.2.1 Approach ....................................................................................... 70CTA Facilitator ............................................................................ 70On-Site CTA Champion ................................................................ 71CTA Framework .......................................................................... 71
5.2.2.2 Tools.. .......................................................................................... .73Contingency Plans ....................................................................... 73Action Plans ............................................................................... 73Special Studies ........................................................................... 73Operational Guidelines ................................................................. 74Data Collection and Interpretation ................................................ .74Priority Setting Tools ................................................................... 75Topic Development Sheets ........................................................... 75Internal Support .......................................................................... 76What If Scenarios ....................................................................... 77
5.2.2.3 Correcting Performance Limiting Factors ............................................ 77Design Performance Limiting Factors ........................................... ..7 7Maintenance Performance Limiting Factors .................................... .78Administrative Performance Limiting Factors ................................... 78
79Operational Performance Limiting Factors .......................................Process Sampling and Testing ............................................... ..8 0Chemical Pretreatment and Coagulant Control .......................... .80Unit Process Controls ............................................................. 82
vii

Con tents (con timed)
Page
5.3 Case Study ............................................................................................................... 855.3.1 CPE Findings ................................................................................................ 855.3.2 CTA Activities .............................................................................................. 86
5.3.2.1 Initial Site Visit ............................................................................... 865.3.2.2 Off-Site Activities ............................................................................ 875.3.2.3 Follow-Up Site Visit ......................................................................... 875.3.2.4 Other CTA Activities ........................................................................ 885.3.2.5 CTA Results ................................................................................... 88
5.4 References ..................................................................................................... ..~ ...... 91
Findings From Field Work ........................................................................................ 936.1 Introduction ............................................................................................................. 936.2 Results of Comprehensive Performance Evaluations ...................................................... .93
6.2.1 Major Unit Process Capability ......................................................................... 936.2.2 Factors Limiting Performance ......................................................................... 946.2.3 Summary of CPE Findings .............................................................................. 96
6.3 Results of Comprehensive Technical Assistance Projects ................................................ 976.4 References .............................................................................................................. 98
The Future: Changing Regulations and New Optimization Challenges ........................... 997.1 Introduction ............................................................................................................. 997.2 Background on M-DBP Regulations .............................................................................. 997.3 M-DBP Requirements Relative to Optimized Performance Goals ..................................... 100
7.3.1 Treatment Technique Turbidity Requirements ................................................. 1007.3.2 Removal/Inactivation Requirements ............................................................... 1017.3.3 DBP Maximum Contaminant Levels (MCLsI .................................................... 1027.3.4 Enhanced Coagulation Requirements ............................................................ .1037.3.5 Microbial Backstop ..................................................................................... 103
7.4 Summary ............................................................................................................... 1047.5 References ............................................................................................................ 105
Other CCP Considerations ..................................................................................... 1078.1 Introduction ........................................................................................................... 1078.2 Developing CCP Skills ............................................................................................. 107
8.2.1 CPE Training Approach ................................................................................ 1078.2.2 CTA Training Approach ............................................................................... 107
8.3 Quality Control ....................................................................................................... 1088.3.1 CPE Quality Control Guidance ...................................................................... 1088.3.2 CTA Quality Control Guidance ...................................................................... 109
8.4 Total System Optimization ....................................................................................... 110
8.5 References ............................................................................................................ 112
. .VIII

Con tents (continued)
Appendices
Appendix A
Appendix B
Appendix C
Appendix D
Appendix E
Appendix F
Appendix G
Appendix H
Appendix I
Appendix J
Appendix K
Appendix L
Appendix M
Appendix N
Page
Data Collection Spreadsheets and Macros for the Partnership for Safe Water . . . . ,. .I 15
Drinking Water Treatment Plant (DWTP) Advisor Software . . . ..I.......................... 123
Major Unit Process Capability Evaluation Performance Potential GraphSpreadsheet Tool for the Partnership for Safe Water . . . . ..I.................................. 125
CT Values for Inactivation of Giardia and Viruses by Free Cl, and OtherDisinfectants .,,...........,.............. . . . . . . . . . . . . . . . . ..*....*. . . . . . ..*................................. 135
Performance Limiting Factors Summary Materials and Definitions . . . . . . . . . . . . . . . . . . . . . . . 145
Data Collection Forms .................................................................................. 159
Example CPE Report ..................................................................................... 205
Example CPE Scheduling Letter.. .................................................................... 221
Example Special Study ................................................................................. 225
Example Operational Guideline ....................................................................... 227
Example Process Control Daily Report.. ........................................................... 231
Example Jar Test Guideline ........................................................................... 233
Chemical Feed Guidelines .............................................................................. 237
Conversion Chart . . . . . . ..*.....................*................. . . ..*.................................... 245
ix
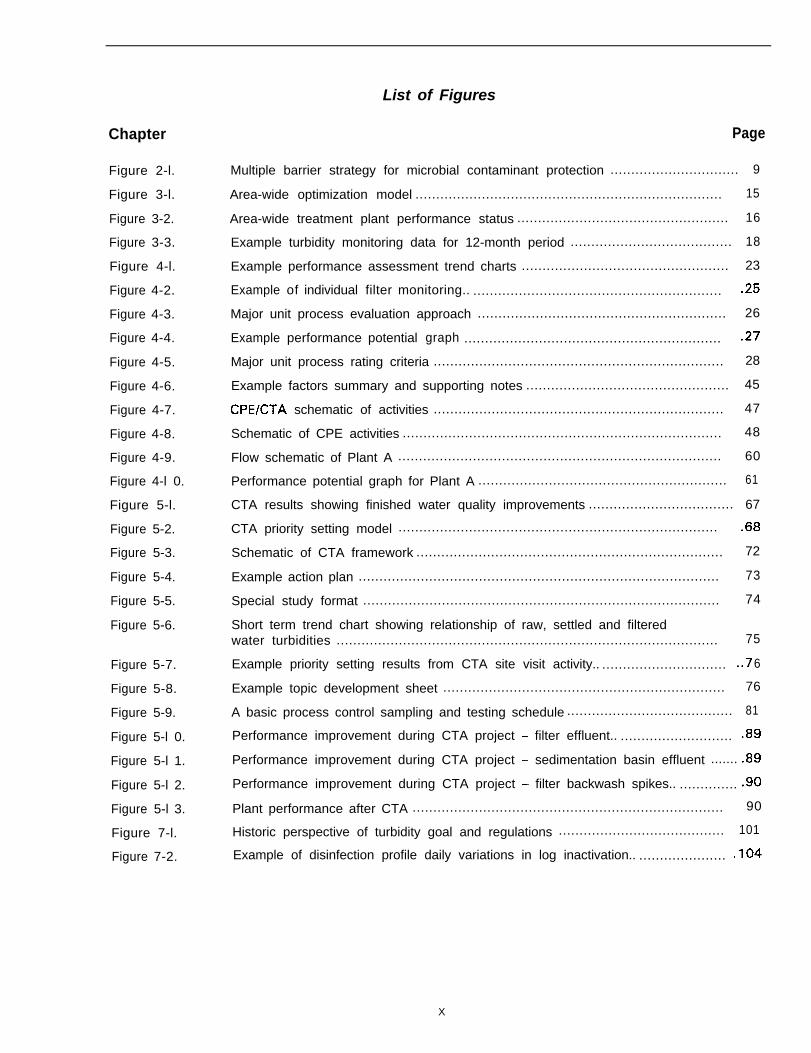
List of Figures
Chapter
Figure 2-l.
Figure 3-l.
Figure 3-2.
Figure 3-3.
Figure 4-l.
Figure 4-2.
Figure 4-3.
Figure 4-4.
Figure 4-5.
Figure 4-6.
Figure 4-7.
Figure 4-8.
Figure 4-9.
Figure 4-l 0.
Figure 5-l.
Figure 5-2.
Figure 5-3.
Figure 5-4.
Figure 5-5.
Figure 5-6.
Figure 5-7.
Figure 5-8.
Figure 5-9.
Figure 5-l 0.
Figure 5-l 1.
Figure 5-l 2.
Figure 5-l 3.
Figure 7-l.
Figure 7-2.
Page
Multiple barrier strategy for microbial contaminant protection ............................... 9
Area-wide optimization model .......................................................................... 15
Area-wide treatment plant performance status ................................................... 16
Example turbidity monitoring data for 12-month period ....................................... 18
Example performance assessment trend charts .................................................. 23
Example of individual filter monitoring.. ............................................................ .25
Major unit process evaluation approach ............................................................ 26
Example performance potential graph .............................................................. .27
Major unit process rating criteria ...................................................................... 28
Example factors summary and supporting notes ................................................. 45
CPEKTA schematic of activities ...................................................................... 47
Schematic of CPE activities ............................................................................. 48
Flow schematic of Plant A .............................................................................. 60
Performance potential graph for Plant A ............................................................ 61
CTA results showing finished water quality improvements ................................... 67
CTA priority setting model ............................................................................. .68
Schematic of CTA framework .......................................................................... 72
Example action plan ....................................................................................... 73
Special study format ...................................................................................... 74
Short term trend chart showing relationship of raw, settled and filteredwater turbidities ............................................................................................ 75
Example priority setting results from CTA site visit activity.. .............................. ..7 6
Example topic development sheet .................................................................... 76
A basic process control sampling and testing schedule ........................................ 81
Performance improvement during CTA project - filter effluent.. ........................... .89
Performance improvement during CTA project - sedimentation basin effluent ....... .89
Performance improvement during CTA project - filter backwash spikes.. .............. .90
Plant performance after CTA ........................................................................... 90
Historic perspective of turbidity goal and regulations ........................................ 101
Example of disinfection profile daily variations in log inactivation.. ..................... .I04
X

List of TabJes
Number Page
Table l-l. Information Pertinent to Specific User Groups ..................................................... 5
Table 2-l. U.S. Outbreaks of Cryptosporidiosis in Surface Water Supplies.. ............................ 8
Table 3-l. Example Prioritization Criteria for Surface Water Systems .................................... 17
Table 3-2. Example Prioritization Database ........................................................................ 18
Table 4-l. Percentile Distribution Analysis of Water Quality Data.. ..................................... ..2 4
Table 4-2. Major Unit Process Evaluation Criteria ............................................................... 29
Table 4-3. Expected Removals of Giardia Cysts and Viruses by Filtration .............................. 33
Table 4-4. Factors for Determining Effective Disinfection Contact Time Based onBasin Characteristics ...................................................................................... 34
Table 4-5. Classification System for Prioritizing Performance Limiting Factors.. .................... ..4 3
Table 4-6. Evaluation Team Capabilities ............................................................................ 49
Table 6-1. Geographical Distribution of CPEs and CTAs ...................................................... 93
Table 6-2. Summary of the Major Unit Process Ratings for 69 Plants ................................. ..9 4
Table 6-3. Most Frequently Occurring Factors Limiting Performance at 69 CPEs ..................... 95
Table 8-l. Training Approach to Achieve Transfer of CPE Skills ......................................... 108
Table 8-2. Quality Control Checklist for Completed CPEs .................................................. 109
Table 8-3. Quality Control Checklist for Completed CTAs ................................................. 110
Table 8-4. Total System Optimization Considerations for Drinking Water Utilities .................. 1 1 1
xi

Chapter 1lntroduc tion
1 .I Purpose
Maintaining public health protection at water sup-ply systems has become more challenging inrecent years with the resistance of some patho-gens to disinfection using chlorination and anincrease in the immuno-compromised population(e.g., people with HIV, organ transplant patients,the elderly). Also, as evidenced by recent out-breaks, compliance with the 1989 Surface WaterTreatment Rule (SWTR) does not always assuremaximum protection of the public from waterbornedisease (1). Based on this awareness, the U.S.Environmental Protect ion Agency (USEPA) isdeveloping regulations to control contaminationfrom microbial pathogens in drinking water whileconcurrently addressing other concerns such asdisinfection by-products (2,3). These new andinterrelated regulations are moving the water sup-ply industry toward meeting increasingly morestringent water treatment requirements.
Research and field work results support optimizingparticle removal from water treatment facilities tomaximize public health protection from microbialcontamination (4,5,6). Since 1988 the CompositeCorrection Program (CCP) has been developed anddemonstrated as a method of optimizing surfacewater treatment plant performance with respect toprotection from microbial pathogens in the UnitedStates and Canada (7,8). The approach is basedon establishing effective use of the available watertreatment process barriers against passage of par-ticles to the finished water.
Specific performance goals are used by the CCPapproach to define optimum performance for keytreatment process barriers such as sedimentation,filtration, and disinfection. These include a maxi-mum individual sedimentation basin effluent tur-bidity goal of less than 2 nephelometric turbidityunits (NTUs) to assure that the integrity of thisbarrier is consistently maintained and to provide alow particle loading to the filters. For the filtrationbarrier, optimum performance has been describedas individual filter effluent turbidities of less than0.1 NTU with a maximum post backwash “spike”to 0.3 NTU and returning to less than 0.1 NTU inless than 15 minutes. The disinfection goal hasbeen based on achieving the log inactivation
requirement for Giardia and/or viruses described inthe SWTR guidance (9).
This handbook is an updated version of the USEPAHandbook: Optimizing Water Treatment Plant Per-formance Using the Composite Correction Programpublished in 1991 (71. It is intended to serve as aresource document for optimizing the performanceof existing surface water treatment facilities toprovide protection from microbial contamination.
1.2 Background
1.2.1 Wastewater Treatment Compliance
The CCP approach was initially developed toaddress compliance problems at wastewatertreatment facilities that were constructed in thelate 1960’s and 1970’s. A survey involving overone hundred facilities was conducted to identifythe reasons for this non-compliance (IO,1 1 ,i 21.The survey revealed that operations and mainte-nance factors were frequently identified as limitingplant performance, but also disclosed that adminis-trative and design factors were contributing limita-tions. Most importantly, each plant evaluated hada unique list of factors limiting performance.
Based on these findings, an approach was devel-oped to identify and address performance limita-t ions at an individual faci l i ty and to obtainimproved performance. Significant success wasachieved in improving performance at manywastewater treatment facilities without major capi-tal improvements (131. Ultimately, a handbookwas developed that formalized the evaluation andcorrection procedures (14). The formalizedapproach was defined as the Composite CorrectionProgram (CCP), and it consists of two compo-nents-a Comprehensive Performance Evaluation(CPE) and Comprehensive Technical Assistance(CTA). As a point of clarification, the technicalassistance phase was initially referred to as aComposite Correction Program; however, thename of this phase was changed to Comprehen-sive Technical Assistance to better differentiatethe two phases. A CPE is a thorough review andanalysis of a plant’s performance-based capabili-ties and associated administrative, operation, and
1

maintenance practices. It is conducted to identifyfactors that may be adversely impacting a plant’sability to achieve permit compliance without majorcapital improvements. A CTA is the performanceimprovement phase that is implemented if the CPEresults indicate improved performance potential.During the CTA phase, identified plant-specific fac-tors are systematically addressed and eliminated.
The wastewater CCP handbook was updated in1989 to include specific low cost modificationsthat could be used to optimize an existing facility’sperformance (15). An “expert system” (POTWExpert) was also developed to supplement thehandbook (I 6).
7.2.2 Water Treatment Optimization
Based on the state of Montana’s successful use ofthe CCP approach for improving compliance oftheir mechanical wastewater treatment facilities,state personnel evaluated the feasibility of usingthe CCP to optimize the performance of small sur-face water treatment facilities. With financialassistance from USEPA Region 8, nine CPEs andthree CTAs were completed from April 1988 untilSeptember 1990. Through these efforts, each ofthe existing facilities where CTAs were imple-mented showed dramatic improvements in thequality of finished water turbidity. Additionally,improved performance was achieved at threeplants where only the evaluation phase (CPE) ofthe program was completed (17). The encourag-ing results from Montana’s adoption of the CCPapproach to surface water treatment plants led tothe USEPA’s Office of Ground Water and DrinkingWater involvement with the program in 1989.
USEPA decided to further develop and demon-strate use of the CCP approach as it applied tocompliance with drinking water regulations toensure its applicability nation-wide. In pursuit ofthis goal, a cooperative project was initiatedbetween USEPA’s Office of Ground Water andDrinking Water, Technical Support Center (TSC)and Office of Research and Development, Tech-nology Transfer and Support Division, NationalRisk Management Research Laboratory (NRMRL).This project provided resources to: conduct anadditional twelve CPEs in the states of Ohio,Kentucky, West Virginia, Maryland, Montana,Vermont, and Pennsylvania; prepare a summaryreport (8); and develop a water CCP Handbook(7).
Following these initial efforts, work continued,through a cooperative agreement between TSCand the University of Cincinnati, on further refine-ment and development of the CCP approach. For-mal efforts were implemented to incorporate theCCP into state programs. It was anticipated thatapplication of the CCP by state regulatory person-nel would achieve desired performance levels witha minimum financial impact on the utilities in theirjurisdiction. Pilot programs were implemented ineight states (West Virginia, Massachusetts,Maryland, Rhode Island, Kentucky, Pennsylvania,Texas, and Colorado) which focused on develop-ing CPE capability for state staff. A progressivetraining process was developed within each state.The training process included the completion of aseminar followed by three CPEs conducted by astate core team that was facilitated by USEPA andProcess Applications, Inc. Similar pilot programswere also completed in USEPA Regions 6 and 9.Typically, state regulatory staff selected the CPEcandidate plants based on their perception of theplant’s inability to meet .the SWTR turbidityrequirements.
The progressive training approach proved to besuccessful; however, other issues and challengesrelated to implementation within the existing stateregulatory program structure became apparent.As the state pilot programs progressed, thesechallenges to implementation became known col-lectively as institutional barriers. The impact ofinstitutional barriers on state-wide optimizationefforts is discussed further in Chapter 3.
7.2.3 Broad-Scale Appiication of CCPConcepts
The optimization concepts included within the CCPapproach have been expanded to a variety ofwater industry and regulatory activities. A partiallist of current optimization efforts that utilize com-ponents of the CCP is described below.
l The states of Alabama, Georgia, Kentucky,and South Carolina, in cooperation with EPARegion 4, are currently pursuing a multi-stateeffort that focuses on optimization of their sur-face water treatment facilities through a pilotprogram based on the application of the CCPconcepts and tools.
l The Partnership for Safe Water is a voluntaryprogram for enhancing water treatment to
2

An expanded discussion of the relationshipbetween optimized performance and publichealth protection.
An expanded definition of optimized perform-ance goals for microbial contaminant protec-tion.
Considerations for selection of CPE and CTAcandidates.
Clarification on CCP terminology.
Description and use of the Partnership for SafeWater software for compiling and analyzingturbidity data.
Updated process criteria for completing themajor unit process evaluation.
An updated database of completed CPEs andCTAs and a summary of typical factors foundlimiting performance.
Streamlined forms for collection of field data.
1.3.2 Support for Future Regulations
The initial CCP handbook focused on meeting therequirements of the Surface Water Treatment Rule(SWTR) (20). As the challenges of protecting thepublic health from microbial contamination becamemore paramount, the emphasis was shifted fromthe SWTR requirements to achieving optimizedperformance goals.
Pursuant to the requirements under the 1996Amendments to the Safe Drinking Water Act(SDWA), the USEPA is developing interrelatedregulations to control microbial pathogens anddisinfectants/disinfection byproducts in drinkingwater, c o l l e c t i v e l y k n o w n a s t h e m i c r o -bial/disinfection byproducts (M/DBP) rules. The1996 Amendment to the SDWA set a deadline forpromulgation of the Interim Enhanced SurfaceWater Treatment Rule (IESWTR) of November1998. USEPA’s Notice of Data Availability (3)indicates that this rule will include a revised fin-ished water turbidity requirement of 0.3 NTU, newindividual filter monitoring requirements, andrequirements for states to have authority to
provide higher quality drinking water. Organiza-tions involved in the Partnership include the U.S.Environmental Protection Agency, American WaterWorks Association, Association of MetropolitanWater Agencies, National Association of WaterCompanies, Association of State Drinking WaterAdministrators, and the American Water WorksAssociation Research Foundation. The Partnershiputilized the CCP as the basis of its Phase III com-prehensive water treatment self-assessment (18).Use of the CCP is also being considered for thePhase IV third party assessment of participatingutilities. As of, May 1998, 217 water utilitiesserving nearly 90 million people are participating inthe Partnership for Safe Water.
l In 1996 the Am.erican Water Works Associa-tion Research Foundation conducted an opti-mization workshop with national water qualityand treatment experts from throughout theindustry. As a result of this workshop, a self-assessment handbook was publ ished byAWWARF (19). This handbook, which followsthe CCP approach, is intended to be a resourcefor water utilities that choose to conduct aself-assessment to improve performance.
1.3 Scope
Since publication of the predecessor of this hand-book in 1991, several modifications have beenmade to the CCP and its use for optimizing surfacewater treatment plants. In addition, other com-plementary drinking water optimization activities(e.g., Partnership for Safe Water) have developedand continue to have positive impacts in this area.The purpose of this handbook update is to incor-porate new information and to integrate the othercomplementary programs.
1.3.1 Update of the CCP Approach andImplementation
Experience gained from over 70 CPEs and 9 CTAsprovides the basis for updating the CCP approachpresented in this handbook. In addition, eightstate pilot programs have provided the basis forthe area-wide application of the CCP. Significantadditions and modifications to the CCP included inthis handbook are:
3

require the conduct of CCPs for water utilities thatexperience difficulties in meeting the turbidityrequirements of the rule. This handbook isintended to provide a technical resource to supportthe implementation of the IESWTR.
1.3.3 Technical Resource for the Partnershipfor Safe Water
This updated handbook is also intended to comple-ment and enhance the existing Partnership forSafe Water documentation and program activities.In addition to supporting the ongoing Phase IIIself-assessment activities, the handbook will alsosupport the anticipated Phase IV activities. Apossible Phase IV approach could involve an inde-pendent third party review of a utility using theCCP format. This final step in the Partnershipprocess ensures that some of the potential limita-tions of self-assessment (e.g., difficulty in identi-fying operational and administrative factors) arenot overlooked.
1.3.4 Considerations for Total SystemOptimization
Although this handbook is intended to be a techni-cal resource for surface water treatment facilitiesto pursue optimized performance for protectionagainst microbial contamination, it is recognizedthat as the regulations change and optimum per-formance is pursued, the focus of optimizationactivities will expand to other parameters. Antici-pated future areas for optimization include sourcewater protection, disinfection by-products, corro-sion control, groundwater disinfection, and distri-bution system water quality. This expanded scopeis called total system optimization. Minor addi-tions are included in this handbook to addresssome of these areas; however, future handbookmodifications or additional handbooks are envi-sioned to more thoroughly address total systemoptimization concepts and topics.
1.4 Using the Manual
The primary intended users of this handbookinclude regulators (e.g., federal and state agencypersonnel) and non-regulators (e.g., utility person-nel and consultants). To facilitate the use of thishandbook, information has been separated into thefollowing chapters:
n Chapter 1 - Introduction
= Chapter 2 - Protection of Public Healthfrom Microbial Pathogens
n Chapter 3 - Assessing Composite Correc-tion Program Application
m Chapter 4 - Comprehensive PerformanceEvaluations
. Chapter 5 - Comprehensive TechnicalA s s i s t a n c e
l Chapter 6 - Findings From Field Work
. Chapter 7 - Current and Future RegulationImpacts on Optimization
n Chapter 8 - Other CCP Considerations
Table l-l provides guidance on where specificuser groups can locate within this handbookinformation that is considered pertinent to theirunique interest or intended use.
1.5 References
When an NTIS number is cited in a reference, thatreference is available from:
National Technical Information Service5285 Port Royal RoadSpringfield, VA 22161(703) 487-4650
1. Kramer, M.H., et al. 1996. “WaterborneDisease: 1993 and 1994.” Journal AWWA,
2.
3.
88(3):66.
USEPA. 1997. National Primary DrinkingWater Regulations: Disinfectants and Disinfec-tion Byproducts; Notice of Data Availability;Proposed Rule. Fed. Reg., 62:212:59338(November 3, 1997).
USEPA. 1997. National Primary DrinkingWater Regulations: Interim Enhanced SurfaceW a t e r T r e a t m e n t R u l e N o t i c e o f D a t aAvailability; Proposed Rule. Fed. Reg.,62:212:59486 (November 3, 1997).
4

User Purpose ChapterSource
USEPA/StateRegulatoryPersonnel
l Assess application of the CCP as part of an area-wideoptimization strategy
= Chapter 3
l Identify priority plants for CCP application * Chapter 3
l Review/learn the CPE protocol = Chapter 4
l Review/learn the CTA protocol 3 Chapter 5
l Review CCP database for common factors limitingperformance
= Chapter 6
l Review quality control criteria for assessment of thirdparty CCPs
= Chapter 8
UtilityPersonnel
l
l
Utilize the CCP as a self-assessment resource
Assess capabilities of CCP providers
3 Chapters4&5
= Chapter 8
Consultants/Peer Assessment
l Review/learn the CPE protocol =j Chapter 4
Team Members l Review/learn the CTA protocol 2 Chapter 5
l Review CCP database for common factors limitingperformance
= Chapter 6
4. Patania, N.L., et al. 1996. Ootimization of Fil-tration for Cvst Removal. AWWARF, Denver,c o .
5. Nieminski, E.C., et al. 1995. “RemovingGiardia and Cryptosporidium by ConventionalTreatment and Direct Filtration.” JournalAWWA, 87(91:96.
6. Consonery, P.J., et al. 1996. “Evaluating andOptimizing Surface Water Treatment Plants:How Good is Good Enough?” Paper presentedatAWWA Water Quality Technology Conference,Boston, MA.
7. Renner, R.C., B.A. Hegg, J.H. Bender, andE.M. Bissonette. 1991. Optimizina WaterTreatment Plant Performance Usina the Com-posite Correction Proaram. EPA/625/6-91/027, USEPA Center for EnvironmentalResearch Information, Cincinnati, OH.
8. Renner, R.C., B.A. Hegg, and J.H. Bender.1990. Summarv ReDort: Optimizina WaterTreatment Plant Performance With the Com-posite Correction Proaram. EPA 625/8-90/01 7, USEPA Center for EnvironmentalResearch Information, Cincinnati, OH.
9. Guidance Manual for Compliance With the Fil-tration and Disinfection Reauirements for Pub-l ic Water Svstems Usina Surface WaterSources. 1989. NTIS No. PB-90148016,USEPA, Cincinnati, OH.
10. Hegg, B.A., K.L. Rakness, and J.R. Schultz.1979. Evaluation of Operation and Mainte-nance Factors Limitina Municioal WastewaterTreatment Plant Performance. EPA 600/2-79-034, NTIS No. PB-300331, USEPA, MunicipalEnvironmental Research Laboratory, Cincinnati,OH.
Table l-1. Information Pertinent to Specific User Groups

11. Gray, A.C., Jr., P.E. Paul, and H.D. Roberts.1979. Evaluation of Operation and Mainte-nance Factors Limitina Bioloaical WastewaterTreatment Plant Performance. EPA 600/2-79-087, NTIS No. PB-297491, USEPA, MunicipalEnvironmental Research Laboratory, Cincinnati,OH.
12. Hegg, B.A., K.L. Rakness, J.R. Schultz, andL.D. DeMers. 1980. Evaluation of Operationand Maintenance Factors Limitina MuniciDalWastewater Treatment Plant Performance -Phase II. EPA 600/2-80-l 29, NTIS No. PB-81-1 12864, USEPA, Municipal EnvironmentalResearch Laboratory, Cincinnati, OH.
13. Hegg, B.A., K.L. Rakness, and J.R. Schultz.1979. A Demonstrated ADDrOaCh for Imerov-ina Performance and Reliabilitv of BioloaicalWastewater Treatment Plants. EPA 600/2-79-035, NTIS No. PB-300476, USEPA, Cincinnati,OH.
14. Hegg, B.A., J.R. Schultz, and K.L. Rakness.1984. EPA Handbook: lmorovina POTW Per-formance Usina the Composite Correction Pro-gram ADDroach. EPA 625/6-84-008, NTIS No.PB-88184007, USEPA Center for Environ-mental Research Information, Cincinnati, OH.
15. Hegg. B.A., L.D. DeMers, and J.B. Barber.1989. EPA Technoloav Transfer Handbook:Retrofittina POTWs. EPA 625/6-89-020, NTISNo. PB-90182478, USEPA Center for Envi-
ronmental Research Information, Cincinnati,OH.
16. Publicly Owned Treatment Works Expert UsersGuide and Software. 1990. Eastern ResearchGroup, Inc. and Process Applications, Inc. forUSEPA Center for Environmental ResearchInformation, Cincinnati, OH.
17. Renner, R.C., B.A. Hegg, and D.L. Fraser.1989. “Demonstration of the ComprehensivePerformance Evaluation Technique to AssessMontana Surface Water Treatment Plants.”Presented at the 4th Annual ASDWA Confer-ence, Tucson, AZ.
18.Bender, J.H., R.C. Renner, B.A. Hegg, E.M.Bissonette, and R. Lieberman. 1995. “Part-nership for Safe Water Voluntary WaterTreatment Plant Performance ImprovementProgram Self-Assessment Procedures.”USEPA, AWWA, AWWARF, Association ofMetropolitan Water Agencies, Association ofState Drinking Water Administrators, andNational Association of Water Companies.
19. Renner, R.C., and B.A. Hegg. 1997. Self-Assessment Guide for Surface Water Treat-ment Plant Optimization. AWWARF, Denver,c o .
20. USEPA. 1989. Surface Water TreatmentRule. Fed. Reg., 54:124:27486 (June 29,19891.

Chapter 2Protection of Public Health From Microbial Pathogens
2.1 Background
One of the major objectives of water supply systems is to provide consumers with drinking watethat is sufficiently free of microbial pathogens tprevent waterborne disease. Water supply systems can achieve this level of public health protection by providing treatment to assure that pathogens found in the raw water supply are removeor inactivated. The relationship between optimizewater treatment plant performance and protectioof public health from microbial pathogens is presented in this chapter.
2.2 Waterborne Disease History
Several well documented disease outbreaks thawere associated with the use of untreated surfacwater, contaminated well water, treatment plandeficiencies, and contaminated distribution systems have occurred over the past 20 years. During this period the most common suspectecauses of waterborne disease outbreaks were thprotozoan parasites Giardia lamblia and Cryptospo-ridium parvum ( 1). These parasites exist in theenvironment in an encysted form where the infectious material is encapsulated such that they arresistant to inactivation by commonly used disinfectants. These parasites are transmitted to theihosts by ingest ion of cysts that have beeexcreted in the feces of infected humans or animals. Infection can occur through ingestion ofecally contaminated water or food or contact witfecally contaminated surfaces. Recent studiehave indicated that these parasites are routineldetected in surface water supplies throughouNorth America (2,3,4). They can enter surfacewater supplies through natural runoff, wastewatertreatment discharges, and combined sewer over-flows,
A recent review of waterborne disease in the U.S.during the period 1993 through 1994 identified 30disease outbreaks associated with drinking water.The outbreaks caused over 400,000 people tobecome ill-the majority from a 1993 outbreak inMilwaukee. Twenty-two of the outbreaks wereknown or suspected to be associated with infec-tious agents and eight with chemical contaminants. Giardia or Cryptosporidium was identified
-ro---
ddn-
tet--de
-e-r
n-fhsyt
-
as the causative agent for 10 of the outbreaks,and six of these systems were associated with asurface water source. All six systems providedchlorination, and four also provided filtration. Inthe filtered systems, deficiencies in the distributionsystem were identified for one outbreak, inade-quate filtration for one, and no apparent deficien-cies were identified in two cases (1).
Cryptosporidium presents a unique challenge tothe drinking water industry because of ‘its resis-tance to chlorination and its small size, making itdifficult to remove by filtration. Cryptosporidiosisis the diarrhea1 illness in humans caused by Cryp-tosporidium parvum. Cryptosporidiosis outbreaksfrom surface water supplies have been docu-mented in the United States, Canada and GreatBritain (5,6,7). A summary of U.S. outbreaksassociated with surface water supplies is shown inTable 2-l. Five of the outbreaks were associatedwith filtered drinking waters. Three systems(Carroll, Jackson - Talent, and Milwaukee) wereexperiencing operational deficiencies and high fin-ished water turbidities at the time of the out-breaks. All three plants utilized conventionaltreatment processes that included rapid mix, floc-culation, sedimentation, and filtration. The ClarkCounty outbreak was the only outbreak associatedwith a filtered drinking water for which no appar-ent treatment deficiencies were noted. All fivesystems were in compliance with the federaldrinking water regulations in effect at that time.
Recent research has shown that free chlorine andmonochloramine provide minimal disinfection ofCryptosporidium oocysts at the dosage and deten-tion time conditions found at most treatment facili-ties (8). Disinfection requirements based on CT inthe 1989 SWTR guidance were developed solelyon inactivation of Giardia lamblia cysts. Researchconducted by Finch (9) showed approximately0.2 log or less inactivation of Cryptosporidiumwhen free chlorine was used alone (5 to 15 mg/L@ 60 to 240 min.). Monochloramine was slightlymore effective than free chlorine. Inactivation ofCryptosporidium through the use of strongerdisinfectants (e.g., ozone, chlorine dioxide) andcombined disinfectants is currently beinginvestigated by the water industry and researchinstitutions.
7

Location Year Type of System EstimatedNumber of
Cases
Bernalillo County, New Mexico 1986 Untreated surface water supply 78
Carroll County, Georgia 1987 Treated surface water supply 13,000
Jackson County, Oregon 1992 Medford - chlorinated spring 15,000Talent - treated surface water
Milwaukee County, Wisconsin 1993 Treated surface water supply 403,000
Cook County, Minnesota 1993 Treated surface water supply 27
Clark County, Nevada 1994 Treated surface water supply 78
Table 2-1. U.S. Outbreaks of Cryptosporidiosis in Surface Water Supplies (5)
The recent incidence of waterborne disease associ-ated with protozoan parasites and the resistanceof some pathogens to conventional disinfectionpresents a challenge to the water industry. Use ofa single barrier, such as disinfection alone, oroperation of a conventional treatment plant thathad not been optimized has contributed to severaldisease outbreaks. For surface supplied filtrationplants, minimizing consumer’s risk from microbialpathogens will require a proactive approach towater treatment, including plant optimization.
2.3 Relationship Between OptimizedPerformance and Public Health Protection
2.3. 7 Multiple Barrier Strategy
Microbial pathogens, including protozoan para-sites, bacteria, and viruses, can be physicallyremoved as particles in flocculation, sedimenta-tion, and filtration treatment processes or inacti-vated in disinfection processes. Consequently, thelevel of protection achieved in a water system canbe increased by optimizing the particle removalprocesses in a system and by proper operation ofthe disinfection processes. In a conventionalplant, the coagulation step is used to develop par-ticles that can be physically removed by sedimen-tation and filtration processes. Effective use ofthese processes as part of a multiple barrier strat-egy for microbial protection represents an opera-
tional approach for water systems that choose tooptimize performance. This strategy is also beingproposed as a method for addressing Cryptospo-ridium in the Interim Enhanced Surface WaterTreatment Rule (10).
Particle removal through a water treatment proc-ess can be monitored and assessed by variousmethods including turbidity, particle counting, andmic roscop ic par t i cu la te ana lys is (MPA). Anincreasing number of water systems treating a sur-face water supply have turbidimeters installed tomonitor turbidity at various locations throughoutthe process. Some systems are supplementingturbidity monitoring with particle counting andmicroscopic particulate analysis, However,because turbidity monitoring is the most commonmethod of assessing particle removal in surfacewater systems, performance goals based on thisparameter have been developed for the CCP todefine optimized system performance.
The role of multiple treatment barriers in optimiz-ing water treatment for protection from microbialpathogens and the associated performance goalsare shown in Figure 2-1. Despite variability insource water quality, surface water treatmentplants must produce consistently high quality fin-ished water. To meet this objective, each treat-ment process must consistently produce treatedwater of a specif ic qual i ty. To this end,
8

Figure 2-1. Multiple barrier strategy for microbial contaminant protection.
VariablaQualitysourcsWater
Flocculation/SedimentationBarrier Filtration
Barrier
DisinfectionBarrier
FinishedWater
performance goals have been established for eachof the treatment barriers in a plant.
When plants include a sedimentation process, themaximum sedimentation basin effluent turbiditygoal of less than 2 NTU is used to define optimumprocess performance. A sedimentation perform-ance goal ensures the integrity of this barrier andprovides a consistent particle loading to the filtra-tion process. With respect to optimum particleremoval for the filtration process, the optimumperformance goal is defined as achieving individualfilter effluent turbidities of less than 0.1 NTU.
The performance of the disinfection barrier isbased on the log inactivation requirement for Giar-dia and virus, as established by the Surface WaterTreatment Rule guidance manual (11). Thisdocument provides tables of the required CT (i.e.,disinfectant concentration (Cl times the time (T)that the disinfectant must be in contact with thewater) to achieve different levels of inactivationbased on the temperature and pH of the water.The amount of log inactivation, and hence the CTvalue that the plant must achieve, is based onSWTR guidance.
Inactivation requirements for Ctyptosporidiumbased on CT have not been established but wouldbe significantly higher than those for Giardia andvirus. Since inactivation of Cryptosporidium isdifficult to achieve with chlorine disinfection,maximizing particle removal could represent themost cost effective and viable option for maximiz-ing public health protection from this microorgan-ism.
2.3.2 Basis for Optimization Goals
Strong evidence exists in support of maximizingpublic health protection by optimizing particleremoval in a plant. Recent supportive evidencefrom water treatment research and field evalua-tions is summarized below:
l Pilot study work conducted by Patania (12)showed that when treatment conditions wereoptimized for turbidity and particle removal,very effective removal of both Cryptosporidiumand Giardia was observed. Cryp tosporidiumremoval ranged from 2.7 to 5.9 logs, andGiardia removal ranged from 3.4 to 5.1 logsduring stable filter operation. Under the condi-tions tested, meeting a filter effluent turbiditygoal of 0.1 NTU was indicative of treatmentperformance producing the most effective cystand oocyst removal. A small difference in fil-ter effluent turbidity (from 0.1 or less tobetween 0.1 and 0.3 NTU) produced a largedifference (up to 1.0 log) in cyst and oocystremoval.
l Pilot study and full-scale plant work performedby Nieminski (13) demonstrated that consis-tent removal rates of Giardia and Cryptospo-ridium were achieved when the treatment plantwas producing water of consistently low tur-bidity (0.1 - 0.2 NTUI. As soon as the plant’sperformance changed and water turbidity fluc-tuated, a high variability in cyst concentrationwas observed in collected effluent samples.The pilot study work, confirmed by full-scaleplant studies, showed that in a properly
9

operated treatment plant producing finishedwater of 0.1 to 0.2 NTU, either conventionaltreatment or direct filtration can achieve 3-logremoval of Giardia cysts.
l An ex tens ive amount o f water f i l t ra t ionresearch was conducted at Colorado StateUniversity on low turbidity water (14,151.Using field-scale pilot filters, researchers dem-onstrated greater than 2-log Giardia removalwhen proper chemical coagulation was prac-ticed on low turbidity raw water (i.e., 0.5 to1.5 NTU), resulting in filter effluent turbidityvalues of less than 0.1 NTU.
. Filter plant performance evaluations conductedby Consonery (16) at 284 Pennsylvania filtra-tion plants over the past eight years haveincluded a combination of turbidity, particlecounting, and microscopic particulate analysisto assess the performance of plant processes.The person completing the evaluation uses thisinformation to rate the plant as to whether itprovides an acceptable level of treatment formicrobial pathogens. Evaluation results haveshown that when filter effluent turbidity wasless than or equal to 0.2 NTU, 60 percent ofthe plants were given an acceptable rating.When filter effluent turbidity was greater thanor equal to 0.3 NTU, only 11 percent of theplants were given an acceptable rat ing.Although this work did not assess plant per-formance at the 0.1 NTU level, the increasedacceptable rating that occurred when effluentturbidi ty was less than 0.2 NTU versus0.3 NTU indicates the benefit of loweringfinished water turbidity.
An extensive amount of research and field workresults support a filtered water turbidity goal of0.1 NTU. These findings are also compatible witha long standing AWWA Policy Statement support-ing treatment to this level (17). It is important tounderstand that achieving this level of filter per-formance (i.e., 0.1 NTU) does not guarantee thatmicrobial pathogens will not pass through filters;however, it represents the current best practice forwater treatment plants to achieve the greatestlevel of public health protection.
Particle counting can be used to support andenhance turbidity measurements, and can beespecially useful when source water turbidity islow (< 5 NTU). At low source water turbiditylevels, it is difficult to assess the level of particlereduction being achieved in the filtration process
with turbidity measurements alone. This is due tothe insensitivity of turbidimeters at extremely lowturbidity measurements ( i .e. , below about0.05 NTU) (18,19,20).
2.4 Optimization Performance Goals
For purposes of this handbook, optimized watertreatment performance for protection againstmicrobial pathogens is defined by specific meas-urements and goals. This section presents theperformance goals for surface water treatmentsystems. These goals are based on CCP fieldwork performed by the authors and experiencegained from the Partnership for Safe Water andstate optimization pilot programs. It is importantto note that these goals are the foundation for allassessments in this handbook and that obtainingthis performance level exceeds present regulatoryrequirements.
2.4.1 Minimum Data MonitoringRequirements
Daily raw water turbidity
Settled water turbidity at 4-hour time incre-ments from each sedimentation basin
On-line (continuous) turbidity from each filter
One filter backwash profile each month fromeach filter
2.4.2 Individual Sedimentation BasinPerformance Goals
l Sett led water turbidi ty less than 1 NTU95 percent of the time when annual averageraw water turbidity is less than or equal to10 NTU.
l Sett led water turbidi ty less than 2 NTU95 percent of the time when annual averageraw water turbidity is greater than 10 NTU.
2.4.3 Individual Filter Performance Goals
. Filtered water turbidity less than 0.1 NTU95 percent of the time (excluding 15minuteperiod following backwashes) based on the
10

maximum values recorded during 4-hour timeincrements.
. If particle counters are available, maxi-mum filtered water measurement of lessthan 10 part ic les ( in the 3 to 18 pmrange) per milliliter. (Note: The currentstate-of-the-art regarding calibration ofparticle counters and the inherent prob-lems in comparisons of readings betweendifferent counters must be considered inusing particle count information to assessoptimized performance. Higher readingsthan the above 10 particles/ml goal froma counter that is properly calibrated maybe a function of differences betweeninstruments. Relative changes in particlecount data wi l l be of greater use inassessing optimized performance than theabsolute values from the particle counter).
l Maximum f i l tered water measurement of0.3 NTU.
l Initiate filter backwash immediately after tur-bidity breakthrough has been observed andbefore effluent turbidity exceeds 0.1 NTU.
l Maximum filtered water turbidity followingbackwash of less than 0.3 NTU.
l Maximum backwash recovery per iod o f15 minutes (e.g., return to less than 0.1 NTU).
2.4.4 Disinfection Performance Goal
l ‘ CT values to achieve required log inactivationof Giardia and virus.
2.5 Role of the Water Treatment PlantStaff in Public Health Protection
The information presented in this chapter demon-strates that the quality of water leaving a watertreatment plant has the potential to directly impactthe health of the consumers of its finished water.All staff associated with the plant, from the opera-tor to the highest level administrator, have animportant role in protecting public health and aresponsibility to provide finished water that mini-mizes the possibility of a disease outbreak. Expe-rience gained from implementing CCP optimizationactivities at plants has demonstrated that, in most
situations, once utility staff become aware of theimportance of achieving optimized performancegoals, they have enthusiastically pursued thesegoals through a variety of activities. Later chap-ters present comprehensive procedures forassessing and achieving the level of performancedescribed in this chapter.
2.6 References
1. Kramer, M.H., et al. 1996. “Waterborne Dis-ease: 1993 and 1994.” Journal A WWA,
2.
3.
4.
5.
6.
7.
8.
9.
88(3):66.
Chauret, C., et al. 1995. “Correlating Crypto-sporidium and Giardia With Microbial Indica-tors.” JournalAWWA, 87(11):76.
LeChevallier, M.W., et al. 1995. “Giardia andCtyptosporidium in Raw and Finished Water.”Journal A WWA, 87(9):54.
States, S., et al. 1997. NProtozoa in RiverWater: Sources, Occurrence, and Treatment. IIJournal A WWA, 89(g): 74.
Solo-Gabriele, H., et al. 1996. “U.S. Out-breaks of Cryptosporidiosis. n Journal A WWA,88(91:76.
Pett, B., et al. 1993. “Cryptosporidiosis Out-break From an Operations Point of View:Kitchener-Waterloo, Ontario.” Paper presentedat AWWA Water Quality Technology Confer-ence, Miami, FL.
Richardson, A.J., et al. “An Outbreak ofWaterborne Cryptosporidiosis in Swindon andOxfordshire.” Epidemiol. Infect., 107(3)485.
Korich, D.G., et al. 1990. “Effects of Ozone,Chlorine Dioxide, Chlorine, and Monochlora-m i n e o n Cryptosporidium parvum O o c y s tViability.” Applied and Environmental Microbi-ology, 56(5):1423.
Finch, G.R., et al. 1995. “Ozone and ChlorineInactivation of Cryptosporidium. n In Proceed-inas of Water Quality Technoloov Conference,November 6-10, 1994, San Francisco, CA.AWWA, Denver, CO.
10. USEPA. 1997. National Primary DrinkingWater Regulations: Interim Enhanced SurfaceWate r T rea tmen t Ru le ; No t i ce o f Da ta
11

Availability; Proposed Rule. Fed. Reg.,
11
62:212:59486 (November 3, 1997).
Guidance Manual for Comoliance With theFiltration and Disinfection Reauirements forPublic Water Svstems Usina Surface WaterSources. 1989. NTIS No. PB-90148016,USEPA, Cincinnati, OH.
12. Patania, N.L., et al. 1996. Ootimization ofFiltration for Cvst Removal. AWWARF,Denver, CO.
13. Nieminski, E.C., et al. 1995. “RemovingGiardia and Cryptosporidium by ConventionalTreatment and Direct Filtration.” JournalAWWA, 87(9):96.
14. Mosher, R.R., et al. 1986. “Rapid Rate Filtra-tion of Low Turbidity Water Using Field-ScalePilot Filters.” Journal AWWA, 78(3):42.
15. Al-Ani, M.Y., et al. 1986. “Removing GiardiaCysts From Low Turbidity Water by RapidSand Filtration.” Journal A WWA, 78(5):66.
16. Consonery, P.J., et al. 1996. “Evaluating andOptimizing Surface Water Treatment Plants:How Good is Good Enough?” Paper presentedat AWWA Water Quality Technology Confer-ence, November 1996, Boston, MA.
17. AWWA Statement of Policy. 1968. QualityGoals for Potable Water, Journal AWWA,60(12):1317.
18. Cleasby, J.L., et al. 1989. Design and Opera-tion Guidelines for Optimization of the HighRate Filtration Process: Plant Survey Results.AWWARF, Denver, CO.
19. West, T. , P. Demeduk, G. Wi l l iams, J.Labonte, A. DeGraca, and S. Teefy. 1997.“Using Particle Counting to Effectively Monitorand Optimize Treatment.” Paper presented atAWWA Annual Conference, Atlanta, Georgia.
20. Veal, C., and B. Riebow. 1994. “ParticleMonitor Measures Filter Performance.”Opflow, 20(51:1.
12

technical skills at plants with potential publichealth concerns.
Despite the identified institutional barriers, thecontinued success of the CCP efforts at individualfacilities could not be ignored (2). In addition,experience gained from the broad-scale implemen-tation of the CCP through state optimization pilotprograms and the Partnership for Safe Water dem-onstrated that improvement in water treatmentperformance could be achieved through multipleactivities that are based on CCP concepts. Somespecific examples include:
l Self-Assessment Based on CCP Can PositivelvImpact Performance: Activities that involvewater utilities with the development and inter-pretation of their turbidity data have providedutility staff with a different perspective onassessing their performance and have resultedin utility-directed changes to their operationand system that have improved performance.Specifically, many water utilities that have par-ticipated in the Partnership for Safe Waterhave acknowledged that associated turbiditydata trending activities have focused them onimproving their plant performance to achievethe Partnership goals (3).
l Centralized Trainina Usina CCP Princiules Canlmoact Multiple Facilities: The application ofCCP-based principles through centralized,facilitated training workshops represents aneffective and efficient approach to assist agroup of utilities with achieving optimizationg o a l s . Specifically, a training facilitator inPennsylvania, working with a group of waterutilities, used CCP-based process control pro-cedures in a workshop format to improvecoagulant dosing understanding and applica-tion (41.
l CCP Components Can be Used to EnhanceExistina State Proaram Activities: Aligningexisting programs (e.g., sanitary surveys,facility outreach) with the CCP approach canenhance achievement of performance goals.For example, existing state sanitary survey
Chapter 3Assessing Composite Correction Program A ppfica tion
3.1 Introduction
The CCP is currently used as an optimization toolby several EPA regional offices and state drinkingwater programs, and its use could increase as theresult of possible new turbidity requirements whenthe Interim Enhanced Surface Water TreatmentRule (IESWTRI is promulgated (1). However, themost effective application of the approach has notalways been achieved. Results from CCP fieldexperience and state pilot programs have indicatedthat the CCP is most effective when it is strategi-cally integrated into a program that focuses onarea-wide optimization of water treatment sys-tems. This chapter describes a developing pro-gram for regulatory agencies and others to initiateeffective CCP-based optimization activities throughthe implementation of an area-wide optimizationmodel.
3.2 Optimization Program Experience
The experience gained from the transfer of CCPcapability to state drinking water programs is dis-cussed in Chapter 1, These activities providedvaluable insights into the use of the CCP as anoptimization tool by primacy agencies. The objec-tive of the early pilot programs was to demon-strate the capability to effectively transfer CCPskills to state personnel and to facilitate state-wideimplementation of these activities. Several chal-lenges became apparent during the implementationphase. The CCP approach, while consideredextremely valuable, was also considered to beresource intensive and, therefore, in competitionwith other state program activities. In somestates with decentralized programs, field and cen-tral office personnel had difficulty defining theirroles and responsibilities for implementing optimi-zation activities. Primacy agency policies guidingthe implementation of follow-up efforts weresometimes challenged (e.g., enforcement versusassistance responsibilities). As the state pilot pro-grams progressed, these challenges to implemen-tation became known collectively as institutionalbarriers. In some cases these institutional barrierswere pervasive enough to prevent state teamstrained in CCP procedures from using their new
13

programs in Texas and Pennsylvania weremodified to include performance-related CPEactivities (e.g., individual filter evaluations, fil-ter backwash special studies, process controlinterviews) (5).
These findings supported a strategic change in theCCP direction. The result was an organizationalframework for implementing optimization activitieson an area-wide basis.
3.3 Area-Wide Optimization Model
An area-wide optimization model was developedthat creates an environment to effectively applyexisting resources (e.g., state programs and per-sonnel) with proven performance improvementtools (e.g., CCP). Major components of the cur-rent model include: Status, Evaluation, Follow-Upand Maintenance. These components are des-cribed in Figure 3-l. This model represents a pro-active approach to public health protection,serving to promote continuous improvement andaddressing performance-related issues when theyfirst become apparent. Pervasive throughout thearea-wide optimization program is an awarenessbuilding process linking treatment plant perform-ance with public health protection. It is importantto note that an area-wide optimization program isan ongoing activity with an overall objective toimprove the performance level of all water sys-tems.
Future activities are planned to enhance the area-wide optimization model. Potential activitiesinclude expanded optimization efforts at surfacewater treatment facilities (e.g., disinfection by-products, source water protection, distributionsystem water quality), and optimization activitiesrelated to ground water systems.
3.3. I Status Component
Status Component activities are designed to deter-mine the status of water systems relative to opti-mized performance goals within a defined area(e.g., state, region, district). Implementers ofoptimization programs then use the results ofthese activities in a prioritization process to con-tinuously focus available resources where they aremost needed, typically at high risk public healthsystems. A key activity under the Status Compo-nent is continuous performance monitoring, whichcan be used to effectively measure the success of
the various optimization efforts associated withthe model.
3.3.2 Evaluation Component
Evaluation Component activities focus on thedetermination of factors limiting performance forthose water systems where performance problemswere identified from Status Component activities.Existing evaluation programs can be utilized byincorporating performance-focused activities. Themost resource-intensive evaluation tools, such asCPEs, are applied at water systems presenting thegreatest risk to public health.
3.3.3 Folio w-Up Component
Follow-Up Component activities focus on identify-ing and developing technical assistance method-ologies, such as the CTA, to systematical lyaddress performance limiting factors at these sys-tems. Coordination and training of available tech-nical resources (e.g., state drinking water programtrainers, non-profit organizations, water systempeers, consultants) are important activities toassure consistency and effectiveness of this com-ponent. The degree of involvement of regulatoryagency personnel in follow-up activities may beimpacted by the agency’s policies on enforcementversus technical assistance. In these situations,policies should be clearly established and agreedupon by agency staff prior to implementing follow-up activities.
3.3.4 Maintenance Component
The Maintenance Component formalizes a feed-back loop to integrate the “lessons learned” fromthe various component activities back into themodel. In addition, these “lessons learned” canprovide opportunities to coordinate findings withother related programs.
3.4 Implementation of an Area-WideModel
Figure 3-2 shows the status of filtration plant tur-bidity performance during a two-year period whena state was initiating an area-wide optimizationprogram (51. For those plants that achievedimproved performance levels, this progress wasaccomplished through their participation in Status
14

Component activities such as turbidity monitoringand Follow-Up Component activities such aschemical feed training. This figure demonstratessome of the benefits of using the Status Compo-nent to continuously monitor the ,water system’slevel of performance relative to the desired per-formance goal. For example, systems representingthe greatest public health risk are apparent. In
addition, systems showing improved performancecan be assessed to ascertain the reasons for suchimprovement. In some cases, an awareness of theimportance of optimized performance by the watersystem has been identified as a major contributingfactor for the change.
15
Figure 3-1. Area-wide optimization model.
b STATUS COMPONENT9 Establish optimized performance goals.9 Routinely prioritize water systems based on public health risk.9 Continuously monitor and assess performance data.9 Incorporate performance-based activities into existing surveillance
programs.9 Establish feedback mechanism to include monitoring and surveillance data
into ongoing prioritization process.
EVALUATION COMPONENT9 Focus existing programs on optimized performance goals.
b 9 Use CCP-based evaluations to identify factors limiting performance.9 Implement CPEs at high risk systems.9 Identify and develop resources to provide CCP-based evaluations.
FOLLOW-UP COMPONENT9 Establish parties responsible for follow-up component activities.9 Utilize a follow-up protocol that systematically addresses factors limiting
performance.9 Identify and develop resources to provide CCP-based follow-up activities.9 Coordinate existing programs to complement performance improvement
efforts.
MAINTENANCE COMPONENT9 Integrate optimization efforts with other drinking water program activities,
such as design review, training, and funding.’ 9 Identify and implement ongoing optimization program refinements.

Figure 3-2. Area-wide treatment plant performance status.
0
1 2 3 4 5 6 7 6 9 10 11 12 13 14 15
System
60
20
10
In the following sections, the Status Component isfurther defined to provide a systematic procedurefor assessing applicability of the CCP. The foursteps of the procedure are: 11 establish perform-ance focused goals to prioritize water systems,2) assess performance relative to defined optimiza-tion goals, 3) prioritize water systems based onselected criteria, and 4) assess the response to theprioritized water systems.
3.4.7 Establish Criteria to Prioritize WaterSystems
The initial step in the development of a prioritizedfacility database is the selection of performancefocused criteria. Example prioritization criteria forsurface water treatment systems are shown inTable 3-l. In this example, criteria were selectedbased on specific performance goals (e.g., tur-bidity) and operations and management practicesthat support optimized performance (e.g., processcontrol, staffing level).
Points are applied to each criterion relative to theirpotential to impact public health risk. For exam-ple, the ability to meet the filtered water turbiditygoal of 0.1 NTU is given a higher number of points
16
as the percentage of time meeting this goaldecreases. Additional data required to completethe assessment outlined in Table 3-l can usuallybe obtained from existing resources (e.g., plantperformance charts, water system monthlyreports, sanitary surveys). It may be necessary toexpand the data collection requirements fromwater systems to assure that sufficient perform-ance focused information is available for thisactivity.
3.4.2 Assess Water System PerformanceRelative to Optimization Goals
Typically, each water system utilizing a surfacewater source collects and records plant perform-ance data on a daily basis. These data can beentered into a computer by either water systemstaff, regulators, or others on a monthly basisusing a spreadsheet program such as the Partner-ship fo r Sa fe Wafe r sof tware inc luded inAppendix A. Data are then used to developturbidity trend charts and percentile tables.Specific types of turbidity data included in theassessment are listed below.

l Raw water turbidity (daily value; maximuvalue recorded for the day preferred).
l Sedimentation basin effluent turbidity (dailymaximum value recorded for the day prferred).
l Filter effluent turbidity (daily for each filtermaximum value preferred; combined filter ofinished water as alternative).
A minimum of 12 months of turbidity data idesired to assess water system performance undevariable source water conditions. An example turbidity monitoring chart for a surface water treament system is shown in Figure 3-3. Rawsettled, and filtered water turbidity values ar
m
;e-
;r
sr-
t-,e
plotted for a 12-month period. In this example,overall filtered water quality is excellent; however,occasional turbidity spikes occur in the filteredwater that correspond to increases in the rawwater turbidity.
3.4.3 Prioritize Water Systems Based onSelected Criteria
When prioritization criteria data are available forthe water systems that are to be included in thearea-wide optimization program, each of the sys-tems can be assigned points, as shown in Ta-ble 3-2. The water systems are then ranked fromhighest priority (i.e., most points) to lowest pri-ority (i.e., least points). Ideally, a prioritized water
Table 3-1. Example Prioritization Criteria for Surface Water Systems
17
Prioritization Criteria Points(0 if No)
Has the water system had an imminent health violation within the last two (2)years (turbidity, CT, positive coliform)?
10 - 15
Does the water system achieve the optimization turbidity goal for filtered water of0.1 NTU?
2 95 % time 0
50 - < 95 % time 5
< 50 % time 10
Does the water system experience post filter backwash turbidity of > 0.3 NTUfor greater than 15 minutes?
O - I O
Does the water system achieve the optimization turbidity goal for settled water(e.g., < 2 NTU 95% time)?
o - 5
Does the water system have operation and treatment problems (e,g., improperchemical feed, improper jar testing, inadequate procedures)?
o - 5
Does the water system experience sedimentation and filtered water turbidityvariability given changing raw water quality?
O - 5
Does the water system lack administrative support (e.g., inadequate funding,inadequate support of system operational needs)?
o - 5
Does the water system have poor source water quality (e.g., high turbidity vari-ability, high presence of protozoan parasites)?
o - 3
Does consistent, high-quality source water lead to complacency in the operationand management of the water system?
0 - 3
Does the water system fail to monitor raw, settled and filtered water turbidity? o - 3

Figure 3-3. Example turbidity monitoring data for 12-month period.
9.5 % time settled turbidity ~9.7 NTU95 % time fittered turbdii < 0.1 NTlJ I
I’,I
T
l/l/95 2/l 195 314195 4/4/95 515185 6/5/95 7/6/95 6/6/95 g/w95 1 o/7/95 lln795 12lW95
Taable 3-2. Example Prioritization Database
9 0 0 3 3 2 0 4 3 4 0 19
6 0 2 3 1 3 0 2 3 0 0 14
4 0 0 2 0 0 0 2 0 0 0 4
system database would include each system andtheir total point score. This database should beupdated routinely (e.g., quarterly) to reflect newinformation from system reports, field surveys,and performance data.
3.4.4 Assess Response to Prioritized WaterSystems
Information gained from the prioritization databaseprovides the basis for determining the appropriate
response to achieving performance ,goals. For ex-ample, some specific actions that could result froman area-wide prioritization database include:
l High scoring utilities:
9 Apply CCP
. Modifications/major construction
n Enforcement action
18

l Moderate scoring utilities:
. Performance-focused sanitary survey
n Centralized training using CCP principles(focus on high ranking performance limit-ing factors)
l Low scoring utilities:
. Telephone contact
g Self-assessment
. Maintain or reduce frequency of sanitarysurveys
Use of a performance-based prioritization databaseprovides assurance that the identified responsesare commensurate with the level of public healthrisk. Following this approach, the CCP, a provenprocess that can result in optimized performance,is applied at water systems that have the highestpublic health risk.
3.5 References
1 . USEPA. 1997. National Primary DrinkingWater Regulations: Interim Enhanced Surface
Water Treatment Rule; Notice of Data Avail-ability; Proposed Rule. Fed. Reg.,
2.
3.
4.
5.
62:212:59486 (November 3, 1997).
Renner, R.C., B.A. Hegg, J.H. Bender, andE.M. Bissonette. 1993. “Composite Correc-tion Program Optimizes Performance at WaterPlants.” JuurnalAWWA, 85(3):67.
Pizzi, N.G., B.A. Hegg, J.H. Bender, andJ. DeBoer. 1997. “Cleveland’s Self-Assessment and Contribution to thePartnership for Safe Water Peer ReviewProcess.” Proceedinus - A W W A A n n u a lConference, June 1997, Atlanta, GA.
Jesperson, K. 1997. “Pilot Program RipplesThrough PA DEP.” E-Train, Published by theNational Environmental Training Center forSmall Communities.
Hoover, J.T,, R.J. Lieberman, L.D. DeMers,and J. Borland. 1997. “Public Water SupplyArea-Wide Optimization Strategy.” Presenta-tion at the Association of State Drinking WaterAdministrators Annual Conference, October1997, Savannah, GA.
19

Chapter 4Comprehensive Performance Evaluation
4.1 Introduction
This chapter provides ‘information on the evalua-tion phase of the CCP, which is a two-step proc-ess to optimize the performance of existing sur-face water treatment plants. For purposes of thishandbook, optimization is defined as achieving theperformance goals as outlined in Chapter 2. Theevaluation phase, called a Comprehensive Perform-ance Evaluation (CPE), is a thorough review andanalysis of a facility’s design capabilities andassociated administrative, operational, and main-tenance practices as they relate to achieving opti-mum performance from the facility. A primaryobjective is to determine if significant improve-ments in treatment performance can be achievedwithout major capital expenditures. This chaptercovers three main areas related to CPEs. First, aCPE methodology section presents all of the majortechnical components of a CPE and their theoreti-cal basis. The following section discusses how toimplement the CPE methodology when conductinga CPE. This section also includes many practicalconsiderations based on the field experiencegained by conducting actual CPEs. The last sec-tion of this chapter includes a case history of anactual CPE.
4.2 CPE Methodology
Major components of the CPE process include:11 assessment of plant performance, 21 evaluationof major unit processes, 3) identification and pri-oritization of performance limiting factors,4) assessment of applicability of the follow-upphase, and reporting results of the evaluation.Although these are distinct components, some are
conduct of an actual CPE. A discussion of each ofthese components follows.
4.2.7 Assessment of Plant Performance
from plant records supplemented by data collected
relative to achieving the optimized performance
21
less-than-optimized performance.optimized performance, a water treatment plant
source of variable quality and produce a consistent
ance of each unit process must demonstrate its
ticles at all times. The performance assessment
sistently perform at optimum levels to provide
ance is not optimized, it also provides valuable
problems and serves as the basis for other CPEfindings.
4.2.1.1 Review and Trend Charting of PlantOperating Records
The performance assessment is based on turbiditydata located in plant operating records. Theserecords, along with a review of laboratory qualitycontrol procedures (especially calibration of turbi-dimeters) and sample locations, are first assessedto ensure that proper sampling and analysis haveprovided data that is representative of plant per-formance. The next step is to prepare trendgraphs of the maximum daily turbidities for theraw water, settled water, finished water, and indi-vidual filter effluents, if available. Data for themost recent one-year period is used in this evalua-tion and can typically be obtained from the plant’sprocess control data sheets. Maximum values areused in these trend charts since the goal is toassess the integrity of each barrier at its most vul-nerable time. A twelve-month period is utilizedbecause it includes the impacts of seasonal varia-tions and provides a good indicator of long termperformance.
Data development can be accomplished by using acommercial computer spreadsheet. However,spreadsheets that work with several commerciallyavailable spreadsheet programs were developed
Partnership for Safe Water (1) and haveproven valuable in making the desired performanceassessment trend charts. The Partnership data
how to use them are provided in Appendix A.

Figure 4-1 shows an example of performanceassessment trend charts prepared for a typicalplant. In addition to the trend charts, a percentileanalysis can also be made using the data todetermine the percent of time that raw, settledand finished water quality is equal to or less than acertain turbidity. This information can be used toassess the variability of raw water turbidity andthe performance of sedimentation and filtrationunit processes. The percentile analysis of settledand finished water quality are useful to project aplant’s capability to achieve optimized perform-ance objectives. An example of the percentileanalysis for the data shown in Figure 4-1 is pre-sented in Table 4-l. It is noted that the trendcharts and the percentile analysis are developed asa portion of the Partnership data developmentspreadsheets and are shown in Appendix A. Thedata provided in Table 4-l was taken from theyearly summary on the percentile portion of thesoftware output. It is often useful to summarizethe data in this fashion since the spreadsheet pro-vides a significant amount of information.
Once the trend charts and percentile analysis havebeen developed, interpretation of the data can beaccomplished. A good indication of the stability ofplant operation can be obtained from comparing aplot of raw water, settled water and finished waterturbidity. When comparing these data, the evalua-tor should look for consistent settled and filteredwater turbidities even though raw water qualitymay vary significantly. In Figure 4-l the rawwater ,turbidity shows variability and several sig-nificant spikes. Variability is also evident in thesettled and finished water turbidities. In addition araw water “spike” on March 9th carried throughthe plant resulting in a finished ,water turbidityclose to 1 NTU. These “pass through variationsand spikes” indicate that the performance of thisplant is not optimized and that a threat of particleand possibly pathogen passage exists. In plantsthat have consistent low raw water turbidities,periodic spikes in sedimentation and finished waterthat appear related to changes in raw water qualitymay indicate that the plant staff are complacentand lack process control skills. The administrativesupport for the plant may also play a role in thiscomplacency.
Optimized performance for the sedimentation basinin the example is assessed based on achieving set-tled water turbidities consistently less than 2 NTUin 95 percent of the samples, since the averageraw water turbidity exceeds 10 NTU (e.g.,19 NTU). In the example shown, the settled
water turbidity was less than or equal to 5.3 NTUat the 95th percentile. This indicates less-than-optimum performance from this process barrier.
Optimized performance for the finished water isassessed based on achieving 0.1 NTU or less in95 percent of the samples. For the exampleshown, the finished water was 0.48 NTU or lessin 95 percent of the samples; consequently, opti-mum performance was not being achieved by thisbarrier. In summary, the interpretation of the datashown in Figure 4-l and Table 4-l indicates thatoptimum performance is not being achieved, and itwill be necessary to identify the causes for thisless-than-optimum performance during the conductof the CPE.
CPEs conducted to date have revealed that oper-ating records often do not have adequate informa-tion to complete the performance assessment.Maximum daily turbidities are often not recordedand settled water turbidity information often doesnot exist. The fact that this type of information isnot available provides a preliminary indicationabout the priority that the utility has on pursuingachievement of optimum performance goals.
Particle data, when available, can also be used toassess optimized performance. Typically, particledata will provide a more sensitive assessment offilter performance when the turbidity is less than0.1 NTU. Particle counts will normally show moresubtle changes in filter performance than indicatedby the turbidimeters. This does not mean thatturbidimeter information should be ignored whenparticle count data is available. It is important thatthe evaluator have confidence in the filter’s per-formance relative to producing water that is lessthan 0.1 NTU.
4.2.1.2 Supplemental Data Collection
Plant records used for the trend charting perform-ance assessment activities are usually based onclearwell samples collected at four-hour intervalsas required by regulations. Complete assessmentof optimized performance, however, also requiresknowledge of the instantaneous performance ofindividual treatment units; especially for individualfilters. Many plants currently do not have separateturbidimeters on individual treatment units, andmost of these do not have equipment that willprovide continuous recording of the data. To sup-plement the performance data available from the
22

Figure 4-1. Example performance assessment trend charts.
R a w W a t s :
2 5 . 0 0
Sett led Water
Finished W atsr
0 . 9 0
0 . 8 0
0 . 7 0
L 0 . 6 0
- 0 . 5 050 0 . 4 0n; 0 . 3 0c-
0 . 2 0
0 . 1 0
0 . 0 0*v-0* 0.I.01 *.“.a. D . . . . 4 1.“.,5 F.b.86 Id.,.96 ,p,.er MS”.95 Jun.05 l”C9, a.g.pI
23

Table 4-1. Percentile Distribution Analysis ofWater Quality Date*
Percent of Time RF4W Settled FinishedValues Water Water Water
Less Than or Turbidity Turbidity TurbidityEqual To NTU MU NTU
Value Shown
I 50 I 17 I 2.1 I 0.30-1
75 2 2 3.0 0.38
90 29 4.1 0.44
95 3 4 5.3 0.48
Average 19 2.6 0.31
*Percentile analysis is based on peak daily turbiditias measuredfor each sample source for the twelve-month evaluation period.
plant records, additional turbidity performancedata is usually collected during the CPE.
Optimum performance cannot be assessed withoutan evaluation of individual filter performance. Fin-ished water samples are often obtained from theclearwell. The clearwell “averages” the perform-ance of the individual filters and thus may maskthe impact of damaged underdrains, of “blownmedia” on an individual filter, or of malfunctioningfilter rate control valves. A malfunctioning indi-vidual filter could allow the passage of sufficientmicrobial contamination to threaten public healthdespite the plant as a whole producing a low fin-ished water turbidity. A second reason for theneed of supplemental data collection is that mostplants do not keep records of their filter backwashrecovery profiles. These are needed to assess ifthe plant is meeting the filter backwash recoveryoptimized performance goals.
Since this instantaneous individual filter perform-ance data is so critical, it is usually best if one ortwo independently calibrated on-line continuousrecording turbidimeters are available during theCPE. Along with providing the ability to assessthe performance of individual filters, these unitsalso allow a quality control check on the plant’smonitoring equipment. On-line units will providemore information on the impacts of various
operational changes such as filter backwashes andchanges in flow rates. Grab sampling from indi-vidual filters can provide useful insights about theperformance of individual filter units, but a con-tinuous recording turbidimeter provides more accu-rate results. Grab sampling to assess individualfilter performance is also cumbersome becausemany samples at short time increments (e.g.,1 minute intervals) are needed to get an accuratefilter backwash recovery profile. It is noted, how-ever, that in a plant with multiple filters it isadvantageous to collect grab samples from indi-vidual filters for turbidity analysis before selectingthe filter that is to be monitored by the continuousrecording turbidimeter. The filter demonstratingthe poorest performance should be selected foranalysis. If all filters demonstrate similar perform-ance, it is desirable to install the on-line turbidime-ter on a filter to be backwashed to allow observa-tion of the backwash recovery profile.
Continuous monitoring and recording of turbidityfrom each filter allows identification of short termturbidity excursions such as: impacts of malfunc-tioning filter rate control valves, impacts of hy-draulic changes such as adjustments to plant flow,impacts of hydraulic loading changes duringbackwash of other filters, impacts of plant start-up, and impacts of backwashing on individual fil-ters. When the plant staff can properly applyprocess control concepts they can eliminate thesevariations in turbidity either through proper controlof the hydraulic loadings to the treatment proc-esses or through chemical conditioning. Thesetypes of turbidity fluctuations on the filter tur-bidimeters are often indicators of inadequate proc-ess control that must be verified during the CPE.
Figure 4-2 shows results of continuous recordingof turbidity from a filter that was backwashed. Asindicated, optimized performance of 0.1 NTU orless was not being achieved prior to the back-wash. Also, the post backwash turbidity spike of0.95 NTU exceeded the optimized performancegoal of 0.3 NTU, and the filtered water turbiditydid not recover to 0.1 NTU or less within a 15-minute period.
These same goals are also used to assess back-wash spikes and optimized performance at plantsthat use filter-to-waste. The 15-minute recoveryperiod starts when the filter begins filtering afterbackwash even though the plant may filter-to-waste for longer periods of time. The rationale for
24

Figure 4-2. Example of individual filter monitoring.
0.80.Resume Filtration
Begin Backwash\
Plant Flow Reduced _ Limited Chlorine AvailaMe
.,_w-0 2 4 6 8 10 12 14 16 16 20 22 24
Time From Start of Continuous Filter Monltorlng - hrs
this approach is that the control of backwashspikes is a key indicator of the adequacy of theplant’s process control program and chemical con-ditioning of the filters. Waiting until the filter-to-waste is completed to assess backwash spikescould hide key information relative to the process
. control capability of the plant staff.
As discussed above, many plants do not collectand/or record data on sedimentation basin per-formance. During a CPE, therefore, it may benecessary to collect sedimentation basin perform-ance data to assess if this process is meeting theoptimized performance goals. It may be necessaryto collect data on individual sedimentation units ifone appears to have worse performance than theothers. Usually, grab sampling of these units willsuffice.
4.2.2 Evaluation of Major Unit Processes
4.2.2.1 Overview
The major unit process evaluation is an assess-ment of treatment potential, from the perspectiveof capability of existing treatment processes toachieve optimized performance levels. If theevaluation indicates that the major unit processesare of adequate size, then the opportunity to opti-
mize the performance of existing facilities by ad-dressing operational, maintenance or administra-tive limitations is available. If, on the other hand,the evaluation shows that major unit processes aretoo small, utility owners should consider construc-tion of new or additional processes as the initialfocus for pursuing optimized performance.
It is important to understand that the major unitprocess evaluation only considers if the existingtreatment processes are of adequate size to treatcurrent peak instantaneous operating flows and tomeet the optimized performance levels. The intentis to assess if existing facilities in terms of con-crete and steel are adequate and does not includethe adequacy or condition of existing mechanicalequipment. The assumption here is that if theconcrete and steel are not of adequate size thenmajor construction may be warranted, and thepursuit of purely operational approaches to achieveoptimized performance may not be prudent. Thecondition of the mechanical equipment around thetreatment processes is an important issue, but inthis part of the CPE it is assumed that the poten-tial exists to repair and/or replace this equipmentwithout the disruption of the plant inherent to amajor construction project. These types of issuesare handled in the factors limiting performancecomponent of the CPE, discussed later in thischapter. It is also projected in the major unit
25

process evaluation that the process controlrequirements to meet optimized performance goalsare being met. By assuming that the equipmentlimitations can be addressed and that operationalpractices are optimized, the evaluator can projectthe performance potential or capability of a unitprocess to achieve optimized performance goals.
The evaluation approach uses a rating system thatallows the evaluator to project the adequacy ofeach major treatment process and the overall plantas either Type 1, 2 or 3, as graphically illustratedin Figure 4-3. Type 1 plants are those where theevaluation shows that existing unit process sizeshould not cause performance difficulties. Inthese cases, existing performance problems arelikely related to plant operation, maintenance, oradministration. Plants categorized as Type 1 areprojected to most likely achieve optimized per-formance through implementation of non-construc-tion-oriented follow-up assistance (e.g., a CTA asdescribed in Chapter 5).
Figure 4-3. Major unit process evaluationapproach.
II
I
The Type 2 category is used to represent a situa-tion where marginal capability of unit processescould potentially limit a plant from achieving anoptimum performance level. Type 2 facilities havemarginal capability, but often these deficienciescan be “operated around” and major constructionis not required. In these situations, improved pro-cess control or elimination of other factors throughimplementation of a CIA may allow the unit proc-ess to meet performance goals.
Type 3 plants are’those in which major unit proc-esses are projected to be inadequate to providerequired capability for the existing plant flows.For Type 3 facilities, major modifications are
believed to be required to achieve optimized per-formance goals. Although other limiting factorsmay exist, such as the operator’s lack of processcontrol capability or the administration’s unfamili-arity with plant needs, consistent acceptable per-formance cannot be expected to be achieved untilphysical limitations of major unit processes arecorrected.
Owners with a Type 3 plant are probably lookingat significant expenditures to modify existing facili-ties so they can meet optimized performancegoals. Depending on future water demands, theymay choose to conduct a more detailed engineer-ing study of treatment alternatives, rate struc-tures, and financing mechanisms. CPEs that iden-tify Type 3 facilities are still of benefit to plantadministrators in that the need for construction isclearly defined. Additionally, the CPE provides anunderstanding of the capabilities and weaknessesof all existing unit processes, operation and main-tenance practices, and administrative policies.
As discussed in Chapter 2, water suppliers have akey role to play in public health protection and aresponsibility to water quality that they must meeton a continuous basis. If a facility is found topose a severe health risk because of its perform-ance, some action must be taken even if it isfound to be Type 3. In the short term, otherweaknesses in the plant that are identified in othercomponents of the CPE may need to be addressedto improve performance as much as possible. Ifthese actions do not result in satisfactory perform-ance, a boil water order or water restriction mayhave to be implemented until modifications arecompleted and performance is improved. This mayrequire coordination with appropriate state regula-tory agencies. The water system must also makelong term plans to upgrade or replace deficienttreatment processes.
Another situation that must be considered in com-pleting the major unit process evaluation is the ageand condition of the plant. Though the CCPapproach attempts to minimize construction ofnew facilities, some plants are so old that they arenot structurally sound and/or contain antiquatedequipment (e.g., outdated filter rate-of-flow controlvalves). It is possible that the major unit processevaluation will show these plants as Type 1because they were designed based on conserva-tive loadings and/or the water demand of the areahas not increased. In these cases, the owner ofthe plant will have to look at the plant needs, bothlong term and short term. In addition, the plant
26

may be able to optimize performance to meetshort term public health protection, but will alsohave to consider construction of a new plant inorder to provide high quality water on a long termbasis.
4.2.2.2 Approach
Major unit processes are evaluated based on theircapability to handle current peak instantaneousflow requirements. The major unit processesincluded in the evaluation are flocculation, sedi-mentation, filtration and disinfection. These proc-esses were selected for evaluation based on theconcept of determining if the basin sizes are ade-quate. The performance potential of a major unitprocess is not lowered if “minor modifications”,such as providing chemical feeders or installingbaffles, could be accomplished by the utility. Thisapproach is consistent with the CPE intent ofassessing adequacy of existing facilities to deter-mine the potential of non-construction alternatives.Other design-related components of the plant pro-cesses, such as rapid mix facilities, are notincluded in the major unit process evaluation butrather are evaluated separately as factors that maybe limiting performance. For purposes of themajor unit process evaluation, these componentsare projected to be addressed through “minormodifications. ” It is important to note that themaior unit orocess evaluation should not beviewed as a comDarison to the oricrinal desiancaoabilitv of a olant. The maior unit Processevaluation is based on an assessment of existinqunit processes to meet optimized oerformanceqoals. These qoals are most likelv not the aoalsthat the existinq facilitv was desiqned to achieve.
A performance potential graph is used to evaluatemajor unit processes. As an initial step in thedevelopment of the performance potential graph,the CPE evaluators are required to use their judg-ment to select loading rates which will serve asthe basis to project peak treatment capability foreach of the major unit processes. It is importantto note that the projected capability ratings arebased on achieving optimum performance fromflocculation, sedimentation, filtration and disinfec-tion such that each process maintains its integrityas a “barrier” to achieve microbial protection. Thisallows the total plant to provide a “multiple bar-rier” to the passage of pathogenic organisms intothe distribution system.
then compared to the peak instantaneous operat-ing flow rate experienced by the water treatmentplant during the most recent twelve months ofoperation. If the most recent twelve months is notindicative of typical plant flow rates, the evaluatormay choose to review a time period considered tobe more representative. The peak instantaneousoperating flow is utilized because unit process per-formance is projected to be most challenged dur-ing these peak loading events and it is necessarythat high quality finished water be produced on acontinuous basis.
An example
The projected unit process treatment capability is
petformance potential graph is shownin Figure 4-4. The major unit processes evaluatedare shown on the left of the graph and the variousflow rates assessed are shown across the top.Horizontal bars on the graph depict projectedcapability for each unit process, and the verticalline represents the actual peak operating flowexperienced at the plant. Footnotes are used toexplain the loading criteria and conditions used torate the unit processes.
Figure 4-4. Example performance potential graph.
flow (MGD)
Unit Process 10 20 30 40 50 60I I I I I I
Flocculation’
Sedimentation+
Filtration*
Disinfection”
Rated at 20 min hydraulic detention time (HDT); assumesvariable speed drive would be added to existing flocculator.
Rated at 0.6 gpmlsq ft surface overflow rate (SOR); 12.5 ftdepth.
Rated at 4 gpmlsq ft hydraulic loading rate (HLR); dualmedia: assumes adequate media depth and backwashingcapability.
Rated at CT = 127 mg/L-min based on 2.4 mg/L Cl,residual, 53-min HDT, total 4 log Giafdia reduction (1.5 logby disinfection), pH = 8, temperature = 5 OC. 10% ofusable clearwell volume, and depth in clearwell maintained> 9 feet.
27


optimized performance goals and are the criteriathat are used for development of the major unitprocess evaluation for this handbook. However,the performance of the unit process in meeting theoptimized performance goals should be a majorconsideration in the selection of evaluation criteria.The situation where a unit process continuouslyperforms at optimized levels should not be ratedas a Type 2 or Type 3 unit process merely basedon the criteria in Table 4-2. Specific guidance forassessing each unit process is described in thefollowing sections.
Flocculation
Proper flocculation requires sufficient time to allowaggregation of particles so that they are easily re-moved in the sedimentation or filtration processes.The capability of the flocculation process is pro-jected based on the hydraulic detention time inminutes required to allow floe to form at the low-est water temperature. Judgment is used to ad-just the selected times based on the type of treat-ment plant, number of stages, and ability to con-trol mixing intensity.
Selection of the required detention time for ade-quate flocculation can vary widely depending onwater temperature. For example, at plants wherewater temperatures of less than 5°C (41°F) occur,floe formation can be delayed because of the coldwater. In these instances, longer (e.g., 30-minute)detention times may be required. If temperaturesare not as severe, detention times as low as 15minutes or less could be considered adequate.
Other factors to consider include the number offlocculation stages and the availability of variableenergy input to control flocculation. A minimumof three stages of flocculation is desirable. How-ever, because the baffling and variable mixingenergy can often be added or modified throughminor modifications, these items are not consid-ered as significant in determining the basin capa-bility rating. Baffling a flocculation basin to betterachieve plug flow conditions can often signifi-cantly improve the size and settleability of the floe.If adequate basin volume is available (i.e., typicallya Type 1 unit process), a one-stage flocculationbasin may result in a Type 2 rating with the stipu-lation that baffling could be provided to overcomethe single-stage limitation if it was shown to belimiting in follow-up CTA activities.
The following guidelines are provided to aid in se-lecting a hydraulic detention time to be used indevelopment of the flocculation unit process per-formance potential:
l Desired hydraulic detention times for floe for-mation are:
Typical range: 15 to 30 minutes.
Cold low turbidity waters (e.g., <0.5” Cand < 5 NTU): 30 minutes or greater fora conventional plant.
With tapered mixing and at least threestages, use lower end of ranges. Twentyminutes is commonly used for multiplestages in temperate climates.
With single-stage, use upper end ofranges shown in Table 4-2.
. Lower hydraulic detention times than thoseshown in Table 4-2 can be used to projectcapacity in cases where plant data demon-strates that the flocculation basin contributesto the plant achieving the desired performancegoals at higher loading rates.
Sedimentation
Except for consistent low turbidity waters, sedi-mentation is one of the multiple barriers normallyprovided to reduce the potential of cysts frompassing through the plant. The sedimentation pro-cess is assessed based on achieving a settledwater turbidity of less than 1 NTU 95 percent ofthe time when the average raw water turbidity isless than or equal to 10 NTU and less than 2 NTUwhen the average raw water turbidity exceeds10 NTU.
Sedimentation performance potential is projectedprimarily based on surface overflow rate (SOR)with consideration given to the basin depth, en-hanced settling appurtenances (e.g., tube settlers),and sludge removal mechanisms. Greater depthsgenerally result in more quiescent conditions andallow higher SORs to be used (see Table 4-2).Sludge removal mechanisms also must be consid-ered when establishing an SOR for projectingsedimentation capability. If sludge is manuallyremoved from the sedimentation basin(s),additional depth is required to allow volume for
30

sludge storage. For these situations, the selectedSOR should be lowered.
Sedimentation capacity ratings can be restricted tocertain maximum values because of criteria estab-lished by state regulatory agencies on hydraulicdetention time. In these cases, state criteria maybe used to project sedimentation treatment capa-bility. However, if data exists that indicates thesedimentation basins can produce desired per-formance at rates above the state rate, it may bepossible to obtain a variance from the state crite-ria.
As shown in Table 4-2, the availability of or theaddition of tube or plate settlers in existing tank-age can be used to enhance the performancepotential of the sedimentation process (e.g., per-form at higher SORs). Upflow-solids-contact clari-fiers represent a unique sedimentation configura-tion since they contain both a flocculation andsedimentation process that have been designed asa single unit. These units can be rated using thecenter volume to assess the flocculation capabilityand the clarifier surface area to rate the sedimen-tation capability.
The following guidelines are suggested to aid inselecting a surface overflow rate to be used in thedevelopment of the sedimentation unit processcapability.
l SORs to project performance potential for rec-tangular, circular, and solids contact basins,operating in a temperate climate with cold sea-sonal water (< 5°C) are shown in Table 4-2.
l SORs to project performance potential forbasins with vertical (> 45O) tube settlers,operating in a temperate climate with cold sea-sonal water (< 5°C) are shown in Table 4-2.
l SORs for projecting performance potential ofproprietary settling units are:
. Lamella plates:
* 10 ft long plates with 2-inch spacingat 55” slope
* 4 gpm/ft’ (based on surface areaabove plates)
n Contact adsorption clarifiers (CACs):
* 6 - 8 gpm/ft2
. Higher SORs than those shown in Table 4-2can be used to project capability in caseswhere plant data demonstrates that a sedimen-tation basin achieves the desired performancegoals at these higher loading rates.
Filtration
Filtration is typically the final unit treatment proc-ess relative to the physical removal of microbialpathogens and, therefore, high levels of perform-ance are essential from each filter on a continuousbasis. Filters are assessed based on their capa-bility to achieve a treated water quality of lessthan or equal to 0.1 NTU 95 percent of the time(excluding the lEGminute period following back-wash) based on the maximum values recordedduring 4-hour time increments. Additional goalsinclude a maximum filtered water turbidity follow-ing backwash of less than or equal to 0.3 NTUwith a recovery to less than 0.1 NTU within 15minutes.
The performance potential of the filtration processis projected based on a filtration rate in gpm/ft2which varies based on the type of media as shownin Table 4-2. For mono-media sand filters a maxi-mum filtration rate of 2 gpm/ft2 is used becauseof the tendency of this filter to surface bind byremoving particles at the top of the filter. Dual ormixed-media filters use a filtration rate of4 gpm/ft2 because of their ability to accomplishparticle removal throughout the depth of the an-thracite layer. Using the anthracite layer allowshigher filtration rates to be achieved while main-taining excellent filtered water quality. Filtrationrates can be, and often are, restricted to certainmaximum values because of criteria established bystate regulatory agencies. In these cases, statecriteria may be used to project filter performancepotential. However, if data exists that indicatesthe filters can produce desired performance at fil-tration rates above the state rate, it may be possi-ble to obtain a variance from the state criteria.
Limitations caused by air binding can also impactthe selected loading rate for projecting a filter’sperformance potential and could bias the selectedloading rate toward more conservative values (seeTable 4-2). Air binding is a condition that occursin filters when air comes out of solution as a resultof pressure decreases or water temperatureincreases (i.e., the water warms as it passesthrough the filter. The air clogs the voids betweenthe media grains, which causes the filter to behave
31

as though it were clogged and in need of back-washing. The result is shorter filter runs and limi-tations in hydraulic capability.
Inadequate backwash or surface wash facilities,rate control systems, and media and underdrainintegrity are areas that can be addressed throughminor modifications. As such, these items areassessed during a CPE as factors limiting perform-ance and are typically not used to lower the filtra-tion loading rate.
Disinfection
Disinfection is the final barrier in the treatmentplant, and is responsible for inactivating anymicrobial pathogens that pass through previousunit processes. For purposes of this handbook,assessment of disinfection capability will be basedon the SWTR (8). The rule requires a minimum of99.9 percent (3 log) inactivation and/or removal ofGiardia lamblia cysts and at least 99.99 percent (4log) inactivation and/or removal of viruses. Underthe rule, each state was required to develop itsown regulations to assure that these levels of dis-infection are achieved.
USEPA has published a guidance manual that pre-sents an approach to assure that required levels ofdisinfection are achieved (9). The approach usesthe concept of the disinfectant concentration (C)multiplied by the actual time (T) that the finishedwater is in contact with the disinfectant. In theguidance manual, CT values are provided that canbe used. to project the various log removals forvarious disinfectants at specific operating condi-tions (e.g., temperature, pH, disinfectant residual).The guidance manual also indicates that, while the3-log and 4-log inactivation and/or removals arethe minimum required, the log inactivation and/orremoval may need to be increased if the raw watersource is subject to excessive contamination fromcysts and/or viruses, Cyst and virus removalcredits for the different types of treatment proc-esses (e.g., conventional, direct filtration) are alsoprovided in the guidance manual.
The following procedures present an approach forprojecting the capability of a plant to meet thedisinfection requirements based on the CT valuespresented in the SWTR guidance manual. Proce-dures are presented for both pre- and post-disin-fection, with pre-disinfection defined as adding thedisinfectant ahead of the filtration process andpost-disinfection defined as adding the disinfectant
following filtration. Whether or not a utility canuse pre-disinfection depends on how the utility’sstate has developed its disinfection requirements.Some states discourage pre-disinfection becauseof concerns with disinfecti.on by-products and thepossible ineffectiveness of disinfectants in un-treated water. Other states allow pre-disinfectionbecause of concerns with the limited capabilitiesof post-disinfection systems (e.g., limited contacttime). Although the approach used in this Hand-book is based on the SWTR requirements, it isimportant to note that the major unit processevaluation for disinfection will have to be based onthe disinfection requirements adopted by the util-ity’s state regulatory agency.
Future regulations may affect the followingapproach for assessing disinfection unit processcapability. CPE evaluators will need to carefullyassess and modify the following procedures asmore details concerning disinfection requirementsare established.
Post-Disinfection:
The following procedure is used to assess theplant’s disinfection capability when using onlypost-disinfection.
l Project the total log Giardia reduction and inac-tivation required by water treatment processesbased on the raw water quality or watershedcharacteristics. Typically, Giardia inactivationrequirements are more difficult to achieve thanthe virus requirements; consequently, Giardiainactivation is the basis for this assessment.State health departments may have establishedthese values for a specific plant. If not, thestandard requirement for a watershed of rea-sonable quality is a 3.0 log reduction/inactivation of Giardia cysts. A 4.0 or morelog reduction/inactivation may be required foran unprotected watershed exposed to factorssuch as wastewater treatment effluents.
w Project the log reduction capability of the ex-isting treatment plant. Expected removals ofGiardia and viruses by various types of filtra-tion plants are presented in Table 4-3. Asshown, a 2.5 log reduction may be allowed fora conventional plant with adequate unit treat-ment process capability (e.g., Type 1 unitspreceding disinfection). If a Type 1 plant doesnot exist, the evaluator may choose to lowerthe projection of log removal capability for the
32

facility. For purposes of the projection ofmajor unit process capability, it is assumedthat the plant will be operated to achieveoptimum performance from existing units.
Table 4-3. Expected Removals of Giardia Cystsand Viruses by Filtration (91
l SeJect a required CT vaJue from the tables inthe SWTR guidance document (also providedin Appendix Dl based on the required logreduction/inactivation, the log reduction capa-bility projected for the plant, the maximum pHand minimum temperature of the water beingtreated, and the projected maximum disinfec-tant residua/. The maximum pH and the mini-mum temperature, of the water being treatedare selected to ensure capability under worstcase conditions. When chlorine is used as thedisinfectant, the maximum residual utilized inthe evaluation should not exceed 2.5 mg/Lfree residual, based on research which indi-cates that contact time is more important thandisinfectant concentration at free chlorineresiduals above 2.5 mg/L (10). Maximumchlorine residual may also be impacted bymaximum residuals tolerated by the consumer.
l Using these parameters, calculate a requireddetention time {e.g., CT required value dividedby the projected operating disinfectant resid-ual) to meet the required CT. The followingequation is used to complete this calculation.
T,,(min) =Cl& (mg/L - min)
Disinfectant Residual (mg/L)
Where:
T =w Required detention time in post disinfectionunit processes.
CT,,, = CT requirements from tables in Appendix Dfor post disinfection conditions.
Disinfectant Residual = Selected operating residualmaintained at the discharge point from thedisinfection unit processes.
. Select an effective volume of the existingclearwell and/or distribution pipelines to thefirst user. Effective volume refers to the vol-ume of a basin or pipeline that is available toprovide adequate contact time for the disinfec-tant. Effective volumes are calculated basedon worst case operating conditions using theminimum operating depths, in the case ofbasins. This is especially critical in plantswhere high service pumps significantly changethe operating levels of the clearwell and inplants that use backwash systems suppliedfrom the clearwell. Depending on the informa-tion available, there are two ways to determinethe effective volume.
Some plants have conducted tracer studies todetermine the actual contact time of basins.Adequate contact time is defined in the regula-tions as T,,, which is the time it takes 10 per-cent of a tracer to be detected in the basineffluent (9). For these plants the effectivevolume is the peak instantaneous operatingflow rate (gpm) multiplied by the T,O value(min) determined from the tracer studies. If atracer study has been conducted, the resultsshould be utilized in determining the effectivecontact time. It is important to note that thetracer study results must also consider peakinstantaneous operating flows as well asminimum operating depths in order to projectan accurate CT.
For those plants where tracer studies have notbeen conducted, the effective volume uponwhich contact time will be determined can becalculated by multiplying the nominal clearwellor pipeline volumes by a factor. Nominal vol-umes are based on worst case operating con-ditions. For example, an unbaffled clearwellmay have an effective volume of only 10%(factor = 0.1) of actual basin volume becauseof the potential for short-circuiting; whereas, atransmission line could be based on 100% ofthe line volume to the first consumer becauseof the plug flow characteristics. A summaryof factors to determine effective volume ispresented in Table 4-4. Typically, for unbaf-fled clearwells a factor of 0.1 has been usedbecause of the fill and draw operational prac-tices (e.g., backwashing, demand changes)and the lack of baf f les. A factor of 0.5 hasbeen used when calculating the effective vol-ume of flocculation and sedimentation basinswhen rating prechlorination, and a factor of
33

1 .O has been used for pipeline flow. However,each disinfection system must be assessed onindividual basin characteristics, as perceivedby the evaluator. Caution is urged when usinga factor from Table 4-4 of greater than 0.1 toproject additional disinfection capability forunbaff led basins. Available tracer test infor-mation indicates that actual T,,/T ratios intypical full-scale clearwells are close to10 percent of theoretical time (10).
Table 4-4. Factors for Determining EffectiveDisinfection Contact Time Based on BasinCharacteristics* (9)
Baffling Condition Factor
Unbaffled 0.1
Baffling Description
None; agitated basin, highinlet and outlet flowvelocities, variable waterlevel
Poor 0.3 Single or multiple unbaf-fled inlets and outlets,no intra-basin baffles
Average 0.5 Baffled inlet or outlet withsome intra-basin baffling
Superior 0.7 Perforated inlet baffle,serpentine or perforatedintra-basin baffles, outletweir or perforated weir
Excellent 0.9 Serpentine bafflingthroughout basin.
Perfect (plug flow) 1 .o Pipeline flow.
*Based on hydraulic detention time at minimum operatingdepth.
l Calculate a flow rate where the plant willachieve the required CT values for post-disinfection. The following equation is used tocomplete this calculation.
Q (m-N =
Where:
Q = Flow rate where required CT,,, canbe met.
vpo*t = Effective volume for post-disinfectionunits.
Pre-Disinfection:
The following procedure is used to assess theplant’s disinfection capability when using pre-disinfection along with post-disinfection. For pur-poses of the calculations, the approach assumesthat the disinfection requirements can be metindependently by both pre- and post-disinfection;and, therefore, these capabilities are additive whenprojecting plant disinfection unit process capa-bility. The procedure is used to determine theadditional disinfection capability provided if pre-disinfection is actually being practiced at the utilitybeing evaluated. If pre-disinfection is practicedand the utility is concerned about disinfection by-products, the performance potential graph shouldbe developed with two bars for disinfection: oneincluding pre- and post-disinfection and oneincluding only post-disinfection capability. Thisallows the evaluators and the utility to assesscapability if pre-disinfection was excluded.
J
34
Project the total Jog Giardia reduction and inac-tivation required by water treatment processesbased on the raw water quality or watershedcharacteristics as presented in the post-disinfection procedure.
Project the log reduction capability of the ex-isting treatment plant as presented in the post-disinfection procedure.
Select a required CT value for pre-disinfectionfrom the tables in the SWTR guidance docu-men t. This value should be based on therequired log reduction, the log reduction capa-bility of the plant, the maximum pH and mini-mum temperature of the water being treated,and the projected maximum disinfectant resid-ual. The required pre-disinfection CT valuemay be different than the post-disinfectionconditions if different temperatures, pHs, andresiduals exist for the two conditions (e.g.,addition of lime or soda ash to increase the pHof finished water would change the requiredpost-disinfection CT value relative to the pre-disinfection value). CT values for inactivationof Giardia cysts and viruses are presented inAppendix D.
NOTE: If chlorine is used as the pre-disinfectant, a 1.5 mg/L free chlorine residualcan be used as a value in the calculationsunless actual plant records support selection ofa different residual.

l Calculate T,W (e.g., CT required value dividedby the projected operating disinfectant resid-ual) as presented in the post-disinfection pro-cedure.
. Select an effective volume available to provideadequate contact time for pre-disin fection.Assess which basins and lines will providecontact time. These are typically the floccula-tion and sedimentation basins, but couldinclude raw water transmission lines if facilitiesexist to inject disinfectant at the intake struc-ture. Filters typically have not been includedbecause of the short detention times typicallyinherent in the filters and the reduction in chlo-rine residual that often occurs through filters.However, increasingly plants are adding freechlorine ahead of the filters and ammonia afterthe filters to improve particle removal whileminimizing DBP formation. Free residuals of2.0 mg/L in the filter effluent are common.These residuals with a filter bed contact timeof 10 to 15 minutes may meet the majority, ifnot all, of the CT requirement. The actualbasin volumes should be converted to effectivevolumes by applying factors described inTable 4-4 and discussed previously in thepost-disinfection procedure. Add the individ-ual effective volumes together to obtain thetotal effective pre-disinfection volume.
. Calculate a f/o w rate where the plant willachieve the required CT values for both pre-and post-disinfection using the formula below.Use this flow rate to project the pre- and post-disinfection system capability on the perform-ance potential graph.
Q (wm)=vpre (gal)
Treqpre tmin)
Where:
Q = Flow rate where required CT,,, can bemet.
vpre = Effective volume for pre-disinfectionunits.
vpost = Effective volume for post-disinfectionunits.
4.2.3 Identification and Prioritization ofPerformance Limiting Factors
423.1 Identification of Performance LimitingFactors
A significant aspect of any CPE is the identifica-tion of factors that limit the existing facility’s per-formance. This step is critical in defining thefuture activities that the utility needs to focus onto achieve optimized performance goals. To assistin factor identification, a list of 50 different fac-tors, plus definitions, that could potentially limitwater treatment plant performance are provided inAppendix E. These factors are divided into thefour broad categories of administration, design,operation, and maintenance. This list and defini-tions are based on the results of over 70 watertreatment plant CPEs. Definitions are provided forthe convenience of the user and also as a refer-ence to promote consistency in the use of factorsfrom plant to plant. If alternate names or defini-tions provide a clearer understanding to thoseconducting the CPE, they can be used. However,if different terms are used, each factor should bedefined, and these definitions should be madereadily available to others conducting the CPE andinterpreting the results. Adopting and using a listof standard factors and definitions as provided inthis handbook allows the effective comparison offactors identified from different plants which willenhance the usefulness of the findings forimproving water system performance on an area-wide basis.
It is noted that several of the design factors referto capability of major unit processes. If the majorunit process evaluation resulted in a Type 2 or 3classification for an individual unit process, theseresults are also indicated in the CPE findings as anidentified factor limiting the existing facility’s per-formance. This also applies to those situationswhere major unit processes are rated Type 1, buthave equipment-related problems that are limitingperformance. This would include key equipmentthat needs to be repaired and/or replaced.
A CPE is a performance-based evaluation and,therefore, factors should only be identified if theyimpact performance. An observation that a utilitydoes not meet a particular “industry standard”(e.g., utility does not have a documented preven-tive maintenance program or does not practicegood housekeeping) does not necessarily indicatethat a performance limiting factor exists in these
35

areas. An actual link between poor plant perform-ance and the identified factor must exist.
Properly identifying a plant’s unique list of factorsis difficult because the actual problems in a plantare often masked. This concept is illustrated inthe following example:
A review of plant records revealed that a con-ventional water treatment plant was periodicallyproducing finished water with a turbiditygreater than 0.5 NTU. The utility, assumingthat the plant was operating beyond its capa-bility, was beginning to make plans to expandboth the sedimentation and filtration unit proc-esses. Field evaluations conducted as part of aCPE revealed that settled water and finishedwater turbidities averaged about 5 NTU and0.6 NTU, respectively. Filtered water tur-bidities peaked at 1.2 NTU for short periodsfollowing a filter backwash. Conceivably, theplant’s sedimentation and filtration facilitieswere inadequately sized. However, furtherinvestigation revealed that the poor perform-ance was caused by the operator addingcoagulants at excessive dosages, leading toformation of a pin floe that was difficult to set-tle and filter. Additionally, the plant was beingoperated at its peak capacity for only 8 hourseach day, further aggravating the washout ofsolids from the sedimentation basins. It wasassessed that implementing proper processcontrol of the plant (e.g., jar testing for coagu-lant control, calibration and proper adjustmentof chemical feed) and operating the plant at alower flow rate for a longer time period wouldallow the plant to continuously achieve opti-mized finished water quality. When the opera-tor and administration were questioned aboutthe reasons that the plant was not operated forlonger periods of time, it was identified that itwas an administrative decision to limit the plantstaffing to one person. This limitation madeadditional daily operating time as well as week-end coverage difficult.
It was concluded that three major factors con-tributed to the poor performance of the plant:
1. Application of Concepts and Testing toProcess Control: Inadequate operatorknowledge existed to determine propercoagulant doses and to set chemical feedpumps to apply the correct chemical dose.
2. Administrative Policies: A restrictiveadministrative policy existed that prohibitedhiring an additional operator to allowincreased plant operating time at a reducedplant flow rate.
3. Process Control Testing: The utility hadinadequate test equipment and an inade-quate sampling program to provide processcontrol information.
In this example, pursuing the perceived limitationregarding the need for additional sedimentationand filtration capacity would have led to impropercorrective actions (i.e., plant expansion). The CPEindicated that addressing the identified operationaland administrative factors would allow the plant toproduce a quality finished water on a continuousbasis without major expenditures for construction.
This example illustrates that a comprehensiveanalysis of a performance problem is essential toidentify the actual performance limiting factors.The CPE emphasis of assessing factors in thebroad categories of administration, design, opera-tion, and maintenance helps to ensure the identifi-cation of root causes of performance limitations.The following sections provide useful observationsin identifying factors in these broad categories.
Identification of Administrative Factors
For purposes of a CPE administrative personnel arethose individuals who can exercise control overwater treatment but do not work “on-site” at theplant on a day-to-day basis. This definitionincludes personnel with job titles such as: off-sitesuperintendents, Directors of Public Works, coun-cil personnel, mayors, etc.
The identification of administrative performancelimiting factors is a difficult and subjective effort.Identification is primarily based on interpretation ofmanagement and staff interview results. Typi-cally, the more interviews that can be conductedthe better the interpretation of results will be. Insmall plants the entire staff, budgetary personnel,and plant administrators, including a minimum ofone or two elected officials, can be interviewed.In larger facilities all personnel cannot typically beinterviewed, requiring the CPE evaluator to selectkey personnel.
36

Interviews are more effective after the evaluatorhas been on a plant tour and has completedenough of the data development activities (includ-ing the performance assessment and major unitprocess evaluations) to become familiar with plantcapabilities and past performance. With thisinformation, the evaluator is better informed to askinsightful questions about the existing plant.Accurately identifying administrative factorsrequires aggressive but non-threatening interviewskills. The evaluator must always be aware of thisdelicate balance when pursuing the identificationof administrative factors.
Policies, budgeting, and staffing are key mecha-nisms that plant owners/administrators generallyuse to implement their objectives. Therefore,evaluation of these aspects is an integral part ofefforts to identify the presence of administrativeperformance limiting factors.
Policies:
In order for a utility to strive for optimized per-formance, there needs to be a commitment toexcellence in the form of supplying a high qualitytreated water. This commitment must be basedon an understanding of the importance of watertreatment to the protection of public health.Administrators must understand that to minimizethe potential for exposure of consumers to patho-genic organisms in their drinking water, all unitprocesses must be performing at high levels on acontinuous basis. Accordingly, administratorsshould develop goals for high quality water andshould emphasize to the operating staff the impor-tance of achieving these goals. Relative to par-ticulate removal, administrators should encouragepursuit of optimized performance goals asdescribed in this handbook.
Typically, all administrators verbally support goalsof low cost, safe working conditions; good plantperformance; and high employee morale. Animportant question that must be answered is, “Ispriority given to water quality?” Often administra-tors are more concerned with water quantity thanwater quality, and this question can be answeredby observing the items implemented or supportedby the administrators. If a multi-million dollarstorage reservoir project is being implementedwhile the plant remains unattended and neglected,priorities regarding water quality and quantity canbe easily discerned.
An ideal situation is one in which the administra-tors function with the awareness that they wantto achieve high quality finished water as the endproduct of their treatment efforts. At the otherend of the spectrum is an administrative attitudethat “We just raised rates last year, and we aren’twilling to pursue additional revenues. Besides myfamily used to drink untreated water from the riverand no one ever got sick.” Also, plant administra-tors may emphasize cost savings as a priority toplant staff. The staff may be told to keep chemi-cal cost down and to cut back if the finished waterturbidity falls below the regulated limit (i.e.,0.5 NTUI. For instance, one administrator indi-cated to a plant superintendent that he would befired if he did not cut chemical costs. Administra-tors who fall into this category usually are identi-fied as contributing to inadequate performanceduring an administrative assessment.
Another area in which administrators can signifi-cantly, though indirectly, affect plant performanceis through personnel motivation. A positive influ-ence exists if administrators: encourage personaland professional growth through support of train-ing; encourage involvement in professional organi-zations; and provide tangible rewards for pursuingcertification. If, however, administrators eliminateor skimp on essential operator training, downgradeoperator or other positions through substandardsalaries, or otherwise provide a negative influenceon staff morale, administrators can have a signifi-cant detrimental effect on plant performance.
When the CPE evaluator finds that the operationsstaff exhibit complacency, the role of the utility’smanagement in this situation needs to beassessed. Utility management must support de-velopment of a work environment that generates acommitment to excellence as the best defenseagainst complacency. This requires involvementof the entire utility to create an empowered staffthat can effectively respond to changing condi-tions.
Utility administrators also need to be aware of theimpact that their policies have on treatment plantperformance. For example, at one small utility thecity manager forbid the plant operators to back-wash filters more than once a week becauseoperating the backwash pump caused excessivepower demand and increased the utility’s powerbill. This administrative policy’s negative impacton plant performance is obvious.
37

When a plant is using key process equipment(e.g., filter rate controllers) that appear to be anti-quated and are impacting plant performance cur-rently or potentially longlterm, concerns with plantreliability must be assessed. In these cases theutility administrator’s role in ‘influencing the plantto use the antiquated equipment past its useful lifeshould be determined. For example, utility admin-istrators may have delayed replacement of the keyequipment way beyond its useful life becausethere was no immediate problem and they wantedto keep the utility’s budget low. Identification ofthis situation would be used to support an admin-istrator’s policies factor limiting performance.
Budgeting:
Minor plant modifications to address performanceproblems identified by the utility staff can oftenserve as a basis for assessing administrative fac-tors limiting performance. For example, the plantstaff may have correctly identified needed minormodifications for the facility and presented theseneeds to the utility manager, but had theirrequests declined. The CPE evaluator must solicitthe other side of the story from the administratorsto see if the administration is indeed non-supportive in correcting the problem. There havebeen numerous instances in which operators orplant superintendents have convinced administra-tors to spend money to “correct” problems thatresulted in no improvement in plant performance.
Smaller utilities often have financial informationcombined with other utilities, such as wastewatertreatment, street repairs, and parks and recreation.Additionally, nearly every utility’s financial infor-mation is set up differently. Therefore, it is neces-sary to review information with the assistance ofplant and/or budgetary personnel to rearrange theline items into categories understood by theevaluator. Forms for comprehensively collectingplant information, including financial information,have been developed and are included in Appen-dix F.
When reviewing financial information, it is impor-tant to determine the extent of bond indebtednessof the community and whether the rate structurecreates sufficient revenue to adequately supportthe plant, Water system revenues should providean adequate number of fairly paid staff and exceedexpenditures enough to allow establishment of areserve fund for future plant modifications. Crite-ria for determining key financial ratios for a utility
and guidance on their use are included inAppendix F.
Staffing:
Administrators can directly impact performance ofa plant by providing inadequate staffing levelssuch that there is not an operator at the plantwhen it is in operation. Inadequate plant coverageoften results in poor performance since no one isat the plant to adjust chemical dosages relative toraw water quality changes. Non-staffed plantoperation can sometimes be justified if remotemonitoring associated with performance parame-ters and alarm and plant shutdown capabilityexists.
Identification of Desian Factors
Data gathered during a plant tour, review of plantdrawings and specifications, completion of designinformation forms in Appendix F, and the com-pleted evaluation of major unit processes, includ-ing the performance potential graph, provideinformation needed to assess design-related per-formance limiting factors. Typically, the identifica-tion of design factors falls into two categories:major unit process limitations, as indicated by theperformance potential graph, and other design fac-tors indicated in the list in Appendix E.
When considering identifying major unit processlimitations, the evaluator needs to exercise a greatdeal of judgment since identification of these fac-tors directs the utility toward construction alter-natives. If at all possible, the evaluator shouldassess options for operational alternatives (e.g.,lower plant loading during periods where the rawwater quality is poor or extended operational timeto bring loading more in-line with assessed capa-bility). This emphasis is especially true for Type 2unit processes.
When the CPE evaluator has concerns with plantreliability because the plant is using antiquatedprocess equipment, the root cause of the reliabilitymust be assessed beyond just identifying this as adesign factor. Typically, a reliability issue fromuse of antiquated equipment is an administrativefactor. In rare cases preventive maintenance pro-grams can lead to reliability problems.
Frequently, to identify design factors the evaluatormust make field evaluations of the various unit
38

processes to assess design limitations. Identifica-tion of these factors often offers great potential toimprove facility performance (e.g., baffling ofbasins or improvement of flow splitting). Fieldevaluations will be discussed later in this chapter.It is important to note that any field evaluationsundertaken during a CPE should be completed incooperation with the plant staff. This approach isessential since the evaluator may wish to makechanges that could improve plant performance butcould be detrimental to equipment at the plant.Plant staff have worked and maintained theequipment, are familiar with control systems, andare in the best position to ascertain any adverseimpact of proposed changes.
Identification of Ooerational Factors
The approach and methods used in maintainingprocess control can significantly affect perform-ance of plants that have adequate physical facili-ties (3,7). As such, identification of operationally-based performance limiting factors offers thegreatest potential in improving the performance ofan existing utility. Information for identifying thepresence or absence of operational factors isobtained throughout the CPE activities andincludes the plant tour, interviews, and the fieldevaluation activities.
A plant tour provides an opportunity to initiallyassess process control efforts. For example, theprocess control capability of an operator can besubjectively assessed during a tour by noting if theoperator discusses the importance of processadjustments that are made to correlate withchanges in raw water quality. A solid foundationfor a viable process control program exists if theoperator presents this key information.
It is also important to assess issues of compla-cency and reliability with respect to the staff’sprocess control capabilities. It is especially criticalto determine if all of the staff have the requiredprocess control skills or if plant reliability is jeop-ardized because only one person can make proc-ess control decisions. Causes for this situationcould be administrative policies, staff technicalskills, or supervisory style.
After the tour, the focus of the identification ofoperational factors is the assessment of the util-ity’s process control testing, data interpretation,and process adjustment techniques. Key processcontrols available to a water treatment plant
39
operator are flow rate; number of basins in serv-ice; chemical selection and dosage; and filterbackwash frequency, duration and rate. Othercontrols include flocculation energy input andsedimentation sludge removal. Process controltesting includes those activities necessary to gaininformation to make decisions regarding availableplant controls. Information to assist in evaluatingprocess control testing, data interpretation, andprocess adjustment efforts is presented below.
Plant Flow Rate and Number of Basins in Service:
Plant flow rate dictates the hydraulic loading rateon the various plant unit processes. In plants thatoperate 24 hours each day, water demand dictateswater production requirements. However, manysmall plants operate at maximum flow rates forshort (e.g., &hour) periods of time. Also, someplants have multiple treatment trains, and flexi-bility exists to vary the number in service. If theoperator is not aware that operating for longerperiods of time at a lower flow rate or increasingthe number of trains in service could improve plantperformance, an operations factor may be indi-cated. Rapid increases in plant flow rate can alsohave a significant effect on plant performance byforcing particles through the filters.
Chemical Dose Control:
Chemical coagulants and flocculant and filter aidsare utilized to neutralize charges on colloidal parti-cles and to increase the size and strength of parti-cles to allow them to be removed in sedimentationand filtration unit processes. Either overdosing orunderdosing these chemicals can result in a failureto destabilize small particles, including pathogens,and allow them to pass through the sedimentationand filtration processes. If disinfection is inade-quate to eliminate the pathogens that pass throughthe plant, a significant public health risk exists.Chemicals used for stabilization, disinfection, tasteand odor control, and fluoridation must also becontrolled.
The following are common indicators that properchemical application is not practiced:
l Calibration curves are not available for chemi-cal feed pumps.

Operations staff cannot explain how chemi-cals, such as polymers, are diluted prior toapplication.
Operations staff cannot calculate chemicalfeed doses (e.g., cannot convert a mg/Ldesired dose to lb/day or ml/min to allowproper setting of the chemical feeder).
Operations staff cannot determine the chemi-cal feeder setting for a selected dose role.
Operations staff do not adjust chemical feedrates for varying raw water quality conditions.
Chemicals are utilized in combinations thathave detrimental effects on plant performance.An example is the practice of feeding lime andalum at the same point without considerationof the optimum pH for alum coagulation.
Chemicals are not fed at the optimum location(e.g., non-ionic polymer fed before rapid mixunit).
Chemical feed rates are not changed whenplant flow rate is adjusted.
Chemical coagulants are not utilized when rawwater quality is good (e.g., less than 0.5 to1 NTU).
Filter Control:
The effectiveness of the filtration unit process isprimarily established by proper coagulant control;however, other factors, such as hydraulic loadingrate and backwash frequency, rate, and duration,also have a significant effect on filter performance.Filters can perform at relatively high filtration rates(e.g., 8 gpm/ft*) if the water applied is properlyconditioned (1 1, 12). However, because particlesare held in a filter by relatively delicate forces,rapid flow rate changes can drive particles througha filter, causing a significant degradation in per-formance (7, 11, 12). Rapid rate changes can becaused by increasing plant flow, by bringing a highvolume constant rate pump on-line, by a malfunc-tioning filter rate control valve, or by removing afilter from service for backwashing without reduc-ing overall plant flow.
Filters must be backwashed periodically to preventaccumulated particles from washing through thefilter or to prevent the filter from reaching terminal
headloss. Filters should be backwashed based oneffluent turbidity if breakthrough occurs beforeterminal headloss to prevent the production ofpoor filtered water quality. Backwash based onheadloss should be a secondary criteria. Forexample, particles that are initially removed by thefilter are often “shed” when velocities and shearforces increase within the filter as headloss accu-mulates as the filter becomes “dirty.” This signifi-cant breakthrough in particles can be prevented bywashing a filter based on turbidity or particlecounting. Also, inadequate washing, both interms of rate and duration, can result in an accu-mulation of particles in the filter, resulting in poorfiltered water quality. When a filter is continuallyreturned to service with a significant amount ofparticles still within the media, these particles canaccumulate to form mudballs. The accumulationof mudballs displaces filter surface area and raisesthe filtration rate through those areas of the filterwhere water can still pass. The filter can alsoreach a point where minimal additional particlescan be removed because available storage siteswithin the media already have an accumulation offiltered particles. The evaluator must determinewhether inadequate washing is caused by a designor an operational limitation. Field evaluations,such as bed expansion and rise rate, that can beconducted to determine the capability of backwashfacilities are discussed later in this chapter.
Another key process control activity is returning afilter to service following a backwash. Since start-up of filters can often result in loss of particles andhigh turbidities, process control practices shouldbe developed to minimize this impact on perform-ance. Operational practices that have providedimproved quality from filters during start-up haveincluded: ramping the backwash rate down inincrements to allow better media gradation, restinga filter after backwash for several minutes or up toseveral hours before putting the filter in service,adding a polymer to the backwash water, andslowly increasing the hydraulic loading on the filteras it is brought back on line. These process con-trol practices should be implemented and observedat each utility to develop the optimum combinationof activities that provides the best filter perform-ance.
The following are common indicators that properfilter control is not practiced:
l Filters are started dirty (i.e., without back-washing).
40

Rapid increases in overall plant flow rate aremade without consideration of filtered waterquality.
Filter to waste capability is not being utilizedor is not monitored if utilized.
Filters are removed from service withoutreducing plant flow rate, resulting in the totalplant flow being directed to the remaining fil-ters.
Operations staff backwash the filters withoutregard for filter effluent turbidity.
Operations staff backwash at a low rate for alonger period of time, or stop the backwashwhen the filter is still dirty to “conserve”water.
Filters have significantly less media than speci-fied, damage to underdrains or support grav-els, or a significant accumulation of mudballs;and these conditions are unknown to the oper-ating staff because there is no routine exami-nation of the filters.
Operations staff cannot describe the purposeand function of the rate control device.
Process Control Activities:
It is necessary for the operations staff to developinformation from which proper process adjust-ments can be made. As a minimum, a method ofcoagulation control must be practiced, such as jartesting. Samples of raw water, settled water, andindividual filter effluent should be monitored forturbidity. Operations staff that properly under-stand water treatment should be able to show theevaluator a recorded history of raw, settled, andfiltered water quality and jar test results; and beable to describe how chemical dosages are deter-mined and calculated and how chemical feedersare set to provide the desired chemical dose.They should also be able to explain how chemicalfeed rates are adjusted, depending on raw waterquality.
Two similar factors are described in Appendix Ewhich often are difficult to discern when identify-ing operational factors: Water Treatment Under-standing and Application of Concepts and Testingto Process Control. Identification of the properfactor is key since follow-up efforts to address
41
each factor are different. Water Treatment Under-standing is identified when the technical skills ofthe staff are not adequate to implement properprocess control procedures. This limitation wouldrequire training in the fundamentals of watertreatment. Application of Concepts and Testing toProcess Control is identified if the staff have basictechnical skills but are not appropriately applyingtheir knowledge to the day-to-day process controlof the unit processes. This factor can often bebest addressed with site-specific hands-on train-ing.
The following are common indicators that requiredprocess control activities are not adequatelyimplemented at a plant:
.
.
.
.
.
.
.
.
.
l
Specific performance objectives for each majorunit process (barrier) have not been estab-lished.
A formalized sampling and testing schedulehas not been established.
Data recording forms are not available or notused.
Jar tests or other methods (e.g., streaming ’current monitor, zeta potential, or pilot filter)of coagulation control are not practiced.
The operator does not understand how toprepare a jar test stock solution or how toadminister various chemical doses to the jars.
The staff collects one sample per day for rawwater turbidity despite a rapidly .changing rawwater source.
Settled water turbidities are not measured orare not measured routinely (e.g., minimum ofonce each shift).
Individual filtered water quality is not moni-tored.
Recycle water quality is not monitored or itsimpact on plant performance is not controlled(e.g., intermittent high volume recycle pump-ing).
Raw water used in jar testing does not includerecycle streams.

l There are no records available which documentperformance of the individual sedimentation orfiltration unit processes.
. Performance following backwash is not moni-tored or recorded.
l Recorded data are not developed or interpreted(e.g., trend charts are not developed forassessing unit process performance).
l Calibration and other quality control proce-dures are not practiced.
l An emergency response procedure has notbeen developed for the loss of chemical feedsor for unacceptable finished water qualityoccurrences.
Other Controls:
Other controls available to the operations staffinclude rapid mixing, flocculation energy ‘input,sedimentation sludge removal, and disinfectioncontrol. The following are indicators that thesecontrols are not fully utilized to improve plant per-formance:
The rapid mixer is shut down (e.g., to con-serve power) and no other means exists toeffectively mix coagulant chemicals with rawwater (e.g., through a pump or prior to avalve).
Variable speed flocculation drives are notadjusted (e.g., they remain at the settingestablished when the plant was constructed).
There is no routine removal of sludge fromsedimentation basins.
There is no testing to control sludge quantitiesin an upflow solids contact clarifier (e.g., rou-tine sludge withdrawal is not practiced).
Clearwell or disinfection contact basin levelsare not monitored or maintained above a mini-mum level to ensure that CT values can bemet.
Identification of Maintenance Factors
Maintenance performance limiting factors are typi-cally associated with limitations in keeping critical
pieces of equipment running to ensure optimumunit process performance or with reliability issuesrelated to a lack of ongoing preventive mainte-nance activities.
Maintenance performance limiting factors areevaluated throughout the CPE by data collection,observations, and interviews concerning reliabilityand service requirements of pieces of equipmentcritical to plant performance. If units are out ofservice routinely or for extended periods of time,maintenance practices may be a significant con-tributing cause to a performance problem. Forexample, key equipment, such as chemical feed-ers, require back-up parts and on-site skills forrepair to ensure their continued operation.Another maintenance limitation could be a smallerraw water pump that was out of service for anextended period of time. In this example, the staffmay be forced to use a larger raw water pumpthat overloads the existing unit processes duringperiods of poor raw water quality.
Another key distinction to make when trying toidentify maintenance factors is to assess the qual-ity of the preventive maintenance program relativeto the reliability of the equipment due to age.Many utilities have excellent maintenance pro-grams and personnel that have kept equipmentrunning long beyond its useful/reliable lifetime. Inthese cases frequent breakdowns of the agingequipment can lead to performance problems.However, the root cause of the performance limi-tation may be plant administrators that have madea decision to forego the costs of replacement andcontinue to force the plant to rely on the oldequipment. In this example, the CPE evaluatormust identify whether the lack of reliability is dueto poor maintenance or is an attitude related to theadministration staff.
4.2.3.2 Prioritization of Performance LimitingFactors
After performance limiting factors are identified,they are prioritized in order of their adverse impacton plant performance. This prioritization estab-lishes the sequence and/or emphasis of follow-upactivities necessary to optimize facility perform-ance. For example, if the highest ranking factors(Le., those having the most negative impact onperformance) are related to physical limitations inunit process capacity, initial corrective actions aredirected toward defining plant modifications andobtaining administrative funding for their
42

implementation. If the highest ranking factors areprocess control-oriented, initial emphasis of follow-up act iv i t ies would be directed toward plant-specific operator training.
Prioritization of factors is accomplished by a two-step process, First, all factors that have beenidentified are individually assessed with regard totheir adverse impact on plant performance andassigned an “A”, “B” or “C” rating (Table 4-5).The summary of factors in Appendix E includes acolumn to enter this rating. The second step ofprioritizing factors is to list those receiving “A”rating in order of severity, followed by listingthose receiving “B” rating in order of severity.“C” factors are not prioritized.
Table 4-5. Classification System for PrioritizingPerformance Limiting Factors
Rating Classification
A Major effect on a long term repetitivebasis
B Mpderate effect on routine basis or majoreffect on a periodic basis
C Minor effect
“A” factors are the major causes of performancedeficiencies and are the central focus of any sub-sequent improvement program. An example “A”factor would be an operations staff that has notdeveloped or implemented process control adjust-ments to compensate for changing raw waterquality.
Factors are assigned a “B” rating if they fall in oneof two categories:
1. Those that routinely contribute to poor plantperformance but are not the major problem.An example would be insufficient plant proc-ess control testing where the primary problemis that the operations staff does not sampleand test to determine process efficiency forthe sedimentation basins.
2. Those that cause a major degradation of plantperformance, but only on a periodic basis.Typical examples are sedimentation basins thatcause periodic performance problems due to
excessive loading during spring run-off or ashort flocculation detention time that limitsfloe formation during cold water periods.
Factors receive a “C” rating if they have a minoreffect on performance. For example, the lack oflaboratory space could be a “C” factor if sampleshad to be taken off-site for analysis. The problemcould be addressed through the addition of benchspace and, thus, would not be a major focusduring follow-up activities.
A particular factor can receive an “A”, “B”, or “C”rating at any facility, depending on the circum-stances. For example, a sedimentation basin couldreceive an “A” rating if its size was inadequate toproduce optimized performance under all currentloading conditions. The basin could receive a “B”rating if the basin was only inadequate periodi-cally, for example, during infrequent periods ofhigh raw water turbidity. The basin would receivea “C” rating if the size and volume were adequate,but minor baffling would improve the consistencyof its performance.
Typically, 5 to 10 unique factors are identified fora particular CPE. The remaining factors that arenot identified as performance limiting represent asignificant finding. For example, in the illustrationthat was previously presented in the Identificationof Performance Limiting Factors section of thischapter, neither sedimentation nor filtration wereidentified as performance limiting factors. Sincethey were not identified, plant personnel need notfocus on sedimentation basin or filter modifica-tions and the associated capital to upgrade thesefacilities, Factors that are not identified are also abasis for providing recognition to plant personnelfor adequately addressing these potential sourcesof problems.
Once each identified factor is assigned an “A”,“B”, or “C” classification, those receiving “A” or“B” ratings are listed on a one-page summarysheet (see Appendix El in order of assessed sever-ity on plant performance. Findings that supporteach identified factor are summarized on an at-tached notes page. An example of a FactorsSummary Sheet and the attached notes is shownin Figure 4-6. The summary of prioritized factorsprovides a valuable reference for the next step ofthe CPE, assessing the ability to improve perform-ance, and serves as the foundation for imple-menting correction activities i f they are deemedappropriate.
4 3

All factors limiting facility performance may not beidentified during the CPE phase. it is often neces-sary to later modify the original corrective steps asnew and additional information becomes availableduring conduct of the performance improvementphase (CTA).
4.2.4 Assessment of the Applicability ofa CTA
Proper interpretation of the CPE findings is neces-sary to provide the basis for a recommendation topursue the performance improvement phase (e.g.,Chapter 5). The initial step in assessment of CTAapplicability is to determine if improved petform-ante is achievable by evaluating the capability ofmajor unit processes. A CTA is typically recom-mended if unit processes receive a Type 1 orType 2 rating. However, if major unit processesare deficient in capability (e.g., Type 3), ac-ceptable performance from each “barrier” may notbe achievable; and the focus of follow-up effortsmay have to include construction alternatives,Another important consideration with Type 3facilities is the immediate need for public healthprotection regardless of the condition of the plant.Even if a facility has serious unit process deficien-cies and antiquated equipment, the plant still has aresponsibility to protect public health until newtreatment processes are designed and constructed.in these situations every effort should be made,therefore, to operate around marginal unit proc-esses and unreliable equipment if it represents thebest short-term solution for providing safe drinkingwater. This concept is shown schematically in Fig-ure 4-7.
Although all performance limiting factors can theo-retically be eliminated, the ultimate decision toconduct a CTA may depend on the factors that areidentified during the CPE. An assessment of thelist of prioritized factors helps assure that ail fac-tors can realistically be addressed given the uniqueset of factors identified. There may be reasonswhy a factor cannot be approached in a straight-forward manner. Examples of issues that may notbe feasible to address directly are: replacement ofkey personnel, increases in rate structures, ortraining of uninformed or uncooperative adminis-trators to support plant needs. In the case ofrecalcitrant administrators who refuse to recognizethe importance of water quality and minimizingpublic health risk, regulatory pressure may be nec-essary before a decision is made to implement aCTA.
For plants where a decision is made to implementa CTA, all performance limiting factors should beconsidered as feasible to address. These are typi-cally corrected with adequate “training” of theappropriate personnel. The training is directedtoward the operations staff for improvements inplant process control and maintenance, toward theplant administrators for improvements in adminis-trative policies and budget limitations, and towardadministrators and operations staff to achieveminor facility modifications. Training, as used inthis context, describes activities whereby informa-tion is provided to facilitate understanding andimplementation of corrective actions.
4.2.5 WE Report
Results of a CPE are summarized in a brief writtenreport to provide guidance for utility staff and, insome cases, state regulatory personnel. It isimportant that the report be kept brief so thatmaximum resources are used for the evaluationrather than for preparation of an all-inclusivereport. The report should present sufficient infor-mation to allow the utility decision-makers to initi-ate efforts toward achieving desired performancefrom their facility. it should not provide a list ofspecific recommendations for correcting individualperformance limiting factors. Making specific rec-ommendations often leads to a piecemealapproach to corrective actions, and the goal ofimproved performance is not achieved. ForType 1 and Type 2 plants, the necessity of com-prehensively addressing the combination of factorsidentified by the CPE through a CTA should bestressed. For Type 3 plants, a recommendationfor a more detailed study of anticipated modifica-tions may be warranted. Appendix G demon-strates a sample CPE report.
4.3 Conducting a CPE
A CPE involves numerous activities conductedwithin a structured framework. A schematic ofCPE activities is shown graphically in Figure 4-8.Initial activities are conducted prior to on-siteefforts and involve notifying appropriate utilitypersonnel to ensure that they, as well as neces-sary resources, will be available during the CPE.The kick-off meeting, conducted on-site, allowsthe evaluators to describe forthcoming activities,to coordinate schedules, and to assess availabilityof the materials that will be required. Following
44

Figure 4-6. Example factors summary and supporting notes.
CPE PERFORMANCE LIMITING FACTORS SUMMARY
Plant Name/Location: XYZ Water Treatment Plant
CPE Performed By: Process Applications, Inc.
CPE Date: June 15 - 18, 1998
Plant Type: Conventional with mixed media filters
Source Water: Wolf Creek
Performance Summary:
Plant was not able to meet the Surface Water Treatment Rule turbidity requirement of 0.5 NTU95 percent of the time during March - May 1998. Optimized performance to achieve maximumpublic health protection from microbial contaminants by producing a filtered water turbidity of0.1 or less 95 percent of the time has not been achieved.
Ranking Table
Rank
1
2
3
4
5
Rating Performance Limiting Factor (Category)
A Alarm Systems (Design)
A Process Flexibility (Design)
A Policies (Administration)
A Application of Concepts and Testing to Process Control(Operation)
B Process Instrumentation/Automation (Design)
Rating DescriptionA - Major effect on long-term repetitive basis.B - Moderate effect on a routine basis or major effect on a periodic basis.c- Minor effect.
45

Figure 4-6. Example factors summary and supporting notes (continued).
Performance Limiting Factors Notes
Factor
Alarm Systems
Rating Notes
A l No alarm/plant shutdown capability on chlorine feed,chlorine residual, raw water turbidity, and finished waterturbidity.
Process Flexibility A . Inability to select plant flow rate (e.g., set at2,100 gpm).
. No ability to feed filter aid polymer to the filters.
. Inability to gradually increase and decrease backwashflow rate.
Policies A l Lack of established optimization goals (e.g., 0.1 NTUfiltered water turbidity) to provide maximum publichealth protection and associated support to achievethese performance goals.
Applications of Concepts andTesting to Process Control
A 9 No sampling of clarifier performance.
. inadequate testing to optimize coagulant type anddosages.
Process Instrumentation/Automation
. No individual filter turbidity monitoring.
. Starting “dirty” filters without backwash.
. Incomplete jar testing to optimize coagulant dose.
. Non-optimized feed point for flocculant aid addition.
B . No turbidimeters on individual filters.
. Start and stop of filters without backwash or filter-to-waste (due to storage tank demand).
. Location of raw water turbidity monitor cell resulting ininaccurate readings.
4 6

Figure 4-7. CPEKTA schematic of activities.
Regulators Recognize NeedTo Evaluate or Improve
Plant Performance
ModificationsFacility
ModificationsModificationsPlus CTAPlus CTAActivitiesActivities
Optimized PerformanceAchieved
the kick-off meeting, a plant tour is conducted bythe superintendent or process control supervisor.During the tour, the evaluators ask questionsregarding the plant and observe areas that mayrequire additional attention during data collectionactivities. For example, an evaluator might make amental note to investigate more thoroughly theflow splitting arrangement prior to flocculationbasins.
Following the plant tour, data collection activitiesbegin. Depending on team size, the evaluatorssplit into groups to facilitate simultaneous collec-tion of the administrative, design, operations,maintenance and performance data. After data arecollected, the performance assessment and themajor unit process evaluation are conducted. It isnoted that often the utility can provide the per-
*AbandonExisting
Facilities andDesign NewOnes Plus
CTAActivities-
formance data prior to the site visit. In this casethe performance graphs can be initially completedprior to the on-site activities. However, it isimportant to verify the sources of the samples andquality of the data during field efforts.
Field evaluations are also conducted to continue togather additional information regarding actual plantperformance and confirm potential factors. Onceall of this information is collected a series of inter-views are completed with the plant staff andadministrators. Initiating these activities prior tothe interviews provides the evaluators with anunderstanding of current plant performance andplant unit process capability, which allo,ws inter-view questions to be more focused on potentialfactors.
47

Figure 4-8. Schematic of CPE activities.
Initial Activities
Kick-Off Meeting
Location
Off-Site
L
Plant Tour
Data Collection Activities
AdministrationData
I
IDesignData
OperationsData
IMaintenance
DataPerformance
Data
I
Off-Site
4 8

After all information is ‘collected, the evaluationteam meets at a location isolated from the utilitypersonnel to review findings. At this meeting, fac-tors limiting performance of the plant are identifiedand prioritized and an assessment of the applica-bility of a follow-up CTA is made. The prioritizedlist of factors, performance data, field evaluationresults, and major unit process evaluation data arethen compiled and copied for use as handoutsduring the exit meeting. An exit meeting is heldwith appropriate operations and administrationpersonnel where all evaluation findings are pre-sented. Off-site activities include completing anddistributing the written report. A more detaileddiscussion of each of these activities follows.
4.3.7 Overview
A CPE is typically conducted over a three to five-day period by a team comprised of a minimum oftwo personnel. A team approach is necessary toallow a facility to be evaluated in a reasonabletime frame and for evaluation personnel to jointlydevelop findings on topics requiring professionaljudgment. Professional judgment is critical whenevaluating subjective information obtained duringthe on-site CPE activities. For example, assessingadministrative versus operational performance lim-iting factors often comes down to the evaluators’interpretation of interview results. The synergisticeffect of two people making this determination is akey part of the CPE process.
Table 4-6. Evaluation Team Capabilities
Because of the wide range of areas that are evalu-ated during a CPE, the evaluation team needs tohave a broad range of available skills. This broadskills range is another reason to use a teamapproach in conducting CPEs. Specifically, per-sons should have capability in the areas shown inTable 4-6.
Regulatory agency personnel with experience inevaluating water treatment facilities; consultingengineers who routinely work with plant evalua-tion, design and start-up; and utility personnelwith design and operations experience representthe types of personnel with appropriate back-grounds to conduct CPEs. Other combinations ofpersonnel can be used if they meet the minimumexperience requirements outlined above. Althoughteams composed of utility management and opera-tions personnel associated with the CPE facilitycan be established, it is often difficult for an inter-nal team to objectively assess administrative andoperational factors. The strength of the CPE isbest represented by an objective third partyreview.
4.3.2 Initial A c tivities
The purpose of the initial activities is to establishthe availability of the required personnel anddocumentation. To assure an efficient and com-prehensive evaluation, key utility personnel and
Technical Skills Leadership Skills
l Water treatment plant design l Communication (presenting, listening,interviewing)
l Water treatment operations and l Organization (scheduling, prioritizing)process control
. Regulatory requirements . Motivation (involving people, recognizing staffabilities)
. Maintenance l Decisiveness (completing CPE within time frameallowed)
. Utility management (rates, l Interpretation (assessing multiple inputs, makingbudgeting, planning) judgments)
49

specific information need to be available. Requiredinformation includes basic data on the plantdesign, staffing and performance. A letter shouldbe sent to the utility describing the schedule ofactivities that will take place and outlining thecommitment required of plant and administrativestaff. An example letter is presented in Appen-dix H. Topics that are discussed in the letter arepresented below.
4.3.2.1 Key Personnel
It is necessary to have key people available duringthe conduct of the CPE. The plant superintendent,manager or other person in charge of the watertreatment facility must be available. If differentpersons are responsible for plant maintenance andprocess control, their presence should also berequired. These individuals should be availablethroughout the three to five-day on-site activities.
A person knowledgeable about details of the utilitybudget must also be available. A one- to two-hourmeeting with this person will typically be requiredduring the on-site activities to assess the financialinformation. In many small communities, this per-son is most often the City Clerk; in small waterdistricts it may be the Chairman of the Board or apart-time clerk. In larger communities, the FinanceDirector, Utilities Director, or Plant Superintendentcan usually provide the required information.
Availability of key administrative personnel is alsorequired. In many small communities or waterdistricts, an operator or plant superintendent mayreport directly to the mayor or board chairman orto the elected administrative body (e.g., CityCouncil or District Board). In larger communities,the key administrative person is often the Directorof Public Works/Utilities, City Manager, or othernon-elected administrator. In all cases the admin-istrator(s) as well as representative elected offi-cials who have the authority to effect a change inpolicy or budget for the plant should be availableto participate in the evaluation. Typically thesepeople are needed for a one-half to three-quarterhour interview and to attend the kick-off and exitmeetings.
4.3.2.2 CPE Resources
Availability of specific utility and plant informationis required during a CPE. The following list of thenecessary items should be provided to the utility
contact for review at the kick-off meeting andbefore initiating on-site activities:
Engineering drawings and specifications whichinclude design information on the individualunit processes, and plant equipment.
A plant flow schematic.
Daily plant performance summaries showingthe results of turbidity measurements on raw,settled, and filtered water for the most recenttwelve-month period.
Financial information showing budgeted andactual revenues and expenditures (i.e., chemi-cals, salaries, energy, training), long-term debt,water rates and connection fees.
An organizational chart of the utility.
A list of utility staff members.
In addition to the information listed, meeting andwork rooms are required during the conduct of theCPE. A meeting room large enough for the evalua-tion team and utility personnel should be availablefor the kick-off and exit meetings. During theCPE, a somewhat private work room with a tableand electrical outlets is desirable. Two or threesmall rooms or offices are necessary for the indi-vidual interviews.
Some facilities do not have a sample tap availableon the effluent from each individual filter. If thesetaps are not available they should be requestedprior to the on-site activities. During the CPE,existing taps should be checked to see if they arefunctional. All taps both new and existing mustbe located at points that assure a continuous sam-ple stream that is representative of the filter efflu-ent.
4.3.2.3 Scheduling
A typical schedule for on-site CPE activities for asmall to medium-sized water treatment facility ispresented below:
l First Day - a.m. (travel)
l First Day - p.m.:
a Conduct kick-off meeting.
50

. Conduct plant tour.
. Set-up and calibrate continuous recordingturbidimeter (if available).
n Coordinate location of CPE resources.
l Second Day - a.m.:
. Compile data on plant performance,design, administration, operations andmaintenance.
l Second Day - p.m.:
. Continue data compilation.
. Develop performance assessment and per-formance potential graph.
l Third Day - a.m.:
n Conduct interviews with plant staff andutility officials.
. Conduct field evaluations.
l Third Day- p.m.:
. Shut down continuous recording turbi-dimeter (if available).
. Meet to identify and prioritize performancelimiting factors.
. Prepare materials for exit meeting.
l Fourth Day - a.m.:
n Conduct exit meeting.
. Meet to debrief and make follow-upassignments.
4.3.3 On-Site A c tivities
4.3.3.1 Kick-Off Meeting
A short (i.e., 30-minute) meeting between keyplant operations and administration staff and theevaluators is held to initiate the field work. Themajor purposes of this meeting are to present theobjectives of the CPE effort, to coordinate andestablish the schedule, and to initiate the adminis-trative evaluation activities. Each of the specific
activities that will be conducted during the on-siteeffort should be described. Meeting times forinterviews with administration and operations per-sonnel should be scheduled. Some flexibility withthe interview schedules should be requested sincetime for data development, which is essential priorto conducting interviews, is variable from facilityto facility. A sign-up sheet (see Appendix F) maybe used to record attendance and as a mechanismfor recognizing names. Information items thatwere requested in the letter should be reviewed toensure their availability during the CPE.
Observations that can contribute to the identifica-tion of factors are initiated during the kick-offmeeting. More obvious indications of factors maybe lack of communication between the plant staffand administration personnel or the lack of famili-arity with the facilities by the administrators.More subtle indications may be the priority placedon water quality or policies on facility funding.These initial perceptions often prove valuablewhen formally evaluating administrative factorslater in the CPE effort.
4.3.3.2 Plant Tour
A plant tour follows the kick-off meeting. Theobjectives of the tour include: 1 I familiarize theevaluation team with the physical plant; 21 make apreliminary assessment’of operational flexibility ofthe existing processes and chemical feed systems;and 3) provide a foundation for discussions onperformance, process control and maintenanceand continued observations that may indicate per-formance limiting factors. A walk-through tourfollowing the flow through the plant (i.e., sourceto clearwell) is suggested. Additionally, the tourshould include backwash and sludge treatmentand disposal facilities, and the laboratory andmaintenance areas. The evaluator should note thesampling points and chemical feed locations as thetour progresses.
The CPE evaluation is often stressful, especiallyinitially, for plant personnel. Consequently, duringthe conduct of a tour, as well as throughout theon-site activities, the evaluation team should besensitive to this situation. Many of the questionsasked by the evaluation team on the plant tour areasked again during formal data collection activities.The plant staff should be informed that this repeti-tiveness will occur. Questions that challenge cur-rent operational practices or that put plant person-nel on the defensive must be avoided. It is
51

imperative that the CPE evaluators create an open,non-threatening environment so that all of theplant staff feel free to share their perspective asvarious questions are asked. The evaluator shouldtry to maintain an information gathering posture atall times. It is not aporooriate to recommendchanges in facilities or operational practices duringthe plant tour or the conduct of on-site activities.This is often a challenge since the evaluation teamwill frequently be asked for an opinion. Handlethese requests by stating that observations of theCPE team will be presented at the conclusion ofthe on-site activities after all information is col-lected and analyzed.
The plant tour continues the opportunity for theevaluator to observe intangible items that maycontribute to the identification of factors limitingperformance (i.e., operator knowledge of the plantoperation and facilities, relationship of processcontrol testing to process adjustments, the qualityof the relationships between various levels, etc.).The tour also presents an opportunity to assessthe potential of using minor modifications toenhance current facility capability. Suggestions tohelp the evaluation team meet the objectives ofthe plant tour are provided in the following sec-tions.
Pretreatment facilities consist of raw water intakestructures, raw water pumps, presedimentationbasins and flow measurement equipment. Intakestructures and associated screening equipment canhave a direct impact on plant performance. Forexample, if the intake configuration is such thatscreens become clogged with debris or the intakebecomes clogged with silt, maintaining a consis-tent supply of water may be a problem. While atthe raw water source, questions should be askedregarding variability of the raw water quality,potential upstream pollutant sources, seasonalproblems with taste and odors, raw water quantitylimitations, and algae blooms.
Presedimentation facilities are usually only foundat water treatment plants where high variability inraw water turbidities occurs. If plants areequipped with presedimentation capability, basininlet and outlet configurations should be noted,and the ability to feed coagulant chemicals shouldbe determined. Typically, most presedimentationconfigurations lower turbidities to a consistentlevel to allow conventional water treatment plants
to perform adequately. If presedimentation facili-ties do not exist, the evaluator must assess thecapability of existing water treatment unit proc-esses to remove variable and peak raw water tur-bidities.
Raw water pumping should be evaluated regardingthe ability to provide a consistent water supplyand with respect to how many pumps are oper-ated at a time. Frequent changing of high volumeconstant speed pumps can cause significanthydraulic surges to downstream unit processes,degrading plant performance. In addition, opera-tional practices as they relate to peak flow rates,peak daily water production, and plant operatinghours should be discussed to assist in defining thepeak instantaneous operating flow rate.
Flow measurement facilities are important to accu-rately establish chemical feed rates, wash waterrates, and unit process loadings. Questionsshould also be asked concerning location, mainte-nance, and calibration of f low measurementdevices. Discussions of changes in coagulantdosages with changes in plant flow rate are alsoappropriate at this stage of the tour.
Mixins/Flocculation/Sedimentation
Rapid mixing is utilized to provide a completeinstantaneous mix of coagulant chemicals to thewater. The coagulants neutralize the negativecharges on the colloidal particles allowing them toagglomerate into larger particles during the gentlemixing in the flocculation process. These heavierparticles are then removed by settling in the quies-cent area of the sedimentation basin. Thesefacilities provide the initial barrier for particleremoval and, if properly designed and operated,reduce the particulate load to the filters, allowingthem to “polish” the water. During the tour,observations should be made to determine if themixing, flocculation, and sedimentation unit proc-esses are designed and operated to achieve thisgoal. The evaluators should also observe flowsplitting facilities and determine if parallel basinsare receiving equal flow distribution.
Rapid mix facilities should be observed to deter-mine if adequate mixing of chemicals is occurringthroughout the operating flow range. The opera-tor should be asked what type of coagulants arebeing added and what process control testing isemployed to determine their dosage. Observationsshould be made as to the types of chemicals that
52

are being added together in the mixing process.For example, the addition of alum and lime at thesame location may be counter-productive if noconsideration is given to maintaining the optimumpH for alum coagulation. If coagulant chemicalsare added without mixing, observations should bemade as to possible alternate feed locations, suchas prior to valves, orifice plates or hydraulicjumps, where acceptable mixing migh t beachieved.
When touring flocculation facilities, the evaluatorshould note inlet and outlet conditions, number ofstages, and the availability of variable energyinput. Flocculation facilities should be baffled toprovide even distribution of flow across the basinand to prevent velocity currents from disruptingsettling conditions in adjacent sedimentationbasins. If multiple stages are not available, thecapability to baffle a basin to create additionalstaging should be observed. The ability to feedflocculation aids to the gentle mixing portion ofthe basin should be noted. The operator should beasked how often flocculation energy levels areadjusted or if a special study was conducted todetermine the existing levels. In the case ofhydraulic flocculation, the number of stages, theturbulence of the water, and the condition of thefloe should be noted to determine if the unit proc-ess appears to be producing an acceptable floe.For upflow solids contact units, questions con-cerning control of the amount of solids in the unitand sludge blanket control procedures should beasked.
Sedimentation basin characteristics that should beobserved during the tour include visual observa-tions of performance and observations of physicalcharacteristics such as configuration and depth.Performance observations include clarity of settledwater, size and appearance of floe, and presenceof flow or density currents. The general configu-ration, including shape, inlet conditions, outletconditions, and availability of a sludge removalmechanism should be observed. Staff should beasked about process control measures that areutilized to optimize sedimentation, including sludgeremoval.
Chemical Feed Facilities
A tour of the chemical feed facilities typicallyrequires a deviation from the water flow scheme inorder to observe this key equipment. Often allchemical feed facilities are located in a central
location that supplies various chemicals to feedpoints throughout the plant. Chemical feed facili-ties should be toured to observe the feed pumps,day tanks, bulk storage facilities, flow pacingfacilities, and chemical feeder calibration equip-ment. Availability of backup equipment to ensurecontinuous feeding of each chemical during plantoperation should also be observed.
Filtration
Filters represent the key unit process for theremoval of particles in water treatment. Carefulobservation of operation and control practicesshould occur during the tour. The number andconfiguration of filters should be noted, includingthe type of filter media. The filter rate controlequipment should be observed and discussed toensure that it regulates filter flow in an even, con-sistent manner without rapid fluctuations. Theflow patterns onto each filter should be noted tosee if there is an indication of uneven flow to indi-vidual filters. Backwash equipment, includingpumps and air compressors, should be noted. Theavailability of back-up backwash pumping is desir-able to avoid interruptions in treatment if a break-down occurs.
The operator should be asked how frequently fil-ters are backwashed and what process controlprocedures are used to determine when a filtershould be washed. Since turbidity represents anindication of particles in the water, it should be theparameter utilized to initiate a backwash unlessthe plant has on-line particle counters. The opera-tor’s response to this inquiry helps to demonstratehis understanding and priorities concerning waterquality.
The tour guide should also be questioned con-cerning the backwash procedure and asked if alloperators follow the same technique. Theevaluation team should determine if filter to wastecapability exists and, if so, how it is controlled.Questions concerning individual filter monitoringshould also be asked. The availability of turbidityprofiles following backwash should be determined.Some facilities utilize particle counting to assessfilter performance, and the availability of thismonitoring tool should be determined during theplant tour.
The tour is an excellent time to discuss the selec-tion of a filter and the location of the samplingpoint for continuous turbidity monitoring to be
53

conducted during the field evaluation activities.Ideally, the filter that is most challenged to pro-duce high quality water should be monitored bythe evaluation team. Often, the operational staffwill be able to quickly identify a “problem filter.”
Disinfection
The evaluation team should tour disinfection facili-ties to become familiar with the equipment feedpoints and type of contact facilities. Special atten-tion should be given to the configuration and baf-fling of clearwells and finished water reservoirsthat provide contact time for final disinfection.Observation of in-line contact time availabilityshould be made by noting the proximity of the“first user” to the water treatment plant. Often,distribution piping cannot be used in the assess-ment of contact time since the plant staff repre-sents the first user.
The availability of back-up disinfection equipmentshould be determined to assess the capability ofproviding an uninterrupted application of disinfec-tant. The addition of a disinfectant prior to filtra-tion, either as an oxidizing agent or disinfectant,should also be noted. The capability to automati-cally control the disinfection systems by flowpacing should be determined.
Backwash Water and Sludae Treatment andDisoosal
The location of any recycle streams should beidentified during the tour. Recycle of water shouldbe assessed with respect to the potential forreturning a high concentration of cysts to the plantraw water stream. Since this practice represents apotential risk, the evaluator should determine themethod of treatment or other methods used tohandle the impact of recycle streams (e.g., storagefor equalization of flows with continuous return oflow volumes of recycle to the raw water). It isalso important to assess if plant piping allows col-lection of a representative sample of recycle to beused in jar tests to determine coagulant dose.
Typically, the main sources of recycle flows arethe settled filter backwash water and sedimenta-tion basin sludge decant. If these streams are dis-charged to a storm sewer system or a waterway,questions should be asked to determine if the dis-charge is permitted and if permit requirements arebeing complied with. If recycle treatment facilities
exist, questions should be asked to determine themethod of controlling the performance of thesefacilities.
Laboratory
The laboratory facilities should be included as partof the plant tour. Source water and performancemonitoring, process control testing, and qualitycontrol procedures should be discussed with labo-ratory personnel. It is especially important todetermine if turbidity measurements representactual plant performance. The use of laboratoryresults should be discussed and a review of thedata reporting forms should also be made. Thelaboratory tour also offers the opportunity toassess the availability of additional plant data thatcould be used to assess plant performance (e.g.,special studies on different coagulants, individualturbidity profiles), Available analytical capabilityshould also be noted. An assessment should alsobe made if all of the analytical capability resides inthe laboratory and, if so, does the operations staffhave sufficient access to make process controladjustments?
Maintenance
A tour of the maintenance facilities provides anopportunity to assess the level of maintenancesupport at the plant. Tools, spare parts availa-bility, storage, filing systems for equipment cata-logues, general plant appearance, and condition ofequipment should be observed. Questions on thepreventive maintenance program, including meth-ods of initiating work (e.g., work orders), areappropriate. Equipment out of service should alsobe noted.
4.3.3.3 Data Collection Activities
Following the plant tour, data collection proce-dures are initiated. Information is collectedthrough discussions with plant and administrativestaff utilizing a formalized data collection format asshown in Appendix F. Categories covered bythese forms are listed below:
l Kick-Off Meeting
l Administration Data
l Design Data
54

l Operations Data
l Maintenance Data
l Field Evaluation Data
. Interview Guidelines
l Exit Meeting
When collecting information requested on theforms, the evaluation team should solicit the par-ticipation of the most knowledgeable person ineach of the evaluation areas. For example, thosepersons actually implementing the maintenanceactivities should be included in the maintenancedata collection efforts.
When collecting information, the evaluator shouldbe aware that the data are to be used to evaluatethe performance capability of the existing facilities.The evaluator should continuously be asking “Howdoes this information affect plant performance?“.If the area of inquiry appears to be directly relatedto plant performance, the evaluator should spendsufficient time to fully develop the information.Often this pursuit of information will go beyondthe constraints of the forms. In this way, some ofthe most meaningful information obtained is “writ-ten on the back of the forms.”
4.3.3.4 Evaluation of Major Unit Processes
An evaluation of the plant’s major unit processesis conducted to determine the performance poten-tial of existing facilities at peak instantaneousoperating flow. This is accomplished by develop-ing a performance potential graph and rating themajor unit processes as Type 1, 2, or 3, as previ-ously discussed in 4.2.2 Evaluation of Major UnitP r o c e s s e s .
It is important that the major unit process evalua-tion be conducted early during the on-site activi-ties, since this assessment provides the evaluatorwith the knowledge of the plant’s treatment capa-bility. If the plant major unit processes are deter-mined to be Type 1 or 2 and they are not per-forming at optimum levels, then factors in theareas of administration, operation or maintenanceare likely contributing to the performance prob-lems. The completed major unit process assess-ment aids the evaluation personnel in focusinglater interviews and field evaluations to identifythose performance limiting factors.
4.3.3.5 Performance Assessment
An assessment of the plant’s performance is madeby evaluating existing recorded data and by con-ducting field evaluations to determine if unit proc-ess and total plant performance have been opti-mized. Typically, the most recent twelve monthsof existing process control data is evaluated andgraphs are developed to assess performance of theplant. Additional data (e.g., backwash turbidityprofiles, particle counting data, individual filter 24-hour continuous turbidimeter performance) can bedeveloped if they aid in the determination of theexisting plant performance relative to optimizedgoals. Evaluations are also conducted during theperformance assessment activities to determine ifexisting plant records accurately reflect actualplant-treated water quality. Calibration checks onturbidimeters or a review of quality control proce-dures in the laboratory are part of these evalua-tions.
It is conceivable that a public health threat couldbe indicated by the data during the development ofthe data for the performance assessment compo-nent. The CPE evaluation team will have to handlethese situations on a case-by-case basis. Animmediate discussion of the potential threat shouldbe conducted with the plant staff and administra-tion and they should be encouraged to contact theappropriate regulatory agency. Voluntary actionssuch as plant shut-down or a voluntary boil waternotice should also be discussed. It is importantthat the CPE evaluation team not assume respon-sibility for the process adjustments at the plant.
Another key part of the performance assessmentis the use of a continuous recording turbidimeterduring the conduct of the on-site activities. Thiseffort will be further described in the next sectionof this chapter. A detailed discussion of themethods utilized in the performance assessmentwas presented previously in the Assessment ofPlant Performance section of this chapter.
4.3.3.6 Field Evaluations
Field evaluations are an important aspect of theon-site activities. Typically, field evaluations areconducted to verify accuracy of monitoring andflow records, chemical dosages, record drawings,filter integrity, and backwash capability. Forms toassist in the documentation of the data collected
55

during field evaluations have been included inAppendix F.
Performance monitoring records can be verified byutilizing a continuous recording turbidimeter toassess an individual filter’s performance over atwenty-four hour period. A backwash cycle isconducted during this monitoring effort. It isimportant that the evaluation team acquire or havemade available to them a properly calibrated tur-bidimeter to support this field effort. If a recordingon-line turbidimeter is not available, an instrumentthat allows individual analysis of grab samples canbe used. If the evaluation team does not haveaccess to a turbidimeter, the plant’s turbidimeter,which must be calibrated prior to the sampling andtesting activities, can be used.
Treated water quality obtained from the fieldevaluation can be compared with recorded data tomake a determination if performance monitoringrecords accurately represent treated water quality.Differences in actual versus recorded finishedwater quality can be caused by sampling location,sampling time, sampling procedures, and testingvariations. The evaluation team’s instrument canalso be used to assess the plant’s turbidimeter andcalibration techniques.
The accuracy of flow records can be verified byassessing the calibration of flow measurementequipment. This is often difficult because of thetype of meters utilized (e.g., propeller, venturi,magnetic). If these types of meters are utilized, itmay be necessary to require a basin to be filled ordrawn down over a timed period to accuratelycheck the metering equipment. If accuracy ofmetering equipment is difficult to field-verify, thefrequency of calibration of the equipment by theplant staff or outside instrumentation technicianscan be evaluated. If flow metering equipment isbeing routinely (e.g., quarterly or semiannually)calibrated, flow records typically can be assumedto be accurate.
Dosages of primary coagulant chemicals should beverified. Feed rates from dry feeders can bechecked by collecting a sample for a specified timeand weighing the accumulated chemical. Simi-larly, liquid feeders can be checked by collecting asample in a graduated cylinder for a specified time.In both cases the feed rate in Ib/min or mL/min ofchemical should be converted to mg/L and com-pared with the reported dosage. During thisevaluation the operating staff should be askedhow they conduct chemical feed calculations, pre-
pare polymer dilutions, and make chemical feedersettings. Additionally, the plant staff should beasked how they arrived at the reported dosage. Ifjar testing is used, the evaluation team should dis-cuss this procedure, including preparation of stocksolutions. Often, a discussion can be used toassess the validity and understanding of thiscoagulation control technique. Performing jartests is typically not part of the CPE process.
The integrity of the filter media, support gravels,and underdrain system for a selected filter shouldbe evaluated. This requires that the filter bedrained and that the evaluation team inspect themedia. The filter should be investigated for sur-face cracking, proper media depth, mudballs andsegregation of media in dual media filters. Themedia can be excavated to determine the depth ofthe different media layers in multi or dual mediafilters. The media should be placed back in theexcavations in the same sequence that it wasremoved. The filter should also be probed with asteel rod to check for displacement of the supportgravels and to verify the media depth within thefilter. Variations in depth of support gravels ofover two inches would signify a potential problem.Variations in media depth of over two incl-ieswould also indicate a potential problem. If possi-ble, the clear well should be observed for thepresence of filter media. Often, plant staff canprovide feedback on media in the clearwell ifaccess is limited. If support gravels or media lossare apparent, a more detailed study of the filterwould then be indicated, which is beyond thescope of a CPE.
Filter backwash capability often can be determinedfrom the flow measurement device on the back-wash supply line. If this measurement is in ques-tion or if the meter is not available, the backwashrate should be field-verified by assessing either thebackwash rise rate or bed expansion. Rise rate isdetermined by timing the rise of water for a spe-cific period. For example, a filter having a surfacearea of 150 ft’ would have a backwash rate of20 gpm/f? if the rise rate was 10.7 inches in20 seconds. This technique is not suitable forfilters where the peak backwash rate is notreached until the washwater is passing over thetroughs.
Bed expansion is determined by measuring thedistance from the top of the unexpanded media toa reference point (e.g., top of filter wall) and fromthe top of the expanded media to the same refer-ence point. The difference between these two
56

measurements is the bed expansion. A variety oftechniques can be used to determine the top ofthe expanded bed. A light-colored can lid attachedto the end of a pole is effective. The bed expan-sion measurement divided by the total depth ofexpandable media (i.e., media depth less gravels)multiplied times 100 gives the percent bed expan-sion. A proper wash rate should expand the filtermedia a minimum of 20 to 25 percent (4).
Record drawings may have to be field-verified bymeasuring basin dimensions with a tape measure ifthere is doubt as to their accuracy. If no drawingsare available, all basin dimensions will have to bemeasured.
Additional field tests such as verification of equalflow splitting and calibration of monitoring or labo-ratory equipment can also be conducted. Fieldverification to support identified factors limitingperformance should always be considered by theevaluation team; however, time requirements forthese activities must be weighed against meetingthe overall objectives of the CPE.
4.3.3.7 Interviews
Prior to conducting personnel interviews, it is nec-essary to complete the data collection forms, themajor unit process evaluation, and performanceassessment. This background information allowsthe evaluator to focus interview questions onanticipated factors limiting performance. It is alsoadvantageous for the CPE evaluators to be familiarwith the factors outlined in Appendix E prior toconducting the interviews. This awareness alsohelps to focus the interviews and to maintain theperformance emphasis of the interview process.For example, an adamantly stated concernregarding supervision or pay is only of significanceif it can be directly related to plant performance.
Unless the number of the utility staff is too large,interviews should be conducted with all of theplant staff and with key administrative personnelin order to obtain feedback from both resources.Example key administrators include the mayor,board members from the Water Committee, andthe Utility Director.
Interviews should be conducted privately witheach individual. The persons being interviewedshould be informed that the responses are pre-sented in the findings as an overall perception, andindividual responses are not utilized in the exit
meeting or final report. Approximately 30 to 45minutes should be allowed for each interview.
Interviews are conducted to clarify informationobtained from plant records and on-site activitiesand to ascertain differences between real or per-ceived problems. Intangible items such as com-munication, administrative support, morale, andwork attitudes are also assessed during the inter-view process. The interviews also offer an oppor-tunity to ask questions about potential factors.During the conduct of on-site activities, the CPEevaluators begin to form preliminary judgments.The interviews offer the opportunity to ask, in aninformation gathering forum, what the utility per- Isonnel may think of the perceived limitation. Anadamant response may justify additional data col-lection to strengthen the evaluation team’s convic-tions prior to the exit meeting. On the other hand,sensitive findings such as operational and adminis-trative limitations can be introduced in a one-on-one setting and will allow the affected parties tobe aware that these issues may be discussed atthe exit meeting.
Interview skills are a key attribute for CPE evaluat-ors. Avoidance of conflict, maintaining an infor-mation gathering posture, utilizing initial on-siteactivity results, creating an environment for opencommunication, and pursuing difficult issues (e.g.,supervisory traits) are a few of the skills requiredto conduct successful interviews. An additionalchallenge to the CPE evaluators is to avoid pro-viding “answers” for the person being interviewed.A major attribute is the ability to ask a questionand wait for a response even though a period ofsilence may exist.
A key activity after conducting several interviewsis for the evaluation team members to discusstheir perceptions among themselves. Often, con-flicting information is indicated, and an awarenessof these differences can be utilized to gather addi-tional information in remaining interviews. Toassist in conducting interviews, guidelines havebeen provided in Appendix F - Interview Guide-lines.
4.3.3.8 Evaluation of Performance LimitingFactors
The summarizing effort of the on-site activities isidentification and prioritization of performance lim-iting factors. This activity should be completed ata locat ion that a l lows open and objective
57


An ideal conclusion for an exit meeting is that theutility fully recognizes its responsibility to providea high quality finished water and that, providedwith the findings from the CPE, the utility staff areenthusiastic to pursue achievement of this goal.
4.3.4 WE Report
At the conclusion of the on-site activities, a CPEreport is prepared. The objective of a CPE reportis to summarize findings and conclusions. Ten tofifteen typed pages are generally sufficient for thetext of the report. The CPE report should beavailable within a month following the on-siteactivities to reinforce the need to address factorslimiting optimized performance. An examplereport is presented in Appendix G. Typical con-tents are:
Introduction
Facility Information
Performance Assessment
Major Unit Process Evaluation
Performance Limiting Factors
Assessment of Applicability of a CTA
As a minimum, the CPE report should be distrib-uted to plant administrators, and they should berequested to distribute the report to key plant per-sonnel. Further distribution of the report (e.g., toregulatory personnel or to the design consultant)depends on the circumstances of the CPE.
4.4 Case Study
The following case study provides insights on theconduct of a CPE at an actual water utility. Thestate regulatory agency had identified in theirreview of monthly monitoring reports that a con-ventional water treatment plant was routinely vio-lating the 0.5 NTU limit on finished water turbid-ity. The state notified the community that theyintended to conduct a CPE to identify the reasonsfor non-compl iance wi th current regulatoryrequirements.
4.4.7 Facility Information
Facility A serves a community of 10,000 peopleand is located in an area with a temperate climate.The facility was designed to treat 5.0 MGD. Nor-mally during the year the plant is operated forperiods ranging from 5 to 12 hours each day.During operation, the facility is always operated ata flow rate of 5 MGD. A flow schematic of thefacility is shown in Figure 4-9.
The following data were compiled from the com-pleted data collection forms, as presented inAppendix F.
Design Flow: 5.0 MGDAverage Daily Flow: 1.2 MGD
Peak Daily Flow: 4.0 MGD
Peak Instantaneous Operating Flow:5.0 MGD
Figure 4-9. Flow schematic of Plant A.Sedimentation
Flash
IntakeMix
Fe IH_Raw Flocculation
Cleanwater Creek waterPumps
TODistribution
Sludge to Ponds/Drying Beds Backwash to
Pond SupsrnatantReturned to Plant
60

Flocculation:. Number Trains: 2
n Type: Mechanical turbines, 3 stages
. Dimensions:* Length: 15.5 f t
* Wid th : 15 .5 f t
* Depth : 10 .0 f t
Sedimentation:. Number Trains: 2
. Type: Conventional rectangular
. Dimensions:* Leng th : 90 ft
* W i d t h :
* D e p t h :
30 ft
12 ft
Filtration:. Number: 3
n Type: Dualgravity
approximately 15 NTU and the settled water tur-bidity was measured at 4.3 NTU during the CPE.Routine sampling of settled water was not beingpracticed. Field evaluation of one of three filtersduring the on-site activities indicated a turbidityspike of 1 .I NTU following backwash with areduction to 0.6 NTU after one hour of operation.The results of the performance assessment indi-cated that optimized performance goals were notbeing achieved.
4.4.3 Major Unit Process Evaluation
A performance potential graph (Figure 4-101 wasprepared to assess the capability of Plant A’s ma-jor unit processes. The calculations that wereconducted to complete the graph are shown in thefollowing four sections.
FIGURE 4-10. Performance potential graph forPlant A.
media (i.e., anthracite, sand),
Unit Process I 0 1 2 3 4 5 6. Dimensions:
* Leng th : 18 f t
* Width: 18 ft
Disinfection:n Disinfectant: Free chlorine
= Application Point: Clearwell
. Number: 1
. Clearwell Dimensions:* Leng th : 75 f t
* W i d t h : 7 5 f t
* Maximum operating level: 20 ft
* Minimum operating level: 14 ft
. Baffling factor: 0.1 based on unbaffledbasin
4.4.2 Performance Assessment
The performance assessment, using the mostrecent 12 months of data, indicated that the fin-ished water turbidity was not meeting the regu-lated quality of <0.5 NTU in 95 percent of thesamples collected each month. In fact, the95 percent requirement was exceeded in 5 of 12months, The raw water turbidi ty averaged
Disinfectiod4) TYPO 2 I iI I
II I
Peak lnstmtmmus OperatingRow - 5.0 MC0
(1) Rated at 20 min (HDT) - 7.6 MGD
(2) Rated at 0.6 gpm/ft2 - 4.7 MGD
(3) Rated at 4.0 gpm/ft2 - 5.6 MGD
(4) Rated at 20 min HDT - 4.2 MGD
4.4.3.1 Flocculation Basin Evaluation
The flocculation basins were rated at a hydraulicdetention time of 20 minutes because the floccula-tion system has desirable flexibility (i.e., threestages with each stage equipped with variablespeed flocculators). The plant is also located in atemperate climate, so the temperature criteria is< 0.5”C.
61

1. Basin Volume = 6 basins x 15.5 ft x1 5 . 5 f t x 10 ft x 7.48 gal/ft3
= 107,824 gallons
2. Select 20-minute detention time to determinepeak rated capability.
3. Rated Capability = 107,824 gal/20 minutes
= 5,391 gpm x1 MGD
694.4 gpm
= 7 . 8 M G D
The 20-minute detention time results in a ratedcapability of 7.8 MGD. Therefore, the flocculationsystem is rated Type 1 because the 7.8 MGDexceeds the peak instantaneous plant flow of5.0 MGD.
4.4.3.2 Sedimentation Basin Evaluation
The sedimentation basins were rated at0.6 gpm/ft2 surface overflow rate. This mid-rangecriteria was selected based on the basin depth of12 ft and the observed poor performance duringthe on-site activities.
1. Basin Surface Area = 2 basins x 90 ft x 30 ft= 5 , 4 0 0 ft2
2 . Select 0.6 gpm/ft2 surface overflow rate todetermine peak rated capability.
3. Rated Capability = 5,400 ft2 x 0.6 gpm/ft2
= 3 , 2 4 0 g p m x 1 MGD694.4 gpm
= 4 . 7 MGD
The 0.6 gpm/ft2 overflow rate results in a ratedcapability of 4.7 MGD. The sedimentation basinsare rated Type 2 because the 4.7 MGD rating fallswithin 80 percent of the 5 MGD peak instantane-ous operating flow.
4.4.3.3 Filter Evaluation
The filters were rated at 4 gpm/ft2 filtration ratebased on dual-media with adequate backwashingcapability.
1. Filter Area = 3 filters x 18 ft x 18 ft
= 972 ft2
2. Select 4 gpm/ft’ to determine peak rated capa-bility.
3. Rated Capability = 972 ft2 x 4 gpm/ft2
= 3 , 8 8 8 g p m x 1 MGD694.4 gpm
= 5 . 6 M G D
The 4 gpm/ft2 rate results in a rated capability of5.6 MGD. The filters were rated Type 1 because5.6 MGD exceeds the peak instantaneous operat-ing flow of 5.0 MGD.
4.4.3.4 Disinfection Process Evaluation
The disinfection system was evaluated based onpost-disinfection capability only since prechlorina-tion was not practiced at Plant A.
1.
2 .
3 .
4 .
Determine required Giardia log reduct ion/inact ivat ion based on raw water qual i ty.Select 3.0 log, based on state regulatoryagency requirement.
Determine CT based on minimum water tem-perature and maximum treated water pH.From plant records select:
Temperature (minimum) = 0.5 O C
pH (maximum) = 7.5
Determine log inactivation required by disinfec-tion,
Allow 2.5 log reduction because plant is con-ventional facility in reasonable condition with aminimum Type 2 rating in previous unit proc-ess evaluation.
Log inactivation required by disinfection =3 . 0 - 2 . 5 = 0 . 5
Determine CT required for 0.5 log inactivationof Giardia at pH = 7.5
T = 0.5OC, free chlorine residual = 2.5 mg/L.
From tables in Appendix D, CT =50:5 mg/L-min
6 2
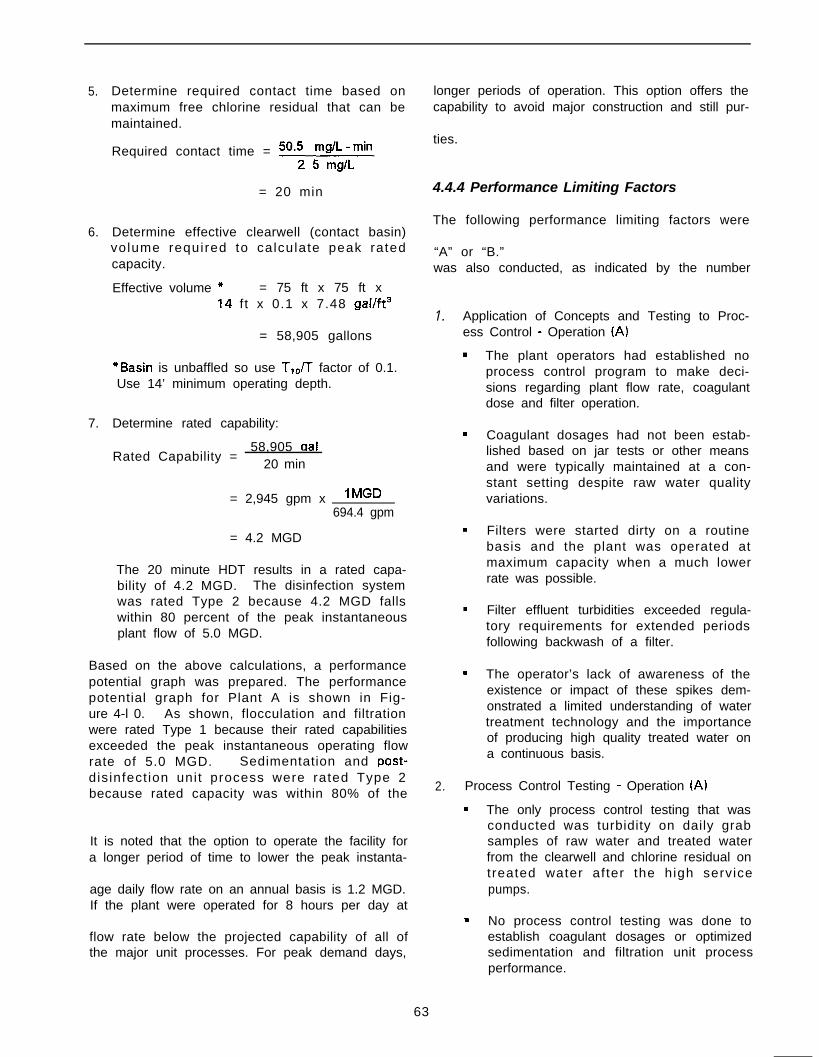
5.
6.
7.
Determine required contact time based onmaximum free chlorine residual that can bemaintained.
Required contact time = 50.t rrdirnin
= 20 min
Determine effective clearwell (contact basin)volume required to calculate peak ratedcapacity.
Effective volume + = 75 ft x 75 ft x14 ft x 0.1 x 7.48 gal/ft3
= 58,905 gallons
*Basin is unbaffled so use T,,/T factor of 0.1.Use 14’ minimum operating depth.
Determine rated capability:
Rated Capability =58,905
20 min
= 2,945 gpm x lMGD694.4 gpm
= 4.2 MGD
The 20 minute HDT results in a rated capa-bility of 4.2 MGD. The disinfection systemwas rated Type 2 because 4.2 MGD fallswithin 80 percent of the peak instantaneousplant flow of 5.0 MGD.
Based on the above calculations, a performancepotential graph was prepared. The performancepotential graph for Plant A is shown in Fig-ure 4-l 0. As shown, flocculation and filtrationwere rated Type 1 because their rated capabilitiesexceeded the peak instantaneous operating flowrate of 5.0 MGD. Sedimentation and disinfect ion unit process were rated Type 2because rated capacity was within 80% of the
It is noted that the option to operate the facility fora longer period of time to lower the peak instanta-
age daily flow rate on an annual basis is 1.2 MGD.If the plant were operated for 8 hours per day at
flow rate below the projected capability of all ofthe major unit processes. For peak demand days,
longer periods of operation. This option offers thecapability to avoid major construction and still pur-
ties.
4.4.4 Performance Limiting Factors
The following performance limiting factors were
“A” or “B.”was also conducted, as indicated by the number
1 . Application of Concepts and Testing to Proc-ess Control - Operation (A)
The plant operators had established noprocess control program to make deci-sions regarding plant flow rate, coagulantdose and filter operation.
Coagulant dosages had not been estab-lished based on jar tests or other meansand were typically maintained at a con-stant setting despite raw water qualityvariations.
Filters were started dirty on a routinebasis and the plant was operated atmaximum capacity when a much lowerrate was possible.
Filter effluent turbidities exceeded regula-tory requirements for extended periodsfollowing backwash of a filter.
The operator’s lack of awareness of theexistence or impact of these spikes dem-onstrated a limited understanding of watertreatment technology and the importanceof producing high quality treated water ona continuous basis.
2. Process Control Testing - Operation (A)
= The only process control testing that wasconducted was turbidity on daily grabsamples of raw water and treated waterfrom the clearwell and chlorine residual ontreated water af ter the high servicepumps.
. No process control testing was done toestablish coagulant dosages or optimizedsedimentation and filtration unit processperformance.
63

3. Plant Coverage - Administration (A)
. Plant operators were only allowed enoughtime to be at the plant to fill the reservoir,approximately six hours each day.
. On occasion, the alum feed line wouldplug and go unnoticed, resulting in peri-ods of poor treated water quality.
= The operators were expected to conductother activities, such as monitoring thecity swimming pool, assisting wastewatertreatment plant operators, and assistingstreet maintenance crews during summermonths.
4. Disinfection - Design (B)
. Operation of the plant at maximum flowrate does not allow sufficient contact timefor disinfection. However, operation ofthe plant at or below 4.2 MGD allows thedisinfection unit process to be in compli-ance with existing regulations.
5. Sedimentation - Design (B)
n The sedimentation basin was not pro-jected to be capable of achieving opti-mized performance criteria at flows above4.7 MGD. Reducing the flow would allowthe basin to perform adequately duringmost periods of the year.
6. Sample Taps - Design (B)
. Sample taps do not exist to allow samplesto be obtained from the individual filters.This prevents the plant staff from obtain-ing needed information to optimize indi-vidual filter performance.
4.4.5 Assessing Applicability of a CTA
The most serious of the performance limiting fac-tors identified for Plant A were process control-oriented. The evaluation of major unit processesresulted in a Type 2 rating at the present peakinstantaneous operating flow. However, it wasdetermined that the rating could be upgraded toType 1 if the plant peak instantaneous operatingflow rate could be reduced by operating for longerperiods of time each day. This adjustment willrequire addressing the plant coverage factor byconvincing administrators to allow operators tospend additional time at the treatment facility. If
plant flow can be reduced and operator coverageincreased, it appears that the utility would be ableto achieve improved performance through imple-mentation of a follow-up CTA. These conditionswould require approval by the City Council beforea CTA could be initiated. Documentation ofimprovement in finished water turbidity, includingreduction of spikes after dirty filter start-up andbackwashing, should result from CTA efforts.Additionally, maintaining settled water turbidity at< 2 NTU on a continuous basis would be theexpected result from a CTA. These improvementsto optimized performance will enhance the treat-ment barriers that this facility provides and, thus,enhance public health protection.
4.4.6 CPE Results
The success of conducting CPE activities can bemeasured by plant administrators selecting a fol-low-up approach and implementing activities toachieve the required performance from their watertreatment facility. If definite follow-up activitiesare not initiated within a reasonable time frame,the objectives of conducting a CPE have not beenachieved. Ideally, follow-up activities must com-prehensively address the combination of factorsidentified (e.g., implement a CIA) and should notbe implemented in a piecemeal approach. In theprevious example, plant administrators decided tohire a third party to implement a CTA. The CTAaddressed the identified factors and resulted in theexisting plant achieving optimized performancegoals without major capital improvements.
4.5 References
1. Bender, J.H., R.C.Bissonette, and R.nership for Safe
Renner, B.A. Hegg, E.M.Lieberman. 1995. “Part-Water Voluntary Water
Treatment Plant Performance ImprovementProgram Self-Assessment Procedures. IUSEPA, AWWA, AWWARF, Association ofMetropolitan Water Agencies, Association ofState Drinking Water Administrators, andNational Association of Water Companies.
2. Eastern Research Group, Inc. 1992. WaterAdvisor Utilizing the CCP Approach (ExpertSystem). USEPA Work Assignment No. 7391-55. Eastern Research Group, Inc., Arlington,MA.
64

3.
5.
6.
Renner, R.C., B.A. Hegg, J.H. Bender, andE.M. Bissonette. February 1991. Handbook -Optimizino Water Treatment Plant PerformanceUsina the Composite Correction Proaram. EPA625/g-91 /027. USEPA, Cincinnati, OH.
American Society of Civi l Engineers andAmerican Water Works Association. 1990.Water Treatment Plant Desian. McGraw-Hill,2nd ed.
James M. Montgomery Consulting Engineers,Inc. 1985. Water Treatment Princioles andDesian. John Wiley & Sons, Inc.
Sanks, R.L., ed.. 1978. Water TreatmentPlant Desian for the Practicina Enaineer. AnnArbor Science Publishers, Kent, England.
Renner, R.C., B.A. Hegg, and J.H. Bender.March 1990. EPA Summarv Report: Opti-mizina Water Treatment Plant PerformanceWith the Composite Correction Prooram. EPA625/g-90/01 7, USEPA Center for Environ-mental Research Information, Cincinnati, OH.
8. “Surface Water Treatment Rule”, from FederalRegister, Vol. 54, No. 124, U.S. Environ-mental Protection Agency, 40 CFR, Parts 141and 142 , Rules and Regulations, Filtra-tion/Disinfection (June 1989).
9. USEPA. 1989. Guidance Manual for Compli-ance With the Filtration and DisinfectionReauirements for Public Water Svstems UsinqSurface Water Sources. NTIS No. PB90148016. USEPA, Washington, DC.
10. Regli, S. June 1990. “How’s and Why’s ofCTs . ” Presented at AWWA Annual Confer-ence, Cincinnati, OH.
11. Cleasby, J.L., M.M. Williamson, and E.R.Baumann. 1963. “Effect of Filtration RateChanges on Quality.” Journal AWWA, 55:869-878.
12. Cleasby, J.L., A.H. Dharmarajah, G.L. Sindt,and E.R. Baumann. September 1989. Desianand Operation Guidelines for Optimization ofthe Hiah Rate Filtration Process: Plant SurvevResults. AWWA Research Foundation andAWWA, Denver, CO.
65

Chapter 5Comprehensive Tech&al Assistance
5.1 Objective
The objective of conducting Comprehensive Tech-nical Assistance (CTA) activities is to achieve andsustain optimized performance goals, as wasdescribed in Chapter 2. Given this objective, theresults of a successful CTA can be easily depictedin graphical form. Results from an actual CTA arepresented in Figure 5-l. As shown, plant per-formance was inconsistent as depicted by thevariations in finished water turbidity. However,after CTA activities had been implemented (April1997) the treated water quality gradually improvedto a level that has been consistently less than0.1 NTU. It is noted that other parameters, suchas improved operator capability, cost savings, andimproved plant capacity are oft&r associated withthe conduct of a CTA, but the true measure ofsuccess is the ability to achieve optimized per-formance goals and demonstrate the capability tomeet these goals long-term under changing rawwater quality conditions. It is recommended thatCTA results be presented graphically to indicatethat the primary objective has been achieved.
An additional objective of a CTA is to achieve opti-mized performance from an existinq water treat-ment facility (i.e., avoid, if possible, major modifi-cations). If the results of a Comprehensive Per-formance Evaluation (CPE) indicate a Type 1 plant(see Figure 4-31, then existing major unit proc-esses have been assessed to be adequate to meetoptimized treatment requirements at current plantloading rates. For these facilities, the CTA canfocus on systematically addressing identified per-formance limiting factors to achieve optimized per-formance goals.
For Type 2 plants, some or all of the major unitprocesses have been determined to be marginal.Improved performance is likely through the use ofa CTA; however, the plant may or may not meetoptimized performance goals without major facilitymodifications. For these plants, the CTA focuseson obtaining optimum capability of existing facili-ties. If the CTA does not achieve the desired fin-ished water quality, unit process deficiencies willbe clearly identified and plant administrators canbe confident in pursuing the indicated facilitymodifications.
Figure 5-1. CTA results showing finished water quality improvements.
Start CT&
67

For Type 3 plants, major unit processes have beendetermined to be inadequate to meet performanceobjectives. For these facilities, major constructionis indicated and a comprehensive engineeringstudy that focuses on alternatives to address theindicated construction needs is warranted. Thestudy should also look at long term water needs,raw water source or treatment alternatives, andfinancing mechanisms.
If an existing Type 3 plant has performance prob-lems with the potential to cause serious publichealth risk, officials may want to try to addressany identified limitations, in addition to the designfactors, to improve plant performance. In thesecases, activities similar to a CTA could be imple-mented to obtain the best performance possiblewith the existing facilities, realizing that optimumperformance would not be achieved. Additionally,administrative actions such as a boil order orwater restrictions may have to be initiated byregulators until improvements and/or constructioncan be completed for Type 3 facilities.
5.2 Conducting CTAs
5.2. I Overview
The CTA was developed as a methodology toaddress the unique combination of factors thatlimit an individual facility’s performance throughuse of a consistent format that could be applied atmultiple utilities. This foundation for the CTAnecessarily required a flexible approach. Conceptsthat define the general CTA approach are furtherdiscussed.
Implementation of a CTA is guided by an unbiasedthird party who is in a position to pursue correc-tion of factors in all areas such as addressingpolitically sensitive administrative or operationallimitations. This person, called the CTA facilitator,initiates and supports all of the CTA activities.The CTA facilitator uses a priority setting model asa guide to address the unique combination of fac-tors that have been identified in a CPE. Based onthe priorities indicated by this model, a systematiclong term approach is used to transfer priority set-ting and problem solving skills to utility personnel.The priority setting model is illustrated graphicallyin Figure 5-2.
The first step in implementation of a CTA is estab-lishing the optimized performance goals that willbe the objectives to achieve during the conduct of
the CTA. Since these goals exceed regulatedrequirements, the plant administration has toembrace achieving this level of performance froma public health perspective. For example, adminis-trators must be aware that even momentaryexcursions in water quality must be avoided toprevent G i a r d i a and C r y p t o s p o r i d i u m or o therpathogenic organisms from passing through thetreatment plant and into the distribution system.To this end, all unit processes must be performingat high levels on a continuous basis, thus provid-ing a “multiple barrier” to passage of pathogenicorganisms through the treatment plant. Ulti-mately, administrators must adopt the concept ofoptimized performance goals and be willing toemphasize the importance of achieving these goalswithin the framework of the CTA.
Figure 5-2. CTA priority setting model.
Optimized Performance Goals
tI
Operation IProcess Control)
When the performance objectives are established,the focus turns to operation (i.e., process control)activities. Implementing process control is the keyto achieving optimized performance goals with acapable facility. Administration, design and main-tenance are necessary to support a capable plant.Any limitations in these areas hinder the successof the process control efforts. For example, if fil-tered water turbidity cannot be consistently main-tained at optimized levels because operating staffis not at the plant to make chemical feed adjust-ments in response to changing raw water quality,then improved performance will require more staffcoverage. In this case, identified limitations inmaking chemical feed adjustments established thepriority for improving staff coverage (i.e., anadministrative policy). Additional staff coveragewould alleviate the identified deficiency (i.e., sup-port a capable plant) and allow process adjust-ments to be made so that progress toward the
68

optimized performance goals could be continued.In this manner, factors can be prioritized andaddressed, ensuring efficient pursuit of the opti-mized performance goals.
The results of the CPE (Chapter 4) provide the ini-tial prioritized list of performance limiting factorsimpacting an individual facility. The CTA facilita-tor utilizes these factors, coupled with the prioritysetting model, to establish the direction for theCTA. It is important to note that a CTA is adynamic process, and the facilitator will have toconstantly readjust priorities as the events unfold.The model can be used repetitively to assist in theprioritization of CTA activities.
A systematic long term process is used to transferpriority setting and problem solving skills to theutility personnel during a CTA. Typically, 6 to 18months are required to implement a CTA. Thislong time period is necessary for several reasons:
. Time necessary to identify and develop a localchampion or champions. Since the CTA facili-tator is off-site, one or more personnel thatcan implement the CTA activities need to beidentified. These persons are called champi-ons since they are the focal point for CTAimplementation. They are designated as theperson at the plant responsible to understandthe implementation of the CTA and to assistthe plant staff with CTA activities on a day-to-day basis. This person is also the key contactfor communications with the CTA facilitatorand the local personnel. The champion is alsothe focal point for the transfer of prioritysetting and problem solving skills. The cham-pion will ultimately be responsible for transferof these skills to the other utility personnel.This transfer is essential to ensure the conti-nuity of water quality improvements after thefacilitator is gone. Ideally, the championwould be the superintendent or lead operator.
l Greater effectiveness of repetitive trainingtechniques. Operator and administrator train-ing should be conducted under a variety ofactual operating conditions (e.g., seasonalwater quality or demand changes). Thisapproach allows development of observation,interpretation, and implementation skills nec-essary to maintain desired finished waterquality during periods of variable raw waterquality.
l Time required to make minor faciJity modifica-tions. For changes requiring financial expendi-tures, a multiple step approach is typicallyrequired to gain administrative (e.g., CityCouncil) approval. First, the need for minormodifications to support a capable facilitymust be demonstrated. Then, council/administrators must be shown the need andultimately convinced to approve the fundsnecessary for the modifications, This processresults in several months before the identifiedmodification is implemented and operational.
. Time required to make administrative changes.Administrat ive factors can prolong CTAefforts. For example, if the utility rate struc-ture is inadequate to support plant perform-ance, extensive time can be spent facilitatingthe required changes in the rate structure.Communication barriers between “downtown”and the plant or among staff members mayhave to be addressed before progress can bemade on improved performance. If the staff isnot capable, changes in personnel may berequired for the CTA to be successful. Thepersonnel policies and union contracts underwhich the utility must operate may dictate thelength of time these types of changes couldtake.
l Time required for identification and eliminationof any additional performance limiting factorsthat may be found during the CCP. It is impor-tant to note that additional performance limit-ing factors, not identified during the shortduration of the CPE, often become apparentduring conduct of the CTA. These additionallimitations must also be removed in order toachieve the desired level of performance.
5.2.2 Implementation
Experience has shown that no single approach toimplementing a CTA can address the unique com-bination of factors at every water treatment plant.However, a systematic approach has been devel-oped and specific tools have been used to increasethe effectiveness of CTA activities. The approachrequires involvement of key personnel and estab-lishes the framework within which the CTA activi-ties are conducted. Key personnel for the imple-mentation of the CIA are the CTA facilitator and
69

the utility champions. The framework for con-ducting the activities includes site visits, commu-nication events, and data and records review con-ducted over a sufficient period of time (e.g., 6 to18 months),
The tools utilized for conducting CTAs have beendeveloped to enhance the transfer of capability toutility administrators and staff. Actual implemen-tation of each CTA is site-specific, and the combi-nation of tools used is at the discretion of the CTAfacilitator. Additional approaches to addressingperformance limiting factors exist,, and a creativefacilitator may choose other options,
Implementation of a successful CTA requires thatthe CTA facilitator constantly adjust the prioritiesand implementation techniques to match thefacility and personnel capabilities at the uniquesite. The bottom line is that ootimized oerform-ante qoals, that can be araohicallv deoicted, needto be achieved as a result of the CTA efforts (seeFioure 5-l). Components of CTA implementation
are further described.
5.2.2.1 Approach
CTA Facilitator
The CTA facilitator is a key person in the imple-mentation of CTA activities and must possess avariety of skills due to the dynamic nature of theprocess. Desired skills include a comprehensiveunderstanding of water treatment unit processesand operations and strong capabilities in leader-ship, personnel motivation, priority setting, andproblem solving.
Comprehensive understanding of water treatmentunit processes and operat ions is necessarybecause of the broad range of unit processesequipment and chemicals utilized. For example,numerous sedimentation devices exist such asspiral flow, reactor type, lamella plate, tube set-tlers, pulsators and solids contact units. Addition-ally, multiple possibilities exist in terms of types,combinations and dosages of coagulant, flocculantand filter aid chemicals.
Operations capability is necessary to understandthe continually changing and sometimes conflictingrequirements associated with water treatment.Optimization for particulate removal ultimately hasto be coordinated with control of other regulatedparameters such as disinfection by-products or
lead and copper. In addition, those responsible forimplementing a CTA must have sufficient processcontrol capability to establish an appropriateapproach that is compatible with the personnelcapabilities available at the utility.
A CTA facilitator must often address improvedoperation, improved maintenance, and minordesign modifications with personnel alreadyresponsible for these water treatment functions,A “worst case situation” is one in which the plantstaff is trying to prove that “the facilitator can’tmake it work either.” The CTA facilitator must beable to create an environment to maintain commu-nications and enthusiasm and to allow all partiesinvolved to focus on the common goal of achiev-ing optimized plant performance. Ultimately, theCTA facilitator must transfer priority setting andproblem solving skills to the utility staff. Theobjective here is to leave the utility with the nec-essary skills after the facilitator leaves so that theperformance goals can be met long term. Toaccomplish this transfer, the facilitator must createsituations for local personnel to “self discover”solutions to ongoing optimization challenges sothat they have the knowledge and confidence tomake all necessary changes. In almost all casesthe facilitator must avoid assuming the role oftroubleshooter or the person with all of theanswers. Each situation has to be evaluated forits learning potential for the staff.
A CTA facilitator must be able to conduct trainingin both formal and on-the-job situations. Trainingcapabilities must also be developed so they areeffective with both operating as well as adminis-trative personnel. When addressing process con-trol limitations, training must be geared to thespecific capabilities of the process control decisionmakers. Some may be inexperienced; others mayhave considerable experience and credentials.“Administrative” training is of ten a matter ofclearly providing information to justify or supportCTA objectives or activities. Although manyadministrators are competent, some may not knowwhat to expect from their facilities or what theirfacilities require in terms of staffing, minor modifi-cations, or specific funding needs.
CTA facilitators can be consultants, state and fed-eral regulatory personnel, or utility employees. Forconsultants, the emphasis of opt imizing the“existing facility” without major construction mustbe maintained. A substantial construction costcan be incurred if an inexperienced facilitator isnot able to bring a capable water treatment plant
70

to the desired level of performance. For example,a consultant, involved primarily with facilitydesign, may not have the operational experience toutilize the capability of existing unit processes totheir fullest extent and may be biased towarddesigning and constructing new processes.
If utility personnel try to fill the role as CTA facili-tator, they should recognize that some inherentproblems may exist. The individuals implementingthe CTA, for example, often find it difficult to pro-vide an unbiased assessment of the area in whichthey normally work (i.e., operations personnel tendto look at design and administration as problemareas; administrators typically feel the operationspersonnel should be able to do better with existingresources). These biases should be recognized,and they must be continually challenged by utilitypersonnel who assume the role of CTA facilitator.
Individuals who routinely work with water utilitiesto improve water treatment plant performance willlikely be the best qualified CTA facilitators. Thesepeople are typically engineers or operators whohave gained experience in correcting deficienciesat plants of various types and sizes. CTA facilita-tors that have experience in a variety of plantshave a definite advantage in their ability to recog-nize and correct true causes of limited perform-ance.
On-Site CTA Champion
In addition to the capabilities of the CTA’ facilita-tor, it is necessary to have one or several utilitypersonnel who “champion” the objectives andimplementation of the CTA process. The cham-pion is the person who assumes the day-to-dayresponsibilities of pursuing the implementation ofthe established priorities. This person is alsoresponsible for the transfer of problem solvingskills learned from the CIA facilitator to the rest ofthe staff.
Identification of the champion is a key step in thesuccess of the CTA. Ideally, the superintendent orlead operator is the person that would fill thechampion role. However, many times these indi-viduals may be part of the limitation to achievingoptimized performance because they tend to stickto the old ways of conducting business. Newoperators or laboratory personnel often offer thegreatest potential for the role as champion. Toresolve some of the issues with the selection ofthese “junior” personnel, a champion team con-
sisting of the selected personnel and the personnelthat normally would assume the role (e.g., thesuperintendent) can be selected.
Ideally the role of the champion is formally identi-fied during the CTA activities. In other cases,however, it may be necessary to use an informalapproach where the champion is only recognizedby the CTA facilitator. For example, in somecases the champion may not be the typical person,based on the “chain of command.” In these casesthe use of a junior person to assist the supervisoror superintendent in the actual implementationmay be the only option available to ensure pro-gress on CTA activities. This is a delicate situa-tion for the facilitator, and extra effort is requiredto maintain open communications and acceptancefor project activities. In any event, the closer thecharacteristics of the champion are to those out-lined for the CTA facilitator, the easier the imple-mentation of the CTA will be.
CTA Framework
A consistent framework has been developed tosupport the implementation of a CTA. Theframework consists of on-site involvement (e.g.,site visits) interspersed with off-site activities(e.g., communication events such as phone/fax/e-mail and data and guidelines review). A graphi-cal illustration of the CTA framework is shown inFigure 5-3.
l Site visits are used by the facilitator to verifyor clarify plant status, establish optimizationperformance goals, initiate major process con-trol changes, test completed facility modifica-tions, provide on-site plant or administrativetraining, and report progress to administratorsand utility staff. Dates for site visits cannot beestablished at specific intervals and must bescheduled based on plant status (e.g., processupsets), training requirements, communica-tions challenges, etc. As shown in Figure 5-3,site visits and communication events typicallytaper off as the CTA progresses. This is inline with the transfer of skills to the plant staffthat occurs throughout the CTA. The numberof site visits required by a CTA facilitator isdependent on plant size and on the specificperformance limiting factors. For example,some administrative (e.g., staffing and ratechanges) and minor design modifications couldsignificantly increase the number of site visitsrequired to complete a CTA. Typically, the
71

Figure 5-3. Schematic of CTA framework.
7 8 8 10 11 12
Site Visits
Communication:Phone,Fax,E-Mai
Data andCorrespondenceReview
ReportingActivities
I
0..
08
0
initial site visit is conducted over three to fourdays and intermediate site visits are conductedover two to three days. CTA accomplish-ments and proposed future activities are pre-sented to plant and administrative personnel atan exit meeting at the conclusion of each sitevisit.
l Communication events such as telephonecalls, faxes and e-mail are used to routinelyassess CTA progress. Communication activi-ties are normally conducted with the on-siteCTA champion. Routine contact is used totrain and encourage plant personnel to pursuedata collection and interpretation, encourageprogress on prioritized activities, and providefeedback on special studies and guidelinedevelopment. The CTA facilitator shouldalways summarize important points, describedecisions that have been reached, and identifyactions to be taken. Further, both the CTAfacilitator and plant personnel should maintainwritten phone logs. It is noted that communi-cation events have limited ability to address allidentified factors. As such, the CTA facilitatorshould always monitor the progress beingaccomplished in the effectiveness of the com-munication events to assess the need for a sitevisit.
l Data and correspondence review are activitieswhere the CTA facilitator reviews the informa-tion provided routinely by the utility. A formatfor submittal of weekly performance data isestablished during the initial site visit. Thisinformation is provided in hard copy or elec-tronically by the utility. Results of special
5 6
I
ee 04
Months of Involvement
.
BP
0
00
-
80
0
-
studies or draft operational guidelines are alsosubmitted to the CTA facilitator for review.Review and feedback by the CTA facilitator arekey to demonstrate the importance of effortsby the utility personnel. Findings from dataand records review are related to the staff bycommunications events. The routine feedbackenhances the data development and interpreta-tion skills of the utility staff.
l Reporting activities are used to document pro-gress and to establish future direction. Shortletter reports are typically prepared at the con-clusion of each site visit. These reports canbe used to keep interested third parties (e.g.,regulatory personnel) informed and to maintaina record of CTA progress and events. Theyalso provide the basis for the final CTA report,Short reports or summaries can also be devel-oped to justify minor facility upgrades orchanges in plant coverage or staffing. A finalCTA report is typically prepared for delivery atthe last site visit. The report should be brief(e.g., eight to twelve pages are typically suffi-cient for the text of the report). Graphs docu-menting the improvement in plant performanceshould be presented. If other benefits wereachieved these should also be documented.Typical contents are:
n Introduction:
* Reasons for conducting the CTA.
. CPE Results:
* Briefly summarize pertinent informa-tion from the CPE report.
72

. CTA Significant Events:
* Chronological summary of activitiesconducted.
* Include special study results.
. CTA Results:
* Graph of plant performance plusother benefits.
. Conclusions:
* Efforts required to maintain improvedperformance.
n Appendices:
* Compilation of site specific guidelinesdeveloped by the plant staff.
5.2.2.2 Tools
Contingency plans should be prepared for facilitiesproducing finished water quality that is not meet-ing current regulated requirements and for possibleinstances when finished water degrades duringimplementation of changes during the CTA. Thecontingency plan should include actions such asreducing plant flow rate to improve performance,shutting down the plant, initiating a voluntarypublic notification, and initiating a voluntary boilorder. If plant finished water exceeds a regulatedmaximum contaminant level (MCL), the Stateregulatory agency should be immediately informed,and public notification procedures mandated bythe Public Notification Regulation Rule (1) shouldbe followed. To minimize the chance of producingunacceptable finished water while conducting aCTA, all experimentation with chemical doses anddifferent coagulant products should be done on abench scale (e.g., jar test) before implementingchanges on a full scale basis. Full scale experi-mentation can be done on an isolated treatmenttrain or during low demand conditions that wouldallow “dumping” of improperly treated water.
Action Plans
Action plans can be utilized to ensure progressiveimplementation of performance improvementactivities. The action plan summarizes items to becompleted, including the name of the person that
is assigned a particular task and the projected duedate. The plan is normally developed during theCTA site visits and distributed by the CTA facilita-tor. The plan should identify tasks that are clearto the person responsible and within their area ofcontrol. The person should have been involved inthe development of the action item and shouldhave agreed to the assignment and the due date.The action plan is provided to administrators andplant personnel after site visits or communicationevents. Communication events are used toencourage and monitor progress on the assignedaction items. An example format for an “Action”plan is shown in Figure 5-4.
Figure 5-4. Example action plan.
Item Action Person DateResponsible Due
1 Develop calibration curve Jon 414for polymer feed pump.
2 Draft special study Bob 5/lprocedure to evaluate useof a flocculant aid toimprove sedimentationbasin performance.
3 Process control:a. Develop daily data Larry 4117
collection sheet. Eric 4124b. Develop routine Rick 4128
sampling program.c. Draft guideline for jar
testing.
Special Studies
Special studies can be used to evaluate and opti-mize unit processes, to modify plant process con-trol activities, or to justify administrative or designchanges necessary to improve plant performance.They are a structured, systematic approach forassessing and documenting plant optimizationactivities. The format for development of a specialstudy is shown in Figure 5-5. The major compo-nents include the special study topic, hypothesis,approach, duration of the study, expected results,documentation/conclusions, and implementationplan. The hypothesis should have a focusedscope and should clearly define the objective ofthe special study. The approach should providedetailed information on how the study is to beconducted including: when and where samplesare to be collected, what analyses are to be con-ducted, and which specific equipment or proc-esses will be used. The approach should be
73

developed in conjunction with the plant staff toobtain staff commitment and to address any chal-lenges to implementation that may exist prior toinitiating the study. Expected results ensure thatmeasures of success or failure are discussed priorto implementation. It is important that the studyconclusions be documented. Ideally, data shouldbe developed using graphs, figures and tables.This helps to clarify the findings for presentationto interested parties (e.g., plant staff, administra-tors, regulators). Special study findings serve as abasis for continuing or initiating a change in plantoperation, design, maintenance or administration.An implementation plan in conjunction with con-clusions identifies the procedural changes andsupport required to utilize special study results. Ifall of the steps are followed, the special studyapproach ensures involvement by the plant staff,serves as a basis for ongoing training, andincreases confidence in plant capabilities. Anexample special study is presented in Appendix I.
Ooerational Guidelines
Operational guidelines can be used to formalizeactivities that are essential to ensure consistentplant performance. Examples of guidelines thatcan be developed include: jar testing, polymerdilution preparation, polymer and coagulant feedcalculations, filter backwashing, chemical feedercalibration, sampling locations and data recording.The CTA facilitator may provide examples, butguidelines should be developed by the plant staff.Through staff participation, operator training isenhanced and operator familiarity with equipmentmanuals is achieved. Additionally, communicationamong operators and shifts is encouraged in thepreparation of guidelines. The guidelines should beprepared using word processing software andshould be compiled in a three-ring binder so thatthey can be easily modified as optimizationpractices are enhanced. An example guideline ispresented in Appendix J.
Data Collection and InterDretation
Data collection and interpretation activities areused to formalize the recording of results of proc-ess control testing that is initiated. Typically, adaily sheet is used to record operational data suchas lab test results, flow data, and chemical use.These data are transferred to monthly sheets thatare used to report necessary information to the
regulatory agency and to serve as a historic recordfor plant operation. Examples of daily andmonthly process control sheets are presented inAppendix K. Graphs or trend charts can be usedto enhance the interpretation of process monitor-ing results. The data developed can be plottedover long periods to show seasonal trends andchanges in water demand or over shorter periodsto show instantaneous performance. Examples ofdata development over a several month period areshown in Figure 5-1, A short term trend chartshowing raw, settled and filtered water turbiditiesover a one-day period is depicted in Figure 5-6.During this period no change in coagulant dosewas initiated, despite the change in raw water tur-bidity. As a result, settled water and finishedwater quality deteriorated several hours after theraw water turbidity increased. Without the use ofa trend chart this correlation would be difficult toobserve.
Figure 5-5. Special study format.
Special Study Topic: Identify name of the special studyand briefly describe why the study is being conducted(i.e., one to two sentences).
Hypothesis:Focused scope. Try to show definite cause/effectrelationship.
Approach:Detailed information on conducting study. Involveplant staff in development.
Duration of Study:Important to define limits of the study since “extrawork” is typically required.
Expected Results:Projection of results focuses attention on interimmeasurements and defines success or limitations ofeffort.
Conclusions:Documented impact of study allows the effort to beused as a training tool for all interested parties. Allowscredit to be given for trying an approach.
Implementation:Identifies changes or justifies current operatingprocedures. Formalizes demonstratedmechanisms to optimize plant performance.
74

Figure 5-6. Short term trend chart showing relationship of raw, settled and filtered water turbidities.
0-l
0 4 a 12
Tlme (hrs)
I16 20 24
Prioritv Settina Tools
The CTA facilitator uses the priority setting model(i.e., Figure 5-2) to aid in establishing priorities forimplementing a CTA. Awareness of this modelcan be provided to utility personnel to aid them insetting routine priorities for utility activities.
Another method that is useful for utility personnelto aid in developing their priority setting skills isthe nominal group process. This mechanism usesa facilitator (e.g., the CTA facilitator initially andthe utility champion or other staff as the CTA pro-gresses) to solicit input from plant personnel dur-ing a formal meeting by asking an open-endedquestion concerning optimization activities. Aquestion such as “What concerns, activities, ormodifications, can we address to continue to pur-sue optimization performance goals at our utility?”can be asked to start the discussion. Participantsare given time to develop ideas and the facilitatorthen solicits responses one at a time from eachperson in a round-robin fashion. After all ideas aredocumented (e.g., on a flip chart or chalk board)the ideas are discussed for clarity and overlap.The participants then priority vote on the issues(e.g., vote for the top five issues, allowing fivepoints for the top issue, four for the second issue,etc.). Topics are prioritized by the number ofvotes that they get, and ties are differentiated bythe number of points. Based on the combinedresults of all of the voting, the highest priorityissues are identified. These issues are discussed,
and action steps are identified and placed on anaction list. Example results from a priority settingactivity are shown in Figure 5-7.
The nominal group process encourages involve-ment of all parties and provides significant trainingduring the open discussion of prioritized topics.The CTA facilitator can interrupt the discussions iftechnical inaccuracies exist; but, for the most part,the facilitator should try to maintain a neutral role.It is important to note, however, that the nominalgroup process is only effective after the CTA isunderway and the initial key priorities have beenimplemented. After the initial efforts, the utilitypersonnel are more aware of the purpose of theCTA and better equipped to contribute meaningfulsuggestions concerning optimization activities. Itis up to the CTA facilitator to ascertain whenutility personnel are able to effectively utilize thistool.
Tooic DevdODtTWIt Sheets
Topic development sheets (see Figure 5-8) can beused to develop problem solving skills in utilitypersonnel. In utilizing the topic developmentsheet, the issue should be clearly defined. Anideal starting point would be a prioritized issuedeveloped from the nominal group process. TheCTA facilitator, initially, and utility champion, asthe CTA progresses, would lead the discussion onusing the topic development sheet format.
75

Figure 5-7. Example priority setting results from-CT A s i t e v i s i t activity -
and the associated activity also enhances commu-nication skills among the staff.
Question: What concerns, activities or modifications canbe addressed to continue to pursue optimization goals atyour utility?
Figure 5-8. Example topic development sheet.
List of Rewonses: TOPIC DEVELOPMENT SHEET
1. Post backwash turbidity spikes
2. Retention of trained staff
3. End point for CTA project
4. Eliminate washwater return
5. Drought impact (color, taste and odor, rationing)
6. Flow indicators on chemical feeders
7. Reconsider particle counter capability
8. Recognition for utility staff by regulatory agency
9. Recent budget constraints
10. Public relations on optimization efforts
1 1. Maintaining optimization approach
Topic/Issue:
Benefits:
Possible Obetacles: Possible Solutions:
Prioritized Topics:
Rank Item Votes Points1 Flow indicators on chemical
feeders 6 24
2 Post backwash turbidity spikes 6 23
3 Retention of trained staff 5 17
4 End point for CTA project 4 7
5 Maintaining optimizationapproach 3 1 0
6 Recognition for utility staff 3 5
Action Steps: l
* ransfer to an Action Plan.
Internal Support
Figure 5-8, provides a section listing obstacles.Typically, it is easier for participants to discuss thereasons why an idea will not work. After theobstacles are presented, the facilitator shouldfocus the group on possible solutions. The facilita-tor should have the group pursue a solution foreach obstacle. While the discussion occurs, thebenefits for making the change can be listed in thebenefits section of the sheet. The solutionsshould be converted to action steps and docu-mented on the sheet. The action steps should besubsequently transferred to the optimization actionplan.
Use of the topic development sheet is effective inenhancing the problem solving skills of utility per-sonnel. The tool allows obstacles to be presentedbut requires that solutions and action steps also bedeveloped. Use of the topic development sheet
The CTA facilitator must ensure that internalcommunication to maintain support for the CTAoccurs at all levels of the organization. This istypically done through routine meetings (e.g.,during site visits) or with summary letters andcommunication events. Internal support is key todevelop during the conduct of a CTA and can beuseful in accomplishing desired changes. Typi-cally, a CTA introduces a “new way of doing busi-ness” to the water utility. This new approach isnot always embraced by the existing personnel.Support from the personnel department or theadministrative staff can be utilized in establishingthe “acceptable behavior” required of the utilitystaff to support the CTA objectives. For example,the CTA facilitator and utility champion may haveclearly defined a new sampling procedure tosupport the optimization efforts. If a staff memberwill not comply with the approach or continues toresist the change, administrative pressure can be
76

solicited if internal support for project activitieshas been maintained.
What-If Scenarios
Many facilities have very stable raw water sourcesand as such are not challenged with variations thattest the capability of facilities and personnel torespond and maintain optimized performancegoals. In some facilities this is true even if theduration of the CTA is over a period of a year orgreater. In these facilities, factors relating to reli-ability and complacency often need to beaddressed. The CTA facilitator can create “what-ifscenarios” for the utility personnel to address.Development of these scenarios may be the onlyopportunity during the conduct of the CTA to pre-pare local personnel for challenging situations.“What-if scenarios” should only be utilized afterthe plant staff have gained experience and confi-dence from CTA training activities.
5.2.2.3 Correcting Performance LimitingFactors
A major emphasis of a CTA is addressing factorsidentified as limiting performance in the CPE phaseas well as additional limiting factors that may beidentified during the CTA. Correcting these fac-tors provides a capable plant and allows the opera-tional staff to utilize improved process control(operation) to move the plant to achievement .ofoptimized performance goals. Approaches thatcan be implemented to enhance efforts ataddressing factors in the areas of design, admini-stration, maintenance and operation are discussedin the following sections.
Desiqn Performance Limitina Factors
The performance of Type 3 plants is limited bydesign factors that require major modifications tocorrect. Major modifications require the develop-ment of contract documents (i.e., drawings andspecifications) and hiring a construction companyto complete the improvements. Examples includethe addition of a sedimentation basin or expansionof a clear well. Major modifications can some-times be avoided by operating the plant at a lowerflow rate for longer periods of time; therebyreducing the unit process hydraulic loading rate toa range that allows adequate performance to beachieved. CTA experience with Type 2 facilities
may.support the need for major construction; andonce this has been established, utility staff shouldpursue this direction similar to a Type 3 facility.
The performance of Type 1 and Type 2 plants canoften be improved by making minor modificationsto the plant. A minor modification is defined as amodification that can be completed by the plantstaff without development of extensive contractdocuments. Examples of minor modificationsinclude: adding a chemical feeder, developingadditional chemical feed points, or installing bafflesin a sedimentation basin.
A conceptual approach to improving design per-formance limiting factors is based on the premisethat if each proposed design modification can berelated to an increased capability to achieve opti-mized performance goals, then the modificationwill be supported. For example, if a chemicalfeeder is necessary to provide a feed rate in alower range than current equipment can provide,then the design modifications are needed to pro-vide a capable plant so that desired process con-trol objectives can be met (see Figure 5-2). Theneed for this minor modification can be easilydocumented and justified to the administration.Support for the modification would be expected.
The degree of documentation and justification forminor modifications usually varies with the associ-ated costs and specific plant circumstances. Forexample, little justification may be required to adda sampling tap to a filter effluent line. However,justification for adding baffles to a flocculationbasin would require more supporting information.Extensive justification may be required for a facilitywhere water rates are high and have recently beenraised, yet there is no money available for an iden-tified modification.
The CTA facilitator should assist in developing theplant staff skills to formally document the need forminor modifications. This documentation is valu-able in terms of presenting a request to supervi-sory personnel and in providing a basis for theplant staff to continue such requests after the CTAhas been completed. For many requests the spe-cial study format can be used as the approach fordocumenting the change (see Special Studies sec-tion previously discussed in this chapter). Formodifications with a larger cost, the followingitems may have to be added to the special studyformat.
77

. Purpose and benefit of the proposed change(i.e., how does the change relate to the devel-opment of a.capable plant so that process con-trol can be used to achieve performancegoals?).
. Description of the proposed change and anassociated cost estimate.
Many state regulatory agencies require that modi-fications, other than repair and maintenance items,be submitted for their approval. Improvementsrequiring state approval may consist of items suchas changing types of chemicals added to the water(e.g., substituting iron salts for aluminum salts),adding another chemical feeder (e.g., filter aidpolymer feeder), or modifying filter media. If thereis any doubt as to whether approval is needed, thefacilitator should recommend submitting the pro-posed modification to the regulatory agency forapproval. Typically, the same documentation thatwould be prepared to obtain administrativeapproval can be used for the submittal to theregulatory agency.
Once the proposed modification has beenapproved by plant administrators and the stateregulatory agency, the CTA facilitator should serveas a technical reference throughout the implemen-tation of the modification. Following completionof a modification, the CTA facilitator shouldensure that a formal presentation of the improvedplant capability is presented to the administration.This feedback is necessary to build rapport withthe plant administrators and to ensure support forfuture requests. The intent of the presentationshould be to identify the benefits in performanceobtained from the expended resources.
Maintenance Performance Limitina Factors
Maintenance can be improved in nearly all plants,but it is a significant performance limiting factor inonly a small percentage of plants (2,3,4). Thefirst step in addressing maintenance factors is todocument any undesirable results of the currentmaintenance effort. If plant performance isdegraded as a result of maintenance-relatedequipment breakdowns, the problem is easilydocumented. Likewise, if extensive emergencymaintenance events are experienced, a need forimproved preventive maintenance is easily recog-nized. Ideally, maintenance factors should havebeen previously identified and prioritized during aCPE. However, most plants do not have such
obvious evidence directly correlating poor mainte-nance practices with poor performance; therefore,maintenance factors often do not become apparentuntil the conduct of a CTA. For example, in manycases CTA activities utilize equipment and proc-esses more extensively than they have been usedin the past, such as running a facility for longerperiods of time. The expanded use emphasizesany maintenance limitations that may exist.
Implementing a basic preventive maintenance pro-gram will generally improve maintenance practicesto an acceptable level in many plants. A sug-gested four-step procedure for developing a main-tenance record keeping system is to: 1) list allequipment, 2) gather manufacturers’ literature onall equipment, 3) complete equipment informationsummary sheets for all equipment, and 4) developand implement time-based.preventive maintenanceactivities. Equipment lists can be developed bytouring the plant and by reviewing availableequipment manuals. As new equipment is pur-chased it can be added to the list. Existing manu-facturers’ literature should be inventoried to iden-tify missing but needed materials. Maintenanceliterature can be obtained from the manufactureror from local equipment representatives.
Equipment maintenance sheets that summarizerecommended maintenance activities and sched-ules are then developed for each piece of equip-ment. Once these sheets are completed, a com-prehensive review of the information allows atime-based schedule to be developed. This sched-ule typically includes daily, weekly, monthly, quar-terly, semiannual, and annual activities. Forms toremind the staff to complete the tasks at thedesired schedule (e.g., check-off lists) can bedeveloped.
The above system for developing a maintenancerecord keeping system provides a reliable founda-tion for implementing a preventive maintenanceprogram. However, there are many other goodmaintenance systems, including computer-basedsystems. The important concept to remember isthat adequate maintenance is essential to reliablvachieve optimized performance goals.
Administrative Performance Limitina Factors
Administrators who are unfamiliar with plantneeds, and thus implement policies that conflictwith plant performance, are a commonly identifiedfactor. For example, such items as implementing
78

minor modifications, purchasing testing equip-ment, or expanding operator coverage may be rec-ognized by plant operating personnel as neededperformance improvement steps, but changescannot be pursued due to lack of support by non-technical administrators. Administrative supportand understanding are essential to the successfulimplementation of a CTA. The following tech-niques have proven useful in addressing adminis-trative factors limiting performance:
Focus administrators on their responsibility toprovide a “product” that not only meets butexceeds regulatory requirements on a continu-ous basis to maximize public health protection.Often, administrators are reluctant to pursueactions aimed at improving plant performancebecause of a lack of understanding of both thehealth implications associated with operating awater treatment plant and of their responsibili-ties in producing a safe finished water. TheCTA facilitator must inform and train adminis-trators about their public health responsibilitiesand the associated objectives of achievingoptimized performance goals from their facili-ties. As an endpoint, administrators should beconvinced to adopt the optimum performancegoals described in Chapter 2. Administratorsshould also be encouraged to emphasize to theoperating staff the importance of achievingthese goals.
Build a rapport with administrators such thatcandid discussions concerning physical andpersonnel resources can take place (e.g., seeInternal Support section previously discussedin this chapter).
Involve plant administrators from the start.Site visits should include time with keyadministrators to explain the CTA activities. Ifpossible, conduct a plant tour with the admin-istrators to increase their understanding ofplant processes and problems. Share perform-ance results on a routine basis.
Listen carefully to the concerns of administra-tors so that they can be addressed. Some oftheir concerns or ideas may be unrelated to thetechnical issues at the plant, but are veryimportant in maintaining internal support forongoing CTA activities.
Use technical data based on process needs toconvince administrators to take appropriateactions.
l Solicit support for involvement of plant staff inthe budgeting process. Budget involvementhas been effective in encouraging more effec-tive communication, in motivating plant staff,and in improving administrative awareness andunderstanding. This activity also helps toensure continued success after the CTA facili-tator is gone.
. Encourage development of a “self-sustainingutility” attitude. This requires financial plan-ning for modification and replacement of plantequipment and structures, which encouragescommunication between administrators andplant staff concerning the need to accomplishboth short and long term planning. It alsorequires development of a fair and equitablerate structure that requires each water user(i.e., domestic, commercial, and industrial) topay their fair share. The revenues generatedshould be sufficient to support ongoing oper-ating costs as well as short term modificationand long term replacement costs. The CTAfacilitator may choose to encourage the utilityto gain professional help in this area,depending on the circumstances. Informationis also available from other sources (5,6,7).
Operational Performance Limitinu Factors
Obtaining optimized performance goals is ulti-mately accomplished by implementing formalprocess control procedures, tailored for the par-ticular personnel and plant. Additionally, the proc-ess control skills must be transferred to the localstaff for the CTA to result in the plant having thelong term capability to maintain the desired per-formance goals.
Initial efforts should be directed toward the train-ing of the key process control decision-makers(i.e., on-site CTA champion). In most plants withflows less than 0.5 MGD, one person typicallymakes and implements all major process controldecisions. In these cases, on-the-job training ismost effective in developing skills and transferringcapability. If possible, in plants of this size a“back-up” person should also be trained. Thisperson may be an administrator or board memberat a very small utility. As the number of operatorsto be trained increases with plant size, the needfor classroom training also increases. However, asignificant aspect of the CTA’s effectiveness is the“hands-on” training approach; therefore, anyclassroom training must be supported by actual
79

“hands-on” applicability and use. The only excep-tion to this emphasis is in addressing complacencyissues with “what if scenarios” (see What If Sce-narios section previously discussed in this chap-ter).
A generic discussion of process control for watertreatment facilities is presented. The CTA facilita-tor must identify deficiencies in any of the follow-ing areas and implement activities to address theselimitations, recognizing existing facility and per-sonnel capabilities.
Process Sampling and Testing:
Successful process control of a water treatmentplant involves producing a consistent, high qualitytreated water despite the variability of the rawwater source. To accomplish this goal, it is nec-essary that the performance of each unit processbe optimized. This is important because a break-down in any one unit process places a greaterburden on the remaining processes and increasesthe chance of viable pathogenic organisms reach-ing the distribution system and consumers’ taps.By optimizing each unit process, the benefit ofproviding multiple barriers prior to the consumer isrealized.
To optimize each unit process, information mustbe routinely obtained and recorded on raw waterquality and on the performance of the various unitprocesses in the plant so that appropriate controlscan be exercised to maintain consistent treatedwater quality. The term “routinely” is stressedbecause it is necessary to have the plant achieveperformance objectives at all times when it is inoperation. To allow information to be gatheredand for process control adjustments to be madewhenever water quality conditions dictate, staffshould be available during all periods of operation.If staffinq is not available, continuous wateraualitv monitorinq with alarms and shutdowncaoabilitv should exist.
The gathering of information in an organized andstructured format involves development of a proc-ess control sampling and testing schedule. Abasic process control sampling and testing sched-ule for a conventional plant is shown in Figure 5-9.Turbidity is the primary test because it provides aquick and easily conducted measurement todetermine particulate levels and particle removaleffectiveness of individual plant unit processes.Particle counting can be used in conjunction with
80
turbidity; however, most small facilities are not yetusing this technology. Raw water turbidity testingshould be conducted on a frequent basis (e.g.,every four hours) to identify changes in quality.During periods of rapid change, raw water tur-bidity should be measured on a more frequentbasis to allow adjustment of coagulant aids. Set-tled water turbidity from each basin should bemeasured a minimum of every four hours to moni-tor the effectiveness of the settling process and todocument that the integrity of this barrier is beingmaintained. If the effectiveness of sedimentationdeteriorates (e.g., due to the unexpected failure ofan alum feeder), the monitoring allows immediatecorrective actions to be taken to minimize orlessen the impact on downstream unit processes.Filtered water turbidity should be measured andrecorded on a continuous basis from each filter toallow constant monitoring of filtered water quality.Continuous monitoring of filtered water tremen-dously enhances the operators’ capability to prop-erly time backwashing of filters, to determine theextent of post backwash turbidity breakthrough,and to observe if filter control valve fluctuationsare impacting filtered water turbidity.
The process control data should be recorded ondaily sheets, and this data should be transferred tomonthly sheets to allow observation of waterquality trends. For turbidity measurement, maxi-mum daily values are recorded since this repre-sents the worst case potential for the passage ofparticles. Appendix K includes examples of bothdaily and monthly process control sheets. Thedaily sheets should include space for recordingactual chemical feed rates and the conversion ofthese values to a mg/L dosage so that dosage andwater quality can be correlated. This database canthen be used by the operator to better predictchemical feed requirements during different rawwater quality events. Graphs and trend chartsgreatly enhance these correlation efforts. The useof computer spreadsheets is encouraged to sup-port data development and the use of trend charts.
Chemical Pretreatment and Coagulant Control:
The selection and control of chemical coagulants,flocculants and filter aids is the most importantaspect of improving water treatment plant per-formance. Therefore, a method to evaluate differ-ent coagulants and to control the selected coagu-lant is a primary focus in implementing a processcontrol program. The special study format is

especially effective for systematically optimizingchemical pretreatment.
A coagulant control technique must exist or beimplemented during a CTA if optimized perform-ance is to be achieved. Example coagulant controltechniques include: jar testing, streaming currentmonitors, zeta potential, and pilot filters. Jartesting is the most common technique and is dis-cussed in more detail.
To successfully implement jar testing as a coagu-lant control technique requires understanding ofstock solution preparation and conducting the testso that it duplicates plant operating conditions asclosely as possible. A typical procedure for pre-paring stock solutions, conducting jar tests, anddetermining mixing energy settings is shown inAppendix L. Stock solutions must be prepared forall coagulant chemicals (e.g., metal salts andpolymers) that are going to be added to the jars.
The jar test can be set up to represent plant oper-ating conditions by setting jar test mixing energyinputs, mixing times, and settling detention timessimilar to those found in the plant (Appendix LI.Plant mixing energy (i.e., G-values) can be deter-mined by using worksheets presented in thedesign section of Appendix F. The use of squarejars is recommended because square jars break upthe circular motion inherent in cylinders and moreaccurately represent plant operating conditions.
Chemicals should also be added to the jars to tryto duplicate plant operating conditions. For exam-ple, if alum is added to the plant flash mix andpolymer is added to a pipeline approximately30 seconds downstream from the flash mix, the
same sequence should be used in the jar test. Theuse of syringes without needles to measure anddeliver the appropriate chemical dose to each jarsimplifies the chemical addition step (i.e., 1 cc =1 mL). Syringes are available from pharmacies orveterinary/farm supply stores. The jar test proce-dure should be adjusted to more closely duplicatethe plant processes. In direct filtration plants, asmall volume (about 50 mL) of flocculated watershould be removed from the jars and passedthrough filter paper. Typically, 40 micron filterpaper (e.g., Whatman #40, Schleicher and Schuell#560) can be used to approximate filter perform-ance. The filtered samples should be tested forturbidity, and the sample with the lowest turbidityrepresents the optimum chemical dose.
In conventional plants, the jar contents should beallowed to settle for a period of time relative to thesurface overflow rate of the basins. The approachfor determining the sampling time for settled wateris shown in Appendix L. Allowing the water in thejar to settle for 30 to 60 minutes and then taking asample for turbidity measurement has no relation-ship to a full-scale plant and should not be donefor collecting useful jar test information. After thecorrect sampling time is determined, samplesshould be drawn from the sample tap located10 cm from the top of the jar, and the turbidity ofthe sample should be determined. The lowest tur-bidity represents the best chemical dosage. Ifsample taps are not available on the jars, pipettescan be used to draw-off samples from the jars.Excellent references are available to guide thefacilitator in implementing jar testing techniques toobtain optimum coagulant doses (8,9,10,11 I.
Figure 5-9. A basic process control sampling and testing schedule.
Sample
Plant lnfluant
SedimentationBasin
Filter Effluent
Treated orFinished Water
Sample Location I Tests I Frequency I Sample By
Tap by Raw WaterTurbidimeter
Top of FilterI
Turbidimeter
Turbidity Continuous MeterPH Daily Operator
Alkalinity Weekly OperatorFlow Rate Continuous MeterJar Test As Needed Operator
Temperature Daily Operator
Turbidity Every 2 Hours Operator
I I
Turbiditv Continuous Meter
Lab Tap PH DailyCl1 Residual Continuous
Turbidity Every 4 Hours
MeterMeter
Operator/Mater
81

Once the correct chemical dose is determined, thestaff must be able to adjust the chemical feedersto deliver the desired dosage. This requires theability to conduct chemical calculations and todevelop and utilize calibration curves for chemicalfeeders. For example, a mg/L dose has to be con-verted to a feed rate (e.g., lb/day or mL/min) inorder to correctly adjust chemical feed equipment.Calibration curves which indicate feed rate settingversus feeder output must be developed for allchemical feeders to assure the correct feeder set-ting for a given desired chemical dosage. Somechemicals, such as polymers, must often be pre-pared in dilute solutions prior to introduction intothe plant flow stream. Therefore, the capability toprepare chemical dilutions must be transferred tothe operators during the CTA. Example chemicalfeed calculations are presented in Appendix M,and a procedure to develop a chemical feeder cali-bration curve is shown in Appendix J.
Chemical addition must not only be carefully con-trolled, but the correct type of coagulants, floccu-lants and filter aids must be applied.
. A positively charged product (e.g., metal salt,cationic polymer, polyaluminum chloride)should be added for coagulation. Coagulantstypically require good mixing so they should beadded to the rapid mix.
. If alum is being utilized with a raw water pHexceeding 8.0 to 8.5, consideration should begiven to switching to iron salts, sodium alumi-nate or polymerized products.
l The use of a flocculant polymer to enhancefloe formation and settling can also be investi-gated.
. Investigation of filter aid polymers should beconducted since these products are oftenrequired if filtered water turbidities less than0.1 NTU are to be achieved on a continuousbasis. Flocculant and filter aids typically havean anionic or nonionic charge, and they shouldbe introduced into the plant flow stream at apoint of gentle mixing, since excessive turbu-lence will shear the polymer chains and reducethe product effectiveness.
. For low alkalinity waters (e.g., <20 mg/L),consideration should be given to adding alka-linity (e.g., soda ash, lime).
Some chemicals should not be added at the samelocation. For example, the addition of lime andalum at the same point is counter-productive if thelime is raising the pH to the extent that the opti-mum range for alum coagulation is exceeded. Theaddition of powdered activated carbon at the samelocation as chlorine is also detrimental since thecarbon will quickly adsorb the chlorine, inhibitingthe ability of both chemicals. The addition of chlo-rine, potassium permanganate or other oxidant, incombination with some polymers, will result in theoxidation of the polymer, with a subsequentreduction in its effectiveness.
Unit Process Controls:
Optimization of unit processes requires that thoseparameters that can be controlled to adjust proc-ess performance be identified and incorporatedinto a plant specific process control program.Ideally, existing process control procedures andinput from plant staff are used to develop thisprogram, This usually must be supplemented byinformation from the CTA facilitator based onexperience at other facilities, equipment manuals,or networking with peers. Multiple unit processesand their unique control features exist in watertreatment facilities. An overview of the more con-ventional unit processes and their associated con-trols is presented in the following sections.
Mixinq, Flocculation, and Sedimentation. Themain controls for mixing, flocculation and sedi-mentation unit processes include the following:
l Plant process flow rate and flow splittingbetween unit processes operating in parallel
l Type of chemical and chemical feed rate (seeChemical Pretreatment and Coagulation Con-trol section previously discussed in thischapter)
l Flocculation energy input
l Sludge removal
. Floe break-up at the effluent of sedimentationtanks
Plant flow rate is a primary control at many smallplants that are operated for less than 24 hourseach day. At these plants an excessive hydraulicloading rate on the flocculation/sedimentationprocesses can be avoided by operating at a lower
82

flow rate for a longer period of time. This pro-vides an option to meet more rigorous perform-ance requirements with existing units withoutmajor capital improvements. The capability toreduce plant flow rate to improve performance isoffset by the need to staff the plant for longerperiods of time, which adds to operating costs.Therefore, plant administrators and staff, in con-junction with the CTA facilitator, must evaluatethese options.
If multiple basins exist, flow splitting to ensureequal loading to the units should be monitored andcontrolled. Often, performance monitoring (e.g.,turbidity) of individual sedimentation basins can beused to indicate unequal flow splits.
Flocculation energy input is often fixed at smallplants, either by hydraulic flocculation systems orby constant speed flocculation drives. However,flocculation energy, if low enough to allow forma-tion of settleable floe, is not considered an essen-tial variable to achieve desired performance of asmall plant. More important are the plug flowcharacteristics of the flocculation system. Plugflow characteristics, similar to those found in mosthydraulic flocculation systems, result in the forma-tion of floe particles of uniform size, which greatlyaids settleability. As such, greater priority may beplaced on installing baffling in flocculation systemsrather than trying to optimize mixing energies.Adequate time for chemical reaction is typicallymore important when the water temperature isless than 5OC, and under these conditions per-formance can be improved by reducing plant flowrate.
Sludge needs to be removed from conventionalsedimentation basins frequently enough to preventsolids carryover to the filters. The frequency ofsludge removal can be determined by using a coresampler to monitor build-up in the basin. Theduration of sludge removal can be determined bycollecting samples during draw-off (e.g., every30 seconds) and determining when the sludgebegins to thin. A centrifuge, graduated cylinder,or lmhoff cone can be used to observe the densitychanges.
Sludge control is very important in the operation ofreactor type upflow sedimentation basins thatoperate using a sludge blanket. The reactor sec-tion of the basin must be monitored daily, and theappropriate amount of sludge must be removedfrom the basin to maintain the optimum reactorconcentration and sludge blanket depth. Inade-
quate monitoring of the basin can lead to a loss ofthe sludge blanket over the weirs, which signifi-cantly degrades unit process performance and,ultimately, filter performance. A 100 mL gradu-ated cylinder has been used to monitor sludgemass in a reactor type basin. A volume of 18 -25 mL of sludge in a 100 mL cylinder, after fiveminutes of settling, has provided satisfactory per-formance at one location (12).
Another issue to consider is the possibility of floebreakup after the settled water leaves the sedi-mentation basins. Depending on the chemicalconditioning used in the plant, coagulated particlesmay break apart because of turbulence when thesettled water is conveyed to the filtration process(e.g., sedimentation effluents with large elevationchanges at the discharge of the basin). If floebreakup is suspected, operational changes, suchas flooding the effluent weirs, can be tried toassess if performance improves. Additionally, theuse of a filter aid can assist in overcoming the det-rimental impacts of floe breakup.
Filtration. The controls for the filtration processinclude the following:
l Coagulation control
l Filtration rate control
l Filter aid chemical and chemical feed rate
l Backwash frequency, duration and rate
l Filter to waste
Proper chemical pretreatment of the water prior tofiltration is the key to acceptable filter perform-ance. Improper coagulation (e.g., incorrect feedrate, inappropriate coagulant) fails to produce par-ticles that can be removed within the filter or toproduce particles large enough that they can beremoved by sedimentation. Because of thisimpact, the importance of a good plant specificcoagulant control technique cannot be overempha-sized.
For waters that are properly chemically condi-tioned, filter flow rate becomes less critical. Themost important aspect of flow rate relative to filterperformance is the magnitude and rate of changeof flow rate adjustments (4,131. Rapid, high mag-nitude flow rate can cause a large number ofparticles to be washed through the filter. This canbe observed by the associated increases inturbidity measurements or particle counts. Sincethe filters are the most effective barriers to cysts,
83

even short term performance deviations canpotentially expose consumers to significantconcentrations of cysts.
Filtration rate changes most often occur duringbackwashing events, raw water pumps cycling onand off, start-up of filters, and periods when filterrate controllers malfunction.
l When one filter is removed from service forbackwashing, many operators leave plant flowrate the same and direct the entire plant flowto the remaining filter or filters. At plants witha limited number of filters this places aninstantaneous, high magnitude flow increaseon the remaining filters. This is frequentlyinherent in automatic backwash control sys-tems where the plant was not designed toadjust flow during backwash. This can beprevented by lowering the plant flow rate priorto removing the filter from service, therebycontrolling the hydraulic loading to theremaining on-line filters.
l Rapid changes in plant influent flow by startingand stopping constant speed raw water pumpsalso encourages the loss of particles from fil-ters. This may be prevented by using a man-ual or automatic control valve to slowly adjustplant influent flow rate.
l Start-up of dirty filters can also result in thewashout of entrained particles. Backwashingof filters prior to returning them to service isessential to maintain the integrity of this unitprocess.
l Malfunctioning filter rate control valves canresult in rapid changes in filtration rates. Theimpact of filter rate control valve malfunction-ing is difficult to identify without continuouson-line monitoring. An ongoing preventivemaintenance program can be effective to keepthe valves in good working order and to avoidthis source of poor filter performance.
The utilization of a low dose of filter aid polymercan improve filtered water quality from dual ormixed media filters. These products are veryeffective but, if overdosed, can quickly blind afilter. They, therefore, should be used at optimumdoses (i.e., typically less than 0.1 mg/L) to avoidexcessively short filter runs. Once activated,these products are subject to shearing because oftheir long polymer chains and should be fed at
points of low turbulence, such as flocculationbasins or sedimentation basin effluent lines,
During a filter run, backwashing must occur beforeparticle breakthrough occurs. Filtered water tur-bidity should be monitored continuously, and thefilter should be backwashed at the first indicationof an increasing turbidity trend. Particle countershave recently been used to monitor individual fil-ters at some plants. Results have shown that par-ticle breakthrough is indicated prior to deteriora-tion in filtered water turbidity (14,15). Excessivefilter runs (e.g., greater than 48 hours) can some-times make filters difficult to clean during back-wash due to media compaction and can cause anincrease in biological growth on the filter. How-ever, filter run times are site-specific and shouldbe determined at each treatment plant. Onemethod to assess filter run time is to conduct aspecial study involving microscopic evaluations offiltered water throughout the filter run (16,17).Particle breakthrough, as measured by turbidity orparticle counting, should always remain a primarycontrol in establishing filter run times.
The filter backwash duration and intensity must besufficient to clean the filter, but not so great thatdamage occurs with the support gravel andunderdrain system or media is washed out of thefilter. A filter bed expansion test can be used toassess the adequacy of backwash rate (see theField Evaluations section discussed in Chapter 4).The backwash duration should be long enough toadequately clean the media, otherwise filter per-formance will degrade and mudballs could form inthe media. The filter should be probed periodically(e.g., semi-annually) to inspect for support gravelproblems and to check media depths. Propercleaning can be evaluated by inspecting the filtermedia for mudballs and overall cleanliness. Filtersoccasionally require the addition of media (i.e.,topping due to washout of media during back-wash).
Operating guidelines should be developed todescribe consistent methods of backwashing fil-ters. Guideline content should include measuresto: 1) prevent rapid flow rate increases to theremaining on-line filter(s), 2) ensure that the filteris properly cleaned, 3) prevent damage to the filterby operating at excessive flow rates or openingvalves too quickly, and 4) return a filter to service.When a filter is returned to service followingwashing, it should be rested for a period of time toallow the media to consolidate before it isrestarted, or it should be slow-started by gradually
84

increasing the filtration rate over a period of30 minutes (18). Conducting a special study todefine backwash procedures that result in theachievement of optimized performance goalsshould be completed and serve as the foundationfor the backwash guideline.
At some plants where operational adjustments donot allow filters to return to optimized performancegoals within 15 minutes following backwash, moreaggressive steps may be required. These includeaddition of coagulant to the water used to back-wash the filter or modifications to provide filter towaste capabilities. Some utilities have found thataddition of coagulants to the backwash waterhelps in minimizing turbidity spikes by conditioningthe filter prior to returning it to service. Filter towaste allows the initial filtered water to bedirected to a drain until the quality achieves theperformance criteria, at which time it can be redi-rected to the clearwell. These approaches shouldonly be implemented after other less costlyapproaches described above have proven ineffec-tive during a series of special studies.
Disinfection. The controls for the disinfectionprocess include the following:
l Contact time
l Disinfectant concentration
. Disinfectant application point
To prove adequate disinfection, the plant unitprocesses, including disinfection, must meet astate-specified criteria for log reduction/inactiva-tion of Giardia and viruses. Presently, this criteriais defined as achieving a CT value outlined in theSWTR Guidance Manual (191. The CT value,which is the concentration of disinfectant (mg/L)multiplied by the effective contact time (minutes)prior to the first user’s tap, is affected both byplant flow rate and the concentration of the disin-fectant applied. The maximum concentration ofdisinfectant that can be added because of effec-tiveness and aesthetic concerns (taste and odor) isnormally 2.5 mg/L as free chlorine residual.Therefore, adjustments to contact time offer thebest process control option for optimizing disinfec-tion. Most plants apply chlorine as a disinfectantto the filtered water prior to a clearwell. Theclearwell is typically designed as a storage basinfor backwash water or a wet well for finishedwater pumps and not as a disinfectant contactor.As a result, there are no baffles or other means tomake the basin plug flow, and the clearwell
basin’s small size provides limited contact time.Reducing the plant flow rate, operating at greaterclearwell depth, or baffling the basin can often beused to gain more effective contacting.
Adding a chlorine application point prior to theplant rapid mix to provide contact time in rawwater transmission lines and flocculation. andsedimentation basins can also be evaluated. How-ever, this practice, while allowing greater CT val-ues to be obtained, may cause the formation ofexcessive disinfection by-products. State regula-tory personnel should be consulted prior to initiat-ing this practice.
If operational changes cannot be made to achievethe specified CT values, modifications to the plantmay be required to provide sufficient disinfectantcontact time. It is noted that actual levels of disin-fection required for water treatment plants is pres-ently established by the state where the plant islocated. Additionally, future regulations mayimpact disinfection practices (20). Modificationsto a plant’s disinfection system should include athorough review of proposed regulations andcoordination with the state regulators.
5.3 Case Study
A case study of a CTA is difficult to presentbecause many of the activities are conducted overa long period of time and include numerous eventssuch as on-site training, transfer of technical andinterpersonal skills, weekly data review, phoneconsultations and site visits, and multiple specialstudies. Since these activities do not lend them-selves readily to the case study format, an abbre-viated overview of a CTA will be presented.
5.3.7 CPE Findings
A CPE was conducted at a conventional watertreatment plant that included facilities for chemicaladdition, rapid mixing, flocculation, sedimentation,filtration, and clearwell storage. Raw water wassupplied to the plant from a reservoir fed by ariver. The facility was constructed in 1994 andhad a rated design capacity of 13 MGD. The plantis operated 24 hours per day and serves approxi-mately 23,000 people.
The performance assessment of the plant revealedthat this new facility had not consistently met the0.5 NTU turbidity limit required by the 1989
85

SWTR (21) during its first year of operation. Infact, enforcement action was being considered bythe state regulatory personnel due to the frequentviolations. Turbidity values at the levels observedindicated that the plant was definitely not achiev-ing optimized performance goals as described inChapter 2. Along with not meeting the filteredwater optimization goals, the plant had inconsis-tent sedimentation basin performance with peaksas high as 8 NTU. Turbidity spikes of 0.6 NTUafter backwash were also found.
The major unit process evaluation revealed that allof the major unit processes had sufficient physicalcapacity to support achievement of optimized per-formance goals. The rated design capacity of thefacility was 13 MGD, and the peak instantaneousflow rate was 7.5 MGD. All of the major unitprocesses were rated above the 13 MGD capa-bility.
Three major performance limiting factors wereidentified in the CPE. The highest ranking factorwas related to the operations staff’s capability toapply proper process control concepts to improvethe performance of their facility. Performancemonitoring and process control testing were notconsistent, and data was not developed nor usedto make process adjustments. Limited efforts hadbeen completed to define optimum chemical feedstrategies. Backwashing practices were inconsis-tent and not focused on limiting turbidity spikes orshortening recovery time after filters were placedback in service.
The second factor was related to administration.Specific administrative policies were limiting per-formance of the plant by failing to create an envi-ronment necessary to support optimization. Start-
/ up training for the operators in connection withthe new facilities was deleted as a cost savingmeasure. Optimization goals were not embracedby administrative personnel, and personnelchanges at the plant had resulted in conflictingdirectives to the plant staff and confusion overwho was in charge.
The third factor was related to design with severalissues related to process controllability. The loca-tion of the recycle line from the sludge and back-wash storage pond was after the point of chemicaladdition to the raw water. This prevented theplant staff from properly monitoring and control-ling the coagulation chemistry of the blended rawwater. Chemical feed facilities were also contrib-uting to the performance problems since several
chemical feed pumps were oversized for currentflows and sufficient flexibility had not been pro-vided with respect to adding chemicals at variouslocations in the plant.
A CTA was initiated at the plant to attempt toachieve optimized performance goals. The dura-tion of the CTA was about 18 months, and high-lights from the project are summarized below.
5.3.2 C TA A c tiviries
5.3.2.1 Initial Site Visit
During the initial site visit, the CTA facilitator usedthe CPE results and the priority setting model toprioritize activities. At the CTA facility, cautionhad to be taken to consider the potential adverseimpact of any changes on plant performance andpublic health since the facility was producingunacceotable finished water quality. A contin-gency plan was developed that included plantshutdown, lowering plant flow rate, and initiatingan order to boil water. Fortunately, the staff hadimproved process monitoring (e.g., began indi-vidual filter monitoring and initiated sedimentationbasin monitoring) after the CPE exit meeting.These steps had resulted in process controlchanges that allowed improved performance and,for the most part, compliance with the SWTR.After the CPE, the plant staff had also dealt withthe oversized chemical feed pumps by interchang-ing with others within the plant. They also madeprovisions for some additional chemical feedpoints.
A key step in the CTA was the identification of thelocal CTA champion. The person selected was thenew superintendent for the utility. Although hewas new to the position, it was felt that he wasthe best choice for utility champion and was thebest person to assist the CTA facilitator in makingthe necessary changes to the “old ways of doingbusiness.”
Jar testing procedures were developed, and rou-tine testing was initiated. A sampling and jar testset-up modification was implemented to allow jartesting to be conducted on the blended raw waterand recycle water. Based on the jar test results,the need for coagulant dosage adjustments wasindicated. The operations staff participated in allof the testing and data development. Despite theresults, the staff was reluctant to make changes.This stemmed from the fact that jar testing had
86
never been a routine activity at the plant and,thus, the operators lacked the confidence to takejar tests results and use the information to makechemical feed changes in the plant. However, astaff consensus of “We don’t think it will work,but we can try it” was achieved. Preliminaryresults during the site visit were very encouraging.
A formal meeting was set up between the CTAfacilitator and the plant staff to discuss additionalhigh priority items. The topics for discussion wereestablished by the CTA facilitator. During thismeeting, optimized unit process performance goalswere established. The guidelines in Chapter 2were used to set the performance goals. Limitedstaff acceptance for the goals was accomplishedat this meeting because they were more focusedon just being able to meet the SWTR require-ments. In addition, they did not have the confi-dence that the optimized treatment goals could bemet. Sampling, monitoring and data recordingprocedures were also discussed. The negativeimpact of the location of the recycle line was alsodiscussed, and it was decided to pursue modifica-tion of this line with the utility administration.
An action list was developed which includedassignments to the staff to develop operationalguidelines on jar testing and unit process perform-ance sampling, monitoring, and data recording.Arrangements were made with the on-site CTAchampion to provide plant monitoring and per-formance data to the CTA facilitator on a weeklybasis.
Prior to the conclusion of the site visit, the CTAfacilitator and the on-site CTA champion met withthe City Manager and the Director of PublicWorks. The basis for the meeting was to reporton the process control changes and the action listand to initiate discussions on the desired recycleline modification. The initial response on the needfor the recycle line was “Wasn’t that the designconsultant’s responsibility?“. The CTA facilitatoridentified that the optimized performance goalsthat were being pursued required much closer con-trol than would be required to just meet the SWTRrequirements. The utility was encouraged to pur-sue modifications on their own, and the adminis-trators agreed to begin an evaluation of the possi-ble approaches for completion of -the modificationand associated costs. A discussion was also heldconcerning the less-than-enthusiastic response bythe staff to the new procedures and performancegoals. This information was provided to lay thegroundwork for administrative support if condi-
tions didn’t change. Questions were receivedfrom the administrators concerning the need andcosts of achieving water quality goals thatexceeded regulatory requirements. The publichealth implications were explained by the CTAfacilitator, with only limited acceptance on behalfof the administrative personnel. A report whichsummarized the progress made and the action listthat was developed was prepared by the facilitatorat the conclusion of the site visit.
5.3.2.2 Off-Site Activities
The on-site CTA champion provided drafts of theagreed upon guidelines as well as weekly summa-ries of plant data. The CTA facilitator reviewedthe guidelines and provided written comments tothe utility. Data review was also completed by theCTA facilitator, and trend charts were developedto aid in data interpretation.
Phone calls were made on a weekly basis to dis-cuss data trends and to follow up on action items.Feedback from the CTA champion indicated thateven after his best efforts, the plant staff were stillbalking at the increased sampling and laboratoryactivities and that the administration had not pur-sued the recycle line modification. A decision wasmade to make a return site visit to address theseissues,
5.3.2.3 Follow-Up Site Visit
During the second site visit the nominal groupprocess was used to establish priorities for con-tinued optimization activities (see Priority SettingTools section previously presented in this chapter).The issue of increased work load and lack of rec-ognition was rated high and received extensivediscussion. The CTA facilitator used the trendcharts developed from plant data to show theimprovements that had been accomplished inachieving optimized performance goals, Several ofthe operators took pride in these accomplishmentsand voiced support for the increased process con-trol activities. However, one operator remainedadamantly opposed to the changes. At the con-clusion of the discussion it was decided to con-tinue the additional process control effort for atleast several more months.
The concept of special studies was introducedduring the staff meeting, and two special studieswere developed to evaluate the use of a filter aid

polymer and to assess control of backwash spikes.Additional guidelines for turbidimeter calibrationand sludge removal from the sedimentation basinswere also discussed. An action list was developedto conduct the special studies, draft the additionalguidelines, and to pursue the modification to therecycle line.
At the conclusion of the site visit, an administra-tive exit meeting was held where the preliminarygraph of improved performance was presented.The results of the plant meeting and discussionswere presented, and support for the recycle linemodification was again requested. These discus-sions revealed that the administrators did notcompletely understand the importance of the recy-cle line modifications with respect to being able toperform effective process control. Once theyunderstood the need for timely modifications tothe recycle line, these modifications were quicklymade.
A report was prepared by the facilitator at theconclusion of the second site visit which summa-rized the progress made and the updated actionlist. The site visit was an effective mechanism todemonstrate improved performance to the utilitystaff, provide positive feedback on achievinginterim milestones, and reinforce the long termproject goals. This site visit also demonstrated theimportance of the facilitator in resolving issuesthat the CTA champion finds difficult to resolve onhis/her own.
5.3.2.4 Other CTA Activities
Activities conducted by the CTA facilitator off-siteand on-site (an additional two site visits)continued, using a similar format for anothertwelve months. During that time, the modificationto the recycle line was accomplished, and processcontrol skills were transferred to all of the plantstaff. A significant part of transferring processcontrol skills was getting all of the operators toaccurately record individual filter effluentturbidities on the plant’s process control sheets.Procedures had to be developed and implementedwhere readings above a certain level (0.1 NTU)had to be verified before being recorded. A total of23 operational guidelines were developed by theplant staff.
Acceptance of the optimization goals and theprocess control procedures to achieve them were
not quickly accepted by all of the operators. Onerecalcitrant operator was found to be underminingthe CTA champion’s efforts to get consistentprocess control procedures implemented. A sig-nificant amount of the time during the CTA wasinvolved in obtaining the administrative support toreassign this person to maintenance.
After the CPE, the plant staff made changes to theexisting piping so that polymers could be addedbefore and after the rapid mix basin. During theCTA, a decision was made that a separate polymerfeed system would also be needed so that a filteraid could be added to the sedimentation basineffluent. This was deemed necessary to meet thefilter effluent and backwash spike turbidity goals.
Controlling the turbidity spikes after filter back-wash required a significant effort by the plantstaff I Many special studies were completed toevaluate a variety of filter backwash procedures,including gradual ramping of the backwash flowand resting of the filter before returning it to serv-ice. Problems were also found with the sampletap locations when the special study resultsshowed that the spikes were eliminated on two ofthe filters but remained on the other two.
5.3.2.5 CTA Results
Figure 5-10 graphically depicts the success of thecase history CTA. There was a dramatic changefrom highly variable finished water prior to theCPE to stable, high quality finished water after theCTA.
Along with the optimized performance from theirfilters, Figure 5-l 1 shows how the plant alsoachieved the settled water turbidity performancegoals. Additionally, after much effort, the planthas essentially eliminated the turbidity spikes afterbackwash, as shown in Figure 5-l 2. A significantbenefit achieved from the CTA was the develop-ment of staff tenacity to address any deviationsfrom the optimized water quality goals. Thistenacity, coupled with the experience and confi-dence that the staff gained during the CTA, sup-ports the long term achievement of the optimiza-tion goals. This is demonstrated in Figure 5-13which shows the performance of this plant for ayear after completion of the CTA without theassistance of the facilitator.
88

Figure 5-10. Performance improvement during CTA project - filter effluent.
CPE CTA
1.6
1.4
0.6
0.0 JJm-94 FQr-94 51694 0.244 Jan-95 Apr-95 Jld-95 Od-% Jan-96 &Jr-96
Pefformana, Goal - 0.1 NTU
Figure 5-11. Performance improvement during CTA project - sedimentation basin effluent.
1
I9 I I 1 I
Apr-95 Jun-95 Aug-95 act-95 Dee-95 Feb-96
Date
89

Figure 5-12. Performance improvement during CTA project - filter backwash spikes.
5 10 15 20
Time After Filter Start-Up
25 30
Figure 5-13. Plant performance after CTA.
0.25I
0.05
o.oo 1Jan-97 Mar-97 May-97 Jul-97 Sep-97 Nov-97 Jan-98 Mar-98
Date
90

Additionally, the administrators developed pride intheir utility’s capability to maintain consistent, highquality treated water that exceeds regulatoryrequirements. Most importantly, the consumers ofthe utility’s water have benefited from the highlevel of protection against water-borne diseaseoutbreaks.
A final CTA report was prepared and was used topresent the benefits of utilizing the CTA process toplant administrators.
5.4 References
When an NTIS number is cited in a reference, thatreference is available from:
National Technical Information Service5285 Port Royal RoadSpringfield, VA 22161(703) 487-4650
1.
2.
3.
4.
5.
6.
Public Notification Regulation Rule. October1987. U.S. Environmental Protection Agency,40 CFR, Part 141, Subpart D, Reporting, Pub-lic Notification and Record Keeping.
Renner, R.C., B.A. Hegg, and J.H. Bender.March 1990. EPA Summarv Report: “Opti-mizino Water Treatment Plant PerformanceWith the Comoosite Correction Proaram.EPA 625/8-90/017, USEPA Center for Envi-ronmental Research Information, Cincinnati,OH.
Renner, R.C., B.A. Hegg, and D.L. Fraser.February 1989. “Demonstration of the Com-prehensive Performance Evaluation Techniqueto Assess Montana Surface Water TreatmentPlants. n Presented at the 4th Annual ASDWAConference, Tucson, AZ.
USEPA. February 1991. Handbook: Ooti-mizinq Water Treatment Plant PerformanceUsinq the Composite Correction Proaram. EPA625/6-91/027, USEPA Office of Research andDevelopment, Cincinnati, OH.
Water Rates and Related Charqes (M251.1986. AWWA Reference Manual, No.30026, Denver, CO.
Small Svstem Guide to Rate Settinq. Commu-nity Resource Group, Inc., Springdale, AK.
91
7 . USEPA. 1989. A Water and WastewaterM a n a a e r ’ s G u i d e f o r Stavino FinanciallvHealthv. USEPA (#430-09-89-0041, Cincinnati,OH.
8. Hudson, H.E., Jr. 1980. Water ClarificationProcesses: Practical Desiqn and Evaluation,Van Nostrand Reinhold Co.
9. Singley, H.E. June 1981. “Coagulation Con-trol Using Jar Tests.” Coaqulation and Filtra-tion: Back to Basics, Seminar Proceedinas,1981 Annual Conference, p.85. AWWA,Denver, CO.
10. Hudson, H.E. and J.E. Singley. June 1974.“Jar Testing and Utilization of Jar Test Data.”Uoqradina Existinq Water Treatment Plants,AWWA Seminar Proceedinqs, VI-79. Denver,co.
11. AWWA. 1992. Ooerational Control ofCoaaulation and Filtration Process. AWWAManual M37. AWWA, Denver, CO.
12. Process Applications, Inc. December 1990.“Summary Report - Loma, Montana WaterTreatment Plant Composite Correction Pro-gram.” Unpublished report.
13. Cleasby, J.L., M.M. Williamson, and E.R.Baumann. 1963. “Effect of Filtration RateChanges on Quality,” Journal AWWA, 55:869-878. Denver, CO.
14. West, T., P. Demeduk, G. Williams,J. Labonte, A. DeGraca, and S. Teefy. June1997. “Using Particle Counting to EffectivelyMonitor and Optimize Treatment.” Presentedat AWWA Annual Conference, Atlanta, GA.
15.
16.
17.
Veal, C., and B. Riebow. May 1994. “ParticleMonitor Measures Filter Performance. mOpflow, Vol. 20, No. 5. AWWA, Denver, CO.
Hibler, C.P. and CM. Hancock. “Inter-pretation - Water Filter Particulate Analysis.”CH Diagnostic & Consulting Service, Inc., FortCollins, CO.
Hibler, C.P. “Protocol - Sampling Water forDetection of Waterborne Particulate& Giardia,a n d Cryptosporidium.” C H D i a g n o s t i c &Consulting Service, Inc., Fort Collins, CO.

18. Pizzi, N. 1996. “Optimizing Your Plant’s Filter 21. “Surface Water Treatment Rule.” June 1989.Performance.” Opflow, Vol.22, No.5. AWWA, From Federal Register, Vol. 54, No. 124, U.S.Denver, CO. Environmental Protection Agency, 40 CFR,
Parts 141 and 142, Rules and Regulations, Fil-19. USEPA. October 1989. Guidance Manual for tration/Disinfection.
Compliance With the Filtration and DisinfectionReauirements for Public Water Svstems UsinsSurface Water Sources. NTIS No. PB-90 148-016, USEPA, Cincinnati, OH.
20. USEPA. 1997. Microbial/Disinfection By-Products Federal Advisory Committee Agree-ment in Principle. Dated June 9, 1997.Signed July 15, 1997.
92

Chapter 6Findings From Field Work
6.1 introduction
This chapter summarizes findings from the fieldactivities and draws conclusions concerning futureefforts and potential impacts of utilizing the CCPapproach in improving performance of surfacewater treatment plants.
The field activities conducted to refine the CCPapproach have focused on three distinct areas:
l Development/application of the process towater treatment plants.
l Demonstration and transfer of principles andpractices to state, third-party and utility per-sonnel.
l Incorporation of the process into an area-wideoptimization program (see Chapter 3).
In addition, the CCP approach has evolved from afocus of achieving compliance with the SurfaceWater Treatment Rule (1) to one of minimizing thepassage of Ctyptosporidium oocysts through thetreatment plant by achieving optimized perform-ance goals (see Chapter 2).
The basis for the conclusions and resultsdescribed in this chapter is drawn from 69 CPEsand 8 CTAs conducted in 17 states and Canada.The geographical distribution of the CPEs andCTAs is described in Table 6-l. The plants had awide range of peak instantaneous operating flowrates and populations served. Thirty-five percentof the plants served communities with populationsless than 3,300, with peak flow rates typicallyless than 3.0 MGD, while 10 percent of the plantsprovided service to populations in excess of50,000 persons. The majority of the systemsserved small to medium-sized communities. Largerplants typically required more time to conduct theplant tour and interviews; otherwise, the CPE pro-cess was only minimally affected by plant size.
All of the plants evaluated used surface water fortheir raw water source. The majority of the plantsutilized conventional treatment consisting of rapidmix, flocculation, sedimentation, filtration anddisinfection. Several of the plants that were
evaluated operated in a direct or in-line direct fil-tration mode. Three lime softening plants wereevaluated. In addition, several types of uniquefiltration processes were evaluated; they includedautomatic valveless gravity filters, .traveling bridgebackwashing filters, and several types of pressurefilters. The CCP approach was found to be appli-cable regardless of plant size or type.
Table 6-1. Geographical Distribution of CPEs andCTAs
CPEs CTAS CPEs
Montana 11 3 Louisiana 3
Maryland 10 Rhode Island 3
West Virginia 8 1 Wisconsin 3
Texas 7 1 Kentucky 2
Massachusetts 4 Ohio 2
Pennsylvania 4 1 California 1
Canada 4 Vermont 1
Colorado 3 1 Washington 1
Navajo Tribal 2 1Lands in Utah,New Mexico
6.2 Results of Comprehensive Perform-ance Evaluations
6.2.7 Major Unit Process Capability
A summary of the major unit process capability forthe 69 plants is shown in Table 6-2. The unitprocesses were assigned a rating of Type 1, 2 or3 depending on their projected ability to consis-tently meet optimized performance goals at thepeak instantaneous operating flow rates underideal conditions. Ideal conditions are those inwhich all ancillary features of a unit process areoperational (e.g., paddles, drive motors and inter-basin baffles are functional in a flocculation basin)and process control activities have been optimized.
93

As described in Chapter 4, a Type 1 or 2 ratingindicates that the unit processes are potentiallyadequate to consistently meet optimized perform-ance goals. A unit process rated as Type 3 wouldnot be expected to perform adequately.
Table 6-2. Summary of the Major Unit ProcessRatings for 69 Plants
The basis for rating the major unit processes hasbeen consistent for all 69 CPEs except for thedisinfection process. The disinfection process ini-tially was evaluated on the ability of a plant toprovide two hours of theoretical detention time.This was done for the initial nine plants evaluatedin Montana. The disinfection evaluation was latermodified based on the SWTR CT requirements.The disinfection ratings for the initial nine MontanaCPE sites are not included in the summary inTable 6-2.
As shown in Table 6-2, the flocculation, sedimen-tation and filtration unit processes were typicallyjudged adequate to justify attempts to optimizeperformance using existing facilities (e.g., majorunit processes rated either Type 1 or 2). Only 5percent of the flocculation and 6 percent of thesedimentation processes were judged to requiremajor capital improvements. Also, the filtrationprocesses were almost always rated as beingType 1. In some circumstances filters that hadbeen rated as Type 1 were found to require modi-fications such as media replacement because ofdamaged underdrains or support gravels; however,media replacement was not judged to be a major
construction requirement. In some circumstances,reducing the peak instantaneous flow rate andoperating the plant longer enabled a Type 3 unitprocess to be reclassified as Type 2 or 1. Basedon these findings, it was projected that 92 percent
of the plants evaluated could meet optimized per-formance goals without major capital construction.
Disinfection was evaluated at 60 of the facilitieswith respect to their ability to meet the CTrequirements of the SWTR. Post-disinfectionalone was only found capable to meet the CTrequirements in 49 percent of the plants. Theprimary deficiency was the limited contact time ofthe clearwells that were typically designed to pro-vide backwash water storage or wet wells for highservice pumps. The majority of disinfection con-tact basins were unbaffled and operated on a filland draw basis. This operation is less than idealfor optimizing contact time.
For facilities where both pre- and post-disinfectionwas practiced, 91 percent of the plants were pro-jected to comply with the SWTR CT requirements.Although use of both pre- and post-disinfectionmay allow some plants to provide adequate disin-fection capability with existing facilities, its appli-cation may be limited due to requirements relatedto the allowable levels of disinfection by-products(DBPs). Proposed requirements of the Disinfec-tants and Disinfection By-Products Rule (2) wouldestablish DBP requirements for all systems. Thefinal regulations regarding CT credit for predisin-fection will be established by individual states.Because the regulations governing disinfection arechanging, it is likely that capability projected fromthe historical CPE disinfection unit process evalua-tions will change.
6.2.2 Factors Limiting Performance
Factors limiting performance were identified foreach of the 69 CPEs utilizing the list of factorsdescribed in Appendix E. An average of eight fac-tors was identified at each plant. Each factor wasgiven a rating of A, 8, or C, depending on itsimpact on performance (see Chapter 41. Toassess the degree of impact from an overall basis,A factors (i.e., major impact on performance) wereassigned 3 points, B factors (i.e., moderate impacton performance on a continuous basis or a majorimpact on performance on a periodic basis) wereassigned 2 points, and C factors (i.e., minorimpact on performance) were assigned 1 point.The summary of factors that occurred mostfrequently and the degree of impact of the factorsidentified during the 69 CPEs are presented inTable 6-3.
94

Table 6-3. Most Frequently Occurring Factors Limiting Performance at 69 CPEs
8 Process Controllability Design 47 22
9 Flocculation Design 45 23
10 Water Treatment Understanding Operations 41 14
11 Plant Staff Administrative 40 18
12 Ultimate Sludge Disposal and/or Design 39 15Backwash Water Treatment
Three of the top twelve factors were related tooperations: Number I- Application of Concepts,Number 3 - Process Control Testing, and Number10 - Water Treatment Understanding. The overallhigh ranking of operational-related factors is ofmajor significance. Consistently achieving opti-mized performance goals requires optimization ofeach unit process in the treatment scheme. Addi-tionally, achieving optimized performance goalsrequires timely adjustments in response to chang-ing raw water quality.
Essentially, inadequate or marginal process controlprograms existed in over half of the plants whereCPEs were conducted. At 62 percent of theplants, the operators had problems applying theirknowledge of water treatment to the control of thetreatment processes. These operators could dis-cuss coagulation chemistry and filter operation buthad difficulty in demonstrating that they couldapply this knowledge to changing raw waterquality and subsequently to achieving optimizedperformance goals. Water treatment understand-ing was identified at 14 of the 69 plants. A lackof understanding means that the operators did nothave the basic knowledge of water treatment,which would make successful implementation of aprocess control testing program impossible. Sinceoperator limitations in applications of concepts and
95
limitations in water treatment understanding aremutually independent in identifying CPE factors,these results can be combined, which indicatesthat 85 percent of the plants had operational limi-tations that adversely impacted performance.
Seven of the top 12 factors were related to designaspects of the facility. While most flocculation,sedimentation, and filtration processes were foundto be of adequate size during the major unit proc-ess evaluation, limitations associated with theseunit processes contributed to their identification asfactors limiting performance. Sedimentation proc-esses were projected to be marginal at 39 plants,typically due to the inability to treat seasonal highraw water turbidities, improper placement of efflu-ent weirs that disrupted quiescent settling, andeffluent conditions that resulted in floe shear priorto filtration. Problems such as backwash limita-tions, improperly maintained rate-of-flow control-lers, and disrupted support gravels andunderdrains contributed to filtration being identi-fied as a performance limiting factor. Flocculationproblems were typically related to marginal vol-ume, lack of multiple stages, fixed speed mixerdrives that made tapered flocculation impossible,and inoperative mechanical equipment.

Disinfection was also identified as a top factorlimiting performance. As noted, the adoption offinal regulations by the states may affect thefuture results in identifying the ranking of this fac-tor. Although plants may be able to improve con-tact time by installing baffles, some plants mayrequire major capital improvements (e.g., new con-tact basins, alternate disinfectant capabilities) toaccommodate the need for greater contact timeand/or reduced DBP levels.
Process flexibility, process controllability and ulti-mate sludge disposal/backwash water treatmentwere the other design factors that were consis-tently identified. The identification of these fac-tors was usually.attributed to plants that were notequipped with the capability to add chemicals atdifferent points in the plant, were unable to oper-ate processes in different configurations (e.g.,series or parallel), were unable to measure or con-trol flows through processes, or lacked appropriatebackwash water treatment facilities that limitedthe plant’s ability to backwash filters based onperformance degradation.
It was projected that implementing minor modifica-tions, reducing peak flows, and improving processcontrol could provide alternatives at individualfacilities to avoid major modifications. Ideally,CTAs implemented at these facilities could be usedto implement these alternatives. If the CTAresults were unsuccessful, a construction alterna-tive could be more clearly pursued. It was con-cluded that, despite the high ranking for designfactors, immediate construction of major plantmodifications was not indicated or warranted.
Two administrative factors, policies and inade-quate plant staff, were among the top factorsidentified. Plant administrative policies wereobserved in 29 CPEs to be detrimental to perform-ance. Typically, these administrators were notaware of the significance of finished water quality.For example, most were unaware of the impact onpublic health of even short-term excursions fromhigh quality treated water. Additional items con-tributing to the identification of these factorsincluded plant administrators that: 1) were notaware of plant resources or training requirements,2) could not relate the impact of their decisions onplant performance and thus public health, 3) hadpolicies related to minimizing production cost atthe expense of performance, and 4) maintainedplant staffing at levels too low to support processcontrol requirements.
Eighteen of the 69 plants had a plant staff sizeconsidered to be too small to properly operate andmonitor the treatment plant. This was consideredto be critical with respect to the projected need forincreased levels of process control and monitoringrequired to achieve optimized performance goals.Staffing limitations were felt to be especially criti-cal for plants that were being operated for periodswithout staff on-site and without alarm and shut-down capability triggered by performance parame-ters.
It was interesting to note that insufficientresources were not found to be a significant factorlimiting performance of the water plants evaluateddespite the fact that lack of resources is a widelypublicized reason for noncompliance of small sys-tems. Insufficient funding was identified in only13 of 69 plants. Furthermore, in only 4 of the 13plants where insufficient funding was identified, itwas considered to be a major factor limiting per-formance. Numerous utilities had sizable capitalreserve funds, and those that did not often hadwater rates set at unreasonably low levels. It wasprojected that resources could be made availableto address operations limitations and to implementminor design modifications at these facilities.Time would be required in follow-up CTAs at theseutilities to gain administrative support and under-standing for reallocation or development ofresources, but the option to achieve this supportwas projected to be viable.
The lack of identification of any significant mainte-nance-related factors is also important to note.Maintenance-related factors were assessed ashaving a lessor or minor impact relative to theoperations and administrative factors. Only 2 ofthe 69 CPEs had a maintenance factor identifiedas having a major impact on performance. At bothfacilities, total neglect was apparent. At thesefacilities administrative policies that were contraryto supporting the integrity of the infrastructurewere also identified as factors.
6.2.3 Summary of CPE Findings
l The flocculation, sedimentation and filtrationprocesses in 92 percent of the plants wereprojected to have adequate capacity to handleplant peak instantaneous operating flows.
l Construction would be required for 13 percentof the plants if only post-disinfection were
96

allowed, and baffling of existing clear-wells isnot sufficient. Disinfection capabilities aredependent on the final interpretation andimplementation of the disinfection regulationsby individual states.
l Operations factors limited performance in 60percent of the CPEs performed. This finding,coupled with the fact that 92 percent of theexisting facilities were assessed to have ade-quate capacity to meet turbidity removalrequirements, indicates that addressing opera-tions factors could significantly improve watertreatment plant performance.
l Although design factors represent half of thetop factors identified, it was projected thatthese deficiencies could be satisfactorilyaddressed in many cases by utilizing minormodifications, decreasing plant flows, andimproving process control/operations.
l Administrative factors were identified as hav-ing a significant impact on plant performance.Training of plant administrators must be anintegral part of implementation of programs tooptimize performance.
l Administrators must assure that adequate pro-visions have been made to deal with compla-cency and reliability issues. These issues areprevalent for systems using stable high qualitysource waters where administrators and staffmay be lulled into a false sense of security byover-relying on the source water to protectthem from performance degradation. Adminis-trators need to encourage operational staff tomaintain skills relative to proper process con-trol for changing source water quality.
l Impacts due to plant size only affected theamount of time that it took to conduct theactual CPE. Larger plants required more timeto conduct the interview process due to largeroperational and administrative staffs, yet theapproach was still applicable to large systems.
l On-site performance assessments indicatedthat reported finished water turbidities wereoften not representative of true performance.Continuous recording of turbidity from each fil-ter is considered essential to provide operatorswith enough information to minimize excur-sions in treated water turbidities.
97
. Numerous plant-specific impacts on perform-ance were identified during the conduct of theCPEs:
Lack of attention to filter rate controldevices resulted in deteriorated filter per-formance.
Lack of attention to the impact of flowrate changes on operating filters resultedin deteriorated filter performance.
Starting dirty filters resulted in deterio-rated filter performance.
Filter performance immediately followingbackwash was often unsatisfactory andposed a significant health threat duringthis critical operational period. Improvedoperational practices, chemical condition-ing of the backwash water, or use ofexisting filter-to-waste provisions arealternatives to address this negativeimpact on filter performance.
Adequate process control was only prac-ticed in just over half of the plants whereCPEs were conducted.
Decreased flows and increased operatingtime offer a significant alternative to con-struction of new facilities for many smallwater treatment plants.
Exit meetings with the administratorswere identified as one of the major advan-tages of the CPE over other surveys andinspections.
6.3 Results of Comprehensive TechnicalAssistance Projects
CTAs have been conducted at eight facilities toestablish that plant performanceimproved. Seven facilities achieved improved per-formance without major capital expenditures.
remaining CTA, and improved performance wasnot documented at this facility.facilities where successful CTAs were imple-mented, four were completed when the goal was
SWTR. The remaining three facilities were com-pleted when the performance objective was the

optimized performance criteria outlined inChapter 2. It is noted that performance results ofall seven of the facilities where CTAs werecompleted would meet the proposed turbidityperformance objectives outlined in the IESWTR.(3)
The potential in existing facilities to achieve cur-rent and proposed regulatory requirements is aviable alternative for many water treatment utili-ties. More importantly, the CTA component hasdemonstrated that optimized performance goalscan be achieved at small to medium-sized facilitieswithout major construction. This capability shouldbe utilized, especially at high risk facilities, asdescribed in Chapter 3, to obtain maximum benefittoward public health protection from existingplants.
6.4 References
When an NTIS number is cited in a reference, thatreference is available from:
National Technical Information Service5285 Port Royal RoadSpringfield, VA 22161(703) 487-4650
1.
2.
3.
Surface Water Treatment Rule From FederalRegister, Vol. 54, No. 124. June 1989. U.S.
Parts 141 and 142, Rules and Regulations, Fil-tration/Disinfection.
USEPA. November 3, 1997. National PrimaryDrinking Water Regulations: Disinfectants andDisinfection Byproducts; Notice of DataAvailability; Proposed Rule. Fed. Reg.,62:212:59338.
USEPA. November 3, 1997. National PrimaryDrinking Water Regulations: Interim EnhancedSurface Water Treatment Rule; Notice of DataAvailability; Proposed Rule. Fed. Reg.,62:212:59486.
98

Chapter 7The Future: Changing Regulations and
Ale w Optimization Challenges
7.1 Introduction
This handbook presents procedures for optimizingfiltration plant performance for particle removal. Itis the intent of this chapter to discuss how, evenwhen a water system has used these proceduresand attained the desired turbidity performancegoals, the challenges of plant optimization willcontinue. Water systems face other regulatoryrequirements, both current and future, that theywill need to consider as they maintain the opti-mized turbidity performance achieved through useof the CCP procedures. While water systemsmust comply with a wide variety of drinking waterregulations, this chapter will focus on a series ofregulations known as the microbial-disinfectants/disinfection by-product regulations (M-DBP) which,from a regulatory perspective, represent one of thebiggest challenges facing water suppliers over thenext several years. It is not intended that thischapter discuss the detailed requirements of theseregulations or serve as the definitive resource onthe technical issues around these regulations.Most of these regulations have not been finalized;and, when finalized, USEPA will provide detailedguidance on the specific requirements and therelevant technical information needed to comply.
7.2 Background on M-DBP Regulations
The M-DBP regulations were the result of a regula-tory negotiation process (Reg-Neg) in 1993 (1,2,3)between the USEPA and representatives of thewater supply industry over mutual concerns aboutthe possible health impacts of microbial pathogensand DBPs. The following concerns were identifiedduring discussions to identify ways to minimizehealth risks:
1. The adequacy of microbial control, especiallyfor Cryptosporidium, under the current SurfaceWater Treatment Rule (SWTR).
2. The possibility that, if systems were to reducelevels of disinfection to control DBPs, microbialcontrol could be compromised.
99
Control of microbial pathogens and DBPs werelinked together in these regulatory discussionsbecause of a fundamental concern that operationalchanges to control DBPs could potentially lead tochanges in treatment. These changes couldadversely impact microbial pathogen control,Regulations for microbials and DBPs, therefore,needed to simultaneously consider the inherenttradeoff of public health risks associated withchanging treatment practices for reducing levels ofDBPs along with the potential risks of lowermicrobial pathogen control. In order to balancethese “risk-risk” tradeoffs, separate regulations formicrobial pathogens and DBPs are to be promul-gated with effective dates set such that water sys-tems will have to comply with both regulations atthe same time.
The original M-DBP Reg-Neg agreement includedthe following:
l A “Stage 1 fl DBP regulation that would applyto all systems. This regulation would initiallyapply to systems with a population of> 10,000. Systems with a population of< 10,000 would have extended compliancedates.
l A “Stage 2” DBP regulation to evaluate theneed for further reductions in DBPs when morehealth effects and occurrence informationbecomes available.
l An “Interim” Enhanced SWTR (IESWTR) forPWSs > 10,000 to address improvements inmicrobial control and risk-risk trade-off issuesrelated to the “Stage 1 N DBP regulation whichwould be implemented at the same time.
l A “Long Term” ESWTR (LTESWTR) thatwould apply to PWSs C 10,000 which wouldbe implemented when they are required tocomply with the “Stage 1 n DBP regulation.This regulation could also include enhance-ments that would also apply to the large sys-tems.

During the Reg-Neg process there was alsoagreement that additional data and research wasneeded on occurrence, treatment capabilities, andhealth effects of both microbials and DBPs to pro-vide a sound technical basis for these regulations.These issues were to be resolved by:
l An Information Collection Rule (ICR) to collectoccurrence and treatment information toevaluate possible components of an IESWTR,LTESWTR, and “Stage 2” DBP regulations.
l Additional research, including health effectsstudies, to support regulatory development.
In July 1994, USEPA proposed a “Stage 1 II DBPregulation (4) and an IESWTR (51 which reflectedthe 1992-93 negotiations. The ICR was promul-gated in May 1996 (6) with data collection start-ing in July 1997 and continuing for 18 months.Based on this schedule, the ICR data will not becollected, validated and available for regulationdevelopment until January 2000.
In August 1996 congress passed amendments tothe Safe Drinking Water Act (SDWA) (7) thatincluded the following statutory deadlines forUSEPA to promulgate the M-DBP regulations:
. IESWTR and “Stage I* DBPs - November1998
l LTESWTR - November 2000
. “Stage 2” DBPs - May 2002
These deadlines were such that it would beimpossible to use the ICR data to develop theIESWTR and LTESWTR as intended by Reg-Neg.In early 1997, USEPA formed the M-DBP AdvisoryCommittee under the Federal Advisory CommitteeAct (FACA) to help the Agency meet the newSDWA deadlines. This resulted in an agreement inprinciple that formed the basis for the Notice ofData Availability (NODA) for the “Stage 1 N DBP (81and the IESWTR (9) to supplement the 1994proposal for these regulations. Based on com-ments on the 1994 proposals and these NODAs,the IESWTR will be promulgated in November1998. USEPA plans to promulgate the LTESWTRin 2000 in order to meet the SDWA mandate witha compliance date that will correspond to the“Stage 1 V DBP regulations for PWSs < 10,000.Even though the LTESWTR applies to PWSs< 10,000, it could include refinements for largersystems.
USEPA also plans to promulgate a “Long Term 2”ESWTR (LT2ESWTRl at the same time that the“Stage 2” DBP regulation is promulgated in orderto address risk-risk trade-offs.
7.3 M-DBP Requirements Relative toOptimized Performance Goals
The discussions above indicate that by the year2002 USEPA will have promulgated several differ-ent SWTRs and DBP regulations, and water sys-tems will be facing compliance. It is also apparentthat these regulations are interrelated such thatwater systems will need to consider the impacts oftreatment process changes from the perspective ofboth regulations. The remainder of this sectionwill discuss some of the major areas where specialconsideration of optimization with respect toM-DBP will need to be considered.
7.3.7 Treatment Technique TurbidityRequirements
Figure 7-l presents a historical perspective of tur-bidity goals and regulations. The original SDWApassed by congress in 1974 (I 0) required USEPAfor the first time to regulate turbidity. A require-ment of 1 NTU was established, which was to bemeasured at the combined plant effluent based onone sample per day. There was also a maximumturbidity level of 5 NTU. In 1989 the originalSWTR (1 I) was promulgated that lowered thecombined plant turbidity levels to 0.5 NTU basedon samples every four hours, but retained themaximum of 5 NTU.
The 1997 Microbial and Disinfectants/DisinfectionByproducts (M-DBP) Federal Advisory Committeemeetings, resulted in the collection, development,evaluation, and presentation of substantial dataand information related to turbidity control. The’FACA committee recommended that the turbidityperformance requirements be changed such thatthe combined filter effluent limit be reduced to0.3 NTU and that the maximum value be reducedto 1 NTU. In addition, the Committee recom-mended that systems conduct individual filtermonitoring and that exceptions reports be pro-vided to states under specific circumstances,namely:
100

I. any individual filter with a turbidity levelgreater than I.0 NTU based on twoconsecutive measurements fifteen minutesapart; and
2. any individual filter with a turbidity levelgreater than 0.5 NTU at the end of the firstfour hours of filter operation based on twoconsecutive measurements fifteen minutesapart.
The Committee also recommended that if an indi-vidual filter has turbidity levels greater than1.0 NTU based on two consecutive measurementsfifteen minutes apart at any time in each of threeconsecutive months, the system should berequired to conduct a self-assessment of the filter,utilizing as guidance relevant portions of guidanceissued by the Environmental Protection Agency forComprehensive Performance Evaluation (CPE).Also, if an individual filter has turbidity levelsgreater than 2.0 NTU based on two consecutivemeasurements fifteen minutes apart at any time ineach of two consecutive months, the systemshould be required to arrange for the conduct of aCPE by the State or a third party approved by theState.
The IESWTR is scheduled for promulgation inNovember 1998, at which time the specificturbidity requirements and provisions will beavailable. EPA WITI issue detailed guidance at thattime on the relevant technical information neededto comply with the rule. Both the L TElES WTRand L TZESWTR are in pre-developmental stages.
Figure 7-1 also shows the turbidity goal of0.1 NTU that was discussed in previous chaptersof this handbook and how regulated turbidity lev-els are approaching this long held turbidity goal.This is not intended to predict that future regula-tions will be set at the 0.1 NTU level, but toencourage plants to pursue the 0.1 NTU perform-ance goals outlined in this handbook, as a way toassure regulatory compliance on a combined plantbasis.
7.3.2 RemovaMnactivation Requirements
The original SWTR required water systems to pro-vide a minimum of 3-log removal/inactivation ofGiardia cysts. State regulatory agencies thatreceived primacy from USEPA were given broadlatitude in how plants would meet this require-ment, including the option to increase theremoval/inactivation requirements for water sys-tems that may have higher levels of cysts in theirsource water. Rule guidance stated that properlyoperating filtration plants could be expected toremove between 2.0 to 2.5~log of Giardia cysts,and this removal could be credited against the3-log requirement. The remaining log removal wasto be achieved with disinfection. Log removalcredits for various disinfectants and operatingconditions were provided in tables of disinfectantconcentration (Cl multiplied by the contact time(TI .
A major impetus for the IESVVTR was that Crypto-sporidium was not regulated under the original
Figure 7-1. Historic perspective of turbidity goal and regulations.
1.5SDWA (1 .O NTU)
J SWTR (0.5 NTU)
s l-5 IESVVTR (0.3 NTU:
sstz 0.5-
\/
Optimized Performance Goal (0.1 NTU)

SWTR. This was of concern since chlorine is notan effective disinfectant against Cryptosporidium,and the impact of other disinfectants (e.g., ozone,chlorine dioxide) has not been well established.
The 1997 M-DBP Federal Advisory Committeerecommended adoption of a 2-log Cryptosporidiumremoval requirement for all surface water systemsthat serve more than 10,000 people and arerequired to filter. The committee also recom-mended that systems which use rapid granularfiltration (direct filtration or conventional filtrationtreatment - as currently defined in the SWTR) andmeet strengthened turbidity requirements wouldbe assumed to achieve at least a 2-log removal ofCryptosporidium. Systems which use slow sandfiltration and diatomaceous earth filtration andmeet existing SWTR turbidity performancerequirements (less than 1 NTU for the 95th per-centile or alternative criteria as approved by theState) also would be assumed to achieve at least a2-log removal of Ctyptosporidium.
The IESWTR is scheduled for promulgation inNovember 7998, at which time the specificremoval requirements and provisions will beavailable. EPA will issue detailed guidance at thattime on the relevant technical information neededto comply with the rule. Both the L TE 1ESWTRand L T2ES WTR are in pre-developmental stages.
7.3.3 DBP Maximum Contaminant Levels(MCLsl
DBPs were first regulated in 1979 (12) when anMCL of 0.10 mg/L was established for the sum offour trihalomethanes (THM), which applied to onlythose water systems serving populations> 10,000 persons. As discussed above, the pur-pose of the M-DBP regulations is to reduce thehealth risk for these compounds and other DBPsby promulgation of disinfectant and disinfectantby-product (D/DBP) regulations to be implementedin two stages. The NODA for Stage 1 of theD/DBP rule has lowered the MCL for THMs and anew MCL has been added for the sum of five addi-tional compounds called haloacetic acids (HAA,).The NODA also contains maximum residual disin-fectant levels (MRDLs) permitted in the distributionsystem.
Fundamental control procedures for THMs andHAAs remain essentially the same and include:
l Removal of natural organic matter (NOM),which are precursors, in the raw water.
l Altering the point of disinfectant addition.
. Reducing the amount of disinfectant used.(NOTE: This may not be feasible because ofmicrobial backstop requirements.)
l Switching to alternate disinfectants,
In conventional treatment, NOM is removed by acoagulation/adsorption mechanism accomplishedby changing the coagulation process to enhancethe removal of these organics. A potential con-flict exists from the standpoint of plant process
meet the optimized turbidity performance goalsdescribed in this handbook may not be compatible
goals. Some research has shown, however, thatenhanced coagulation conditions also achieved
ies have evaluated the impacts of enhancedcoagulation on filterability which may be more of aproblem.
Altering the plant’s disinfection practices to meetthe DBP MCLs, either through changing the pointof disinfectant addition or lowering the disinfectantdose, can potentially also lead to other types ofconflicts. When disinfectants are added ahead of
can also provide additional important benefits(e.g., enhance the coagulation process for tur-bidity removal, enhance iron and manganese con-trol, etc.) along with meeting the plant’s CTrequirements. Lowering pre-disinfection doses toreduce DBP formation, therefore, could result inturbidity performance problems or higher levels ofiron and manganese in the finished water. Themajor consideration in changing disinfection prac-tices to control DBPs, however, is to assure thatthe change will not result in compliance problemswith state SWTR disinfection and the IESWTRmicrobial backstop requirements. The major unitprocess evaluation described in Chapter 4 presentsdisinfection conditions (e.g., chlorine residual, pH)that are necessary to achieve desired inactivationlevels.
If none of the above process control changes aresufficient to control DBPs, then the utility mayhave to consider alternate disinfection including
102

ozone, chlorine dioxide, or chloramines. Ozoneand chlorine dioxide will result in major modifica-tions to the treatment plant and will require thedesign and installation of new treatment processesand equipment. Chloramines, depending on theplant, may be considered a modification thatwould be addressed as part of a CTA.
7.3.4 Enhanced Coagulation Requirements
The Stage 1 DBP regulations. proposed in theNODA for the first time require surface water sys-tems that use conventional treatment or softeningto remove a specified minimum percentage of thetotal organic carbon (TOC) from their raw waterusing a process called enhanced coagulation. TOCremoval is required because other DBPs besidesTHMs and HAAs are formed when disinfectantsreact with a NOM, measured as TOC. The occur-rence and health effects of these unidentifiedDBPs are unknown at this time. The intent of thispart of the proposed regulation is to control theformation of unknown, as well as known, DBPs byrequiring that a minimum percentage of NOM inthe raw water, measured as TOC, is removed bythe plant.
The percentage of TOC removal required is basedon the TOC and alkalinity levels of the plant’s rawwater. These TOC removal requirements arebroken down into nine different percent TOCremoval categories. They are presented in a tablefor three different alkalinities and raw water TOClevels.
Plants that cannot meet the specified percent TOCremovals will follow a “Step 2” procedure todetermine what levels of TOC removal are “rea-sonable and practical” to achieve. The plant usesthis information to request an alternative TOCremoval requirement from its primacy regulatoryagency.
The “Step 2” procedures consist of special jartests to determine the maximum percent TOCremoval that they can achieve by incrementalincreases in coagulant dose. Coagulant dose isincreased in 10 mg/L increments until a specifiedpH level (depending on the raw water alkalinity) isachieved. Residual TOC levels in each jar are thenmeasured, and an analysis is made of the “point ofdiminishing return” (PODR). The PODR is definedas when a 10 mg/L increase in coagulant does notdecrease the residual TOC by more than 0.3 mg/L.This percentage TOC removal would then be con-
sidered “reasonable and practical” and would beused in discussions with the primacy agency rela-tive to giving the plant an alternate enhancedcoagulation requirement.
When a water system meets one of a variety ofconditions it may be exempted from the enhancedcoagulation part of the regulation. It was recog-nized that only the humic fraction of the raw waterTOC is amenable to removal by enhanced coagula-tion. Plants, therefore, with high levels of non-humic TOC may not be able to meet any of theenhanced coagulation removal requirements andcould be exempt from this part of the regulations.Plants can assess the amount of humics in theirraw water by measuring its specific UV absorb-ance or SUVA. SUVA is defined as the UVabsorbance divided by the dissolved organic car-bon (DOC). SUVAs of ~3 L/mg-cm representlargely non-humic materials, and SUVAs in the4-5 L/mg-cm range are mainly humic. SUVA val-ues can also be used to request exemption fromthe regulations and to determine PODR.
Plants may find that achieving desired TOCremoval will require some significant changes inplant process control procedures. Enhancedcoagulation typically requires that additionalcoagulant and/or acid is added to depress the pHto a point where the TOC is removed in thecoagulation process. As with control of DBPs,potential conflicts exist from the standpoint ofplant process control procedures. Chemical feedrates needed to meet the turbidity performancegoals in this handbook may not be compatible withthose needed for enhanced coagulation.
7.3.5 Microbial Backs top
As discussed above, the Reg-Neg agreementrequired that the M-DBP regulations would balancethe risk-risk tradeoffs between control of microbialcontaminants and DBPs. Control of DBPs was notto result in any decrease in microbial protection.Since alteration of disinfection practices is oneway of controlling DBPs, major concern wasexpressed during the 1997 FACA process regard-ing reduced disinfection capability. An approachwas needed to make sure that water systems didnot change disinfection practices to control DBPsand decrease microbial protection.
The approach that resulted from these discussionswas the microbial backstop. As part of the micro-bial backstop requirements, water systems will be
103

required to prepare a disinfection profile when theyapproach specified levels of THMs and HAAs. Adisinfection profile is a historical characterizationof the system’s disinfection practices over a periodof time using new or “grandfathered” daily moni-toring data. A disinfection profile consists of acompilation of daily Giardia log inactivation valuesbased on SWTR CT tables. These calculations willbe based on daily measurements of operationaldata (disinfectant residual concentration(s); con-tact time(s); temperature(s); and, where neces-sary, pH(s)).
The second part of the microbial backstoprequirement is benchmarking, which quantifies thelower bound of the system’s current disinfectionpractices. It is intended that water systems takethe results from the profiling and work with thestate regulatory agency to evaluate changes indisinfection practices which could be used to con-trol DBPs so that these changes result in no sig-nificant decreases in microbial protection. Bench-marking is only required if a PWS intends to makea significant change to its disinfection practicessuch as moving the point of disinfection, changingdisinfectants, changing the disinfection process, orany changes the state considers significant.
Part of the concern that led to the microbial back-stop was based on data that showed water plantswith widely varying disinfection levels. Figure 7-2shows a profile where it is apparent that the plant
was not operating their disinfection systems atany common baseline. Day-to-day variationsabove the state disinfection requirement could becaused by plants not determining their required CTbased on seasonal changes in water temperatureand pH and/or not having close operational controlover the actual CT provided by the plant. Anexample would be not changing the applied disin-fectant dose to respond to changes in the requiredCT, disinfectant demand, and/or operating flow.Plants could also be adding disinfectant for othertreatment issues such as to control Fe, Mn, algae,and/or taste and odor. The microbial backstopwould require water systems to understand inmore detail how much disinfectant they areapplying on a daily basis, and it would force themto make rational decisions on why they are addinghigher levels of disinfectant above that required forthe state’s disinfection requirements.
7.4 Summary
Water systems pursuing optimization for publichealth protection must remain vigilant concerningthe ramifications of new and changing regulations.Those plants that have met the optimizedperformance goals defined in this handbook shouldbe well positioned to take those regulations instride and continue to meet the ever morestringent challenges facing the water industry.
Figure 7-2. Example of disinfection profile daily variations in log inactivation.
Why the Difference?*Improper Operational Practices-Fe and Mn Control
t *Taste and Odor
104

7.5 References
1.
2.
3.
4.
5.
6.
Means, E.G. and SW. Krasner. February1993. “D-DBP Regulation:cations.” Journal A WWA,c o .
Pontius, F.W. September
Issues and Ramifi-85:2:68. Denver,
1993. “Reg-NegProcess Draws to a Close.” Journal AWWA,85:9:18. Denver, CO.
Roberson J.A., J.E. Cromwell, S.W. Krasner,M.J. McGuire, D.M. Owen, S. Regli, and R.S.Summers. October 1995. “The D/DBP Rule:Where did the Numbers Come From?” JournalA WWA, 87:10:48. Denver, CO.
USEPA. July 29, 1994. National PrimaryDrinking Water Regulations: Enhanced SurfaceWater Treatment Requirements; ProposedRule. Fed. Reg., 59:145:38832.
USEPA. July 29, 1994. National PrimaryDrinking Water Regulations: Disinfectants andDisinfection By-products; Proposed Rule. Fed.Reg., 59:145:38668.
USEPA. May 14, 1996. National PrimaryDrinking Water Regulations: MonitoringRequirements for Public Drinking Water Sup-plies. Fed. Reg., 61:94:24353.
7.
8.
9.
US Code. August 6, 1996. Title XIV of thePublic Health Service Act (The Safe DrinkingWater Act) as Amended by Public Law 104-182.
USEPA. November 3, 1997. National PrimaryDrinking Water Regulations: Disinfectants andDisinfection By-products; Notice of DataAvailability; Proposed Rule. Fed. Reg.,62:212:59338.
USEPA. November 3, 1997. National PrimaryDrinking Water Regulations: Interim EnhancedSurface Water Treatment Rule; Notice of DataAvailability; Proposed Rule. Fed. Reg.,62:212:59486.
10. USEPA. December 4, 1975. National InterimPrimary Drinking Water Regulations. EPA-570/9-76-003.
11 USEPA. June 29, 1989. Filtration and Disin-fection: Turbidity, Giardia lamblia, Viruses,Legionella, and Heterotrophic Bacteria; FinalRule. Fed. Reg., 54: 124:27486.
12. USEPA. November 29, 1979. National Pri-mary Drinking Water Regulations: Control ofTrihalomethanes in Drinking Water; Final Rule.Fed. Reg., 44:231:68624.
105

Chapter 80 ther CCP Considerations
8.1 Introduction
The purposes of this chapter are to present train-ing requirements for persons wanting to conductCCP activities and to identify parameters that canbe used by CCP providers or recipients of CCPservices to assure quality control of the CCPapproach. In addition, a brief discussion is pre-sented concerning the applicability of the CCPapproach to other optimization and complianceactivities that a utility may be required to achievenow or in the future.
8.2 Developing CCP Skills
8.2. 7 WE Training Approach
In Chapters 4 and 5 the type of training and expe-rience necessary to implement CPEs and CTAswas discussed. In addition to these basic skillrequirements, it has been demonstrated thathands-on training is very effective for developingCCP skills in interested parties. For conductingCPEs, a training approach has been formalized anddemonstrated with several state drinking waterprogram personnel. The training consists of train-ees participating in a one-day seminar that pro-vides instruction and workshop opportunities forthem to become familiar with the CPE terminologyand approach. This seminar is followed by threeactual CPEs where the trainees gain CPE skillsthrough progressive training that is facilitated byexperienced CPE providers. The roles of the CPEprovider and trainee are described in Table 8-1.During the first CPE, the trainees are involved inthe data collection and special study activities butare largely in an observation role during the kick-off meeting, interview, and exit meeting activities.Involvement in the remaining two CPEs is gradu-ally increased such that by the time the third CPEis conducted the trainees are responsible for all ofthe activities. CPE provider observation andinvolvement take place only when necessary.
This approach has proven to be very effective intransferring CPE skills to trainees. Currently, thetraining process is scheduled over a four to six-
month period. It is noted that in addition to thetraining activities, a quality CPE must be providedto the water utility. Because of this expectation,the number of participants that can be trainedwhile still completing the CPE must be limited toabout four to six people.
8.2.2 CTA Training Approach
Participation in the CPE training, as described inthe previous section, is considered a prerequisiteto participation in CTA training. Training for per-sonnel to implement CTAs has followed a formatsimilar to the one used for CPE training. CTA pro-viders can be used to progressively transfer skillsto trainees through the conduct of actual CTAactivities. The difficulty with this approach is thefact that the CTA typically occurs over a 6 to 18-month period. Also, routine telephone contactwith the facility can only be effectively imple-mented by one person. The current trainingapproach consists of CTA provider and traineeinvolvement at site visits, with the provider sup-plying technical assistance to a designated traineewho maintains routine contact with the utility per-sonnel. The CTA provider utilizes telephone callsand exchange of materials (e.g., telephonememos, operations guidelines, plant data) to main-tain trainee involvement. Although the approachand time commitment limit the number of traineesinvolved, effective transfer of CTA skills has beenachieved.
A key component of CTA training is the emphasison providing problem solving and priority settingcapability to the utility staff. Using this approach,the trainees must learn not to “lead with theirtroubleshooting skills” but rather to recognize howto utilize situations to enhance utility priority set-ting and problem solving skills. This does notmean that CTA providers do not give technical oradministrative guidance when necessary; they onlyuse these activities when they are absolutely nec-essary to accomplish the long term transfer ofcapability to the utility staff and administration.
107

Table 8-1. Training Approach to Achieve Transfer of CPE Skills
Training Activity CPE Provider Role Trainee Role
CCP Seminar l Present CPE seminar l Participate in seminar(1 day)
First CPE l Conduct kick-off meeting . Observe kick-off meeting(3-4 days)
l Facilitate data collection . Participate in data collection
. Conduct special studies l Participate in special studies
l Conduct interviews . Observe interviews
l Facilitate information exchange with team l Review exit meeting materials
l Prepare exit meeting materials . Observe exit meeting
l Conduct exit meeting . Review final report
l Facilitate feedback session with team
l Prepare final report
Second CPE l Conduct kick-off meeting . Participate in kick-off meeting(3-4 days)
l Facilitate data collection l Participate in data collection
l Conduct special studies . Participate in special studies
l Conduct interviews l Participate in interviews
. Facilitate information exchange with team l Prepare exit meeting materials
l Finalize exit meeting materials l Participate in exit meeting
. Facilitate exit meeting . Prepare final report
. Facilitate feedback session with team
. Review draft report
Third CPE l Observe kick-off meeting l Conduct kick-off meeting(3-4 days)
l Participate in data collection l Facilitate data collection
l Observe special studies . Conduct special studies
l Participate in interviews l Conduct interviews
l Review exit meeting materials . Facilitate information exchange with team
l Observe exit meeting l Prepare exit meeting materials
. Facilitate feedback session with team l Conduct exit meeting
l Review draft report l Prepare final report
8.3 Quality Control
It is important for CCP providers and recipients ofCCPs to be aware of appropriate CCP applications,expectations of the process, and maintenance ofprogram integrity, Maintaining the integrity of theCCP approach can best be accomplished by fol-lowing the protocols described in this handbook.However, to assure effective and consistent CCPresults, quality control considerations have beendeveloped and are presented in this section.
8.3.1 CPE Quality Control Guidance
Table 8-2 presents a checklist for CPE providersand recipients to assess the adequacy of a CPErelative to the guidance provided in this handbook.Some of the key areas are discussed in more detailin this section.
A challenging area for the CPE provider is to main-tain the focus of the evaluation on performance(i.e., public health protection). Often, a provider
108

will tend to identify limitations in a multitude ofareas which may not be related to optimized per-formance criteria. Typical areas may include poorplant housekeeping practices, lack of preventivemaintenance, or lack of an operation and mainte-nance manual. Limitations in these areas areeasily observed and do not challenge the capabilityof the operations staff. While they demonstrate athoroughness by the provider to identify all issues,their identification may cause the utility to focusresources on these areas and to ignore areas morecritical to achievement of optimized performancegoals. The evaluator should be aware that a utilitywill have the tendency to take the CPE results andonly address those factors that are consideredrelatively easy to correct without consideration ofpriority or the inter-relatedness of the factors.
Table 8-2. Quality Control Checklist forCompleted CPEs
. Findings demonstrate emphasis on achievement ofoptimized performance goals (i.e., performanceemphasis is evident in the discussion of why priori-tized factors were identified).
. Lack of bias associated with the provider’s back-ground in the factors identified (e.g., all design fac-tors identified by a provider with a design back-ground or lack of operations or administrative fac-tors identified by the utility personnel conducting aCPEI.
. Emphasis in the CPE results to maximize the use ofexisting facility capability.
. AlLcomponents of the CPE completed and docu-mented in a report (i.e., performance assessment,major unit process evaluation, identification and pri-oritization of factors, and assessment of CTA appli-cation).
. Less than 15 factors limiting performance identified(i.e., excessive factors indicates lack of focus forthe utility).
. Specific recommendations are not presented in theCPE report, but rather, clear examples that supportthe identification of the factors are summarized.
. Identified limitations of operations staff or lack ofsite specific guidelines instead of a need for a thirdparty-prepared operation and maintenance manual.
. Findings address administrative, design, operationand maintenance factors (i.e., results demonstrateprovider’s willingness to identify/present all perti-nent factors).
When implementing a CPE, it is important tounderstand that specific recommendations involv-ing plant modifications or day-to-day operationalpractices should not be made. For example, direc-tion on changing coagulants or chemical dosagesis not appropriate during the conduct of a CPE.There is a strong bias for providers to give specificrecommendations and for recipients to want spe-cific checklists to implement. CPE providersshould focus their observations during the evalua-tion on two key areas: 11 identification of factorslimiting the facility from achieving optimized per-formance goals and 2) provision of specific exam-ples to support these factors.
Another significant challenge in conducting aneffective CPE is the tendency for providers to iden-tify limitations that are non-controversial ratherthan real factors that may challenge utility person-nel’s roles and responsibilities. For example, it isoften easy to identify a design limitation, since theutility could not be expected to achieve optimumperformance with inadequate facilities. It is muchmore difficult to identify “lack of administrativesupport for optimized performance goals” or anoperators ’ “inability to apply process control con-cepts” as the causes of poor performance. Failingto appropriately identify these difficult factors is adissenrice to all parties involved. A common resultof this situation is the utility will address a designlimitation without addressing existing administra-tive or operational issues. Ultimately, theseadministrative and operational issues remain andimpact the utility’s ability to achieve optimized per-formance. The challenge to properly identify thetrue factors can best be achieved by the CPE pro-vider focusing on the “greater good” (i.e., achiev-ing sustainable water quality goals). Understand-ing this concept allows the CPE provider to pres-ent the true factors, even though they may not bewell received at the exit meeting.
8.3.2 GTA Quality Control Guidance
Table 8-3 presents a checklist for CTA providersand recipients to assess the quality of a CTA. Areview of the components of the checklist wouldbe a good way to ensure that the integrity of theCTA approach has been maintained. Some of thekey components are discussed further in thissection.
109

Table 8-3. Quality Control Checklist forCompleted CTAs
. Plant specific guidelines developed by utility staff.
. Demonstrated problem solving skills of utility staff.
. Demonstrated priority setting skills of utility admini-stration and staff.
. Tenacity of plant staff to pursue process changeswhen optimized performance goals are exceeded(i;e., filtered water turbidity begins to increase andapproaches 0.1 NTU).
. Utility policy established by administrators toachieve optimized performance goals.
. Demonstrated communication between utility man-agement and staff.
. Training plan that supports front line operators tobe capable of achieving performance goals under allraw water conditions. For very stable raw waterconditions the training plan should include capabilityto address “what if” situations (e.g., avoid compla-cency).
. Adequate staffing or alarm and shut down capa-bility to ensure continuous compliance with opti-mized performance goals.
. Adequate funding to support maintaining optimizedperformance goals.
I Clear direction for utility personnel if optimized per-formance goals are not achieved.
. Trend charts showing unit processes meeting opti-mized performance objectives over long time peri-ods despite changes in raw water quality.
Quality control for a CTA is more easily measuredthan for a CPE, since the bottom line is achieve-ment of unit process and plant optimized perform-ance goals. Consequently, a graphical depiction ofperformance results can be used to demonstratethe CTA endpoint. In some cases the desired per-formance graph cannot be achieved because ofphysical limitations (e.g., a Type 2 unit processwas not able to perform as desired); however, theutility officials can then proceed with confidence inaddressing the limiting factor.
Some attributes of a successful CTA are subtleand difficult to measure. However, they ensurethat the integrity of the process is maintained afterthe CTA provider is gone. Long term performancecan only be achieved by an administrative and
operations staff that have established waterquality goals and demonstrated a commitment toachieve them. A successful CTA will result in atenacious staff that utilize problem solving andpriority setting skills in their daily routine. Plantstaff recognition of the role that they play in pro-tecting the public health of their customers cancreate a strong professional image. These attrib-utes can often be difficult to assess, but they areobvious to the utility personnel and the CTA pro-vider if they have been developed during the CTA.
One of the most difficult challenges for a CTAprovider and utility personnel is to address theissue of complacency. Complacency can occur forall parties if stable raw water quality exists or ifstable performance occurs due to the efforts of afew key personnel. It is important that a CTAprovider and the utility personnel look beyond thecomfort of existing good performance and developskills to address the scenarios that could upset thecurrent stable situation.
8.4 Total System Optimization
As current and future regulations continue to beimplemented, the challenges facing the watertreatment industry will also expand. One of thechallenges will be the integration of optimizing par-ticle removal with other, sometimes competing,optimization goals (e.g., control of disinfection by-products, corrosion control). The CCP approachhas been successfully applied to wastewatertreatment, water treatment (i.e., microbial protec-tion), and ozone applications for water treatment(1,2). Based on this success, it is anticipated thatthe CCP approach can be adapted to new drinkingwater regulations and associated requirements.Future areas for optimization, such as watershedmanagement, balancing disinfection by-productcontrol with microbial protection, and controllingwater quality in distribution systems, are believedto be suitable for development utilizing the CCPapproach. This overall approach is called totalsystem optimization, and the concept is intendedto be developed through additional pubrrcationsthat will enhance this handbook. Table 8-4 pre-sents a summary of total system optimization con-siderations for drinking water utilities.
The USEPA is funding the development of a Cen-ter for Drinking Water Optimization that will focusresearch on the impacts of new regulations onwater treatment plant process control. Results ofthis research, coupled with field applications and
110

Table 8-4. Total System Optimization Considerations for Drinking Water Utilities
Optimization Performance Optimization Activities Possible Treatment ConflictsArea Focus
Natershedl Microbial . Monitor for sources of microbialsource Water Protection contamination‘rotection . Develop watershed protection
program
. Remove/address known sourcesof contamination: developpollution prevention partnerships
. Develop emergency responseplans
Xsinfeotion By- THMs . Reduce current level of . Reduction in prechlorinationJroducts HAAs prechlorination reduces preoxidation effects and
Bromate . Relocate prechlorination to post reduces particle removal
sedimentation . Increased TOC removal increases
. Increase TOC removal sludge production/impactsfacilities
. Change disinfectant type; changefrom chlorine to chloramines for l
Lowering disinfectant residual
maintaining residual causes regrowth
. Lowering oxidant level increasesT&O
.eadZapper
Lead andCopper
. Lowering disinfectant residualreduces disinfection capability
. Corrosion control; feed corrosion l Increased pH levels could reduceinhibitor, adjust pH to achieve available CT for disinfectionstable water
?yptos,ooridium MicrobialZontrol Protection
Vant Recycle MicrobialProtection
. Achieve optimization criteriadefined in Chapter 2
. Stop recycle practices
. Stop recycle to plant; discharge l Discharge of water treatment’wastewater to sewer or obtain residuals to sewer impactspermit to discharge to receiving wastewater treatment capacitywater
DistributionSystem
MicrobialProtection
. Provide treatment of recycle forparticle removal
Develop monitoring program: Optimizing storage tank turnoverinclude routine, construction, and impacts disinfection capabilityemergency coverage
. Maintain minimum disinfectant insystem; consider boosterstations, changing from chlorineto chloramines; eliminate dead-end zones
. Develop unidirectional flushingprogram
. Cover treated water storagereservoirs
. Develop storage tank inspectionprogram, provide vent screens,routine cleaning procedure
. Maintain turnover rate in storagetanks based on monitoring results
111

Table 84. Total System Optimization Considerations for Drinking Water Utilities (Continued)
Groundwater MicrobialTreatment Protection
. Eliminate contaminants fromentering wells (i.e.. well headprotection program)
. Monitor for microbialcontamination
. Provide disinfection (e.g.,establish policy to achieve virusinactivation, CT)
evaluations, will be used to integrate total systemoptimization components with the CCP approach.
tric Power Research Institute Community Envi-ronmental Center, St. Louis, MO.
8.5 References
I. DeMers, L.D., K.L. Rakness, and B.D. Blank.1996. Ozone Svstem Enerav OotimizationHandbook. AWWARF, Denver, CO and Elec-
2. Hegg, B.A., L.D. DeMers, and J.B. Barber.1989. Handbook: Retrofittina POTWs.EPA/625/6-89/020, USEPA Center for Envi-ronmental Research Information, Cincinnati,OH.
112

Appendices
113

Section 1
Section 2
Section 3
Section 4
Section 5
Section 6
Section 7
Section 8
Figure A-l
Table A-l
Table A-2
Appendix A’Data Collection Spreadsheets and Macros for
the Partnership for Safe Water
Background on the Data Collection Spreadsheets and Macros
Selecting the Spreadsheet and Macros for Your Applications
Loading the Spreadsheet and Macros
Running the Macro Self-Test
Entering Performance Data
Activating the Macros
Printing Spreadsheet Output
Important Rules to Remember When Using the Spreadsheets and Macros
Example performance assessment data collection spreadsheet output
File Designations for Various Software Spreadsheets - Single Sample Per Day Format
File Designations for Various Software Spreadsheets - Multiple Sample Per Day Format
’ Developed by Eric M. Bissonette, Technical Support Center, USEPA.
115

Section 1 - Background on the DataCollection Spreadsheets and Macros
Spreadsheets have been prepared to assist utility
formance data (raw, settled, and filtered turbidity)
of the Self-Assessment.spreadsheets will also form the basis of reports to
the Partnership activities.
The spreadsheets have been developed to captureturbidity data from raw water, sedimentation basineffluent and filter effluent, but can be used tomanage repetitive data of any kind (e.g., particlecounts in certain size ranges, turbidity data froman individual filter, chemical dosages and flows)from any point in the process for up to 365 daysworth of data. Macros have been written to gen-erate frequency distributions, on a monthly andannual basis, to help evaluate trends and summa-rize the large amounts of data. Graphics capabili-ties of the spreadsheets ,are also built in to auto-matically plot trend charts and frequency distribu-tions. There are also capabilities for generatingsummaries of the data to report as backgroundinformation or on an annual basis. Other datasummaries within the capabilities of each spread-sheet software version could be generated as well.The spreadsheets accommodate up to six valuesper day or one value per day.
Interpretation of data from the performanceassessment is addressed in Chapter 4 of thishandbook. In general, turbidity fluctuations in rawwater being propagated through the sedimentationbasin and filter effluents could indicate inadequateprocess control or physical limitations in one or allof the major unit treatment processes. The trendcharts and frequency distributions can indicatevariability of turbidity and trends in performance.Individual filter turbidity or particle data can beexamined to determine if individual filters are notperforming up to expectations,
Each spreadsheet has memory requirements of1 MB of RAM, of which 250 KB at minimum hasbeen allocated as expanded or enhanced memory.Systems with computers incapable of allocatingmemory above 640 KB should restrict data entryto one turbidity value per day for six months
worth of data per spreadsheet. If memory con-straints persist, memory management techniquesspecified for individual software versions shouldbe utilized.
Execution of the spreadsheet macros to analyzedata, generate trend graphs, and calculate monthlypercentile distributions is straightforward. Thefollowing instructions for loading selected spread-sheets, entering data, activating macros, andprinting output were, however, generated assum-ing that users have some familiarity with spread-sheet software packages. Specific instructions forentering data are discussed in Section 5. Macroexecution for LOTUS 123 Release 2.4 spread-sheets is approximately 15 minutes on a 48625 MHz computer for twelve months of data. TheWINDOWS spreadsheet macros take four minutesto complete once activated.
The spreadsheets are designed such that uponmacro execution the user may simply print thepreviously defined range containing the percentiletables and graphs and submit this as the baselinereport (please see the attached example Perform-ance Assessment Data Collection SpreadsheetOutput). Users requiring assistance in data entryand macro execution should contact EricBissonette of USEPA/OGWDW Technical SupportDivision at (5 13) 569-7933 or e-mail requests forassistance to [email protected].
Users are encouraged to continue to use thespreadsheets to collect and analyze data after thebaseline collection effort has been completed.Simply copy the provided spreadsheet with a newfilename and continue data entry as defined foreach spreadsheet type. Continued long term useof the data management spreadsheets will assistusers in the conduct of Phase III - the self-assess-ment/self-correction phase and Phase IV - the thirdparty assessment/correction phase of the Partner-ship for Safe Water, as well as provide fundamen-tal input to a plant process control testing pro-gram.
PLEASE NOTE: Never work from the diskette con-taining the master copy of the data co//e&ionspreadsheets. Folio w instructions for copying theappropriate spreadsheet and files described in Sec-tion 3 and work from that copy.
116

Section 2 - Selecting the Spreadsheet and Section 3 - Loading the Spreadsheet andMacros for Your Applications Macros
Spreadsheets with macros have been developed toexecute in LOTUS 123 Release 2.4 for DOS and5.0 for WINDOWS, EXCEL Release 4.0 and 5.0 forWINDOWS, and QUATTRO PRO Release 5.0 forWINDOWS software systems. The spreadsheetswill accommodate data entry of a single value perday or up to six values per day. Files preceded bythe letter “d” represent spreadsheets capable ofaccommodating one sample per day. Files pre-ceded by the number “4” represent spreadsheetscapable of accommodating six samples per day (asample every four hours). Select the files corre-sponding to your application and data entry needsfrom the following table and proceed to Section 3.
The Spreadsheet files with macros have beenstored in a compressed mode on the diskette andmust be “exploded” to create the “working” fileslisted in Section 2. Files may be “exploded” asfollows:
l Start from the drive prompt of the desireddirectory (e.g., C:\l23\PA_data\I.
l Copy the appropriate “compressed” file foryour spreadsheet software application asspecified in Section 2 from the SpreadsheetMaster Diskette to a directory resident on yourhard drive.
Table A-l. File Designations for Various Software Spreadsheets - Single Sample Per Day Fdrmat
for DOS for WINDOWSSingle Component
Spreadsheets LOTUS 123 2.4 LOTUS 123 5.0 EXCEL 4.0 or 5.0 QUATTRO PRO 5.0
Compressed Files D-L24.EXE D-L5W.EXE D-XCL.EXE D-QP.EXE
Working Files D-1 23R24.WKl D-1 23R5W.WK4 D-EXCEM.XLS D-QUTPRO.WBl’
External Format D-1 23R24.FMT None None NoneFiles
External Macros None None MACRO 1 .XLM None
Table A-2. File Designations for Various Software Spreadsheets - Multiple Sample Per Day Format
for DOS for WINDOWSMultiple
Component LOTUS 123 2.4 LOTUS 123 5.0 EXCEL 4.0 or 5.0 QUAmRO PRO 5.0
Spreadsheets
Compressed Files 4-L24.EXE 4-L5W.EXE 4-XCL.EXE 4~QP.EXE
Working Files 4-l 23R24.WKl 4-l 23R5W.WK4 4-EXCEL4.XLS 4-QUTPRO.WBl
External Format 4-l 23R24.FMT None None NoneFiles
External Macros None None MACR04.XLM None
117

. For non-WINDOWS applications, simply typethe compressed filename with the .EXE exten-sion and press return (e.g., type D-L5W.EXEat the C:\l23\PA_data> prompt and pressreturn).
. For WINDOWS applications, select Run fromthe Eile submenu and type the compressedfilename with the .EXE extension and click onOKAY.
When control of the keyboard is returned to theuser:
Copy the required “External” format and macrofiles and “DATAl.WKl s from the MasterDiskette to the directory containing the newlycreated “working” file.
Return to the menu or WINDOWS screen.
Select the icon or menu option to enter thespreadsheet package (e.g., click on theLOTUS 123 Release 5.0 icon). (NOTE:WYSIWYG needs to be invoked for theLOTUS 123 Release 2.4 spreadsheets.)
Open the newly created “working” file asspecified in Section 2 and save the file under anew file name. Please note: The EXCELspreadsheets require that the macro files“ M A C R O 1 .XLM” o r “MACR04.XLM” a r eopened in addition to the spreadsheet file.Once the macro file has been opened, utilizethe HIDE feature under the WINDOW com-mand to redisplay the data entry worksheet.
Proceed to Section 4 to run the macro self-testor Section 5 to begin entering performancedata.
Section 4 - Running the Macro Self-Test
Should users have concerns about the compati-bility of the spreadsheets and macros and theirspreadsheet software package, they should con-duct a self-test of the macro. The self-test outputwill resemble the attached Example PerformanceAssessment Data Collection Spreadsheet Output.Run the self-test as follows:
l Open the “working” file created in Section 3(refer to Section 2 table file name) andsave/rename the file.
. For a single component (one sample per day1self-test: Copy range Bl ..B365 from the file“DATA1 .WKl n to cell B49..B413. Go to theSingle Component portion of Section 5 andproceed.
l For a multiple component (up to six samplesper day) self-test: Copy range Dl ..I365 fromthe file “DATA1 .WKl 0 to Cell D49..1413. Goto the Multiple Component portion ofSection 5 and proceed.
l Activate the macro using steps specified inSection 6.
l Print output using steps specified in Section 7.
The printed output should resemble the attachedExample Performance Assessment Data CollectionSpreadsheet Output. Please note: Outputs gener-ated will vary slightly due to differences in thespreadsheet software package being used. Shouldthe macro prove inoperable, reinstall the files fromthe Master Diskette and repeat the process and/orrefer to Section 8 prior to requesting assistance.
Section 5 - Entering Performance Data
Prior to entering’data, users should set the work-sheet recalculation mode to manual to decreasedata entry and macro execution time. To beginthe data entry process:
Open or Retrieve the working and external filesspecified in Section 3.
Enter the appropriate Utility/Plant specificinformation in cells F39.. F44.
Enter the last two digits of the start year incell 840 (e.g., 94 for 19941.
Enter the start month in cell 841 (e.g., 7 forJuly!.
Data entry should always begin on the first ofeach month and include the entire month.
All graphical and percentile table computationskey on the entered dates. Therefore, no datesshould be left blank.
118

For Single Component Spreadsheets (for use whenentering one value per day):
l The formula residing in cell A50 will automati-cally increase the date entered in A49 by oneday. Copy cell A50 to A51, A52, A53 and soon to the end of the year or the data entryperiod.
l After the column of dates has been generatedin Column A, begin entering data (turbidity orparticle counts, etc.) one value at a time in cellB49, B50, B51, etc. until all data has beenentered. Note: The data entry section of thespreadsheet is highlighted in yellow. Skip cellswhen no data exists for those days.
l Do NOT enter data in Column A.
For Multiple Component Spreadsheets (for usewhen entering six values per day - e.g., 4-hourdata):’
The formula residing in cell A50 will automati-cally increase the date entered into A49 byone day. Copy cell A50 to A51, A52, A53and so on to the end of the year or the dataentry period.
The formula residing in cell B49 calculates themaximum value of the six daily entries. Copycell B49 to B50, B51, B52 and so on to theend of the year or until the end of the dataentry period. Note: Until data is entered inColumns D through I, the value in Column Bwill show an “ERR” message. Ignore thismessage.
After the column of dates and formulas fordaily maximums has been generated inColumns A and B, begin entering the 40 hourdata (turbidity or particle counts, etc.) onevalue at a time in cells D49 and E49 and F49and G498 and H49 and 149, etc. until all datahas been entered. Note: The data entry sec-tion is highlighted in yellow. Skip cells whenno data exists for those days.
Do NOT enter data in Column A or B.
After all data has been entered the worksheetshould be saved with a new file name. Thiswill protect the data in the unlikely event oferror during execution of the macro.
Section 6 - Activating the Macros
To activate the macros when using:
l LOTUS 123 Release 2.4 for DOS, press theALT and F3 keys simultaneously. Highlight Aand press C Enter> or <Return>. Note: theLOTUS 123 Release 2.4 spreadsheets generategraphs during execution, and users must pressc Return> or <Enter> when graphics appearon the screen to proceed through execution.These graphs summarize previous entries andmay be confusing during the first entryprocess.
. LOTUS 123 Release 5.0 for WINDOWS orQUATTRO PRO Release 5.0 for WINDOWS,position and click the mouse button on anybutton contained within the spreadsheetlabeled “Run Macro.”
l EXCEL Release 4.0 or 5.0 for WINDOWS,press the CTRL and A keys simultaneously.
Section 7 - Printing Spreadsheet Output
To print the percentile tables and graphs generatedduring macro execution using:
l LOTUS 123 Release 2.4, invoke theWYSIWYG add-in and print the previouslydefined range by pressing <Shift:> thenselecting <Print > and <Go> after the sys-tem has been configured to the user’s printer.If the WYSIWYG add-in is unavailable, usersshould’generate and print the graph PIC filesFiltyear.PIC and Filtprob.PIC using the LOTUSPrintgraph procedures.
l LOTUS 123 Release 5.0 or QUATTRO PRORelease 5.0 or EXCEL Release 4.0 or 5.0, fol-low printing techniques specified forWINDOWS applications by clicking on a printericon (which will print the previously definedrange) or select PRINT from the Eile submenu(and select “previously defined range”) whenthe system requests a printing option. Usersmay have to adjust margins to accommodateindividual applications in order to print outputto a single sheet of paper.
119

Section 8 Important Rules to RememberWhen Using the Spreadsheets andMacros
l Please remember that the spreadsheets andmacros were developed and tested to operate
sions specified in Section 2. The spreadsheets
other release versions. Users have had suc-
for DOS spreadsheet in a Release 2.3 operat-
to execute the WINDOWS QUATTRO PRO 5.0
ALT and F2 in lieu of depressing the RUN
WINDOWS applications. Please remember that
tested by the Partnership for Safe Water soft-ware development group.
l The only DOS version of the spreadsheets isLOTUS 123 Release 2.4. All other spread-sheets are WINDOWS applications.
l Make certain that the correct spreadsheet andmacros are used for analyzing the appropriatedata based on the number of daily samples(e.g., 1 sample per day versus 6 samples perday).
. Do NOT enter more than 12 months of data onany spreadsheet. Users should create a sepa-rate spreadsheet for each 12 months worth ofdata. The spreadsheet will inaccurately depict
percentiles in the table and on the probabilitygraph when data entry exceeds one year.
Do NOT expect the percentile tables and trendand percentile graphs to update with correctvalues until the macros for the spreadsheetshave been executed. Prior to macro execu-tion, the spreadsheet percentile tables andgraphs contain data generated from the testdata.
When using the EXCEL spreadsheets do NOTopen both external macro files simultaneously.Use only the designated macro for the appro-priate spreadsheet.
Individual spreadsheets need to be created forhandling raw, settled, and filtered/finisheddata. Memory constraints preclude accommo-dating all sampling points within a singlespreadsheet.
Table and graph titles, when working inWINDOWS applications, may be edited bysimply positioning the mouse pointer on theappropriate cells and double clicking the cell.This enters the edit mode.
When using the DOS spreadsheet, the titlesmay be edited by depressing the F2 key in theappropriate cell and typing in the changes.Users must enter thethe chart/graph titles.
graph mode to modify
120

Figure A-l. Example performance assessment data collection spreadsheet output.
Daily Filtered Water Turbidity
PWOWh? YWIY JUll-94 Jul-94 Aug-94
50 0.03 0.02 0.02 0.02
75 0.04 0.02 0.03 0.02
SO 0.07 0.03 0.04 0.02
95 0.11 0.05 0.06 0.03
96 0.14 0.05 0.06 0.03
97 0.16 0.07 0.09 0.03
98 0.19 NA IA NA
09 0.20 NA IA NA
AVI 0.04 0.02 0.02 0.02
PAI 0.01 0.01 0.01 0.01
Ma: 0.54 0.07 0.09 0.03
RSI 121.9% 57.w 07.4% 27.99
Apr-050.060.120.190.200.200.22
IAIA
0.090.020.22
72.7%
Filtered Water Turbidity Probability Dietribution of All Data
0.6
10 20 30 40 50 60 70 60 90 100
Percent of time turbidity values < = X
start Year 94 365 = Total DaysMonth 6 12.00 = Total Months
Day 1
““my rrlrnc
Plant NamePlant Street AddressPlant any. state. zipPlant Contact Name

Appendix BDrinking Water Treatment P/ant (D WTF) Advisor Software
Development of the DWTP Advisor
The DWTP Advisor is a computer software appli-cation designed as an “expert system” to provideassistance in the evaluation of drinking watertreatment plants. The program was based on thesource document Interim Handbook: OotimizinqWater Treatment Plant Performance Usina theComoosite Correction Program Aoproach (1). TheInterim Handbook is the predecessor document tothis handbook, of which this appendix is a part.The software was developed to assist personnelresponsible for improving the performance ofexisting water treatment plants in order to achievecompliance with the 1989 SWTR.
The system consists of two major components:Major Unit Process Evaluation and PerformanceLimiting Factors. These two component parts weredesigned to work together. The evaluator, there-fore, cannot choose to use only one of the pro-gram’s components. In addition, the evaluatorcannot modify the loading values, some of whichare currently outdated. The software leads theevaluator through a series of questions and pro-vides responses based on the experience andjudgment of a group of experts that were used todelineate the logic for the program. The complex-ity of the multiple interrelated factors limiting per-formance and the uniqueness of individual plantsmakes production of an expert system with broadscale application difficult. This coupled with thefact that the program has not been updated forseveral years, should make persons consideringuse of the software aware of these inherentlimitations.
Even though an expert system like the DWTPAdvisor would theoretically have many uses, itscurrent level of development limits its usefulnessin conducting CPEs. Persons familiar with the fun-damental CCP concepts and who understand thelimitations of the software, however, may find it auseful tool.
Technical Information
Hardware Requirements
The DWTP Advisor requires an IBM AT or com-patible computer with the following components:
A hard disk with at least 5.0 megabytes offree space
At least 640 Kbytes of RAM (560,000 bytesuser-available)
A high density floppy disk drive (5.25” 1.2 MBor 3.5” 1.4 MB)
DOS version 3.0 or higher
A printer (EPSON compatible) configured assystem device PRN (optional)
If you installed the DWTP Advisor, but are unableto run the program, you may need to check yourcomputer’s memory configuration. Although yourcomputer may have the minimum memoryrequired, memory resident programs may usesome of this memory. “User-available” memory isthe amount of memory remaining after the oper-ating system and memory resident programs areloaded. If memory resident programs are installedand adequate memory is not available for theDWTP Advisor, an error message will appear onthe screen when you attempt to run the program.If this occurs, memory resident programs shouldbe disabled (e.g., by editing your computer’s con-figuration files, config.sys and autoexec.batI andyour computer rebooted before running the sys-tem. To check the status of your computer’s diskand available memory, run the MS-DOS CHKDSKprogram by typing CHKDSK and pressing<Enter>. For more information, see the MS-DOSmanual that came with your computer or consultyour PC support staff.
Software Specifications
The DWTP Advisor has been developed using sev-eral commercially available software tools. Thesystem interface was developed using TurboPascal 6. The “reasoning” or evaluating portion ofthe system uses the expert system shell 1STClass. The system also consists of data files indBase.dbf format.
123

Contents of the SystemThe DWTP Advisor package includes one double-sided, high density disk and complete User Docu-mentation.
A copy of the Water Advisor Software may beobtained by contacting:
ORD Publications (G-72126 West Martin Luther King DriveU. S. Environmental Protection AgencyCincinnati, Ohio 45268-l 072Telephone: 513-569-7562Fax: 5 13-569-7566
Ask for: Drinking Water Treatment PlantAdvisor Software: 625/R-96/02
124

Appendix CMajor Unit Process Capability Evaluation
Performance Po tentiaf Graph Spreadsheet Toolfor the Partnership for Safe Water
Section 1
Section 2
Section 3
Section 4
Section 5
Section 6
Section 7
Figure C-l
Figure C-2
Figure C-3
Figure C-4
Table C-l
Table C-2
Background on the Major Unit Process Capability Evaluation
The Performance Potential Graph Spreadsheet Tool
Selecting the Appropriate Spreadsheet for Your Application
Loading the Spreadsheet
Entering Plant Information/Data
Printing Spreadsheet Output
Important Rules to Remember When Using the Performance Potential GraphSpreadsheet Tool
Example performance potential graph output for LOTUS 123 files.
Example performance potential graph output for EXCEL and QUATTROPRO files.
Example performance potential graph data entry section for all files.
Performance potential graph data entry guide.
Various Software Spreadsheets - The Designations for Performance Potential Graph
Major Unit Process Evaluation Criteria
125

Section 1 - Background on the Major UnitProcess Capability Evaluation
Water treatment plants are designed to take a rawwater source of variable quality and produce aconsistent, high quality finished water using mul-tiple treatment processes in series to remove tur-bidity and prevent microbial contaminants fromentering the finished water. Each treatment proc-ess represents a barrier to prevent the passage ofmicrobial contaminants and particulates in theplant. By providing multiple barriers, any microor-ganisms passing one unit process can possibly beremoved in the next, minimizing the likelihood ofmicroorganisms passing through the entire treat-ment system and surviving in water supplied tothe public.
The performance potential graph (see Figures C-land C-2) is used to characterize capabilities ofindividual treatment processes to continuouslyfunction as a barrier for removing particulates andharmful pathogens. Each of the major unit proc-esses is assessed with respect to its capability toconsistently contribute to an overall plant treatedwater quality of less than 0.1 NTU turbidity duringpeak flows. Specific considerations are given onlyto process basin size and capability under optimumconditions. Limitations in process capability dueto minor deficiencies or incorrect operation (e.g.,degraded baffles which allow short-circuiting orimproper process control) do not contribute todevelopment of the performance potential graph.These operational or minor modification limitationsare addressed during the evaluation of the otheraspects of the treatment plant conducted as partof the Partnership for Safe Water self-assessmentprocedures.
Specific performance goals for the flocculation,sedimentation, filtration, and disinfection unitprocesses are used when developing the perform-ance potential graph. These include settled waterturbidities of less than 2 NTU and filtered effluentturbidities of less than 0.1 NTU. Capabilities ofthe disinfection process are assessed based on theCT values outlined in a USEPA guidance manualfor meeting filtration and disinfection require-ments. Rated capacities are determined for eachof the unit processes based on industry standardloading rates and detention times with demon-strated capability to achieve specific unit processperformance goals. These evaluation criteria aredefined in Table C-2 of this appendix. The result-ing unit process rated capacities are compared to
the peak instantaneous operating flow for thetreatment plant. Any unit process rated capacitieswhich do not exceed the plant’s peak instantane-ous operating flow are suspect in their ability toconsistently meet desired performance goals thatwill maximize protection against the passage ofmicrobial contaminants through the treatmentplant. Specific interpretation of the results of theperformance potential graph are discussed in Sec-tion 3 of the Partnership for Safe Water self-assessment procedures. It is important that the
Figure C-l. Example performance potential graphspreadsheet output for LOTUS 123 releases.
Major Unit Prowss EvduationPerformance Potential Graph
Flow (MGD)
2.5 5 7.5 10 12.5 15 17.5 20
unn Processes: ’ ’ ’ ’ ’ :’ Pe;k Row’
Flocculation 9.60 I :)f% MGDI
Sedimentation
Filtration
Disinfection
Pre & Post
Post Only
14.04 IiII
18 .82I III0
16 .82 IIII
8.98 1 I
:I
Figure C-2. Example performance potential graphspreadsheet output for EXCEL and QUATTRO PROreleases.
126

evaluator recognize that the guidance provided bythis computer software should not exceed theevaluators’ judgement in projecting unit processcapability. Options to change loading rate projec-tions to values different from those provided areavailable and should be considered if data or theevaluators’ experience justifies the modification.
Section 2 - The Performance PotentialGraph Spreadsheet Tool
Spreadsheets have been generated to assist UtilityPartners in creating the performance potentialgraph required for Section 3 for use in the Part-nersbip for Safe Water self-assessment proce-dures. Generating the performance potential graphrequires opening the appropriate spreadsheet fileand entering specific physical plant information inthe defined cells (see Figure C-4). A performancepotential graph will be generated automatically.Rated capacities for each unit process are gener-ated from user-defined criteria as well as from cri-teria defined in Table C-2 and discussed in Section3 of the Partnership for Safe Water self-assessment procedures. The user may print ahard copy of the performance potential graph byfollowing steps defined in Section 6 of thisappendix.
Users requiring expanded instructions for enteringappropriate information in the spreadsheet cellsshould refer to Figure C-3. Should users requireadditional assistance in preparing a performancepotential graph using the spreadsheet, please con-tact Eric Bissonette of USEPA/OGWDW TechnicalSupport Division at (513) 569-7933.
Section 3 - Selecting the AppropriateSpreadsheet for Your Application
Performance Potential Graph Spreadsheets havebeen developed in LOTUS 123 Release 2.4 forDOS and 5.0 for WINDOWS, EXCEL Release 4.0and 5.0 for WINDOWS, and QUATTRO PRORelease 5.0 for WINDOWS software systems.Select the files corresponding to your applicationand data entry needs from Table C-l and proceedto Section 4.
Table C-l. File Designations for Various SoftwareSpreadsheets - Performance Potential Graph
PerformancePotentialQraphr
for DOS f-x wffmows
LOTUS LOTUS 123 EXCEL 4.0 or GUATTRO123 2.4 5.0 5.0 PRO 5.0
Worklng Files
EXtNldFormat Files
PPG.WKl PPG.WK4
PPG.FMT NOW
PPGXLC-XLS PPGQP.WEl
NOM NOM
Section 4 - Loading the Spreadsheet
l Copy the required working file and externalformat file from the Master Diskette to a direc-tory resident on the hard drive of your com-puter. Do NOT work from the files containedon the Master Diskette.
l Enter your spreadsheet software by selectingthe appropriate icon or menu option (e.g., clickon the LOTUS 123 Release 5.0 icon). (Note:WYSIWYG needs to be invoked for the LOTUS123 Release 2.4 spreadsheets.)
l Open the working file as specified in Section 3and save the file under a new file name.
Section 5 - Entering Plant Information
Each spreadsheet contains a data entry sectionand a chart which depicts the resulting individualunit process rated capacities. The LOTUS 123spreadsheets generate a performance potentialgraph with the unit process rated capacities char-acterized by horizontal bars (see Figure C-l). Con-trarily, the EXCEL and QUATTRO PRO perform-ance potential graphs characterize the unit processcapacities by vertical bars (see Figure C-2). Thedata entry sections are identical for the LOTUS123, EXCEL, and QUATTRO PRO performancepotential graph files (see Figure C-3).
l Begin entering appropriate physical plant datain cells B31..B71 and E32..E69. Figure C-4contains in-depth description of the acceptableentries for each of the cells in the spreadsheet.
l The entered physical plant data will appear inblue. Cells containing black values are calcu-lated from data entered in other cells and can-not be modified.
127

Figure C-3. Performance potential graph data entry guide.
Peak Instantaneous Flow 11
PredisinfectionPresedimentation
Presed. Basin Volume
Presed. Basin Baffling
Predisinfectian Practiced
Temperature (*Cl
PH
Predisint. Residual (mg/Ll
Predisinf. Application Paint
Required CTqPredisinfection Volume 1
Effective Predislnf. Volume
1
Flocculation r 4
Detention Time
SedimentationBasin Volume
Surface Area
Basin Depth
Operation Mode
Process Type
Tubes Present
What is the peak flow in MOD at any instant through the treatment plant? This peak flow is based on hi$torical records and pumping capacity.
(See Section 3 of the Self-Assessment for further discussion.1
Does the plant have and “tlllre B presedimentation basin? Enter Yes or No.
What is the volume (in gallons) of the presedimentation basin(s)?
What is the baffling condition of the presedimentation basinfsl? Unbaffled Poor Average Superior Impacts effective volume cakulatlqn regarding
predisinfection contact time based on estimated TIo to T ratios.
Does the plant apply a disinfectant prior to the clearvvell? Enter Yes or No.
What is the coldest water temperature (in degrees Celsius1 at the predisinfectant application point?
What is the maximum pH at the predirinfectant application point?
What is the maximum predislnfectant residual (In mg/L)?
Where is the predislnfectant applied? Prior to the presedimentation or flocculation or sedimentation or filtration unit processes7
Using the prwdisinfection operating conditions @l-l and Temp and required log removals), obtain the required CT value from Appendix C
of the Surface Water Treatment Rule Guidance Manual or Appendix A of the CCP Handbook.
Calculated from data entered in other weas. No entry is required here.
Calculated from data entered In other areas. lncorparates effective contact of the disinfectant based on baffling In each of the unit processes.
What Is the total volume (in gallons~ Of the flocculation basin(s)?
What is the coldest water temperature (in Celsius1 that the flocculation basin experiences7
Describe the stages contained within the flocculation basin(s). Single or Multiple? No baffling or interbasin compartments equals
single-staged. All other conditions equal multiple-staged.
Suggested detention time calculated using above information from existing conditions (see Attachment 21. No entry is required here.
Enter a detention time (in minutesl. Use the suggested detention time or select one based on site-specific circumstances.
This is the rated capacity of the unit process lin MGDI calculated from the Assigned hydraulic detention time. NO entry Is required here.
This volume is calculated from other entered data. NO entry is required here.
What is the total area lin square feet) of the sedimentation basinIs)?
What is the average depth (in feet1 Of the sedimentation basin(s)?
Enter Turbidity or Softening, depending an the pracess used. Is the process operated mainly to remqve turbidity of tq provide softening?
What settling process is utilized? Enter RsctangularlCircular/Contact/Lamella Plates/Adsorption Clarifier or SuperPulsator.
What type of settling tubes is present in the sedimentation basin(sl? Enter None or Vertical (>45’1 or Horizontal (~459.

Figure C-3. Performance potential graph data entry guide (continued).
Suggested
Assigned
Rated Capacity
FiltrationTotal Filter Surface Arcs
Total Number of Filters
Filters Typically In Service
Total Volume Above Flltsrs
Media Type
Operation Mode
Raw Turbidity
Air BInding
Suggested
Assigned
Rated Capacity
DisinfectionClearwell Volume
Effective Baffling
Temperature IT)
PH
Disinfectant Residual (mQlL1
Required Log Inactivation
Reqd. Disinfection Log Inactivation
prowar SOR
I I
BLoading Rate
EE
SUggeStad surface overflow rate calculated using above information from existing conditions (see Attachment 21. No entry is required hers.
Enter a surface overflow rots ISOR (in gpm/ft’l. Use the suggested SOR or sslect one based on sitekpecific circumstencas.
This is ths rated capacity of the unit process (in MGOI calculated from the ASSIgned surface overflow rate. No antry is required.
Whet is the total surface area (in square feet1 of the filter(s)?
What Is the total number of filtars in the trestment plant?
What number of filters era typIcally in service?
What Is the total volume of water above the filter media (In gallons)?
What media configuration Is pressnt In the filters? Enter Sand, Duel. Mlxsd, Deep Bed.
How ore the filters operated? Enter Conventional Direct. lnllne Direct.
What is ths yearly 95th percentile raw Water turbidity value? Refer to the raw water turbidity spreadsheet Output table.
What level of sir binding is noticeable in the filter(sl? Enter None, Moderate, High.
Suggested filter loading rate calculated using above information from existing conditions (see Attachment 21. No entry la required here.
Enter a filter lqsding rate (in Qpmlft’l. Use the suggested rate or select one based on site-specific circumstances.
This is the rated capacity of the unit prqcass lin MGD) calculated from the Assigned filter loading rate. No entry Is required here.
What is the total volume (in gallonsl of the clearvvell(sI?
What is the baffling condition of the clearwell~a~? Enter Unbaffled. Poor, Average, Superior. lmpacte effective volume calculation
regarding disinfection contact time.
What Is the temperature (in degrees Celsius1 et the disinfectant application point?
What is the pH St the disinfectant application point?
What is the maximum disinfectant residual (in mglU?
Enter the total number of log ramovals required for the plant. Enter 3 or 4 or >4 (must be a numeric value).
Required disinfection log removals calculated from other dots. No entry is required hare.
Pipe Distance to First User
Pipe Diameter
What is the transmission distance (in feet1 to the flrst user/customer?
What is the pipe diameter Iin inches.1 of the transmission pipe?

Figure C-3. Performance potential graph data entry guide (continued).
Required CT
Effective Contact Volume
Suggested
Assigned
Post Disinfection Rated Capacity
Pre & Post Oisinf. Rated Capacity
Using the disinfection operating conditions IpH end Tamp end required log removalsl. obtain the required CT value from Appendix C
of the Surface Water Treatment Rule Guidance Manual or Appendix A of the Composite Correction Program Handbook.
I Calculated from data entered in other areas. No entry is required here.
Detention Time
Suggested detantlon time calculated using above information from existing conditions (see Attachment 21. No entry is required here.
Enter a detention time lin minutes). Use the suggested detention time or select one based on site-specific circumstances.
This is the rated capacity of the unit process (in MGOI calculated from the Assigned detention time end required CTs.
No entry is required here.
This is tha rated capacity of the unit process lin MGOI calculated from the Assigned detention time and required CTs.
No entry is required here.

Figure C-4. Example performance potential graph data entry section.
Plant Name avenport, New Mexrco I
Peaklnstantaneous flow 9 VW FiltrationTotal Fitter Surface Area
PredisinfectionlPresdimentation Contact Total Number of Fitters
Basin Type None, Ptesed, Predts. both Filters Typically in Service
Basin Volume (gallons) Total Volume Above Fitters
Basin Baffling Unbaffled Poor Average Superior Media Type
Disinfectant Applied None, Chbrtne, Chbramines, Chlortne Dioxide, Ozone
Temperature (C)Raw Turbidity (NW)
flw
(gallons)Sand Dual MbedDeeoBed
Disinfect residual (mg/L)Required ,T -4See Guidance Manual Appendk C
FlocculationBasin Volume n ~(galtons)
Temperature (C)Mbing Stages
Disinfectant Applied“l-l
Disinfect residual (mg/L)Reouired a, ISee Gutdance Manual Appendb C
Detention Time
sy$g; Fq$; ;;
Rated Capacity LqMGD
Disinfectant Appfbd I~IChbrine. Chloramtnes
None, Chlorine DioxideDisinfect residual (mg/L)
Required CT p!$;;eGu&a;ce Manual
Loading Rate
Rated Capacity [T’.96]MGD
DisinfectionCleanvetl VolumeEffective Baffling
Averaoe SuoerbrDisinfectant Apptiid v[Chbrtne. Chloramines
SedimentationBasin Volume ~B/@allon
None, Chlorine DioxideTemperature (C)
PH 7.5Disinfectant residual (mgll)
El
2.5Required Log Inactivation 3 or4 or>4
1s)Surface AreaBasin Depth
Operation Mode Turbid.w or SofteningProcess Type NonelRectanguladCimuhdContact Required Disinfection Log Removals17
LamellaPlates/AdsorpCladfiir/SuperPukator
Tubes Present Ii~~~~~s~~~~~~i~~~~~~l Distribution Pipe Distance to First User
Percent Tube Area Pipe diameterRequired CT
Disinfectant Applied None, Chlorine, Chloramines, Chlorine Dioxide Manual Appendbc CEffective Contact Volume ~q(gallons)
Disinfect residual (mg/L)Required CT 1-1See Guidance Manual Appendix C
Process SOR
Detention Time
sz;: f=q;; ;:
Post Disinfection Rated Capacity (8;981MGD
Rated Capacity 1 12.351MGD Pre & Post Disinfection Rated Capacity 1 29.51 [MGD

Table C-2. Major Unit Process Evaluation Criteria*
HydraulicDetention Time /I
Base
Single Stage
Multiple Stages
Temp <C= 0.5”
Temp >0.5”C
Temp CC= 0.5*
Temo >0.6%
20 minutes
+ 10 minutes
+5 m i n u t e s
+0 minutes
-5 minutes
II Sedimentation Surface OverflowRate I
kectanaular/Circular/Contact Basin Devth
Turbidity Mode > 14ft 0.7 gpm/ft*
12 - 14 ft 0.6 apm/ft*
10 - 12 ft 0.5 - 0.6 gpmlft’
<loft
Softening Mode. > 14 ft
IZ- 14ft
lo- 12ft
<IO ft
Vertical (>45”) Tube Settlers
Turbidity Mode > 14 ft
12- 14ft
10 - 12ft
<lO ft
Softening Mode > 14ft
12-14ft
IO - 12 ft
Horizontal (<45”) Tube Settlers
Adsorption Clarifier
Lamella Plates
SuperPulsator
with tubes
Claricone Turbiditv Mode
Claricone Softening Mode
0 . 1 - 0 . 5 m/ft*
1 . 0 m/ftZ
0 . 7 5 m/ft*3Oa5 $J5
0.1 - 0.5 m/ft*
*If long term (12-month) data monitoring indicates capability to meet performance goals at higher loadingrates, then these rates can be used.
Renner, KC., B.A. Hegg, J.H. Bender, and E.M. Bissonette. 1991. Handbook - Optimizing Water Treatment Plant PerformanceUsing the Composite Correction Program. EPA 625/g-911027. Cincinnati, OH: USEPA.
AWWARF Workshop. 1995. P/ant Optimization Workshop. Colorado Springs, CO: AWWARF.
Eastern Research Group, Inc. 1992. Water Advisor Utilizing the CCP Approach (Expert System). USEPA Work Assignment No.7391-55. Eastern Research Group, Inc., Arlington, MA.
USEPA, AWWA, AWWARF, Association of Metropolitan Water Agencies, Association of State Drinking Water Administrators, andNational Association of Water Companies. 1995. Partnership for Safe Water Voluntary Water Treatment Plant PerformanceImprovement Program.
132

Each major unit process section contains asuggested and assigned evaluation criteria cell(e.g., the flocculation section contains a sug-gested and an assigned hydraulic detentiontime cell). The suggested loading rates, sum-marized in Table C-2 of this appendix, forspecified situations are representative of condi-tions in which identified unit processes havedemonstrated effectiveness in serving as amultiple barrier in the prevention of cyst and.microorganism passage through the treatmentplant.
The actual rated capacities for each of the unitprocesses are calculated from the loading ratesentered into the cells labeled “assigned loadingrates.” Users must enter a value into theassigned cell, either selecting the “suggested”value or entering their own loading rate.
The performance potential graph contained atthe top of each spreadsheet will instantane-ously update after each data entry. Completethe entire data entry process prior to proceed-ing to printing the spreadsheet outputdescribed in Section 6.
Section 6 - Printing Spreadsheet Output
To print the performance potential graph using:
l LOTUS 123 Release 2.4 for DOS, invoke theWYSIWYG add-in and print the previouslydefined range by pressing <Shift : > thenselecting <Print > and <Go> after the sys-tem has been configured to the user’s printer.If the WYSIWYG add-in is unavailable, usersshould generate and print the graph PIC file
PPG. PIC, using the LOTUS Printgraphprocedures.
l LOTUS 123 Release 5.0 for WINDOWS, orQUATTRO PRO Release 5.0 for WINDOWS, orEXCEL Release 4.0 or 5.0 for WINDOWS, fol-low printing techniques specified forWINDOWS applications by clicking on aprinter icon (which will print the previouslydefined range) or select PRINT from the Eilesubmenu (and select “previously definedrange” when the system requests a printingoption). Users may have to adjust margins toaccommodate individual applications in orderto print output to a single sheet of paper.
Section 7 - Important Rules to RememberWhen Using the Performance PotentialGraph Spreadsheet Tool
l Cells containing “Black” values are calculatedfrom other pertinent data entries and cannotbe modified because the cells have been pro-tected.
l The actual rated capacities for each of the unitprocesses are calculated from the loading rateentered into the cells labeled “assigned loadingrates.” Users must enter a value into theassigned cell, either selecting the “suggested”value or entering their own loading rate.
l The external format file must be copied fromthe Master Diskette to the same directory asthe working file or the Performance PotentialGraph will not be visible when using LOTUS123 Release 2.4 for DOS.
133


-able D-l.Norinsoncsaration
(mgn
< -0.
0.8
0.8
1
1.2
1.4
1.8
1.8
2
2.2
2.4
2.8
2.8
< -0.
0.6
0.9
1
1.2
1.4
1.6
1.6
2
2.2
2.4
2.6
2.6
pH < - 8.0
Log lnactlvatlon
1 .o 1.5 2.0 2.5 3.0
23
2 4
24
25
25
26
26
27
28
26
20
20
3 0
48
47
48
49
51
52
52
54
55
58
57
58
58
80
71
73
74
78
78
70
81
83
85
88
86
89
01
0 4
9 7
99
101
103
105
108
110
113
115
117
118
114
119
121
123
127
129
131
135
138
141
143
148
146
137
141
145
148
152
155
157
182
165
169
172
175
176
3 0 6 0 91 121 151 191
pH - 8.0
Log lnatlvatfon
0.5 1.0 1.5 2.0 2.5 3.0
46 92
49 05
49 08
51 101
52 104
54 107
55 110
58 113
58 115
50 118
8 0 120
81 123
63 125
130
143
148
152
157
161
185
189
173
177
191
184
168
185
101
197
203
209
214
219
225
231
235
241
245
250
231
238
248
253
281
266
274
292
288
204
301
307
313
277
286
205
304
313
321
320
336
348
353
381
386
375
6 4 127 101 255 318 382
bv Free Chlorine at 0.5 OC or IpH - 8.5
Log lnacdvatlon
1.0 1.5 2.0 2.5 3.0
2 7
2 8
2 0
20
3 0
31
32
32
3 3
3 4
3 4
3 5
3 8
54 82 109 138 183 33 85 98 130 163 195 4 0 79 119 158 198 237
58 84 112 140 188 3 3 87 100 133 187 200 4 0 80 120 150 109 230
57 88 115 143 172 3 4 68 103 137 171 205 41 8 2 123 184 205 248
50 88 117 147 176 3 5 70 105 140 175 210 42 6 4 127 169 211 253
6 0 00 120 150 160 3 8 72 109 143 179 215 43 8 8 130 173 218 259
81 92 123 153 164 3 7 7 4 111 147 184 221 4 4 8 9 133 177 222 288
63 95 126 159 199 38 75 113 151 199 228 46 01 137 162 228 273
8 4 07 129 181 193 3 9 77 118 154 193 231 4 7 9 3 140 lE6 233 279
86 99 131 164 197 39 79 1lE 157 197 236 4 9 9 5 143 191 238 266
8 7 101 134 169 201 4 0 51 121 161 202 242 5 0 9 9 149 106 248 297
66 103 137 171 205 41 92 124 185 209 247 5 0 9 9 149 199 248 288
70 105 130 174 200 4 2 8 4 126 166 210 252 51 101 152 203 253 304
71 107 142 176 213 4 3 86 120 171 214 257 62 103 155 207 259 310
3 8 72 100 145 181 217
pH P 8.5
Log lnsotivdon
0.5 1.0 1.6 2.0 2.5 3.0
55 110
57 114
59 119
61 122
63 125
65 120
88 132
8 8 138
70 130
71 142
73 145
74 148
75 151
165 219 274 329
171 229 285 342
177 238 295 354
183 243 304 365
188 251 313 378
104 258 323 397
199 285 331 307
204 271 330 407
209 278 346 417
213 284 355 428
216 200 383 435
222 208 370 444
228 301 377 452
77 153 230 307 393 480
LabwerpH - 7.0
Log lnactivstlon
0.5 1.0 1.5 2 .0 2.5 3.0
4 4
0.5
07 131 174 216 281
pH < - 9 . 0
Log Inactlvath
1.0 1.5 2.0 2.5 3.0
6 5 130 195 280 325 300
8 8 136 204 271 339 407
7 0 141 211 261 352 422
73 148 219 201 364 437
75 150 226 301 376 451
77 155 232 300 387 484
8 0 159 239 316 398 477
8 2 183 245 328 409 469
8 3 187 250 333 417 500
8 5 170 258 341 428 511
87 174 281 346 435 522
88 178 287 355 444 533
01 181 272 362 453 543
02 184 276 368 460 552
pH - 7.5
Log Inactivation
0.5 1.0 1.6 2.0 2.5 3.0
53 105 156 211 283 318
NOTE: CT 00.0 = CT for 3-log inactivation.

Table D-2. CT Values for Inactivation of Giardia Cysts by Free Chlorine at 5 “C
0.5
pH<-6.0 pH=6.5
Log Inactivation Log Inactivation
1.0 1.5 2 .0 2.5 3 .0 0 .5 1.0 1.5 2.0 2.5 3.0 0.5
pn-7.0
LogInac;uvstion
1.0 1.5 2.0 2.5 3.0 0.5
< -0. 18 32 49 8 5 81 97 2 0 39 59 78
0.6 17 33 50 8 7 83 1W 2 0 4 0 8 0 8 0
0.8 17 3 4 52 69 98 103 2 0 41 61 a1
1 la 35 53 7 0 86 105 21 42 83 8 3
1.2 18 38 54 71 88 107 21 42 6 4 a5
1.4 18 38 55 73 01 100 2 2 43 85 07
1.6 19 37 58 7 4 93 111 22 4 4 86 88
1.6 19 38 57 78 9 5 114 23 45 68 80
2 19 36 56 77 97 118 2 3 4 6 60 9 2
2.2 20 39 50 79 08 118 23 47 70 93
2.4 2 0 40 60 80 100 120 2 4 48 72 9 5
2.8 2 0 41 81 81 102 122 2 4 49 73 07
2.9 21 41 82 83 103 124 2 5 49 7 4 so
3 21 42 63 8 4 105 128
hlorlne pH=a.0
oncentratlon L0gln?+cthtl0n
cmsn 0.5 1.0 1.5 2 .0 2.5 3 .0
9 8 117 2 3 4 6 7 0 03 118 139 28
100 120 2 4 40 72 95 119 143 2 9
102 122 2 4 40 73 97 122 146 2 9
104 125 25 50 75 99 124 149 3 0
106 127 25 51 78 101 127 152 31
108 130 26 52 78 103 129 155 31
110 132 26 53 79 105 132 158 3 2
113 135 27 54 ai 108 135 l a 2 33
115 138 2 6 55 a 3 110 138 165 3 3
117 140 28 56 65 113 141 189 3 4
110 143 29 57 8 6 115 143 172 3 5
122 148 .29 59 8 9 117 148 175 3 8
123 148 3 0 50 88 119 148 178 3 6
2 5 50 78 101 128 151
pH-8.5
.Loglnaotlvodon
3 0 81 91 121 152 182
pH<=9.0
L0glnactivatf0n
0.5 1.0 1.5 2.0 2.5 3.0
3 7 147 184 221
0.5 1.0 1.5 2 .0 2.5 3.0
<-0 33 66 9s 132 165 198 39 70 11s 157 107
0.8 3 4 89 102 136 170 204 41 a1 122 163 203
0.0 35 70 105 140 175 210 4 2 6 4 128 186 210
1 36 72 108 144 180 216 4 3 8 7 130 173 217
1.2 3 7 7 4 111 147 194 221 4 5 89 134 178 223
1.4 38 78 114 151 180 227 4 8 91 137 183 229
1.6 39 77 118 155 193 232 4 7 0 4 141 167 234
1.8 4 0 79 119 159 198 239 4 8 98 144 101 230
2 41 81 122 162 203 243 40 0 9 147 198 245
2.2 41 a3 124 185 207 248 5 0 100 150 200 250
2.4 42 8 4 127 189 211 253 51 102 153 204 255
2.8 43 a8 129 172 215 258 52 104 158 208 280
2.8 4 4 8 8 132 175 219 263 53 108 159 212 265
3 46 89 134 170 223 288
238
244
252
260
267
274
261
287
294
300
308
312
318
54 108 182 218 270 324
4 7 0 3 140 188 233 270
4 9 97 148 194 243 291
5 0 loo 151 201 251 301
52 104 158 208 280 312
53 107 180 213 287 320
55 110 185 219 274 320
56 112 160 225 281 337
58 115 173 230 299 345
50 118 177 235 204 353
8 0 120 ial 241 301 381
81 123 la4 245 307 368
83 125 la9 250 313 375
8 4 127 191 255 318 382
8 5 130 105 259 324 380
pH-7.5
Loglnscnvtion
1.0 1.5 2 .0 2.5 3 .0
55
57
58
60
81
82
64
65
6 7
86
7 0
71
72
74
a3
aa
88
0 0
02
9 4
96
08
100
102
105
107
109
111
111 138 166
114 143 171
117 146 175
119 140 179
122 153 183
125 158 197
129 160 192
131 183 198
133 187 200
138 170 204
130 174 209
142 178 213
145 181 217
NOTE: CT 08.0 = CT for 34og inactivation.

‘able D-3. CT Values for Inactivation of Giardia Cysts by Free Chlorine at 10 “C
0.5 1
pH< - 6 . 0 pH=6.5 pH=7.0 pH=7.5
Log lnsctivstlon Log lnaotivaion Log lnaotivalion Log InactivatiOn
1.5 2 2.5 3.0 0.5 1 1.5 2 2.5 3.0 0.5 1 1.5 2 2.5 3.0 0.5 1 1.5 2 2.5 3.0
c - o . 4 12 '24 37 49 81 73 15 20 4 4 50 73 88 17 3 5 52 69 87 104 21 42 63 8 3 l o 4 '125
0.8 13 25 38 50 63 75 15 3 0 45 8 0 75 90 18 36 5 4 71 89 107 21 43 8 4 85 107 128
0.9 13 28 39 52 85 78 15 31 4 8 61 77 0 2 ia 37 55 73 0 2 110 2 2 4 4 88 8 7 109 131
1 13 26 40 53 66 79 16 31 4 7 83 78 0 4 10 37 58 75 9 3 112 2 2 45 87 80 112 134
1.2 13 27 40 53 67 8 0 16 32 48 63 79 95 19 38 57 76 95 114 23 48 80 01 114 137
1.4 14 27 41 55 88 62 18 33 4 9 85 a2 9 8 19 39 58 77 07 118 2 3 47 70 03 117 140
1.8 14 26 42 55 69 6 3 17 33 50 66 93 9 9 2 0 4 0 8 0 79 99 119 2 4 4 6 72 96 120 144
1.6 14 29 43 57 72 88 17 3 4 51 67 a 4 101 2 0 41 61 a1 102 122 25 40 74 08 123 147
2 15 20 4 4 58 73 87 17 35 52 60 a7 l o 4 21 41 82 a3 103 124 2 5 50 75 100 125 150
2.2 15 3 0 45 59 74 89 18 35 53 70 88 105 21 42 84 8 5 lo6 127 26 51 77 102 128 153
2.4 15 3 0 4 5 60 75 so 18 3 6 54 71 89 107 2 2 43 65 a8 108 129 2 8 52 79 105 131 157
2.6 15 31 48 81 77 92 10 3 7 55 73 02 110 2 2 4 4 66 87 100 131 2 7 53 8 0 107 133 160
2.8 18 31 4 7 62 78 0 3 10 37 56 7 4 93 111 2 2 4 5 87 80 112 134 2 7 5 4 a2 l o 9 136 163
3 16 32 49 63 70 05 19 38 57 75 0 4 113 23 46 60 01 114 137 2 9 55 63 111 138 168
M0rlM pH = a.0 pH = 6.5 pH < -9 .0
m-loantratlon Log Inactivauon Log lnacdvauon Log Inactivation
hwu 0.5 1 1.5 2.0 2.5 3.0 0.5 1.0 1.5 2.0 2.5 3.0 0.5 1.0 1.5 2.0 2.5 3.0
C - O . 4 25 5 0 75 00 124 149 3 0 58 a0 119 148 177 3 5 70 105 139 174 209
0.8 28 51 77 102 128 153 31 61 92 122 153 183 3 8 73 lb9 145 182 218
0.8 28 53 79 105 132 158 32 63 95 126 158 180 38 j5 113 151 188 228
1 27 54 61 ioa 135 182 33 85 9 8 130 183 195 39 78 117 156 195 234
1.2 28 55 63 111 136 188 33 87 loo 133 187 200 4 0 8 0 120 180 200 240
1.4 28 57 85 113 142 170 3 4 8 9 103 137 172 208 41 a 2 124 165 208 247
1.8 20 58 a7 116 145 174 35 70 106 141 178 211 4 2 a 4 127 188 211 243
1.8 3 0 8 0 0 0 110 149 179 36 72 108 143 179 215 43 96 130 173 218 250
2 3 0 61 01 121 152 182 37 7 4 111 147 la4 221 4 4 88 133 177 221 285
2.2 31 8 2 93 124 155 186 38 75 113 150 186 225 45 0 0 136 161 228 271
2.4 32 83 95 127 159 100 38 77 115 153 192 230 4 6 9 2 138 184 230 278
2.8 32 85 97 129 162 104 39 79 117 158 195 234 47 9 4 141 187 234 281
2.8 33 66 99 131 184 107 4 0 a0 120 159 189 230 48 08 144 191 230 287
3 34 87 101 134 188 201 41 81 122 182 203 243 _ 40 9 7 148 195 243 202 ,
NOTE: CT 99.9 = CT for +Iog inactivation.

Table D-4. CT Values for Inactivation of 4hloritm
onc~ntlatlon
bnen.)
< -0.4
0.6
0.6
1
1.2
1.4
1.6
1.8
2
2.2
2.4
2.6
2.8
3
:wolinc
:onccntntlon
ma
< -03
0.6
0.6
1
1.2
1.4
1.6
1.6
2
2.2
2.4
2.6
2.6
3
0.5
pn<-6.0
Log In8cuvauon
1.0 1.5 2 .0 2.5 3 .0
8
9
S
9
9
8
10
10
10
10
10
10
16 25 3 3 41 49 1 2 0 3 0 30 49 59 12 23 3 5 47 58 70 14 2 9 4 2 55 69 83
17 25 33 4 2 5 0 1 2 0 3 0 4 0 5 0 6 0 12 2 4 36 48 6 0 72 14 2 s 43 57 72 8 6
17 26 3 5 4 3 52 1 2 0 31 41 51 61 12 2 4 37 49 61 73 15 29 4 4 59 73 8 8
18 27 35 4 4 5 3 11 21 32 4 2 5 3 6 3 13 25 3 8 5 0 8 3 75 15 3 0 45 6 0 75 00
18 27 3 6 45 5 4 11 21 3 2 4 3 53 6 4 13 2 5 3 8 51 6 3 76 15 31 4 6 81 77 9 2
18 26 37 4 6 55 11 2 2 33 43 5 4 65 13 26 39 52 65 78 18 31 4 7 83 78 0 4
1B 26 3 7 4 7 58 11 2 2 33 4 4 55 6 6 13 26 4 0 53 66 79 16 3 2 46 6 4 60 se
19 2 9 3 6 4 8 57 11 2 3 3 4 4 5 57 6 8 14 2 7 41 54 68 61 16 3 3 49 65 82 9 8
1s 2s 3 9 49 58 12 23 35 46 58 69 14 26 4 2 55 6 9 63 17 3 3 5 0 67 6 3 100
2 0 3 0 39 49 59 12 23 35 47 58 70 14 28 4 3 57 71 9 5 17 3 4 51 68 8 5 102
2 0 3 0 4 0 5 0 60 12 2 4 3 6 4 6 6 0 72 14 29 4 3 57 72 8 6 18 35 53 70 8 8 105
2 0 31 41 51 61 12 2 4 3 7 49 61 73 15 2 9 4 4 59 73 88 18 3 6 5 4 71 80 107
21 31 41 52 62 12 25 3 7 49 62 7 4 15 3 0 4 5 59 74 8 9 19 3 6 55 73 91 109
11 21 32 4 2 5 3 63
pn-8.0
Log mactlvdon
0.5 1.0 1.5 2.0 2.5 3.0
17 33 50 6 6 83 90
17 3 4 51 68 85 102
16 3 5 53 70 6 6 105
18 36 54 72 SO 109
19 3 7 56 74 9 3 111
1s 38 57 76 95 114
19 38 58 77 97 116
2 0 4 0 6 0 79 9 9 119
2 0 41 61 81 102 122
21 41 62 63 103 124
21 4 2 6 4 8 5 106 127
2 2 4 3 65 66 108 129
2 2 4 4 66 88 110 132
2 2 45 67 80 112 134
vdia Cysts by Free Chlorine at 15 ‘CpH-6.5
Log lnactlvatfon
0.5 1.0 1.5 2 .0 2.5 3 .0
pli-7.0
Laginactiv8tion
0.5 1.0 1.5 2.0 2.5 3.0
13 25 38 51 6 3 76 15 3 0 4 6 61 76 81
pn-9.5 pH< - 0 . 0
Log lnactJvdon l.qj InacUvarlon
0.5 1.0 1.5 2.0 2.5 3.0 0.5 1.0 1.5 2.0 2.5 3.0
20 30 59 79 96 116 23 47 70 93 117 140
2 0 41 61 61 102 122 24 49 73 97 122 146
21 42 63 6 4 105 126 25 50 76 101 126 151
2 2 43 65 67 109 130 26 52 78 104 130 156
2 2 45 6 7 6 9 i i 2 134 2 7 53 80 107 133 160
23 46 69 91 114 137 28 55 83 110 139 165
2 4 47 71 9 4 118 141 28 56 65 113 141 169
24 46 72 86 120 144 29 56 6 7 115 144 173
2 5 49 74 96 123 147 3 0 58 80 118 146 177
25 5 0 75 100 125 150 3 0 6 0 91 121 151 181
26 51 77 102 126 153 31 61 9 2 123 153 194
26 52 78 104 130 156 31 63 9 4 125 157 166
27 53 6 0 106 133 159 3 2 6 4 96 127 158 191
27 54 81 106 135 162 3 3 65 98 130 163 195
pH-7.5
Lnglnactivsflon
0.5 1.0 1.5 2.0 2.5 3 .0
19 37 56 74 93 111
NOTE: CT 99.9 - CT for 3-log inactivation.

rable D-5. CT Values for Inactivation of Gkwu% Cysts by Free Chlorine at 20 “Chlorirm pH<=8.0 pH=6.5 pn-7.0 pH=7.5
cncsntration Log Inactivation Log hctlvation Log In~ctlv~tion Log lnactlvation
ImgAl 0.5 1.0 1.5 2.0 2.5 3 .0 0.5 1.0 1.5 2.0 2.5 3.0 0.5 1.0 1.5 2 .0 2.5 3.0 0.5 1.0 1.5 2.0 2.5 3.0
<=0.4 6 12 18 2 4 3 0 36 7 15 2 2 28 3 7 4 4 9 17 2 6 3 5 43 52 10 21 31 41 5 2 6 2
0.6 6 13 18 25 32 38 8 15 23 3 0 36 45 3 16 2 7 3 8 45 5 4 11 21 3 2 43 53 6 4
0.8 7 13 2 0 26 33 3 8 8 15 23 31 36 46 8 18 26 3 7 4 8 55 11 22 3 3 4 4 55 66
1 7 13 2 0 26 3 3 39 8 16 2 4 31 38 47 8 13 28 3 7 4 7 56 11 22 3 4 4 5 56 67
1.2 7 13 2 0 2 7 3 3 4 0 8 16 2 4 32 4 0 4 8 10 19 29 38 4 8 57 12 23 35 46 58 69
1.4 7 14 21 27 3 4 41 8 16 25 33 41 49 10 19 29 39 48 58 12 23 35 4 7 56 70
1.6 7 14 21 28 3 5 4 2 8 17 2 5 3 3 4 2 50 10 2 0 3 0 39 4 9 58 12 2 4 3 6 48 60 72
1.8 7 14 22 28 3 6 4 3 8 17 26 3 4 43 51 10 2 0 31 41 51 61 12 2 5 3 7 49 6 2 7 4
2 7 15 22 2 8 3 7 4 4 8 17 26 35 43 52 10 21 31 41 52 62 13 25 3 8 5 0 83 75
2.2 7 15 22 28 3 7 4 4 a 18 27 35 4 4 53 11 21 3 2 42 53 6 3 13 2 6 3 9 51 8 4 77
2.4 6 15 23 3 0 3 8 4 5 8 18 2 7 36 45 54 11 2 2 33 4 3 5 4 6 5 13 2 6 39 5 2 65 78
2.6 8 15 23 31 3 8 4 6 9 16 28 3 7 46 55 11 2 2 3 3 4 4 55 66 13 2 7 4 0 53 6 7 80
2.9 8 16 2 4 31 39 4 7 9 19 28 3 7 4 7 56 11 22 3 4 45 56 6 7 14 2 7 41 54 8 8 81
3 8 16 2 4 31 3 9 4 7 1 0 19 2 9 3 8 4 8 5 7 11 2 3 3 4 4 5 57 6 8 1 4 2 8 4 2 55 68 8 3
Norim pH-8.0 pIi-8.5 pH<-8.0
cncentrdm Lot Inactivation Log Inmivation Log lnactivaticn
ImgRl 0.5 1 1.5 2 .0 2.5 3 .0 0.5 1.0 1.5 2.0 2.5 3.0 0.5 1.0 1.5 2 .0 2.5 3 .0
<=0.4 12 25 37 4 9 6 2 7 4 15 3 0 45 59 74 69 18 35 53 70 8 8 105
0.6 13 26 39 51 8 4 77 15 31 46 61 77 9 2 18 36 55 73 91 109
0.8 13 2 6 4 0 5 3 8 8 79 16 3 2 4 8 6 3 79 9 5 13 3 8 5 7 75 04 113
1 14 2 7 41 5 4 6 8 61 16 33 49 65 62 86 2 0 39 59 78 9 8 117
1.2 14 26 42 55 68 6 3 17 3 3 50 8 7 3 3 100 2 0 4 0 60 60 100 120
1.4 14 2 6 43 57 71 65 17 34 52 69 86 103 21 41 62 82 103 123
1.6 15 23 4 4 56 73 87 18 35 53 7 0 66 105 21 4 2 6 3 6 4 105 126
1.6 15 3 0 45 59 74 89 18 36 54 72 90 108 22 43 65 a6 108 120
2 15 3 0 46 61 76 91 18 37 55 73 9 2 110 2 2 4 4 66 86 110 132
2.2 16 31 47 62 78 9 3 19 36 57 75 9 4 113 23 4 5 68 90 113 135
2.4 16 32 48 63 79 95 18 38 59 77 96 115 23 48 63 92 115 138
2.6 16 32 49 65 81 87 2 0 39 59 78 96 117 2 4 47 71 9 4 118 141
2.8 17 33 50 66 83 98 2 0 4 0 60 79 89 119 2 4 48 72 95 119 143
3 17 3 4 51 8 7 8 4 101 2 0 41 61 81 102 122 2 4 49 73 9 7 122 146
NOTE: CT 88.8 = CT for 3-log inactivation.

Table D-6. CT Values for Inactivation of Gi8fdi8 Cysts by Free Chlorine at 25 “Cllorlm pH< - 6 . 0 pH-6.5 pH-7.0 P H - 7 . 5
wvxmtrauon Log hlactlvatlon Log lnacuvatlon Log Inacuvauon Log Inactlvatlon
h9R) 0.5 1.0 1.5 2 .0 2.5 3 .0 0.5 1.0 1.5 2.0 2.5 3.0 0.5 1.0 1.5 2 .0 2.5 3.0 0.5 1.0 1.5 2.0 2.5 3.0
c-0.4 4 9 12 16 2 0 2 4 5 10 15 18 2 4 29 6 12 19 2 3 29 35 7 14 21 26 35 4 2
0.6 4 .6 13 17 21 25 5 10 15 2 0 2 5 3 0 6 12 16 2 4 3 0 36 7 14 2 2 2 s 36 43
0.9 4 0 13 17 2 2 26 5 10 16 21 26 31 6 12 19 25 31 3 7 7 15 2 2 2 9 37 4 4
1 4 9 13 17 2 2 26 5 10 16 21 2 6 31 6 12 19 25 31 3 7 6 15 23 3 0 36 45
1.2 5 9 14 16 2 3 27 5 11 16 21 2 7 3 2 6 13 19 25 3 2 3 8 6. 15 23 31 38 4 6
1.4 5 9 14 18 2 3 27 6 11 17 22 2 8 33 7 13 2 0 28 3 3 39 6 16 2 4 31 3 9 4 7
1.6 5 9 14 19 2 3 29 6 11 17 2 2 .28 33 7 13 2 0 2 7 33 4 0 B 16 2 4 32 4 0 48
1.9 5 10 15 19 2 4 29 6 11 17 2 3 2 6 3 4 7 14 21 2 7 3 4 41 9 16 25 33 41 4 9
2 5 10 15 19 2 4 29 6 12 18 2 3 2 9 35 7 14 21 2 7 3 4 41 6 17 25 33 4 2 5 0
2.2 5 10 15 2 0 2 5 3 0 6 12 18 23 29 35 7 14 21 26 35 42 9 17 26 3 4 4 3 51
2.4 5 10 15 2 0 2 5 3 0 6 12 16 2 4 3 0 36 7 14 2 2 29 36 43 9 17 26 35 43 52
2.6 5 10 16 21 2 6 31 6 12 19 2 5 31 37 7 15 2 2 29 37 4 4 9 18 27 35 4 4 53
2.8 5 10 16 21 26 31 6 12 19 2 5 31 37 6 15 2 3 3 0 39 4 5 9 16 27 36 4 5 5 4
3 5 11 18 21 2 7 32 6 13 19 2 5 3 2 39 6 15 23 31 36 46 9 19 26 3 7 4 6 55
hwlru pH-8.0 pH-6.5 pH<-9.0
mcsntmtlon Log lnMtlwtlon LOQ lnactlvatlon Lag hl?ctlvatlon
hoax 0.5 1.0 1.5 2 .0 2.5 3.0 0.5 1.0 1.5 2 .0 2.5 3.0 0.5 1.0 1.5 2 .0 2.5 3.0
<so.4 8 17 25 3 3 4 2 5 0 10 2 0 3 0 39 4 9 59 12 2 3 35 4 7 58 70
0.6 S 17 26 3 4 4 3 51 11 2 0 31 41 51 61 12 2 4 3 7 4 9 61 73
0.8 9 18 27 3 5 4 4 53 11 21 3 2 4 2 5 3 63 13 25 3 8 5 0 63 75
1 9 18 2 7 3 6 4 5 5 4 11 2 2 3 3 4 3 5 4 65 13 28 38 5 2 85 76
1.2 9 18 28 3 7 4 6 55 11 2 2 3 4 4 5 56 67 13 2 7 4 0 53 6 7 60
1.4 10 19 29 38 4 8 57 12 2 3 3 5 4 6 5 6 69 14 2 7 41 55 68 8 2
1.6 10 19 29 3 9 4 8 5 6 12 2 3 3 5 4 7 5 6 7 0 14 2 6 42 5 6 70 0 4
1.6 10 2 0 3 0 4 0 5 0 80 12 2 4 36 48 60 72 14 29 4 3 57 72 96
2 10 2 0 31 41 51 61 12 2 5 3 7 4 9 6 2 74 15 2 9 4 4 59 7 3 9E
2.2 10 21 31 41 52 6 2 13 2 5 3 6 5 0 6 3 75 15 3 0 4 5 80 75 SO
2.4 11 21 3 2 4 2 5 3 63 13 26 3 9 51 8 4 77 15 31 4 6 61 77 9 2
2.8 11 22 33 4 3 5 4 6 5 13 28 3 9 52 6 5 70 16 31 4 7 63 76 9 4
2.8 11 2 2 33 4 4 5 5 66 13 2 7 4 0 53 6 7 60 16 3 2 40 6 4 80 96
3 11 2 2 3 4 4 5 56 67 14 27 41 5 4 6 6 El 16 3 2 4s 6 5 Bl 9 7
NOTE: CT 99.9 - CT for 3-log inactivatbn.

Table D-7. CT Values for Inactivation of Viruses by Free Chlorine
2.0pH 1 6-9 10Temperature (C)
0.5 6 45
5 4 30
10 I 3 22
15 2 15
20 1 11
25 1 7
Log Inactivation3.0
6-9 10
9 66 12 90
6 44 8 60
4 33 6 45
3 22 4 30
2 16 3 22
1 11 2 15
4.06-9 10
Table D-8. CT Values for Inactivation of GimYi” Cysts by Chlorine Dioxide
1 <=l
T6I’IIp6r6tUr6 (Cl
5 10 15 20 25
0.5~log 10 4.3 4 3.2 2.5 2
1 -log 21 8.7 7.7 6.3 5 3.7
1.5~log 32 13 12 10 7.5 5.5
2-log 42 17 15 13 10 7.3
2.5-109 52 22 19 16 13 9
3-log 63 26 23 19 15 11
Table D-9. CT Values for Inactivation of Viruses by Chlorine Dioxide pH 6-9
Temperature (C)
<=l 5 10 15 20
2-log 8.4 5.6 4.2 2.8 2.1
3-log 25.6 17.1 12.8 8.6 6.4
44og 50.1 33.4 25.1 16.7 12.5
25
1.4
4.3
8.4
Table D-10. C . Values for Inactivation of Giardia Cysts by Ozone
Temperature (C)
<=l 5 10 15 20 25
0.5~log 0.48 0.32 0.23 0.16 0.1 0.08
1 -log 0.97 0.63 0.48 0.32 0.2 0.16
1.5-log 1.5 0.95 0.72 0.48 0.36 0.24
2-log 1.9 1.3 0.95 0.63 0.48 0.32
2.5-log 2.4 1.6 1.2 0.79 0.6 0.4
3-log I 2.9 1.9 1.43 0.95 0.72 0.48
142

Table D-l 1. CT Values for Inactivation of Viruses by Ozone
I Temperature (C)
I 1 <=l 5 10 15 20 25
2-log 0.9 0.6 0.5 0.3 0.25 0.15
3-log 1.4 0.9 0.8 0.5 0.4 0.25
4-log 1.8 1.2 1 0.6 0.5 0.3
Table D-12. CT Values for Inactivation of Giardh Cysts by Chloramine pH 6-9
r Temperature (C)
0.5-log 635 365 310 250 185 125
l-log 1270 735 615 500 370 250
1.5-log 1900 1100 930 750 550 375
2-log 2535 1470 1230 1000 735 500
2.5-109 3170 1830 1540 1250 915 625
3-log 3800 2200 1850 1500 1100 750
< = 1 5 10 15 20 25
Table D-13. CT Values for Inactivation of Viruses by Chloramine
Temperature (C)
<=l 5 10 15 20 25
2-log 1243 857 643 428 321 214
3-log 2063 1423 1067 712 534 356
4-log 2883 1988 1491 994 746 497
1
Table D-14. CT Values for Inactivation of Viruses by UV
‘/I
143

Appendix EPerformance Limiting Factors Summary Materials
and Definitions
145

CPE Factor Summary Sheet Terms
Plant Type
Source Water
Performance Summary
Ranking Table
Rank
Rating
Performance LimitingFactor (Category)
Notes
Brief but specific description of plant type (e.g., conventionalwith flash mix, flocculation, sedimentation, filtration and chlorinedisinfection; or direct filtration with flash mix, flocculation andchlorine disinfection).
Brief description of source water (e.g., sutface water includingname of water body).
Brief description of plant performance based on performanceassessment component of the CPE (i.e., ability of plant to meetoptimized performance goals).
A listing of identified performance limiting factors that directlyimpact plant performance and reliability.
Relative ranking of factor based on prioritization of all “A” and“B” rated factors identified during the CPE.
Rating of factor based on impact on plant performance andreliability:
A - Major effect on a long-term repetitive basis
B - Moderate effect on a routine basis or major effect on aperiodic basis
C - Minor effect
Factor identified from Checklist of Performance Limiting Factors,including factor category (e.g., administration, design, operation,and maintenance).
Brief listing of reasons each factor was identified (e.g., lack ofprocess control testing, no defined performance goals).
146

CPE Performance Limiting Factors Summary
Plant Name/Location:
CPE Performed By:
CPE Date:
Plant Type:
Source Water:
Performance Summary:
Ranking Table
Rank Rating Performance Limiting Factor (Category)
Rating DescriptionA - Major effect on long-term repetitive basis.B - Moderate effect on a routine basis or major effect on a periodic basis.C - Minor effect.
147

Factor
Performance Limiting Factors Notes
Notes
.
148

Checklist of Performance Limiting Factors
A. ADMINISTRATION1. Plant Administrators
a. 0 Policies
b. El Familiaritv With Plant Needs
C. q Suoervision
d. Cl Planning
e. 0 Comolacencv
f. 0 Reliabilitv
9. Cl Source Water Protection
2. Plant Staffa. 0 Number
b. 0 Plant Coveraae
C. 0 Personnel Turnover
d. q Comoensation
e. Cl Work Environment
f. 0 Certification
3. Financiala. 0 Ooeratina Ratio
b. 0 Coveraae Ratio
C. q Reserves
B. DESIGN1. Source Water Quality
a. Cl Microbial Contamination
2. Unit Process Adequacya.
b.
c.
d.
e.
f.
9.
h.
i.
j.
k.
0 Intake Structure
0 Presedimentation Basin
0 Raw Water Pumoinq
0 Flow Measurement
0 Chemical Storaae and Feed
Facilities
0 Flash Mix
q Flocculation
q Sedimentation
I7 Filtration
0 Disinfection
0 SludaeIBackwash Water
Treatment and Disoosal
149

3. Plant Operabilitva.
b.
c.
q
q
q
q
q
q
q
q
cl
‘Process Flexibilitv
Process Controllability
Process Instrumentation/
Automation
Standbv Units for Kev
Eauipment
Flow Proportioninq
Alarm Svstems
Alternate Power Source
Laboratorv Space and Eauipment
Sample Taos
d.
e.
f.
9.
h.
i.
C. OPERATION1. Testing
a. Cl Process Control Testinq
b. q Reoresentative Samolinq
2. Process Controla. Cl Time on the Job
b. Cl Water Treatment Understandinq
C. Cl Apolication of Conceots and
Testina to Process Control
3. Operational Resourcesa. 0 Trainina Proaram
b. 0 Technical Guidance
c. Cl Ooerational Guidelines/Procedures
D. MAINTENANCE1. Maintenance Program
a. El Preventive
b. 17 Corrective
C. Cl Housekeeping
2. Maintenance Resourcesa. •I Materials and Equioment
b. Cl Skills or Contract Services
150

Definitions for Assessing Performance Limiting Factors
NOTE: The following list of defined factors is provided to assist the evaluator with identifying perform-ance limitations associated with protection against microbial contaminants in water treatment systems.Performance limiting factors are described below using the following format.
A. CATEGORY1. Subcategory
a. Factor Namel Factor description
9 Examole of factor aDDtied to SOeCifiC D/ant or Uti/itV
A. Administration1. Plant Administrators
a. Policies4 Do existing policies or the lack of policies discourage staff members from making
required operation, maintenance, and management decisions to support plant perform-ance and reliability?9 Utility administration has not communicated a clear policy to optimize plant per-
formance for public health protection.
9 Multiple management levels within a utility contribute to unclear communicationand lack of responsibility for plant operation and performance.
9 Cost savings is emphasized by management at the expense of plant performance.
9 Utility managers do not support reasonable training and certification requests byplant staff.
9 Administration continues to allow connections to the distribution system withoutconsideration for the capacity of the plant.
b. Familiaritv With Plant Needs+ Do administrators lack first-hand knowledge of plant needs?
9 The utility administrators do not make plant visits or otherwise communicate withplant staff.
9 Utility administrators do not request input from plant staff during budget develop-ment.
c. Suoervisionl Do management styles, organizational capabilities, budgeting skills, or communication
practices at any management level adversely impact the plant to the extent that per-formance is affected?9 A controlling supervision style does not allow the plant staff to contribute to opera-
tional decisions.
9 A plant supervisor’s inability to set priorities for staff results in insufficient timeallocated for process control.
d. Planninq+ Does the lack of long range planning for facility replacement or alternative source water
quantity or quality adversely impact performance?9 A utility has approved the connection of new customers to the water system with-
out considering the water demand impacts on plant capacity.
9 An inadequate capital replacement program results in utilization of outdated equip-ment that cannot support optimization goals.
151

e. Complacencv+ Does the presence of consistent, high quality source water result in complacency within
the water utility?9 Due to the existence of consistent, high quality source water, plant staff are not
prepared to address unusual water quality conditions.
9 A utility does not have an emergency response plan in place to respond to unusualwater quality conditions or events.
f. Reliabilitv+ Do inadequate facilities or equipment, or the depth of staff capability, present a poten-
tial weak link within the water utility to achieve and sustain optimized performance?9 Outdated filter control valves result in turbidity spikes in the filtered water entering
the plant clearwell.
9 Plant staff capability to respond to unusual water quality conditions exists withonly the laboratory supervisor.
Source Water Protection+ Does the water utility lack an active source water protection program?
9 The absence of a source water protection program has resulted in the failure toidentify and eliminate the discharge of failed septic tanks into the utility’s sourcewater lake.
9 Utility management has not evaluated the impact of potential contaminationsources on water quality within their existing watershed.
2. Plant Staffa. Number
+ Does a limited number of people employed have a detrimental effect on plant operationsor maintenance?9 Plant staff are responsible for operation and maintenance of the plant as well as
distribution system and meter reading, limiting the time available for process con-trol testing and process adjustments.
b. Plant Coveraae6 Does the lack of plant coverage result in inadequate time to complete necessary opera-
tional activities? (Note: This factor could have significant impact if no alarm/shutdowncapability exists - see design factors).9 Staff are not present at the plant during evenings, weekends, or holidays to make
appropriate plant and process control adjustments.
9 Staff are not available to respond to changing source water quality characteristics.
c. Personnel Turnover+ Does high personnel turnover cause operation and maintenance problems that affect
process performance or reliability?9 The lack of support for plant needs results in high operator turnover and, subse-
quently, inconsistent operating procedures and low staff morale.
d. Compensationl Does a low pay scale or benefit package discourage more highly qualified persons from
applying for operator positions or cause operators to leave after they are trained?9 The current pay scale does not attract personnel with sufficient qualifications to
support plant process control and testing needs.
8. Work Environment4 Does a poor work environment create a condition for “sloppy work habits” and lower
operator morale?9 A small, noisy work space is not conducive for the recording and development of
plant data.
152

f. Certification+ Does the lack of certified personnel result in poor 0 & M decisions?
9 The lack of certification hinders the staff’s ability to make proper process controladjustments.
3. Financiala. Ooeratina Ratio
+ Does the utility have inadequate revenues to cover operation, maintenance, andreplacement of necessary equipment (i.e., operating ratio less than 1 .O)?9 The current utility rate structure does not provide adequate funding and limits
expenditures necessary to pursue optimized performance (e.g., equipmentreplacement, chemical purchases, spare parts).
b. Coveraae Ratio+ Does the utility have inadequate net operating profit to cover debt service requirements
(i.e., coverage ratio less than 1.25)?9 The magnitude of a utility’s debt service has severely impacted expenditures on
necessary plant equipment and supplies.
C. Reserves+ Does the utility have inadequate reserves to cover unexpected expenses or future
facility replacement?9 A utility has a 40-year-old water treatment plant requiring significant modifications;
however, no reserve account has been established to fund these needed capitalexpenditures.
B. Design1. Source Water Quality
a. Microbial Contamination+ Does the presence of microbial contamination sources in close proximity to the water
treatment plant intake impact the plant’s ability to provide an adequate treatment bar-rier?9 A water treatment plant intake is located downstream of a major wastewater
treatment plant discharge and is subject to a high percentage of this flow duringdrought periods.
2. Unit Process Adequacya. Intake Structure
+ Does the design of the intake structure result in excessive clogging of screens, build-upof silt, or passage of material that affects plant equipment?9 The location of an intake structure on the outside bank of the river causes exces-
sive collection of debris, resulting in plugging of the plant flow meter and staticmixer.
9 The design of a reservoir intake structure does not include flexibility to draw waterat varying levels to minimize algae concentration.
b. Presedimentation Basin+ Does the design of an existing presedimentation basin or the lack of a presedimentation
basin contribute to degraded plant performance?9 The lack of flexibility with a presedimentation basin (Le., number of basins, size,
bypass) causes excessive algae growth, impacting plant performance.
9 A conventional plant treating water directly from a “flashy” stream experiencesperformance problems during high turbidity events.
153

C. Raw Water Pumoing4 Does the use of constant speed pumps cause undesirable hydraulic loading on down-
stream unit processes?9 The on-off cycle associated with raw water pump operation at a plant results in
turbidity spikes in the sedimentation basin and filters.
d. Flow Measurement+ Does the lack of flow measurement devices or their accuracy limit plant control or
impact process control adjustments?9 The flow measurement device in a plant is not accurate, resulting in inconsistent
flow measurement records and the inability to pace chemical feed rates accordingto flow.
e. Chemical Storaqe and Feed Facilitiesl Do inadequate chemical storage and feed facilities limit process needs in a plant?
9 Inadequate chemical storage facilities exist at a plant, resulting in excessive chemi-cal handling and deliveries.
9 Capability does not exist to measure and [email protected] the coagulant and flocculant feedrates.
f. Flash Mixl Does inadequate mixing result in excessive chemical use or insufficient coagulation to
the extent that it impacts plant performance?9 A static mixer does not provide effective chemical mixing throughout the entire
operating flow range of the plant.
9 Absence of a flash mixer results in less than optimal chemical addition and insuffi-cient coagulation.
9. Flocculation4 Does a lack of flocculation time, inadequate equipment, or lack of multiple flocculation
stages result in poor floe formation and degrade plant performance?9 A direct filtration plant, treating cold water and utilizing a flocculation basin with
short detention time and hydraulic mixing, does not create adequate floe for filtra-tion.
h. Sedimentation+ Does the sedimentation basin configuration or equipment cause inadequate solids
removal that negatively impacts filter performance?9 The inlet and outlet configurations of the sedimentation basins cause short-
circuiting, resulting in poor settling and floe carryover to the filters.
9 The outlet configuration causes floe break-up, resulting in poor filter performance
9 The surface area of the available sedimentation basins is inadequate, resulting insolids loss and inability to meet optimized performance criteria for the process.
i. Filtration+ Do filter or filter media characteristics limit the filtration process performance?
9 The filter loading rate in a plant is excessive, resulting in poor filter performance.
9 Either the filter underdrain or support gravel have been damaged to the extent thatfilter performance is impacted.
+ Do filter rate-of-flow control valves provide a consistent, controlled filtration rate?9 The rate-of-flow control valves produce erratic, inconsistent flow rates that result
in turbidity and/or particle spikes.l Do inadequate surface wash or backwash facilities limit the ability to clean the filter
beds?9 The backwash pumps for a filtration system do not have sufficient capacity to
adequately clean the filters during backwash.
154

9 The surface wash units are inadequate to properly clean the filter media.
9 Backwash rate is not sufficient to provide proper bed expansion to properly cleanthe filters.
j. Disinfection+ Do the disinfection facilities have limitations, such as inadequate detention time,
improper mixing, feed rates, proportional feeds, or baffling, that contribute to poor dis-infection?9 An unbaffled clearwell does not provide the necessary detention time to meet the
Giardia inactivation requirements of the SWTR.
k. Sludqe/Backwash Water Treatment and Disoosal+ Do inadequate sludge or backwash water treatment facilities negatively influence plant
performance?9 The plant is recycling backwash decant water without adequate treatment.
9 The plant is recycling backwash water intermittently with high volume pumps.
9 The effluent discharged from a sludge/backwash water storage lagoon does notmeet applicable receiving stream permits.
9 Inadequate long-term sludge disposal exists at a plant, resulting in reduced cleaningof settling basins and recycle of solids back to the plant.
3. Plant Operabilitya. Process Flexibility
+ Does the lack of flexibility to feed chemicals at desired process locations or the lack offlexibility to operate equipment or processes in an optimized mode limit the plant’sability to achieve desired performance goals?9 A plant does not have the flexibility to feed either a flocculant aid to enhance floe
development and strength or a filter aid to improve filter performance.
9 A plant includes two sedimentation basins that can only be operated in series.
b. Process Controllabilityl Do existing process controls or lack of specific controls limit the adjustment and control
of a process over the desired operating range?9 Filter backwash control does not allow for the ramping up and down of the flow
rate during a backwash event.
9 During a filter backwash, the lack of flow control through the plant causes hydrau-lic surging through the operating filters.
9 The level control system located in a filter influent channel causes the filter effluentcontrol valves to overcompensate during flow rate changes in a plant.
9 Flows between parallel treatment units are not equal and cannot be controlled.
9 The plant influent pumps cannot be easily controlled or adjusted, necessitatingautomatic start-up/shutdown of raw water pumps.
9 Plant flow rate measurement is not adequate to allow accurate control of chemicalfeed rates.
9 Chemical feed rates are not easily changed or are not automatically changed toaccount for changes in plant flow rate.
C. Process Instrumentation/Automationl Does the lack of process instrumentation or automation cause excessive operator time
for process control and monitoring?9 A plant does not have continuous recording turbidimeters on each filter, resulting
in extensive operator time for sampling.
155

C.
9 The indication of plant flow rate is only located in the pipe gallery, which causesdifficulty in coordinating plant operation and control.
9 Automatic shutdown/start-up of the plant results in poor unit process performance.
d. Standbv Units for Kev Eauioment+ Does the lack of standby units for key equipment cause degraded process performance
during breakdown or during necessary preventive maintenance activities?9 Only one backwash pump is available to pump water to a backwash supply tank,
and the combination of limited supply tank volume and an unreliable pump hascaused staff to limit backwashing of filters during peak production periods.
e. Flow Prooortioning+ Does inadequate flow splitting to parallel process units cause individual unit overloads
that degrade process performance?9 In fluent flow to a plant is hydraulically split to multiple treatment trains, and
uneven flow distribution causes overloading of one flocculation/sedimentation trainover the others.
f. Alarm Svstemsl Does the absence or inadequacy of an alarm system for critical equipment or processes
cause degraded process performance?9 A plant that is not staffed full-time does not have alarm and plant shut-down capa-
bility for critical finished water quality parameters li. e., turbidity, chlorine residual).
9. Alternate Power Sourcel Does the absence of an alternate power source cause reliability problems leading to
degraded plant performance?9 A plant has frequent power outages, and resulting plant shutdowns and start-ups
cause turbidity spikes in the filtered water.
h. Laboratorv Soace and Eouipmentl Does the absence of an adequately equipped laboratory limit plant performance?
9 A plant does not have an adequate process control laboratory for operators to per-form key tests (i.e., turbidity, jar testing).
i. Samole Taos+ Does the lack of sample taps on process flow streams prevent needed information from
being obtained to optimize performance?9 Filter-to-waste piping following plant filters does not include sample taps to meas-
ure the turbidity spike folio wing back wash.
9 Sludge sample taps are not available on sedimentation basins to allow process con-trol of the sludge draw-off from these units.
Operation1. Testing
a. Process Control Testingl Does the absence or wrong type of process control testing cause improper operational
control decisions to be made?9 Plant staff do not measure and record raw water pkl, alkalinity, and turbidity on a
routine basis: consequently, the impact of raw water quality on plant performancecannot be assessed.
9 Sedimentation basin effluent turbidity is not measured routinely in a plant.
156

b. Representative Samolinql Do monitoring results inaccurately represent plant performance or are samples collected
improperly?9 Plant staff do not record the maximum turbidity spikes that occur during filter
operation and following filter back wash events.
9 Turbidity sampling is not performed during periods when the reclaim backwashwater pump is in operation.
2. Process Controla. Time on the Job
+ Does staff’s short time on the job and associated unfamiliarity with process control andplant needs result in inadequate or improper control adjustments?9 Utility staff, unfamiliar with surface water treatment, were given responsibility to
start a new plant; and lack of experience and training contributed to impropercoagulation control and poor performance.
b. Water Treatment Understanding4 Does the operator’s lack of basic water: treatment understanding contribute to improper
operational decisions and poor plant performance or reliability?9 Plant staff do not have sufficient understanding of water treatment processes to
make proper equipment or process adjustments.
9 Plant staff have limited exposure to water treatment terminology, limiting theirability to interpret information presented in training events or in published informa-tion.
C. ADDlication of Concepts and Testina to Process Control6 Is the staff deficient in the application of their knowledge of water treatment and inter-
pretation of process control testing such that improper process control adjustments aremade?
Plant staff do not perform jar testing to determine appropriate coagulant dosagesfor different water quality conditions.
Plant filters are placed back in service following backwash without considerationfor effluent turbidity levels.
Filter to waste valves are available but are not used following filter backwash.
Plant staff do not calculate chemical dosages on a routine basis.
Plant staff do not change chemical feed systems to respond to changes in rawwater quality.
Filters are backwashed based on time in service or headloss rather than on opti-mized performance goal for turbidity or particle removal.
Plant staff nbump” filters by increasing the hydraulic loading to see if backwashingis necessary.
Sedimentation basin performance is controlled by visual observation rather thanprocess control testing.
3. Operational Resourcesa. Trainina Program
l Does inadequate training result in improper process control decisions by plant staff?9 A training program does not exist for new operators at a plant, resulting in incon-
sistent operator capabilities.
157

0.
b. Technical Guidancel Does inappropriate information received from a technical resource (e.g., design engi-
neer, equipment representative, regulator, peer) cause improper decisions or priorities tobe implemented?9 A technical resource occasionally provides recommendations to the plant staff:
however, recommendations are not based on plant-specific studies.
C. Ooerational Guidelines/Proceduresl Does the lack of plant-specific operating guidelines and procedures result in inconsistent
operational decisions that impact performance?9 The lack of operational procedures has caused inconsistent sampling between
operator shifts and has led to improper data interpretation and process controladjustments.
Maintenance1. Maintenance Program
a. Preventivel Does the absence or lack of an effective preventive maintenance program cause unnec-
essary equipment failures or excessive downtime that results in plant performance orreliability problems?9 Preventive maintenance is not performed on plant equipment as recommended by
the manufacturer, resulting in premature equipment failures and degraded plantperformance.
9 A work order system does not exist to identify and correct equipment that is func-tioning improperly.
b. Corrective+ Does the lack of corrective maintenance procedures affect the completion of emergency
equipment maintenance?9 A priority system does not exist on completion of corrective maintenance activities,
resulting in a critical sedimentation basin being out of service for an extendedperiod.
9 Inadequate critical spare parts are available at the plant, resulting in equipmentdown time.
C. Housekeeoinq+ Does a lack of good housekeeping procedures detract from the professional image of
the water treatment plant?9 An unkempt, cluttered working environment in a plant does not support the overall
good performance of the facility.
2. Maintenance Resourcesa. Materials and EauiDment
+ Does the lack of necessary materials and tools delay the response time to correct plantequipment problems?9 Inadequate tool resources at a plant results in increased delays in repairing equip-
ment.
b. Skills or Contract Servicesl Do plant maintenance staff have inadequate skills to correct equipment problems or do
the maintenance staff have limited access to contract maintenance services?9 Plant maintenance staff do not have instrumentation and control skills or access to
contract services for these skills, resulting in the inability to correct malfunctioningfilter rate control valves.
158

Appendix FData Collection Forms
159

Contents
Section
Kick-Off Meeting
Administration Data
Design Data
Operations Data
Maintenance Data
Field Evaluation Data
Interview Data
Exit Meeting
Page
161 - 163
164 - 169
170- 180
181 - 189
190- 191
192 - 197
198- 200
201 - 203
160

KICK-OFF MEETING
A. Kick-Off Meeting Agenda
1.
2.
Purpose of the CPE
l Background on CCP process development and application
l Basis for conducting the CPE at the utility
l Assess ability of plant to meet optimized performance goals
Optimized performance criteria description
Multiple barrier concept for microbial protection
l Identify factors limiting plant performance
l Describe follow-up activities
Schedule CPE events
l Plant tour
l On-site data collection
Performance
Design
Operations
Maintenance
Administration
l Special studies
l Interviews
l Exit meeting
Utilitv Staff Involved Date/Time
161

KICK-OFF MEETING
3. Information Resources
. Performance monitoring records
. Plant operating records
. As-built construction drawings
. Plant flow schematic
. As-built construction drawings
. 0.81 M manuals
. Equipment manuals
. Previous and current year budgets
. Organizational structure
. Water rate structure
162

KICK-OFF MEETING
B. Attendance List
Utility Name Date
I Name TitlelPosition TeleDhone No.
163

ADMINISTRATION DATA
A. Name and Location
1. Name of Facility
2. Utility Name
3. Current Date
4. Contact Information:
B. Organization
1. Governing Body (name and scheduled meetings)
2. Utility structure (attach organizational chart if available)
164

ADMINISTRATION DATA
3. Plant Organizational Structure (include operations, maintenance, laboratory personnel; attach chart ifavailable)
C. Communications
1. Utility Mission Statement
2. Water Quality Goals
165

ADMINISTRATION DATA
3. Communication Mechanisms:
TypeCl Staff Meetings
Description
0 Administrator/Board
Visits to Plant
0 Reports (plant staff to
manager; manager to
governing board)
0 Public Relations/
Education
0. Planning
1. Short-Term Needs
2. Long-Term Needs
166

ADMINISTRATION DATA
E. Personnel
Comments (e.g., vacant positions, adequacy of current staffing):
F. Plant Coverage
1. Shift Description (e.g., length, number per shift, we,ekend/holiday coverage)
2. Unstaffed Operation Safeguards (e.g., alarm/shutdown capability, dialer)
167

ADMINISTRATION DATA
G. Financial Information
1. Budget (basis for budget: total utility 0 plant only 01
Enter Year
1. Beginning Cash on Hand
Last Year Actual Current Year Budget
I I
b. Other Revenue (connection fees, interest)
c. Total Water Revenue (2a t2bI
d. Number of Customer Accounts
e. Average Charge per Account (2a + 2d)
3. Total Cash Available (1 + 2~1
b. Replacement Expenses
c. Total O,M&R Expenses (4a + 4b)
d. Total Loan Payments (interest + principal)
e. Capital Purchases
f. Total Cash Paid Out (4c + 4d + 4eI
g. Ending Cash Position (3 - 4f) I I
5. Operating Ratio (2a + 4~)’
6. Coverage Ratio (2c - 4c) + (4d)’
7. Year End Reserves (debt, capital improvements) I8. End of Year Operating Cash (49 - 7)
Source: USEPA Region 8 Financial Analysis Document (1997)
* Includes employee compensation, chemicals, utilities, supplies, training, transportation,insurance, etc.
f Measure of whether operating revenues are sufficient to cover O,M&R expenses. Anoperating ratio of 1 .O is considered minimum for a self-supporting utility.
t Measure of the sufficiency of net operating profit to cover debt service requirements ofthe utility. Bonding requirements may require a minimum ratio (e.g., 1.25).
168

ADMINISTRATION DATA
2. Supporting Financial Information:
Category Information
0 Rate Structure
l User fees
l Connection fees Il Planned rate changes
0 Debt Service
l Long-term debt
l Reserve account
0 C a p i t a l
Improvements
l Planning
l Reserve account
0 Budget Process
l Staff involvement I
I
q Spending Authorization 1
l Administrator I
l Plant staff
I
169

DESIGN DATA
A . Plant Schematic and Capacity Information
1. Attach or draw plant flow schematic; include the following details:
l Source water type/location l Chemical injection locationsl Major unit processes l Piping flexibilityl Flow measurement locations l On-line monitoring type/location
2. Flow Conditions:
Parameter
Design Capacity
Average Annual Flow
Flow
I Peak Instantaneous Flow I I I
170

B.
1.
DESIGN DATA
Major Unit Process Information
Flocculation:
Topic Description Information
1. Description Type (reel, turbine, hydraulic)
Number trains/stages per trainI
Control (constant/variable speed)
2. Dimensions Length per stage:
Width per stage:
Depth per stage:
3. Major Unit
Process
Total volume:
Selected Process Parameter(s):
Detention time (min)
Evaluation 1 Assigned process capacity I
4. Other IDesign
Information
(G values) I
Calculation of mixing energy as expressed by the mean velocity gradient (G) for mechanical mixing:
G = Velocity gradient, set -’p = viscosity, lb-seclft*V = volume, ft3P = energy dissipated, ft-lblsec
= hp x 550 ft-lblsec/hp
Calculation of G for hydraulic mixing:
= water density, 62.4 Iblft3E, = head loss, ftt = detention time, set
sitv of Water Versus TemoeratureVisco,.-, _. .---. - ___ - ,--.---~ -
Temp. (“F) Temp. (“C) Viscosityx 1o-5
(lb-seclft*)32 0 3.74640 4 3.22950 . 10 2.735
171

DESIGN DATA
B. Major Unit Process Information (cont.)
2. Sedimentation:
Topic
1 s Description
Description
Type (conventional, tube settlers)
Number trains
Weir location
information
Sludge collection
2. Dimensions 1
Width:
Depth:
Total surface area:
3. Major Unit
Process
Evaluation
Selected Process Parameter(s):
Surface loading rate
Assigned process capacity
4. Other
Design
Information
172

DESIGN DATA
B. Major Unit Process Information (cont.)
3. Filtration:
Topic
1. Description
Description
Type (mono, dual, mixed)
Number of filters
Information
Filter control (constant, declining)
Surface wash type (rotary, fixed)
2. Dimensions Length or diameter:
Width:
Total surface area:
3. Media design conditions (depth, effective size, uniformity coefficient):
4. Backwash Backwash initiation (headloss, turbidity, time):
Sequence (surface wash, air scour, flow ramping up/down, filter-to-waste):
173

B.
3.
DESIGN DATA
Major Unit Process Information (cont.)
Filtration (cont.):
Topic Description Information
5. Major Unit Selected Process Parameter(s);
Process Surface loading rate
Evaluation
Assigned process capacity
6. Other
Design
Information
174

B. Major Unit Process
4. Disinfection:
DESIGN DATA
Information (cont.)
Topic
1 I Description
Description
Contact type (clearwell, storage)
Information
T&T factor (see Table 4-4 or use
tracer study results)
2. Dimensions 1 Length or diameter:
Width:
Minimum operating depth:
Total volume:
1 Volume adjusted for T,,/T:
3. Major Unit
Process
Selected Process Parameters:
Disinfectant (chlorine, chloramines)I
Evaluation Max. disinfectant residual (mg/L)
Maximum pH
Minimum temperature (“C)
Required Giardia inactivation
Required virus inactivation
Assigned process capacity
5. Other
Design
Information
175

DESIGN DATA
C. Miscellaneous Equipment Information
1. Miscellaneous Equipment/Unit Processes:
Equipment/Process
1. Intake Structure
Description/Information
m Location
b Size of screen opening
l Design limitations
2. Presedimentation
l Detention time
. Flexibility to bypass
l Chemical feed capability
l Design limitations I
3. Rapid Mix
l Type (mech., inline)
l Chemical feed options
l Mixing energy
l Design limitations
176

DESIGN DATA
C. Miscellaneous Equipment Information (cont.)
1. Miscellaneous Equipment/Unit Processes (cont.):
Equipment/Process I Description/Information
4. Backwash/Sludge
Decant Treatment
l
l Il Design limitations
5. Sludge HandingI
l Onsite storage volume 1
l Long-term disposal
l Design limitations
177

DESIGN DATA
C. Miscellaneous Equipment Information (cant .)
4. Pumping:
Flow Stream Pumpedl Locationl Number of pumpsl Rated capacity
1.
Pump Typel Turbinel Centrifugal
Commentsl Flow control methodl Design issuesl Source of rated capacity (name plate,
specifications, flow meter)
2.
3.
4.
5.
6.
7.
180

OPERATIONS DATA
A. Process Control Strategy and Communication
Describe the process control strategy used by the staff and associated communication mechanisms.
Topic
1. Process Control Strategy
@ Does the staff set specific
performance targets? Are they
posted?
Description/Information
m Who sets process control
strategies and decisions?
b Are appropriate staff members
involved in process control
and optimization activities?
2. Communication Methods
b Does the staff have routine
plant/shift meetings?
b How is communication
conducted among operations,
maintenance, and lab?
) Does the staff develop and
follow operational procedures?
181

OPERATIONS DATA
B. Process Control Procedures
Describe specific process control procedures for the following available processes.
Process I Description/Information
1. Intake Structure
m Flexibility to draw water from
different locations & depths
l Operational problems
2. Pumping/Flow Control
l Flow measurement and control
. Proportioning to multiple units 1
l Operational problems
3. Presedimentation
l Chemicals used/dose control I
l Monitoring (turbidity)
l Sludge removal
l Operational problems
4. Preoxidation
l Chemicals used/dose control
l Monitoring (residual)
l Operational problems
182
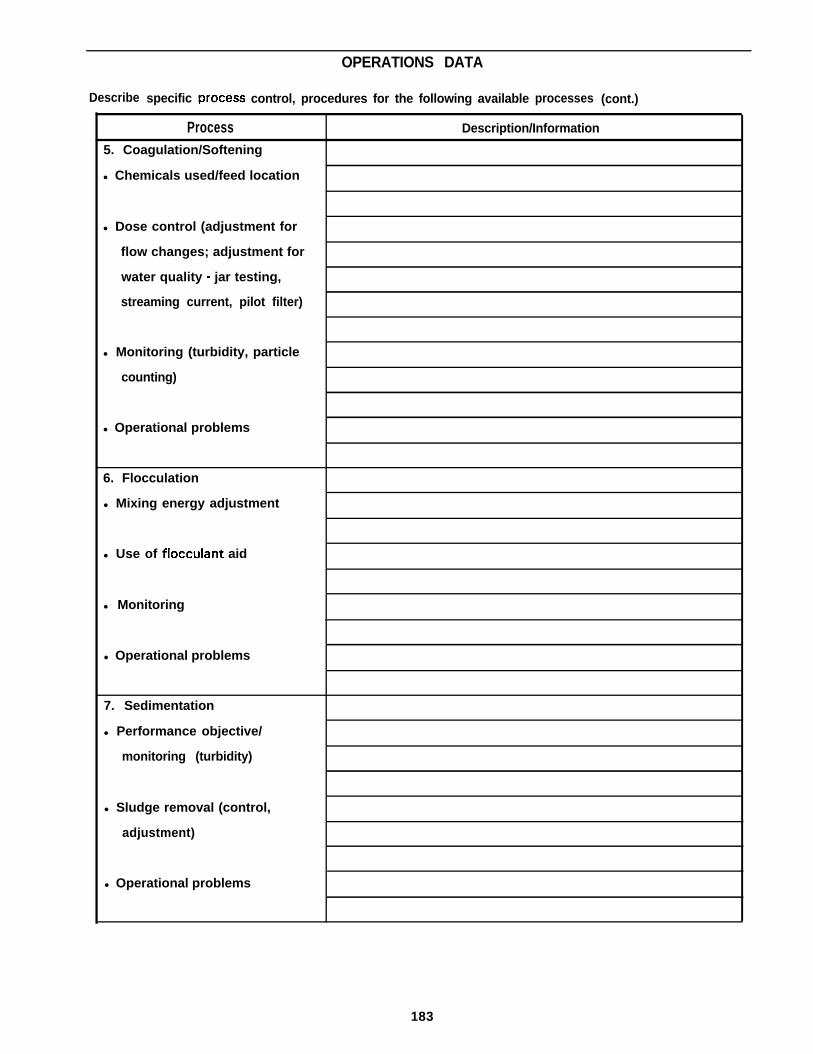
Describe specific
OPERATIONS DATA
control, procedures for the following available processes (cont.)
Process5. Coagulation/Softening
l Chemicals used/feed location
Description/Information
l Dose control (adjustment for
flow changes; adjustment for
water quality - jar testing,
streaming current, pilot filter)
l Monitoring (turbidity, particle
counting)
l Operational problems
6. Flocculation
l Mixing energy adjustment
l Use of flocculant aid
l Monitoring
l Operational problems
7. Sedimentation
l Performance objective/
monitoring (turbidity)
l Sludge removal (control,
adjustment)
l Operational problems
183

OPERATIONS DATA
Describe specific process control procedures for the following available processes (cont.)
Process5. Filtration
1 Performance objective/
monitoring (turbidity, particles,
headloss, run time)
1 Rate control due to demand,
filter backwash
Description/Information
1 Use of filter aid polymer
) Basis for backwash initiation
(turbidity, particles, headloss,
time)
1 Backwash procedures (wash
sequence, duration and rates,
basis for returning filter to
service)
B Filter/media inspections
(frequency and type)
b Operational problems
9. Disinfection
D Performance objective/
monitoring (residual, CT)
l CT factors (pH, minimum depth
of contactor, T,,fl, maximum
residual)
l Operational problems
184

OPERATIONS DATA
Describe specific process control procedures for the following available processes (cont.)
Process I Description/Information
10. Stabilization
l Chemical used/feed location
l Performance objective/
monitoring (pH, index)
l Operational problems
11. Decant Recycle
. Duration, % of plant flow
l Type of treatment (settling,
chemical addition)
l Operational problems
12. Sludge Treatment
185

OPERATIONS DATA
C. Data Management
Describe data collection and management approaches and tools used by plant staff.
Topic
1. Data Collection
Description/Information
l Type of forms used (water Iquality testing, shift rounds,
plant log)
l Computer (SCADA, database)I
2. Data Application
l Development of daily, monthly
reports
l Development of trend charts
I
D. Problem Solving and Optimization Activities
Describe specific approaches and tools used to solve problems or optimize plant processes.
Topic
1. Problem Solving/Optimization
l Use of special studies
l Pilot plant
Description/Information
l List recent and ongoing
problem solving/optimization
activities
l Available resources (technical
assistance providers, training,
manuals of practice)
186

OPERATIONS DATA
E. Complacency and Reliability
Describe specific approaches used to address complacency and reliability issues in the plant.
Topic Description/Information
I. Complacency
1 How does staff respond to
unusual water quality
conditions?
B Does staff have an emergency
response plan? How does staff
train for unusual conditions or
events?
2. Reliability
D Does staff capability to make
process control decisions
exist at more than one level?
187

OPERATIONS DATA
F. Laboratory Capability
1. Describe available analytical testing capability.
Analytical Capability
. Color
l Jar test
l Particle counting
0 PH
Capability J Description/Comments
l Solids (dissolved)
l Taste and odor
l Temperature
l Turbidity
l Aluminum
l Calcium
l Fluoride
l Hardness
l Iron
l Magnesium
l Manganese
l Sodium
l Alkalinity
9 Ammonia Nitrogen
l Nitrite/nitrate
l Phosphate
l Sulfate
l Chlorine residual
l Bacteriological
l Disinfection byproducts
188

OPERATIONS DATA
2. Describe laboratory space/equipment and procedures.
Process
Lab Space and Equipment
Description/Information
9 Does adequate lab space exist? 1
l Do adequate equipment and Ifacilities exist?
Lab Procedures
m Is testing conducted following
standard procedures?
l Where is lab data recorded? I
e Describe quality control
procedures.
Equipment Calibration
m Describe procedure for
calibrating turbidimeters.
l Describe procedures for
calibrating other equipment
(continuous chlorine and pH
monitors).
189

MAINTENANCE DATA
A. Maintenance Program
Describe the plant maintenance program.
Topic
1, Preventive Maintenance
B Describe equipment inventory
method (cards, computer).
Description/Information
D Describe maintenance scheduling
method (daily, weekly, monthly,
annual).
2. Corrective Maintenance
B Describe the work order system
(issuing orders/documentation).
b Describe priority setting
(relationship to process control
and plant performance needs).
B List major equipment out of
service within last 6 months.
3. Predictive Maintenance
l Describe methods used to
predict maintenance needs
(vibration, infrared analysis).
4. Housekeeping
l Does poor housekeeping detract
from plant performance/image?
190

MAINTENANCE DATA
B. Maintenance Resources
Describe the available maintenance resources at the plant.
Topic
1. Equipment Repair and Parts
l Are critical spare parts stored at
Description/Information
the plant?
l Can vendors provide quick
response to spare parts needs? I
l What is the policy on parts
procurement by staff?
2. Maintenance Expertise
l Describe staff expertise
(mechanical, electrical,
instrumentation).
l Does the staff use any contract
maintenance services? How
responsive are they to needs? Il Does staff develop and use I
maintenance procedures?
3. Work Space and Tools
l Does the plant have adequate Iwork space and tools to perform
maintenance tasks?
4. Performance Monitoring
l How is maintenance performance
measured (time to complete
task, work order backlog)?
191

FIELD EVALUATION DATA
A. Historical Water Production Data
1, Use the following table to determine the peak instantaneous operating flow for the plant.
“’ If a plant operates less than 24 hr/day, flow during operation can be determined from theequation below:
QA
-QT x24hrT day
0, = Average flow during operation0, = Total flow in 24-hour periodT = Time of plant operation, hours
‘*’ Peak instantaneous flow through a plant is often different than the average flow due tochanging water demands that the plant must meet. The peak instantaneous flow during aday can sometimes be obtained from plant logs (e.g., raw pump operation, rate changetime and flow).
192

FIELD EVALUATION DATA
B.
1.
Water Usage
Determine the water usage per capita based on water production records and populationWater usage statistics for the Unitid States are shown in the table below.
Qc = Usage per capita per dayQT = Total flow in 24-hour periodP = Population served
Population
0, Avg.
0, Peak
AlabamaI State Use (qpcpd)
ebraska 174
IAlaskaIArizona
ArkansasCalifornia
ColoradoIConnecticutDelawareFlorida
LHawaii
llllinois
I 134 I 306 I! 191 IEew Hampshire ! 85 I
154 New Jersey I 131 I175 ,tjew Mexico ! 184
188 New York II
166 IIVorlh Carolina ! 107North Dakota I
I124 114146 O’- *nlo I
A.-._-1 L I I, . , -L a - - *-T*
180 I
154 I ?hode Island 115 I
! 120
llowa I uaKoIa I IL I3nnessee 148 I
Kentucky I 128 ILouisiana 147 !
!1
Maine srmont 80 IMaryland 119Massachusetts 119 H Washington 217Michigan 136 m west Virginia 96Minnesota I 105Mississippi 127 IMissouriMontana
tyoming>uerto Ricor/it-gin Islands
seirved.
Source: Solley, W.B. Preliminary Estimates of Water Use in the United States, 1995,U.S. Geological Survey (1997).
193

FIELD EVALUATION DATA
2. Determine unaccounted for water based on monthly or annual water production and meter records.Unaccounted for water typically varies from 10 to 12 percent for new systems and 15 to 30 percentfor older systems (Metcalf and Eddy, Inc. 1991).
Q%
= tQT -QM)x,O(j
QT
Q% =QT =Q, =
QT
QM
Q%
% unaccountedTotal plant water production for month or yearTotal metered water for month or year
3. Determine backwash water percent based on volume of water filtered and volume of water used forbackwash. Typically, the amount of water used for backwash ranges for 2 to 6 percent for conven-tional plants. Higher percentages can occur for direct filtration plants.
BW% = (“F -“~V’&~~“ F
BW% = % backwash waterVF = Volume of water filteredVBW = Volume of water used for backwash
V8W
194

FIELD EVALUATION DATA
c . In-Plant Studies
Describe results of in-plant studies conducted during the CPE.
Topic
1. Filter Media Evaluation
l Check media depth and type.
Description/Information/Findings
l Check media condition (presence
of chemicals/debris, mudballs,
worn media).
l Check support gravel level
(variation of less than 2 inches
acceptable).
2. Backwash Evaluation
l Check backwash rate (measure I Irise rate in the filter versus time
and convert to backwash rate; I I
> 15 gpm/ft* acceptable). .
l Check bed expansion I I> 20 percent acceptable).
195

FIELD EVALUATION DATA
C. In-Plant Studies (cont.)
Describe results of in-plant studies conducted during the CPE.
Topic
2. Backwash Evaluation (cont.)
l Observe backwash procedure
(flow distribution, ramping of flow
rate, turbidity of water at end of
backwash).
Description/Information/Findings
3. Coagulant Dosage Evaluation
l Verify reported dose with actual;
measure liquid or dry feed rate
(Ib/min, mL/min) and convert to
dose (mg/L).
4. Turbidity Meter Evaluation
l Check meter calibration or
compare with calibrated meter.
196

FIELD EVALUATION DATA
C. In-Plant Studies (cont.)
Describe results of in-plant studies conducted during the CPE.
Topic Description/Information/Findings
197

INTERVIEW DATA
A. Interview Guidelines
The following interview guidelines are provided to assist CPE providers with the interview process.
1. Conduct interviews with one staff person at a time in a private location.
n It is important to create a comfortable environment for the interview process to take place. Con-fidentiality of the interview should be explained.
2. Keep the interview team size small.
. The number of people included on each interview team should be kept to a minimum (e.g., 1 to 3)to avoid overwhelming the person being interviewed. If more than one person is included on theteam, one person should be assigned as the lead interviewer.
3. Allow 30 to 45 minutes for each interview.
. Interview times will vary depending on the personality of the individual being interviewed and thenumber and type of issues involved. It is the responsibility of the interviewer to maintain thefocus on performance-related issues. Interviews can easily be detracted by individuals who findan “open ear” for presenting grievances.
4. Explain the purpose of the interview and use of the information.
. It is important for the people being interviewed to understand that any information obtained fromthis process is only used to support identification of factors limiting performance (i.e., areasimpacting performance). The interview information is not used to place blame on specific indi-viduals or departments.
5. Conduct interviews after sufficient information has been aathered from CPE activities.
n Utilize results and observations gained from the plant tour, performance assessment, major unitprocess evaluation, and data collection activities to identify areas of emphasis during the inter-views.
6. Proaress throuah the interview In a loaical order.
. For example, if an administrator is being interviewed, focus questions on administrative support,then on design issues, followed by operation and maintenance capabilities,
7. Ask relevant auestions with respect to staff area of involvement.
n For example, when interviewing maintenance personnel, ask questions related to relevant topicssuch as maintenance responsibilities, communication with supervisors, and administrative supportfor equipment.
8. Ask open-ended auestions.
‘* . For example, a question such as “Are you aware of any design deficiencies with the currentplant? II would provide better information than a question like “Do you think that the flocculationbasin provides sufficient detention time for flocculation?“.
198

INTERVIEW DATA
9. Ask the auestions; don’t aive the answers.
m The purpose of the interview is to gain the perspective of the person being interviewed. Ask thequestion and wait for the response (i.e., don’t answer your own question based on informationyou may have received from previous activities). Rephrasing the question may sometimes benecessary to provide clarity.
10. Repeat a resconse to a auestion for clarification or confirmation.
. For example, the interviewer can confirm a response by stating, “If I understand you correctly,you believe that the reason for poor plant performance during April was due to excessive algaegrowth in the source water.”
11. Avoid accusatorv statements.
n Accusatory statements will likely lead to defensiveness by the person being interviewed. Rather,if an area of concern is suspected, ask questions that can confirm or clarify the situation.
12. Use the interview to clarifv or confirm field information.
. For example, if performance problems occurred during one month of the past year, ask questionsto clarify the perceived reasons for these problems.
13. Note scecific resnonses that support factor identification.
. During or following the interview, the interviewer may want to note or underline specificresponses that support the identification of possible factors limiting performance. This summarycan then be used during team debriefing and factor identification meetings.
199

INTERVIEW DATA
B. Personnel Interview Form
Name
Time at plant
Education/training/certification
Title
Years of experience
Interview notes (concerns, recommendations in administration, design, operation, and maintenance):
200

EXIT MEETING
A. Attendance List
Utility Name Date
201

EXIT MEETING
B. Mutiple Barrier Concept for Microbial Contaminant Protection
Addition
Variable J I
nTurbidity
0GOal
QualitySOWOe
FinishedWater
DisinfectionBarrier
l Given a variable quality source water, the treatment objective is to produce a consistent, high qualityfinished water.
l Protozoan parasites, such as Giardia and Cryptosporidium, are found in most source waters; however,it is difficult to quantify their presence and assess their viability.
’ l Microbial pathogens in the source water, such as protozoan parasites, bacteria, and viruses, can bephysically removed as particles in treatment processes and inactivated through disinfection.
l Multiple barriers are provided in a treatment plant to remove or inactivate microbial pathogens.
l Key treatment barriers include flocculation/sedimentation, filtration, and disinfection.
l Since measurement of protozoan parasites is difficult, surrogate parameters, such as turbidity, particlecounting, and pathogen inactivation, are used to assess the performance of each barrier.
202

EXIT MEETING
C. Optimization Performance Criteria
A summary of performance criteria for surface water treatment plants to provide protection againstmicrobial contaminants is presented below:
1. Minimum Data Monitoring Requirements
. Daily raw water turbidity
n Settled water turbidity at 4-hour time increments from each sedimentation basin
n On-line (continuous) turbidity from each filter
n One filter backwash profile each month from each filter
2. Individual Sedimentation Basin Performance Criteria
. Settled water turbidity less than 1 NTU 95 percent of the time when annual average raw waterturbidity is less than or equal to 10 NTU
. Settled water turbidity less than 2 NTU 95 percent of the time when annual average raw waterturbidity is greater than 10 NTU
3. Individual Filter Performance Criteria
= Filtered water turbidity less than 0.1 NTU 95 percent of the time (excluding 15-minute periodfollowing backwashes) based on the maximum values recorded during 4-hour time increments
. Maximum filtered water measurement of 0.3 NTU
. Initiate filter backwash immediately after turbidity breakthrough has been observed and beforeeffluent turbidity exceeds 0.1 NTU.
. Maximum filtered water turbidity following backwash of 0.3 NTU
. Maximum backwash recovery period of 15 minutes (i.e., return to less than 0.1 NTU)
. Maximum filtered water measurement of less than 10 particles (in the 3 to 18 ,um range) per milli-liter (if particle counters are available)
4. Disinfection Performance Criteria
n CT values to achieve required log inactivation of Giardia and virus
203

Appendix GExample WE Report
205

Results of theComprehensive Performance Evaluation
of Water Treatment Plant No. 005
Prepared by:
Prepared for:
206

Site Visit Information
Mailing Address:
Date of Site Visit:
Utility Personnel:
CPE Team:
207

Table of Contents
Paoe No.
INTRODUCTION
FACILITY INFORMATION
PERFORMANCE ASSESSMENT
MAJOR UNIT PROCESS EVALUATION
PERFORMANCE LIMITING FACTORS 218
Alarms (Design) A 218
Process Flexibility (Design) A 218
Policies (Administration) A 218
Insufficient Time on the Job (Operation) A 218
Process Instrumentation/Automation (Design) B 218
Presedimentation (Design) B 219
EVALUATION FOLLOW-UP
210
211
212
216
219
REFERENCES 219
208

List of Figures
FIGURE 1 Comprehensive Performance Evaluation methodology.
FIGURE 2 Water treatment flow schematic.
FIGURE 3 Daily maximum plant influent water turbidity.
FIGURE 4 Daily maximum finished water turbidity.
FIGURE 5 Filter effluent turbidity profile after backwash.
FIGURE 6 Major unit process evaluation.
FIGURE 7 Process evaluation for individual treatment unit.
TABLE 1
TABLE 2
List of Tables
Frequency Analysis of Raw Water Turbidity
Frequency Analysis of Finished Water Turbidity
Paae No.
210
211
213
214
215
216
217
213
215
209

Introduction
The Composite Correction Program (CCPI (1 I is anapproach developed by the U. S. EnvironmentalProtection Agency and Process Applications, Inc.to improve surface water treatment plant perform-ance and to achieve compliance with the SurfaceWater Treatment Rule (SWTRI. Its developmentwas initiated by Process Applications, Inc. and theState of Montana (21, who identified the need fora program to deal with performance problems attheir surface-supplied facilities. The approachconsists of two components, a ComprehensivePerformance Evaluation (CPEI and ComprehensiveTechnical Assistance (CTA).
The methodology followed during a CPE isdescribed in Figure 1. A comprehensive assess-ment of the unit process design, administrationand maintenance support is performed to establishwhether a capable plant exists. Additionally, anassessment is made on the plant staff’s ability toapply process control principles to a capable plantto meet the overall objective of providing safe andreliable finished water. The results of thisassessment approach establish the plant capabilityand a prioritized set of factors limiting perform-ance. Utility staff can address all or some of theidentified factors, and improved performance canoccur as the result of these efforts. A CTA isused to improve performance of an existing plantwhen challenging or difficult-to-address factors areidentified during the CPE. Therefore, the CCP
approach can be utilized to evaluate the ability of awater filtration plant to meet the turbidity anddisinfection requirement of the SWTR and then tofacilitate the achievement of cost effective compli-ance.
In recent years, the CCP has gained prominence asa mechanism that can be used to assist in opti-mizing the performance of existing surface watertreatment plants to levels of performance thatexceed the requirements in the SWTR. The cur-rent standards do not always adequately protectagainst some pathogenic microorganisms, as evi-denced by recent waterborne disease outbreaks.Producing a finished water with a turbidity ofco.1 NTU provides much better protectionagainst pathogens like Cryptosporidium (3,4,5,6,7,8,9,10,11 I, the microorganism responsible fora large outbreak of Ctyptosporidiosis in Milwaukeein April 1993, where 403,000 people became illand at least 79 people died.
USEPA has chosen to use the CCP approach toevaluate selected surface water treatment plants inthis region. Water Treatment Plant No. 005 wasselected as the first candidate for a CPE. Thisplant has experienced difficulties with continuouslymeeting the turbidity requirements of the SWTR,and the water system manager and staffexpressed interest in receiving assistance with cor-recting this situation.
FIGURE 1, Comprehensive Performance Evaluation methodology.
Safe/Reliable Finished Water
Capable Plant
210
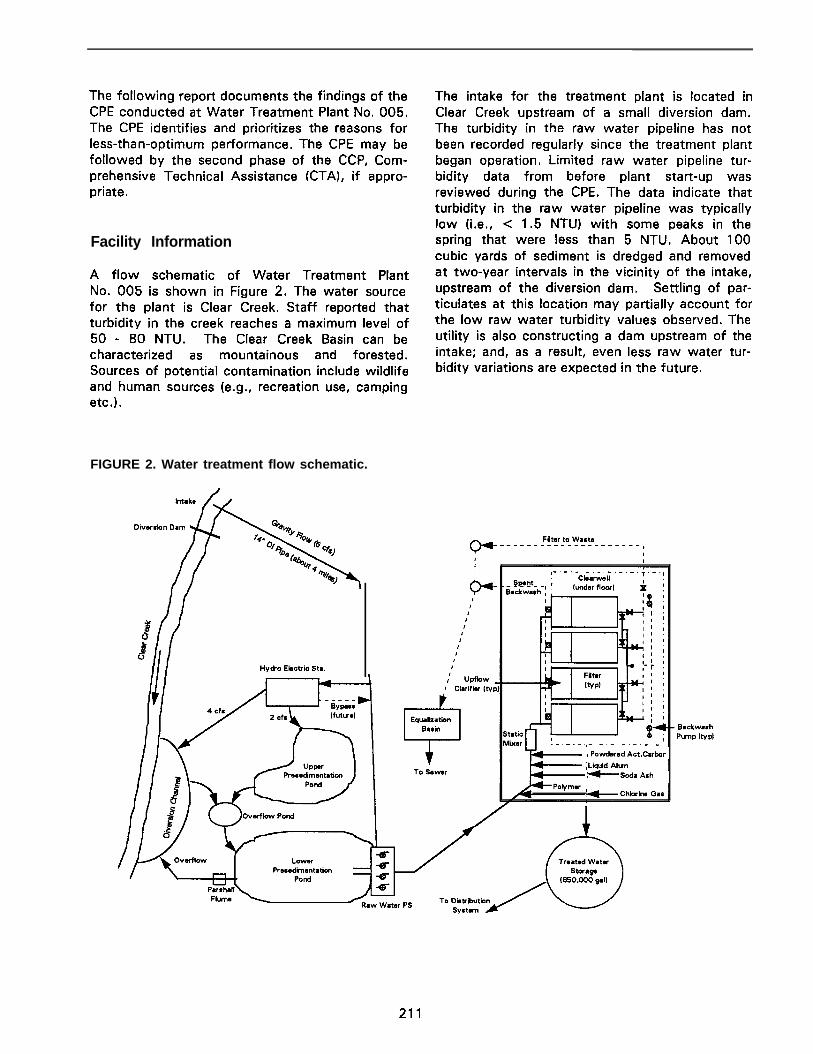
The following report documents the findings of theCPE conducted at Water Treatment Plant No. 005.The CPE identifies and prioritizes the reasons forless-than-optimum performance. The CPE may befollowed by the second phase of the CCP, Com-prehensive Technical Assistance (CTAI, if appro-priate.
Facility Information
A flow schematic of Water Treatment PlantNo. 005 is shown in Figure 2. The water sourcefor the plant is Clear Creek. Staff reported thatturbidity in the creek reaches a maximum level of50 - 80 NTU. The Clear Creek Basin can becharacterized as mountainous and forested.Sources of potential contamination include wildlifeand human sources (e.g., recreation use, campingetc.).
FIGURE 2. Water treatment flow schematic.
Diversion Dam
Hycto Ebcbic Sta.
The intake for the treatment plant is located inClear Creek upstream of a small diversion dam.The turbidity in the raw water pipeline has notbeen recorded regularly since the treatment plantbegan operation. Limited raw water pipeline tur-bidity data from before plant start-up wasreviewed during the CPE. The data indicate thatturbidity in the raw water pipeline was typicallylow (i.e., < 1.5 NTUI with some peaks in thespring that were less than 5 NTU. About 100cubic yards of sediment is dredged and removedat two-year intervals in the vicinity of the intake,upstream of the diversion dam. Settling of par-ticulates at this location may partially account forthe low raw water turbidity values observed. Theutility is also constructing a dam upstream of theintake; and, as a result, even less raw water tur-bidity variations are expected in the future.
To semr
, Powcbrsd A&Carbon
,-Sod. Ash
211

About 6 cfs of water flows by gravity from theintake through about four miles of 14-inchdiameter ductile iron pipe to a utility-ownedhydroelectric power generating station near thewater treatment plant. After the hydroelectricstation, about 4 cfs flows back into Clear Creekand the remaining 2 cfs flows through two largepresedimentation ponds. Detention time throughthese ponds is estimated to be about 14 days. Araw water pump station located beside the lowerpond includes four constant speed raw waterpumps, each with a 700 gpm capacity.
The amount of water that can be run through thepresedimentation ponds and discharged to thecreek is limited by the capacity of the Parshallflume on the overflow of the lower pond. Also,there are no provisions to bypass an individualpond to reduce the detention time. The ponds canbe bypassed by directing the raw water to thepump station intake; however, this results in thebypassing of the hydroelectric station. The utilityis planning to install another pipeline from thehydroelectric station to the raw water pumpingstation before the spring runoff occurs. This willallow the ponds to be bypassed without interferingwith the hydroelectric station operation.
The water treatment plant began operation inAugust 1996. Prior to that, chlorination wasprovided after the settling ponds before enteringthe distribution system. The plant has a reportedfirm design capacity of about 3 MGD. Majortreatment components include chemical feedequipment, four package treatment trains consist-ing of an upflow clarifier and filter basins, a110,000 gallon clearwell, and a 600,000 gallonfinished water storage tank. Each of the upflowclarifier and filter units has a reported capacity of1 MGD. The plant is designed to operate at1 MGD incremental flow rates with one raw waterpump dedicated to each treatment train in opera-tion. Unique characteristics of the plant are sum-marized as follows.
l Large presedimentation ponds prior to treat-ment.
0 Static mixer for coagulant mixing.
l Chemical feed capability: alum, polymer, sodaash, powdered activated carbon, chlorine.
l Upflow clarifiers with gravel media (1 to 5 mmsize).
l Mixed media filters.
l Filter-to-waste capability set by a commoncontrol valve to 1 MGD. (NOTE: This flowrate is not easily adjusted and limits the flexi-bility to change the individual treatment trainflow rate to a value other than 1 MGD.)
l Two continuously monitoring particle counterson filter effluent (one shared by two trains).
l Clearwell with intra-basin baffles
Performance Assessment
During the CPE, the capability of the Water Treat-ment Plant No. 005 was evaluated to assesswhether the facility, under existing conditions,could comply with the turbidity and disinfectionrequirements that are used to define optimizedperformance. Optimized performance, for pur-poses of this CPE, represents performance criteriathat exceeds the SWTR requirements. Optimizedperformance would require that the facility take asource water of variable quality and consistentlvproduce a high quality finished water. Multipletreatment processes (e.g., flocculation, sedimenta-tion, filtration, disinfection) are provided in seriesto remove particles, including microbial pathogens,and provide disinfection to inactivate any remain-ing pathogens.
Water Treatment Plant No. 005 utilizes a packagewater treatment process that includes combinedflocculation/sedimentation in an upflow clarifierand filtration. Each of the available processes rep-resents a barrier to prevent the passage of micro-bial pathogens through the plant. By providingmultiple barriers, any microorganisms passing oneprocess can be removed in the next, minimizingthe likelihood of microorganisms passing throughthe entire treatment system and surviving in watersupplied to the public. The role of the watertreatment operator is to optimize the treatmentprocesses (i.e., barriers) under all conditionsbecause even temporary loss of a barrier couldresult in the passage of microorganisms into thedistribution system and represents a potentialhealth risk to the community.
A major component of the CPE process is anassessment of past and present performance ofthe plant. This performance assessment isintended to identify if specific unit treatment
212

processes are providing multiple barrier protectionthrough optimum performance. The performanceassessment is based on data from plant recordsand data collected during special studies per-formed during the CPE.
Specific turbidity performance targets were usedduring this assessment. These specific perform-ance targets include:
l Sedimentation - turbidity of less than 1 NTU95 percent of the time, since average annualraw water turbidity is less than 10 NTU.
l Filtration - individual filter turbidity less than0.1 NTU 95 percent of the time (excluding 15-minute period following backwash); also,maximum filtered water turbidity followingbackwash of 0.3 NTU.
l Disinfection - CT values to achieve required logGiardia cyst and virus inactivation.
A plant influent turbidimeter and strip chartrecorder are provided, but the plant operators donot routinely record daily influent water turbidity intheir operating log. The plant influent turbiditystrip charts for the past year were reviewed duringthe evaluation. A frequency analysis of these datais summarized in Table 1. As indicated, the raw
water turbidity is less than or equal to 4 NTU 95percent of the time. Maximum daily plant influentturbidity varied from less than 1 NTU to 10 NTU,as shown in Figure 3.
TABLE 1. Frequency Analysis of Raw WaterTurbidity
J
FIGURE 3. Daily maximum plant influent water turbidity.
9095
Average
*Daily maximum value
3.64.02.6
The turbidimeter is located a long distance fromthe influent pipe. A significant number of brief (afew minutes to less than 1 hour) turbidity spikeswere noted on the strip chart. A special studywould be required to determine the cause of thesebrief influent turbidity spikes. lnfluent turbidityduring the CPE was less than 1 NTU.
9.00
7.00
g mo
$ 5.00
e12 4.00
3.00
2.00
1.00
213

The finished water turbidimeter is located at theoutlet of the 600,000 gallon finished water stor-age tank. This meter has a strip chart recorder,and operators routinely record this data for waterquality reporting purposes.
The plant operators do not routinely sample andmeasure turbidity after the upflow clarifiers. Dur-ing the CPE, turbidities of 0.56 to 0.71 NTU weremeasured between the upflow clarifier and the fil-ter over a two-hour period. During the sameperiod the plant influent turbidity ranged from 0.5to 0.7 except for a 15-minute spike from 3 to10 NTU after a brief filter shutdown. Because ofthe low influent water turbidity conditions duringthe CPE and the lack of historical turbidity data atthe clarifier outlet, the ability of the plant to meetthe 1 NTU turbidity goal on a long-term basiscould not be determined.
The plant does not have on-line turbidimeters formonitoring turbidity following individual filters, andplant operators do not routinely collect grab sam-ples to measure turbidity at this location. Two on-line particle counters are available for monitoringfilter performance; however, staff have experi-enced operating problems with at least one of theunits. To assess historical plant performance, tur-bidity values from after the treated water storage
FIGURE 4. Daily maximum finished water turbidity.
2.00
1.80
1.60
1.40
5 1.20
$ 1.00
z5 0.80+
0.60
tank were used. The daily maximum finishedwater turbidity for the previous 12 months isshown in Figure 4. The results of a frequencyanalysis of the finished water data are shown inTable 2 and indicate that 95 percent of the timethe filtered water turbidity was less than0.87 NTU.
During several months, plant performance did notmeet the turbidity requirement of the SWTR (i.e.,<0.50 NTU 95 percent of the time on monthlybasis). From April through June, filtered waterturbidity consistently exceeded the regulated limitof 0.50 NTU. Plant staff reported that this periodof poor performance was due to a bad batch ofalum and poor water quality from the ponds. Alarge amount of algae or other filamentous materialfrom the ponds caused clogging problems on themedia support screens of the upflow clarifiers forseveral weeks. This material was cleaned manu-ally with great difficulty, and during the worstperiod cleaning was required on a daily frequency.Hand-cleaned screens have been installed on theraw water pump intakes in the lower pond toassist with removing this material before it reachesthe treatment units. It is also possible that postflocculation may have occurred in the clearwelland finished water storage tank during this period.
214

TABLE 2. Frequency Analysis of Finished WaterTurbidity
Percentile Finished WaterNTU*
50 0.1675 0.3290 0.5595
Average0.87
I 0.33
‘Daily maximum value
Although significant improvement in performancehas recently occurred, the plant d i d not achievethe optimized filtered water turbidity target of lessthan 0.1 NTU during the past year. This perform-ance allows an increased opportunity for patho-gens, such as Cryptosporidium oocysts, to passinto the public water supply.
During the CPE a special study was conducted onthe filter media, backwash procedure, and per-formance of a filter following a backwash. Prior tobackwashing, filter unit #2 was drained to allowphysical observation of the filter media. The totaldepth of the mixed media was consistently about
FIGURE 5. Filter effluent turbidity profile after backwash.
31.5 inches. Of this mixed media depth, about 18inches was anthracite. Inspection of the media atand below the surface showed that the media wasvery clean. During the backwash, a filter bedexpansion of 21.8 percent was calculated, whichis within the acceptable range of 20 to 25%.
Immediately after completion of the filter back-wash, the filtered water turbidity was measuredperiodically for about 35 minutes. These data areshown in Figure 5. The current procedure is tofilter to waste for ten minutes after the end of thebackwash cycle. As indicated by the performancegraph, the filter did not meet the backwash optimi-zation criteria of a maximum turbidity spike of0.3 NTU and return to less than 0.1 NTU within15 minutes.
In summary, performance data for the last yearshow that Water Treatment Plant No. 005 has notbeen in compliance with the SWTR on a consistentbasis. In addition, the plant has not met the opti-mized performance goal of 0.1 NTU for filteredwater. Consequently, this performance assess-ment indicates that the water system is at risk ofpassing microbial pathogens to consumers.
0.05
0.00
Optimized Target
Filter to Waste -+ to Cleawell
I I I I I I0 5 10 15 20
Minutes After Backwash25 30 35
215

Major Unit Process Evaluation
Major unit processes were assessed with respectto their capability to provide consistent perform-ance and an effective barrier to passage of micro-organisms on a continuous basis. The perform-ance goal used in this assessment for the filtrationprocess was a settled water turbidity of less than2 NTU and a filtered water turbidity of less than0.1 NTU. Capabilities of the disinfection systemwere based on the USEPA guidance manual (12)requirements for inactivation of G i a r d i a andviruses.
Since the plant’s treatment processes must pro-vide an effective barrier at all times, a peak instan-taneous operating flow is typically determined.The peak instantaneous operating flow representsthe maximum flow rate that the unit processes aresubjected to, which represents the hydraulic con-ditions where the treatment processes are themost vulnerable to the passage of microorganisms.If the treatment processes are adequate at thepeak instantaneous flow, then the major unit proc-esses are projected to be capable of providing thenecessary effective barriers at lower flow rates.
FIGURE 6. Major unit process evaluation.
Water Treatment Plant No. 005 has a maximumraw water pumping capacity of 4 MGD. The plantwas designed for a maximum treatment capacityof 3 MGD with one treatment unit out of service.A peak instantaneous flow rate of 3 MGD is usedfor the major unit process evaluation, based on thehighest instantaneous flow rate reported by thestaff.
Major unit process capability was assessed byprojecting treatment capacity of each major unitprocess against the peak instantaneous flow rate.The major unit process evaluation for the entiretreatment plant is shown in ‘Figure 6. The unitprocesses evaluated are shown on the left side ofthe graphs, and the flow rates against which theprocesses were assessed are shown across thetop. Horizontal bars on the graph represent theprojected peak capability of each unit process toachieve the desired optimized process perform-ance. These capabilities were projected based onthe combination of treatment processes at theplant, the CPE team’s experience with other simi-lar processes, industry guidelines, and regulatorystandards. The shortest bar represents the unitprocess which limits plant capability the most rela-tive to achieving the desired plant performance.
Water Flow Rate (MGD)
0.0 0.5 1.0 1.5 2.0 2.5 3.0 3.5 4.0
I”“““““““‘~“““““‘~““““’
FlocYSedimentation (1)
Peakhstantanmus +Flow
Filtration (2)
1Disinfection (3) 1, 1
(1) Surface area = 280 Rz; rated at 8.0 gpm/fP, upflow clarifier with rock gravel media(2) Surface area = 580 ttl; rated at 4 gpm/fF; mixed media(3) Volume = 98,000 gal; total 3-log Giardia inactivation/removal required; assume 2.5log
removal allowed through conventional plant credit and OS-log required by disinfection;pH = 7.5; temp = OSoC; chlorine residual = 1.8 mg/L; T&T = 0.7; 3 tt minimumcleatwell depth
216

The major unit processes evaluated were theupflow clarifiers (flocculation and sedimentation),filtration, and disinfection processes. Criteria usedto assess each major unit process are described inthe notes below the graph.
The upflow clarifiers were rated based on theirsurface overflow rate. Typically, conventionalsedimentation basin capability is rated based on asurface overflow rate of 0.5 to 0.7 gpmlft’. Asurface overflow rate of 10 gpm/ft2 is used by thepackage plant manufacturer for the design ratingof their upflow clarifier units. Because of thecombined flocculation and sedimentation functionand the short detention time of these units, theywere rated based on an oveiflow rate ofa gpm/ft2. This produced a combined floccula-tion/sedimentation capability rating of 3.23 MGDwhen using all four treatment units.
The filtration process was rated based on a load-ing rate of 4 gpm/ft2 and use of all four filters.These criteria resulted in a combined filtrationcapability of 3.23 MGD.
The disinfection process was assessed based onUSEPA Surface Water Treatment Rule require-ments for inactivation of 3-log of Giardia cysts and4 log of viruses. The Giardia removal/inactivationis the most stringent criteria; consequently, it wasused as the basis of the disinfection evaluation. A
well-operated conventional filtration plant isallowed a 2.5-log removal credit for Giardia cysts,and the remaining 0.5-log removal is achieved bymeeting specified CT requirements associated withchemical disinfection. CT is the disinfectant con-centration (Cl in mg/L multiplied by the time (T) inminutes that the water is in contact with the disin-fectant. The required CT value was obtained fromthe USEPA guidance manual (31, using typicalplant values for free chlorine residual (i.e.,1 .O mg/L) and pH (i.e., 7.5) and a worst casewater temperature of 0.5OC. The volume of theclearwell was adjusted for the minimum operatingdepth of 3 feet. A T,,/T ratio of 0.70 was usedbecause of the superior baffling conditions in theclearwell. Under this scenario, the disinfectionprocess is capable of treating 3.44 MGD, using arequired free chlorine CT value of 46 mg/L-min.
The results of the major unit process evaluationindicate that the plant should be capable of treat-ing the peak instantaneous flow rate of about3.2 MGD with four treatment trains in service (i.e.,0.8 MGD per train). However, the control of theplant is set up so that each treatment trainoperates at a constant flow rate of 1 MGD (seeFigure 71, and flexibility does not exist to easilyoperate each train at lower flow rates withoutmodifying the filter to waste piping from thefilters.
FIGURE 7. Process evaluation for individual treatment unit.
0.0
Water Flow Rate (MGD)
0.5 1.0 1.5
FlocISedimentation (1)
Filtration (2)
(1) Surface area = 70 tt2; rated at 8.0 gpm/ft$ upflow clarifier with gravel media(2) Surface area = 140 ft2; rated at 4 gpm/ft2; mixed media
217

The major unit process evaluation indicates thatthe current practice of operating individual treat-ment units at a constant flow rate of 1 MGD, asrequired by the design and control system, may becontributing to the less-than-optimum performanceof the flocculation/sedimentation and filtrationprocesses.
Performance Limiting Factors
The areas of design, operation, maintenance, andadministration were evaluated in order to identifyfactors which limit performance. These evalua-tions were based on information obtained from theplant tour, interviews, performance and designassessments, special studies, and the judgment ofthe evaluation team. Each of the factors wasclassified as A, B, or C according to the followingguidelines:
A - Major effect on a long term, repetitive basis
B - Minimal effect on a routine basis or majoreffect on a periodic basis
c- Minor effect
The A and B factors were prioritized as to theirrelative impact on performance and are summa-rized below. In developing this list of factors lim-iting performance, 50 potential factors werereviewed; and their impact on the performance ofWater Treatment Plant No. 005 was assessed.The evaluation team identified six factors that arelimiting plant performance. Numerous other fac-tors were not felt to be affecting plant perform-ance. The factors and the findings that supporttheir selection are summarized below in prioritizedorder.
Alarms (Design) A
l The plant does not have alarm and shutdowncapability on chlorine feed, chlorine residual,influent turbidity and finished water turbidity.
Process Flexibility (Design) A
. Inability to automatically change the filter towaste flow rate to values other than 1 MGD.(NOTE: This lack of flexibility limits the flowrate of the individual treatment trains, sincethe plant flow rate must be 1 MGD to match
218
the filter to waste flow rate of 1 MGD; other-wise, the water level in a filter changes.)
l No ability to feed filter aid polymer to the fil-ters, (NOTE: This flexibility can be used toenhance filter performance, especially duringtimes when clarifier performance is less thanoptimum.)
l Inability to .gradually increase and decreasebackwash flow rate. (NOTE: This flexibilityprovides better cleaning of the filter media,less opportunity for loss of media, and betterre-stratification of the media following back-wash.)
Policies (Adminis tra tionl A
l Lack of established performance goals for theplant, such as 0.1 NTU filtered water turbidity,that would provide maximum public healthprotection and associated support to achievethese performance goals.
Insufficient Time on the Job lOperation A
No sampling and evaluation of upflow clarifierperformance.
Inadequate testing to optimize coagulant typeand dosages. (NOTE: Some jar testing wascompleted by staff; however, standard testingprocedures were not followed to determineoptimum dosages.1
No monitoring of individual filter turbidity.
Excessive caution on use of the creek sourceto achieve optimized performance.
Starting “dirty” filters without backwashing orusing filter to waste.
Non-optimized feed point for flocculant aidaddition. (NOTE: Flocculant aid products aretypically fed at a location with gentle mixing toavoid breaking the long-chain organic mole-cules.)
Process lnstrumen ta tion/Automa tion (Design) B
l No turbidimeters are located on individual fil-ters and creek source (i.e., at turbine).

. Plant is designed to automatically start andstop operation based on storage tank level andupflow clarifier backwash requirements.(NOTE: Without initiating a filter backwash orthe filter to waste mode after each shutdown,the potential exists to pass trapped particles(i.e., potential pathogens) through the plantdue to hydraulic surging.)
l Location of influent turbidity sample line rela-tive to the monitor cell may cause inaccuratereadings.
Presedimen ta tion (Design) 6
Long detention time and subsequent low turn-over contributes to excessive algae growthand poor water quality.
Lack of flexibility to operate one, or portion ofone, presedimentation pond to reduce deten-tion time and increase turnover.
Lack of flexibility to bypass ponds withoutbypassing the turbine. (NOTE: A new bypassis under construction which will provide thisflexibility.)
Limited ability to maintain high turnoverthrough ponds when not in use because ofrestriction in Parshall flume from pond 2 tocreek.
Evaluation Follow-Up
The potential exists to achieve optimized perform-ance goals and, therefore, enhance public healthprotection with Water Treatment Plant No. 005.Implementation of a Comprehensive TechnicalAssistance (CTA) project by a qualified facilitatorhas been demonstrated to be an effectiveapproach to achieve optimum performance goals(13). Through a CIA project, the performancelimiting factors identified during the Comprehen-sive Performance Evaluation would be addressedin a systematic manner. A partial list of potentialCTA activities that could be implemented by afacilitator and plant staff is presented below:
. Facilitate development of optimization per-formance goals by the city administration toprovide adequate direction and support tooperation and maintenance staff.
l Establish a process control program based onprioritized data collection, database develop-ment, data and trend interpretation, and proc-ess adjustments.
l Provide technical guidance on use of the creeksource versus the presedimentation pondsduring seasonal water quality changes.
. Facilitate special studies with plant staff toassist them with optimizing plant performanceand establishing the need for minor plant modi-fications.
l Provide training to assist operators with opti-mizing coagulant type and dosages.
References
1.
2.
3.
4.
5.
6.
Renner, R.C., B.A. Hegg, J.H. Bender, andE.M. Bissonette. February 1991. Handbook -Optimizinq Water Treatment Plant Perform-ance Usina the Composite Correction Pro-m. EPA 625/6-91/027. Cincinnati, OH:USEPA.
Renner, R.C., B.A. Hegg, and D.F. Fraser.February 1989. “Demonstration of the Com-prehensive Performance Evaluation Techniqueto Assess Montana Surface Water TreatmentPlants. m Association of State Drinking WaterAdministrators Conference. Tucson, AZ.
AWWA Statement of Policy. 1968. “QualityGoals for Potable Water.” Jour.A WWA,60(12):1317. Denver, CO.
AWWA White Paper. 1995. “What WaterUtilities Can Do to Minimize Public Exposureto Cryptosporidium in Drinking Water.”AWWA Mainstream. Denver, CO.
Logsdon, G.S. and E.C. Lippy. December1982. “The Role of Filtration in PreventingWaterborne Disease. n Jour.A WWA:654.Denver, CO.
USEPA Water Engineering Research Labora-tory. 1985. Project Summarv - Filtration ofGiardia Cvsts and Other Substances:Volume 3 - Rapid Rate Filtration. EPA/GOO/S2-85/027. Cincinnati, OH: USEPA.
219

7.
8.
9.
Logsdon, G.S., L. Mason, and J.B. Stanley,Jr. 1988. “Troubleshooting an ExistingTreatment Plant.” In Proc. of A WWA Semi-nar - Filtration: Meeting New Standards:109-l 25. Denver, CO. 11
Consonery, P.J., et. al. November 1996.“Evaluating and Optimizing Surface WaterTreatment Plants: How Good is Good 12Enough.” Paper presented at AWWA WaterQuality Technology Conference. Boston, MA.
Nieminski, E.C., et. al. 1995. “RemovingGiardia and Cryptosporidium by ConventionalTreatment and Direct Filtration.” J o u r n a l 1 3AWWA, 87(9):96. Denver, CO.
10. West, T., P. Daniel, P. Meyerhofer, A.DeGraca, S. Leonard, and C. Gerba. 1994.“Evaluation of Cryptosporidium Removal
Through High Rate Filtration.” In Proceedinasof 1994 AWWA Annual Conference - NewYork, NY. AWWA. Denver, CO.
Patania, N.L., et. al. 1996. “Optimization ofFiltration for Cyst Removal.” Denver, CO:AWWARF.
Guidance Manual for Compliance With theFiltration and Disinfection Reauirements forPublic Water Svstems Usina Surface WaterSources. 1989. USEPA Office. of DrinkingWater. Washington, D.C.
Schwarz, C., J.H. Bender, and, B.A. Hegg.December 1997. “Final Report - Comprehen-sive Technical Assistance Project - City ofGreenville Water Treatment Plant. II TexasNatural Resource Conservation Commission.
220

Appendix HExample CPE Scheduling 1 e tter
221

April 6, 1998
Chairman/Mayor/Public Works DirectorWater Authority/City/Town
RE: Evaluation of theMay 18-21, 1998
Water Authority/City/Town Water Treatment Plant
Dear Mr./MS.
You were recently contacted by of the (regulatory agency) regarding anevaluation of your water treatment facility. This letter is intended to provide you with some informationon the evaluation and describe the activities in which the Water Authority/City/Town will beinvolved. The evaluation procedure that will be used at your facility is part of an overall water treatmentoptimization approach called the Composite Correction Program.
The Composite Correction Program (CCP) was developed by the U. S. Environmental Protection Agencyand Process Applications, Inc. to optimize surface water treatment plant performance for protectionagainst microbial contaminants such as Giardia and Cryptosporidium. ‘The approach consists of two com-ponents, a Comprehensive Performance Evaluation (CPE) and Comprehensive Technical Assistance (CTAI.The first component, the Comprehensive Performance Evaluation, will be conducted at your facility theweek of . During the CPE, all aspects of your water treatment administration, design,operation, and maintenance will be reviewed and evaluated with respect to their impact on achievingoptimized performance.
The evaluation will begin with a brief entrance meeting on Monday, May 18, 1998 at approximately2:00 P.M. The purpose of the entrance meeting is to discuss with the plant staff and administrators thepurpose of the evaluation and the types of activities occurring during the next three days. Any questionsand concerns regarding the evaluation can also be raised at this time. It is important that the plantadministrators and those persons responsible for plant budgeting and planning be present because thisevaluation will include an assessment of these aspects of the plant. Following the entrance meeting,which should last approximately 30 minutes, the plant staff will be requested to take the evaluation teamon an extensive plant tour. After the plant tour, the team will begin collecting performance and designdata. Please make arrangements so that the monitoring records for the previous 12 months, operatingrecords, and any design information for the plant are available for the team. Also, a continuous recordingon-line turbidimeter will be installed on one or more of your filters. Sample taps to accomodate this con-nection should be available.
On Tuesday, the evaluation team will be involved in several different activities. The major involvement ofthe plant staff will be responding to the evaluation team’s questions on plant performance and operationand maintenance practices. Several special studies may also be completed by the team to investigate theperformance capabilities of the plant’s different unit treatment processes. Requests to inspect filter mediaand monitor filter backwashes will be coordinated with staff to minimize the impact on plant operation.
Also on Tuesday, a member of the evaluation team will meet with the administrators to review theadministrative policies and procedures and financial records associated with the plant. We would like toreview your water treatment budget for the previous and current fiscal years. We would expect that mostof this information would be available in your existing accounting system.
222

April 6, 1998Page 2
We request that the plant staff and administrators be available for interviews either Tuesday afternoon orWednesday morning. We will be flexible in scheduling these interviews around other required duties ofyou and your staff. Each of the interviews will require about 30 to 45 minutes of time.
We are anticipating that an exit meeting will be held on Thursday morning at 8:30 A.M., and it will lastabout 1 hour. During the exit meeting, the results of the evaluation will be discussed with all of thosewho participated. The performance capabilities of the treatment processes will be presented, and any fac-tors found to limit the performance of the plant will be discussed. The evaluation team will also answerany questions regarding the results of the evaluation. The results presented in the exit meeting will formthe basis of the final report, which will be completed in about one month.
We look forward to conducting the CPE at your facility. If you have any questions prior to the evaluation,please don’t hesitate to contact us.
Very truly yours,
Evaluation Team Contact
223

Appendix IExample Special Study
225

Example Special Study(as developed by CTA facilitator and plant staff prior to implementation)
I. HypothesisA. Increasing the ferric chloride dosage for low turbidity water (< 5.0 NTU) will improve the
finished water turbidity and increase plant stability.
B. Increasing the ferric dosage may decrease alkalinity below level to maintain finished waterpH target.
II. ApproachA. Conduct series of jar tests using established jar testing guidelines that vary ferric chloride
dosages (start with 0.5 mg/L increments and bracket down to 0.1 mg/L).
B. Add filter aid at the end of the flocculation time to simulate plant dosage (up to 0.1 mg/L).
C. Measure pH, alkalinity, temperature and turbidity of raw and finished water.
D. Document and interpret test results.
E. Test optimum dosage at full plant scale (pilot mode where filtered water is directed towaste).
F. Measure same parameters as above.
G. If results indicate alkalinity limitation is necessary (finished water alkalinity C 20 mg/L),conduct jar tests with soda ash addition.
III. Duration of StudyA. Two weeks to complete jar and full-scale testing.
IV. Expected ResultsA. Improved finished water turbidity and increased plant stability at higher ferric chloride dos-
ages.
B. Deficiency in finished water alkalinity.
C. Loss of finished water pH.
D. Potential change in primary coagulant.
E. Potential need for alkalinity (soda ash) addition.
V. ConclusionsA. To be compiled in summary report after completion of study.
VI. ImplementationA. To be determined after completion of study.
226

Appendix JExampJe Operational Guideline
227

Example Operational Guideline
Subject: Process Control Data CollectionObjective: To establish a data collection method
Number: 5Date Adopted: 4129197Date Revised:
I. Measure a n d record the following water quality, chemical usage, and flow data at thefrequency noted.
A. Raw water parameters (measure/record once per day):1. Plant flow rate - MGD (8:OO a.m. to 8:00 a.m.12. Raw turbidity - 7 days per week3. pH - units - 7 days per week4. Alkalinity - mg/L - 5 days per week5. Temperature - “C - 7 days per week
B. Chemical usage data (record once per day):1. Coagulant use - gal/day2. Coagulant batch density - lb/gal3. Filter aid use - gal/day4. Filter aid batch density - lb/gal5. Chlorine use - lb/day6. Orthophosphate use - lb/day
C. Finished water parameters (measure/record once per day, unless noted otherwise):1. Alkalinity - mg/L - 5 days per week2. pH - 7 days per week3. Free chlorine residual - mg/L - 7 days per week (minimum value for day from chart)4. Turbidity - NTU - value at established 4-hour increments
II. Individual sedimentation basin turbidity.
A. Collect samples once each 4-hour period from the effluent of each basin and use labturbidimeter to measure turbidity.
III. Individual filter monitoring data collection methods.
A. Circular recording charts will be used for turbidity monitoring.1. Individual turbidity charts are located on top of the individual turbidity monitors.2. Twenty-four hour charts will be used.3. When changing charts, record the “change chart time” for the 24-hour period.
B. Data to record from individual filter charts.1. Start of all backwashes (note time and record on chart).2. Return to service after all backwashes (note time and record on chart).3. Backwash turbidity spike (highest turbidity value after filter is back on-line).4. Recovery turbidity (turbidity 15 minutes after filter placed back in service).5. Highest turbidity recorded every 4 hours for each individual filter, excluding
backwash spike and recovery turbidities.
228

Process Control Data Collection (Continued)
IV. Utilize the process control data entry form below for data recording.
A. Complete the data entry form once per day, 7 days per week.
B. Enter daily data into computer database program and print out daily report.
C. At the end of each month, print monthly process control report from the database programand distribute as follows:1. Public Works Director2. Monthly process control file in filing cabinet3. Post copy on plant bulletin board
229

Appendix KExample Process Control Daily Report
231

agulant dose‘er aid doseier chemical doseemical cost
mg/Lmg/LmglL
$Im gal
5.240.0600.00
47.91
Required CTMeasured CTCT ratio
mg/L-min 57.2mg/L-min 103.7
1.8
---)-Filter3 --~-~Fiiter4
Time
mEWspike El 15 min after BW
Filter No.
232

Appendix LExample Jar lest Guideline
233

JAR TEST PROCEDURE (page 1)‘EST CONDITIONS
Facility 1 Date T i m e 1 T u r b i d i t y Temperature/ pH Alkalinity 1
I I IWater Source Coagulant Coagulant Aid
‘REPARING STOCK SOLUTIONS‘tep 1 Select desired stock solution concentration (see Table 1).
Choose a stock solution concentration that will be practical for transferring chemicals to jars.
#tep 2 Determine chemical amount to add to 1 liter flask.If using dry products, see Table 2. If using liquid products, go to step 3.
Itep 3
Desired Amount Coagulant I Coag. Aid (in 1 liter flask (mL) I
Determine liquid chemical amount to add to volumetric tlask.For liqutd chemicals, use the equation below -
mL coagulant = (stock solution %) x (flask volume, mL) x (8.34 lb/gal)100 x (chemical strength, lb/gal)
~1
’ Note: Chemical Strength = chemical density x % strength
234

(plant flow rate, gal/d)
Floe time (min) = (flocculator volume, gal) x (1,440 minlday)(plant flow rate, gal/d)
imated from plant
Sample time (min) = (10 cm) x (surface area, ft2) x (1,440 minIday) X (7.48 gal/R?(plant flow rate, gal/d) x (30.48 cm/R)
235

‘EST RESULTSJAR TEST PROCEDURE (page 3)
Record test results in the table below.
:omments:
lmpdb Speed mm)
Figure 1. Laboratory G Curve for Flat Paddle in 2 Liter Gator Jar
236

Appendix MChemical Feed Guidelines
237

Chemical Feed Guidelines
The following guidelines provide information onthe use of water treatment chemicals for coagula-tion and particle removal. Typical chemicals usedfor these applications include coagulants, floccu-lants, and filter aids. To use these chemicalsproperly, it is necessary to understand how thespecific chemicals function and the type of calcu-lations that are required to assure accurate feed-ing. Although these guidelines focus on coagula-tion and particle removal, the discussion ondetermining feed rates and preparing feed solu-tions applies to other water treatment chemicalapplications such as corrosion and taste and odorcontrol.
Chemicals for Coagulation and ParticleRemoval
Coagulation Chemicals
Alum
1.
2.
3.
4.
5.
Alum (aluminum sulfate) is one of the mostwidely used coagulants in water treatment.When alum is added to water, insoluble pre-cipitates such as aluminum hydroxide (AI(Oare formed.
The optimum pH range for alum is generallyabout 5 to 8.
Alkalinity is required for the alum reaction toproceed. If insufficient alkalinity is present inthe raw water, the pH will be lowered to thepoint where soluble aluminum ion is formedinstead of aluminum hydroxide. Soluble alu-minum can cause post flocculation to occur inthe plant clearwell and distribution system.
As a rule of thumb, about 1 .O mg/L of com-mercial alum will consume about 0.5 mg/L ofalkalinity. At least 5 to 10 mg/L of alkalinityshould remain after the reaction to maintainoptimum pH.
1 .O mg/L of alkalinity expressed as CaCO, isequivalent to:
. 0.66 mg/L 85% quicklime KaO)
6.
7.
8.
n 0.78 mg/L 95% hydrated lime (Ca(OH),)
m 0.80 mg/L caustic soda (NaOHI
. 1.08 mg/L soda ash (Na,CO,)
. 1.52 mg/L sodium bicarbonate (NaHCO,)
If supplemental alkalinity is used it should beadded before coagulant addition, and thechemical should be completely dissolved bythe time the coagulant is added.
When mixing alum with water to make a feedsolution, maintain the pH below 3.5 to preventhydrolysis from occurring which will reducethe effectiveness of the chemical. A 10 to 20percent alum solution by weight will maintainthis pH requirement in most applications.
Density and solution strength values for com-mercial alum can be found in Table M-l. Asolution strength of 5.4 lb/gal can be used forapproximate chemical calculations.
Ferric Chloride
1.
2.
3.
4.
5.
The optimum pH range for ferric chloride is 4to 12.
When mixing ferric chloride with water tomake a feed solution, maintain the pH below2.2.
Ferric chloride consumes alkalinity at a rate ofabout 0.75 mg/L alkalinity for every 1 mg/L offerric chloride.
Ferric chloride dosage is typically about half ofthe dosage required for alum.
Density and solution strength values for com-mercial ferric chloride vary with the supplier.A solution strength of 3.4 lb FeClJgallon canbe used for approximate chemical calculations(i.e., product density of 11.3 lb/gal and 30percent FeCI, by weight).
238

Table M-l. Densities and Weight Equivalents of Commercial Alum Solutions’
I SpecificI
Density % AlzO, Equivalent % Strength StrengthGravity lb/gal Dry Alum’ lb alum/gallon g alum/liter I
I 1.0662 8.89 1.85 10.88 ! 0.97 1 116.003 11.0741 8.96 2.07 12.18 1.09 130.8251.0821 9.02 2.28 13.41 1.21 145.1101 nan3 I a na I 2.50 14.71 1.34 160.3681.0985 9.16 2.72 16.00 1.47 175.7601.1069 9.23 2.93 17.24 1.59 190.830
I 1.1154 I 9.30 I 3.15 1 18.53 1 1.72 1 206.684 1I 1.1240 9.37 3.38 19.88 1.86
1.1328 9.45 3.60 21.18 2.001.1417 9.52 3.82 22.47 2.141.1508 9.60 4.04 23.76 2.281.1600 9.67 4.27 25.12 2.431.1694 9.57 4.50 26.47 2.58 309.5401.1789 9.83 4.73 27.82 2.74 327.970
1 1.1885 1 9.91 I 4.96 1 29.18 1 2.89 1 346.804 11.1983 9.99 5.19 30.53 3.05 1 365.841 11.2083 I 10.08 5.43 31.94 3.22 1 I385.9311.2185 10.16 5.67 33.35 3.39 406.3701.2288 10.25 5.91 34.76 3.56 427.1311.2393 10.34 6.16 36.24 3.74 449.1221.2600 10.43 6.42 37.76 3.93 472.000
l-. . - - - - I I I
1.2609 I 10.52 6.67 39.24 I 4.12 I 494.777 II
1.2719 10.61 6.91 40.65 4.31 517.0271.2832 10.70 7.16 42.12 4.51 540.4841.2946 10.80 I 7.40 43.53 4.71 1 563.539 11.3063 I 10.89 7.66 45.06 4.91
*’588.619
46.59 5.12 614.149
814648.18 5.34 640.938
10 49.76 5.57 668.07810 8.74 51.41 5.81 696.657
t 1.3679 ..---. I
..-- I
11.41 9.01 53.00 6.05 1 724.987
‘From Allied Chemical Company “Alum Handbook”, modified by adding gm/L dry alum column.
‘17% Al203 in Dry Alum + 0.03% Free Al2O3.
239

Polyaluminum Chloride (1 I Flocculation Chemicals
1.
2.
3.
Polyaluminum chloride (PACI) products are lesssensitive to pH and can generally be used overthe entire pH range generally found in drinkingwater treatment (i.e., 4.5 to 9.5).
Alum and PACI products are not compatible; achange from feeding alum to PACI requires acomplete cleaning of the chemical storagetanks and feed equipment.
The basicity of the product determines itsmost appropriate application:
Low basicity PACls (below 20 percent):Applicable for waters high in color andtotal organic carbon (TOC).
Medium basicity PACls (40 to 50 per-cent): Applicable for cold water, low tur-bidity, and slightly variable raw waterquality.
High basicity PACls (above 70 percent):Applicable for waters with highly variablequality, as a water softening coagulant,for direct filtration, and some waters withhigh color and TOC.
4. Check specific manufacturer’s product infor-mation for density and strength values.
Polymers (Coagulation)
1.
2.
3.
4.
Polymer can be added as either the primarycoagulant or as a coagulant aid to partiallyreplace a primary coagulant (e.g., alum).
Polymers used for coagulation are typically lowmolecular weight and positively charged (cati-onic).
The dosage for polymers used for coagulationis dependent on raw water quality.
Product density and solution strength informa-tion can be obtained from the individual poly-mer manufacturers.
1.
2.
3.
4.
Polymers used as flocculants generally have ahigh molecular weight and have a charge thatis positive, negative (anionic), or neutral (non-ionic).
The purpose of a flocculant is to bridge andenmesh the neutralized particles into larger floeparticles, and they are generally fed at a dos-age of less than 1 mg/L.
Flocculants should be fed at a point of gentlemixing (e.g., diffuser pipe across a flocculationbasin) to prevent breaking apart the long-chained organic molecules.
Product density and solution strength informa-tion can be obtained from the individual poly-mer manufacturers.
Filter Aid Chemicals
1.
2.
3.
4.
Polymers used as filter aids are similar to floc-culants in both structure and function.
Filter aid polymers are typically fed at dosagesless than 0.1 mg/L; otherwise, when fed inexcess concentrations they can contribute tofilter head loss and short filter run times.
Filter aid polymers are fed at a point of gentlemixing (e.g., filter influent trough).
Product density and solution strength informa-tion can be obtained from the individual poly-mer manufacturers.
Feeding Chemicals in the Plant
Step 1. Determining the Required ChemicalDosage
1. The appropriate chemical dosage for coagu-lants is typically determined by lab or pilotscale testing (e.g., jar testing, pilot plant), on-line monitoring (e.g., streaming current meter,particle counter), and historical experience. Aguideline on performing jar testing is include inAppendix L.
240

2.
3.
Flocculants are typically fed at concentrationsless than 1 mg/L. Jar testing can be used toestimate the optimum dosage.
The typical dosage for filter aid polymers isless than 0.1 mg/L. Jar testing, including fil-tering the samples, is typically not effective fordetermining an optimum dose. The polymermanufacturers can provide guidelines on useof their products as filter aids.
Step 2. Determining the Chemical Feed Rate
1. Once the chemical dosage is determined, thefeed rate can be calculated by the equationbelow:
Feed Rate (lb/day) = Flow Rate (MGD) xChemical Dose (mg/L) x 8.34 lb/gal
a plant. An approach similar to dry feedercalibration is followed; however, a volumetriccylinder is typically used to collect the sample.For example, 50 mL of liquid chemical col-lected over 2 minutes would equate to a feedr a t e o f 2 5 mL/min. A graph similar toFigure M-l can be developed showing pumpsetting (e.g., % speed) versus feed rate inmL/min.
4. For liquid chemicals, an additional step is nec-essary to convert the required weight-basedfeed rate to a volume-based pumping rate.The following equation can be used to deter-mined the pumping rate:
(FR)lb galP u m p R a t e ( m U m i n ) = - x - x dayd a y (C,)lb 1,440min
x 3,785 mL
gal
FR = Feed Rate (lb/day)
CS = Chemical Strength (lb/gal)Step 3. Determining the Chemical FeederSetting
Preparation of Feed Solutions1. Once the chemical feed rate is known, this
value must be translated into a chemical feedersetting. The approach for determining the set-ting depends on whether the chemical is in adry or liquid form.
2. For dry chemicals, a calibration curve shouldbe developed for all feeders that are used inthe plant. A typical calibration curve is shownin Figure M-l, The points on the curve aredetermined by operating the feeder at a fulloperating range of settings and collecting asample of the chemical over a timed period foreach setting. Once the sample weight isdetermined by a balance, the feed rate can bedetermined for that set point. For example,the feed rate for the 100 setting was deter-mined by collecting a feeder output sampleover a 2-minute period. The sample weightwas 5.8 lb. The associated feed rate can thenbe converted into an equivalent hourly feedrate as follows:
Feed Rate = 5.8 lb x 60 min 174 lb-=-2min hr hr
Liquid solutions of both dry and liquid chemicalsare frequently prepared in a plant to prepare thechemical for feeding (e.g., activating polymer) andto allow the feeding of the chemical in an efficientmanner. Two examples are presented below todescribe approaches for preparing chemical solu-tions from dry and liquid chemicals.
Preparation of an Alum Feed Solution
1. Determine the desired percent solution forfeeding the alum. As described under the pre-vious alum discussion, a percent solution of10 to 20 percent is typically used. In thisexample, assume a 15 percent solution.
2. Based on the volume of alum solution to beprepared, determine the weight of alum to addto the solution tank. For an alum solution vol-ume of 500 gallons, determine the alumweight as follows:
8.34 lbAlum Weight = 500 gal x -x0.15 =625 lb
gal
3. For liquid chemicals, a calibration curve shouldalso be developed for all liquid feeders used in
241

Figure M-l. Example dry chemical feeder calibration chart.
200 250 300Feeder Setting
3. Determine the alum strength (A,) for use incalculating feed rates. The alum strength forthe example above is calculated as follows:
Alum Strength (A,) = z = F500 gal
Preparation of a Polymer Feed Solution
1. Polymer manufacturers provide guidelines onpreparation of their products, includingwhether the product is fed neat (i.e., undi-luted) or in a diluted form. Diluted polymersare typically mixed at 2% by weight or less;otherwise, they become difficult to mix effec-tively. For this example, assume a 1% solu-tion is to be prepared.
2. Based on the volume of solution to be pre-pared, determine the weight of polymer to addto the solution tank. For a solution volume of200 gallons, determine the polymer weight asfollows:
8.34 lbPolymer Weight = 200 gal x - x 0.01 = 16.7 lb
gal
3. It is frequently easier to measure polymervolumetrically rather than by weight, so theweight of polymer can be converted to anequivalent volume by obtaining the productdensity from the manufacturer. For example,if the polymer density is 9.5 lb/gal, the volumeis calculated as follows:
galPolymerVolume=16.7Ibx-=9.5 lb
1.76 gal
242

4. Determine the polymer strength (P,) for use incalculating feed rates. The polymer strengthfor the example above is calculated as follows:
Polymer Strength (Ps) = 16.71b = o*“~~:‘b200 gal
Ref ecences
1. Lind, Chris. 1996. “Top 10 Questions aboutAlum and PACI.” Opflow, 22(8):7. AWVVA,Denver, CO.
243


Appendix NConversion Chak
245

Conversion Chart
English Unit Multiplier SI Unit
acre
acre-ft
cfs
cu ft
cu ft
“F
ft
ftlsec
gal
wm
mm
gpdfsq ft
wmlw ft
inch
lb
lb
MGD
psi
w ft
0.405
1,233.5
1.7
0.0283
28.32
5/9 x (“F-32)
0.3048
30.48
3.785
0.0631
8.021
0.0408
40.7
2.54
0.454
454
3,785
0.070
0.0929
ha
cu m
cu m/min
cu m
I
“C
m
cmisec
I
liter/set
cu ft/hr
cu m/day/sq m
I/min/sq m
cm
kg
9
cu m/day
kg/w cm
sq m
246 JtY.S GOVERNMENT PRINTING OFFICE: 1998 653-662

United StatesEnvironmental Protection AgencyCenter for Environmental Research InformationCincinnati, OH 45268
Official BusinessPenalty for Private Use$300
EPA/62516-911027
Please make all necessary changes on the below label,detach or copy, and return to the address in the upperleft-hand corner.
If you do not wish to receive these reports CHECK HERE 0;detach, or copy this cover, and return to the address in theupper left-hand corner.
,-