optimum temperatures for soil respiration along a semi-arid elevation gradient in southern...
TRANSCRIPT

at SciVerse ScienceDirect
Soil Biology & Biochemistry 46 (2012) 89e95
Contents lists available
Soil Biology & Biochemistry
journal homepage: www.elsevier .com/locate/soi lb io
Optimum temperatures for soil respiration along a semi-arid elevation gradientin southern California
Justin Richardson a,b,*, Amitava Chatterjee b,c, G. Darrel Jenerette a,b
aDepartment of Botany and Plant Sciences, University of California, Riverside, CA 92521, USAbCenter for Conservation Biology, University of California, Riverside, CA 92521, USAcDepartment of Soil Science, North Dakota State University, Fargo, ND 58108-6050, USA
a r t i c l e i n f o
Article history:Received 20 July 2011Received in revised form9 November 2011Accepted 10 November 2011Available online 24 November 2011
Keywords:Soil CO2 effluxSanta Rosa MountainsSoil microenvironmentsMaximum soil respirationModified Arrhenius equationSoil organic matter
* Corresponding author. Environmental Studies P6182 Steele Hall, Hanover, NH 03755, USA. Tel.: þ1 6
E-mail address: [email protected] (J
0038-0717/$ e see front matter � 2011 Elsevier Ltd.doi:10.1016/j.soilbio.2011.11.008
a b s t r a c t
Soil respiration (R) has not been adequately studied at temperatures above 35 �C, which are commontemperatures for soils in the southwestern United States and may be important for C dynamics in semi-arid regions. While frequently excluded from ecosystem models or set to 35 �C, the optimum temper-ature for soil R is poorly understood. Optimum temperatures are likely controlled by substrate avail-ability, soil moisture content, and previous climate. To quantify the optimal temperature for soil R andhypothesized relationships, we collected soils from beneath and between plant canopies at three sitesalong a semi-arid elevation gradient. Processed soil samples were incubated at three soil moisturecontents and soil R was measured at 6 temperatures, successively (25e55 �C). From these data, anactivation energy for reaction kinetics and deactivation energy for enzyme functionality model was usedto generate soil R curves fromwhich two parameters were derived: Rmax, the maximum rate of soil R andTopt, the optimum temperature for soil R. Rmax was significantly greater for soils at the highest elevationand at medium soil moisture content. Topt was greater than 35 �C at all locations. In addition, Topt wassignificantly greater for soils with greater amounts of SOM but not significantly different along theelevation gradient or at different moisture contents. These results support inclusion of much higheroptimum temperatures than currently used in many ecosystem and land-surface models and providesupport for explaining variation in Topt as regulated by substrate quantity within a site and generalinsensitivity across climate differences.
� 2011 Elsevier Ltd. All rights reserved.
1. Introduction
Understanding the rate at which terrestrial carbon cyclingoccurs is critical for determining the role of soil as a potentialpositive feedback mechanism for the greenhouse effect andresulting climate changes (Kirschbaum, 2006; Raich andSchlesinger, 1992; Schimel et al., 2001). The temperature depen-dence of decomposition and respiration of CO2 by soil microor-ganisms is one principal controlling relationship (Kirschbaum,2006). However, the interactions between temperature and soilmetabolic activity have primarily been evaluated within 0e35 �Crange, with few studies characterizing CO2 efflux rates above 35 �C(Davidson et al., 2006; Fang and Moncrieff, 2001; Lloyd and Taylor,1994). As a reflection of this lack of information, terrestrialecosystem models of soil R typically do not include any negative
rogram, Dartmouth College,03 646 3958.. Richardson).
All rights reserved.
effect of temperature or the optimal temperature is assumed to benear 35 �C (Cable et al., 2011; Fang and Moncrieff, 2001; Lloyd andTaylor, 1994; Shen et al., 2008). However, soil temperatures in thelowlands of southern California and other warm drylandsfrequently exceed 35 �C from June through September (Barron-Gafford et al., 2011; Boyd-Deep Canyon Desert Research Center).In observational studies of diel changes in soil respiration,maximum rates of soil respiration have been observed above 35 �C(Barron-Gafford et al., 2011; Parker et al., 1983). Thus, determiningthe rate and variation of soil R at temperatures greater than 35 �C isimportant for understanding and modeling terrestrial carboncycling in a warming world, particularly for soils within hyper-thermic temperature regimes.
Two key dependent variables describe soil R at optimaltemperatures: the temperature of maximum respiration (Topt) andthe rate of maximum respiration (Rmax). The regulation of Toptand Rmax may respond differently to environmental conditions.Similar to factors influencing soil R within the 0e35 �C range, wehypothesized variation around optimal temperatures would be
J. Richardson et al. / Soil Biology & Biochemistry 46 (2012) 89e9590
dependent on soil moisture content, substrate supply, and theadjustment of soil microbes to local climatic conditions (Davidsonand Janssens, 2006; Fierer et al., 2005; Scott-Denton et al., 2003;Waldrop and Firestone, 2006). Soil moisture content affects soil Rby controlling soil water films, water potentials inside soil micro-organisms, and the diffusion of O2 (Ilstedt et al., 2000; McLatcheyand Reddy, 1998; �Sim�unek and Suarez, 1993; Stres et al., 2008).Generally, a soil moisture content around 50% of water-holdingcapacity (WHC) allows for maximum soil R (Ilstedt et al., 2000;Jin et al., 2008), although the effect on optimum temperature forsoil R is unclear.
In addition to soil moisture, C substrate supply has been shownto directly influence soil R rates (Davidson et al., 2006) and stronglyregulate temperature dependence of soil R (Davidson et al., inpress). At low substrate concentrations, the delivery rate of Csubstrate to microbes may limit peak fluxes at the temperatureassociated with these fluxes. C substrate is primarily supplied tosoil by adjacent vegetation in the form of detritus. The rate of soilorganic matter (SOM) accumulation in soil is dependent on thevegetation type and climate (Berg and Meentemyer, 2002; Raichand Tufekcioglu, 2000).
An alternate hypothesis believed to control the temperatureresponse of soil R is climate acclimation or adaptation of soilmicroorganisms. An early study of the temperature dependence ofsoil R by Koepf (1953) hypothesized local temperature regime wasa dominant variable influencing the temperature sensitivity of soilR. Recent experiments have shown soil R acclimation to long term(>77 days) thermal environment (Bradford et al., 2010). Further-more, soil microorganisms have been found to be phylogeneticallyclustered with respect to elevation (Bryant et al., 2008). Pietkäinenet al. (2005) hypothesized climate acclimation of soil microbialcommunities would occur with prolonged exposure totemperatures > 35 �C. Therefore, it may be possible that soilmicroorganisms are physically adapted to their climate and wouldexhibit a greater or lesser adaption to respire at elevated temper-atures depending on their original climate.
To understand the variation in optimum temperature for soil R,we conducted laboratory incubations at elevated temperatures(>35 �C) using soils collected from contrasting plant canopy andinterplant microenvironments along a 2500m elevation gradient insouthern California. The resulting data for each soil sample werecoupled with a process-based model of metabolism that includestemperature sensitivity in both the activation energy required forrespiration and the deactivation energy associated with enzymedegradation. We used this data-model combination to identify Toptand Rmax. The combination of elevation gradient and microenvi-ronments were used to evaluate the potential influence of substrateand climate adaptation on the optimum temperature for soil R. Thisanalysis was repeated at three different moisture contents toevaluate the role of moisture on soil R at elevated temperatures. The
Table 1Geographic location and climatic parameters, of Base, Mid, and Summit sites located alRiverside County, California, USA.
Site Elevation (m) Latitude Longitude MAT (�C) MA
Base 289 33�14’1900 N 116�2201500 W 24a 8
Mid 1829 33�32041.500 N 116�29024.700 W 15 50
Summit 2489 33�31016.400 N 116�25011.100 W 10b 52
All climate data is from USDA Natural Resource Conservation Service: Soil Survey Staff,Official Soil Series Descriptions. Available online at http://soils.usda.gov/technical/classifi
a Soil Temperatures regularly exceed 50 �C (0e10 cm).b Soils temperatures have not been observed above 25 �C (0e10 cm).
climate adaptation hypothesis leads to a prediction that Topt andRmax will be greatest at the low elevations and in open microen-vironments compared to higher elevations and underneath plantcanopy microenvironments. In contrast, substrate supply hypoth-eses predict Topt and Rmax will be greatest at high elevations andunderneath plant canopy microenvironments as both have higherorganic matter contents than either low elevations or the plantinterspaces. Similar to soil R patterns within the 0e35 �C, themoisture availability hypothesis predicts Topt and Rmax will behighest under intermediate moisture content. The resulting datawill provide some of the first estimates of soil R patterns near theirthermal optimums and inform understanding of soil R dynamics inresponse to projected global warming.
2. Materials and methods
2.1. Soil sampling and site characterization
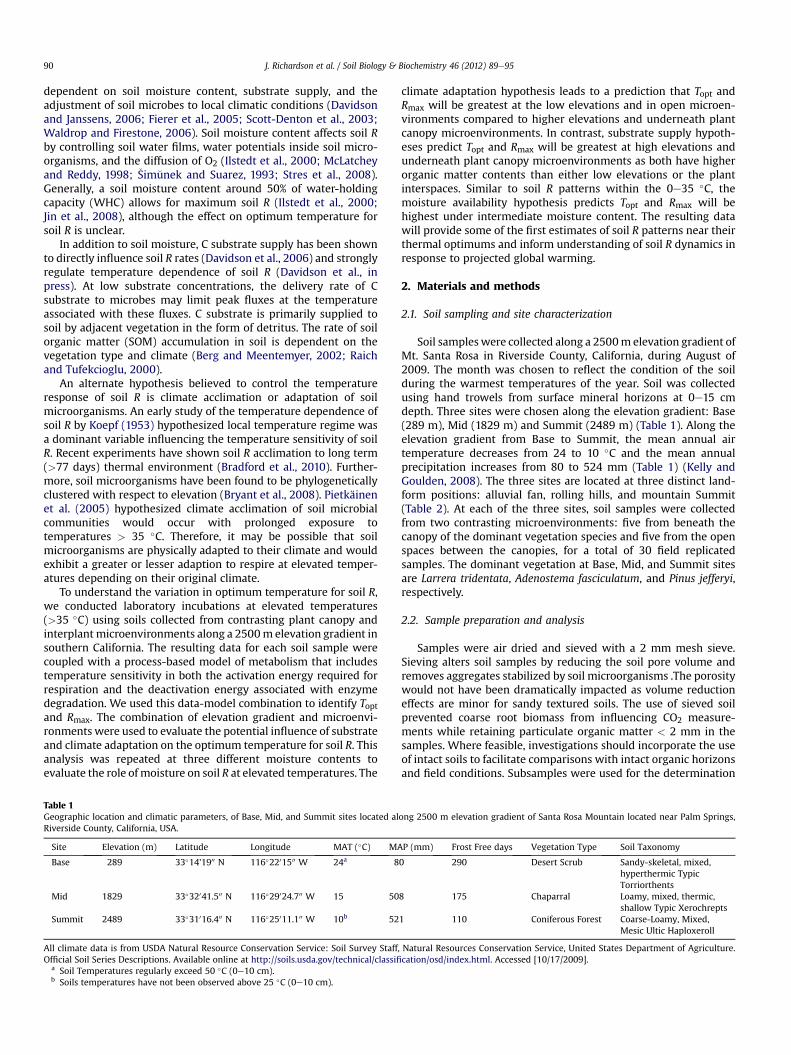
Soil samples were collected along a 2500m elevation gradient ofMt. Santa Rosa in Riverside County, California, during August of2009. The month was chosen to reflect the condition of the soilduring the warmest temperatures of the year. Soil was collectedusing hand trowels from surface mineral horizons at 0e15 cmdepth. Three sites were chosen along the elevation gradient: Base(289 m), Mid (1829 m) and Summit (2489 m) (Table 1). Along theelevation gradient from Base to Summit, the mean annual airtemperature decreases from 24 to 10 �C and the mean annualprecipitation increases from 80 to 524 mm (Table 1) (Kelly andGoulden, 2008). The three sites are located at three distinct land-form positions: alluvial fan, rolling hills, and mountain Summit(Table 2). At each of the three sites, soil samples were collectedfrom two contrasting microenvironments: five from beneath thecanopy of the dominant vegetation species and five from the openspaces between the canopies, for a total of 30 field replicatedsamples. The dominant vegetation at Base, Mid, and Summit sitesare Larrera tridentata, Adenostema fasciculatum, and Pinus jefferyi,respectively.
2.2. Sample preparation and analysis
Samples were air dried and sieved with a 2 mm mesh sieve.Sieving alters soil samples by reducing the soil pore volume andremoves aggregates stabilized by soil microorganisms .The porositywould not have been dramatically impacted as volume reductioneffects are minor for sandy textured soils. The use of sieved soilprevented coarse root biomass from influencing CO2 measure-ments while retaining particulate organic matter < 2 mm in thesamples. Where feasible, investigations should incorporate the useof intact soils to facilitate comparisons with intact organic horizonsand field conditions. Subsamples were used for the determination
ong 2500 m elevation gradient of Santa Rosa Mountain located near Palm Springs,
P (mm) Frost Free days Vegetation Type Soil Taxonomy
0 290 Desert Scrub Sandy-skeletal, mixed,hyperthermic TypicTorriorthents
8 175 Chaparral Loamy, mixed, thermic,shallow Typic Xerochrepts
1 110 Coniferous Forest Coarse-Loamy, Mixed,Mesic Ultic Haploxeroll
Natural Resources Conservation Service, United States Department of Agriculture.cation/osd/index.html. Accessed [10/17/2009].

Table 2Soil parent material and physico-chemical properties of Base, Mid and Summit sites located along 2500 m elevation gradient of Santa Rosa Mountain, Riverside County,California, USA.
Site Soil pHa Canopy SOM % Inter-Canopy SOM % DOCb Soil Texture Landform Parent Material
Base 7.9 (�0.4) 1.9% (�0.2) 1.5% (�0.1) 17.5 (�3.1) Sand Alluvial fan Alluvium derived from graniteMid 6.6 (�0.2) 3.4% (�0.2) 2.9% (�0.1) 29.4 (�5.2) Sandy Loam Rolling Hills Granodiorite ResiduumSummit 6.1 (�0.2) 7.4% (�1.4) 7.3% (�0.8) 34.5 (�3.5) Sandy Loam Mountain Residuum weathered from granite
a Soil pH measured with 1:2.5 soil:water extract.b DOC units values are (mg C per kg dry soil).
J. Richardson et al. / Soil Biology & Biochemistry 46 (2012) 89e95 91
of physical and chemical properties of each soil (Table 1, Table 2).Soil particle size distributionwas determined using the hydrometermethod (Bouyoucos, 1962). SOM was measured by combustionmethod: soil samples were placed in a muffle furnace at 550 �C for4 h and the mass lost per mass dry soil was reported. DOCmeasurements were madewith 50 g of dry soil, incubated for 5 d at40% WHC. A 1 M K2SO4 solution was used in a 1:1 extraction andvacuum filtered with 8 mm Whatman 40 filter papers (GE Health-care UK Limited), then analyzed with a Shimadzu TOC 5000Analyzer using high temperature combustion (Shimadzu Corpora-tion). Soil WHC was measured by the gravimetric method for eachfield replicates. 50 g sub-samples were saturated with de-ionizedwater in funnels lined with Whatman 40 filter paper, allowed todrain for 2 h to a constant mass, and then dried at 105 �C for 24 h todetermine themass of water held in the soil. Soil pHmeasurementsused a 1:2.5 soil:water extract at 25 �C with an Accumet AB15 pHmeter (Fisher Scientific) (Table 2).
2.3. Preparative incubation and measurements of soil R
A preparative incubation time and temperature were chosen tofavor the growth of the soil microbial community and avoid thecommonly observed pulse of activity following initial rewetting(Fierer and Schimel, 2003; Chatterjee and Jenerette, 2011a). 50 g ofsieved soil was placed in glass jars, wetted with de-ionized water toone of three designated percentages of WHC (20, 40, and 80%),capped, and incubated in the dark for five days at 25 �C. After thepreparative incubation, the jars were opened to ambient conditionsfor an hour and fanned to remove any accumulated gases. Soil Rwasmeasured at 6 temperatures successively (25�, 35�, 40�, 45�, 50�,55 �C) using an LI-7000 infrared CO2 gas analyzer (Licor Biosci-ences, Lincoln, NE) and a water bath system for temperatureregulation (Chatterjee and Jenerette, 2011a). The non-randomizedthermal incubation method may have influenced the respirationin a manner difficult to quantify (Davidson et al., 2006), althoughprevious applications of sequential warming over short durationshave suggested at short time-scales the problem is minimized(Fang et al., 2005). The short intervals were used to examine thecurrent microbial community’s temperature sensitivity beforephysiological adjustments occur (Bradford et al., 2010). The changein CO2 concentration for a 90 s time interval was fit to a linearregression model to determine the flux of mmol CO2 day�1 kg drysoil�1 (Yuste et al., 2007; Chatterjee and Jenerette, 2011a). Thesequential heating incubations were completed within 8 h forevery sample. A 30e40 min heating and stabilization intervalbetween measurements was adequate to thoroughly heat thesample to the required temperature. The 30 field samples wereanalyzed at three different soil moisture contents (20, 40, and 80%WHC) for a total of 90 samples. This follows previous soil R studiesthat used slightly moist, intermediate, and near saturation soilwater contents (Fang and Moncrieff, 2001; Reichstein et al., 2005).Soil water content was maintained throughout the incubation bythe addition of de-ionized water to replace water lost. Soil CO2efflux estimates tend to underestimate soil R immediatelyfollowing application of water (Bouma and Bryla, 2000). For this
reason, water was added approximately an hour before measure-ments. Soil R measurements were repeated in triplicate, and thenaveraged for a single sample value.
2.4. Soil R curve modeling
The temperature dependence of soil Rmax was modeled usinga modified Arrhenius equation as described by Leuning (2002),which is widely used in models of plant functioning (Misson et al.,2006; Barron-Gafford et al., in press), although to our knowledge ithas not been applied to soil R.
Rmax ¼ 1þ exp½ðSvT0 � HdÞ=ðRT0Þ�exp½ðHa=RT0Þð1� T0=T1Þ�1þ exp½ðSvT1 � HdÞ=ðRT1Þ�
(1)
Following Leuning (2002), the reference temperature wasdefined as T0 ¼ 298$2 K. Ha is the energy of activation (J, mol�1)associated with enzyme mediated reactions, Hd is the energy ofdeactivation (J, mol�1) which follows enzyme degradation. Sv, is anentropy term (J, mol�1 K�1). This model allows for asymmetry insoil R surrounding the optimum temperature. Eq. (1) was able tomodel soil R curves for 87 of the 90 field replicates with R2 � 0.70using Matlab (The MathWorks Inc., 2011). The remaining 3 samplesdid not exhibit characteristic temperature response function andwere subsequently excluded from the analysis. The soil R curves,described by the modified Arrhenius equation, were used toempirically derive both Topt and Rmax for each of the 87 samples(Fig. 1). Rmax and Topt were calculated by differentiating each soilR curve to obtain the point of inversion. The optimum temperature(Topt) was defined as the temperature (�C) on the soil R curve atwhich the maximum rate of soil R (Rmax) occurred.
2.5. Statistical analysis
A three-way Analysis of Variance (ANOVA) was performed todetermine the effect of site elevation, microenvironment, andwatercontent on Rmax and Topt. To calculate the significance of differencesbetween different levels, post-hoc unpaired two-sample t-testswere conducted with Tukey’s Honestly Significant Difference testfor confirmation. Correlative relationships between Rmax, Topt, SOMcontent, and DOC were investigated using multiple regressionmodels. All regressionmodeling and analyseswere conducted usingMatlab.
3. Results
3.1. ANOVA analysis
The three-way ANOVA revealed Rmax and Topt varied withrespect to elevation, microenvironment, and soil moisture contentin different patterns (Table 3). Topt was primarily affected by themicroenvironment but not elevation or soil moisture. In addition,the ANOVA revealed significant interactions between elevation-microenvironment and elevation-soil moisture content (Table 3).

Fig. 2. The optimum temperature for soil R is shown for the three elevations at twodifferent microenvironments. The mean values for the 87 Topt values are displayed withstandard error bars. * denotes a significant difference when compared between canopyand inter-canopy samples ( P < 0.01).
Fig. 1. An example of the modified Arrhenius equation fit to respiration data. 87 of the90 total field replicates were accurately described with R2 values � 0.70. The optimumtemperature (Topt) was defined as the temperature (�C) at which the maximum rate ofCO2 efflux (Rmax) occurred on the modeled soil R graph.
J. Richardson et al. / Soil Biology & Biochemistry 46 (2012) 89e9592
Post-hoc two-sample t-tests identified significant variation in Toptwith respect to elevation, soil moisture, and microenvironmentbetween samples. The Topt values for Base and Mid canopy sampleswere significantly greater than Base and Mid between canopiessamples (P < 0.05) (Fig. 2, Table 4). Overall, Topt values for soilbeneath canopies (44.1 � 0.6 S.E. �C) were significantly greaterwhen compared to inter-canopy soils (42.4 � 0.9 S.E. �C) (P < 0.05)(Table 4). In addition, the Summit inter-canopy Topt value wassignificantly greater than the Base and Mid values (P < 0.05).However, when samples were regrouped with respect to elevationand soil moisture content, Topt did not vary significantly ashypothesized (Table 3).
Rmax varied conversely with Topt with respect to elevation, soilmoisture, and microenvironment. From the ANOVA, Rmax wassignificantly affected by elevation and soil moisture content but notmicroenvironment (Table 3). Fig. 3 depicts the variation of Rmax foreach elevation at the three soil moisture contents. Rmax at Mid site(32 � 2.9 S.E. mmol CO2 day�1 kg dry soil�1) were significantly lessthan Base (63.4 � 6.5 S.E. mmol CO2 day�1 kg dry soil�1) andSummit (77.7 � 8.5 S.E. mmol CO2 day�1 kg dry soil�1) (Fig. 3,Table 4). As expected, the soil moisture content significantlyaffected soil R in a similar manner as with previous studies. 40%WHC was significantly greater with an Rmax value of 81.4 � 8.5 S.E.(mmol CO2 day�1 kg dry soil�1) compared to 20% WHC and 80%WHC (P < 0.05) (Fig. 3, Table 4). Furthermore, 20% WHC wassignificantly less than 80% WHC with Rmax values of 34.6 � 3.1 S.E
Table 3Three-way ANOVA for Topt and Rmax with respect to elevation, microenvironment,and soil moisture content are displayed for 87 samples.
Optimal Temperature forsoil Respiration (Topt)
Maximum rate ofsoil respiration (Rmax)
Elevation (E) 0.051 <0.001***Microenvironment (M) <0.05* 0.342Soil moisture (S) 0.144 <0.001***E � M <0.05* 0.436E � S <0.05* <0.05*M � S 0.369 <0.001***E � M � S <0.001*** 0.571
* and *** denote significant differences of P < 0.05 and P < 0.001, respectively.
(mmol CO2 day�1 kg dry soil�1) and 56.1 � 6.3 S.E (mmol CO2day�1 kg dry soil�1), respectively (P < 0.05) (Fig. 3, Table 4).
3.2. Chemical and physical soil properties
SOM% differed significantly by elevation andmicroenvironment.Summit SOM% was significantly greater than both Base and Midsamples (P < 0.01) (Table 2). SOM% was higher for soils beneathplant canopies for Base and Mid samples (P < 0.05). However, SOM% was similar for both microenvironments at the Summit site.These patterns are consistent with previous extensive sampling ofspatial variation in soil properties along this transect (Chatterjeeand Jenerette, 2011b). At 40% WHC, linear regression analysisrevealed SOM% content was positively correlated with greater Toptvalues (P < 0.05) (R2 ¼ 0.183) (Fig. 4) and with greater Rmax values(P < 0.05) (R2 ¼ 0.348) (Fig. 4). The equations for the linearregressions for SOM% with Topt and Rmax are:
Topt ¼ 1:002$SOM%þ 40:14 (2)
Rmax ¼ 9:556$SOM%þ 41:92 (3)
SOM% and DOC were positively correlated with each other(P < 0.05). Soil pH was negatively correlated with SOM% and DOC(P < 0.05). Soil pH was significantly higher for Base samples whencompared toMid samples (P< 0.01) and for Mid samples comparedto Summit samples (P < 0.05) (Table 2). Soil pH between micro-environments was not significantly different.
Table 4Topt and Rmax values by microenvironment, soil water content, and elevation. Themean values (�standard errors) are displayed for the 87 samples.
Topt (�C) Rmax (mmol CO2 day�1
kg dry soil�1)
Canopy 44.1 (�0.6) 54.2 (�5.5)Inter-Canopy 42.4 (�0.9) 60.5 (�6.3)20% WHC 42.3 (�0.9) 34.6 (�3.1)40% WHC 44.3 (�1.2) 81.4 (�8.5)80% WHC 43.2 (�0.4) 56.1 (�6.3)Base 42.3 (�0.8) 63.4 (�6.5)Mid 42.7 (�0.6) 32.0 (�2.9)Summit 44.8 (�1.2) 77.7 (�8.5)

Fig. 3. Maximum soil respiration rate (Rmax) at different soil moisture contents (20, 40,80% of the total WHC) of soils from two microenvironments (canopy and inter-canopy)at Base, Mid, and Summit elevation positions. Mean values for 87 Rmax are displayedwith standard error bars. * indicates a significantly different Rmax value within thesame elevation and microenvironment (P < 0.05).
J. Richardson et al. / Soil Biology & Biochemistry 46 (2012) 89e95 93
4. Discussion
4.1. General discussion
Our study provides experimental evidence that the optimaltemperature of soil R is consistently higher than 35 �C acrossclimates, vegetation types, and moisture contents. This conclusionwas based on soil R measurements throughout an elevationgradient of nearly 2500 m, from contrasting microenvironments,and a 60% variation in soil moisture content. Across these differentfactors, the optimal temperature for soil R was influencedprimarily by microenvironment, in which the highest optimumtemperatures were observed from beneath plant canopies (Fig. 2).The maximum rate of soil R at the optimum temperature wasprimarily influenced by soil moisture content and the elevationgradient (Table 3). These findings correspond with the hypothesesof intermediate soil moisture and substrate supply dominance onsoil R at elevated temperatures, however, the consistency in Topt,across the elevation transect is in contrast with expectationsof climate induced acclimatization or adaptation of microbialcommunities.
Fig. 4. (Left) The correlative relationship between optimum temperature (Topt) for soil R aP < 0.05 with R2 ¼ 0.183. (Right) The correlative relationship between the maximum rate ofwith R2 ¼ 0.348.
There were no significant relationships between soil physicalproperties and the optimal temperature response of soil R. Soiltexture was similar along the elevation gradient. There was nosignificant change in parent material, thus contributions ofcarbonates to CO2 efflux were most likely low. The soil chemicalproperties yielded many relationships with the response of soil R totemperature. Soil pHwas significantly correlated with SOM% due toorganic acids as expected. The pH at the Base elevation was highand may have affected soil microbial community in structure andpossibly its function (Bryant et al., 2008).
4.2. The effect of soil moisture content
As with previous studies (e.g. Ilstedt et al., 2000; Jin et al., 2008;Wilson and Griffin,1975), our results demonstrate soil R is generallyrestricted at both high and low soil moisture contents (Fig. 3). At20%WHC, limitedmoisture availability may have decreased Rmax byreducing substrate transport and decreased internal soil microbewater potentials, which both may have limited microbial growthand their metabolic activities (Ilstedt et al., 2000; Orchard andCook, 1983). At 80% WHC, the near saturating conditions mayhave reduced Rmax by decreasing transport of oxygen and creatingoxygen-limited conditions (E.g. Ilstedt et al., 2000; McLatchey andReddy, 1998). In contrast to Rmax, Topt was not significantlyaffected by soil moisture content alone. The three-way factorANOVA revealed a significant interaction among water content andelevation affecting Topt (P < 0.05) (Table 3). This suggests compo-nents of the temperature response of soil microorganisms totemperatures > 35 �C were differentially dependent on moisturewhen at least 20% WHC is present.
4.3. The effect of soil organic matter
The substrate supply hypothesis, which predicts soils with thegreatest substrate availability would have the greatest Topt and Rmaxvalues, was supported for Rmax but was less consistent for Topt. Thegreatest Rmax values were observed at the elevation and themicroenvironmentwith the highest SOM% and DOC values. Topt wasgreater for canopy microenvironments but similar across allelevations. The lack of correspondence with Topt and general esti-mates of substrate supply across the elevation gradient could beindicative of changes in substrate quality from plant litter differ-ences. Vegetation type may have directly influenced Rmax bydifferences in the decomposability of the plant foliar tissue and theavailability of labile carbon and nitrogen compounds such as non-
nd the SOM content at 40% WHC is displayed. The linear regression is significant atsoil R and the SOM content at 40% WHC. The linear regression is significant at P < 0.001

J. Richardson et al. / Soil Biology & Biochemistry 46 (2012) 89e9594
structural carbohydrates, phenolics, or amino acids (Berg andMeentemyer, 2002; Quideau et al., 2000). These plant createdmicroenvironments may have also led to altered microbialcommunities (Waldrop and Firestone, 2006), potentially causingcompensating effects across the elevation transect. The amount ofSOM accumulation in soil is dependent on the vegetation type andclimate (Berg and Meentemyer, 2002; Raich and Tufekcioglu,2000). The effect of SOM supply across the elevation gradient onTopt may have been masked by the change in quantity and distri-bution of SOM. In our transect, the dominant vegetation dramati-cally changed (Table 1) from Larrea tridentata, a desert shrubreaching up to 2 m in height, to Pinus ponderosa, a pine tree whichmay grow to 50 m in height. Pinus ponderosa, the dominant vege-tation of the Summit site, deposits more needle leaves in a widerfashion covering both microenvironments with greater evennessthan Larrea tridentata. This potentially explains of a why Topt wasnot significantly different between microenvironments at theSummit elevation.
4.4. The effect of thermal acclimation or adaptation
The thermal acclimation or adaptation hypotheses suggestedthat Topt and Rmax will be greatest at the low elevations whichregularly reach temperatures > 35 �C and in open microenviron-ments which have higher daily temperatures. Differences in theoptimum temperature for maximum soil R due to existing climatehad been hypothesized by Koepf (1953) based on a microbialthermal acclimatization mechanism. Furthermore, Pietkäinen et al.(2005) attributed an optimum temperature in soil R above 30 �C toan adaptive response resulting from a shift in microbial communitycomposition in response to higher temperatures. Thermal accli-mation or adaptation hypotheses were derived from the potentiallylarge variation in microbial communities and the assumption oftheir ability to respond to ambient temperatures. In contrast tothese hypotheses, we observed no effect of elevation (Fig. 2), whichconstitutes large differences in mean annual temperature,maximum temperature, mean annual precipitation, and number offrost free days, on Topt. The mean optimum temperatures for theSummit site were substantially higher than temperatures occurringin recent history at that elevation. Consequently, our observationssuggest microorganisms capable of respiring at temperatures>35 �C are ubiquitous to all three climates examined. In contrast tothe thermal acclimation hypothesis, plant created microenviron-ments had a higher Topt than inter-canopy microenvironments onlya few meters away (Fig. 2). At the Base site, Topt varied by nearly10 �C between contrasting microenvironments. The localizedmicroenvironment effect may result from the higher SOM underthe plant canopies providing different soil microorganisms withsufficient substrates to support metabolic activity at highertemperatures. Evidence of a consistent Topt across the elevationgradient and higher Topt in the more moderated plant-canopymicroenvironments than the warmer inter-canopy microenviron-ments both suggest climatic dependence of peak rate characteris-tics is minimal in this landscape.
4.5. Conclusion
The optimum temperature for respiration in soil has notreceived enough attention. Our results suggest revisions to currentassumptions used in ecosystem and land-surface models used forfuture climate projections. Topt was consistently higher than 35 �Cand varied not in response to regional climate variation but morewith local vegetation effects. The co-variance of vegetation typeand their respected detritus production along the elevationgradient may have indirect effects that interact with direct climate
effects on soil respiration temperature sensitivity. Short-term basedmeasurements provide insight into the ubiquity of the complextemperature dependent response of soil respiration in the mineralsoil at high temperatures. In-situ measurements along with incu-bation studies will further our knowledge in this area and lead tomore accurate depictions of soil R in regions where soil tempera-tures regularly exceed 35 �C. With global annual temperaturesexpected to increase, more soils will experience temperaturesnearer and above their optimums; extending ecosystem modelsand experiments to these higher temperature regimes are impor-tant research needs.
Acknowledgments
This research was supported by grants from Kearny Foundationfor Soil Science Research and the University of California, River-side’s Office of Undergraduate Education. We thank Al Muth andthe Boyd Deep Canyon UC Reserve for access to field sites. Wekindly thank Lindy Shomper for the field and technical support,Lauren Velasco for sharing her plant species data, Dr. Patty Oikawaand Dr. Weijun Shen for the technical advice and furtherdiscussions.
References
Barron-Gafford, G.A., Scott, R.L., Jenerette, G.D., Huxman, T.E., 2011. The relativecontrols of temperature, soil moisture, and plant functional group on soil CO2efflux at diel, seasonal, and annual scales. Journal of Geophysical Research 116,G01023. doi:10.1029/2010JG001442.
Barron-Gafford, G.A., Scott, R.L., Jenerette, G.D., Hamerlynck, E.P., Huxman, T.E.,Temperature and precipitation controls over leaf- and ecosystem-level CO2 fluxalong a woody plant encroachment gradient. Global Change Biology, in press.
Berg, B., Meentemyer, V., 2002. Litter quality in a north European transect versuscarbon storage potential. Plant and Soil 242, 83e92.
Bouma, T.J., Bryla, D.R., 2000. On the assessment of root and soil respiration for soilsof different textures: interactions with soil moisture contents and soil CO2concentrations. Plant and Soil 227, 215e221.
Bouyoucos, G.J., 1962. Hydrometer method improved for making particle sizeanalyses of soils. Agronomy Journal 54, 464e465.
Bradford, M.A., Watts, B.W., Davies, C.A., 2010. Thermal adaptation of heterotrophicsoil respiration in laboratory microcosms. Global Change Biology 16,1576e1588.
Bryant, J.A., Lamanna, C., Morlon, H., Kerkoff, A.J., Enquist, B.J., Green, J.L., 2008.Microbes on mountainsides: contrasting elevational patterns of bacterial andplant diversity. Proceedings of the National Academy of Sciences of the UnitedStates of America 105, 11505e11511.
Cable, J.M., Ogle, K., Lucas, R.W., Huxman, T.E., Loik, M.E., Smith, S.D., Tissue, D.T.,Ewers, B.E., Pendall, E., Welker, J.M., Charlet, T.N., Cleary, M., Griffith, A.,Nowak, R.S., Rogers, M., Steltzer, H., Sullivan, P.F., van Gestel, N.C., 2011. Thetemperature responses of soil respiration in deserts: a seven desert synthesis.Biogeochemistry 103, 71e90.
Chatterjee, A., Jenerette, G.D., 2011a. Changes in soil respiration Q10 during drying-rewetting along a semi-arid elevation gradient. Geoderma 163, 171e177.
Chatterjee, A., Jenerette, G.D., 2011b. Spatial Variability of soil metabolic rate alonga dryland elevation gradient. Landscape Ecology 26, 1111e1123. doi:10.1007/s10980-011-9632-0.
Davidson, E.A., Janssens, I.A., 2006. Temperature sensitivity of soil carbon decom-position and feedbacks to climate change. Nature 440, 165e173.
Davidson, E.A., Janssens, I.A., Luo, Y., 2006. On the variability of respiration interrestrial ecosystems: moving beyond Q(10). Global Change Biology 12,154e164.
Davidson, E.A., Samanta, S., Caramori, S.S., Savage, K., The Dual Arrhenius andMichaeliseMenten kinetics model for decomposition of soil organic matter athourly to seasonal time scales. Global Change Biology, in press. doi:10.1111/j.1365-2486.2011.02546.x.
Fang, C., Moncrieff, J.B., 2001. The dependence of soil CO2 efflux on temperature. SoilBiology and Biochemistry 33, 155e165.
Fang, C., Smith, P., Moncrieff, J.B., Smith, J.U., 2005. Similar response of labile andresistant soil organic matter pools to changes in temperature. Nature 433,57e59.
Fierer, N., Schimel, J.P., 2003. A proposed mechanism for the pulse in carbon dioxideproduction commonly observed following the rapid rewetting of a dry soil. SoilScience Society of America Journal 67, 798e805.
Fierer, N., Craine, J.M., McLauchlan, K., Schimel, J.P., 2005. Litter quality and thetemperature sensitivity of decomposition. Ecology 86, 320e326.

J. Richardson et al. / Soil Biology & Biochemistry 46 (2012) 89e95 95
Ilstedt, U., Nordgren, A., Malmer, A., 2000. Optimum soil water for soil respirationbefore and after amendment with glucose in humid tropical acrisols anda boreal mor layer. Soil Biology and Biochemistry 32, 1591e1599.
Jin, X., Wang, S., Zhou, Y., 2008. Microbial CO2 production from surface andsubsurface soil as affected by temperature, moisture, and nitrogen fertilization.Australian Journal of Soil Research 46, 273e280.
Kelly, A.E., Goulden, M.L., 2008. Rapid shifts in plant distribution with recentclimate change. Proceedings of the National Academy of Sciences of the UnitedStates of America 105, 11823e11826.
Kirschbaum, M.U.F., 2006. The temperature dependence of organic-matter decom-position- still a topic of debate. Soil Biology and Biochemistry 38, 2510e2518.
Koepf, H., 1953. Die Temperatur/Zeit e Abhängigkeit der Bodenatmung. Zeits-chriftfür Pflanzenernährung, Düngung. Bodenkunde 61, 29e48.
Leuning, R., 2002. Temperature dependence of two parameters in a photosynthesismodel. Plant Cell and Environment 25, 1205e1210.
Lloyd, J., Taylor, J.A., 1994. On the temperature dependence of soil respiration.Functional Ecology 8, 315e323.
McLatchey, G.P., Reddy, K.R., 1998. Regulation of organic matter decomposition andnutrient release in wetland soil. Journal of Environmental Quality 27,1268e1274.
Misson, L., Tu, K.P., Boniello, R.A., Goldstein, A.H., 2006. Seasonality of photosyn-thetic parameters in a multi-specific and vertically complex forest ecosystem inthe Sierra Nevada of California. Tree Physiology 26, 729e741.
Orchard, V.A., Cook, F.J., 1983. Relationship between soil respiration and soilmoisture. Soil Biology and Biochemistry 15, 447e453.
Parker, L.W., Miller, J., Steinberger, Y., Whitford, W.G., 1983. Soil respiration ina Chihuahuan desert rangeland. Soil Biology and Biochemistry 15, 303e309.
Pietkäinen, J., Pettersson, M., Bååth, E., 2005. Comparison of temperature effects onsoil respiration and bacterial and fungal growth rates. FEMS MicrobiologyEcology 52, 49e58.
Quideau, S.A., Anderson, M.A., Graham, R.C., Chadwick, O.A., Trumbore, S.E., 2000.Soil organic matter processes: characterization by 13C NMR and 14C measure-ments. Forest Ecology and Management 138, 19e27.
Raich, J.W., Schlesinger, W.H., 1992. The global carbon-dioxide flux in soil respira-tion and its relationship to vegetation and climate. Tellus 44B, 81e99.
Raich, J.W., Tufekcioglu, A., 2000. Vegetation and soil respiration: correlations andcontrols. Biogeochemistry 48, 71e90.
Reichstein, M., Subke, J.A., Angeli, A.C., Tenhunen, J.D., 2005. Does the temperaturesensitivity of decomposition of soil organic matter depend upon watercontent, soil horizon, or incubation time? Global Change Biology 11,1754e1767.
Schimel, D.S., House, J.I., Hibbard, K.A., Bousquet, P., Ciais, P., Peylin, P., Braswell, B.H.,Apps, M.J., Baker, D., Bondeau, A., Canadell, J., Churkina, G., Cramer, W.,Denning, A.S., Field, C.B., Friedlingstein, P., Goodale, C., Heimann, M.,Houghton, R.A., Melillo, J.M., Moore, B., Murdiyarso, D., Noble, I., Pacala, S.W.,Prentice, I.C., Raupach, M.R., Rayner, P.J., Scholes, R.J., Steffen, W.L., Wirth, C.,2001. Recent patterns and mechanisms of carbon exchange by terrestrialecosystems. Nature 414, 169e172.
Scott-Denton, L.E., Sparks, K.L., Monson, R.K., 2003. Spatial and temporal controls ofsoil respiration in a high-elevation, subalpine forest. Soil Biology andBiochemistry 35, 525e534.
Shen, W.J., Jenerette, G.D., Hui, D.F., Philips, P., Ren, H., 2008. Effects of changingprecipitation regimes on dryland soil respiration and C pool dynamics at rainfallevent, seasonal, and interannual scales. Journal of Geophysical Research-Bio-geosciences. doi:10.1029/2008JG000685.
�Sim�unek, J., Suarez, D.L., 1993. Modeling of carbon dioxide and production in soil 1.Model Development. Water Resources Research 29, 487e497.
Stres, B., Danev�ci�c, T., Pal, L., Fuka, M.M., Resman, L., Leskovec, S., Hacin, J., Stopar, D.,Mahne, I., Mandic-Mulec, I., 2008. Influence of temperature and soil watercontent on bacterial archaeal and denitrifying microbial communities indrained fen grassland soil microcosms. FEMS Microbiology Ecology 66,110e122.
Waldrop, M.P., Firestone, M.K., 2006. Seasonal dynamics of microbial communitycomposition and function in Oak canopy and open grassland soils. MicrobialEcology 52, 470e479.
Wilson, J.M., Griffin, D.M., 1975. Water potential and the respiration of microor-ganisms in the soil. Soil Biology and Biochemistry 7, 199e204.
Yuste, J.C., Baldocchi, D.D., Gershenson, A., Goldstein, A., Mission, L., Wong, S., 2007.Microbial soil respiration and its dependency on carbon inputs, soil tempera-ture and moisture. Global Change Biology 13, 2018e2035.