options analysis: costs and benefits of urban tree canopy
TRANSCRIPT

Prepared by BDO EconSearchLevel 7, BDO Centre, 420 King William Street Adelaide SA 5000 Tel: +61 (8) 7324 6190 https://www.bdo.com.au/en-au/econsearch
OPTIONS ANALYSIS: Costs and Benefits of Urban Tree Canopy Options for Minor Infill Development in the Planning and Design Code
A Report to the Attorney-General’s Department
September 2020

TREE CANOPY OPTIONS COST BENEFIT ANALYSIS i Pr epar ed by BDO EconSear ch
ACKNOWLEDGEMENTS
This study was commissioned and project managed by the Attorney-General’s Department (AGD) Planning Reform area. The development of this study was guided by an Across Agency Working and Steering Group which included representatives from:
AGD (Planning Reform and Sustainability and Environment areas) Department of Environment and Water (Green Adelaide and Urban Water areas) Wellbeing SA.
A Stakeholder Reference Group provided feedback on the draft project scope and included representatives from the following organisations:
Department of Treasury and Finance Housing Industry Association (HIA) Master Builders Association (MBA) Urban Development Institute of Australia (UDIA) Local Government Association of South Australia (LGA) Stormwater Management Authority Premier’s Climate Change Council Water Sensitive SA Stormwater SA Australian Institute of Landscape Architects (AILA) Australian Institute of Architects (AIA) Conservation SA South Australian Council of Social Services (SACOSS) Property Council of Australia Community Alliance.
Project Manager: Julian Morison
Principal Author: Heather Bailey
Name of Client: Attorney-General’s Department
Name of Project: OPTIONS ANALYSIS: Costs and Benefits of Urban Tree Canopy Options for Minor Infill Development in the Planning and Design Code
Document Version: 5
Job Number: ES2001
#15766940

URBAN TREE CANOPY OPTIONS COST BENEFIT ANALYSIS ii Pr epar ed by BDO EconSear ch
EXECUTIVE SUMMARY
Purpose of this Report
BDO EconSearch and Tonkin Engineering have been commissioned by the Attorney-General’s Department, Department for Environment and Water, Department of Treasury and Finance, and SA Health to analyse the cost-effectiveness of the proposed Planning and Design Code policies for minor infill, in relation to:
Tree canopy cover and the ‘One Tree Policy’ (this report)
Stormwater management and rainwater tanks (refer to separate report).
The State Planning Policies give direction to improving urban greening outcomes in recognition of the multiple benefits they provide, especially in the context of minor infill. Draft Planning and Design Code (Code) policies have been prepared and consulted on in response to this direction.
Feedback received during the Code’s consultation indicates there is a dichotomy of views in community and industry about whether the proposed tree policies for minor infill developments go too far, or not far enough. Concerns included, on one side, the potential impacts of tree planting on upfront housing affordability from higher footing costs, and on the other side, the potential negative impacts of tree loss on public health, urban heat, liveability, biodiversity and neighbourhood amenity. It is important to respond to these concerns with an independent and sound evidence base.
This report is intended to inform decision-making on the cost-effectiveness of proposed Code policy, alongside other feedback. It aims to improve understanding of all the upfront and long-term costs and
Major Findings
To determine the most cost-effective way to balance urban tree canopy and infill outcomes, this study tested two policy options for the new Planning and Design Code:
Option 1: Draft Planning and Design Code policy for one onsite tree per allotment Option 2: Offsite tree planting, via an offset scheme.
The ‘One Tree Policy’ proposed in the new Planning and Design Code is expected to deliver economic, amenity and liveability gains to the Greater Adelaide community valued at $26.4 million (Benefit Cost Ratio 1.7), and is therefore a worthwhile initiative for government to consider.
In the General Neighbourhood and Suburban Neighbourhood Zones, the majority of households can meet the proposed tree requirements without incurring any new costs to their house footings.
Consideration could be given to implementing more nuanced policy options to minimise upfront costs in the cases when a homeowner will incur a net cost as a result of tree policies i.e. in locations with highly reactive soils and small minimum set-backs. This may include introducing an optional offset scheme which, as formulated in this study, would deliver estimated gains to the Greater Adelaide community of $187.2 million.

URBAN TREE CANOPY OPTIONS COST BENEFIT ANALYSIS iii Pr epar ed by BDO EconSear ch
benefits of the proposed policies to the individual household and the Greater Adelaide community, and ensure they can be weighed up objectively.
Balancing tree canopy cover and urban infill outcomes
Minor infill is now the single largest provider of new housing in Greater Adelaide, with a net annual increase of about 2,500 residential dwellings. The 30-Year Plan for Greater Adelaide (2017 Update) (the 30-Year Plan) has a target for 85 per cent of all new housing to be built within the existing urban footprint, because infill development helps to create walkable neighbourhoods, protect valuable farming and environmental land, and meet consumer demand for living close to jobs, shops, and services.
The 30-Year Plan also sets a target to increase urban green cover by 20 per cent by 2045. This target recognises the many benefits of green cover to urban cooling, the character, biodiversity and liveability of our suburbs, and our physical and mental health. This target is at significant risk, with tree cover reducing from 21.5 per cent to 19.5 per cent across metropolitan Adelaide between 2013 and 2016.
There is evidence minor infill has contributed to a significant reduction in green cover in many neighbourhoods. This is because infill development generally increases site coverage and driveway crossovers, and reduces space for gardens and tree planting, creating up to 90 per cent impervious surfaces. The opportunities for delivering additional green infrastructure on existing public land in the metropolitan area are insufficient to keep up with the loss of green cover on private land.
There are no provisions for landscaping in the current Residential Code, and landscaping provisions vary significantly in the current Development Plans. Therefore, to meet both desired policy outcomes – more infill and more canopy cover – improved policies need to be considered for inclusion in the new Planning and Design Code. It is important that Code policies find the best balance between upfront and long-term costs and benefits, for both individuals and the community.
Costs and benefits of urban tree cover
Benefits of urban tree canopy
Trees, beyond their amenity and biodiversity value, provide critical services that make cities healthier and more liveable. Tree canopy cover is now widely recognised for providing multiple benefits1 including:
1 Refer to the full report for the list of references for these.

URBAN TREE CANOPY OPTIONS COST BENEFIT ANALYSIS iv Pr epar ed by BDO EconSear ch
Given that trees are long-lived and provide a number of benefits, it is being increasingly recognised that trees should be considered as assets, the same way livestock, buildings and employees are considered assets. Trees should be considered appreciating assets, as their replacement value and the services they provide increase over time.
House footings and the tree effect
One of the concerns raised in consultation on the Code was the potential impact of tree planting on upfront housing affordability, as a result of higher footing costs. Addressing these concerns was a key focus of this report.
According to independent advice from several structural engineering firms, a single new tree will usually only impose a new cost on house footings if it is planted closer to the dwelling than its mature height (in the ‘tree effect’ zone2, see diagram supplied by TMK Consulting (2019)).
In an established urban area, house footings often will already have to be designed to accommodate the impact of nearby offsite trees, regardless of the tree policy. Usually there is already a street tree and sometimes there is one or more neighbouring site trees within the ‘tree effect’ zone of the new dwelling. Adding the proposed new tree (to the front garden for example) will often not add an additional footing design cost as the new dwelling would have to already accommodate for a ‘single tree effect’ or ‘group of trees effect’ cost. Further, many households already choose to retain existing trees or plant new trees when undertaking infill developments. For example in our case study, 57 per cent of infill developments retained or planted a tree anyway, regardless of the ‘tree planting policy’3.
Consequently, in the majority of cases, house footings will have to be designed to accommodate trees, regardless of the proposed ‘One Tree Policy’. It is also recommended that developers seek advice from their structural engineer about the optimal location for the tree to minimise the effect on the footings.
It is also prudent for home owners to consider that new trees in the future may be planted on neighbouring sites or in the public verge outside their house (within the zone of effect on their footings), therefore it is recommended that their house footings are designed for this.
In cases where a tree is planted close enough to a footing to cause a ‘tree effect’, soil type can have a significant impact on the cost4. In Greater Adelaide there are five main soil types, ranging from sandy to highly reactive clay. The cost impact is also dependent on a range of other factors, including construction method, the mature height and number of trees, and the type and shape
2 As per the Australian Standard 2870-2011 Residential Slabs and Footings. A single tree is classified as ‘1 or 2 trees’.
3 Refer to the Glengowrie case study site within this report for further information. This case study includes developments occurr ing between 2007 and 2019 and is the best available information on household behaviour in relation to trees in minor infill settings in metropolitan Adelaide. 4 See Table 3-3: Additional costs to footings from single tree effects by soil type

URBAN TREE CANOPY OPTIONS COST BENEFIT ANALYSIS v Pr epar ed by BDO EconSear ch
of footings. Therefore the cost impact on footings can be highly variable.
In the case studies tested in this analysis, additional house footing costs incurred under the ‘One Tree Policy’ ranged from $186 to $3,636 depending on the tree effect, the reactivity of the soil, and the dwelling type. This analysis used the ‘single tree effect’ costings as it will be the most likely outcome of the one tree planting policy.
Other costs
The cost of planting a tree and maintaining it for 25 years has been estimated in this study at $603 on private land and $1,165 on public land.
There can also be adverse tree impacts that need to be managed. For example, tree root growth can cause damage to kerbs, paving, foundations and other underground infrastructure; leaf litter can accumulate in gutters and drains; falling branches can cause risk to people, buildings and fences; and provision for trees may influence the footprint of buildings on small blocks. In many instances, adverse impacts reflect poor tree selection and/or poor site preparation and can be avoided.
Methodology
Which options have been analysed?
The cost benefit analysis tested two policy options under multiple scenarios, against the base case. The purpose of this approach is to test whether the Draft Code proposals stack up against the current South Australian policy requirements. Note that the tested policies are being considered for minor infill sites only, not for greenfield developments where the public realm (streetscapes and public open space) is usually designed together with new housing.
The base case and policy options analysed were:
Base Case Scenario – Current (‘business as usual’) scenario. No tree planting provision. There are no provisions for landscaping in the current Residential Code. Landscaping provisions vary significantly in the current Development Plans but don’t include a specific tree planting requirement for minor infill.
Option 1 – One onsite tree per allotment (Draft Code policy). The proposed deemed-to-satisfy5 provision for minor infill to provide one tree (or equivalent) on each allotment, which is small, medium or large depending on allotment size. Discounts apply for retaining existing trees and associated soil area.
Option 2 – Offset scheme. Applicants can choose to meet the one tree provision on their own allotment, or have the same outcome achieved offsite on public land, funded by an offset scheme.
The two proposed solutions were compared against the ‘base case’ – that is, what happens with trees in minor infill developments now. To check if proposed policy options will add or subtract value, we needed to clearly define an accurate base case. This was a key part of this project. Based on a case study site6,
5 A deemed to satisfy policy is a measurable cr iter ia which is one way of meeting a performance outcome in the Planning and Design Code. Applicants can instead choose alternative solutions that meet the relevant performance outcome. 6 The case study site is the Frederick Street catchment area in Glengowrie within the City of Marion, which is the same area used as a case study for the separate Stormwater Management report.

URBAN TREE CANOPY OPTIONS COST BENEFIT ANALYSIS vi Pr epar ed by BDO EconSear ch
we apportioned how many infill developments currently remove, retain and plant trees, and how many already have to factor the tree effect into house footing costs due to offsite trees.
Multiple scenarios were tested under each option to enable assessment of whether policies should be adjusted in specific scenarios. The scenarios covered various tree effects7, two soil types 8 and two common infill dwelling types 9. While this is not exhaustive, it does provide a reasonable indication of the potential impact of the proposed Code policy.
What is a cost benefit analysis, and why have we taken this approach?
A cost benefit analysis is undertaken to enable all quantifiable costs and benefits of various policy options to be considered on an even playing field. This includes testing the likelihood and significance of any net costs or benefits. The aim of using this approach is to ensure the Planning and Design Code uses the most cost-effective and beneficial solutions to meet the desired policy outcomes.
In determining the costs and benefits of the two policy options, it is important to distinguish between who is accruing the costs and the benefits. The analysis was therefore undertaken at two levels:
At the community level – expected costs and benefits (both monetary and non-monetary) accruing to people (households, businesses and government) and the environment within Greater Adelaide, as a result of the proposed options.
At the individual household level – expected cost and benefits (monetary only) accruing to the household undertaking the development, as a result of the proposed options.
A cost benefit analysis has limitations. It can only include costs and benefits that are quantifiable in dollar terms, backed by the best available, relevant and defensible information. It provides an indication of the likelihood and significance of costs and benefits, but due to the many variables at play, it is not possible to identify the exact net cost or benefit applicable to every individual household in every possible scenario.
The analysis was conducted over a 25-year period. Results were expressed in terms of net costs or benefits – that is, how each option compared against the base case, in real terms (i.e. 2020 dollars). The criteria measured were Net Present Value (NPV) and Benefit-Cost Ratio (BCR). Where NPV is a positive, this shows a net benefit, and where negative, a net cost. Where the Benefit-Cost Ratio is greater than 1.0, the option delivers a net benefit, and where it is less than 1.0, it delivers a net cost.
Which costs and benefits have been considered, and which have been excluded?
Monetary costs and benefits considered include those that are direct (e.g. paying an offset) and those that are indirect (e.g. electricity bill savings). Non-monetary costs and benefits were also considered (e.g. avoided healthcare costs from reduced air pollution).
The analysis captures only a conservative estimate of the benefits, due to the rigorous and transparent approach taken to quantify benefits in financial terms. We have preferenced South Australian and then best practice Australian data sources.
Many of the benefits attributed to tree cover in the research are not readily expressed financially, and as a result, often go unquantified in dollar terms. There are a multitude of studies that have identified the link between urban trees and social and environmental benefits (see Table 2-6), but it is a challenge to
7 Not causing a new tree effect, causing a new tree effect, and causing an additional tree effect. 8 The type causing the smallest effect to house footing costs, and the type causing the greatest effect. 9 A 200m2 br ick veneer detached single storey house and a 90m2 two story townhouse, two common minor infill development housing types in metropolitan Adelaide.

URBAN TREE CANOPY OPTIONS COST BENEFIT ANALYSIS vii Pr epar ed by BDO EconSear ch
find suitable studies from which to transfer values, without risk of misapplication. We have been careful and conservative in the values we have transferred from other studies to use in this study. Some well-researched benefits that could not be defensibly quantified have therefore been excluded. These include amenity values of onsite trees, biodiversity values, urban heat mitigation, and some physical and mental health benefits. Nuisance costs have also been excluded due to a lack of defensibly quantifiable evidence, and because nuisance effects are generally associated with larger trees than those required under the proposed Code policy.
Key Findings of the Cost Benefit Analysis
Compared to the base case, introducing the ‘One Tree Policy’ is expected to deliver economic, amenity and liveability gains to the Greater Adelaide community valued at $26.4 million (BCR 1.7), and is therefore a worthwhile initiative for government to consider.
Consideration could be given to implementing more nuanced policy options to minimise upfront costs in the cases where a homeowner will incur a net cost as a result of tree policies (i.e. in locations with highly reactive soils and small minimum setbacks). This may include introducing an optional offset scheme which, as formulated in this study, would deliver estimated gains to the Greater Adelaide community of $165.1 million.
Option 1 – ‘One Tree Policy’ for one onsite tree per allotment (Draft Code policy).
This option would return $1.70 to the community for every $1 invested. The ‘One Tree Policy’ as described in the Draft Code is therefore a worthwhile initiative for government to consider.
This study tested a number of likely common infill development scenarios.

URBAN TREE CANOPY OPTIONS COST BENEFIT ANALYSIS viii Pr epar ed by BDO EconSear ch
In the most likely scenario, a tree can be planted onsite without creating a new or additional tree effect (Scenario 110). In this case, infill households will realise a significantly positive net benefit of $888 (BCR 2.5).
This study also tested the impact of infill developments planting a 6m tree 4m from the dwelling’s footings, which will impose a new tree effect on house footing costs. The study found that where the soil has lower reactivity11, the household will realise a net benefit, and where the soil has higher reactivity12, the household will incur a net cost (BCRs range from 1.9 to 0.4 respectively).
There may be merit in identifying additional options for households to meet tree cover outcomes while minimising upfront costs, in the scenario they will incur a net cost.
This study has only included a limited sub-set of benefits that were able to be defensibly quantified in dollar terms. Other benefits likely to accrue to households with onsite trees include improved physical and mental health. We therefore expect the estimated benefits to be conservative for both individual households and the community.
Option 2 – Provision of an offset scheme.
This option would return $2.4 to the community for every $1 invested. Providing the option for infill households to have the same ‘one tree’ outcome achieved offsite on public land, funded via an offset scheme, is therefore a worthwhile initiative for government to consider.
As formulated in this study, providing an offset option would deliver gains to the Greater Adelaide community valued at an estimated $165.1 million.
Option 2 had a significantly higher return than Option 1 for three reasons:
Amenity value of offsite trees is significantly greater than onsite trees – valued at $104.0 million in additional community benefits.
Most house footing costs would be avoided, with some households choosing to pay an offset instead – valued at $26.3 million in avoided household costs compared to Option 1
More mature trees would be retained (incentivised via avoided offset payments) – valued at $15.2 million in retained community benefits compared to Option 1.
For households choosing to pay an offset rather than meeting tree outcomes onsite, net costs were $1,165 if there was no existing tree onsite and $3,435 if an existing tree was removed. An offset may therefore be appealing where the cost is lower than amending house footings (e.g. on more reactive soils). In the case where an existing tree is removed, an offset payment may be attractive to households with other considerations external to this analysis (such as site configuration or particular house designs) they are prepared to trade off against the offset payment. Note the offset scheme in this cost benefit analysis is illustrative only and further investigation is needed.
10 Scenario 1 covers cases where the new tree is planted outside the tree effect zone OR where there is already one nearby tree (causing an existing single tree effect on footings) OR where there is already a group of nearby trees (causing an existing group of trees effect on footings). 11 See Scenario 2 and 4 in the Cost Benefit Analysis. 12 See Scenario 3 and 5 in the Cost Benefit Analysis.

URBAN TREE CANOPY OPTIONS COST BENEFIT ANALYSIS ix Pr epar ed by BDO EconSear ch
Key Policy Considerations
1. Nuanced policy implementation for more reactive soils in denser zones
A nuanced application of the policy could be considered for households expected to incur a net cost. This may occur in denser zones (with smaller lots and setbacks) with more reactive soils.
Distribution of more reactive soils is highly variable across Greater Adelaide.
2. Putting a price on tree loss
Retained trees, being more mature, provide relatively more economic, social and environmental benefits than newly planted trees.
There is currently a 3 x $150 fee for removing a Significant tree and 2 x $150 fee for removing a Regulated tree on private land. It is clear this nominal fee falls short of covering the costs of planting and maintaining a replacement tree ($603 on private land, $1,165 on public land) – not to mention the lost benefits to the community (estimated at $3,435 for an average unregulated tree).
Mechanisms could be considered for appropriately pricing removal of trees to reflect the true cost imposed on the community (e.g. lost carbon storage, lost urban heat mitigation, reduced house values, reduced health outcomes, etc.).
3. Providing an offset scheme for trees to be planted offsite
Option 2, as formulated in this study, does put a price on lost benefits and replacement costs when removing existing trees. This is expected to incentivise higher retention of existing trees.
An appropriately priced offset scheme may provide individual households with greater choice in how they fulfil their contribution to the desired policy outcome of improved tree canopy cover. For example, an offset payment may be attractive to households on sites with more reactive soils.
Individual households may have other considerations external to the analysis, such as site configuration or particular house designs, which they are prepared to trade off against the cost of payment into the offset scheme.
If an offset scheme is pursued, its design should consider the practicalities of replacing and maintaining a tree in the public realm (including space constraints), the loss of tree benefits where they are needed most, and the required administrative arrangements of an offset scheme.
Consideration would also need to be given to appropriately distributing offset payment receipts to equalise lost tree benefits, both by location (so tree benefits can be provided where they are needed most) and by sector (so the lost benefits can be provided by alternative means).
New infill development zones
The new General Neighbourhood and Suburban Neighbourhood Zones have a minimum 5m setback. Infill developments in these zones can usually meet the ‘One Tree Policy’ provisions without incurring any new costs to house footings.
The denser Housing Diversity and Urban Renewal Zones have a minimum 3m setback. In these zones, households could choose to avoid additional house footing costs by setting their house back further than the minimum, or they can choose to accommodate the ‘tree effect’ in their house footing design. Due to the small block size and minimum setback, it is likely that many of these developments will already have to consider some form of ‘tree effect’ from nearby street trees or neighbour’s trees, regardless of the ‘One Tree Policy’.

URBAN TREE CANOPY OPTIONS COST BENEFIT ANALYSIS x Pr epar ed by BDO EconSear ch
TABLE OF CONTENTS Acknowledgements ................................................................................................. i
Executive Summary.................................................................................................ii Major Findings ......................................................................................................ii
Purpose of this Report .............................................................................................ii Balancing tree canopy cover and urban infill outcomes ........................................................ iii
Costs and benefits of urban tree cover .......................................................................... iii Benefits of urban tree canopy ............................................................................. iii House footings and the tree effect........................................................................ iv Other costs................................................................................................... v
Methodology ........................................................................................................ v Which options have been analysed? ........................................................................ v What is a cost benefit analysis, and why have we taken this approach?................................ vi Which costs and benefits have been considered, and which have been excluded? .................... vi
Key Findings of the Cost Benefit Analysis ....................................................................... vii
Option 1 – ‘One Tree Policy’ for one onsite tree per allotment (Draft Code policy). ................. vii Option 2 – Provision of an offset scheme. .............................................................. viii
Key Policy Considerations ......................................................................................... ix
Tables ............................................................................................................. xii Figures ............................................................................................................ xii
Abbreviations .................................................................................................... xiii 1. Introduction.................................................................................................. 1
1.1. Background to this study............................................................................. 1 1.2. Study objectives and scope .......................................................................... 3
2. Study Context................................................................................................ 5
2.1. Urban infill trends in Greater Adelaide ............................................................. 5 2.2. Urban tree canopy trends in metropolitan Adelaide ............................................... 8 2.3. Current policy framework ........................................................................... 9
2.3.1.Urban green cover target and supporting policies .......................................... 9 2.3.2.Current policy for tree canopy in minor infill development ................................ 9
2.4. Future policy framework........................................................................... 11 2.4.1.Overview of the South Australian planning reforms....................................... 11 2.4.2.Draft Code policy for tree canopy in minor infill development .......................... 11
2.5. Research on the costs and benefits of urban trees .............................................. 13 2.5.1.Benefits of urban trees ..................................................................... 13 2.5.2.Costs of urban trees ......................................................................... 14 2.5.3.Study limitations ............................................................................ 15
2.6. House footings and the ‘tree effect’.............................................................. 17 2.6.1.Impact of soil type on the ‘tree effect’ ................................................... 18

URBAN TREE CANOPY OPTIONS COST BENEFIT ANALYSIS xi Pr epar ed by BDO EconSear ch
2.7. Offset schemes ..................................................................................... 22 3. Study Approach ............................................................................................ 24
3.1. Method of Analysis ................................................................................. 24 3.2. Scope of the cost benefit analysis................................................................. 25
3.2.1.Policy options analysed ..................................................................... 25 3.2.2.Costs and benefits considered .............................................................. 25
3.3. Quantifying the costs and benefits ................................................................ 28 3.3.1.Footing costs................................................................................. 28 3.3.2.Tree planting and maintenance costs ...................................................... 29 3.3.3.Offset scheme payments and management................................................ 30 3.3.4.Amenity benefits of trees on house prices................................................. 31 3.3.5.Improved air quality ........................................................................ 31 3.3.6.Carbon removed ............................................................................. 32 3.3.7.Avoided loss of stored carbon .............................................................. 32 3.3.8.Avoided stormwater runoff ................................................................. 32 3.3.9.Reduced household electricity use ......................................................... 32 3.3.10. Avoided mental health costs............................................................ 33
3.4. Defining key variables.............................................................................. 35 3.4.1.Number of dwellings to be built per year.................................................. 35 3.4.2.Proportion of dwelling types to be built ................................................... 35 3.4.3.Proportion of allotments on each soil type ................................................ 35 3.4.4.Proportion of allotments with trees retained, planted and lost ......................... 36 3.4.5.Proportion of allotments with nearby trees ............................................... 39
4. Cost Benefit Analysis Results ............................................................................. 40 4.1. Community.......................................................................................... 40
4.1.1.Cost benefit analysis results ................................................................ 40 4.1.2.Sensitivity analysis .......................................................................... 41
4.2. Individual infill households ........................................................................ 43 4.2.1.Scenarios tested ............................................................................. 43 4.2.2.Cost benefit analysis results ................................................................ 44 4.2.3.Sensitivity analysis .......................................................................... 46
5. Key Policy Considerations ................................................................................. 49
References ........................................................................................................ 50 APPENDIX 1 Background evidence gathering ............................................................ 54
APPENDIX 2 Detailed CBA Models ........................................................................ 79

URBAN TREE CANOPY OPTIONS COST BENEFIT ANALYSIS xii Pr epar ed by BDO EconSear ch
TABLES Table 2-1 Changes in land surface cover from 2013-2016, Metropolitan Adelaide .......................... 8
Table 2-2 Tree size and number required per dwelling, proposed DTS 21.2............................... 12
Table 2-3 Tree size, proposed DTS 21.2...................................................................... 12
Table 2-4 Retained tree discounts, proposed DTS 21.2 ..................................................... 12
Table 2-5 Tree size equivalents, proposed DTS 21.2 ........................................................ 12
Table 2-6 Examples of benefits of green infrastructure in cities ........................................... 13
Table 2-7 Distribution of soil types across local government areas, based on TMK soil samples (number of samples) ............................................................................... 20
Table 4-1 Results of the community cost benefit analysis, Greater Adelaide ............................. 40
Table 4-2 Results of the sensitivity analysis – discount rate ................................................ 42
Table 4-3 Results of the sensitivity analysis – period of analysis ........................................... 42
Table 4-4 Results of the sensitivity analysis – amenity ...................................................... 43
Table 4-5 Results of the individual household cost benefit analysis – Scenarios 1-5, Options 1 and 2 ... 45
Table 4-6 Results of the individual household cost benefit analysis – Scenarios 6-7, Option 2 ........... 46
Table 4-7 Results of the sensitivity analysis – discount rate ................................................ 46
Table 4-8 Results of the sensitivity analysis – period of analysis ........................................... 47
Table 4-9 Results of the sensitivity analysis – amenity ...................................................... 47
Appendix Table 2-1 Detailed community level CBA, Option 1a,b............................................. 79
Appendix Table 2-2 Detailed community level CBA, Option 2a,b............................................. 80
Appendix Table 2-3 Detailed individual homeowner level CBA, Scenario 1a,b,c ............................. 81
Appendix Table 2-4 Detailed individual homeowner level CBA, Scenario 2a,b,c ............................. 82
Appendix Table 2-5 Detailed individual homeowner level CBA, Scenario 3a,b,c ............................. 83
Appendix Table 2-6 Detailed individual homeowner level CBA, Scenario 4a,b,c ............................. 84
Appendix Table 2-7 Detailed individual homeowner level CBA, Scenario 5a,b,c ............................. 85
Appendix Table 2-8 Detailed individual homeowner level CBA, Scenario 6a,b,c ............................. 86
Appendix Table 2-9 Detailed individual homeowner level CBA, Scenario 7a,b,c ............................. 87
FIGURES
Figure 1 Relationship of this Options Analysis to development of the Planning and Design Code ........ 1
Figure 2 Map of the study area (Greater Adelaide) .......................................................... 4
Figure 3 Examples of minor infill development .............................................................. 6
Figure 4 Demand driven residential trends, Greater Adelaide .............................................. 6
Figure 5 Recent trends in minor infill development ......................................................... 7

URBAN TREE CANOPY OPTIONS COST BENEFIT ANALYSIS xiii Pr epar ed by BDO EconSear ch
Figure 6 New baseline data for tree canopy in metropolitan Adelaide (Aerometrex, 2020) ............ 10
Figure 7 The criteria for determining if a single tree will influence a building footing system ......... 18
Figure 8 The criteria for determining if a group tree effect will influence a building footing system ...................................................................................................... 18
Figure 9 Distribution of soil types across Greater Adelaide, based on TMK soil samples ................ 21
Figure 10 Hypothetical 200m2 brick veneer detached single storey dwelling ............................. 28
Figure 11 Hypothetical 90m2 brick veneer two-storey townhouse ......................................... 28
Figure 12 The criteria for determining if trees create a ‘group of tree’ effect ........................... 44
ABBREVIATIONS
BCR Benefit-cost Ratio
CBA Cost Benefit Analysis
CPI Consumer Price Index
DEW Department of Environment and Water
AGD Attorney-General’s Department
DTS Deemed-to-satisfy
GI Green Infrastructure
LGA Local Government Area
NPV Net Present Value
SPC State Planning Commission
WSUD Water Sensitive Urban Design

URBAN TREE CANOPY OPTIONS COST BENEFIT ANALYSIS 1 Pr epar ed by BDO EconSear ch
1. INTRODUCTION
1.1. Background to this study
The progressive implementation of the Planning, Development and Infrastructure Act 2016 will reach a major milestone in 2020, as the Planning and Design Code (the Code) is brought into formal operation across South Australia.
Introduction of the Code provides a valuable opportunity to refine and improve policies to meet the State’s strategic directions, including those related to water sensitive urban design (WSUD) and urban greening in the context of increasing minor residential infill.
The State Planning Policies give direction to improving water sensitive urban design and urban greening outcomes, in recognition of the multiple benefits they provide. Draft Planning and Design Code (Code) policies have been prepared and consulted on (until 28 February 2020) in response to this direction.
BDO EconSearch and Tonkin Engineering have been commissioned by the Attorney-General’s Department (AGD), Department for Environment and Water (DEW), Department of Treasury and Finance (DTF), and SA Health to analyse the cost-effectiveness of the proposed Planning and Design Code policies for minor infill, in relation to:
Tree canopy cover and the ‘One Tree Policy’ (this report) Stormwater management and rainwater tanks (refer to separate report).
This work sits within the context of the public consultation process for Phase 3 (Urban Areas) of the Planning and Design Code as illustrated in -1.
Figure 1 Relationship of this Options Analysis to development of the Planning and Design Code

URBAN TREE CANOPY OPTIONS COST BENEFIT ANALYSIS 2 Pr epar ed by BDO EconSear ch
Stakeholder engagement
A stakeholder reference group with representatives from the following organisations provided feedback into the scope of this work:
Department of Treasury and Finance Department for Environment and Water SA Health Housing Industry Association (HIA) Master Builders Association (MBA) Urban Development Institute of Australia (UDIA) Local Government Association of South Australia(LGA) Stormwater Management Authority Premier’s Climate Change Council Water Sensitive SA Stormwater SA Australian Institute of Landscape Architects (AILA) Australian Institute of Architects (AIA) Conservation SA South Australian Council of Social Services (SACOSS) Property Council Community Alliance Engineers Australia.
Background evidence gathering
As a first stage to this work, AGD, sought to identify and review some of the likely costs and benefits associated with proposed Code policies, with funding from Green Adelaide. These efforts were informed by a number of stakeholder workshops and forums included members of the Stakeholder Reference Group as well as representatives from key government agencies, local councils and developers with experience in infill development. This options analysis used and built on this work (see Appendix 1 for a summary).

URBAN TREE CANOPY OPTIONS COST BENEFIT ANALYSIS 3 Pr epar ed by BDO EconSear ch
1.2. Study objectives and scope
This report is intended to inform decision-making on the cost-effectiveness of proposed Planning and Design Code policy for minor infill in relation to tree canopy cover, alongside other feedback. It aims to improve understanding of all the upfront and long-term costs and benefits of the proposed policies, to both the individual household and the Greater Adelaide community, and ensure they can be weighed up objectively. Note that the tested policies are being considered for minor infill13 sites only, not for greenfield developments where the public realm (streetscapes and public open space) is usually designed together with new housing.
The analysis was undertaken at two levels:
At the community level – expected costs and benefits (both monetary and non-monetary) accruing to people (households, businesses and government) and the environment across Greater Adelaide, as a result of the proposed options.
At the individual household level – expected cost and benefits (monetary only) accruing to the household undertaking the development, as a result of the proposed options.
The cost benefit analysis tested two policy options against the base case. The purpose of this approach is to test whether the Draft Code policies stack up against the current South Australian policy requirements. Multiple scenarios were tested under each option to enable assessment of whether policies should be adjusted in specific scenarios.
The base case and policy options analysed were:
Base Case Scenario – Current (‘business as usual’) scenario. No tree planting provision. There are no provisions for landscaping in the current Residential Code. Landscaping provisions vary significantly in the current Development Plans but don’t include a specific tree planting requirement for minor infill.
Option 1 – One onsite tree per allotment (Draft Code policy). The proposed deemed-to-satisfy14 provision for minor infill to provide one tree (or equivalent) on each allotment, which is small, medium or large depending on allotment size. Discounts apply for retaining existing trees and associated soil area.
Option 2 – Offset scheme. Applicants can choose to meet the one tree provision on their own allotment, or have the same outcome achieved offsite on public land, funded by an offset scheme.
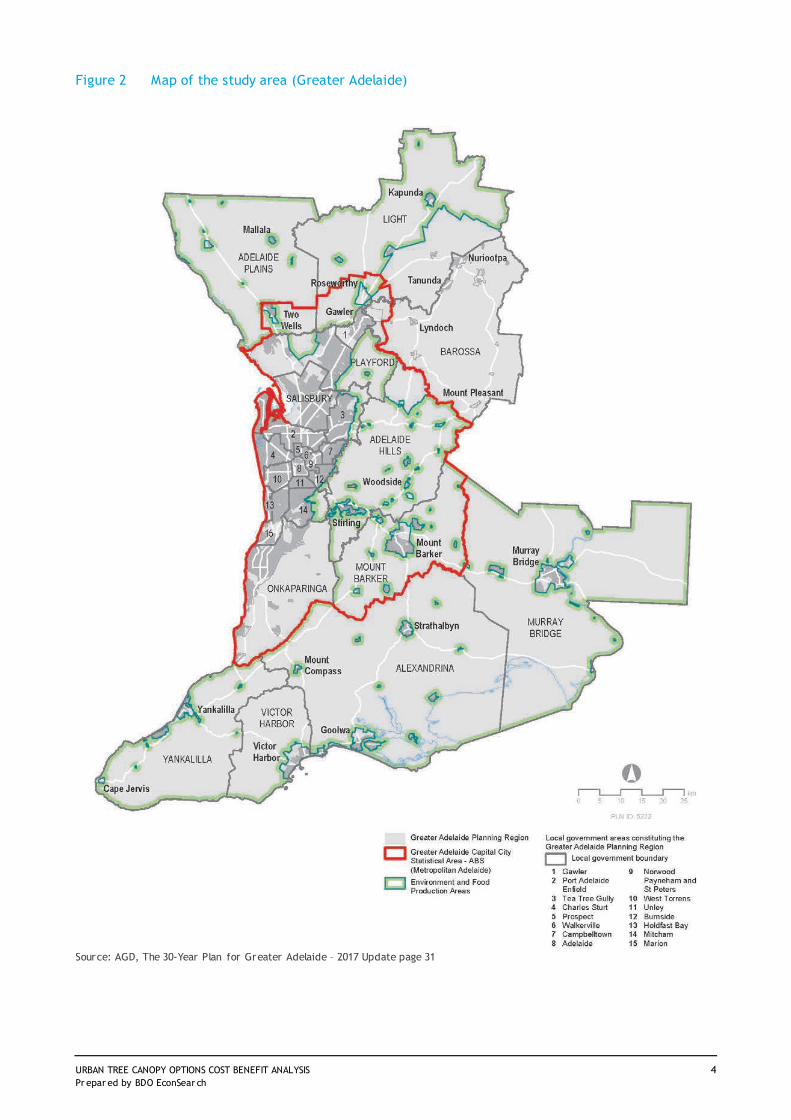
The study area covers the urban areas of the Greater Adelaide Capital City Statistical area15. Figure 2 shows a map of the study area for this analysis.
13 Minor infill is defined as ‘Development and adaptation of the existing housing stock, including demolition and subdivision, on sites less than 4,000m² and involving 10 dwellings or less. Minor infill is an important component of the overall land supply equation and makes a significant contr ibution (around 40 per cent) to the annual metropolitan housing supply growth within Greater Adelaide’ (AGD 2019). 14 A deemed to satisfy policy is a measurable cr iter ia which is one way of meeting a performance outcome in the Planning and Design Code. Applicants can instead choose alternative solutions that meet the relevant performance outcome. 15 Gawler, Port Adelaide Enfield, Tea Tree Gully, Charles Sturt, Prospect, Walkerville, Campbelltown, Adelaide, Norwood Payneham Dt Peters, West Torrens, Unley, Burnside, Holdfast Bay, Mitcham, Marion, Salisbury, Playford, Adelaide Hills, Mt Barker, Onkaparinga, Mallala (part of) and Light (part of).
URBAN TREE CANOPY OPTIONS COST BENEFIT ANALYSIS 4 Pr epar ed by BDO EconSear ch
Figure 2 Map of the study area (Greater Adelaide)
Source: AGD, The 30-Year Plan for Greater Adelaide – 2017 Update page 31

URBAN TREE CANOPY OPTIONS COST BENEFIT ANALYSIS 5 Pr epar ed by BDO EconSear ch
2. STUDY CONTEXT
This section provides a more in-depth discussion of the study context and describes urban infill and urban tree cover trends in Greater Adelaide, the policy context, and Draft Code tree planting requirements. It also provides a literature review of the costs and benefits associated with urban trees and highlights the limitations of this study.
2.1. Urban infill trends in Greater Adelaide
Target 1 of the 30-Year Plan for Greater Adelaide (2017 Update) (the 30-Year Plan) is for 85 per cent of all new housing to be built within the existing urban footprint. This target recognises that infill development helps to create walkable neighbourhoods, protect valuable farming and environmental land, and meet consumer demand for living close to jobs, shops, and services. This target has facilitated a significant increase in the ratio of infill development compared to greenfield development in Greater Adelaide.
In recent decades, a large amount of development has occurred at major infill broadacre sites such as Mawson Lakes and Northgate. Now the focus is shifting to identifying new opportunities within established suburbs. Currently, about 80 per cent of Greater Adelaide’s new housing growth is in these established suburbs (AGD 2020).
Minor infill development16 (see Figure 3 for an illustrative example) is now playing a significant role in delivering the 30-Year Plan target, contributing about 40 per cent of the overall housing supply each year (AGD 2019). From 2012 to 2018, minor infill produced an average annual net increase of about 2,500 residential dwellings (AGD 2019). Figure 4 gives context to the role played by minor infill in recent housing supply.
The median allotment size of new development across Greater Adelaide has reduced significantly in recent years. In 2018/19, the median size of new allotments (detached and semi-detached) was 361m2, down from 518m2 in 1999/2000.
It has been observed that minor infill development is generally not occurring in a way that addresses urban tree canopy objectives. This is because infill development generally increases site coverage and driveway crossovers, and reduces space for gardens and tree planting, creating up to 90 per cent impervious surfaces. The implications of these trends for urban tree canopy are discussed in Section 2.2.
Refer to the extract from AGD’s People and Neighbourhoods Discussion Paper for further information about recent minor infill trends in Greater Adelaide (Figure 5 5).
16 Minor infill involves the demolition of dwellings and/ or the subdivision of land to generate new housing at the same or greater densities (up to 10 dwellings) on sites less than 4,000m2 (AGD 2019).
The 30-Year Plan for Greater Adelaide (2017 Update)
Containing our urban footprint and protecting our resources
85% of all new housing built in established urban areas by 2045

URBAN TREE CANOPY OPTIONS COST BENEFIT ANALYSIS 6 Pr epar ed by BDO EconSear ch
Figure 3 Examples of minor infill development
Source: AGD 2019a
Figure 4 Demand driven residential trends, Greater Adelaide
Source: AGD 2019a

URBAN TREE CANOPY OPTIONS COST BENEFIT ANALYSIS 7 Pr epar ed by BDO EconSear ch
Figure 5 Recent trends in minor infill development
Source: State Planning Commission, 2019a

URBAN TREE CANOPY OPTIONS COST BENEFIT ANALYSIS 8 Pr epar ed by BDO EconSear ch
2.2. Urban tree canopy trends in metropolitan Adelaide
The evidence is that most metropolitan Adelaide councils have experienced a decline in canopy cover. Across 19 LGAs, a national report (Amati et al. 2017) found a loss of tree and shrub canopy and increase in hard surfaces from 2013 to 2016 (Table 2-1). The analysis, which used i-Tree Canopy, found that 17 of the 19 councils assessed had a loss of green cover across private and public spaces combined over the period 2013 to 2016. Overall, tree cover has reduced from 21.5 per cent to 19.5 per cent across metropolitan Adelaide between 2013 and 2016.
Table 2-1 Changes in land surface cover from 2013-2016, Metropolitan Adelaide
Land surface type 2013 (%) 2016 (%) Change (%)
Tree canopy 21.37% 19.45% 1.92% loss
Shrub 5.92% 5.23% 0.69% loss
Grass 32.08% 32.10% 0.02% gain
Hard surface 40.63% 43.20% 2.57% gain
Source: Amati et al., 2017.
A number of metropolitan Adelaide councils have also undertaken more detailed analyses of changing tree canopy cover. For example, an i-Tree Canopy assessment of land cover was undertaken across the City of Charles Sturt (Seed Consulting Services 2016). Land cover was assessed at three points in time (1998, 2008, 2014) and across land tenures (private and public). Key findings include:
Between 2008 and 2014, impervious surfaces across the City increased significantly (from 55.25 per cent to 60.16 per cent), plantable space decreased (from 23.63 per cent to 19.38 per cent), and tree cover decreased (from 15.51 per cent to 14.28 per cent).
Changes in land cover across the City were driven primarily by changes on private land. For example, impervious surfaces increased by 6.5 per cent on private land, but only by 1 per cent on public land.
The implications of these combined results are that the rate of increase in green infrastructure on public land cannot keep up with the loss of trees and green cover due to infill development on private land. This trend is expected to exist in other council areas as reflected in the increase in hard surface area noted in Table 2-1.

URBAN TREE CANOPY OPTIONS COST BENEFIT ANALYSIS 9 Pr epar ed by BDO EconSear ch
2.3. Current policy framework
2.3.1. Urban green cover target and supporting policies
Target 5 of the 30-Year Plan is to increase urban green cover by 20 per cent by 2045. This target recognises the many benefits of green cover to urban cooling, the character, biodiversity and liveability of our suburbs, and our physical and mental health. This target is at significant risk, as outlined in Section 2.2.
The 2017 Update was the first time a target was introduced to measure progress in this area. The target includes the following detail:
For council areas with less than 30 per cent tree canopy cover currently, this should be increased by 20 per cent by 2045
For council areas with more than 30 per cent tree canopy cover currently, this should be maintained to ensure no net loss by 2045.
The 30-Year Plan also contains the following policy to support investment in green infrastructure in areas subject to infill development:
Promote permeable, safe, attractive, accessible and connected movement networks (streets, paths, trails and greenways) in new growth areas and infill redevelopment areas that incorporate green infrastructure (Policy 28).
Developing a new, more accurate baseline
AGD, DEW and the Regional Climate Partnerships have recently collaborated to develop a more accurate, finer grained baseline for urban tree canopy cover in metropolitan Adelaide. The tree canopy model uses high-resolution LiDAR laser surveying, rather than the i-Tree Canopy software. Due to the multiple spatial products LiDAR can produce, and the better accuracy of the results, it is likely that AGD will use this 2020 model as the new baseline for the 30-Year Plan target.
See Figure 6 for a snapshot of the new results, released in April 2020.
2.3.2. Current policy for tree canopy in minor infill development
In South Australia, where a proposed development meets certain criteria, it is assessed under the Residential Code. Otherwise, the development is assessed under the relevant Development Plan. There are no provisions for landscaping in the current Residential Code. Landscaping provisions vary significantly in the current Development Plans but don’t include a specific tree planting requirement for minor infill.
The 30-Year Plan for Greater Adelaide (2017 Update)
A Green Liveable City
20% increase in urban green cover in metropolitan Adelaide by 2045

URBAN TREE CANOPY OPTIONS COST BENEFIT ANALYSIS 10 Pr epar ed by BDO EconSear ch
Figure 6 New baseline data for tree canopy in metropolitan Adelaide (Aerometrex, 2020)

URBAN TREE CANOPY OPTIONS COST BENEFIT ANALYSIS 11 Pr epar ed by BDO EconSear ch
2.4. Future policy framework
2.4.1. Overview of the South Australian planning reforms
The Planning, Development and Infrastructure Act 2016 (the Act) is being progressively introduced to enable a more efficient, responsive and effective planning system.
Concerns about climate change, liveability, stormwater management, increasing health costs and declining biodiversity are driving an increased interest in green infrastructure and the many co-benefits it provides. Green infrastructure, particularly tree canopy, has been a significant area of interest for the State Planning Commission (the Commission), and the State Planning Policies on Climate Change and Design Quality reflect this.
State Planning Policies provide the high-level goals and requirements for the new planning system, which Regional Plans and the Planning and Design Code must respond to.
The 30-Year Plan has transitioned over as a Regional Plan.
The Code will replace the complex and at times inconsistent planning rules found within the 72 Development Plans currently in use. Establishing the Code presents an opportunity to refine and improve green infrastructure policies to meet the State Planning Policies and Regional Plan targets.
Draft policy directions were included in the Commission’s Natural Resources and Environment and People and Neighbourhood Discussion Papers (released for consultation in August 2018 and September 2019 respectively). Draft Code policies were prepared in response, and were out for formal public consultation until 28 February 2020. These include both ‘performance outcomes’ and ‘deemed-to-satisfy’ provisions (see breakout box) for minor infill developments to provide tree canopy onsite.
2.4.2. Draft Code policy for tree canopy in minor infill development
There is a Performance Outcome relating to tree planting (see below) included in the Draft Code for infill development (SPC 2019c).
The proposed Performance Outcome 21.2 for tree planting that:
Contributes to shade and shelter Improves the outlook for occupants of buildings Reduces the mass of buildings Contributes to biodiversity Mitigates urban heat Improves the amenity and character of streetscapes and contributes to attractive vistas.
One way to achieve this Performance Outcome is for tree planting to be provided in accordance with the proposed DTS 21.2, which is essentially to provide one tree (or equivalent) on each allotment that is small, medium or large depending on allotment size. Discounts apply for retaining existing trees and associated soil area. Our analysis indicated that most potential minor infill developments would occur on allotments that are between 200m2 and 400m2 in size, so infill households are most likely to have a requirement to plant or retain one small tree, 4-6m in height.
Planning and Design Code A performance-based planning system
Performance Outcomes (PO) are used in the Code to clearly describe the outcome being sought by the policy.
Deemed-to-Satisfy (DTS) provisions are clear and measurable criteria that have been assessed as one way to achieve a performance outcome. These criteria are designed to make policies easier to interpret and implement, but applicants can always choose to meet the performance outcome another way.
Source: DPTI 2019b

URBAN TREE CANOPY OPTIONS COST BENEFIT ANALYSIS 12 Pr epar ed by BDO EconSear ch
In detail, the proposed DTS 21.2 provides for:
Tree size and number required per dwelling according to allotment size (Table 2-2 and Table 2-3) Discounts apply for existing trees retained on the allotment and are not a species identified in
Regulation 3F(4)(b) of the Planning, Development and Infrastructure (General) Regulations 2017 which are invasive/nuisance species (Table 2-4)
Smaller trees can be substituted for larger trees in accordance with equivalent planting rates (Table 2-5).
Table 2-2 Tree size and number required per dwelling, proposed DTS 21.2
Allotment size Tree sizea and number require per dwelling
Less than 450m2 One small tree
450-800m2 One medium tree
800m2 and greater One large tree
a Refer to Table 2-3 for tree size requirements.
Source: Draft Planning and Design Code, SPC 2019c.
Table 2-3 Tree size, proposed DTS 21.2
Tree size Mature height Mature spread Minimum soil area
Small 4-6m 2-4m 10m2 and minimum dimension of 1.5m
Medium 6-12m 4-8m 30m2 and minimum dimension of 2m
Large Greater than 12m Greater than 8m 60m2 and minimum dimension of 4m
Source: Draft Planning and Design Code, SPC 2019c
Table 2-4 Retained tree discounts, proposed DTS 21.2
Retained tree height Retained tree spread Retained soil area within development site Discount applied
4-6m Less than 4m 10m2 and minimum dimension of 1.5m Two small trees
6-12m 4-8m 30m2 and minimum dimension of 2m Two medium trees
Greater than 12m Greater than 8m 60m2 and minimum dimension of 4m Two large trees
Source: Draft Planning and Design Code, SPC 2019c
Table 2-5 Tree size equivalents, proposed DTS 21.2
Tree sizea Equivalent planting
Medium Two small trees
Large Four small trees or two medium trees
a Refer to Table 2-3 for tree size requirements. Source: SPC 2019c.

URBAN TREE CANOPY OPTIONS COST BENEFIT ANALYSIS 13 Pr epar ed by BDO EconSear ch
2.5. Research on the costs and benefits of urban trees
This analysis draws and builds on background evidence gathering work undertaken by AGD. See Appendix 1 for a summary of the relevant investigations.
2.5.1. Benefits of urban trees
Beyond its amenity and biodiversity value, green infrastructure provides critical services that make cities healthier and more liveable (Pittman et al. 2015). Tree canopy cover in particular is receiving increasing attention from urban planners and land managers nationally and internationally. This is due to trees now being widely recognised for providing multiple benefits (Natural Resources Adelaide and Mount Lofty Ranges 2018), including:
Improved human physical, psychological and social health and wellbeing Enhanced liveability through improving amenity and air quality, and noise abatement Climate change mitigation through carbon sequestration in plants Climate change adaptation through reduction of the urban heat island effect by shading and
transpiration, and providing protection from extreme weather events such as heatwaves and storms Buffering from exposure to extreme storms and winter weather Better water management, through reduced stormwater run-off and flooding, increased soil
infiltration and groundwater recharge and improved water quality Healthy urban ecology conserving, creating and linking, habitat for flora and fauna Local food production e.g. private, school kitchen, verge and community gardens and urban
orchards and farms Broader economic benefits from enhanced commerce and property values, health care and energy
savings, and ecosystem services.
Further information on some of these benefits is presented in Table 2-6. A more detailed description of the broader benefits of green infrastructure is provided in the Adoption Guidelines for Green Treatment Technologies (Fowdar et al. 2018), in Pittman et al. (2015) and in Appendix 1.
Given that trees are long-lived and provide a number of benefits, it is being increasingly recognised that trees should be considered as assets, the same way livestock, buildings and employees are considered assets. Trees should be considered appreciating assets, as their replacement value and the services they provide increase over time.
Table 2-6 Examples of benefits of green infrastructure in cities
Benefit type Description
Urban cooling Trees have been identified as a highly effective mechanism for cooling the local environment through shading and evapotranspiration. The cooling effect of trees can benefit human health and general comfort either directly (e.g. direct shading or reducing solar radiation reflectance from pavements and buildings) or indirectly (e.g. reducing exacerbation or complication of existing illnesses) (Shashua-Bar, Pearlmutter and Erell 2011). A study in the City of Melbourne reported that every 10% increase in tree cover results in a 0.5-1ºC cooling of land surface temperatures; and other studies have shown that tree shading can cool air temperatures up to 4ºC (compared to unshaded areas), and cool soil surface temperatures by between 3-12ºC (Coutts, Broadbent, et al. 2014, Lin and Lin 2010, Armson, Rahman and Ennos 2013). Coolstreets (LGNSW 2016) undertook a study with several neighbourhoods in Sydney and estimated that a neighbourhood of 40 houses on a street with trees reduced their electricity use (through less use of air-conditioning in summer) by 10,651kWh per year, compared to a similar street without street trees.
A recent study in Western Adelaide assessed the effects of trees and other vegetation in people’s yards at reducing day time and night time heat during an extreme heatwave event. Despite covering about 20% of urban land, people’s yards contained more than 40% of the total tree cover. The number of private gardens, as well as the percentage of vegetation cover within these gardens, both contributed significantly in providing widespread cooling benefits across the Western Adelaide region with localised reductions in land surface

URBAN TREE CANOPY OPTIONS COST BENEFIT ANALYSIS 14 Pr epar ed by BDO EconSear ch
Benefit type Description
temperatures of up to 5-6˚C compared to non-vegetated areas and land parcels (Ossola et al. 2020).
Improved air quality According to The World Health Report 2013 (Dye 2013), air pollution is one of the main environmental risk factors affecting human health. Trees play an important role in filtering and cleaning the air of harmful gaseous and particulate pollutants, via uptake through leaves and interception and accumulation of particles on the plant surface (Nowak, et al. 2014, Davern et al. 2017), Kardan et al. 2015).
Physical health Studies have reported a range of additional physical health benefits for adults and children in relation to trees, such as: decreased mortality (Donovan, et al. 2013), increased longevity for senior citizens (Takano, Nakamura and Watanabe 2002), decreased cardio metabolic conditions (Kardan et al. 2015, Astell-Burt & Feng 2019a), lower risk of asthma development in children (Lovasi, et al. 2008, Sarajevs 2011), enhanced motor skill development in children (Fjortoft 2001), increased physical exercise and sleep quality (Grigsby-Toussaint, et al. 2015, Astell-Burt & Feng 2019b) and decreased sun (UV) exposure (Parsons, et al. 1998, Sarajevs 2011, Ely & Pitman 2012).
Mental health Australian-based research even suggests that neighbourhood ‘greenness’ is more important for influencing mental health than physical health (Sugiyama, et al. 2008).
Residents living closer to and with greater exposure to green space are significantly less likely to suffer poor mental health (e.g. Beyer et al. 2014, Richardson et al. 2013).
A systematic review found that children exposed to greenspace achieved greater mental well-being, reduced hyperactivity and inattention problems, and in adolescents and young adult less depressive symptoms outcomes (Vanaken and Danckaerts 2018).
Place making and increased economic value (amenity)
Several Australian studies have shown that living near to trees in public places, in particular street trees, can increase property prices. For example, Pandit et al. (2013) found being on a street with street trees increased the median property price in Perth by 1.9% and Plant et al. (2017) found that houses in Brisbane with street tree canopy cover of 50% increased the median house price by 5.05%.
Stormwater management
Vegetation plays a critical role in the natural water cycle, modifying rainfall inflows, soil infiltration and groundwater recharge, and patterns of surface runoff (Ely & Pitman 2014) and can ameliorate the impacts of urbanisation on stormwater management.
A 1996 study of stormwater management costs, showed that the urban forest provided stormwater management benefits valued at US$15.4 million in Milwaukee, Wisconsin, and US$122 million in Austin, Texas, by reducing the need for constructing additional retention, detention and treatment capacity (MacDonald 1996). Brisbane City (2013) estimated that the Brisbane street tree population intercepted and infiltrated 635,733m3 of stormwater providing stormwater management services worth $1,444,533/yr.
Biodiversity Trees can provide, for example, food, shelter, habitat, protection from predators, movement corridors to a range of plant, animal and fungal biodiversity. Healthy biodiversity plays a fundamental role in the functioning of ecosystems and their ability to deliver long-term ecosystem services, with biodiversity loss an issue of increasing global concern. Nature and biodiversity in cities contribute to our human sense of place, identity and psychological well-being. Green Infrastructure supports biodiversity by creating or conserving habitat patches linked by corridors, thereby reducing habitat fragmentation. While the ‘urban nature’ found in cities may be different from ‘wild nature’, it still contributes to healthy ecosystem function and has both intrinsic and human well-being values (Ely & Pitman 2014).
2.5.2. Costs of urban trees
There can be adverse tree impacts that need to be managed. For example, tree root growth can cause damage to kerbs, paving, foundations and other underground infrastructure; leaf litter can accumulate in gutters and drains; falling branches can cause risk to people, buildings and fences; and provision for trees may influence the footprint of buildings on small blocks. In many instances, adverse impacts reflect poor tree selection and/or poor site preparation and can be avoided e.g. selection of a tree that is too large for the site or irrigation is insufficient to prevent extensive surface root growth (Seed Consulting et al. 2019).
The ‘tree effect’ is also an important consideration for a structural engineer when they are designing the footings for a house. Factors they consider include the footing type, size of house, construction type, size of the tree at mature height, and distance away from the dwelling. The type of soil also has an important

URBAN TREE CANOPY OPTIONS COST BENEFIT ANALYSIS 15 Pr epar ed by BDO EconSear ch
impact - sandy soils are better at accommodating trees from a footing perspective than highly reactive soils. These variables mean that there is no single design for house footings to factor in the tree effect, and therefore no single price for the impact of a tree on the cost of the footings. These issues are explored further in Section 2.6.
2.5.3. Study limitations
A cost benefit analysis has limitations. It can only include costs and benefits that are quantifiable in dollar terms, backed by the best available, relevant and defensible information. These limitations are greater when assessing the impact of policies that have costs and benefits that are not readily quantifiable from the available research.
Many of the benefits attributed to green cover are not readily expressed financially, and as a result, often go unquantified in dollar terms. There are a multitude of studies that have identified the link between urban trees and social benefits (see Table 2-6), but it is a challenge to find suitable studies from which to transfer values, without risk of misapplication. We have been careful and conservative in the values we have transferred from other studies to use in this study.
Some well-researched benefits that could not be defensibly quantified have therefore been excluded. These include structural values, biodiversity values, urban heat mitigation, and some physical and mental health benefits (more detail on physical and mental health benefits and structural values of trees is provided below). Nuisance costs have also been excluded due to a lack of defensibly quantifiable evidence, and because nuisance effects are generally associated with larger trees than those required under the proposed Code policy.
Physical health benefits
We have only quantified a limited sub-set of physical health benefits associated with a reduction in air pollution. There is a substantial literature which identifies and quantifies, in biophysical terms, the association between green infrastructure and mental and physical health outcomes. What is less readily available, is translating those biophysical outcomes to defensible dollar values. An example of a method that has achieved this is the i-Trees Eco tool. This tool puts a dollar value on human health outcomes from air pollution reduction provided by trees absorbing air pollutants nitrous oxide, sulphur dioxide and ozone. Valuing the human health outcomes is based on avoided health care expenses from non-exposure to these pollutants, avoided productivity losses associated with specific adverse health events and the avoided mortality based on the value of a statistical life (Nowak et al. 2014). The method, developed in the USA, has been adapted for Australian conditions and local examples are available (e.g. Seed Consulting 2018). The method requires tree canopy data, tree species, tree health assessment and local air quality data. Within the timeframe and resources available to this study it was only possible to undertake desktop analyses using existing studies (e.g. Seed Consulting 2018), where benefit values have been estimated and could be reasonably used in this study. Other physical health benefits have been excluded.
Mental health benefits
The prevalence of mental health issues generates significant economic cost on individuals, their employers and the community more broadly. In the workplace, for example, employees with mental illness are more likely to be absent from work and less productive when at work (KPMG and Mental Health Australia 2018). This has a flow-on effect at a macroeconomic level where mental health costs to the economy were an estimated $66 billion17 in 2019. These significant costs are forecast to increase six-fold over the next 30 years (Doran and Kinchin 2019).
17 Originally published in VISES (2016) as $56.7 billion for 2014, adjusted for inflation and population growth over the per iod 2014 to 2019.

URBAN TREE CANOPY OPTIONS COST BENEFIT ANALYSIS 16 Pr epar ed by BDO EconSear ch
Cox et al. (2017) notes that experiences with nature provide many mental health benefits, particularly for people living in urban areas. They demonstrate quantifiable associations of mental health with the characteristics of nearby vegetation. Ely and Pitman (2012) found that contact with nature can help children, and people in general, deal with stress. Natural outdoor settings have been shown to provide restoration from cognitive effort and stress (Kaplan and Kaplan 1989; Kaplan 1995), and one study in rural United States found that that the presence of vegetation near a home helped to moderate the impact of stressful life events on the psychological wellbeing of children (Wells and Evans 2003).
An important step for this analysis was to translate the improved mental health outcomes generated by the presence of vegetation near a home into economic outcomes. This entails applying a methodology to place an economic value on the direct, indirect and intangible health costs associated with the improved health outcomes.
Analysis by Cox et al. (2017) undertook an analysis to estimate the association between neighbourhood vegetation cover and levels of depression, anxiety and stress. The benefits from these associations “may be gained from intentionally interacting with nature (e.g. through visiting neighbourhood green spaces or spending time in a garden), from incidental interactions whereby people are exposed to nature as they engage in other activities (e.g. walking to the shops), or indirectly while not actually being present in nature (e.g. viewing it through a window)” (Cox et al. 2017, p.147). This analysis, combined with research from the Victorian Institute of Strategic Economic Studies (VISES 2016), was used to estimate and assign values for the impact of trees on avoided mental health costs associated with severe depression and anxiety (see Section 3.3.10). Other mental health benefits have been excluded.
Structural value
Given that trees are long-lived and provide a number of benefits, it is being increasingly recognised that trees should be considered as assets, the same way that livestock, buildings and employees are considered assets. Trees should be considered appreciating assets, as their replacement value and the services they provide increase over time.
In some industries, such as forestry, their capital valuation and treatment on corporate balance sheets is a well-established process. Local governments and other owners of trees in the public realm are increasingly putting a value on their tree assets to ensure proper accounting and management resourcing.
In cost benefit analysis, capital assets may still be capable of providing a future flow of benefits if they are not at the end of their useful life by the end of the analysis period. This is generally considered as the residual value of that capital, and is accounted for in the analysis. Typically, the residual value of capital is the replacement price of a ‘like-for-like’ item of capital, e.g. the residual value of a stormwater pipe with 20 years of useful life remaining at the end of the analysis period is the price that would be paid for an equivalent stormwater pipe with 20 years of useful life remaining.
The Seed Consulting (2018) study valued the structural value of trees, sometimes referred to as the ‘replacement value’, using a replacement cost based on the Council of Tree and Landscape Appraisers formulae in the i-Tree Eco tool.
This study used the structural value of trees using the method and appropriate values from the Seed Consulting (2018) study as part of the tree offset payments under Option 2 (see Section 3.3.3). It was, however, excluded as a benefit from the broader analysis as its application in this context was considered novel and untested.

URBAN TREE CANOPY OPTIONS COST BENEFIT ANALYSIS 17 Pr epar ed by BDO EconSear ch
2.6. House footings and the ‘tree effect’
One of the concerns raised in consultation on the Code was the potential impact of tree planting on upfront housing affordability, as a result of higher footing costs. Addressing these concerns was a key focus of this report.
To inform this study, AGD commissioned independent advice from several structural engineering firms (including TMK Consulting Engineers) on the effect of a tree on house footings costs (costs are outlined in Section 3.3.1). The advice can be summarised as follows:
Structural engineers will design house footings to factor in a ‘single tree effect’ if the distance between the dwelling and the tree is 1x the mature height of a single tree (in the case of one or two trees); or to factor in a ‘group tree effect’ if the distance between the dwelling and the trees is 1.5x the mature height of a group of trees (in the case of three trees close together) (AS2870-2011 Residential Slabs and Footings). See Figure 7 and Figure 8 for explanatory diagrams.
However, if a tree is within the tree effect zone, the required footing depth can be influenced by a number of other factors e.g. soil type, construction method, the height of the tree at maturity, the number of other trees present, and the type and shape of footing. Therefore the cost impact of trees on footings is highly variable.
There are five main soil types in Greater Adelaide, ranging from least reactive (sandy) to most reactive (clay). For less reactive soils, a tree (even planted quite close to a house) would have only a low impact on footing thickness (and therefore cost), while more reactive soils, the cost is much greater. See Section 2.6.1 for more information on soils.
In an established urban area, it is estimated that house footings will already have to be designed to accommodate the impact of offsite trees in 75 per cent of cases, regardless of the tree policy (see Section 3.4.5).
Usually there is already a street tree and sometimes there is one or more neighbouring site trees within the tree effect zone of the new dwelling. Adding the proposed new tree (to the front garden for example) will often not add an additional footing design cost as the new dwelling would have to accommodate for a ‘single tree effect’ or ‘group of tree effect’ cost already. Further, many households already choose to retain existing trees or plant new trees when undertaking infill developments. Refer to the Glengowrie case study for further information. For example, our case study found that 58 per cent of households already choose to retain existing trees or plant new trees when undertaking infill developments (see Section 3.4.4).
Therefore, in the majority of cases, house footings will have to be designed to accommodate trees, regardless of the proposed ‘One Tree Policy’.
It is also prudent for home owners to consider that new trees in the future may be planted on neighbouring sites or in the public verge outside their house (within the zone of effect on their footings) therefore it is important to make sure that their house footings are not under designed.

URBAN TREE CANOPY OPTIONS COST BENEFIT ANALYSIS 18 Pr epar ed by BDO EconSear ch
Source: TMK Consulting Engineers 2019
Source: TMK Consulting Engineers 2019
2.6.1. Impact of soil type on the ‘tree effect’
In cases where a new house footing cost may be incurred due to the tree effect, soil type is a significant factor in the magnitude of the cost impact (see Section 3.3.1 for estimated costs).
In Greater Adelaide there are five main soil types, ranging from least reactive (sandy) to most reactive (clay). They are classified as S, M-D, H2-D, H1-D and E-D, in order of least to most reactive. More reactive soils generally have a higher impact on footings, and less reactive soils a lower impact. However, the relationship is not necessarily linear (see Section 3.3.1 for independent costings). Distribution of soil types is highly variable across Greater Adelaide.
Figure 7 The criteria for determining if a single tree will influence a building footing system
Figure 8 The criteria for determining if a group tree effect will influence a building footing system

URBAN TREE CANOPY OPTIONS COST BENEFIT ANALYSIS 19 Pr epar ed by BDO EconSear ch
A comprehensive soil map for all areas of Greater Adelaide is not readily available. However, TMK Consulting Engineers, a prominent engineering firm in Adelaide, has produced an online map capturing the soil tests they have undertaken in the Adelaide area18. They kindly provided this data to the AGD Spatial Analyst Team for the purposes of this study, which has enabled production of Table 2-7 and Figure 9, showing how the soil types are distributed across Greater Adelaide.
While only 4,106 soil sample points are available, the data does provide a reasonably representative sample and some indication of the spatial distribution of the five soil types (S, M-D, H2-D, H1-D and E-D)19.
The results show that many areas have a range of soil types, and there are two soil types that are most predominate in Greater Adelaide (H1-D and M-D). H1-D is more reactive, and M-D is less reactive.
18 Available online at http://www.tmkmaps.com.au/SoilMovement/ 19 Not all LGAs are well represented in the data, as it depends on where TMK has undertaken work as well as other factors like levels of infill development and natural features such as the Adelaide Hills.

URBAN TREE CANOPY OPTIONS COST BENEFIT ANALYSIS 20 Pr epar ed by BDO EconSear ch
Table 2-7 Distribution of soil types across local government areas, based on TMK soil samples (number of samples)
LGA E-D % H2-D % H1-D % M-D % S % Total
Adelaide City 1 100% 1
Adelaide Hills 1 2% 18 35% 22 42% 11 21% 52
Adelaide Plains Council 1 2% 5 11% 29 64% 10 22% 45
Campbelltown 43 43% 18 18% 31 31% 7 7% 1 1% 100
Burnside 2 13% 7 44% 4 25% 2 13% 1 6% 16
Charles Sturt 54 19% 155 55% 74 26% 283
Holdfast Bay 1 3% 12 33% 18 50% 5 14% 36
Marion 24 9% 54 21% 116 45% 37 14% 28 11% 259
Mitcham 14 22% 6 9% 28 44% 12 19% 4 6% 64
Onkaparinga 62 7% 85 10% 314 38% 270 32% 105 13% 836
Playford 21 3% 76 10% 450 62% 162 22% 20 3% 729
Port Adelaide Enfield 164 36% 50 11% 52 11% 126 27% 68 15% 460
Prospect 2 12% 2 12% 4 24% 6 35% 3 18% 17
Salisbury 14 3% 7 2% 284 62% 151 33% 4 1% 460
Tea Tree Gully 40 27% 17 12% 36 24% 34 23% 20 14% 147
Unley 3 20% 2 13% 8 53% 2 13% 15
West Torrens 8 8% 41 40% 33 32% 20 20% 102
Light 5 6% 7 9% 22 27% 40 49% 8 10% 82
Mount Barker 4 2% 15 7% 127 56% 63 28% 17 8% 226
Norwood Payneham and St Peters 2 9% 7 32% 11 50% 2 9% 22
Walkerville 2 29% 5 71% 7
Gawler 1 1% 4 3% 68 46% 61 41% 13 9% 147
Total 402 10% 374 9% 1,714 42% 1,214 30% 402 10% 4,106

URBAN TREE CANOPY OPTIONS COST BENEFIT ANALYSIS 21 Pr epar ed by BDO EconSear ch
Figure 9 Distribution of soil types across Greater Adelaide, based on TMK soil samples

URBAN TREE CANOPY OPTIONS COST BENEFIT ANALYSIS 22 Pr epar ed by BDO EconSear ch
2.7. Offset schemes
A new feature of the Planning, Development and Infrastructure Act 2016 is the capacity to establish other schemes, beyond existing carpark funds, for ‘off-setting contributions’. An offset scheme would allow councils to accept financial contributions from infill households, in-lieu of them complying with tree canopy provisions under the Code.
This would mean that where green cover outcomes cannot be met on an infill site, the infill household can instead choose to make a payment into a council-managed offset scheme, which would provide those tree outcomes offsite on public land. Preferably this would be in the local streetscape to ensure that the benefits are retained locally (Seed Consulting et al. 2019), however this may not be practical in every case. Establishing an offset scheme would also require identification of appropriate governance, ownership requirements and maintenance obligations (Seed Consulting et al. 2019).
Spatial issues
There would also need to be enough plantable public within the LGA, or across Greater Adelaide, to achieve desired landscape-scale outcomes like the 30-Year Plan target. The evidence is that there is not enough space on public land to keep up with the loss of trees and green cover due to infill development on private land (see Section 2.2).
Even if landscape-scale targets are able to be met, an offset scheme could result in localised loss of tree cover. If outcomes cannot be generated locally, infill households and the local community will miss out on the benefits of green cover (e.g. urban cooling, higher house values).
Pricing issues
An accurate valuation of trees would need to be ascertained if infill households are to contribute to the costs of:
Re-instating tree cover that has been removed during the development process, or Providing tree cover outcomes on public land in lieu of providing them on private land.
There is currently a 3 x $94 fee for removing a significant tree and 2 x $94 fee for removing a Regulated tree on private land (under the Development Regulations 1993). Fees are generally consolidated in a council-managed tree fund and used to maintain the health of existing trees (Seed Consulting et al. 2019). Feedback from council staff is that these fees fall well short of both the re-instatement cost of trees (especially mature trees), and their structural value as an appreciating asset (Seed Consulting et al. 2019).
A range of methods have been developed internationally and in Australia that can be used to determine the value of trees. In Australia these include:
Revised Burnley method (Moore 2006): This is widely used around Australia, including by councils and arborists. Tree value is determined based on tree size, useful life expectancy, form and vigour, and location.
City of Melbourne method: Where removal of a tree on public land is approved by Council’s arborist in relation to a development, the tree value and removal cost is paid by the developer prior to its removal. The payment includes:
o Removal Costs: Costs incurred by Council for physically removing the tree
Case study: Native Vegetation
South Australia has experience with offsetting trees, through clearance management under the Native Vegetation Act 1991. Where significant clearance of native vegetation is proposed on a property (i.e. due to mining or major greenfield developments), there is often a requirement to offset this clearance. This may be done by protecting a separate area for conservation, or by paying into a fund.
The offset must provide a ‘Significant Environmental Benefit’, which means the gain needs to be over and above the loss caused by clearance. A similar approach could be adopted for urban green cover.

URBAN TREE CANOPY OPTIONS COST BENEFIT ANALYSIS 23 Pr epar ed by BDO EconSear ch
o Amenity Value: Calculated in accordance with Council’s Amenity Formula o Ecological Services Value: Calculated in accordance with the i-Tree valuation tool o Reinstatement Costs: Costs incurred by Council in providing green infrastructure to replace
loss to the landscape incurred by the removal. City of Sydney method: Tree value is determined based on the cost of planting a 200 litre
(container size) tree in the City, age of the tree since planting, size of the tree, diameter of the tree trunk, condition of the tree, life expectancy of the tree, visibility of the tree from public areas, heritage status of the tree, and ownership of land where the tree is growing.
Application of these valuation methods for removal of trees on public land can generate values in the range of a few thousand dollars for small mature trees through to tens of thousands or more for large mature trees (see for example, Seed Consulting (2018)). As such, in current practice, there is at least an order of magnitude difference in the value placed on a tree on public land compared with private land.

URBAN TREE CANOPY OPTIONS COST BENEFIT ANALYSIS 24 Pr epar ed by BDO EconSear ch
3. STUDY APPROACH
As described in Section 1.1, this work sits within the context of the public consultation process for Phase 3 (Urban Areas) of the Planning and Design Code. A stakeholder reference group provided input and advice into the scope of this work. The consultation, review and evidence gathering process is described in Section 1.
Other key information sources include:
Analysis of infill housing statistics for this study provided by AGD’s Planning Research Analysis Unit The INFFEWS Value Tool, kindly made available for use by this study by the CRC for Water Sensitive
Cities Seed Consulting Services 2019, Perspectives on Performance-based Planning Provisions and
Assessment Frameworks for Green Infrastructure and WSUD, in association with DesignFlow, Ekistics and CRC for Water Sensitive Cities, prepared for Water Sensitive SA
Seed Consulting Services 2018, Valuing the Trees of Hazelwood Park, An i-Tree Eco Assessment, prepared for the City of Burnside
List of studies concerning the relationship between physical and mental health and green infrastructure compiled by Dr Tahna Pettman, Department of Health (see Appendix 1).
A full list of references is provided in this report.
3.1. Method of Analysis
This cost benefit analysis (CBA) was undertaken according to the principles and method outlined in South Australian and Australian Government guidelines for conducting evaluations of public sector initiatives (Department of Treasury and Finance (2008) and Department of Finance and Administration (2006)).
The key characteristics of the CBA method employed in this study include the following:
The CBA includes a base case or counterfactual scenario, that is, the benchmark against which the Options were compared. The base case was defined as current requirements for trees in infill developments under the current Residential Code and Development Plans (Section 2.3.2)
The CBA was conducted over a 25-year time period and results were expressed in terms of net benefits, that is, the incremental benefits and costs of the options relative to those generated by the base case scenario20
Costs and benefits were specified in real terms (i.e. current 2020 dollars). Past and future values were converted to present values by applying a discount rate of 6 per cent
In order to account for uncertainty, a sensitivity analysis was undertaken using a range of values for key variables
The evaluation criteria employed in the analysis are net present value (NPV)21 and benefit-cost ratio (BCR)22
Costs and benefits for the option and base case scenarios have been listed in tabular form and include those that can be readily identified and valued in monetary terms as well as those which
20 Where incremental benefits = (option benefits – base case benefits) and incremental costs = (option costs – base case costs). 21 NPV is defined as discounted net benefits, where net benefits = (incremental benefits – incremental costs).
22 BCR is defined as (discounted incremental benefits) / (discounted incremental costs).

URBAN TREE CANOPY OPTIONS COST BENEFIT ANALYSIS 25 Pr epar ed by BDO EconSear ch
cannot be easily valued in monetary terms because of the absence of market signals 23. The tables also provide an indication of the likely distribution of the costs and benefits between stakeholder groups and the source of the information.
The cost benefit analysis was undertaken at two levels:
At the community level – expected costs and benefits (both monetary and non-monetary) accruing to people (households, businesses and government) and the environment across Greater Adelaide24, as a result of the proposed options.
At the individual household level – expected cost and benefits (monetary only) accruing to the household undertaking the development, as a result of the proposed options.
3.2. Scope of the cost benefit analysis
3.2.1. Policy options analysed
The cost benefit analysis tested two policy options against the base case. The purpose of this approach is to test whether the Draft Code proposals stack up against the current South Australian policy requirements (see Section 2.3.2). Multiple scenarios were tested under each option to enable assessment of whether policies should be adjusted in specific scenarios.
The base case and policy options analysed were:
Base Case Scenario – Current (‘business as usual’) scenario No tree planting provision. There are no provisions for landscaping in the current Residential Code. Landscaping provisions vary significantly in the current Development Plans but don’t include a specific tree planting requirement for minor infill.
Option 1 – One onsite tree per allotment (Draft Code policy) The proposed deemed-to-satisfy25 provision for minor infill to provide one tree (or equivalent) on each allotment, which is small, medium or large depending on allotment size. Discounts apply for retaining existing trees and associated soil area.
Option 2 – Offset scheme Applicants can choose to meet the one tree provision on their own allotment, or have the same outcome achieved offsite on public land, funded by an offset scheme.
3.2.2. Costs and benefits considered
Monetary costs and benefits considered include those that are direct (e.g. buying a tree) and those that are indirect (e.g. reduced demand for electricity). Non-monetary costs and benefits were also considered (e.g. amenity value of trees). The analysis only includes costs and benefits that are quantifiable in dollar terms, backed by the best available, relevant and defensible information. It likely captures a conservative estimate of the benefits, due to the rigorous and transparent approach taken to quantify benefits in financial terms. We have preferenced South Australian and then best practice Australian data sources.
The costs and benefits of options were measured using a ‘with’ and ‘without’ framework, that is, quantification of the incremental changes associated with the option compared to the base case scenario. A zero value indicates there is no change to accrued costs or benefits compared to the base case. A
23 The analysis only includes costs and benefits that are quantifiable in dollar terms, backed by the best available, relevant and defensible information. It likely captures a conservative estimate of the benefits, due to the r igorous and transparent approach taken to quantify benefits in financial terms. We have preferenced South Australian, then best practice Australian data sources. 24 Gawler, Port Adelaide Enfield, Tea Tree Gully, Charles Sturt, Prospect, Walkerville, Campbelltown, Adelaide, Norwood Payneham Dt Peters, West Torrens, Unley, Burnside, Holdfast Bay, Mitcham, Marion, Salisbury, Playford, Adelaide Hills, Mt Barker, Onkaparinga, Adelaide Plains (part of) and Light (part of). 25 A deemed to satisfy policy is a measurable cr iter ia which is one way of meeting a performance outcome in the Planning and Design Code. Applicants can instead choose alternative solutions that meet the relevant performance outcome.

URBAN TREE CANOPY OPTIONS COST BENEFIT ANALYSIS 26 Pr epar ed by BDO EconSear ch
negative cost indicates an avoided cost (i.e. a benefit) compared to the base case, and a negative benefit indicates a lost benefit (i.e. a cost) compared to the base case.
The major economic costs and benefits of the options are listed in Table 3-1 and Table 3-2, respectively. The method, data sources and assumptions used to quantify these values are described in Section 3.1. Consideration was given to those benefits and costs likely to occur over a 25-year period.
Table 3-1 Costs considered in the analysis
Option Description of Costs Bearer of Cost Valued in $
Terms
Source of
Information
Base Case House footings Infill household Yes AGD
Onsite tree planting & maintenance Infill household Yes Office for Design & Architecture SA
Options 1 & 2 House footings Infill household Yes AGD
Onsite tree planting & maintenance Infill household Yes Office for Design & Architecture SA
Offsite tree planting & maintenance costs
Local Government Yes Office for Design & Architecture SA
Offset scheme management Local Government Yes BDO EconSearch analysis
Offset scheme payments Infill household Yes BDO EconSearch analysis

URBAN TREE CANOPY OPTIONS COST BENEFIT ANALYSIS 27 Pr epar ed by BDO EconSear ch
Table 3-2 Benefits considered in the analysis
Option Description of Benefits Recipient of Benefit Valued in $
Terms
Source of
Information
Base Case Improved air quality Community Yes Seed Consulting 2018
Carbon removed Community Yes Seed Consulting 2018
Avoided stormwater runoff Community Yes Seed Consulting 2018
Avoided loss of stored carbon Community Yes Seed Consulting 2018
Reduced household electricity use Infill household Yes Cool Streets 2016
Options 1 & 2 Offset scheme receipts (Option 2) Local Government Yes BDO EconSearch analysis
Amenity value of trees Households adjacent to offset plantings
Yes Pandit et al. 2013
Improved air quality Community Yes Seed Consulting 2018
Carbon removed Community Yes Seed Consulting 2018
Avoided loss of stored carbon Community Yes Seed Consulting 2018
Avoided stormwater runoff Community Yes Seed Consulting 2018
Reduced household electricity use Infill household Yes Cool Streets 2016
Improved mental wellbeing Community Yes BDO EconSearch analysis

URBAN TREE CANOPY OPTIONS COST BENEFIT ANALYSIS 28 Pr epar ed by BDO EconSear ch
3.3. Quantifying the costs and benefits
3.3.1. Footing costs
To inform this study, AGD commissioned house footing costings from structural engineering firms for two case study dwelling types:
A 200m2 brick veneer detached single storey dwelling with a 6m tree (at mature height) planted 5m from the dwelling (refer to Figure 10)
A smaller 90m2 brick veneer two storey townhouse with a 6m tree (at mature height) planted 5m from the dwelling (refer to Figure 11).
The 6m tree was chosen as it is the maximum size of the deemed-to-satisfy provision for sites less than 450m2 in the Draft Code26. The dwelling types were chosen because they are common in infill developments in Greater Adelaide. However, it is important to note that applicants can also choose a 4 metre (at mature height) tree option which could be accommodated outside the ‘tree effect zone’ in zones such as the General Neighbourhood and Suburban Neighbourhood Zones.
TMK Consulting Engineers and PT Design designed a footing for the 200m2 detached dwelling. PT Design also prepared a design for the 90m2 townhouse. Centina Homes costed both dwelling types. The costings consider the impact of all five soil types in Greater Adelaide on residential footing design. This analysis used the ‘single tree effect’ costings as these are the ones most likely to be relevant to the Code’s single tree planting policy (refer to Section 2.6 for further information).
26 Our analysis indicated that most potential minor infill developments would occur on allotments that are between 200m2 and 400m2 in size.
Figure 10 Hypothetical 200m2 brick veneer detached single storey dwelling Figure 11
Hypothetical 90m2 brick veneer two-storey townhouse

URBAN TREE CANOPY OPTIONS COST BENEFIT ANALYSIS 29 Pr epar ed by BDO EconSear ch
The additional footing costs attributable to the newly planted trees are presented in
Table 3-327. These costs provided by the structural engineering firms are used in this analysis. Appendix 1 details the costings and general advice provided by the structural engineering firms.
As outlined in Section 2.6, many variables impact footing costs, and it is not possible to identify an exact cost for every possible scenario. For the purposes of the individual household cost benefit analysis, the least cost and greatest cost options were tested as scenarios so that the bounds of policy impact could be assessed. These costs do not necessarily align with the least and most reactive soils, but can generally be classified as ‘less reactive’ and ‘more reactive’.
Table 3-3 Additional costs to footings from single tree effects by soil type
Soil type Prevalence Case-study 1:
200m2 single storey detached dwelling
Case-study 2:
90m2 double storey townhouse
Estimate 1 Estimate 2 Average
S 10% $508 $1,497 $1,003 $588
M-D 30% $496 $699 $597 $601
H1-D 42% $3,484 $1,710 $2,597 $186
H2-D 9% $3,803 $3,469 $3,636 $2,377
E-D 10% $5,676 $1,537 $3,607 $1,085
Source: Centina Homes costings of hypothetical footing designs by TMK Engineers and PT Design Engineers, 2019 with soil type prevalence drawn from TMK Engineers’ soil sample points for metropolitan Adelaide
3.3.2. Tree planting and maintenance costs
Tree planting costs were based on estimates prepared by the Office for Design and Architecture SA. Using this data, it was assumed that the cost to an individual infill household to plant and establish a tree was $22028 per tree (applied to all options), and the cost for a tree to be planted and established offsite by a commercial contractor was $782 per tree (applied to Option 2).
Ongoing tree maintenance costs were based on Knox City Council’s published statistics (2016) for their maintenance program expenditures over a five-year period, and the estimated number of street trees in the council area. Annual costs per tree were derived and were updated to current dollars using all sectors CPI for Melbourne (ABS 2020). An annual tree maintenance cost of $30 per tree was applied.
Total tree planting and maintenance costs over the study period are therefore $603 on private land and $1,165 on public land.
27 ‘Single Tree Effect’: If one or two adjacent trees are less than their mature height from a dwelling than they should be designed to include ‘tree effects’, in accordance with AS2870-2011 Residential slabs and footings. ‘Group Tree Effect’: This occurs when there are three or more trees in a group, or a row of three trees (where tree spacing is less their mature height, otherwise consider as single trees). If a group of three trees are located less than 1.5m x mature height away from the dwelling they should be designed to include ‘tree effects’, in accordance with AS2870-2011 Residential slabs and footings. 28 Onsite tree planting and first year maintenance was based on ODASA 2020 Table 1 estimates, but with planting activities simplified and therefore the overall cost adjusted down from $261.50 to $220 per tree.

URBAN TREE CANOPY OPTIONS COST BENEFIT ANALYSIS 30 Pr epar ed by BDO EconSear ch
3.3.3. Offset scheme payments and management
Offset scheme development and management
A cost of $200,00029 was assumed to apply to the first year of the analysis for offset scheme development. Ongoing, annual scheme administration costs of $220,00030 was assumed. These costs apply to Option 2.
Offset scheme payments
It should be noted that this offset scheme has been developed for the purposes of this analysis and its formulation is intended to be illustrative only. It is consistent with the City of Melbourne method (see Section 2.7). Table 3.4 describes how the payment was estimated.
Offset scheme payments represent a cost to infill households and a benefit to offset scheme providers, and are, for the community level analysis, a transfer payment. These costs and benefits apply to Option 2.
The offset payment is made up of two components:
A payment for the loss of an existing tree that could have been retained to meet draft Code requirements
A payment for planting and maintaining a tree offsite to meet draft Code requirements.
The first component applies to the 40 per cent of infill households that have existing trees that they choose to remove. The second component applies to the 23 per cent of infill households that choose to pay into an offset scheme in lieu of meeting tree canopy requirements onsite. See Section 3.4.4 for how these proportions were derived.
The compensation for the loss of an existing tree is based on the cost to replace the physical asset (i.e. a tree of equivalent structural value), the loss of stored carbon and the loss of ongoing benefits (i.e. future tree services31). These values have been estimated from the results of an analysis of the value of tree assets in the City of Burnside’s Hazelwood Park, and are based on the average values of non-regulated trees in that study (Seed Consulting 2018). This assessment was based on the i-Tree Eco tool, a well-established and accepted method of valuing trees in Australia.
The payment for planting and maintaining a tree offsite was based on the costs described in Section 3.3.2, discounted to a present value.
Table 3-4 Offset payments per tree
Component Present value ($)
Removal of existing tree
Structural value 3,318
Loss of stored carbon 39
Loss of future tree services 77
Total 3,435
Offsite planting and maintenance
Planting cost 782
Maintenance cost 383
Total 1,165
29 Equivalent to approximately 1.4 full-time equivalent at a Professional Officer Level 3 within the SA Government public service (including on costs and overheads). 30 Equivalent to $10,000 per LGA for the 22 LGAs in Greater Adelaide. 31 Future tree services were quantified and discounted to a net present value using our study’s discount rate of 6 per cent.

URBAN TREE CANOPY OPTIONS COST BENEFIT ANALYSIS 31 Pr epar ed by BDO EconSear ch
3.3.4. Amenity benefits of trees on house prices
Amenity values are the characteristics that influence and enhance people's appreciation of a particular area. These values are derived from the pleasantness, aesthetic coherence and cultural and recreational attributes of an area. Urban trees can make a neighbourhood more scenic, provide privacy, block unwanted views and make areas more attractive to recreate in (Pandit et al. 2013, Pandit et al. 2014).
Pandit et al. (2013) undertook a hedonic pricing study of trees on private property and street trees for 23 suburbs in Perth. They found a significant, positive relationship between house price and street trees. They estimated that the presence of a street tree increased the median property value by 1.9 per cent. Other Australian studies found significant positive relationships between houses and street trees (e.g. Pandit et al. 2014 and Plant et al. 2017).
The Pandit et al. (2013) study results were applied to trees planted under the offset scheme (Option 2). That study’s estimate of 1.9 per cent amenity value was applied to the median house price in metropolitan Adelaide ($485,000, DTF 2020). An estimate of the number of homes this would apply to was based on the number of trees planted in the offset scheme adjusted by the expected number of street trees per home (approximately 1.1 street trees/home32). This equated to an amenity value of $8,348 per tree planted in the offset scheme. This one-off value accrues to households adjacent to the offset plantings and was applied at the time of planting.
This analysis has assumed that the on-site trees (retained or planted) raise the capital value of the properties by 0.19 per cent (i.e. 10 per cent of 1.9 per cent increase in value estimated by Pandit et al. 2013). This equates to $922 per infill household that retains a tree or plants a tree on-site. This figure is based on the below analysis:
Pandit et al 2013 did not find a statistically significant relationship between house price and on-site trees. They did not differentiate between the different levels of tree canopy cover onsite.
Plant et al. (2017), however, found a significant, positive relationship between house price and trees on the same property provided the tree canopy cover was less than 20 per cent of the property. However, this study did not report the quantified effect.
The Code ‘One Tree Policy’ is designed to apply when on-site tree canopy cover is less than 20 per cent.
It therefore seems reasonable to assume that there is a small, positive effect of having a tree on-site, when the tree canopy is less than 20 per cent. It is greater than 0 per cent and likely to be much smaller than 1.9 per cent. A value of 0.19 per cent is uncertain, but it is considered that this judgement is reasonable.
3.3.5. Improved air quality
As described in Section 2.5, air pollution is one of the main environmental risk factors affecting human health. Trees play an important role in filtering and cleaning the air of harmful gaseous and particulate pollutants, via uptake through leaves and interception and accumulation of particles on the plant surface. Seed Consulting (2018) undertook a study for the City of Burnside to value the trees of Hazelwood Park. Using the well-established i-Tree Eco tool, they estimated the value of the air pollution removed by trees to human physical health33. For non-regulated trees, the average annual value per tree for removed air pollution was $2.54 in current dollars. The 2018 dollar value was adjusted to current dollars using the all sectors CPI for Adelaide (ABS 2020). This value was applied to all planted and retained trees.
32 Based on an average street tree planting distance of 12.8m (Inner West Council 2014) and an average home street frontage of 14.2m (Westbrooke Estate, 2020) 33 See Nowak et al. 2014 for the method for estimating the value of avoided health costs through air pollution removal by trees, upon which the method within the i-Tree Eco tool has been based.

URBAN TREE CANOPY OPTIONS COST BENEFIT ANALYSIS 32 Pr epar ed by BDO EconSear ch
3.3.6. Carbon removed
As described in Section 2.5, another environmental benefit provided by trees is removal of carbon from the atmosphere, assisting with global goals to manage greenhouse gas emissions.
The Seed Consulting (2018) study also valued the annual removal of carbon from the atmosphere using the i-Tree Eco tool. For non-regulated trees within Hazelwood Park, the average annual value per tree for carbon removal was 0.01 tonnes of carbon dioxide equivalent (tCO2e). It was assumed that the average age of the non-regulated trees in Hazelwood Park was 30 years, and a carbon sequestration by age profile was developed and applied.
A social cost of carbon was applied to the carbon removal volumes. The social cost of carbon is the marginal cost of the impacts caused by emitting one extra tonne of greenhouse gas (carbon dioxide equivalent) at any point in time, inclusive of ‘non-market’ impacts on the environment and human health (Yohe et al. 2007). The United States Government (2016) social cost of carbon price was used, which was the equivalent of A$63/tCO2e in 2021 rising to A$96/tCO2e in 2045. It was assumed that retained trees were the equivalent of 20 years old and planted trees were one year old. This value was applied to all planted and retained trees under the base case and both options.
3.3.7. Avoided loss of stored carbon
The carbon removed benefit described above is based on future flows of stored carbon. The avoided loss of stored carbon benefit puts a value on the carbon already stored by trees that are retained under Options 1 and 2 that would otherwise be removed under the base case.
The Seed Consulting (2018) study valued stored carbon using the i-Tree Eco tool. For non-regulated trees within Hazelwood Park, the average amount of stored carbon per tree was 0.62tCO2e. As with the carbon removal benefit, this was assumed to apply to a 30 year old tree, and a stored carbon by age profile was developed and the social cost of carbon values applied. This value was applied to all planted and retained trees under the base case and both options.
3.3.8. Avoided stormwater runoff
As described in Section 2.5, another environmental benefit provided by trees is the interception of rainfall, allowing infiltration into the soil and thereby assisting with stormwater management.
The Seed Consulting (2018) study also valued the annual avoided stormwater runoff using the i-Tree Eco tool. For non-regulated trees within Hazelwood Park, the average annual value per tree for avoided stormwater runoff was $0.60 in current dollars. As with the carbon removal benefit, this was assumed to apply to a 30 year old tree and a benefit by age profile was developed and applied. This value was applied to all planted and retained trees under the base case and both options.
3.3.9. Reduced household electricity use
As described in Section 2.5, trees have been identified as a highly effective mechanism for cooling the local environment through shading and evapotranspiration. Coolstreets (LGNSW 2016) undertook a study with several neighbourhoods in Sydney and estimated that a neighbourhood of 40 houses on a street with trees reduced their electricity use (through less air-conditioning in summer) by 10,651kWh per year, compared to a similar street without street trees. It was estimated that the medium-sized street trees in the study were approximately 20 years old, and assuming a one year old tree would have a negligible effect on cooling, a tree age by energy saving profile was derived. Using a current price of retail electricity of $32/kWh it was possible to estimate the energy savings achieved by the planted and retained trees under the base case and both options.

URBAN TREE CANOPY OPTIONS COST BENEFIT ANALYSIS 33 Pr epar ed by BDO EconSear ch
3.3.10. Avoided mental health costs
Analysis by Cox et al. (2017) estimated the association between neighbourhood vegetation cover and levels of depression, anxiety and stress. Compared to a baseline of 10 per cent vegetation cover, the number of people showing symptoms of depression is reduced by up to 11 per cent in neighbourhoods with more than 20 per cent vegetation cover, and an additional reduction of around 10 per cent was demonstrated if vegetation cover was more than 30 per cent (Cox et al. 2017). A similar finding was reported in relation to anxiety and stress. Again using a baseline of 10 per cent vegetation cover, the number of cases of anxiety and stress could be reduced by 17 per cent if vegetation cover were more than 20 per cent, and a further 8 per cent if vegetation cover were more than 30 per cent (Cox et al. 2017).
These results suggest that, on average, each percentage point increase in vegetation cover above 20 per cent (the approximate average tree cover across the Greater Adelaide area), would result in:
1.0 per cent reduction in the number of people showing symptoms of depression 0.8 per cent reduction in the number of cases of anxiety and stress.
Therefore, the following assumptions have been made to estimate the mental health benefits of increasing tree cover across Greater Adelaide by 1 percentage point34.
1. The effect on reducing the symptoms of depression and reducing the cases of anxiety and stress were assumed to be the same, using the lower coefficient of 0.8.
2. While it may be that a reduction in the number of people affected by mental health issues will see a corresponding reduction in the cost of service delivery, there are undoubtedly significant overhead (fixed) costs in delivery these services. This is conservatively estimated at 50 per cent35.
3. Assumptions 1 and 2 above imply the following relationship: a 1 percentage point increase in vegetation cover above 20 per cent (e.g. from 20 per cent to 21 per cent) will result in a 0.4 per cent reduction in the cost of mental health related to depression, anxiety and stress.
4. The annual cost of mental health in Australia in 2019 is estimated to be $66.4 billion, derived from the VISES (2016) estimate ($56.7 billion), adjusted for inflation and population growth.
5. The proportion of people who suffer severe depression and anxiety (of the total suffering serious mental health issues) was estimated at 56.3 per cent (VISES 2016). Assuming the costs to the economy per person of those suffering from severe anxiety and severe depression are, on average, similar to the costs associated with those suffering other types of severe mental illness (e.g. schizophrenia and bipolar disorder), the national cost of severe anxiety and severe depression in Australia in 2019 was estimated to be $37.4 billion (56.3 per cent x $66.4 billion).
6. The prevalence of mental illness in Greater Adelaide was assumed to be the same as in Australia as whole. In June 2019, the population of Greater Adelaide was 5.4 per cent of the national population. Accordingly, the annual cost of those suffering severe anxiety & severe depression in the study area was estimated to be $2.0 billion (5.4 per cent x $37.4 billion).
7. Applying assumption #3 to assumption #6 implies that, in the study area, a 1 percentage point increase in vegetation cover above 20 per cent will result in an $8.0 million avoided mental health cost related to severe anxiety and depression (0.4 per cent x $2.0 billion).
34 Our analysis estimated that, relative to the base case, Option 1 would increase urban tree canopy cover by 0.01% in the first year and by 0.73% by year 25. Similar ly, Option 2 would increase urban tree canopy cover by 0.02% and 1.04% respectively. 35 Noting that many of the costs of mental health are additional to the direct costs of providing mental health services which will not have a fixed cost component, i.e. they will vary directly with the number of people with mental illnesses. This implies an adjustment value of 50% is likely to be high and therefore very conservative.

URBAN TREE CANOPY OPTIONS COST BENEFIT ANALYSIS 34 Pr epar ed by BDO EconSear ch

URBAN TREE CANOPY OPTIONS COST BENEFIT ANALYSIS 35 Pr epar ed by BDO EconSear ch
3.4. Defining key variables
Defining a number of key variables was an important step in undertaking the cost benefit analysis. These key variables allowed us to define a realistic base case and options for the community-level analysis, and a realistic suite of the most common scenarios likely to apply to an infill household for the dwelling-level analysis.
The variables are:
Number of dwellings to be built per year Proportion of dwelling types to be built Proportion of allotments on each soil type Proportion of allotments with trees retained, planted and lost Proportion of allotments with nearby trees.
3.4.1. Number of dwellings to be built per year
To undertake this cost benefit analysis, we needed to know the number of infill dwellings likely to be built per year in Greater Adelaide during the study period of 2020 to 2045 (i.e. the number of dwellings that would be subject to the proposed policy)36. Projections for minor infill in the study area, between 2016 and 2035, were provided by AGD (see Table 3.5). For the period of 2036 to 2045, the annual increase was based on the average of the previous four periods.
Table 3-5 Minor infill development projections and estimates
2016-2020 2021-2025 2026-2030 2031-2035 2036-2045
No. dwellings built/year
4,579 4,507 4,639 4,477 4,551
Source: AGD, 2020 pers. comm.
3.4.2. Proportion of dwelling types to be built
For this purpose of this analysis, AGD defined two common dwelling types to use as case studies:
A 200m2 brick veneer detached single storey dwelling A smaller 90m2 brick veneer two storey townhouse.
The dwelling types were chosen because they are common in infill developments in Greater Adelaide. While this is not an exhaustive list, it enabled AGD to seek independent costings of house footing costs, to then enable an indicative assessment of the impact of trees. Because of the many variables impacting house footing costs, it is not possible to identify the exact cost applicable to every individual household in every possible scenario.
The approximate proportions of single storey detached and double storey townhouse infill dwellings relative to each other are 88 per cent and 12 per cent respectively (AGD 2020). These proportions were applied to the distribution of case study dwellings.
3.4.3. Proportion of allotments on each soil type
As outlined in Section 2.6, soil type has a significant impact on house footing cost where there is a tree effect. For the purpose of the community-scale analysis, the prevalence of soil types across Greater Adelaide (TMK Consulting Engineers, 2020) was used. For the purpose of the infill household-scale analysis,
36 Section 2.1 refers to an approximate net gain of 2,500 infill dwellings per year (e.g. one dwelling demolished to build two new dwellings = net gain of one dwelling). Section 3.3.1 refers to the average annual number of new infill dwellings built per year (e.g. one dwelling demolished to build two new dwellings = two new dwellings, which the policy will apply to).

URBAN TREE CANOPY OPTIONS COST BENEFIT ANALYSIS 36 Pr epar ed by BDO EconSear ch
scenarios testing the most expensive and least expensive footings (as a result of soil type) were used. See Section 3.3.1 for more details.
3.4.4. Proportion of allotments with trees retained, planted and lost
Even though there is no current requirement to plant a tree (see Section 2.3.2), and Draft Code policy stipulates one tree per allotment (see Section 2.4.2), it cannot be assumed that every allotment will start from a base case of zero trees and end up with a single tree. This is important because we need to be able to test the economic outcomes of realistic future scenarios against realistic base case scenarios. Importantly, impacts on house footing costs can only be assessed if we know how likely it is that footings will be impacted by no trees, a single tree or a group of trees 37.
The general assumption is that at the time of occupation, a relatively small proportion of minor infill developments have planted a tree or retained a tree. AGD undertook a case study investigation to test this assumption – see Glengowrie case study (overleaf).
This case study is the best available information on what currently happens with trees in minor infill developments in Greater Adelaide. The findings were therefore assumed to represent the base case.
It was assumed that introducing regulatory and financial incentives to retain trees would encourage more households to retain mature trees. For the purpose of this analysis, it was assumed the One Tree Policy (Option 1) would increase the tree retention rate by 50 per cent compared to the base case, and introduction of an offset scheme (where payments could be avoided if tree outcomes were already met onsite) would double the tree retention rate compared to the base case. For Option 2, it was also assumed that half of households that did not retain a tree would choose to plant one onsite, and half would choose to pay into the offset scheme instead.
These assumptions result in the following proportions of trees post-development under each option38:
Base case (no tree requirement): 27 per cent retain a tree, 30 per cent plant a tree onsite, 43 per cent have no tree (37 per cent remove an existing tree and 6 per cent had no trees pre-development)
Option 1 (One Tree Policy): 41 per cent retain a tree, 59 per cent plant a tree onsite Option 2 (One Tree Policy with offset scheme option): 54 per cent retain a tree, 23 per cent plant
a tree onsite, and 23 per cent pay into the offset scheme (no tree onsite).
37 ‘Single Tree Effect’: If one or two adjacent trees are less than their mature height from a dwelling than they should be designed to include ‘tree effects’, in accordance with AS2870-2011 Residential slabs and footings. ‘Group Tree Effect’: This occurs when there are three or more trees in a group, or a row of three trees (where tree spacing is less their mature height, otherwise consider as single trees). If a group of three trees are located less than 1.5m x mature height away from the dwelling they should be designed to include ‘tree effects’, in accordance with AS2870-2011 Residential slabs and footings.
38 Note that percentage calculations have been rounded.

URBAN TREE CANOPY OPTIONS COST BENEFIT ANALYSIS 37 Pr epar ed by BDO EconSear ch
Glengowrie Case Study
AGD reviewed a case study infill site to determine whether infill households typically retain existing trees, remove them, and/or plant a new tree.
The case study site chosen was the Frederick Street catchment in Glengowrie, in the City of Marion. This area was chosen as it has had significant infill development, and is the same case study site used in the Stormwater Report. See Appendix 1 for a copy of the maps produced for this case study.
Methodology
This investigation used a 2007 to 2019 Lidar data set39 to manually identify all the mature trees 40 (assumed to be over 2 metres) within the infill study area.
The analysis involved:
Combining tree data with infill data to investigate gain/loss of vegetation per parcel (for 2007 to 2019)
Reviewing the 2019 trees against the 2007 imagery to identify what was an existing tree and what was a new planting
Calculating statistics of trees as outlined in key findings (overleaf).
Refer overleaf for the key findings from this case study.
39 Lidar data (captured in March 2018) was used for automatically identifying trees over 2m. The analyst then manually added or removed any trees that did not match the 2019 imagery. 2007 tree data was entirely manual. 40 Tree counts are for extent of or iginal parcel pre demolition not new dwelling lots.
2007 2019
2019
2007
2007
2019
2019

URBAN TREE CANOPY OPTIONS COST BENEFIT ANALYSIS 38 Pr epar ed by BDO EconSear ch
Key findings – Glengowrie Case Study
76 out of 81 (94%) parcels in 2007 had at least 1 mature tree pre-infill development.
22 of the 76 parcels (29%) chose to retain at least one tree (excludes new plantings)
30 of the 76 parcels (39%) did not retain OR plant any trees (left with no trees in 2019)
24 of the 76 parcels (32%) that did not retain any trees DID plant 1 or more new trees
Overall 38 of the 76 parcels (50%) planted at least 1 tree.
Further AGD investigations have identified that these 81 parcels were sub-divided into 166 allotments. Out of these new allotments, 20% retained an existing mature tree on site, while 38% planted one or more new trees. Overall 51% of these new allotments did not have a mature tree on site in 2020. Note: sometimes a site retained both a mature tree(s) and planted a new tree(s) – however these were the minority.
Local context
A AGD review has found that the 81 original parcels have been subdivided into 166 new allotments. These new allotments have the following number of nearby trees (either street trees and/or trees in neighbouring property front gardens) in 2020:
none: 25%
1 nearby tree: 41%
2 nearby trees: 19%
3 nearby trees: 15%.
These 81 allotments were sub-divided into 166 new allotments with the following characteristics.
1 parcel into 1 replacement dwelling: 12%
1 into 2 new dwellings: 55%
1 into 3 or more dwellings: 37%.
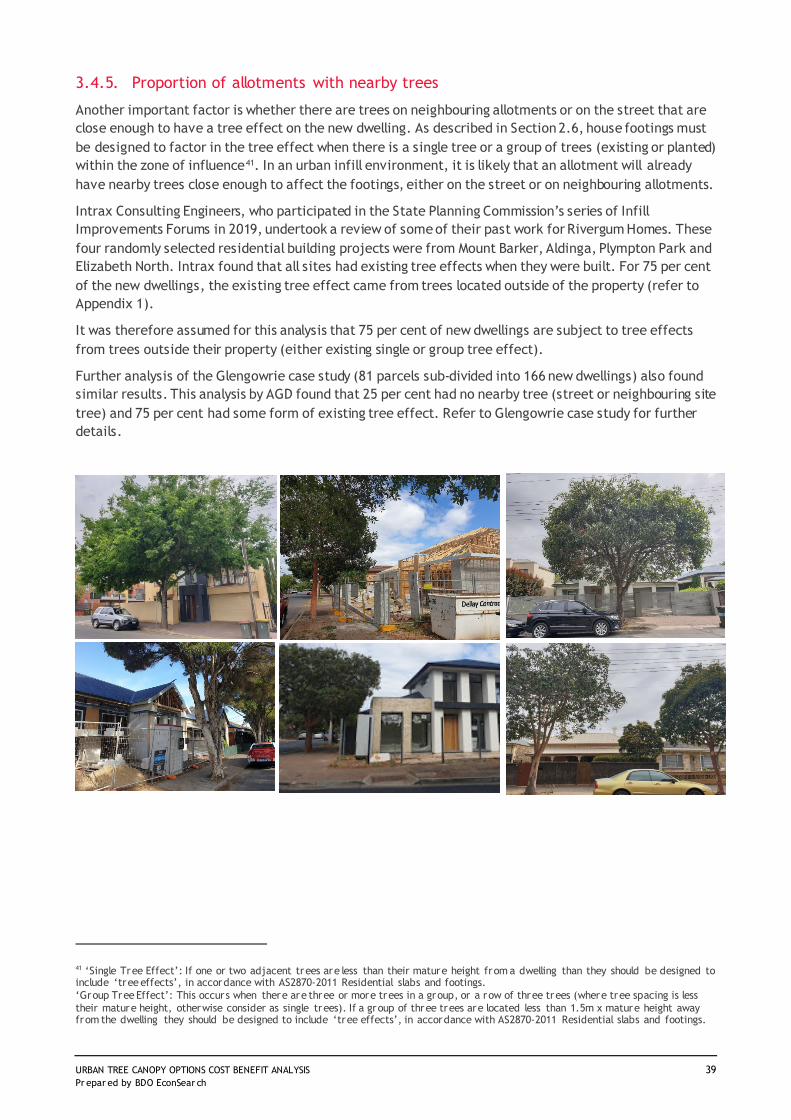
URBAN TREE CANOPY OPTIONS COST BENEFIT ANALYSIS 39 Pr epar ed by BDO EconSear ch
3.4.5. Proportion of allotments with nearby trees
Another important factor is whether there are trees on neighbouring allotments or on the street that are close enough to have a tree effect on the new dwelling. As described in Section 2.6, house footings must be designed to factor in the tree effect when there is a single tree or a group of trees (existing or planted) within the zone of influence41. In an urban infill environment, it is likely that an allotment will already have nearby trees close enough to affect the footings, either on the street or on neighbouring allotments.
Intrax Consulting Engineers, who participated in the State Planning Commission’s series of Infill Improvements Forums in 2019, undertook a review of some of their past work for Rivergum Homes. These four randomly selected residential building projects were from Mount Barker, Aldinga, Plympton Park and Elizabeth North. Intrax found that all sites had existing tree effects when they were built. For 75 per cent of the new dwellings, the existing tree effect came from trees located outside of the property (refer to Appendix 1).
It was therefore assumed for this analysis that 75 per cent of new dwellings are subject to tree effects from trees outside their property (either existing single or group tree effect).
Further analysis of the Glengowrie case study (81 parcels sub-divided into 166 new dwellings) also found similar results. This analysis by AGD found that 25 per cent had no nearby tree (street or neighbouring site tree) and 75 per cent had some form of existing tree effect. Refer to Glengowrie case study for further details.
41 ‘Single Tree Effect’: If one or two adjacent trees are less than their mature height from a dwelling than they should be designed to include ‘tree effects’, in accordance with AS2870-2011 Residential slabs and footings. ‘Group Tree Effect’: This occurs when there are three or more trees in a group, or a row of three trees (where tree spacing is less their mature height, otherwise consider as single trees). If a group of three trees are located less than 1.5m x mature height away from the dwelling they should be designed to include ‘tree effects’, in accordance with AS2870-2011 Residential slabs and footings.

URBAN TREE CANOPY OPTIONS COST BENEFIT ANALYSIS 40 Pr epar ed by BDO EconSear ch
4. COST BENEFIT ANALYSIS RESULTS
The cost benefit analysis was undertaken at two levels:
At the community level – expected costs and benefits (both monetary and non-monetary) accruing to people (households, businesses and government) and the environment across Greater Adelaide, as a result of the proposed options. For results, see Section 4.1.1.
At the individual household level – expected cost and benefits (monetary only) accruing to the household undertaking the development, as a result of the proposed options. For results, see Section 4.2.2.
4.1. Community
4.1.1. Cost benefit analysis results
The results of the community level, social CBA are provided in Table 4-1. These results are based on the expected values for key variables, as outlined in Section 3.4.
Table 4-1 Results of the community cost benefit analysis, Greater Adelaide
Description Option 1 Option 2
Incremental Benefits ($ma)
Amenity 24.5 128.5
Improved air quality 0.4 0.6
Carbon removed 0.1 0.2
Avoided loss of stored carbon 0.1 0.1
Avoided stormwater runoff 0.4 0.8
Reduced household electricity use 15.1 16.6
Avoided mental health costs 23.8 36.8
Offset scheme receipts (Government) NA 99.8
Total Incremental Benefits ($ma) 64.3 283.4
Incremental Costs ($ma)
House footing costs 29.0 2.6
Onsite tree planting & maintenance costs 9.0 -2.1
Offsite tree planting & maintenance costs NA 14.8
Offset scheme development & management NA 3.2
Offset scheme payments (infill homeowners) NA 99.8
Total Incremental Costs ($ma) 38.0 118.3
Net Present Value ($ma) 26.4 165.1
Benefit Cost Ratio 1.7 2.4 a Current dollars, present value (PV) BDO EconSearch analysis.

URBAN TREE CANOPY OPTIONS COST BENEFIT ANALYSIS 41 Pr epar ed by BDO EconSear ch
Option 1
Compared to the base case, introducing the ‘One Tree Policy’42 is expected to deliver economic, amenity and liveability gains to the Greater Adelaide community valued at $26.4 million (BCR 1.7), and is therefore a worthwhile initiative for government to consider.
The additional house footing costs and onsite tree planting and maintenance costs (borne by infill households) is offset by the non-market environmental and social benefits that increased tree canopy provides to the community of Greater Adelaide, and the cost-saving benefit of reduced electricity use to infill households. This option would return $1.70 to the community for every $1 invested.
Option 2
This option43 is estimated to return $2.40 to the community for every $1 invested. Providing the option for infill households to have the same ‘one tree’ outcome achieved offsite on public land, funded via an offset scheme, is therefore a worthwhile initiative for government to consider.
It should be noted that this offset scheme has been developed for the purposes of this analysis and its formulation is intended to be illustrative only. However, as formulated in this study, providing an offset option is expected to deliver gains to the Greater Adelaide community valued at an estimated $165.1 million.
Option 2 had a significantly higher return than Option 1 for three reasons:
Amenity value of offsite trees is significantly greater than onsite trees – valued at $104.0 million in additional community benefits.
Most house footing costs would be avoided, with some households choosing to pay an offset instead – valued at $26.3 million in avoided household costs compared to Option 1.
More mature trees would be retained (incentivised via avoided offset payments) – valued at $15.2 million in retained community benefits compared to Option 1.
4.1.2. Sensitivity analysis
The results of the analysis were sensitivity tested to reflect any uncertainties present in key variables. Sensitivity analyses were undertaken for the following variables:
Discount rate Period of analysis Amenity.
The range of values used for each uncertain variable and results of the sensitivity analysis are set out below with some interpretation of the results. Note that each sensitivity analysis for each variable was undertaken by holding all other variables constant at their ‘expected’ values.
Discount rate
Costs and benefits are specified in real terms (i.e. current 2020 dollars) and future values are converted to present values by applying a discount rate of 6 per cent. A sensitivity analysis was conducted using discount rates of 4 and 8 per cent (Table 4-2).
42 The proposed deemed-to-satisfy provision for minor infill to provide one tree (or equivalent) on each allotment, which is small, medium or large depending on allotment size. Discounts apply for retaining existing trees and associated soil area. Detailed requirements are descr ibed in Section 2.4.2. This policy is intended to be included in Gen 1 of the Planning and Design Code. 43 Applicants can choose to meet the one tree DTS provision on their own allotment, or have the same outcome achieved offsite on public land, funded by an offset scheme. More information on offset schemes is provided in Section 2.7. This policy may be considered in later generations of the Code.

URBAN TREE CANOPY OPTIONS COST BENEFIT ANALYSIS 42 Pr epar ed by BDO EconSear ch
Table 4-2 Results of the sensitivity analysis – discount rate
Discount rate Option 1 Option 2
NPV ($ma) BCR NPV ($ma) BCR
4% 36.6 1.8 204.6 2.4
6%b 26.4 1.7 165.1 2.4
8% 19.2 1.6 136.1 2.4
a In current dollars b Expected value
Source: BDO EconSearch analysis
As expected, the NPV and BCR improve with the lower (4 per cent) discount rate and decrease under the higher discount rate (8 per cent). This occurs because, although the bulk of the project costs are upfront and are not significantly affected by the discount rate, the benefits accrue over many years and are greater, in present value terms, when the discount rate is lower.
The results are shown to be sensitive to changes in discount rate. This means that a 4 or 8 per cent discount rate will have a significant effect on the magnitude of the NPV and BCR results, however the results remain positive across the range in this variable.
Period of analysis
Many of the tree benefits increase over time as the trees become older or more mature, and can take decades to become significant, however major planning policies are likely to have a life of two to three decades. A sensitivity analysis was undertaken with a period of analysis of 15 years and 40 years (Table 4-3).
Table 4-3 Results of the sensitivity analysis – period of analysis
Period of analysis Option 1 Option 2
NPV ($ma) BCR NPV ($ma) BCR
15 years 8.5 1.3 110.4 2.2
25 yearsb 26.4 1.7 165.1 2.4
40 years 56.4 2.2 223.4 2.6
a In current dollars b Expected value
Source: BDO EconSearch analysis
For both Option 1 and Option 2, the results are shown to be moderately sensitive to changes in period of analysis, however the results remain positive across the range in this variable.
Amenity
The amenity value to households of gaining or retaining a tree on site or nearby was derived from a study in Perth. It is possible that the community in Adelaide values street trees differently from people in Perth. A sensitivity analysis was conducted using a 25 per cent decrease and increase in the expected value of 1.9 per cent of the median house price (Table 4-4).

URBAN TREE CANOPY OPTIONS COST BENEFIT ANALYSIS 43 Pr epar ed by BDO EconSear ch
Table 4-4 Results of the sensitivity analysis – amenity
Amenity Option 1 Option 2
NPV ($ma) BCR NPV ($ma) BCR
25% less 20.2 1.5 132.9 2.1
Expected valueb 26.4 1.7 165.1 2.4
25% more 32.5 1.9 197.2 2.7
a In current dollars Source: BDO EconSearch analysis
The results are moderately sensitive to change. If a zero value is assumed for amenity benefits, then the NPV for Option 1 drops to $1.9 million and for Option 2 drops to $36.6 million, however the results are still positive.
4.2. Individual infill households
4.2.1. Scenarios tested
For the household level analysis, we sought to test the two policy options against a realistic suite of the scenarios that may apply to an individual household. This analysis provides an indication of the likelihood and significance of costs and benefits, but due to the many variables at play, it is not possible to identify the exact net cost or benefit applicable to every individual household in every possible scenario, or to provide a weighted average cost or benefit per household. The scenarios below are based on the expected values for key variables, as outlined in Section 3.4.
For individual households, our case study indicates that 57 per cent of infill developments would have retained or planted a tree anyway44 (see Section 3.4.4). This means they will be no better or worse off, so they have not been tested in the household scenario analysis.
Households that in the base case would have removed a tree (or had no tree) and would not have planted one, will be required to plant a tree onsite (under Option 1), or will be able to choose whether to plant a tree onsite or pay into an offset scheme (under Option 2). The possible scenarios fit into four categories:
A tree can be planted onsite without creating an additional tree effect on footing costs (Scenario 1). This is the most likely scenario.
Proposed dwelling has no nearby trees, and planting an onsite tree will create an additional tree effect on footing costs (Scenarios 2-5). These scenarios are considered less likely.
Household chooses to pay an offset rather than plant a tree onsite (Option 2 - Scenarios 6-7). These scenarios are estimated to represent 23 per cent of developments (see Section 3.4.4).
Scenarios 2-5 tested variations based on the two different dwelling types, and the soil types with the least expensive footings and most expensive footings. Scenarios 6-7 tested variations based on whether the household had no existing tree, or chose to remove an existing tree.
44 In a Glengowrie case study site, including developments occurr ing between 2007 and 2019, trees were retained in 27% of developments, and new trees were planted in 30% of developments. This case study is the best available information on household behaviour in relation to trees in minor infill settings in Greater Adelaide.

URBAN TREE CANOPY OPTIONS COST BENEFIT ANALYSIS 44 Pr epar ed by BDO EconSear ch
Explanatory notes
An additional tree effect on house footings is caused by moving from no tree effect to a single tree effect (from 0 to 1 trees), or by moving from a single tree effect to a group of trees effect (from 2 to 3 trees). There is no additional tree effect caused by moving from 1 to 2 trees, because the single tree effect applies when there are one or two trees (AS2870-2011 Residential Slabs and Footings). Refer to Figure 12 for a diagram showing when a single tree effect moves to a group of trees effect.
Scenario 1 covers cases where the new tree is planted outside the tree effect zone OR where there is already one nearby tree (causing an existing single tree effect on footings) OR where there is already a group of nearby trees (causing an existing group of trees effect on footings). Note all development in the General Neighbourhood and Suburban Neighbourhood Zones has the opportunity to plant a 4 metre tree at least 4 metres away from the footings.
Scenarios 2-5 are considered less likely to occur as dwellings in the General Neighbourhood and Suburban Neighbourhood Zones have minimum setbacks that mean a small tree can be planted outside the zone of tree effect if an applicant chooses. However this case study situation could occur in denser zones with smaller setbacks (or if the household chooses to plant a larger tree or plant within the tree effect zone) and there is no nearby tree causing an effect45.
4.2.2. Cost benefit analysis results
For individual households, our case study indicates that 57 per cent of infill developments will be no better or worse off than under the base case, because they would have retained or planted a tree anyway46.
This study tested a number of likely common infill development scenarios.
In the most likely scenario, a tree is planted onsite without creating a new or additional tree effect (Scenario 1). In this case, infill households will realise a significantly positive net benefit of $888 (BCR 2.5).
This study also tested the impact of infill developments planting a 6m tree 4m from the dwelling’s footings, which will impose a new tree effect on house footing costs. The study found that where the soil has lower reactivity47, the household will realise a net benefit, and where the soils have higher reactivity48, the household will incur a net cost (BCRs range from 1.9 to 0.4 respectively).
This indicates that house footprint size and configuration, and tree height and placement (compared to existing nearby trees and the house), will be an important cost consideration for households in areas with more reactive soils. Therefore there may be merit in identifying additional options for households to meet tree cover outcomes while minimising upfront costs, in the scenario they will incur a net cost.
45 In an established urban area, it is estimated that house footings will already have to be designed to accommodate the impact of nearby offsite trees in 75 per cent of all infill developments. 46 In a Glengowrie case study site, including developments occurr ing between 2007 and 2019, trees were retained in 27% of developments, and new trees were planted in 30% of developments. This case study is the best available information on household behaviour in relation to trees in minor infill settings in Greater Adelaide. 47 See Scenario 2 and 4 in the Cost Benefit Analysis. 48 See Scenario 3 and 5 in the Cost Benefit Analysis.
Figure 12 The criteria for determining if trees create a ‘group of tree’ effect

URBAN TREE CANOPY OPTIONS COST BENEFIT ANALYSIS 45 Pr epar ed by BDO EconSear ch
It is also important to acknowledge that the study has only included a limited sub-set of benefits that were able to be defensibly quantified in dollar terms. Other benefits likely to accrue to households with onsite trees include improved house value (monetary) and improved physical and mental health (non-monetary).
The cost benefit analysis results are provided in Table 4-5, and Table 4-6, and detailed in Appendix 2.
Table 4-5 Results of the individual household cost benefit analysis – Scenarios 1-5, Options 1 and 2
Description Scenario 1b Scenario 2c Scenario 3d Scenario 4e Scenario 5f
Benefits ($a)
Household electricity bill saving 570 570 570 570 570
Amenity 922 922 922 922 922
Total Benefits ($a) 1,491 1,491 1,491 1,491 1,491
Costs ($a)
House footing costs 0 186 2,377 597 3,636
Onsite tree planting & maintenance costs
603 603 603 603 603
Total Costs ($a) 603 790 2,980 1,201 4,239
Net Present Value ($a) 888 702 -1,489 291 -2,748
Benefit Cost Ratio 2.5 1.9 0.5 1.2 0.4 a In current dollars b Scenario 1: Tree is planted onsite without creating a new or additional tree effect. c Scenario 2: Tree is planted where it creates a tree effect, least expensive footing (less reactive soil), double storey dwelling. d Scenario 3: Tree is planted where it creates a tree effect, most expensive footing (more reactive soil), double storey dwelling. e Scenario 4: Tree is planted where it creates a tree effect, least expensive footing (less reactive soil), single storey dwelling. f Scenario 5: Tree is planted where it creates a tree effect, most expensive footing (more reactive soil), single storey dwelling.
Source: BDO EconSearch analysis.
Table 4-6 presents the results for individual infill households choosing to pay into an offset scheme in the following scenarios:
Scenario 6: No existing tree, household pays offset for tree to be planted offsite Scenario 7: Existing tree removed, household pays offset for loss of existing tree and for new tree
to be planted offsite.
These scenarios are relevant to Option 2 only.

URBAN TREE CANOPY OPTIONS COST BENEFIT ANALYSIS 46 Pr epar ed by BDO EconSear ch
Table 4-6 Results of the individual household cost benefit analysis – Scenarios 6-7, Option 2
Description Scenario 6b Scenario 7c
Benefits ($ma)
Household electricity bill saving - -
Structural value of tree - -
Total Benefits ($ma) 0 0
Costs ($ma)
House footing costs - -
Onsite tree planting & maintenance costs - -
Offset scheme payment 1,165 4,630
Total Costs ($ma) 1,165 4,630
Net Present Value ($ma) -1,165 -4,630
Benefit Cost Ratio - - a In current dollars b Scenario 6: No existing tree, offset paid for tree to be planted offsite. c Scenario 7: Existing tree removed, offset paid for loss of existing tree and for new tree to be planted offsite. Source: BDO EconSearch analysis
4.2.3. Sensitivity analysis
The results of the analysis were sensitivity tested to reflect any uncertainties present in key variables. Sensitivity analyses were undertaken for the following variables:
Discount rate Period of analysis Amenity.
The range of values used for each uncertain variable and detailed results of the sensitivity analysis are set out below with some interpretation of the results. Note that each sensitivity analysis for each variable was undertaken by holding all other variables constant at their ‘expected’ values.
Discount rate
Costs and benefits are specified in real terms (i.e. current dollars) and future values are converted to present values by applying a discount rate of 6 per cent. A sensitivity analysis was conducted using discount rates of 4 and 8 per cent (Table 4-7).
Table 4-7 Results of the sensitivity analysis – discount rate
Discount rate Scenario NPV ($a)
1 2 3 4 5 6 7
4% 980 794 -1,396 383 -2,655 -1,165 -4,600
6%b 888 702 -1,489 291 -2,748 -1,165 -4,600
8% 825 638 -1,552 227 -2,811 -1,165 -4,600
a In current dollars b Expected value Source: BDO EconSearch analysis
As expected, the NPVs improve with the lower (4 per cent) discount rate and decrease under the higher discount rate (8 per cent). This occurs because, although the bulk of the project costs are upfront and are

URBAN TREE CANOPY OPTIONS COST BENEFIT ANALYSIS 47 Pr epar ed by BDO EconSear ch
not significantly affected by the discount rate, the benefits accrue over many years and are greater, in present value terms, when the discount rate is lower.
The exceptions are Scenarios 6 and 7, which incur all costs upfront and no benefits (see Table 4-7) and so are indifferent to discount rate.
Period of analysis
Many of the tree benefits increase over time as the trees become older or more mature, and can take decades to become significant, however major planning policies are likely to have a life of two to three decades. A sensitivity analysis was undertaken with a period of analysis of 15 years and 40 years (Table 4-8).
Table 4-8 Results of the sensitivity analysis – period of analysis
Period of analysis Scenario NPV ($a)
1 2 3 4 5 6 7
15 years 718 532 -1,659 121 -2,918 -1,165 -4,600
25 yearsb 888 702 -1,489 291 -2,748 -1,165 -4,600
40 years 1,099 912 -1,278 501 -2,537 -1,165 -4,600
a In current dollars b Expected value Source: BDO EconSearch analysis
As expected, the NPVs improve with the longer (40 years) period of analysis and decrease under the shorter period of analysis (15 years). This occurs because, although the bulk of the project costs are upfront and are not significantly affected by the discount rate, the benefits accrue over many years and are greater, in present value terms, when the period of analysis is longer. The exceptions to this are Scenarios 6 and 7, which incur all costs upfront and no benefits (see Table 4-8) and so are indifferent to the period of analysis.
Amenity
The amenity value to households of gaining or retaining a tree on site was derived from a study in Perth. It is possible that the community in Adelaide values street trees differently from people in Perth. A sensitivity analysis was conducted using a 25 per cent decrease and increase in the expected value of 1.9 per cent of the median house price (Error! Reference source not found.). The results are shown to be moderately sensitive to changes in period of analysis, however the results remain positive across the range in this variable.
Table 4-9 Results of the sensitivity analysis – amenity
Amenity Scenario NPV ($a)
1 2 3 4 5
25% less 658 471 -1,719 60 -2,978
Expected value 888 702 -1,489 291 -2,748
25% more 1,118 932 -1,258 521 -2,517

URBAN TREE CANOPY OPTIONS COST BENEFIT ANALYSIS 48 Pr epar ed by BDO EconSear ch
a In current dollars b Expected value
Source: BDO EconSearch analysis

URBAN TREE CANOPY OPTIONS COST BENEFIT ANALYSIS 49 Pr epar ed by BDO EconSear ch
5. KEY POLICY CONSIDERATIONS
1. Nuanced policy implementation for more reactive soils in denser zones
A nuanced application of the policy could be considered for households expected to incur a net cost. This may occur in denser zones (with smaller lots and setbacks) with more reactive soils.
Distribution of more reactive soils is highly variable across Greater Adelaide.
2. Putting a price on tree loss
Retained trees, being more mature, provide relatively more economic, social and environmental benefits than newly planted trees.
There is currently a 3 x $150 fee for removing a Significant tree and 2 x $150 fee for removing a Regulated tree on private land. It is clear this nominal fee falls short of covering the costs of planting and maintaining a replacement tree ($603 on private land, $1,165 on public land) – not to mention the lost benefits to the community (estimated at $3,435 for an average unregulated tree).
Mechanisms could be considered for appropriately pricing removal of trees to reflect the true cost imposed on the community (e.g. lost carbon storage, lost urban heat mitigation, reduced house values, reduced health outcomes, etc.).
3. Providing an offset scheme for trees to be planted offsite
Option 2, as formulated in this study, does put a price on lost benefits and replacement costs when removing existing trees. This is expected to incentivise higher retention of existing trees.
An appropriately priced offset scheme may provide households with greater choice in how they fulfil their contribution to the desired policy outcome of improved tree canopy cover. For example, an offset payment may be attractive to households on sites with more reactive soils.
Individual households may have other costs external to the analysis, such as site configuration or particular house designs, which they are prepared to trade-off against the cost of payment into the offset scheme.
If an offset scheme is pursued, its design should consider the practicalities of replacing and maintaining a tree in the public realm (including space constraints), the loss of tree benefits where they are needed most, and the required administrative arrangements of an offset scheme.
Consideration would also need to be given to appropriately distributing offset payment receipts to equalise lost tree benefits, both by location (so tree benefits can be provided where they are needed most) and by sector (so the lost benefits can be provided by alternative means).
New infill development zones
The new General Neighbourhood and Suburban Neighbourhood Zones have a minimum 5m setback. Infill developments in these zones can usually meet the ‘One Tree Policy’ provisions without incurring any new costs to house footings.
The denser Housing Diversity and Urban Renewal Zones have a minimum 3m setback. In these zones, households could choose to avoid additional house footing costs by setting their house back further than the minimum, or they can choose to accommodate the ‘tree effect’ in their house footing design. Due to the small block size and minimum setback, it is likely that many of these developments will already have to consider some form of ‘tree effect’ from nearby street trees or other neighbouring trees, regardless of the ‘One Tree Policy’.
URBAN TREE CANOPY OPTIONS COST BENEFIT ANALYSIS 50 Pr epar ed by BDO EconSear ch
REFERENCES Amati, M., Boruff, M., Caccetta, B., Devereux, P., and Kas, D. 2017. Where should all the trees go?
Investigating the impact of tree canopy cover on socio-economic status and wellbeing in LGA’s. Prepared for Horticulture Innovation Australia Limited by the Centre for Urban Research, RMIT University.
Armson, D., Rahman, M.A., and Ennos, A.R., 2013. A comparison of the shading effectiveness of five different street tree species in Manchester, UK. Arboriculture and Urban Forestry 39: 157-164.
Astell-Burt, T, and Feng, X. 2019a, Association of urban green space with mental health and general health among adults in Australia, https://apo.org.au/node/250246.
Astell-Burt, T. and Feng, X. 2019b, Does sleep grow on trees? A longitudinal study to investigate potential prevention of insufficient sleep with different types of urban green space, http://www.sciencedirect.com/science/article/pii/S2352827319301703.
Australian Bureau of Statistics (ABS) 2020, Consumer Price Index, Australia. Cat No. 6401.0
Beyer, K., Kaltenbach, A,, Szabo, A., Bogar, S., Nieto, J. and Malecki, K. 2014, Exposure to Neighborhood Green Space and Mental Health: Evidence from the Survey of the Health of Wisconsin. Int. J. Environ. Res. Public Health 2014, 11, 3453-3472.
Brisbane City 2013. Aussie i-Tree estimates of the environmental values of Brisbane’s street trees. Case Study Contributions to NUFA Website, Brisbane City Council.
Coutts, A., Broadbent, A., Thom, J., Loughnan, M. and Tapper, N. 2014, The Impacts of WSUD Solutions on Human Thermal Comfort: Green Cities and Microclimate. Cooperative Research Centre for Water Sensitive Cities, Victoria.
Cox, T.C., Shanahan, D.F., Hudson, H.L., Plummer, K.E., Siriwardena, G.M., Fuller, R.A., Anderson, K. Hancock, S. and Gaston, K.J. 2017, Doses of Neighbourhood Nature: The benefits for mental health of living with nature, BioScience, 67:2, 147-155.
Davern, M., Farrar, A., Kendal, D. and Giles-Corti, B. 2017, Quality Green Space Supporting Health, Wellbeing and Biodiversity: A literature review, University of Melbourne, Victoria.
Department of Finance and Administration 2006, Handbook of Cost-Benefit Analysis, Financial Management Reference Material No. 6, Commonwealth of Australia, Canberra.
Department of Planning, Transport and Infrastructure (DPTI) 2017, The 30-Year Plan for Greater Adelaide 2017 Update. Department of Planning, Transport and Infrastructure (DPTI) 2018, Planning Research and Analysis Unit, Residential Land Supply and Development Trends Research Paper (unpublished).
Department of Planning, Transport and Infrastructure (DPTI) 2019a, Minor Infill, Greater Adelaide, 2012-2018, factsheet.
Department of Planning, Transport and Infrastructure (DPTI) 2019b, South Australia’s Planning and Design Code – How will it work?, Technical Discussion Paper for Consultation.
Department of Planning, Transport and Infrastructure (DPTI) 2020, Planning Reform Implementation Program. Stage 1 Evidence Gathering (Small-scale residential infill, stormwater management, rainwater tanks and tree planting, January
Department of Treasury and Finance 2008, Guidelines for the Evaluation of Public Sector Initiatives, South Australia.

URBAN TREE CANOPY OPTIONS COST BENEFIT ANALYSIS 51 Pr epar ed by BDO EconSear ch
Department of Treasury and Finance 2020, Median House Sales by Quarter, February https://www.sa.gov.au/topics/planning-and-property/buying-and-selling/researching-a-property/median-house-sales-by-quarter
Donovan, G.H., Butry, D.T., Micahel, Y.L., Prestemon, J.P., Liebhold, A.M., Gatziolis, D. and Mao, M.Y. 2013, The relationship between trees and human health: Evidence from the spread of the emerald ash borer, American Journal of Preventative Medicine 44 (2): 139-145.
Doran, C.M. and Kinchin, I. 2019, Review of the economic impact of mental illness, Australian Health Review, 43, 43-48.
Dye, C. 2013, The World Health Report 2013, Research for Universal Health Coverage, World Health Organisation, Geneva.
Ely, M.E. and Pitman, S.D. 2012, Green Infrastructure Life support for human habitats the compelling evidence for incorporating nature into urban environments, https://www.researchgate.net/publication/278028732_Green_infrastructure_as_life_support_Urban_nature_and_climate_change.
Fjortoft, I. 2001, The natural environment as a playground for children: the impact of outdoor play activities in pre-primary school children. Early Childhood Education Journal 29 (2): 111-117.
Fowdar, H., Deletic, A., Hatt, B.E., and Barron, N. 2018. Adoption Guidelines for Green Treatment Technologies. Melbourne, Australia: Cooperative Research Centre for Water Sensitive Cities.
Grigsby-Toussaint, D.S., Turi, K.N., Krupa, M., Williams, N.J., Pandi-Perumal, S.R., and Jean-Louis, G. 2015, Sleep insufficiency and the natural environment: results from the US Behavioural Risk Factor Surveilland System survey, Preventative Medicine 78: 78-84.
Gunawardena, A., Zhang, F., Fogarty, J., and Iftekhar, M.S. 2017, Review of non-market values of water sensitive systems and practices: An update. Melbourne, Australia: Cooperative Research Centre for Water Sensitive Cities.
Iftekhar, S., Gunawardena, A. and Fogarty, J. 2020, INFEWWS Value Tool, Benefit:Cost Analysis of urban water and green infrastructure projects, Version 2020-02, CRC for Water Sensitive Cities.
Inner West Council 2014, Marrickville Street Tree Master Plan, September.
Kaplan, R. and Kaplan, S. 1989, The Experience of Nature, Cambridge University Press, Cambridge.
Kaplan, S. 1995, “The restorative benefits of nature: Toward an integrated framework”, Journal of Environmental Psychology, 15, 169-182.
Kardan, O., Gozdrya, P., Misic, B., Moola, F., Palmer, L.J., Paus, T., Berman, M.G. 2015, Neighbourhood greenspace and health in a large urban centre, Sicentific Reports, 5, Article 11610, doi: 10.1038/srep11610
Knox City Council 2016, Street Tree Asset Management Plan, May.
KPMG and Mental Health Australia 2018, Investing to save: the economic benefits for Australia of investment in mental health reform, May.
Lin, B.-S., and Lin, Y.-J. 2010. Cooling effect of shade trees with different characteristics in a subtropical urban park. Hortscience 45: 83-86.
Local Government New South Wales (LGNSW) 2016, Blacktown City Council’s Cool Streets urban heat project, November.
Lovasi, G.S., Quinn, J.W., Neckerman, K.M., Perzanowski, M.S. and Rundle, A. 2008. Children living in areas with more street trees have lower prevalence of asthma. Journal of Epidemiology and Community Health 62: 647-349.

URBAN TREE CANOPY OPTIONS COST BENEFIT ANALYSIS 52 Pr epar ed by BDO EconSear ch
MacDonald, L. 1996, Global problems, local solutions: measuring the value of the urban forest, American Forests 103(4).
Moore, G.M. 2006. Urban Tree Valuation – A current perspective and progress report. The 7th National Street Tree Symposium 2006.
Natural Resources Adelaide and Mount Lofty Ranges 2018, Accessed May 2, 2018. http://www.naturalresources.sa.gov.au/adelaidemtloftyranges/plants-and-animals/green-infrastructure
Nowak, D., Hirabayashi, S., Bodine, A. and Greenfield, E. 2014, Tree and forest effects on air quality and human health in the United States, Environmental Pollution 193: 119-129.
Ossola, A., Staas, L. and Leisham, M. 2020, Urban Tree and People’s Yards Mitigate Extreme Heat in Western Adelaide, Final Summary Report, Centre for Smart Green Cities, Macquarie University, Sydney.
Pandit, R., Polyakov, M. and Tapsuwan, S. 2013, The effect of street trees on property value in Perth, Western Australia, Landscape and Urban Planning 110:134-142.
Pandit, R., Polyakov, M. and Rohan Sadler, R. 2014, Valuing Public and Private Urban Tree Canopy Cover, Australian Journal of Agricultural and Resource Economics, 58(3):453–470.
Parsons, P.G., Neale, R., Wolski, P. and Green, A. 1998, Shady side of solar protection, Medical Journal of Australia 168 (7): 327-330.
Pitman, S.D., Daniels, C.B. and Ely, M.E. 2015, Green infrastructure as life support: urban nature and climate change, Transactions of the Royal Society of South Australia 139 (1): 97–112.
PricewaterhouseCoopers (PwC) 2019, Creating shared value: the business imperative to improve mental health in Australia, report prepared for the Royal Commission into Victoria’s Mental Health System, October
Richardson, E.A., Pearce, J., Mitchell, R. and Kingham, S. 2013, Role of physical activity in the relationship between urban green space and health, Public Health, 127 (4): 318-24.
Sarajevs, V. 2011, Health benefits of street trees, Forest Research, Forestry Commission, Bristol, UK.
Seed Consulting Services 2016, Tree Canopy Cover in the City of Charles Sturt – Benchmark Assessment. A report prepared for the City of Charles Sturt, South Australia.
Seed Consulting Services 2018, Valuing the Trees of Hazelwood Park, An i-Tree Eco Assessment, prepared for the city of Burnside, August.
Seed Consulting Services 2019, Perspectives on Performance-based Planning Provisions and Assessment Frameworks for Green Infrastructure and WSUD, in association with DesignFlow, Ekistics and CRC for Water Sensitive Cities, prepared for Water Sensitive South Australia, September.
Shashua-Bar, D., Pearlmutter, D. and Erell, E. 2011, The influence of trees and grass on outdoor thermal comfort in a hot-arid environment, International Journal of Climatology 31:1498-1506.
State Planning Commission 2018, Natural Resources and Environment, Discussion Paper, Department of Planning, Transport and Infrastructure, August.
State Planning Commission 2019a, People and Neighbourhood, Discussion Paper, Department of Planning, Transport and Infrastructure, September.
State Planning Commission 2019b, State Planning Policies for South Australia, Department of Planning, Transport and Infrastructure, May.

URBAN TREE CANOPY OPTIONS COST BENEFIT ANALYSIS 53 Pr epar ed by BDO EconSear ch
State Planning Commission 2019c, Draft Planning and Design Code, Phase 3 (Urban Areas), Department of Planning, Transport and Infrastructure, October.
Sugiyama, T, E Leslie, B Giles-Corti, and N Owne 2008, Associations of neighbourhood greenness with physical and mental health: do walking, social coherence and local social interaction explain the relationships? Journal of Epidemiology and Community Health 69: e9.
Takano, T., Nakamura, K. and Watanabe, M. 2002, Urban residential environments and senior citizens' longevity in megacity areas: the importance of walkable green spaces, Journal of Epidemiology and Community Health 56 (12): 913-918.
Vanaken, G.-J., and Danckaerts, M. 2018, Impact of Green Space Exposure on Children’s and Adolescents’ Mental Health: A Systematic Review, Int. J. Environ. Res. Public Health, 15, 2668.
Victorian Institute of Strategic Economic Studies (VISES) 2016, The economic cost of serious mental illness and comorbidities in Australia and New Zealand, a report prepared for the Royal Australian and New Zealand College of Psychiatrists and the Australian Health Policy Collaboration.
Wells, N.M. and Evans, W.G. 2003, "Nearby Nature: A Buffer of Life Stress Among Rural Children" Environment & Behaviour, 35, 311.
Westbrooke Estates 2020, Typical Street Frontages.
Yohe, G.W., Lasco, R.D., Ahmad, Q.K., Arnell, N., Cohen, S.J., Hope, Q., Janetos, A.C. and Perez, R.T. 2007, 20.6 Global and aggregate impacts; 20.6.1 History and present state of aggregate impact estimates. In Parry, M., Canziani, O., Palutikof, J., van der Linden, P. and Hanson, C. (eds.). Perspectives on climate change and sustainability. Climate Change 2007: Impacts, Adaptation and Vulnerability. Contribution of Working Group II to the Fourth Assessment Report of the Intergovernmental Panel on Climate Change. Cambridge University Press.
Disclaimer
The assignment is a consulting engagement as outlined in the ‘Framework for Assurance Engagements’, issued by the Auditing and Assurances Standards Board, Section 17. Consulting engagements employ an assurance practitioner’s technical skills, education, observations, experiences and knowledge of the consulting process. The consulting process is an analytical process that typically involves some combination of activities relating to: objective-setting, fact-finding, definition of problems or opportunities, evaluation of alternatives, development of recommendations including actions, communication of results, and sometimes implementation and follow-up.
The nature and scope of work has been determined by agreement between BDO and the Client. This consulting engagement does not meet the definition of an assurance engagement as defined in the ‘Framework for Assurance Engagements’, issued by the Auditing and Assurances Standards Board, Section 10.
Except as otherwise noted in this report, we have not performed any testing on the information provided to confirm its completeness and accuracy. Accordingly, we do not express such an audit opinion and readers of the report should draw their own conclusions from the results of the review, based on the scope, agreed-upon procedures carried out and findings.

URBAN TREE CANOPY OPTIONS COST BENEFIT ANALYSIS 54 Pr epar ed by BDO EconSear ch
APPENDIX 1 Background evidence gathering
As a first stage to this work, AGD sought to identify and review some of the likely costs and benefits associated with proposed Code policies. These efforts were informed by a number of stakeholder workshops and forums, which included members of the Stakeholder Reference Group as well as representatives from key government agencies, local councils and developers with experience in infill development. This Appendix contains the relevant outputs of that earlier work.
Summary of engagement activities
Engagement activity
Partic ipants Purpose Summary of key outcomes and further info
Industry Infill Advisory Forum 13 August 2019
Local developers, builders and four inner metropolitan councils (West Torrens, Salisbury, Campbelltown and Charles Sturt)
The purpose of this workshop was to seek input and evidence sources on the costs and benefits of WSUD and urban greening.
There was strong interest in identifying what role rainwater tanks might have in local stormwater management. John Eckert (from River Gum Homes) also volunteered to organise for three of the structural engineers that commonly do work for small scale infill development for Rivergum Homes to participate in the below workshop.
Footings and the Effects of Trees Workshop 29 August 2019
Local developer (Rivergum Homes), structural engineers and landscape architects
The purpose of the workshop was to identify: • opportunities and
challenges with the proposed tree planting policy, including any factors specific to Adelaide
• ways to improve the policy
• any further information or support that industry would need to implement the policy.
There was a diversity of viewpoints raised. Trees were seen by most at the workshop as common existing ‘infrastructure’ in neighbourhoods that needed to be designed for and were therefore not a ‘new cost’. It was recommended that further supporting guidance was provided about this policy such as trees not to plant.
Infill Advisory Forum 24 September 2019
Representatives from the SPC, Ministerial Liaison Group, 3 x Planning Reform Advisory Groups (Development and Industry, Local Government and Community and Sustainability), local councils, government agencies and research groups
Workshop - Understanding and balancing the different costs and benefits of WSUD / greening: • What are the benefits
and challenges? • What are the
opportunities to address the challenges?
• What further information/support is needed to assist implementation
There was a diversity of viewpoints raised. Some groups thought that the Code policies proposed weren’t strong enough, while other industry groups preferred that they were removed. There was discussion about potential implementation issues e.g. compliance with rainwater tank installation. There was also discussion about whether guidance material was needed about what type of tree and where to plant.
Stakeholder Reference Group meetings
As listed in the Options Analysis
Three meetings to discuss the scope and findings of the Options Analysis
Literature review on the key benefits of improving urban tree canopy cover
Green infrastructure and water sensitive urban design have multiple benefits – especially in the context of increasing urban infill. These benefits include improving amenity, reducing the urban heat island effect,

URBAN TREE CANOPY OPTIONS COST BENEFIT ANALYSIS 55 Pr epar ed by BDO EconSear ch
improving physical and mental health, reducing stormwater run-off and improving the overall liveability of urban communities. AGD undertook a literature review to identify some of the likely costs and benefits associated with proposed Code policies. The key findings and references are listed below.
The role of trees in promoting positive health and wellbeing of communities
There are a range of well documented positive health and wellbeing outcomes provided by trees and green public spaces. Those impacts which may be associated with trees in private spaces, such as urban gardens, are outlined in the below table and are drawn from a literature review undertaken by SA Health, and including references identified by the Heart Foundation.
Positive Impacts to Public Health and Wellbeing for the Whole of Community
Impact Public Health and Wellbeing Outcomes
Improved air quality Urban trees have been associated with a lower prevalence of asthma. Increased densities of trees have been found to lower childhood asthma prevalence by 29%.
Trees, and other vegetated areas, are known to filter pollutants including nitrogen oxides, ozone, carbon monoxides and sulphur oxides, and of other large particulate matter.
The filtering capacity of trees has been found to reduce particulate matter concentrations downwind of the trees by more than 10%.
In the United States alone, it is estimated that trees provide $18.3 billion in annual value due to air pollution, reduced building energy use, carbon sequestration and avoided pollutant emissions.
Decreased cardio metabolic conditions49
After controlling for demographics including age, income and education, research suggests that residents living in areas of with a high number of and/or large trees on streets and have significantly fewer cardio-metabolic conditions.
Canadian research suggests that the inclusion of 10 trees per urban block can have health impacts which are equivalent to being seven years younger in age.
There is early evidence that evergreen canopy coverage is linked to a reduction in the proportion of communities with cardio metabolic conditions.
Improved wellbeing and mental health
Evidence suggests that high tree species diversity can improve mental health and wellbeing.
In Toronto, living in a street having 10 or more trees was found to equate to health benefits equivalent to being seven years younger or receiving a $10,000 salary rise. People who live in areas that have more (and/or larger) trees on the streets report significantly fewer cardio-metabolic conditions. People reported decrease of 0.04 units of cardio-metabolic conditions (0.5% of the 0–8 scale for cardio-metabolic conditions) for every increase of 408 cm2/m2 in tree density. This is approximately equivalent to 11 more average-sized trees on the streets per city block. This effect for cardio-metabolic conditions is equivalent to a $20,200 increase in both area median income and annual household income adjusted for other variables. This decrease in cardio-metabolic conditions is also, on average, equivalent to being 1.4 years younger.
Exposure to 30% or more tree canopy compared with 0% to 9% tree canopy was associated with 31% lower odds of incident psychological distress, whereas exposure to 30% or more grass was associated with 71% higher odds
49 Cardio metabolic conditions are a collection of disorders that occur together and increase the risk of developing type 2 diabetes or cardiovascular disease.
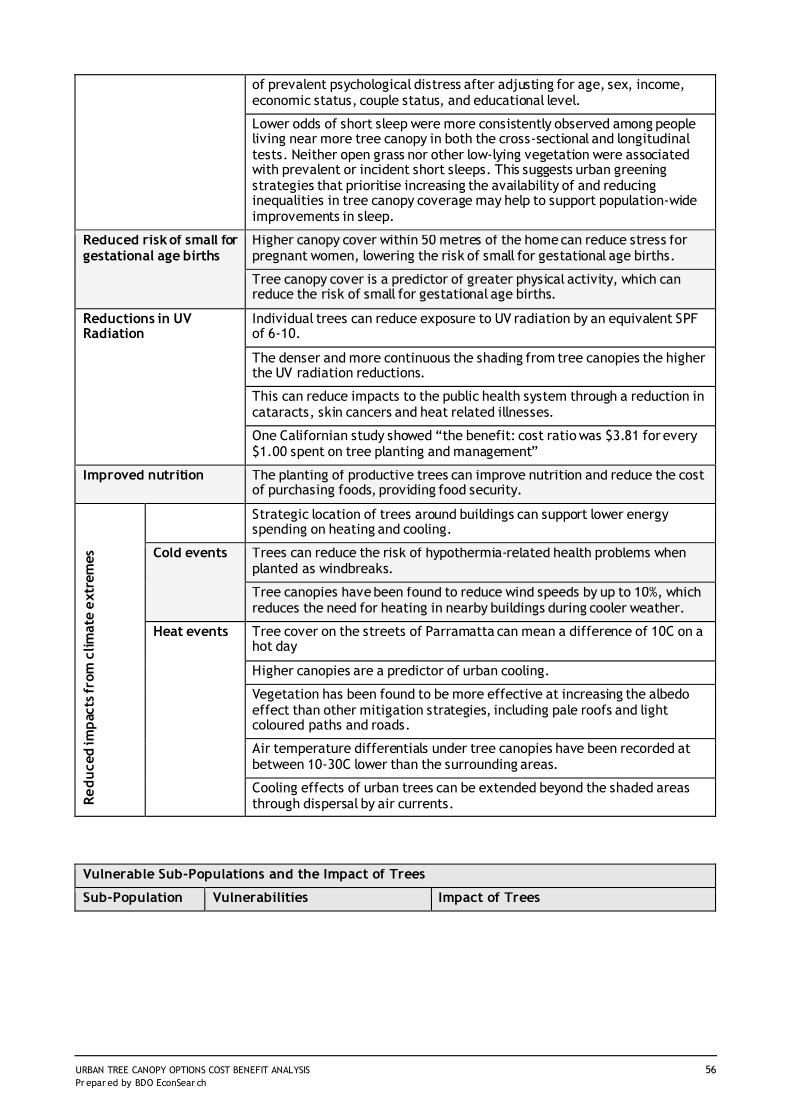
URBAN TREE CANOPY OPTIONS COST BENEFIT ANALYSIS 56 Pr epar ed by BDO EconSear ch
of prevalent psychological distress after adjusting for age, sex, income, economic status, couple status, and educational level.
Lower odds of short sleep were more consistently observed among people living near more tree canopy in both the cross-sectional and longitudinal tests. Neither open grass nor other low-lying vegetation were associated with prevalent or incident short sleeps. This suggests urban greening strategies that prioritise increasing the availability of and reducing inequalities in tree canopy coverage may help to support population-wide improvements in sleep.
Reduced risk of small for gestational age births
Higher canopy cover within 50 metres of the home can reduce stress for pregnant women, lowering the risk of small for gestational age births.
Tree canopy cover is a predictor of greater physical activity, which can reduce the risk of small for gestational age births.
Reductions in UV Radiation
Individual trees can reduce exposure to UV radiation by an equivalent SPF of 6-10.
The denser and more continuous the shading from tree canopies the higher the UV radiation reductions.
This can reduce impacts to the public health system through a reduction in cataracts, skin cancers and heat related illnesses.
One Californian study showed “the benefit: cost ratio was $3.81 for every $1.00 spent on tree planting and management”
Improved nutrition The planting of productive trees can improve nutrition and reduce the cost of purchasing foods, providing food security.
Redu
ced
impa
cts f
rom
clim
ate
extr
emes
Strategic location of trees around buildings can support lower energy spending on heating and cooling.
Cold events Trees can reduce the risk of hypothermia-related health problems when planted as windbreaks.
Tree canopies have been found to reduce wind speeds by up to 10%, which reduces the need for heating in nearby buildings during cooler weather.
Heat events Tree cover on the streets of Parramatta can mean a difference of 10C on a hot day
Higher canopies are a predictor of urban cooling.
Vegetation has been found to be more effective at increasing the albedo effect than other mitigation strategies, including pale roofs and light coloured paths and roads.
Air temperature differentials under tree canopies have been recorded at between 10-30C lower than the surrounding areas.
Cooling effects of urban trees can be extended beyond the shaded areas through dispersal by air currents.
Vulnerable Sub-Populations and the Impact of Trees
Sub-Population Vulnerabilities Impact of Trees

URBAN TREE CANOPY OPTIONS COST BENEFIT ANALYSIS 57 Pr epar ed by BDO EconSear ch
Elderly50 Physiological changes: • Less active/delayed sweat
response leading to dehydration as not as likely to increase fluid intake as thirst response is delayed.
• Decreased ability to increase blood flow to the skin to dissipate heat.
• Concerns over bladder control and reduced renal system functions, which may discourage drinking for fear of embarrassing situations.
• Likely to have multi-variant pre-existing chronic health illnesses which are frequently associated with increased risk from heat-related illness.
• Medications which may increase heat production, increase speed of dehydration and impair natural thermoregulation.
• May have cognitive impairments and not perceive heat
It has been estimated that, in heat events, shading provided by large trees can reduce energy use and associated bills by 10%. Strategic placement of trees around buildings has been found to reduce air conditioning requirements by up to 30% and heating requirements by up to 20-50%. Vegetation has been found to be more effective at increasing the albedo effect than other mitigation strategies, including pale roofs and light coloured paths and roads.
Managing thermal environments: • House may be older buildings
which can be thermally inefficient – draughty, poor solar orientation, poorly insulated
• Less likely to run air conditioners due to the costs of electricity costs when on a fixed income
Mental and Behavioural Disorders
Physiological susceptibilities: • Evidence of a number of
disorders becoming exacerbated when ambient temperatures reach, and exceed, 26.7C.
• A range of disorders, and treatment medications, can interfere with thermoregulation by: o Reducing the ability to sweat, o Increasing core body
temperature. • Impaired cognitive awareness of
environmental conditions and subsequent appropriate reactions to these conditions can exacerbate risk to heat related illness.
It has been estimated that, in heat events, shading provided by large trees can reduce energy use and associated bills by 10%. Strategic placement of trees around buildings has been found to reduce air conditioning requirements by up to 30% and heating requirements by up to 20-50% Vegetation has been found to be more effective at increasing the albedo effect than other mitigation strategies, including pale roofs and light coloured paths and roads.
Managing the cumulative impacts of longer lasting, more intense extreme temperature events is a future challenge for the public health system. Given the constraints of councils to plant trees in public spaces, the impact of planting on private property to assist with climate mitigation and improved public health and wellbeing outcomes should not be underestimated. Strategic selection of species and planting location
50 Elderly people are those ages 65+ years.

URBAN TREE CANOPY OPTIONS COST BENEFIT ANALYSIS 58 Pr epar ed by BDO EconSear ch
in private properties may be a low-cost and effective strategy to assist in mitigating the impacts of extreme temperature events, not only for those vulnerable sub-populations, but for residents of neighbouring properties too.
Other key trends, benefits and challenges
Benefits of taking action + ‘costs doing nothing’
Examples / evidence
Mitigating the impacts of climate change
Climate projections indicate there will be: • Warming temperatures in all seasons across South Australia. By
2100 it is projected that average temperatures will increase by up to 3°C.
• Increasing frequency and intensity of heatwaves and hot days. By 2100 it is projected that Adelaide will experience more than 15 days over 40°C per year and Marree will experience more than 50 days over 50°C per year.
• Reduced annual rainfall and more time spent in drought. By 2100 it is projected that winter and spring rainfall will decrease by between 10% and 45%.
Recent Regional Climate Partnerships work has found that green infrastructure (trees and shrubs) significantly reduce local surface temperatures: • For example, 2.8 C + an additional 1.7C if irrigated.
Reducing the loss of tree canopy in existing metropolitan Adelaide neighbourhoods
Overall 1.92% tree canopy loss (2013-216) Adelaide has the second lowest tree canopy levels in Australian capital cities
Higher household running costs
US studies have found that tree shade can also reduce air conditioning costs of buildings by 20-50% providing suitable tree placement Increasing tree cover by 10% – or strategically planting about three shade trees per building lot – saves annual heating and cooling costs by an estimated $50 to $90 per dwelling.
Social license / community support / affordability
The existing Residential Code is silent on stormwater management, WSUD and landscaping requirements. This is one of the reasons that there is rising concern amongst some community members about small scale infill development. Including some policy to mitigate this concern may help keep the ‘social licence’ for continuing infill development to support affordable housing provision in locations well serviced by public transport as well as avoid need to avoid further encroachment into valuable primary production and environmental assets at the fringes of metropolitan Adelaide. Adelaide has the lowest residential construction cost in Australia Housing supply in established neighbourhoods is critical to maintaining affordability
Increased property values and economic value of protecting infrastructure
AECOM research focuses on three Sydney suburbs, where we conservatively estimate that a 10 percent increase in the leaf canopy of street trees could increase the value of properties by an average of $50,000 It is estimated that properties in tree-lined streets are valued around 30% higher than those in streets without trees. Urban forests that provide significant canopy coverage improve the lifespan of certain assets such as asphalt by shading them from harmful UV rays – potentially by 30%.

URBAN TREE CANOPY OPTIONS COST BENEFIT ANALYSIS 59 Pr epar ed by BDO EconSear ch
In Perth, “broad leaved street trees were shown to have a significant effect on the sale price of properties, increasing the median value by $16,889.
Economic value of trees In Adelaide a four year old tree was estimated to generate a gross annual benefit of $171/ tree, consisting of energy savings, air quality improvements, stormwater management, aesthetics and other benefits. It has been suggested that this value is closer to $424/tree. Urban forests that provide significant canopy coverage improve the lifespan of certain assets such as asphalt by shading them from harmful UV rays – potentially by 30%. One Californian study showed …..“the benefit: cost ratio was $3.81 for every $1.00 spent on tree planting and management” (Maco and Macpherson in Ely, 2010).
Reference list i. Sarajevs, V. (2011). Health benefits of street trees. Forest Research, Forestry Commission.
Bristol. UK. ii. Heart Foundation. (2013). Position snapshot: Making the case for investment in street trees and
landscaping in urban environments. Adelaide. iii. Davern, M., Farrar, A., Kendal, D., Giles-Corti, B. (2017). Quality Green Space Supporting Health,
Wellbeing and Biodiversity: A literature review. University of Melbourne. Victoria. iv. Kardan, O., Gozdyra, P., Misic, B., Moola, F., Palmer, L.J., Paus, T., Berman, MG. (2015).
Neighbourhood greenspace and health in a large urban centre. Scientific Reports. 5. Article 11610. doi: 10.1038/srep11610.
v. Food and Agriculture Organization of the United Nations. (2016). Building greener cities: Nine benefits of urban trees. United Nations. Rome.
vi. McDonald, R., Aljabar, L., Aubuchon, C., Girnbaum, HG., Chandler, C., Toomey, B., Daley, J., Jimenez, W., Trieschman, E., Paque, J., Zeiper, M. (2017). Funding trees for health: An analysis of finance and policy actions to enable tree planting for public health. The Nature Conservancy. Virginia.
vii. Nowak, D.J. and Greenfield, E.J. 2018., US Urban Forest Statistics, Values, and Projections, https://www.fs.fed.us/nrs/pubs/jrnl/2018/nrs_2018_Nowak_003.pdf
viii. Karden et al, 2015, Neighborhood greenspace and health in a large urban center. www.nature.com/articles/srep11610
ix. Thomas Astell-Burt, Xiaoqi Feng, 2019, Association of urban green space with mental health and general health among adults in Australia, https://apo.org.au/node/250246
x. McDonald et al, 2016, Planting healthy air: A global analysis of the role of urban trees in addressing particulate matter pollution and extreme heat, https://thought-leadership-production.s3.amazonaws.com/2016/10/28/17/17/50/0615788b-8eaf-4b4f-a02a-8819c68278ef/20160825_PHA_Report_FINAL.pdf
xi. Thomas Astell-Burta and Xiaoqi Fengb, 2019, Does sleep grow on trees? A longitudinal study to investigate potential prevention of insufficient sleep with different types of urban green space, https://www.sciencedirect.com/science/article/pii/S2352827319301703
xii. Donovan, GH., Michael, YL., Butry, DT., Sullivan, AD., Chase, JM. (2011). Planting Healthy Air: A Global analysis of the role of urban trees in addressing particular matter pollution and urban heat, Urban trees and the risk of poor birth outcomes. Health & Place. 17. doi:10.1016/j.healthplace.2010.11.004, https://thought-leadership-production.s3.amazonaws.com/2016/10/28/17/17/50/0615788b-8eaf-4b4f-a02a-8819c68278ef/20160825_PHA_Report_FINAL.pdf
xiii. Ely and Pitman, 2012, Green Infrastructure Life support for human habitats The compelling evidence for incorporating nature into urban environments, https://www.researchgate.net/publication/278028732_Green_infrastructure_as_life_support_Urban_nature_and_climate_change

URBAN TREE CANOPY OPTIONS COST BENEFIT ANALYSIS 60 Pr epar ed by BDO EconSear ch
xiv. Killicoat, P., Puzio, E., Stringer, R. (2002). The economic value of trees in urban areas: Estimating the benefits of Adelaide’s street trees. Treenet Proceedings of the 3rd National Street Tree Symposium. 5-6 September.
xv. Amin, M, 2019, These two Western Sydney streets are completely different temperatures — here's why
xvi. https://www.abc.net.au/news/2019-11-21/western-sydney-heatwave-alleviated-by-tree-cover/11721698
xvii. Australian Government. (2019). An assessment of Australia’s future infrastructure needs: The Australian infrastructure audit 2019. Infrastructure Australia. https://www.infrastructureaustralia.gov.au/sites/default/files/2019-08/Australian%20Infrastructure%20Audit%202019.pdf [Accessed 12 September 2019]
xviii. Ingleton, G. (2019). Smart water for a smart future. Cooler, greener Adelaide presentation. 20 March 2019. https://www.watersensitivesa.com/wp-content/uploads/08-GregIngleton.pdf and https://youtu.be/CtfJkrBaO-s [Accessed 9 September 2019].
xix. Thomson, S. (2019). Don’t suffer small thinking: Living green in challenging spaces. Cooler, greener Adelaide presentation. 20 March 2019. https://youtu.be/-xzkd_7y9Pw [Accessed 9 September 2019].
xx. Hansen, A., Peng, B., Nitschke, N., Ryan, P., Pisaniello, D., Tucker, G. (2008). The effect of heat waves on mental health in a temperate Australian city. Environmental Health Perspectives. 116(10). doi:10.1289/ehp.11339
xxi. Nitschke, M., Hansen, A., Peng, B., Pisaniello, D., Newbury, J., Kitson, A., Tucker, G., Avery, J., Dal Grande, E. (2013) Risk factors, health effects and behaviour in older people during extreme heat: A survey in South Australia. International Journal of Environmental Research and Public Health. 10(12). doi:10.3390/ijerph10126721
xxii. Hansen, A., Peng, B., Nitschke, N., Pisaniello, D., Newbury, J., Kitson, A. (2011). Older persons and heat-susceptibility: The role of health promotion in a changing climate. Health Promotion Journal of Australia. I22 Special Issue.
xxiii. Williams, S., Venugopal, K., Nitschke, M., Nairn, J., Fawcett, R., Beattie, C., Wynwood, G., Peng, B. (2018). Regional morbidity and mortality during heatwaves in South Australia. International Journal of Biometerology. https://doi.org/10.1007/s00484-018-1593-4
xxiv. Australian Climate Change Science Program, 2016, Climate Change in Australia, https://www.climatechangeinaustralia.gov.au/media/ccia/2.1.6/cms_page_media/176/AUSTRALIAS_CHANGING_CLIMATE_1.pdf
xxv. Seed Consulting Services et al. 2017, Western Adelaide Heat Mapping Project, www.westtorrens.sa.gov.au/CWT/content/Environment/Climate_change/Urban_heat_mapping
xxvi. Amati, M., 2017, Where should all the trees go? Investigating the impact of tree canopy cover on socio-economic status and wellbeing in LGAs https://www.greenlifeindustry.com.au/Attachment?Action=Download&Attachment_id=2175
xxvii. Institute for Sustainable Futures, 2014, Benchmarking Australia’s Urban Canopy, An i-Tree Assessment, Final Report, https://202020vision.com.au/media/7141/final-report_140930.pdf
xxviii. Rahman, Mohammad, 2016, What we know and don’t know about the cooling benefits of urban trees, University of Munich.
xxix. McPherson E.G, Rowntree R., 1993. Energy Conservation Potential of Urban Tree planting. Journal of Arboriculture 19(6), 321-331.
xxx. AECOM, 2017, A Brilliant Cities Report, https://www.clearwatervic.com.au/resource-library/publications-and-reports/a-brilliant-cities-report-green-infrastructure.php.
xxxi. Sander H., Polasky S., Haight R.G., 2010. The value of urban tree cover: a hedonic property price model in Ramsay and Dakota, Minnesota, USA. Ecological Economics 69(8), 1646-4656.
xxxii. Islands’, G McPherson, Centre for Urban Forest Research, USDA Forest Service, 2009. xxxiii. Pandit et al, 2013, The effect of street trees on property value in Perth, Western Australia,
https://research-repository.uwa.edu.au/en/publications/the-effect-of-street-trees-on-property-value-in-perth-western-aus
xxxiv. National Heart Foundation of Australia, Ely M. Building the case for the role of landscaping in urban street design (unpublished). 2012

URBAN TREE CANOPY OPTIONS COST BENEFIT ANALYSIS 61 Pr epar ed by BDO EconSear ch
xxxv. City of Melbourne, 2012, Urban Forest Strategy, Making a great city greener 2012-2032, https://www.melbourne.vic.gov.au/SiteCollectionDocuments/urban-forest-strategy.pdf
xxxvi. Ely, M, 2010, Tree Literate Design: Integrating trees into the design of the city. September 2010.

URBAN TREE CANOPY OPTIONS COST BENEFIT ANALYSIS 62 Pr epar ed by BDO EconSear ch
Case Study: Tree canopy retained, lost and planted in Glengowrie, City of Marion
Case study undertaken by AGD to determine whether new infill developments typically keep their existing tree(s) and/or plant a new tree.
The case study site chosen was the Frederick Street Stormwater Catchment area in Glengowrie, City of Marion. This area was chosen as it has had significant infill development, and is the same case study site used in the Stormwater Report.
Refer below and overleaf for a copy of the maps produced.
Glengowrie Case Study Site - Minor Infill and Tree Canopy Assessment – 2007

URBAN TREE CANOPY OPTIONS COST BENEFIT ANALYSIS 63 Pr epar ed by BDO EconSear ch
Glengowrie Case Study Site - Minor Infill and Tree Canopy Assessment – 2019

URBAN TREE CANOPY OPTIONS COST BENEFIT ANALYSIS 64 Pr epar ed by BDO EconSear ch
Costings – tree effect on footings The following approach was undertaken by AGD to investigate the impact of trees on footings on new dwellings:
• Commission of independent advice from TMK Consulting engineering (with costings undertaken by Centina)
• Commission of independent advice from PT Design consulting engineering (with costings undertaken by Centina)
• Rivergum Homes organised for four of their completed dwellings to be reviewed by Intrax Consulting Engineers.

URBAN TREE CANOPY OPTIONS COST BENEFIT ANALYSIS 65 Pr epar ed by BDO EconSear ch

URBAN TREE CANOPY OPTIONS COST BENEFIT ANALYSIS 66 Pr epar ed by BDO EconSear ch
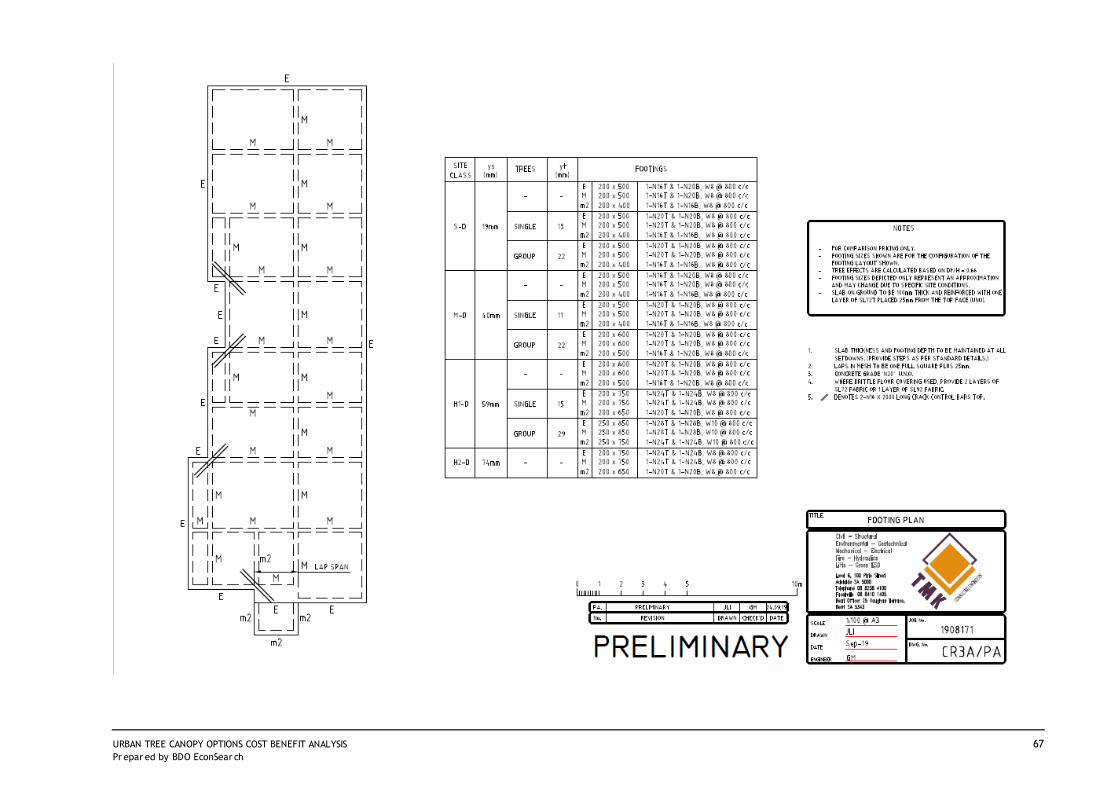
URBAN TREE CANOPY OPTIONS COST BENEFIT ANALYSIS 67 Pr epar ed by BDO EconSear ch

URBAN TREE CANOPY OPTIONS COST BENEFIT ANALYSIS 68 Pr epar ed by BDO EconSear ch

URBAN TREE CANOPY OPTIONS COST BENEFIT ANALYSIS 69 Pr epar ed by BDO EconSear ch
AGD - FOOTING ASSESSMENT (2) 14.10.2019 SITE CLASS
ys (mm)
DESIGN LAYOUT
TREES
yt (mm)
FOOTING BEAM
FOOTING SIZE
REINFORCEMENT
TOTAL COST (inc. GST)
E/O for TREE EFFECTS
% INCREASE
S-D
19mm
CR3A_PA
-
-
E 200x500 1-N16T & 1-N20B. W8 @ 800 c/c $19,602.76
-
M 200x500 1-N16T & 1-N20B. W8 @ 800 c/c
m2 200x400 1-N16T & 1-N16B. W8 @ 800 c/c CR3A_PA
SINGLE
13
E 200x500 1-N20T & 1-N20B. W8 @ 800 c/c $20,110.96
$508.20
3% M 200x500 1-N20T & 1-N20B. W8 @ 800 c/c
m2 200x400 1-N16T & 1-N16B. W8 @ 800 c/c
M-D
40mm
CR3A_PA
-
-
E 200x500 1-N16T & 1-N20B. W8 @ 800 c/c $19,602.76
-
M 200x500 1-N16T & 1-N20B. W8 @ 800 c/c
m2 200x400 1-N16T & 1-N16B. W8 @ 800 c/c CR3A_PA
SINGLE
11
E 200x500 1-N20T & 1-N20B. W8 @ 800 c/c $20,098.86
$496.10
3% M 200x500 1-N20T & 1-N20B. W8 @ 800 c/c
m2 200x400 1-N16T & 1-N16B. W8 @ 800 c/c
H1-D
59mm
CR3A_PA
-
-
E 200x600 1-N20T & 1-N20B. W8 @ 800 c/c $21,421.03
-
M 200x600 1-N20T & 1-N20B. W8 @ 800 c/c
m2 200x500 1-N16T & 1-N20B. W8 @ 800 c/c CR3A_PA
SINGLE
15
E 200x750 1-N24T & 1-N24B. W8 @ 800 c/c $24,904.68
$3,483.66
16% M 200x750 1-N24T & 1-N24B. W8 @ 800 c/c
m2 200x650 1-N20T & 1-N20B. W8 @ 800 c/c
H2-D
74mm
CR3A_PA
-
-
E 200x750 1-N24T & 1-N24B. W8 @ 800 c/c $24,904.68
-
M 200x750 1-N24T & 1-N24B. W8 @ 800 c/c
m2 200x650 1-N20T & 1-N20B. W8 @ 800 c/c CR3B_PA
SINGLE
28
E 200x800 1-N28T & 1-N28B. W10 @ 800 c/c $28,707.38
$3,802.69
15% M 200x800 1-N28T & 1-N28B. W10 @ 800 c/c
m2 200x650 1-N20T & 1-N20B. W10 @ 800 c/c
E-D
104mm
CR3B_PA
-
-
E 250x900 1-N28T & 1-N28B. W10 @ 800 c/c
$33,935.95
-
M 250x900 1-N28T & 1-N28B. W10 @ 800 c/c
m2 250x750 1-N24T & 1-N24B. W10 @ 800 c/c
CR3B_PA
SINGLE
31
E 250x1100 1-N32T & 1-N32B. W10 @ 800 c/c $39,612.30
$5,676.35
17%
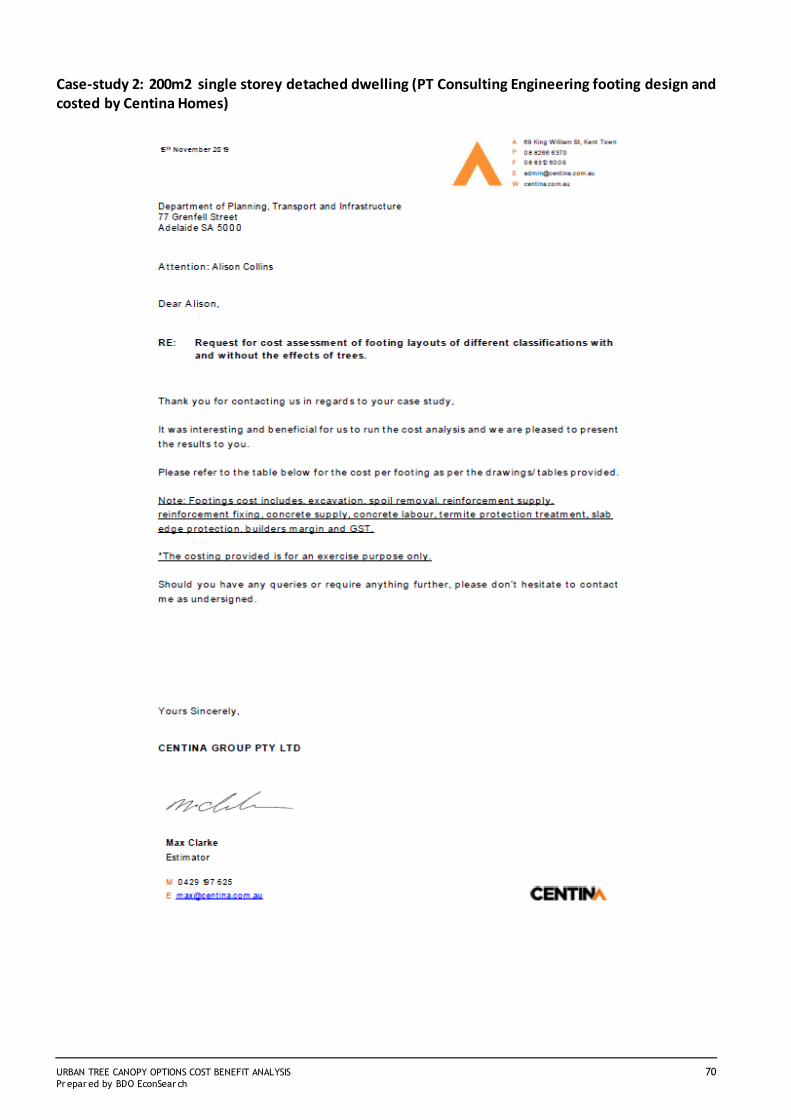
URBAN TREE CANOPY OPTIONS COST BENEFIT ANALYSIS 70 Pr epar ed by BDO EconSear ch
Case-study 2: 200m2 single storey detached dwelling (PT Consulting Engineering footing design and costed by Centina Homes)

URBAN TREE CANOPY OPTIONS COST BENEFIT ANALYSIS 71 Pr epar ed by BDO EconSear ch

URBAN TREE CANOPY OPTIONS COST BENEFIT ANALYSIS 72 Pr epar ed by BDO EconSear ch
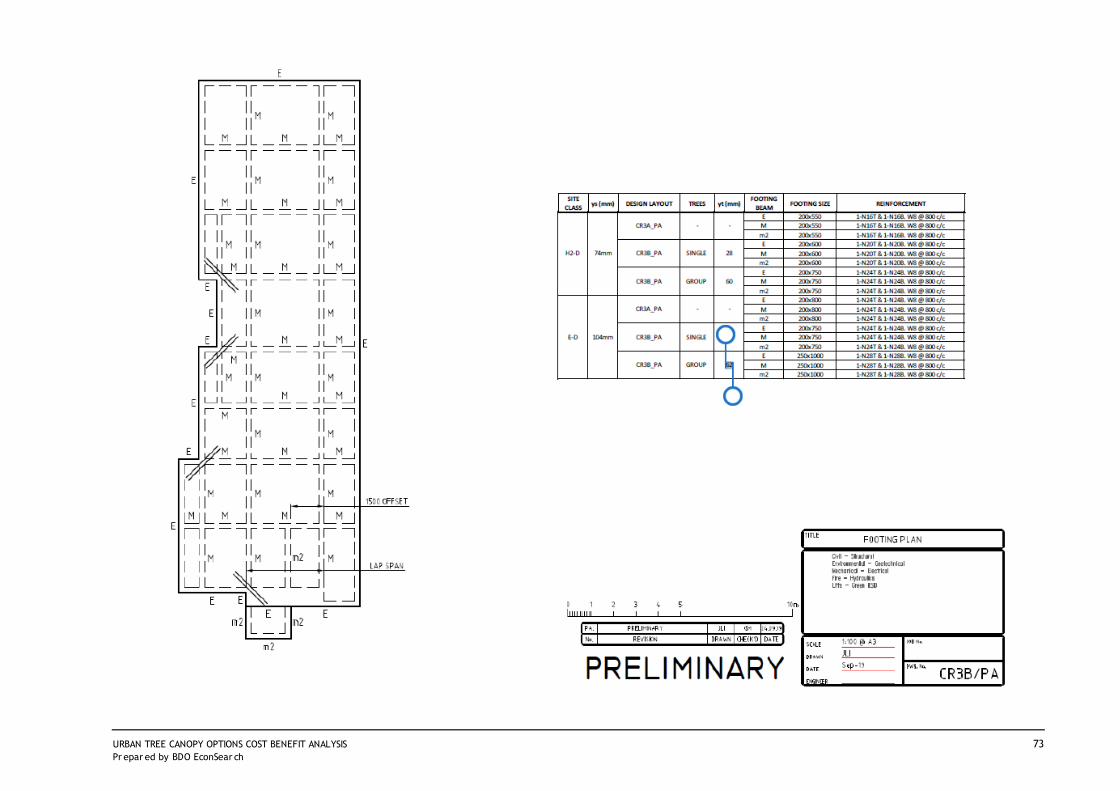
URBAN TREE CANOPY OPTIONS COST BENEFIT ANALYSIS 73 Pr epar ed by BDO EconSear ch

URBAN TREE CANOPY OPTIONS COST BENEFIT ANALYSIS 74 Pr epar ed by BDO EconSear ch
AGD - FOOTING ASSESSMENT (2) 15.11.2019 SITE CLASS ys (mm) DESIGN
LAYOUT TREES yt
(mm) FOOTING BEAM FOOTING SIZE REINFORCEMENT TOTAL COST
(inc. GST) E/O for TREE EFFECTS
% INCREASE
S-D
19mm
CR3A_PA
-
-
E 200x350 1-N12T & 1-N12B. W8 @ 800 c/c $17,549.24
-
M 200x350 1-N16T & 1-N16B. W8 @ 800 c/c
m2 200x350 1-N16T & 1-N16B. W8 @ 800 c/c
CR3A_PA
SINGLE
13 E 200x400 1-N16T & 1-N16B. W8 @ 800 c/c
$19,046.44
$1,497.20
9% M 200x400 1-N16T & 1-N16B. W8 @ 800 c/c m2 200x400 1-N16T & 1-N16B. W8 @ 800 c/c
M-D
40mm
CR3A_PA
-
-
E 200x400 1-N16T & 1-N16B. W8 @ 800 c/c $19,046.44
-
M 200x400 1-N16T & 1-N16B. W8 @ 800 c/c
m2 200x400 1-N16T & 1-N16B. W8 @ 800 c/c
CR3A_PA
SINGLE
11 E 200x500 1-N16T & 1-N16B. W8 @ 800 c/c
$19,745.03
$698.60
4% M 200x500 1-N16T & 1-N16B. W8 @ 800 c/c m2 200x500 1-N16T & 1-N16B. W8 @ 800 c/c
H1-D
59mm
CR3A_PA
-
-
E 200x500 1-N16T & 1-N16B. W8 @ 800 c/c $20,443.63
-
M 200x500 1-N16T & 1-N16B. W8 @ 800 c/c
m2 200x500 1-N16T & 1-N16B. W8 @ 800 c/c
CR3A_PA
SINGLE
15
E 200x550 1-N20T & 1-N20B. W8 @ 800 c/c
$22,153.78
$1,710.16
8% M 200x550 1-N20T & 1-N20B. W8 @ 800 c/c
m2 200x550 1-N20T & 1-N20B. W8 @ 800 c/c
H2-D
74mm
CR3A_PA
-
-
E 200x550 1-N16T & 1-N16B. W8 @ 800 c/c
$21,142.22
-
M 200x550 1-N16T & 1-N16B. W8 @ 800 c/c
m2 200x550 1-N16T & 1-N16B. W8 @ 800 c/c
CR3B_PA
SINGLE
28
E 200x600 1-N20T & 1-N20B. W8 @ 800 c/c
$24,611.42
$3,469.20
16% M 200x600 1-N20T & 1-N20B. W8 @ 800 c/c
m2 200x600 1-N20T & 1-N20B. W8 @ 800 c/c
E-D
104mm
CR3A_PA
-
-
E 200x800 1-N24T & 1-N24B. W8 @ 800 c/c $26,871.28
-
M 200x800 1-N24T & 1-N24B. W8 @ 800 c/c
m2 200x800 1-N24T & 1-N24B. W8 @ 800 c/c CR3B_PA SINGLE 31 E 200x750 1-N24T & 1-N24B. W8 @ 800 c/c $28,408.09 $1,536.81 6%
M 200x750 1-N24T & 1-N24B. W8 @ 800 c/c m2 200x750 1-N24T & 1-N24B. W8 @ 800 c/c

URBAN TREE CANOPY OPTIONS COST BENEFIT ANALYSIS 75 Pr epar ed by BDO EconSear ch
Case-study 3: 90m2 two storey townhouse (PT Consulting Engineering footing design and costed by Centina Homes)

URBAN TREE CANOPY OPTIONS COST BENEFIT ANALYSIS 76 Pr epar ed by BDO EconSear ch

URBAN TREE CANOPY OPTIONS COST BENEFIT ANALYSIS 77 Pr epar ed by BDO EconSear ch
AGD - FOOTING ASSESSMENT 3 - 19.11.2019 SITE
CLASS ys
(mm) DESIGN LAYOUT
TREES yt (mm)
FOOTING SIZE REINFORCEMENT TOTAL COST (inc. GST)
E/O for TREE EFFECTS
% INCREASE
S-D
20mm
21428 - - 350x300 3-N12T & 3-N12B. W8 @ 800 c/c $12,349.64 -
21428 SINGLE 7.2 400x300 3-N12T & 3-N12B. W8 @ 800 c/c $12,937.19 $587.55 5%
M-D
40mm
21428 - - 450x300 3-N12T & 3-N12B. W8 @ 800 c/c $13,524.75 -
21428 SINGLE 14.3 500x300 3-N12T & 3-N12B. W8 @ 800 c/c $14,125.61 $600.86 4%
H1-D
60mm
21428 - - 500x300 3-N12T & 3-N12B. W8 @ 800 c/c $14,125.61 -
21428 SINGLE 21.5 500x300 3-N12T & 4-N12B. W8 @ 800 c/c $14,311.95 $186.34 1%
H2-D
75mm
21428 - - 500x300 3-N16T & 3-N16B. W8 @ 800 c/c $15,256.96 -
21428 SINGLE 26.9 700x300 3-N16T & 3-N16B. W8 @ 800 c/c $17,633.80 $2,376.84 16%
E-D
105mm
21428 - - 1100x300 3-N16T & 3-N16B. W8 @ 800 c/c $22,374.16 -
21428 SINGLE 37.6 1000x350 3-N16T & 3-N16B. W8 @ 800 c/c $23,459.26 $1,085.10 5%

URBAN TREE CANOPY OPTIONS COST BENEFIT ANALYSIS 78 Pr epar ed by BDO EconSear ch
Costing of completed dwellings (Rivergum Homes)
Rivergum Homes supplied four randomly selected real life examples to Intrax Consulting Engineers to test the effects of trees on footings and the subsequent costs of this. The Intrax engineer also identified whether the original footing design considered the effect of trees and therefore whether trees were actually a new cost or not. For all projects, every tree identified on the survey (and shown on the civil plan) was considered during the original design. This includes street trees and neighbouring trees if they are visible at the time of the survey/design. Dwellings 51 in the following geographical locations (soil types) were selected:
• Mount Barker • Aldinga Beach • Plympton Park • Elizabeth North.
Rivergum Homes subsequently organised for one of their cost estimators to provide costings. Key findings All sites had existing tree effects when they were built. For 3 out of the 4 dwellings, the critical existing tree was actually located outside of the property. Therefore even if a site is free from trees at the time of being built, often they will have to take into account neighbouring or street trees. In all cases, it was considered that if the engineer was astute, and had control over tree placement, the effects of planting the new tree could have been negligible. Even in this small analysis it has highlighted that having an engineer with a very good understanding of nuances in the tree requirements in the code and this policy could have a large impact on their ability to achieve more favourable results (assuming they have discretion over where the tree is planted) than would have been the case in the past. Two of the developments assessed (Elizabeth and Mount Barker) could have had different outcomes depending on engineer's choices. Costings
The cost estimator undertook a comparison between costings for current, proposed and no tree effect footing design depth. The cost estimator also advised that as a guide, the additional cost to footings is approximately $2,000 retail for every 100mm added to the depth of the footing.
5151 These had a range of different allotment sizes and dwelling characteristics.

URBAN TREE CANOPY OPTIONS COST BENEFIT ANALYSIS 79 Pr epar ed by BDO EconSear ch
APPENDIX 2 Detailed CBA Models
Appendix Table 2-1 Detailed community level CBA, Option 1a,b
a Years 2-4, 7-9, 12-14 and 17-23 hidden for presentational purposes. b In current dollars.
BDO EconSearch analysis.
Base Case PV 2021 2025 2026 2030 2031 2035 2036 2044 2045Benefits ($m)
Improved air quality 0.66 0.00 0.02 0.02 0.04 0.05 0.07 0.08 0.14 0.15Carbon removed 0.24 0.00 0.01 0.01 0.01 0.02 0.03 0.03 0.06 0.06Avoided stormwater runoff 0.16 0.00 0.00 0.01 0.01 0.01 0.02 0.02 0.03 0.04Avoided loss of stored carbon 0.79 0.05 0.05 0.06 0.06 0.06 0.06 0.06 0.07 0.07Reduced household electricity use 24.08 0.11 0.65 0.82 1.56 1.76 2.67 2.92 5.21 5.52
Total Benefits ($m) 25.93 0.17 0.74 0.91 1.68 1.90 2.85 3.11 5.52 5.84Costs ($m)
House footing costs 86.86 6.36 6.36 6.54 6.54 6.32 6.32 6.42 6.42 6.42On-site tree planting & maintenance costs 9.06 0.29 0.46 0.51 0.67 0.71 0.87 0.91 1.24 1.28
Total Costs ($m) 95.92 6.65 6.81 7.05 7.22 7.02 7.18 7.33 7.66 7.70Option 1
Benefits ($m)Amenity 24.47 1.79 1.79 1.84 1.84 1.78 1.78 1.81 1.81 1.81Improved air quality 1.06 0.01 0.03 0.04 0.07 0.08 0.12 0.13 0.23 0.24Carbon removed 0.38 0.00 0.01 0.01 0.02 0.03 0.04 0.05 0.09 0.10Avoided stormwater runoff 0.25 0.00 0.01 0.01 0.02 0.02 0.03 0.03 0.05 0.06Avoided loss of stored carbon 1.19 0.07 0.08 0.08 0.09 0.09 0.09 0.10 0.11 0.11Reduced household electricity use 39.13 0.17 1.02 1.28 2.49 2.83 4.34 4.77 8.66 9.19Avoided mental health costs 23.80 0.10 0.60 0.75 1.48 1.68 2.63 2.89 5.46 5.84
Total Benefits ($m) 90.28 2.14 3.54 4.02 6.01 6.50 9.03 9.77 16.41 17.34Costs ($m)
House footing costs 115.81 8.48 8.48 8.72 8.72 8.42 8.42 8.56 8.56 8.56On-site tree planting & maintenance costs 18.10 0.59 0.91 1.01 1.35 1.41 1.73 1.82 2.48 2.56
Total Costs ($m) 133.91 9.06 9.39 9.74 10.07 9.83 10.15 10.38 11.04 11.12Incremental Benefits ($m) 64.35 1.98 2.80 3.11 4.32 4.60 6.18 6.66 10.89 11.50Incremental Costs ($m) 37.98 2.41 2.57 2.69 2.85 2.81 2.97 3.05 3.38 3.42Net Benefits (NPV) ($m) 26.36 -0.44 0.23 0.42 1.47 1.80 3.21 3.61 7.51 8.08Standard BCR 1.7

URBAN TREE CANOPY OPTIONS COST BENEFIT ANALYSIS 80 Pr epar ed by BDO EconSear ch
Appendix Table 2-2 Detailed community level CBA, Option 2a,b
a Years 2-4, 7-9, 12-14 and 17-23 hidden for presentational purposes. b In current dollars. BDO EconSearch analysis.
Base Case PV 2021 2025 2026 2030 2031 2035 2036 2044 2045Benefits ($m)
Improved air quality 0.66 0.00 0.02 0.02 0.04 0.05 0.07 0.08 0.14 0.15Carbon removed 0.24 0.00 0.01 0.01 0.01 0.02 0.03 0.03 0.06 0.06Avoided stormwater runoff 0.16 0.00 0.00 0.01 0.01 0.01 0.02 0.02 0.03 0.04Avoided loss of stored carbon 0.79 0.05 0.05 0.06 0.06 0.06 0.06 0.06 0.07 0.07Reduced household electricity use 24.08 0.11 0.65 0.82 1.56 1.76 2.67 2.92 5.21 5.52
Total Benefits ($m) 25.93 0.17 0.74 0.91 1.68 1.90 2.85 3.11 5.52 5.84Costs ($m)
House footing costs 86.86 6.36 6.36 6.54 6.54 6.32 6.32 6.42 6.42 6.42On-site tree planting & maintenance costs 9.06 0.29 0.46 0.51 0.67 0.71 0.87 0.91 1.24 1.28
Total Costs ($m) 95.92 6.65 6.81 7.05 7.22 7.02 7.18 7.33 7.66 7.70Option 2
Benefits ($m)Amenity 128.46 9.40 9.40 9.68 9.68 9.34 9.34 9.49 9.49 9.49Improved air quality 1.27 0.01 0.04 0.05 0.08 0.09 0.14 0.15 0.27 0.28Carbon removed 0.45 0.00 0.01 0.01 0.03 0.03 0.05 0.05 0.11 0.12Avoided stormwater runoff 0.30 0.00 0.01 0.01 0.02 0.02 0.03 0.04 0.06 0.07Avoided loss of stored carbon 1.58 0.10 0.11 0.11 0.12 0.12 0.13 0.13 0.15 0.15Reduced household electricity use 40.68 0.22 1.21 1.49 2.73 3.06 4.50 4.89 8.35 8.81Avoided mental health costs 36.75 0.19 1.05 1.30 2.41 2.72 4.05 4.42 7.81 8.30Offset scheme receipts (Government) 99.82 7.31 7.31 7.52 7.52 7.26 7.26 7.38 7.38 7.38
Total Benefits ($m) 309.32 17.22 19.13 20.17 22.59 22.64 25.50 26.56 33.62 34.59Costs ($m)
House footing costs 89.48 6.55 6.55 6.74 6.74 6.51 6.51 6.61 6.61 6.61On-site tree planting & maintenance costs 6.96 0.23 0.35 0.39 0.52 0.54 0.67 0.70 0.95 0.98Off-site tree planting & maintenance costs 14.82 0.80 0.93 0.98 1.11 1.11 1.24 1.28 1.53 1.57Offset scheme development & management 3.18 0.42 0.22 0.22 0.22 0.22 0.22 0.22 0.22 0.22Offset scheme payments (households) 99.82 7.31 7.31 7.52 7.52 7.26 7.26 7.38 7.38 7.38
Total Costs ($m) 214.26 15.30 15.35 15.85 16.11 15.64 15.89 16.19 16.70 16.76Incremental Benefits ($m) 283.39 17.05 18.39 19.26 20.91 20.74 22.65 23.44 28.10 28.74Incremental Costs ($m) 118.33 8.65 8.54 8.80 8.89 8.62 8.70 8.86 9.04 9.06Net Benefits (NPV) ($m) 165.06 8.40 9.85 10.46 12.02 12.13 13.95 14.58 19.06 19.69Standard BCR 2.4

URBAN TREE CANOPY OPTIONS COST BENEFIT ANALYSIS 81 Pr epar ed by BDO EconSear ch
Appendix Table 2-3 Detailed individual homeowner level CBA, Scenario 1a,b,c
a Years 2-4, 7-9, 12-14 and 17-23 hidden for presentational purposes. b In current dollars. c Scenario 1: tree is planted where there is an existing tree effect onsite from other, offsite trees or the new tree has a mature height that is outside the distance of tree effect. BDO EconSearch analysis.
Base Case PV 2021 2025 2026 2030 2031 2035 2036 2044 2045Benefits ($)Total Benefits ($) 0 0 0 0 0 0 0 0 0 0Costs ($)
House footing costs 1,411 1,411 0 0 0 0 0 0 0 0Total Costs ($) 1,411 1,411 0 0 0 0 0 0 0 0
Option 1 or 2Benefits ($)
Household electricity bill saving 570 4 21 25 42 46 63 67 96 99Property value increase (amenity) 922 922 0 0 0 0 0 0 0 0
Total Benefits ($) 1,491 926 21 25 42 46 63 67 96 99Costs ($)
House footing costs 1,411 1,411 0 0 0 0 0 0 0 0On-site tree planting & maintenance costs 603 220 30 30 30 30 30 30 30 30
Total Costs ($) 2,014 1,631 30 30 30 30 30 30 30 30Incremental Benefits ($) 1,491 926 21 25 42 46 63 67 96 99Incremental Costs ($) 603 220 30 30 30 30 30 30 30 30Net Benefits (NPV) ($) 888 705 -9 -5 12 16 33 37 65 68Standard BCR 2.5

URBAN TREE CANOPY OPTIONS COST BENEFIT ANALYSIS 82 Pr epar ed by BDO EconSear ch
Appendix Table 2-4 Detailed individual homeowner level CBA, Scenario 2a,b,c
a Years 2-4, 7-9, 12-14 and 17-23 hidden for presentational purposes. b In current dollars. c Scenario 2: tree is planted where it creates a tree effect requir ing additional cost to footings, double storey, least cost (less reactive soil). BDO EconSearch analysis.
Base Case PV 2021 2025 2026 2030 2031 2035 2036 2044 2045Benefits ($)Total Benefits ($) 0 0 0 0 0 0 0 0 0 0Costs ($)
House footing costs 0 0 0 0 0 0 0 0 0 0Total Costs ($) 0 0 0 0 0 0 0 0 0 0
Option 1 or 2Benefits ($)
Household electricity bill saving 570 4 21 25 42 46 63 67 96 99Property value increase (amenity) 922 922 0 0 0 0 0 0 0 0
Total Benefits ($) 1,491 926 21 25 42 46 63 67 96 99Costs ($)
House footing costs 186 186 0 0 0 0 0 0 0 0On-site tree planting & maintenance costs 603 220 30 30 30 30 30 30 30 30
Total Costs ($) 790 407 30 30 30 30 30 30 30 30Incremental Benefits ($) 1,491 926 21 25 42 46 63 67 96 99Incremental Costs ($) 790 407 30 30 30 30 30 30 30 30Net Benefits (NPV) ($) 702 519 -9 -5 12 16 33 37 65 68Standard BCR 1.9

URBAN TREE CANOPY OPTIONS COST BENEFIT ANALYSIS 83 Pr epar ed by BDO EconSear ch
Appendix Table 2-5 Detailed individual homeowner level CBA, Scenario 3a,b,c
a Years 2-4, 7-9, 12-14 and 17-23 hidden for presentational purposes. b In current dollars. c Scenario 3: tree is planted where it creates a tree effect requir ing additional cost to footings, double storey, greatest cost (more reactive soil). BDO EconSearch analysis.
Base Case PV 2021 2025 2026 2030 2031 2035 2036 2044 2045Benefits ($)Total Benefits ($) 0 0 0 0 0 0 0 0 0 0Costs ($)
House footing costs 0 0 0 0 0 0 0 0 0 0Total Costs ($) 0 0 0 0 0 0 0 0 0 0
Option 1 or 2Benefits ($)
Household electricity bill saving 570 4 21 25 42 46 63 67 96 99Property value increase (amenity) 922 922 0 0 0 0 0 0 0 0
Total Benefits ($) 1,491 926 21 25 42 46 63 67 96 99Costs ($)
House footing costs 2,377 2,377 0 0 0 0 0 0 0 0On-site tree planting & maintenance costs 603 220 30 30 30 30 30 30 30 30
Total Costs ($) 2,980 2,597 30 30 30 30 30 30 30 30Incremental Benefits ($) 1,491 926 21 25 42 46 63 67 96 99Incremental Costs ($) 2,980 2,597 30 30 30 30 30 30 30 30Net Benefits (NPV) ($) -1,489 -1,672 -9 -5 12 16 33 37 65 68Standard BCR 0.5
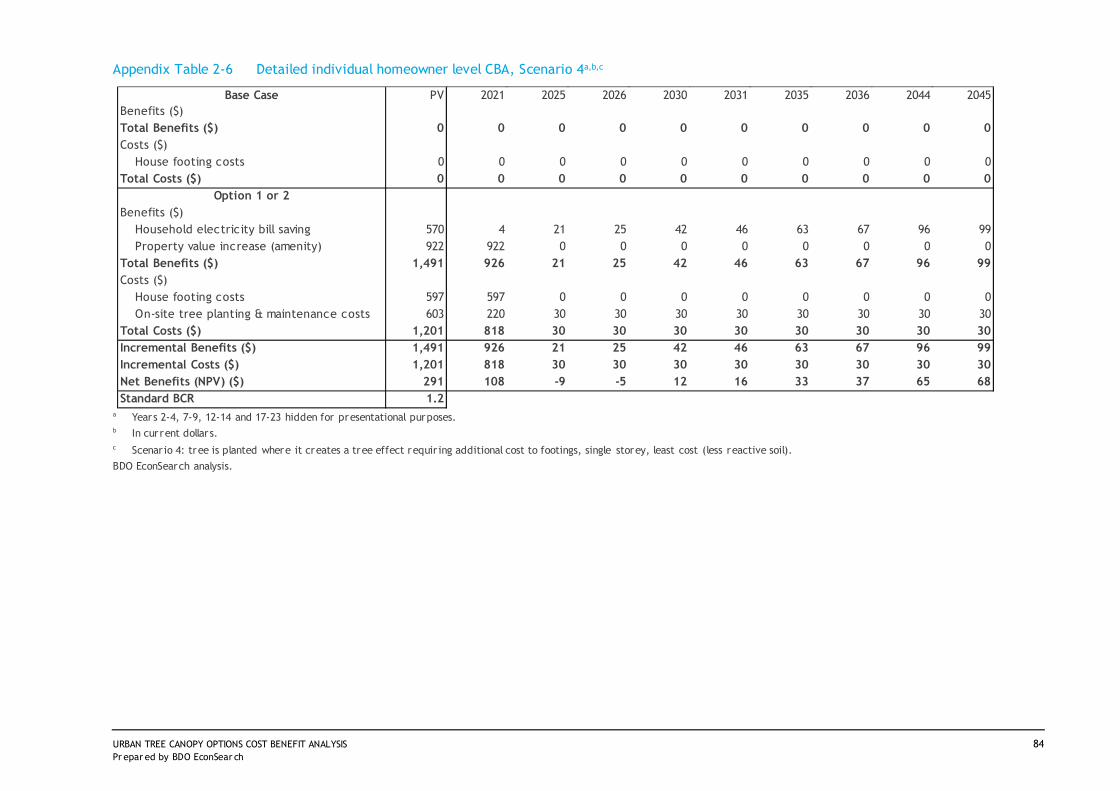
URBAN TREE CANOPY OPTIONS COST BENEFIT ANALYSIS 84 Pr epar ed by BDO EconSear ch
Appendix Table 2-6 Detailed individual homeowner level CBA, Scenario 4a,b,c
a Years 2-4, 7-9, 12-14 and 17-23 hidden for presentational purposes. b In current dollars. c Scenario 4: tree is planted where it creates a tree effect requir ing additional cost to footings, single storey, least cost (less reactive soil). BDO EconSearch analysis.
Base Case PV 2021 2025 2026 2030 2031 2035 2036 2044 2045Benefits ($)Total Benefits ($) 0 0 0 0 0 0 0 0 0 0Costs ($)
House footing costs 0 0 0 0 0 0 0 0 0 0Total Costs ($) 0 0 0 0 0 0 0 0 0 0
Option 1 or 2Benefits ($)
Household electricity bill saving 570 4 21 25 42 46 63 67 96 99Property value increase (amenity) 922 922 0 0 0 0 0 0 0 0
Total Benefits ($) 1,491 926 21 25 42 46 63 67 96 99Costs ($)
House footing costs 597 597 0 0 0 0 0 0 0 0On-site tree planting & maintenance costs 603 220 30 30 30 30 30 30 30 30
Total Costs ($) 1,201 818 30 30 30 30 30 30 30 30Incremental Benefits ($) 1,491 926 21 25 42 46 63 67 96 99Incremental Costs ($) 1,201 818 30 30 30 30 30 30 30 30Net Benefits (NPV) ($) 291 108 -9 -5 12 16 33 37 65 68Standard BCR 1.2

URBAN TREE CANOPY OPTIONS COST BENEFIT ANALYSIS 85 Pr epar ed by BDO EconSear ch
Appendix Table 2-7 Detailed individual homeowner level CBA, Scenario 5a,b,c
a Years 2-4, 7-9, 12-14 and 17-23 hidden for presentational purposes. b In current dollars. c Scenario 5: tree is planted where it creates a tree effect requir ing additional cost to footings, single storey, greatest cost (more reactive soil). BDO EconSearch analysis.
Base Case PV 2021 2025 2026 2030 2031 2035 2036 2044 2045Benefits ($)Total Benefits ($) 0 0 0 0 0 0 0 0 0 0Costs ($)
House footing costs 0 0 0 0 0 0 0 0 0 0Total Costs ($) 0 0 0 0 0 0 0 0 0 0
Option 1 or 2Benefits ($)
Household electricity bill saving 570 4 21 25 42 46 63 67 96 99Property value increase (amenity) 922 922 0 0 0 0 0 0 0 0
Total Benefits ($) 1,491 926 21 25 42 46 63 67 96 99Costs ($)
House footing costs 3,636 3,636 0 0 0 0 0 0 0 0On-site tree planting & maintenance costs 603 220 30 30 30 30 30 30 30 30
Total Costs ($) 4,239 3,856 30 30 30 30 30 30 30 30Incremental Benefits ($) 1,491 926 21 25 42 46 63 67 96 99Incremental Costs ($) 4,239 3,856 30 30 30 30 30 30 30 30Net Benefits (NPV) ($) -2,748 -2,931 -9 -5 12 16 33 37 65 68Standard BCR 0.4

URBAN TREE CANOPY OPTIONS COST BENEFIT ANALYSIS 86 Pr epar ed by BDO EconSear ch
Appendix Table 2-8 Detailed individual homeowner level CBA, Scenario 6a,b,c
a Years 2-4, 7-9, 12-14 and 17-23 hidden for presentational purposes. b In current dollars. c Scenario 6: No existing tree, payment for planting and maintaining tree offsite. BDO EconSearch analysis.
Base Case PV 2021 2025 2026 2030 2031 2035 2036 2044 2045Benefits ($)Total Benefits ($) 0 0 0 0 0 0 0 0 0 0Costs ($)
House footing costs 0 0 0 0 0 0 0 0 0 0Total Costs ($) 0 0 0 0 0 0 0 0 0 0
Option 2Benefits ($)Total Benefits ($) 0 0 0 0 0 0 0 0 0 0Costs ($)
House footing costs 0 0 0 0 0 0 0 0 0 0Offset payment 1,165 1,165 0 0 0 0 0 0 0 0
Total Costs ($) 1,165 1,165 0 0 0 0 0 0 0 0Incremental Benefits ($) 0 0 0 0 0 0 0 0 0 0Incremental Costs ($) 1,165 1,165 0 0 0 0 0 0 0 0Net Benefits (NPV) ($) -1,165 -1,165 0 0 0 0 0 0 0 0

URBAN TREE CANOPY OPTIONS COST BENEFIT ANALYSIS 87 Pr epar ed by BDO EconSear ch
Appendix Table 2-9 Detailed individual homeowner level CBA, Scenario 7a,b,c
a Years 2-4, 7-9, 12-14 and 17-23 hidden for presentational purposes. b In current dollars. c Scenario 7: Existing tree removed, payment for loss of existing tree and for planting and maintaining tree offsite. BDO EconSearch analysis.
Base Case PV 2021 2025 2026 2030 2031 2035 2036 2044 2045Benefits ($)Total Benefits ($) 0 0 0 0 0 0 0 0 0 0Costs ($)
House footing costs 0 0 0 0 0 0 0 0 0 0Total Costs ($) 0 0 0 0 0 0 0 0 0 0
Option 1Benefits ($)Total Benefits ($) 0 0 0 0 0 0 0 0 0 0Costs ($)
House footing costs 0 0 0 0 0 0 0 0 0 0Offset payment 4,600 4,600 0 0 0 0 0 0 0 0
Total Costs ($) 4,600 4,600 0 0 0 0 0 0 0 0Incremental Benefits ($) 0 0 0 0 0 0 0 0 0 0Incremental Costs ($) 4,600 4,600 0 0 0 0 0 0 0 0Net Benefits (NPV) ($) -4,600 -4,600 0 0 0 0 0 0 0 0