"options for glebe island: cost–benefit analysis of ... · a c i l a l l e n c o n s u l t i...
TRANSCRIPT

A C I L A L L E N C O N S U L T I N G
SEPTEMBER 2013
OPTIONS FOR GLEBE ISLAND BRIDGE BRIDGE
COST BENEFIT ANALYSIS OF VARIOUS OPTIONS FOR GLEBE ISLAND BRIDGE

ACIL ALLEN CONSULTING PTY LTD
ABN 68 102 652 148
LEVEL FIFTEEN
127 CREEK STREET
BRISBANE QLD 4000
AUSTRALIA
T+61 7 3009 8700
F+61 7 3009 8799
LEVEL TWO
33 AINSLIE PLACE
CANBERRA ACT 2600
AUSTRALIA
T+61 2 6103 8200
F+61 2 6103 8233
LEVEL NINE
60 COLLINS STREET
MELBOURNE VIC 3000
AUSTRALIA
T+61 3 8650 6000
F+61 3 9654 6363
LEVEL ONE
50 PITT STREET
SYDNEY NSW 2000
AUSTRALIA
T+61 2 8272 5100
F+61 2 9247 2455
SUITE C2 CENTA BUILDING
118 RAILWAY STREET
WEST PERTH WA 6005
AUSTRALIA
T+61 8 9449 9600
F+61 8 9322 3955
ACILALLEN.COM.AU
COPYRIGHT IN THIS DOCUMENT IS AND REMAINS THE PROPERTY OF ACIL ALLEN CONSULTING PTY LTD. THIS DOCUMENT MUST NOT BE REPRODUCED IN WHOLE OR IN PART WITHOUT ACIL ALLEN CONSULTING’S PRIOR CONSENT. ITS CONTENT MUST ONLY BE USED FOR THE PURPOSES OF EVALUATION WITH A VIEW TO CONTRACTING ACIL ALLEN CONSULTING TO CARRYING OUT THE WORK THAT IS THE SUBJECT MATTER OF THE DOCUMENT. NO OTHER USE WHATSOEVER CAN BE MADE TO ANY MATERIAL OR ANY RECOMMENDATION, MATTER OR THING IN THE DOCUMENT WITHOUT ACIL ALLEN CONSULTING’S PRIOR WRITTEN AGREEMENT.
© ACIL ALLEN CONSULTING 2013

A C I L A L L E N C O N S U L T I N G
ii
C o n t e n t s 1 Introduction 1
1.1 Context 1
1.2 Study objective and scope 2
1.3 Study approach 3
1.3.1 Desktop review 3
1.3.2 Stakeholder consultations 3
1.3.3 Cost-benefit analysis methodology 4
1.4 Report structure 4
2 Background 5
2.1 Glebe Island Bridge 5
2.1.1 Overview 5
2.1.2 Bridge design 5
2.1.3 Current condition of the bridge 6
2.1.4 Heritage significance 7
2.2 The Bays Precinct 8
2.2.2 Vessel movements through the Glebe Island Bridge channel 10
3 Options development 12
3.1 Long list of options 12
3.1.1 Preservation / restoration 13
3.1.2 Demolition 14
3.1.3 Replacement 17
3.2 Shortlisted options 18
4 Assessment of costs 20
4.1 Capital costs 20
4.1.1 Base Case 20
4.1.2 Full Demolition 20
4.1.3 Restoration 21
4.2 Recurrent costs 22
4.2.1 Base Case 22
4.2.1 Full Demolition 23
4.2.2 Restoration 23
4.3 Costs to NSW Government 25
5 Assessment of benefits 26

A C I L A L L E N C O N S U L T I N G
iii
5.1 Full demolition option benefits 26
5.1.1 Avoided maintenance costs 26
5.1.2 Safety benefits 26
5.1.3 Time savings of maritime operators 28
5.2 Restoration option benefits 29
5.2.1 Avoided maintenance costs 29
5.2.2 Delays for vessel operators 29
5.2.3 Time savings of commuters 30
5.2.4 Amenity benefits 31
5.2.5 Heritage value 31
5.2.6 Option value for future light rail 32
5.2.7 Benefits for visitors to the Sydney Exhibition Centre @ Glebe Island 32
5.2.8 Residual value 33
6 Cost-benefit analysis results 34
6.1 Full Demolition option 34
6.1.1 Present value of incremental costs 34
6.1.2 Present value of incremental benefits 34
6.1.3 Net present value 34
6.1.4 Benefit-cost ratio 34
6.2 Restoration option 35
6.2.1 Present value of incremental costs 35
6.2.2 Present value of incremental benefits 35
6.3 Sensitivity analysis 36
6.3.1 Full Demolition option 36
6.3.2 Restoration option 37
6.4 Conclusion 38
List of figures
Figure 1 The Bays Precinct 1
Figure 2 Glebe Island Bridge (2012) 5
Figure 3 Glebe Island Bridge elevation 6
Figure 4 Aerial view of the Bays Precinct 8
Figure 6 Preservation – option 3 14
Figure 7 Replacement – option 1 17
Figure 8 Replacement – option 2 18
Figure 9 Avoided maintenance costs of Full Demolition option, Year 1 to Year 30 (2013 dollars) 26

A C I L A L L E N C O N S U L T I N G
iv
Figure 10 Avoided maintenance costs of Restoration option, Year 1 to Year 30 (2013 dollars) 29
List of tables
Table ES 1 Long list of options considered for Glebe Island Bridge vi
Table ES 2 Present value of benefits of Full Demolition option, 2013 dollars ix
Table ES 3 Present value of quantifiable benefits of Restoration option, 2013 dollars x
Table ES 4 NPV of quantifiable benefits of Restoration option and difference in NPV between Restoration and Full Demolition options, 2013 dollars x
Table ES 5 Required heritage and amenity benefits for Restoration to be preferred option – 7% real discount rate, 2013 dollars xi
Table 1 Maritime businesses in Rozelle and Blackwattle Bays 10
Table 2 Vessel movements data 11
Table 3 Long list of options considered for cost-benefit analysis 12
Table 4 Preservation - option 2 13
Table 5 Works required for each demolition option 15
Table 6 Demolition – option 1 15
Table 7 Demolition – option 2 16
Table 8 Demolition – option 3 16
Table 9 Demolition – option 4 17
Table 10 Capital cost of Base Case 20
Table 11 Capital cost of Full Demolition option 21
Table 12 Capital cost of Restoration option 21
Table 13 Recurrent costs under the Base Case, Year 1 to Year 30 23
Table 15 Total costs to Government over 30-year analysis period, bt option (2013 dollars) 25
Table 16 Assumptions used in estimating safety benefits of the Full Demolition option 27
Table 17 Assumptions used in estimating maritime timesavings of the Full Demolition option 28
Table 18 Assumptions used in estimating commuter time savings under the Restoration option 30
Table 19 Present value of benefits of Full Demolition option, 2013 dollars 34
Table 20 Present value of quantifiable benefits of Restoration option, 2013 dollars 35

A C I L A L L E N C O N S U L T I N G
v
Table 21 NPV of quantifiable benefits of Restoration option and difference in NPV between Restoration and Full Demolition options, 2013 dollars 35
Table 22 Required heritage and amenity benefits for Restoration to be preferred option – 7% real discount rate, 2013 dollars 36

A C I L A L L E N C O N S U L T I N G
Cost Benefit Analysis of various options for glebe island bridge vi
Executive summary
ACIL Allen Consulting (ACIL Allen) was commissioned by Transport for NSW to
undertake a cost-benefit analysis of options for the Glebe Island Bridge in Sydney.
Opened in 1903, the Glebe Island Bridge was an electrically operated swing bridge
which connected Rozelle to Pyrmont by road. The Bridge was closed in 1995, when
the adjacent Anzac Bridge opened, and remains in a permanently open position with
no access to pedestrians or vehicular traffic.
A 2009 structural assessment found the Bridge to be in very poor condition, and it
has since deteriorated further with the wooden access platform under the western
span of the Bridge collapsing in January 2012. It is one of the few remaining swing
bridges of its type in Australia and in the world.
Options development
ACIL Allen considered three broad categories of options for the Bridge:
restoration / preservation
removal / demolition
replacement / adaptation.
Within each category there were a number of options (see Table ES 1).
TABLE ES 1 LONG LIST OF OPTIONS CONSIDERED FOR GLEBE ISLAND BRIDGE
Category Option Description Cost
Preservation / restoration
Option 1 Minimal repairs to ensure boating safety * $12.0 million
Option 2 Restoration of the bridge for two lanes of traffic on the bridge $37.5 million
Option 3 Restoration of central bridge for safety purposes, removal of abutments
Not costed
Removal / demolition
Option 1 Demolish swing span superstructure only ** $39.3 million
Option 2 Demolish swing span and central stone pier to bed level ** $43.9 million
Option 3 Demolish swing span, approach spans and all 3 piers ** $37.3 million
Option 4 Demolish swing span, approach spans and all 3 piers, as well as removal of approach embankments
$40.2 million
Replacement / adaptation
Option 1 Replacement of bridge with pedestrian footbridge Not costed
Option 2 Replacement of bridge with modern swing span mechanism Not costed
Option 3 Replacement of bridge with light rail capability Not costed
NOTE: * ALLOWS FOR A MAINTENANCE LOAD OF 2.0KPA AND/OR A MEDIUM SIZE VEHICLE UP TO 9 TONNES ON THE BRIDGE
** FOR SAFETY REASONS, REMOVAL/DEMOLITION OPTIONS INCLUDE THE RESTORATION OF THE REMAINING INFRASTRUCTURE
NOT DEMOLISHED, SUCH AS: RESTORATION OF THE EXISTING TIMBER FENDERS, RESTORATION OF STEEL BRIDGE APPROACHES
AND SPANS WHERE APPLICABLE, AND RESTORATION OF SANDSTONE ABUTMENTS AND THE CENTRAL PIER WHERE APPLICABLE
SOURCE: RMS
The shortlisted options for this cost-benefit analysis are:

A C I L A L L E N C O N S U L T I N G
Cost Benefit Analysis of various options for glebe island bridge vii
Base Case – Preservation / Restoration Option 1
Full Demolition – Demolition Option 4
Restoration – Preservation / Restoration Option 2.
Preservation / Restoration Option 3 was eliminated as it does not preserve the
integrity of the original Bridge design and therefore confers only partial heritage
value to the preserved structure. It also does not restore the functionality of the
original Bridge.
The replacement options were eliminated because they provide similar transport
functionality as Preservation / Restoration Option 2 without the heritage benefits of
that option.
Among the demolition options, Option 3 was shortlisted because it enables the
channel to be widened relative to Options 1 and 2 (thereby improving the transit of
boats through the channel and reducing the likelihood of an accident), while costing
less than Option 4 (which would have widened the channel even more).
It should also be noted that demolition options do not preclude the addition of
replacement/adaptation options at a later point.
Costs of shortlisted options
Capital costs
The capital costs of the shortlisted options in 2013 dollars are:
Base Case: $12.013 million
Full Demolition option: $37.303 million
Restoration option: $37.517 million.
The incremental capital costs of the Full Demolition and Restoration options are
therefore $25.290 million and $25.504 million in 2013 dollars respectively.
Recurrent costs
The year-by-year total recurrent costs of the Base Case and the Restoration option
over the 30-year analysis period are shown in Figure ES 1. It is assumed that
recurrent costs are zero in the Demolition option.

A C I L A L L E N C O N S U L T I N G
Cost Benefit Analysis of various options for glebe island bridge
viii
FIGURE ES 1RECURRENT COSTS OF BASE CASE AND RESTORATION OPTION, YEAR 1 TO YEAR 30
SOURCE: ACIL ALLEN
Benefits of shortlisted options
The cost-benefit analysis involved identifying, quantifying and valuing the benefits
associated with each of the shortlisted options and comparing them to the capital
and recurrent costs of the options.
However, some of the benefits are very difficult to quantify and precisely place a
value on, in particular the amenity and heritage benefits of the Restoration option.
An alternative strategy was adopted to address this challenge, as outlined below.
Full Demolition option
The following benefits were quantified for the Full Demolition option:
avoided maintenance costs
safety benefits from reduced risks of collision between vessels and the Bridge
time savings of vessel operators as a result of the widened channel.
According to records held by Transport for NSW, in the period 1992/93 to 2012/13
there has been 11 reported boating incidents in the immediate vicinity of Glebe
Island Bridge. These 11 incidents comprised one fatal incident and 10 non-injury
incidents. Transport for NSW estimates that the number of accidents would
decrease by at least 50 per cent after the demolition of the Bridge.
Information obtained from ACIL Allen’s survey of maritime businesses in Rozelle
and Blackwattle Bays suggests that: 78 per cent of trips through the channel are for
businesses rather than leisure; there are 4.8 passengers per vessel on average; and
the average time saving per vessel enabled by full demolition of the Bridge would be
10.0 minutes. RMS estimates that, on average, up to 300 vessels currently pass
through the channel each day and that vessel movements are likely to grow by more
than 2 per cent per annum.
$0
$1
$2
$3
$4
$5
$6
$7
$8
$9
$10
1 3 5 7 9 11 13 15 17 19 21 23 25 27 29
Millions
Year
Base Case
Restoration

A C I L A L L E N C O N S U L T I N G
Cost Benefit Analysis of various options for glebe island bridge ix
Restoration option
The following benefits and costs were quantified for the Restoration option:
reduced maintenance costs relative to the Base Case
time cost of delays to vessel operators
time savings of cyclists and walkers commuting to work between Balmain or East Balmain and Sydney Inner City.
ACIL Allen’s survey of maritime businesses at Blackwattle and Rozelle Bays
indicates that the average delay per vessel is expected to be 14.3 minutes when the
Bridge is primarily closed to maritime traffic and only periodically opened after
restoration.
Based on data by the NSW Bureau of Transport Statistics, there are 229 cyclists
and 101 walkers each work day who could potentially enjoy time savings by
commuting to work over the low-level restored Glebe Island Bridge instead of the
high-level Anzac Bridge. In the cost-benefit analysis, it is assumed that, on average,
cyclists save 5 minutes per trip while walkers save 15 minutes per trip.
The restored Bridge’s heritage benefits and the amenity benefits that will be enjoyed
by recreational walkers and cyclists have not been explicitly quantified in the cost-
benefit analysis. Instead, ACIL Allen has calculated the threshold value that the
community must ascribe to the heritage aspects of the restored Glebe Island Bridge
and to its potential amenity benefits in order for Restoration to be the preferred
option.
Cost-benefit analysis results
Full Demolition option
The present value of benefits associated with the Full Demolition option under three
alternative real discount rates is shown in Table ES 2. The NSW Treasury
recommends 7 per cent as the central case with 4 per cent and 10 per cent as
sensitivities.
TABLE ES 2 PRESENT VALUE OF BENEFITS OF FULL DEMOLITION OPTION, 2013 DOLLARS
4% real discount
rate
7% real discount
rate
10% real discount
rate
Avoided maintenance costs $21.0m $18.1m $16.0m
Safety benefits $4.5m $3.0m $2.2m
Maritime travel time savings $80.0m $54.7m $39.8m
Total benefits $105.5m $75.9m $58.1m
SOURCE: ACIL ALLEN
The net present value (NPV) of the Full Demolition option, calculated by subtracting
the present value of total incremental costs from the present value of total
incremental total benefits, under the alternative real discount rates is:
$80.2 million (4 per cent real discount rate)
$50.6 million (7 per cent real discount rate)
$32.8 million (10 per cent real discount rate).

A C I L A L L E N C O N S U L T I N G
Cost Benefit Analysis of various options for glebe island bridge x
The benefit-cost ratio (BCR) of the Full Demolition option, calculated by dividing the
present value of total incremental benefits by the present value of total incremental
costs, under the alternative real discount rates is:
4.17 (4 per cent real discount rate)
3.00 (7 per cent real discount rate)
2.30 (10 per cent real discount rate).
Under the central assumption of a 7 per cent real discount rate, the present value of
the benefits of the option is exactly 3 times that of the present value of its costs.
Restoration option
The present value of the quantifiable benefits associated with the Restoration option
under the three alternative real discount rates is shown in Table ES 3. The maritime
travel savings are negative as the restored Bridge will induce delays when vessels
are required to wait for the Bridge to open.
TABLE ES 3 PRESENT VALUE OF QUANTIFIABLE BENEFITS OF RESTORATION OPTION, 2013
DOLLARS
4% real discount
rate
7% real discount
rate
10% real discount
rate
Avoided maintenance costs $10.6m $11.6m $11.7m
Maritime travel time savings -$114.0m -$78.0m -$56.7m
Commuter time savings for cyclists and walkers
$21.9m $15.2m $11.3m
Residual value $5.0m $2.2m $1.0m
Total quantifiable benefits -$76.5m -$48.9m -$32.8m
SOURCE: ACIL ALLEN
The NPV of the Restoration option, based on quantifiable benefits, under the three
alternative discount rates is shown in the second row of Table ES 4. The difference
in the NPVs of the Restoration and Full Demolition options (based on the
quantifiable benefits of the Restoration option) is shown in the last row of the table.
TABLE ES 4 NPV OF QUANTIFIABLE BENEFITS OF RESTORATION OPTION AND DIFFERENCE IN NPV
BETWEEN RESTORATION AND FULL DEMOLITION OPTIONS, 2013 DOLLARS
4% real discount
rate
7% real discount
rate
10% real discount
rate
NPV of Restoration Option based on quantifiable benefits
-$102.0m -$74.4m -$58.3m
Difference in NPV of Restoration and Full Demolition options based on quantifiable benefits of Restoration option
$182.2m $125.1m $91.1m
SOURCE: ACIL ALLEN
In order for the Restoration option to be preferred over the Full Demolition option,
the yet-to-be quantified heritage and amenity benefits of the restored bridge needs
to be at least $125.1 million in 2013 dollars in present value terms over the 30-year
analysis period under a 7 per cent real discount rate.
Suppose that the unquantified benefits are to be split evenly between heritage and
amenity benefits, each source of benefits would then need to be at least $62.5

A C I L A L L E N C O N S U L T I N G
Cost Benefit Analysis of various options for glebe island bridge xi
million in present value terms under a 7 per cent real discount rate for Restoration to
emerge as the preferred option (see Table ES 5).
TABLE ES 5 REQUIRED HERITAGE AND AMENITY BENEFITS FOR RESTORATION TO BE PREFERRED
OPTION – 7% REAL DISCOUNT RATE, 2013 DOLLARS
Distribution of required benefits Heritage value PV of amenity benefits
25% heritage benefits: 75% amenity benefits $31.3m $93.8m
50% heritage benefits: 50% amenity benefits $62.5m $62.5m
75% heritage benefits: 25% amenity benefits $93.8m $31.3m
SOURCE: ACIL ALLEN
Conclusion
The cost-benefit analysis indicates that Full Demolition of the Glebe Island Bridge
generates a relatively high BCR of approximately 3.0 under a 7 per cent real
discount rate. About a quarter of the benefits of this option are attributable to
maintenance cost savings relative to the Base Case, while nearly three-quarters of
the benefits is due to expected maritime travel time savings from the widened
channel. The BCR is therefore sensitive to the assumed average time saving per
vessel. If the assumed average time saving is halved from 10 minutes to 5 minutes,
the BCR decreases to 1.92.
Restoration of the Glebe Island Bridge generates benefits from reduced
maintenance costs relative to the Base Case as well as commuter time savings for
some of the cyclists and walkers who currently commute to work over the high-level
Anzac Bridge. However, these benefits are only a third of the value of the estimated
time losses that would be experienced by vessel operators when the Bridge is
primarily closed and only periodically opened after restoration.
The heritage value of the restored Bridge and the amenity benefits experienced by
recreational walkers and cyclists have not been explicitly quantified in the cost-
benefit analysis. However, ACIL Allen’s analysis suggests that they have to be at
least $125.1 million in 2013 dollars in present value terms over the 30-year analysis
period (under a 7 per cent real discount rate) in order for Restoration to be the
preferred option.
If these “required” unquantified benefits are to be evenly split between heritage and
amenity benefits, the community must value the heritage aspects of the Glebe Island
Bridge at more than $62.5 million in 2013 dollars and value the amenity benefits to
recreational cyclists and walkers at more than $5.5 million a year. Assuming 1,000
trips are made each day by such cyclists and walkers, the community would have to
value each trip at more than $15.20 in 2013 dollars.

A C I L A L L E N C O N S U L T I N G
OPTIONS FOR GLEBE ISLAND BRIDGE BRIDGE COST BENEFIT ANALYSIS OF VARIOUS OPTIONS FOR GLEBE ISLAND BRIDGE 1
1 Introduction
ACIL Allen Consulting (ACIL Allen) has been commissioned by Transport for NSW
to undertake a cost-benefit analysis of options for the Glebe Island Bridge in
Sydney.
1.1 Context
The NSW Government is considering options for the future of the Glebe Island
Bridge (the Bridge) as part of its response to the Bays Precinct Taskforce Report
into the future use of the Bays Precinct of Sydney Harbour (the Precinct).
The Bays Precinct comprises the waterways and foreshores of four connected bays
west of Darling Harbour: Johnstons, White, Rozelle, and Blackwattle. This area
spans 94 hectares, as illustrated in Figure 1.
FIGURE 1 THE BAYS PRECINCT
SOURCE: BAYS PRECINCT TASKFORCE 2012
As can be seen in Figure 1, the Glebe Island and ANZAC Bridges divide the precinct
into two zones. Opened in 1903, the Glebe Island Bridge served as the road
connection between Glebe Island and Pyrmont until the opening of the ANZAC
Bridge in 1995.
Currently, the Glebe Island Bridge remains under the ownership of NSW Roads and
Maritime Services (RMS), which is responsible for its operation, management,
maintenance and repair. While the Bridge is listed on the heritage register of the
RMS, it has fallen into disrepair since it ceased operations.

A C I L A L L E N C O N S U L T I N G
OPTIONS FOR GLEBE ISLAND BRIDGE BRIDGE COST BENEFIT ANALYSIS OF VARIOUS OPTIONS FOR GLEBE ISLAND BRIDGE 2
Unlike the ANZAC Bridge, which is a large cable-stayed bridge, engineered to
minimise the restriction of shipping in the Precinct, the Glebe Island Bridge is an
electrically operated swing bridge. When it is in a closed position, road traffic may
pass through, but vessels would be blocked from passing between the southern
bays of the Precinct and the rest of Sydney Harbour.
Since the Glebe Island Bridge was superseded by the ANZAC Bridge, it has been
disused and left permanently in an open position, permitting the free movement of
vessels in the area and allowing the Government to actively promote maritime
developments within Rozelle and Blackwattle Bays. Many of these businesses
depend on being able to safely navigate through the channel at their discretion.
Estimates of the number of vessels that currently pass between the Rozelle and
Blackwattle bays to the rest of Sydney Harbour each day range from 200 to 300
(Hasham, 2013; RMS).
The future of the Glebe Island Bridge is therefore closely tied to the future of the
entire Bays Precinct. Indeed, the Taskforce recommended that the Government
undertake a comprehensive analysis of the costs and benefits of various options for
the Bridge’s future, ranging from removal, to its retention for use as a pedestrian and
bike connection.
Doing nothing is not an option, given the navigational hazards posed by the
deterioration of the Bridge’s condition:
According to the Taskforce report, a 2009 structural assessment found the Bridge to be in “very poor condition”, with further deterioration since then.
A wooden platform under the Bridge’s wooden span collapsed in January 2012 (Hasham, 2013).
A commercial vessel collided with the Bridge in February 2013, resulting in the fatality of a crew member.
However, there are differing views in the community about what the appropriate
course of action should be. Examples of alternatives that have been raised in media
reports (Hasham, 2013) include:
complete demolition
partial demolition, with the abutments left intact
restoration
restoration and conversion into a bridge for pedestrians and cyclists
conversion to support a light rail line.
Each alternative involves different costs and benefits.
1.2 Study objective and scope
The NSW Government has agreed to undertake a comprehensive analysis of the
costs and benefits of retaining versus removing the Bridge, taking into consideration
future transport needs associated with urban renewal scenarios, and current
maritime industry needs, in consultation with relevant Councils and key
stakeholders.
This study:
A C I L A L L E N C O N S U L T I N G
OPTIONS FOR GLEBE ISLAND BRIDGE BRIDGE COST BENEFIT ANALYSIS OF VARIOUS OPTIONS FOR GLEBE ISLAND BRIDGE 3
analyses the costs and benefits of retaining/refurbishing the Bridge, removing the Bridge, or replacing the Bridge
considers the potential uses of the Bridge, including for public transport services, as part of the analysis
considers the views of key stakeholders and community groups
considers the current and potential use of the channels spanned by the Bridge and the dependencies on these channels
makes recommendations on the most appropriate future use of the Bridge based on the analysis.
1.3 Study approach
1.3.1 Desktop review
Prior to undertaking the cost-benefit analysis, ACIL Allen reviewed a range of
documents provided by Transport for NSW, including reports produced by the Bays
Precinct Taskforce.
ACIL Allen also undertook extensive research on Australian and international
studies relating to the valuation of heritage structures and the economic value of
walking trails.
1.3.2 Stakeholder consultations
As part of this study, ACIL Allen consulted with key stakeholders such as:
Transport for NSW
Roads and Maritime Services (RMS)
Bays Precinct Taskforce
City of Sydney
Leichhardt Municipal Council
Heritage Council of New South Wales.
These consultations took the form of face-to-face meetings. In addition, ACIL Allen
surveyed a range of maritime businesses in Rozelle and Blackwattle Bays,
including:
Seawind Catamarans
Blackwattle Bay Marine Ops
Devine Marine
Waterway Constructions
Polaris Marine
Sydney Superyacht Marina
Sydney Heritage Fleet
Sydney Fish Market.
These businesses were asked to estimate the average delay per vessel movement if
the Bridge were to be primarily closed after restoration with only periodic openings,
and the likely time savings per vessel movement if the entire Bridge was to be
demolished.

A C I L A L L E N C O N S U L T I N G
OPTIONS FOR GLEBE ISLAND BRIDGE BRIDGE COST BENEFIT ANALYSIS OF VARIOUS OPTIONS FOR GLEBE ISLAND BRIDGE 4
1.3.3 Cost-benefit analysis methodology
ACIL Allen first developed a long list of options, including different preservation /
restoration options and various demolition options. The less likely options were
progressively eliminated to form a short list of options.
The incremental benefits of the shortlisted options were identified, analysed and
quantified. The present value of the stream of incremental benefits associated with
each shortlisted option was then compared with the present value of the stream of
capital and recurrent costs for that option over a 30-year time horizon under an
appropriate real discount rate.
The results of the cost-benefit analysis are reported in metrics such as the Net
Present Value (NPV, the difference between the present value of total benefits and
the present value of total costs) and the Benefit-Cost Ratio (BCR, the ratio of the
present value of total benefits to the present value of total costs).
Sensitivity analysis was then undertaken to test the robustness of the cost-benefit
analysis results to changes in key assumptions and parameter values.
1.4 Report structure
This report is structured as follows:
Chapter 2 provides a background of the Glebe Island Bridge and the Bays Precinct in which it is located
Chapter 3 presents the initial long list of options and the options shortlisted for the cost-benefit analysis
Chapter 4 assesses the costs of the shortlisted options
Chapter 5 assesses the benefits of the shortlisted options
Chapter 6 presents the key results of the cost-benefit analysis.
A C I L A L L E N C O N S U L T I N G
OPTIONS FOR GLEBE ISLAND BRIDGE BRIDGE COST BENEFIT ANALYSIS OF VARIOUS OPTIONS FOR GLEBE ISLAND BRIDGE 5
2 Background
2.1 Glebe Island Bridge
2.1.1 Overview
The Glebe Island Bridge over Johnstons Bay was constructed from 1899 to 1903
and was removed from service in 1995 after the opening of the Anzac Bridge. The
Bridge is owned by Roads and Maritime Services (RMS), which is responsible for its
operation, management, maintenance and repair. RMS also owns the sea-bed upon
which the Bridge’s piers rest, forming part of the Sydney Harbour Title.
The Glebe Island Bridge and the Anzac Bridge divide the Bays Precinct into two
distinct zones: the port zone at Johnstons and White Bay; and the maritime zone at
Rozelle and Blackwattle Bay. Unique among Sydney Harbour foreshore areas,
almost all the lands are owned by NSW Government authorities, principally the
Sydney Ports Corporation, RMS, Sydney Harbour Foreshore Authority and State
Property Authority.
2.1.2 Bridge design
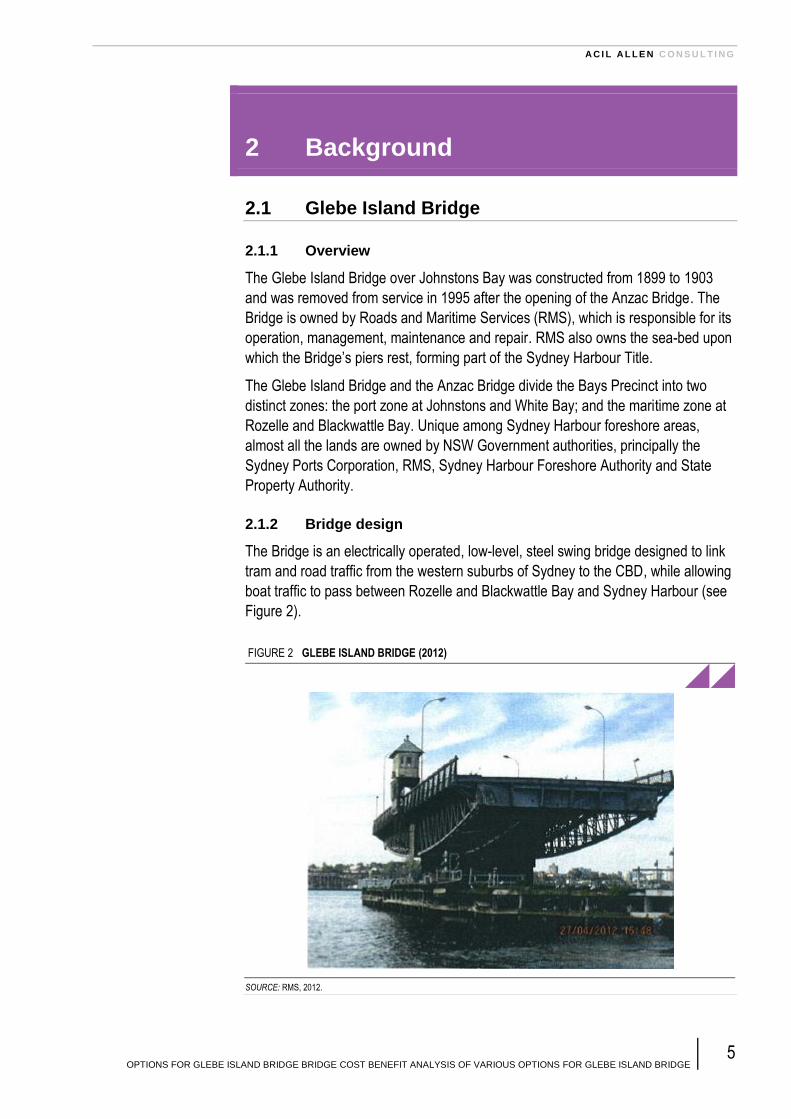
The Bridge is an electrically operated, low-level, steel swing bridge designed to link
tram and road traffic from the western suburbs of Sydney to the CBD, while allowing
boat traffic to pass between Rozelle and Blackwattle Bay and Sydney Harbour (see
Figure 2).
FIGURE 2 GLEBE ISLAND BRIDGE (2012)
SOURCE: RMS, 2012.

A C I L A L L E N C O N S U L T I N G
OPTIONS FOR GLEBE ISLAND BRIDGE BRIDGE COST BENEFIT ANALYSIS OF VARIOUS OPTIONS FOR GLEBE ISLAND BRIDGE 6
The Bridge is 108 metres long overall and is connected to the land by two artificially
formed abutments (see Figure 3). There are two steel truss spans 24.7 metres long
at either end of the Bridge. The central Swing Span is supported by a massive pivot
pier, founded on a nest of timber piles capped by concrete. The Swing Span can
rotate through 90 degrees to allow the passage of maritime traffic. Underneath the
central span is an inverted arch truss, which varies in depth from 4.3 metres in the
middle to 2.7 metres at the ends (NSW 2012).
The Swing Span is mounted on a steel roller track on the cylindrical stone masonry
and concrete pivot pier 13.9 metres high and 12.9 m wide and is swung by means of
a 600 volt motor. The roadway is 12.2 metres wide and has a 1.5 metre footway on
each side.
The Bridge includes a rare surviving operable Mercury-arc Rectifier, as well as some
early silicon rectifiers, installed in 1960 when the reticulated DC supply was
discontinued (NSW 2012). The Bridge could swing open or closed in 44 seconds,
which was much faster than contemporary bridges in the world at the time of
construction.
When open, the Bridge allows water traffic to flow freely along two waterways, each
18.3 metres wide. At present the Bridge is kept permanently in the open position.
The clearance provided between the centre of the arch truss and high tide mark,
when the bridge is in its ‘closed’ position, is 4.7 metres.
FIGURE 3 GLEBE ISLAND BRIDGE ELEVATION
SOURCE: RMS
2.1.3 Current condition of the bridge
The Glebe Island Bridge operated from 1903 to 1995 with little interruption and few
major works, apart from maintenance, being undertaken. In 1933, the Bridge

A C I L A L L E N C O N S U L T I N G
OPTIONS FOR GLEBE ISLAND BRIDGE BRIDGE COST BENEFIT ANALYSIS OF VARIOUS OPTIONS FOR GLEBE ISLAND BRIDGE 7
underwent an underwater upgrade, with underpinning to replace decayed piles
around the central pier. In 1960, the DC electricity supply from the Tramways
system was shut down, as was the tramway system in Sydney. A new AC supply
was obtained from the local reticulated network and a set of rectifiers was installed
in a small kiosk erected on the north east side of the Bridge. In the 1980s, the
Control Cabin was burnt out and was subsequently rebuilt to the original design.
Since the closing of the Bridge in 1995, it has fallen into disrepair and, despite the
$100,000 per year currently spent on maintenance (BPT, 2012), the structure has
deteriorated to the point where it has become a concern to vessels. The Urbis 2012
report on the state of the Bridge found that:
between 30 and 40% of the structural steel requires replacement or repair
the majority of timber safety fenders have rotted through and snapped
a large proportion of the sandstone piers supporting the Bridge require repair or replacement.
Further, the NSW Heritage Database notes the condition of the Bridge is ‘poor’
(Urbis 2012).
NSW Government agencies have argued that the Bridge poses a navigational risk
by decreasing the sight line of for vessels moving in and out of the Bays. The
Taskforce report also stated that timber fendering bordering both channels is
unlikely to withstand vessel impact and that a minor navigational error resulting in a
collision may also cause a risk to human life and potential for damage or collapse of
elements of the bridge structure.
2.1.4 Heritage significance
Although the Bridge is not listed as an item of significance on the State Heritage
Register under the Heritage Act 1977, the Bridge is listed as a heritage item under a
number of other important policy instruments including:
Heritage Item No. 4301666 s170 RMS
Heritage Item 68 SREP Sydney Harbour Catchment (State Significance)
Heritage item No. 4560015 s170 SPC
It is also considered an important heritage item by the Leichhardt Council, National Estate and National Trust (BPT, 2012 p75).
The NSW Department of Environment and Heritage Statement of Significance
states:
The Glebe Island Bridge, across Johnstons Bay, is likely to be of state significance1 as it
demonstrates one of the earliest examples of an electric-powered swing bridge in Australia.
Technically, it is a complementary structure to the already acclaimed Pyrmont Swing Bridge,
and has all the same significant features, including the electrically-driven swing span. Both
bridges were designed by Percy Allan, a highly-regarded Australian bridge designer of the late
19th and early 20th century. Both represent the only examples of such types of bridges in New
South Wales and are still operable
NSW, 2012, accessed 22/07/2013
1 Italics inserted

A C I L A L L E N C O N S U L T I N G
OPTIONS FOR GLEBE ISLAND BRIDGE BRIDGE COST BENEFIT ANALYSIS OF VARIOUS OPTIONS FOR GLEBE ISLAND BRIDGE 8
Major differences between the Pyrmont Bridge in Darling Harbour and the Glebe
Island Bridge include the fact that the Pyrmont Bridge has a larger swing span than
the Glebe Island Bridge and has more numerous fixed spans of timber than Glebe
Island Bridge, where they are made of steel supplemented by stone causeways
(NSW, 2012).
Determining the heritage value of the Glebe Island Bridge is made more complex by
its similarity to the Pyrmont Bridge. It could be argued that the heritage benefits from
a significant investment in the Glebe Island Bridge are already being provided in a
more densely populated part of Sydney that receives significantly larger numbers of
visitors, hence providing much greater utility/amenity value.
The Heritage Council of NSW is currently considering a request from the National
Trust of Australia to place the Glebe Island Bridge on the NSW State Heritage
Register.
2.2 The Bays Precinct
The Bays Precinct comprises the waterways and foreshores of four connected bays
west of Darling Harbour (Johnstons, White, Rozelle and Blackwattle bays). The
future of the Bridge will have significant economic implications for the Bays Precinct
and the surrounding suburbs, which include Pyrmont, Ultimo, Lilyfield, Annandale,
Balmain, Rozelle, Glebe, Forest Lodge and Leichhardt. The decision will also have
significant implications in terms of potential development options for the Bays
Precinct Area.
An aerial view of the affected area is presented in Figure 4.
FIGURE 4 AERIAL VIEW OF THE BAYS PRECINCT
SOURCE: RMS

A C I L A L L E N C O N S U L T I N G
OPTIONS FOR GLEBE ISLAND BRIDGE BRIDGE COST BENEFIT ANALYSIS OF VARIOUS OPTIONS FOR GLEBE ISLAND BRIDGE 9
The Bays Precinct area has seen significant changes over the past few decades
including the following:
the decommissioning of the White Bay Power Station in 1983
the opening of the Anzac Bridge and decommissioning of the Glebe Island Bridge in 1995
the cessation of operations at the Rozelle Rail Yards in 1997
the cessation of stevedoring operations and container operations in White Bay in 2004, and the opening of a cruise ship passenger terminal in 2013
the cessation of car import operations at Glebe Island and their relocation to Port Kembla in 2008
increased commercial and recreational maritime activities at Rozelle and Blackwattle Bays
an increasing resident population in close proximity to the port
shifting local demographic characteristics (BPT, 2012).
The NSW Government has committed to maintaining the Bays Precinct as a working
port in Government ownership, with land provided for port-dependant industrial and
maritime businesses and activities. According to the Government, opportunities will
be pursued to consolidate industrial activities, freeing up areas for greater public
access and better recreational boating facilities, particularly in Rozelle and
Blackwattle Bays.
Use of the Bridge channel
The Bridge channel is used by recreational vessels as well as by commercial
vessels as part of maritime business operations. Some of the major maritime
businesses operating within the Bays are listed in Table 1.
The area has unique business opportunities due to the close proximity of the Bays to
Sydney CBD. The bay area is also popular with both recreational and commercial
users during public holidays such as Australia Day and New Year’s Eve.
Due to the narrow nature of the channel, additional navigation rules apply to transit
through the Bridge. Vessels must give way to outbound traffic. Vessels must also
navigate through the Eastern Channel, unless directed otherwise by the Sydney
Harbour Master.
The Western Channel is closed to navigation. The channel itself is navigable but has
been closed to avoid interactions between vessels passing through the Bridge and
any vessels that may be berthed at the Glebe Island 1 dock. The Harbour Master
periodically issues directions to maritime vessels in the vicinity of Glebe Island
Bridge, such as altering the navigation channel if bridge maintenance is occurring.
Vessels must give way to the traffic lights installed on the Bridge if they are in
operation. These traffic lights are controlled by Harbour Control (Vessel Traffic
Services) when a large vessel needs to navigate through the channel. Operators of
large vessels can inform Harbour Control of their intended transit. RMS also has a
secondary control unit.

A C I L A L L E N C O N S U L T I N G
OPTIONS FOR GLEBE ISLAND BRIDGE BRIDGE COST BENEFIT ANALYSIS OF VARIOUS OPTIONS FOR GLEBE ISLAND BRIDGE 10
TABLE 1 MARITIME BUSINESSES IN ROZELLE AND BLACKWATTLE BAYS
Business operator Type of business and number of vessel movements per day (where
applicable)
Sydney Superyacht Marina The marina accommodates a large number of yachts, the majority of which are ocean going. There are 10-15vessel movements per day from the Bays to the Harbour.
Sydney Boathouse Dry dock facility, marina and commercial boat mooring. Up to 20 vessel movements per day. The Boathouse has development approval for a 600-vessel dry stack storage, which will lead to increased vessel traffic.
Seawind Catmarans Manufacture, maintenance and berthing of large ocean going catamarans and trimarans. 4-20 movements per day depending on low/peak season.
Sydney City Marine Boat maintenance, repair, refitting business catering for all types of vessels. Up to 10 vessel movements per day.
All Occasion Cruises Marina providing charter vessels for recreational uses.10-30 vessel movements per day from low season to peak periods.
Blackwattle Bay Marine Operatives Business leases the wharf area and provides low level maintenance. 8-14 vessel movements per day (low/peak seasons).
Devine Marine Marine salvage company.
Waterway Constructions Maritime contractor undertaking construction, maintenance and refurbishment of maritime structures.
Polaris Marine Business offers a range of services including salvage, towage, mooring and marine construction services.
Australian Wharf and Bridge Marine contractor undertaking construction, maintenance and refurbishment of maritime structures including wharves, marinas and piers. Vessel movements are unpredictable.
Hanson Construction Materials Receiving and processing point for primary material aggregates for concrete manufacture.
Hymix Australia Concrete batching plant site – lease expires 2013.
Sydney Fish Market Leases the wharf service to charter vessel operators including the Manly Fast Ferry and Fusion Cruises as well as privately owned yachts. Commercial fishing fleet includes 15 vessels. There are between 20 and 30 vessel movements per day.
Australian Heritage Fleet Refitting and maintenance area for historical vessels.
SOURCE:URBIS 2012.
2.2.2 Vessel movements through the Glebe Island Bridge channel
There is limited data available on the movement of vessels through the Glebe Island
Bridge Channel. The much quoted figure of 200 vessels per day (Hasham, 2013 /
BPT, 2012 / Urbis, 2012) is already somewhat old, having been determined in
February 2005 by a study of vessel movements undertaken by the former Roads
and Traffic Authority (RTA). Of these vessels, it was found that a significant
proportion (10 per cent) of the estimated 200 vessels per day crossing this passage
exceed the 4.7 metre air draft limit imposed by the Bridge when in the ‘closed’
position.
While small vessel traffic is not thought to have increased significantly since then, it
is estimated that there has been an approximate 50 per cent increase in the number
of larger vessels using this passage. This is due to the increase in larger vessels
departing from various commercial maritime enterprises within the Bays including
the Sydney Superyacht Marina, the Blackwattle Bay Marina and Sydney Fish
Markets (RMS, 2011).
A separate study carried out in June 2006 and commissioned by the Sydney Boat
House found that up to 29 power vessel movements occurred per day, a high
proportion of which exceed the air draft limit.

A C I L A L L E N C O N S U L T I N G
OPTIONS FOR GLEBE ISLAND BRIDGE BRIDGE COST BENEFIT ANALYSIS OF VARIOUS OPTIONS FOR GLEBE ISLAND BRIDGE 11
A counting exercise commissioned by the City of Sydney found an average of 180
vessel movements per day over a 3-week period in June 2013 and a 1-week period
in August 2013, of which 47 per cent were large vessels that would require a
restored bridge to open to enable their passage through the channel. It is likely that
recorded vessel movements would be higher if the exercise were to be conducted
over the warmer months of the year.
A summary of available information on vessel movements is presented in Table 2.
Note that none of the study periods include assessments of the commercial peak
season, which occurs in November and December.
TABLE 2 VESSEL MOVEMENTS DATA
Source Time of year Vessel Movements
Water Research Laboratory, 2004 24 September – 14
October
62 vessels per hour (peak time of day)
Former RTA, 2005
February 198 total - 19 unable to fit under the bridge
Sydney Boat House, 2006 Uncertain 29 movements from RMS and Sydney Superyacht Marina
alone, with a ‘high proportion’ of these exceeding the air
draft limit
City of Sydney, 2013 June and August Average of 180 per day, of which 85 are large vessels
SOURCE: RMS,
A C I L A L L E N C O N S U L T I N G
OPTIONS FOR GLEBE ISLAND BRIDGE BRIDGE COST BENEFIT ANALYSIS OF VARIOUS OPTIONS FOR GLEBE ISLAND BRIDGE 12
3 Options development
This chapter presents an initial long list of options for Glebe Island Bridge. These
options are assessed and refined into a number of shortlisted options. The costings
were provided by RMS and were developed by RMS Bridge Engineering specialists
in consultation with TLB Engineers and M Raven North estimating consultants.
3.1 Long list of options
There are three broad categories of options for the Glebe Island Bridge:
restoration / preservation
removal / demolition
replacement / adaptation.
Within each category there are a number of different options, the most realistic and feasible of which are outlined and examined below.
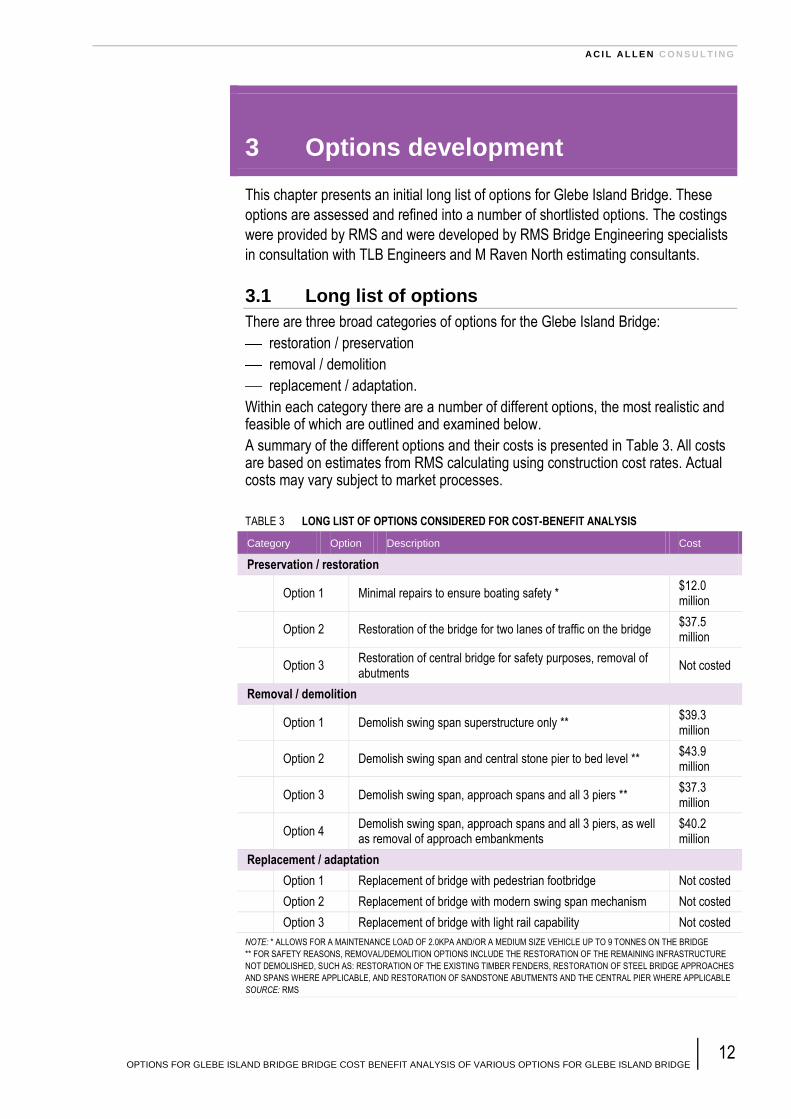
A summary of the different options and their costs is presented in Table 3. All costs are based on estimates from RMS calculating using construction cost rates. Actual costs may vary subject to market processes.
TABLE 3 LONG LIST OF OPTIONS CONSIDERED FOR COST-BENEFIT ANALYSIS
Category Option Description Cost
Preservation / restoration
Option 1 Minimal repairs to ensure boating safety * $12.0 million
Option 2 Restoration of the bridge for two lanes of traffic on the bridge $37.5 million
Option 3 Restoration of central bridge for safety purposes, removal of abutments
Not costed
Removal / demolition
Option 1 Demolish swing span superstructure only ** $39.3 million
Option 2 Demolish swing span and central stone pier to bed level ** $43.9 million
Option 3 Demolish swing span, approach spans and all 3 piers ** $37.3 million
Option 4 Demolish swing span, approach spans and all 3 piers, as well as removal of approach embankments
$40.2 million
Replacement / adaptation
Option 1 Replacement of bridge with pedestrian footbridge Not costed
Option 2 Replacement of bridge with modern swing span mechanism Not costed
Option 3 Replacement of bridge with light rail capability Not costed
NOTE: * ALLOWS FOR A MAINTENANCE LOAD OF 2.0KPA AND/OR A MEDIUM SIZE VEHICLE UP TO 9 TONNES ON THE BRIDGE
** FOR SAFETY REASONS, REMOVAL/DEMOLITION OPTIONS INCLUDE THE RESTORATION OF THE REMAINING INFRASTRUCTURE
NOT DEMOLISHED, SUCH AS: RESTORATION OF THE EXISTING TIMBER FENDERS, RESTORATION OF STEEL BRIDGE APPROACHES
AND SPANS WHERE APPLICABLE, AND RESTORATION OF SANDSTONE ABUTMENTS AND THE CENTRAL PIER WHERE APPLICABLE
SOURCE: RMS

A C I L A L L E N C O N S U L T I N G
OPTIONS FOR GLEBE ISLAND BRIDGE BRIDGE COST BENEFIT ANALYSIS OF VARIOUS OPTIONS FOR GLEBE ISLAND BRIDGE 13
3.1.1 Preservation / restoration
Refurbishment or restoration of the Bridge can be undertaken to various degrees:
from simply ensuring that the bridge no longer poses a hazard to vessels travelling
through the channel, to full restoration of the Bridge to working order.
Preservation Option 1 (Base Case)
This option would essentially leave the situation ‘as is’ pending further developments
in the Bays Precinct Area. The major costs involved would be investigation costs
and maintenance work in order to bring the Bridge up to the standard required of
heritage structures identified on the RMS Heritage and Conservation Register.
Preservation Option 2 (Restoration)
Restoring the Bridge to its former glory, as shown in Figure 5 below, would provide
amenity value to local residents at Johnstons Bay and Ultimo as well as the wider
community. A thoroughfare for cyclists would also improve cycle paths through the
city. The heritage value of the Bridge would be preserved.
FIGURE 5 PRESERVATION – OPTION 2 (RESTORATION)
SOURCE: RMS
The costing for full rehabilitation of the Bridge would be $37.5 million dollars,
including a 35 per cent contingency amount. A more detailed breakdown of costs is
presented in Table 4.
TABLE 4 PRESERVATION - OPTION 2
Project item Cost
Construction $22.95 million
Project management and client costs $4.86 million
Contingency $9.70 million
Total cost $37.52 million
SOURCE: RMS
A C I L A L L E N C O N S U L T I N G
OPTIONS FOR GLEBE ISLAND BRIDGE BRIDGE COST BENEFIT ANALYSIS OF VARIOUS OPTIONS FOR GLEBE ISLAND BRIDGE 14
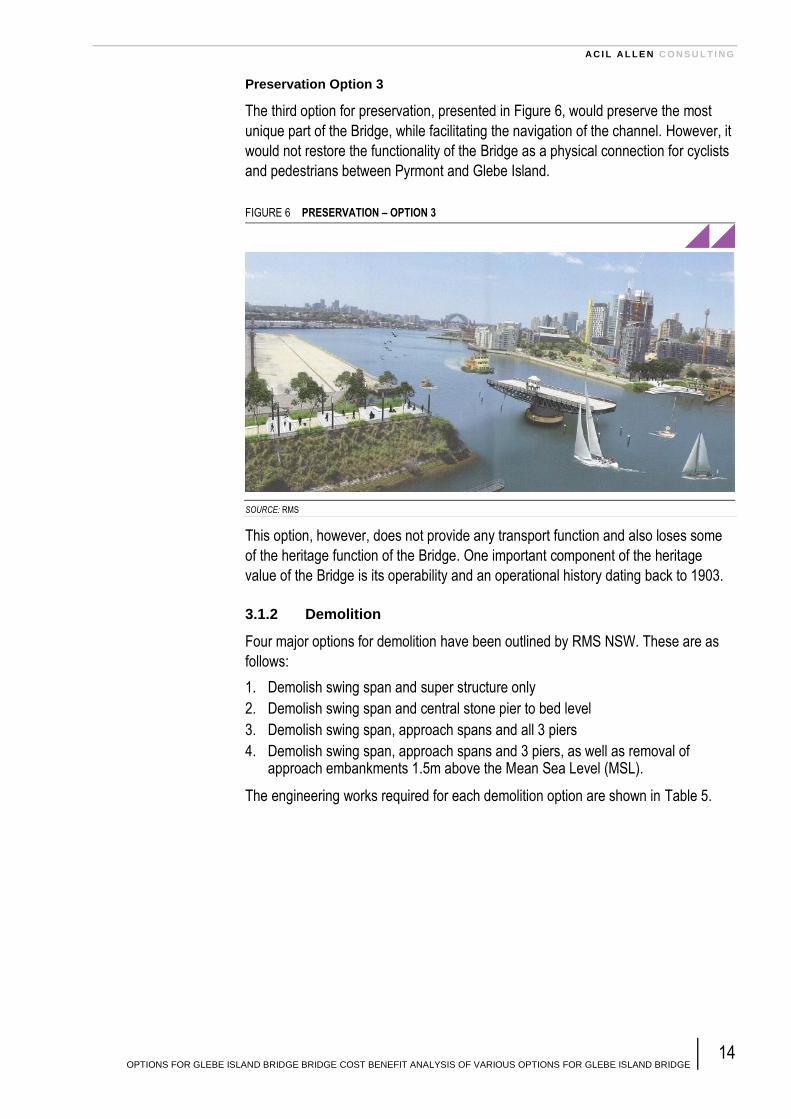
Preservation Option 3
The third option for preservation, presented in Figure 6, would preserve the most
unique part of the Bridge, while facilitating the navigation of the channel. However, it
would not restore the functionality of the Bridge as a physical connection for cyclists
and pedestrians between Pyrmont and Glebe Island.
FIGURE 6 PRESERVATION – OPTION 3
SOURCE: RMS
This option, however, does not provide any transport function and also loses some
of the heritage function of the Bridge. One important component of the heritage
value of the Bridge is its operability and an operational history dating back to 1903.
3.1.2 Demolition
Four major options for demolition have been outlined by RMS NSW. These are as
follows:
1. Demolish swing span and super structure only
2. Demolish swing span and central stone pier to bed level
3. Demolish swing span, approach spans and all 3 piers
4. Demolish swing span, approach spans and 3 piers, as well as removal of approach embankments 1.5m above the Mean Sea Level (MSL).
The engineering works required for each demolition option are shown in Table 5.

A C I L A L L E N C O N S U L T I N G
OPTIONS FOR GLEBE ISLAND BRIDGE BRIDGE COST BENEFIT ANALYSIS OF VARIOUS OPTIONS FOR GLEBE ISLAND BRIDGE 15
TABLE 5 WORKS REQUIRED FOR EACH DEMOLITION OPTION
Work item Option 1 Option 2 Option 3 Option 4
Remove Piles and Timber Fender Yes Yes Yes Yes
Remove Centre Swing Span Yes Yes Yes Yes
Remove Centre Pivot No Yes Yes Yes
Remove Approach Girders No No Yes Yes
Rehabilitate Approach Girders Yes Yes No No
Remove Road Approach and Bridge BN 26 No No No Yes
Rebuild Approach Road and Bridge No No No No
Rehabilitate Approach Road and Bridge BN26 Yes Yes Yes No
SOURCE: RMS
Demolition Option 1
Option 1 would remove the swing span and other superstructure. It would cost a
total of $39.3 million dollars, and would leave a navigational hazard in the middle of
the channel as shown below
TABLE 6 DEMOLITION – OPTION 1
Project item Cost
Contractors costs $7.8 million
Restore approach and spans $15.7 million
Project development, design and management $4.7 million
Contingency $11.1 million
Total cost $39.3 million
SOURCE: RMS
Demolition Option 2
Option 2 is more expensive than Option 1, but it involves removal of the central pier
down to the bed level, thus allowing for vessels with a greater draft or wider beam to
pass through the channel free of any navigational hazard.

A C I L A L L E N C O N S U L T I N G
OPTIONS FOR GLEBE ISLAND BRIDGE BRIDGE COST BENEFIT ANALYSIS OF VARIOUS OPTIONS FOR GLEBE ISLAND BRIDGE 16
TABLE 7 DEMOLITION – OPTION 2
Project item Cost
Contractors costs $11 million
Restore approach and spans $15.7 million
Project development, design and management $5 million
Contingency $12.1 million
Total cost $43.9 million
SOURCE: RMS
Demolition Option 3
Option 3 involves the removal of the swing span, the central pier, fenders, approach
spans and rest piers, which would provide an even wider channel for commercial
boats crossing between the Bays and the Harbour.
TABLE 8 DEMOLITION – OPTION 3
Project item Cost
Contractors costs $19.1 million
Restore approach $4.1 million
Project development, design and management $4.5 million
Contingency $9.6 million
Total cost $37.3 million
SOURCE: RMS
Demolition Option 4
Option 4 is to demolish all structures and approach embankments. This would leave
the widest channel for all kinds of maritime purposes and would remove the
approach embankments 1.5 metres above the MSL.

A C I L A L L E N C O N S U L T I N G
OPTIONS FOR GLEBE ISLAND BRIDGE BRIDGE COST BENEFIT ANALYSIS OF VARIOUS OPTIONS FOR GLEBE ISLAND BRIDGE 17
TABLE 9 DEMOLITION – OPTION 4
Project item Cost
Contractors costs $26.1 million
Restore approach NA
Project development, design and management $4.5 million
Contingency (31%) $9.6 million
Total cost $40.2 million
SOURCE: RMS
3.1.3 Replacement
At present there are two main ideas for replacing the Bridge:
1. Replacing the Bridge altogether with a pedestrian/cycle bridge.
2. Adapting the existing structure to provide a more modern and efficient solution facilitating both pedestrian and vessel access.
Replacement Option 1
The first idea is to establish a new fixed pedestrian and cycle bridge across the
channel (see Figure 7).
FIGURE 7 REPLACEMENT – OPTION 1
SOURCE: TRANSPOSRT FOR NSW

A C I L A L L E N C O N S U L T I N G
OPTIONS FOR GLEBE ISLAND BRIDGE BRIDGE COST BENEFIT ANALYSIS OF VARIOUS OPTIONS FOR GLEBE ISLAND BRIDGE 18
The major issue with this kind of solution is that it would restrict Bay access for some
of the commercial and other vessels passing between the Bays and the Harbour.
This would lead to an adverse economic outcome for commercial maritime activities
within the Bays. It would also prohibit the Bays from being used by recreational craft
that have a higher drafting than this bridge.
Replacement Option 2
This option would involve replacing the approach road surface with civic paving or
park materials and creating a new pedestrian/cycle swing bridge. It would retain and
restore the swing mechanism and create a linear parkland area with seating,
lighting, planting and cycle infrastructure.
FIGURE 8 REPLACEMENT – OPTION 2
SOURCE: TRANSPOSRT FOR NSW
This would again connect the Bays Precinct to Pyrmont Light Rail via the waterfront
and would allow for the creation of a new park under the bridge at Bank Street with
restored buildings and new harbour access.
Neither of the replacement options is precluded by demolishing the Bridge. If the
Government was to pursue redevelopment options for Glebe Island in the longer-
term, there is also potential for replacement options to be privately funded as part of
the development at no cost to Government.
3.2 Shortlisted options
The shortlisted options for the cost-benefit analysis are:
Base Case – Preservation / Restoration Option 1
Full Demolition – Demolition Option 4
Restoration – Preservation / Restoration Option 2.
Preservation / Restoration Option 3 was eliminated as it does not preserve the
integrity of the original Bridge design and therefore confers only partial heritage
value to the preserved structure. It also does not restore the functionality of the
original Bridge.
A C I L A L L E N C O N S U L T I N G
OPTIONS FOR GLEBE ISLAND BRIDGE BRIDGE COST BENEFIT ANALYSIS OF VARIOUS OPTIONS FOR GLEBE ISLAND BRIDGE 19
The replacement options were eliminated because they provide similar transport
functionality as Preservation / Restoration Option 2 without the heritage benefits of
that option.
Among the demolition options, Option 3 was shortlisted because it enables the
channel to be widened relative to Options 1 and 2 (thereby improving the transit of
vessels through the channel and reducing the likelihood of an accident), while
costing less than Option 4 (which would have further widened the channel).
The costs and benefits associated with the shortlisted options are assessed in the
next two chapters of the report.

A C I L A L L E N C O N S U L T I N G
OPTIONS FOR GLEBE ISLAND BRIDGE BRIDGE COST BENEFIT ANALYSIS OF VARIOUS OPTIONS FOR GLEBE ISLAND BRIDGE 20
4 Assessment of costs
The capital and recurrent costs of the Base Case, the Restoration option and the Full Demolition option are set out in this chapter.
4.1 Capital costs
4.1.1 Base Case
The capital costs associated with the Base Case are shown in Table 10. The total
capital cost is estimated at $12.013 million in 2013 dollars. It is assumed that the
works will be completed within a year.
TABLE 10 CAPITAL COST OF BASE CASE
Item Cost
Demolish and Replace Fender System $4,800,000
Dolphins $1,800,000
Structural Repairs to Approach Spans allow Year 1
Painting of Approach Spans allow Year 1
Repair to Bridge No 62 -Bearings and Structural $250,000
Replace Swing Gate $45,000
Repair Pedestrian Barrier $86,000
Replace Lighting $72,000
Sandstone Facing $301,000
Total Construction Cost $7,354,000
Project Management and Client Costs $1,544,340
Contingency $3,114,419
Total Project Costs $12,013,000
SOURCE: RMS
4.1.2 Full Demolition
The capital costs associated with the Full Demolition option are shown in Table 11.
The total capital cost of the option is $37.303 million in 2013 dollars. The
incremental capital cost of the option is thus $25.290 million in 2013 dollars.
Again, it is assumed that the works will be completed within a year.

A C I L A L L E N C O N S U L T I N G
OPTIONS FOR GLEBE ISLAND BRIDGE BRIDGE COST BENEFIT ANALYSIS OF VARIOUS OPTIONS FOR GLEBE ISLAND BRIDGE 21
TABLE 11 CAPITAL COST OF FULL DEMOLITION OPTION
Item Cost
Project Development $926,770
Investigation and Design $1,004,001
Construction
Preliminaries, Surveys, Temporary Works $2,024,373
Environmental Works $1,896,306
Adjustment to existing services $390,084
Controlled Demolition $19,205,202
Earthworks $55,813
Miscellaneous $1,844,152
Provision for Traffic $265,608
Restore approach and Abutment $5,740,000
PAI $172,818
Project Management Services $3,119,651
Client Representation $311,965
Handover $346,281
Total Project Costs $37,303,024
SOURCE: RMS
4.1.3 Restoration
The capital costs associated with the Restoration option are shown in Table 12. The
total capital cost is estimated at $37.517 million in 2013 dollars. The incremental
capital cost of the option (above that of the Base Case) is $25.502 million in 2013
dollars.
TABLE 12 CAPITAL COST OF RESTORATION OPTION
Item Cost
Preliminaries $2,748,700
Environmental $1,404,700
Adjustment to Services $288,000
Demolition $2,708,800
Fender Restoration and Repair $2,210,700
Earthworks $232,400
Pavements $1,121,000
Steelwork Repairs $2,181,500
Steelwork Repainting $8,554,800
Electrical and Mechanical $339,100
Sandstone Facing Restoration $556,700
Miscellaneous $448,100
Provision for Traffic $159,400
Total Construction Cost $22,953,900
Project Management and Client Costs $4,863,000
Contingency $9,699,400
Total Project Costs $37,517,000
SOURCE: RMS

A C I L A L L E N C O N S U L T I N G
OPTIONS FOR GLEBE ISLAND BRIDGE BRIDGE COST BENEFIT ANALYSIS OF VARIOUS OPTIONS FOR GLEBE ISLAND BRIDGE 22
As in the Base Case, it is assumed that the works will be completed within a year.
4.2 Recurrent costs
4.2.1 Base Case
According to RMS, under the Base Case the following maintenance works will need to be undertaken over the 30-year analysis period:
annual maintenance (costing $100,000 per year in 2013 dollars)
structural steelwork repairs and road repairs within the first two years (costing a total of $2,542,000)
major repainting (20 per cent of steel area in Year 2, 50 per cent in Year 5 and 30 per cent in Year 10)
bridge bearings replacement and other associated works (costing $250,000 every 15 years)
sandstone facing (100 square metres costing $301,000 every 10 years)
timber fender maintenance (costing $807,000 every 10 years)
mechanical and electrical upgrades (AC-DC in Year 5 and mechanical in Year 10, costing $200,000 on each occasion).
The year-by-year recurrent costs of the Bridge in the Base Care are shown in Table
13.

A C I L A L L E N C O N S U L T I N G
OPTIONS FOR GLEBE ISLAND BRIDGE BRIDGE COST BENEFIT ANALYSIS OF VARIOUS OPTIONS FOR GLEBE ISLAND BRIDGE 23
TABLE 13 RECURRENT COSTS UNDER THE BASE CASE, YEAR 1 TO YEAR 30
Annual
maintenance
Structural steelwork
repairs and road
repairs
Major
repaint
Bridge
bearings
and
structural
Sandstone
facing
Timber
fender
maintenance
Mechanical
and
electrical
upgrades
Total
recurrent
costs
Year 1 $100,000 $2,542,000
$2,642,000
Year 2 $100,000
$4,494,000
$4,594,000
Year 3 $100,000
$100,000
Year 4 $100,000
$100,000
Year 5 $100,000
$7,284,000
$200,000 $7,584,000
Year 6 $100,000
$100,000
Year 7 $100,000
$100,000
Year 8 $100,000
$100,000
Year 9 $100,000
$100,000
Year 10 $100,000 $154,000 $5,475,000
$301,000 $807,000 $200,000 $7,037,000
Year 11 $100,000
$100,000
Year 12 $100,000
$100,000
Year 13 $100,000
$100,000
Year 14 $100,000
$100,000
Year 15 $100,000
$250,000
$350,000
Year 16 $100,000
$100,000
Year 17 $100,000
$100,000
Year 18 $100,000
$100,000
Year 19 $100,000
$100,000
Year 20 $100,000
$301,000 $807,000
$1,208,000
Year 21 $100,000
$100,000
Yer 22 $100,000
$100,000
Year 23 $100,000
$100,000
Year 24 $100,000
$100,000
Year 25 $100,000
$100,000
Year 26 $100,000
$100,000
Year 27 $100,000
$100,000
Year 28 $100,000
$100,000
Year 29 $100,000
$100,000
Year 30 $100,000
$250,000 $301,000 $807,000
$1,458,000
SOURCE: RMS
4.2.1 Full Demolition
It is assumed that no recurrent costs will be incurred under the Full Demolition
option.
4.2.2 Restoration
Under the Restoration option, the following maintenance works will need to be undertaken over the 30-year analysis period:
annual maintenance (costing $50,000 per year in the first five years and $100,000 per year thereafter)
major repairs (costing $7,124,500 every 15 years)

A C I L A L L E N C O N S U L T I N G
OPTIONS FOR GLEBE ISLAND BRIDGE BRIDGE COST BENEFIT ANALYSIS OF VARIOUS OPTIONS FOR GLEBE ISLAND BRIDGE 24
timber fender maintenance (costing $807,000 every 10 years)
bridge bearings replacement (costing $50,000 every 15 years)
road restoration (costing $160,000 every five years)
sandstone facing (100 square metres costing $301,000 every 10 years)
mechanical and electrical upgrades (AC-DC in Year 5 and mechanical in Year 10, costing $200,000 on each occasion).
In addition, the annual operational costs of the restored Bridge, including for labour
and utilities, are estimated by RMS to be $500,000 in 2013 dollars based on
operating costs of other opening bridges. The year-by-year recurrent costs of the
Bridge in the Restoration Option are shown in Table 14.
TABLE 14 RECURRENT COSTS UNDER THE RESTORATION OPTION, YEAR 1 TO YEAR 30
Annual
maintenance
Major
repaint
Timber
fender
maintenance
Road
restoration
Sandstone
facing
Mechanical
and
electrical
upgrades
New
bridge
bearings
Operational
costs
Total
recurrent
costs
Year 1 $50,000
$500,000 $550,000
Year 2 $50,000
$500,000 $550,000
Year 3 $50,000
$500,000 $550,000
Year 4 $50,000
$500,000 $550,000
Year 5 $50,000
$160,000
$200,000
$500,000 $910,000
Year 6 $100,000
$500,000 $600,000
Year 7 $100,000
$500,000 $600,000
Year 8 $100,000
$500,000 $600,000
Year 9 $100,000
$500,000 $600,000
Year 10 $100,000
$807,000 $160,000 $301,000 $200,000
$500,000 $2,068,000
Year 11 $100,000
$500,000 $600,000
Year 12 $100,000
$500,000 $600,000
Year 13 $100,000
$500,000 $600,000
Year 14 $100,000
$500,000 $600,000
Year 15 $100,000 $7,124,500
$160,000
$50,000 $500,000 $7,934,500
Year 16 $100,000
$500,000 $600,000
Year 17 $100,000
$500,000 $600,000
Year 18 $100,000
$500,000 $600,000
Year 19 $100,000
$500,000 $600,000
Year 20 $100,000
$807,000 $160,000 $301,000
$500,000 $1,868,000
Year 21 $100,000
$500,000 $600,000
Yer 22 $100,000
$500,000 $600,000
Year 23 $100,000
$500,000 $600,000
Year 24 $100,000
$500,000 $600,000
Year 25 $100,000
$160,000
$500,000 $760,000
Year 26 $100,000
$500,000 $600,000
Year 27 $100,000
$500,000 $600,000
Year 28 $100,000
$500,000 $600,000
Year 29 $100,000
$500,000 $600,000
Year 30 $100,000 $7,124,500 $807,000 $160,000 $301,000
$50,000 $500,000 $9,042,500
SOURCE: RMS
A C I L A L L E N C O N S U L T I N G
OPTIONS FOR GLEBE ISLAND BRIDGE BRIDGE COST BENEFIT ANALYSIS OF VARIOUS OPTIONS FOR GLEBE ISLAND BRIDGE 25
4.3 Costs to NSW Government
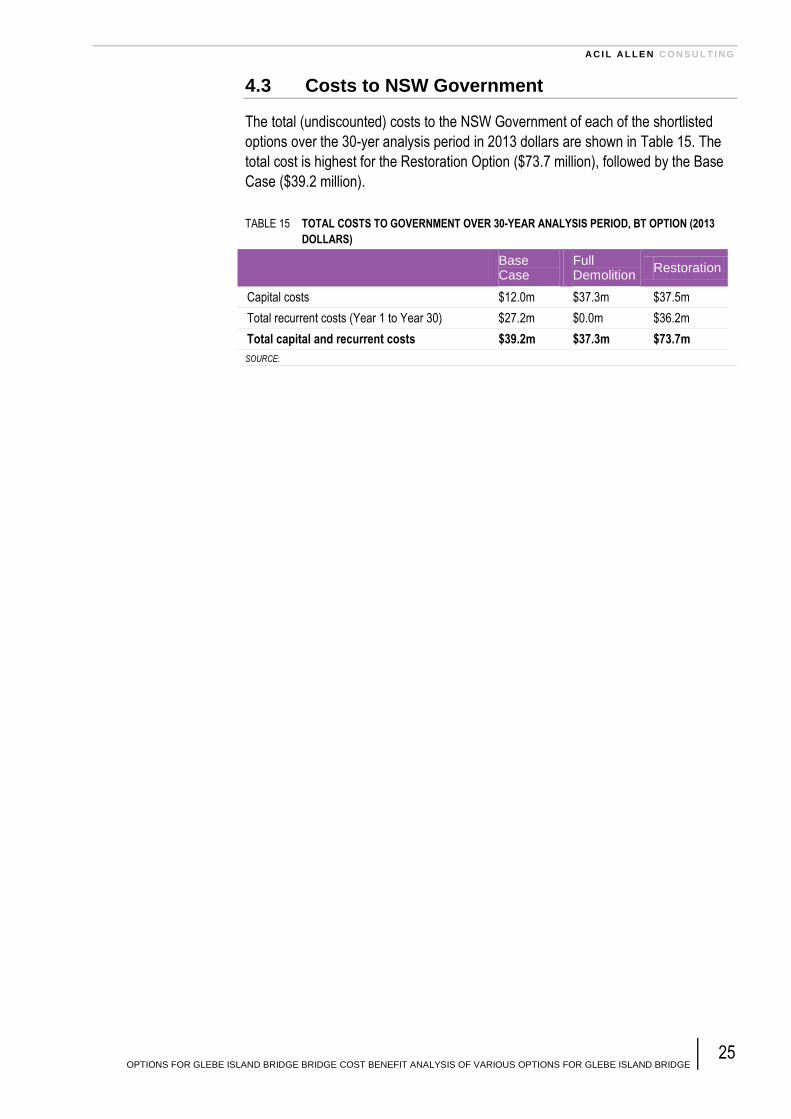
The total (undiscounted) costs to the NSW Government of each of the shortlisted
options over the 30-yer analysis period in 2013 dollars are shown in Table 15. The
total cost is highest for the Restoration Option ($73.7 million), followed by the Base
Case ($39.2 million).
TABLE 15 TOTAL COSTS TO GOVERNMENT OVER 30-YEAR ANALYSIS PERIOD, BT OPTION (2013
DOLLARS)
Base Case
Full Demolition
Restoration
Capital costs $12.0m $37.3m $37.5m
Total recurrent costs (Year 1 to Year 30) $27.2m $0.0m $36.2m
Total capital and recurrent costs $39.2m $37.3m $73.7m
SOURCE:

A C I L A L L E N C O N S U L T I N G
OPTIONS FOR GLEBE ISLAND BRIDGE BRIDGE COST BENEFIT ANALYSIS OF VARIOUS OPTIONS FOR GLEBE ISLAND BRIDGE 26
5 Assessment of benefits
The benefits associated with the Restoration and Full Demolition options, relative to
the Base Case, are identified, assessed and quantified (where possible) in this
chapter.
As some of the benefits are very difficult to quantify and precisely place a value on,
in particular the amenity and heritage benefits of the Restoration option, an
alternative strategy was adopted to address this challenge.
5.1 Full demolition option benefits
5.1.1 Avoided maintenance costs
Demolishing the Glebe Island Bridge means that the recurrent costs associated with
the Base Case can be avoided. The resulting year-by-year benefit is shown in
Figure 9.
FIGURE 9 AVOIDED MAINTENANCE COSTS OF FULL DEMOLITION OPTION, YEAR 1 TO YEAR 30
(2013 DOLLARS)
SOURCE: ACIL ALLEN
5.1.2 Safety benefits
According to records held by Transport for NSW, in the period 1992/93 to 2012/13
there has been 11 reported boating incidents in the immediate vicinity of Glebe
Island Bridge. These 11 incidents were comprised of one fatal incident and 10 non-
injury incidents.
$0
$1
$2
$3
$4
$5
$6
$7
$8
1 3 5 7 9 11 13 15 17 19 21 23 25 27 29
Millions
Year

A C I L A L L E N C O N S U L T I N G
OPTIONS FOR GLEBE ISLAND BRIDGE BRIDGE COST BENEFIT ANALYSIS OF VARIOUS OPTIONS FOR GLEBE ISLAND BRIDGE 27
Seven of these incidents have involved a collision with the Bridge or its structures.
Were the Bridge to be removed, it is likely that there would be a very significant
decrease in ‘collision with fixed object’ incidents in this area.
According to Transport for NSW, a comparison between the number of incidents at
Glebe Island Bridge and other similar bridges reveals that the incident rate at Glebe
Island Bridge is significantly higher than at other similar locations. For example, at
Iron Cove Bridge there has been only one reported incident during this period, and
at Fig Tree Bridge in Lane Cove River there have been only three reported
incidents.
Based on the historical average for the period examined, the mean rate of incidents
occurring in the vicinity of Glebe Island Bridge was calculated by Transport for NSW
to be 0.52 (confidence bounds of 0.21 to 0.83) incidents per year. Interestingly, the
incident rate appears to be increasing, with a mean from 1992/93 to 2003/04 of 0.18
and a mean from 2004/05 to 2012/13 of 0.9 (a statistically significant increase).
THE ASSUMPTIONS UNDERPINNING ACIL ALLEN’S ESTIMATE OF THE SAFETY BENEFITS ASSOCIATED
ASSOCIATED WITH THE DEMOLITION OF THE BRIDGE ARE SHOWN IN TABLE 16. THE
VALUE OF A DEATH AVERTED (KNOWN AS THE VALUE OF STATISTICAL LIFE OR VSL –
SEE
Box 1) and the value of a serious injury averted are drawn from Principles and
Guidelines for Economic Appraisal of Transport Investments published by Transport
for NSW in March 2013. Transport for NSW estimates that the number of accidents
would decrease by at least 50 per cent after the demolition of the Bridge.
TABLE 16 ASSUMPTIONS USED IN ESTIMATING SAFETY BENEFITS OF THE FULL DEMOLITION
OPTION
Assumption Assumed value Source
No. of non-injury accidents in last 8 years 7 Transport for NSW
No. of fatalities in last 20 years 1 Transport for NSW
No. of serious injuries in last 20 years 0 Transport for NSW
Value of property damage per accident $50,000 ACIL Allen estimate
Value of Statistical Life (VSL) $6,412,584 TfNSW Principles and Guidelines for Economic Appraisal of Transport Investments, March 2013
Value of serious injury averted $482,043 TfNSW Principles and Guidelines for Economic Appraisal of Transport Investments, March 2013
% reduction in accidents after demolition 50% Transport for NSW estimate
SOURCE: VARIOUS

A C I L A L L E N C O N S U L T I N G
OPTIONS FOR GLEBE ISLAND BRIDGE BRIDGE COST BENEFIT ANALYSIS OF VARIOUS OPTIONS FOR GLEBE ISLAND BRIDGE 28
BOX 1 VALUE OF STATISTICAL LIFE
Accident costs can be estimated based on two main approaches: willingness to pay and human capital cost:
The willingness to pay approach uses an ex-ante measure of the amount that individuals are willing to pay for accident prevention. Values of accident costs are derived from stated preference surveys where respondents are asked to choose hypothetical scenarios systematically varied in safety, travel time and cost. Econometric models are specified and developed to statistically estimate the monetised valuation of safety.
The human capital approach captures the ex-post sum of various identifiable costs, such as loss of work income, medical expenses, long term care, insurance cost, vehicle repair, property damage, travel delays and policing.
The Value of Statistical Life (VSL) is often used to estimate the benefits of reducing the risk of death. The VSL is an estimate of the financial value society places on reducing the average number of deaths by one. The VSL is most appropriately measured by estimating how much society is willing to pay to reduce the risk of death. However, there are different methods of measuring society’s willingness to pay to reduce the risk of death.
One direct method is to ask individuals through a survey what they would pay to save or prolong life. There is evidence that willingness to pay surveys overestimate willingness to pay when compared to actual consumer choices subject to a budget constraint.
One method which incorporates a budget constraint is to observe how much consumers pay for products that reduce the risk of death or injury, for example, the purchase of safety items in a car.
Another indirect method is to observe how much workers are willing to pay (through reduced wages) for an improvement in workplace safety. This form of analysis is most commonly used for estimating the value of statistical life.
SOURCE:OFFICE OF BEST PRACTICE REGULATION , BEST PRACTICE REGULATION GUIDANCE NOTE – VALUE OF STATISTICAL
LIFE, NOVEMBER 2008
5.1.3 Time savings of maritime operators
Full demolition of Glebe Island Bridge would potentially enable smoother and
quicker passage of vessels through the widened channel.
The assumptions underpinning ACIL Allen’s estimate of the potential time savings
for maritime operators and other users of the channel if the Bridge is completely
demolished are shown in Table 17.

A C I L A L L E N C O N S U L T I N G
OPTIONS FOR GLEBE ISLAND BRIDGE BRIDGE COST BENEFIT ANALYSIS OF VARIOUS OPTIONS FOR GLEBE ISLAND BRIDGE 29
TABLE 17 ASSUMPTIONS USED IN ESTIMATING MARITIME TIMESAVINGS OF THE FULL DEMOLITION OPTION
Assumption Assumed
value Source
Average number of boats passing through the bridge per day 300 * TfNSW Maritime Division estimate
Average number of passengers per boat 4.8 ACIL Allen survey of maritime businesses
Proportion of boat trips that are business-related 78% ACIL Allen survey of maritime businesses
Value of travel time savings per hour for business trips $44.03 TfNSW Principlaes and Guidences for Economic Appraisal of Transport Investments, March 2013
Value of travel time savings per hour for leisure trips $13.76 TfNSW Principlaes and Guidences for Economic Appraisal of Transport Investments, March 2013
Average time saving per boat due to full demolition (minutes) 10.0 ACIL Allen survey of maritime businesses
NOTE: * A COUNTING EXERCISE COMMISSIONED BY THE CITY OF SYDNEY FOUND AN AVERAGE OF 180 VESSEL MOVEMENTS PER DAY OVER A 3-WEEK PERIOD IN JUNE 2013
AND A 1-WEEK PERIOD IN AUGUST 2013, OF WHICH 47% WERE LARGE VESSELS THAT WOULD REQUIRE A RESTORED BRIDGE TO OPEN. IT IS LIKELY THAT RECORDED VESSEL
MOVEMENTS WOULD BE HIGHER IF THE EXERCISE WERE TO BE CONDUCTED OVER THE WARMER MONTHS OF THE YEAR.
SOURCE: VARIOUS
Information obtained from the survey of maritime businesses in Rozelle and
Blackwattle Bays suggests the following: 78 per cent of trips through the channel are
for businesses rather than leisure; there are 4.8 passengers per vessel on average;
and the average time saving per vessel enabled by full demolition of the Bridge
would be 10.0 minutes. RMS estimates that currently up to 300 vessels pass
through the channel each day and that vessel movements are likely to grow by more
than 2 per cent per annum.
5.2 Restoration option benefits
Restoring Glebe Island Bridge reduces the future costs of maintaining the Bridge. It
also results in time savings for some of the Balmain and East Balmain residents who
commute to work in the inner city by cycling or walking. It will also generate amenity
benefits for recreational cyclists and walkers who use the Bridge as part of their
route, as well as better realising its heritage value to Sydneysiders.
5.2.1 Avoided maintenance costs
The benefit of reduced maintenance costs associated with the restored Bridge
relative to the Base case is quantified by subtracting the recurrent cost shown in
Table 14 from that shown in Table 13.
The resulting year-by-year benefit is shown in Figure 10. The avoided maintenance
costs are positive in the first 15 years of the analysis period and negative in the next
15 years. The negative spikes in Year 15 and Year 30 correspond to the costs of
repainting the restored Bridge.
FIGURE 10 AVOIDED MAINTENANCE COSTS OF RESTORATION OPTION, YEAR 1 TO YEAR 30 (2013
DOLLARS)

A C I L A L L E N C O N S U L T I N G
OPTIONS FOR GLEBE ISLAND BRIDGE BRIDGE COST BENEFIT ANALYSIS OF VARIOUS OPTIONS FOR GLEBE ISLAND BRIDGE 30
SOURCE: ACIL ALLEN
5.2.2 Delays for vessel operators
ACIL Allen’s survey of maritime businesses at Blackwattle and Rozelle Bays indicates that the average delay per vessel is expected to be 14.3 minutes when the bridge is primarily closed to maritime traffic and only periodically opened (no more than once per hour) after restoration. This is the estimated average delay for all vessels – there would be no delay for smaller vessels that can pass under the Bridge and delays in excess of 14.3 minutes for larger vessels that have to queue and wait for the Bridge to open.
5.2.3 Time savings of commuters
According to the NSW Bureau of Transport Statistics, 3,744 residents in the
transport zones around Balmain and Balmain East commute to work in the Sydney
Inner City each work day of the week. Of these, 208 (approximately 6 per cent) cycle
and 89 (approximately 3 per cent) walk. In addition, 374 residents in Sydney Inner
City commute to Balmain and Balmain East for work. Of these, 21 (approximately 6
per cent) cycle and 12 (approximately 4 per cent) walk.2
Therefore, there are approximately 229 cyclists and 101 walkers each work day who
could potentially enjoy time savings by commuting to work via the low-level restored
Glebe Island Bridge instead of the high-level Anzac Bridge.
This is predicated on cyclists/pedestrians being able to directly access the Bridge
from Balmain. Public access from Balmain to White Bay is currently limited due to
port operations. Some connecting infrastructure (such as a bike path) would
therefore need to be provided. This connecting infrastructure has not yet been
costed.
While the number of cyclists/pedestrians using the Bridge would significantly
increase if residential development occurred on Glebe Island, the NSW Government
2 This information was accessed via the NSW Bureau of Transport Statistics’ online JTW Explorer, available at
http://visual.bts.nsw.gov.au/jtwbasic/
-$8
-$6
-$4
-$2
$0
$2
$4
$6
$8
1 3 5 7 9 11 13 15 17 19 21 23 25 27 29
Millions
Year

A C I L A L L E N C O N S U L T I N G
OPTIONS FOR GLEBE ISLAND BRIDGE BRIDGE COST BENEFIT ANALYSIS OF VARIOUS OPTIONS FOR GLEBE ISLAND BRIDGE 31
has recently confirmed that it will be retained for port use – meaning that such
development is unlikely within the timeframe of the study.
In the cost-benefit analysis, it is assumed that on average the cyclists save 5
minutes per trip while the walkers save 15 minutes per trip. The assumptions
underpinning ACIL Allen’s estimation of the commuter time savings are shown in
Table 18.
TABLE 18 ASSUMPTIONS USED IN ESTIMATING COMMUTER TIME SAVINGS UNDER THE
RESTORATION OPTION
Assumption Assumed value Source
Projected growth in commuters per year 2.0% ACIL Allen estimate
Value of travel time savings per hour for business trips $44.03
TfNSW Principles and Guidelines for Economic Appraisal of Transport Investments, March 2013
Commuters - cycling
No. of cyclists per weekday who will benefit from the restored Bridge 229 NSW Bureau of Transport
Time savings per cyclist (minutes) 5.0 ACIL Allen estimate
Commuters – walking
No. of cyclists per weekday who will benefit from the restored Bridge 101 NSW Bureau of Transport
Time savings per walker (minutes) 15.0 ACIL Allen estimate
SOURCE: VARIOUS
5.2.4 Amenity benefits
Some of the stakeholders consulted by ACIL Allen envisage a restored Glebe Island
Bridge being an integral part of a seamless walking and biking trail that would
eventually connect all the disparate parts of the Bays Precinct. This link has been
identified in the City of Sydney’s Inner Sydney Regional Bike Plan.
There might therefore be potential amenity benefits for recreational walkers, joggers
and cyclists who choose to include the restored Glebe Island Bridge as part of their
walking / jogging / cycling route.
However, the number of recreational walkers and joggers is likely to be small unless
Glebe Island is redeveloped as a major residential precinct. As noted previously,
given the Government’s recent commitment to retain Glebe Island as a working port,
residential development within the 30-year timeframe of this analysis is unlikely.
ACIL Allen’s review of the literature on the economic valuation of walking trails did
not uncover any Australian and international studies whose findings would be
applicable to the valuation of amenity benefits resulting from the restoration of Glebe
Island Bridge.
5.2.5 Heritage value
As noted previously in Section 2.1.4, the Glebe Island Bridge is potentially of state
heritage significance as it demonstrates one of the earliest examples of an electric-
powered swing bridge in Australia.

A C I L A L L E N C O N S U L T I N G
OPTIONS FOR GLEBE ISLAND BRIDGE BRIDGE COST BENEFIT ANALYSIS OF VARIOUS OPTIONS FOR GLEBE ISLAND BRIDGE 32
Technically, it is a complementary structure to the Pyrmont Swing Bridge and has all
the same significant features, including the electrically-driven swing span. They
demonstrated the earliest use of electrical power for this purpose in Australia. The
bridges were considered very innovative at the time of their construction and
attracted international attention.
Both bridges were designed by Percy Allan, a highly-regarded Australian bridge
designer of the late 19th and early 20th century. Both represent the only examples
of such types of bridges in New South Wales and are still operable [Heritage Council
2012].
The historical significance of the Bridge is based on it having been a vital component
of the ‘five bridges’ route from the city to the northern and western suburbs. The
history of this crossing, going back to 1892, is closely associated with the economic
and social development of Sydney at the end of the 19th century.
The Glebe Island Bridge’s value to the Sydney community for having been a
significant contribution to the social and commercial development of Sydney and the
inner western suburbs is demonstrated by the public statements and interest in its
conservation during the broad-ranging community consultation undertaken for the
Bays Precinct by the NSW Government.
The heritage value of the Glebe Island Bridge encompasses non-use values such as
bequest value (where community members place a value on preserving the
structure for future generations), option value (where community members value
their future ability to access the Bridge even if they do not do so presently) and
existence value (where community members derive pleasure just from knowing the
structure is there, even if they never access it).
The heritage value of a historic structure such as the Glebe Island Bridge is usually
estimated using a stated preference or Contingent Valuation Method (CVM). More
specifically, a survey of community members is usually undertaken to elicit their
willingness-to-pay (WTP) for the preservation of the structure. However, such a
survey was beyond the scope of this study. Instead, ACIL Allen will calculate the
threshold value that the community must ascribe to the heritage and amenity
aspects of the restored Glebe Island Bridge in order for Restoration to be the
preferred option.
5.2.6 Option value for future light rail
There has been discussion among some stakeholders consulted by ACIL Allen
about a possible future extension of the Sydney Light Rail system that would
connect the existing station near the Sydney Fish Market to the White Bay Cruise
Passenger Terminal and the to-be-rejuvenated White Bay Power Station via a
restored Glebe Island Bridge.
However, a light rail connection between Pyrmont and White Bay is not in the NSW
Long Term Transport Master Plan and is therefore unlikely to eventuate in the next
20 years. In addition, even if the light rail extension was to be built, it is unclear if it
would result in significant travel time savings for patrons relative to a bus service

A C I L A L L E N C O N S U L T I N G
OPTIONS FOR GLEBE ISLAND BRIDGE BRIDGE COST BENEFIT ANALYSIS OF VARIOUS OPTIONS FOR GLEBE ISLAND BRIDGE 33
serving a similar route. For these reasons, an option value for future light rail has not
been included in the cost-benefit analysis.
5.2.7 Benefits for visitors to the Sydney Exhibition Centre @ Glebe
Island
Sydney Exhibition Centre @ Glebe Island will be the temporary home for Sydney’s
major trade and consumer exhibitions during the redevelopment of the Sydney
international convention, exhibition and entertainment precinct at Darling Harbour
between 2014 and 2016.
Some of the stakeholders consulted by ACIL Allen believe that a restored Glebe
Island Bridge could provide a useful pedestrian connection between the existing light
rail station near the Sydney Fish Market and the Sydney Exhibition Centre @ Glebe
Island.
However, transport links for the venue will already be extensive even without such a
pedestrian connection. Free special event transport will operate on exhibition days.
Regular, scheduled ferry services will run from Darling Harbour, along with regular,
scheduled shuttle bus services from Central Station. A taxi rank and drop-off point
will be located outside the venue and limited paid parking will be available on-site. A
shuttle bus will pick up visitors and exhibitors from selected bus stops and parking
locations in the immediate vicinity of the venue.
Consequently, potential benefits for visitors to the Sydney Exhibition Centre @
Glebe Island have not been included in the cost-benefit analysis.
5.2.8 Residual value
The residual value of the Bridge at the end of the 30-year analysis period is
estimated to be $15,757,140 in 2013 dollars.

A C I L A L L E N C O N S U L T I N G
OPTIONS FOR GLEBE ISLAND BRIDGE BRIDGE COST BENEFIT ANALYSIS OF VARIOUS OPTIONS FOR GLEBE ISLAND BRIDGE 34
6 Cost-benefit analysis results
The results of the cost-benefit analysis of the Glebe Island Bridge are presented in
this chapter. The outcomes of the sensitivity analysis undertaken to check the
robustness of these results are also reported.
6.1 Full Demolition option
6.1.1 Present value of incremental costs
The present value of incremental total costs for the Full Demolition option is $25.3
million in 2013 dollars. It is invariant to the choice of discount rate as the capital
expenditure is incurred in Year 1.
6.1.2 Present value of incremental benefits
The present value of benefits associated with the Full Demolition option under three
alternative real discount rates is shown in Table 19. NSW Treasury recommends
that a 7 per cent real discount rate be used as the central case, with 4 per cent and
10 per cent as sensitivities.
TABLE 19 PRESENT VALUE OF BENEFITS OF FULL DEMOLITION OPTION, 2013 DOLLARS
4% real discount
rate
7% real discount
rate
10% real discount
rate
Avoided maintenance costs $21.0m $18.1m $16.0m
Safety benefits $4.5m $3.0m $2.2m
Maritime travel time savings $80.0m $54.7m $39.8m
Total benefits $105.5m $75.9m $58.1m
SOURCE: ACIL ALLEN
6.1.3 Net present value
The net present value (NPV) of the Full Demolition option, calculated by subtracting
the present value of total incremental costs from the present value of total
incremental total benefits, under the alternative real discount rates is:
$80.2 million (4 per cent real discount rate)
$50.6 million (7 per cent real discount rate)
$29.9 million (10 per cent real discount rate).
6.1.4 Benefit-cost ratio
The benefit-cost ratio (BCR) of the Full Demolition option, calculated by dividing the
present value of total incremental benefits by the present value of total incremental
costs, under the alternative real discount rates is:
4.17 (4 per cent real discount rage)

A C I L A L L E N C O N S U L T I N G
OPTIONS FOR GLEBE ISLAND BRIDGE BRIDGE COST BENEFIT ANALYSIS OF VARIOUS OPTIONS FOR GLEBE ISLAND BRIDGE 35
3.00 (7 per cent real discount rate)
2.30 (10 per cent real discount rate).
Under the central assumption of a 7 per cent real discount rate, the present value of
the benefits of the option is exactly 3 times that of the present value of its costs.
6.2 Restoration option
6.2.1 Present value of incremental costs
The present value of incremental total costs for the Restoration options is $25.5
million in 2013 dollars. It is invariant to the choice of discount rate as the capital
expenditure is incurred in Year 1.
6.2.2 Present value of incremental benefits
The present value of the quantifiable benefits associated with the Restoration option
under the three alternative real discount rates is shown in Table 20. Note that the
maritime travel savings are negative as the restored Bridge will induce delays when
vessels are required to wait for the Bridge to open.
TABLE 20 PRESENT VALUE OF QUANTIFIABLE BENEFITS OF RESTORATION OPTION, 2013
DOLLARS
4% real discount
rate
7% real discount
rate
10% real discount
rate
Avoided maintenance costs $10.6m $11.6m $11.7m
Maritime travel time savings -$114.0m -$78.0m -$56.7m
Commuter time savings for cyclists and walkers
$21.9m $15.2m $11.3m
Residual value $5.0m $2.2m $1.0m
Total quantifiable benefits -$76.5m -$48.9m -$32.8m
SOURCE: ACIL ALLEN
The NPV of the Restoration option based on quantifiable benefits under the three
alternative discount rates is shown in the second row of Table 21. The difference in
the NPVs of the Restoration and Full Demolition options (based on the quantifiable
benefits of the Restoration option) is shown in the last row of the table.
TABLE 21 NPV OF QUANTIFIABLE BENEFITS OF RESTORATION OPTION AND DIFFERENCE IN NPV
BETWEEN RESTORATION AND FULL DEMOLITION OPTIONS, 2013 DOLLARS
4% real discount
rate
7% real discount
rate
10% real discount
rate
NPV of Restoration Option based on quantifiable benefits
-$102.0m -$74.4m -$58.3m
Difference in NPV of Restoration and Full Demolition options based on quantifiable benefits of Restoration option
$182.2m $125.1m $91.1m
SOURCE: ACIL ALLEN
In order for the Restoration option to be preferred over the Full Demolition option,
the yet-to-be quantified heritage and amenity benefits of the restored Bridge needs

A C I L A L L E N C O N S U L T I N G
OPTIONS FOR GLEBE ISLAND BRIDGE BRIDGE COST BENEFIT ANALYSIS OF VARIOUS OPTIONS FOR GLEBE ISLAND BRIDGE 36
to be at least $125.1 million in 2013 dollars in present value terms over the 30-year
analysis period under a 7 per cent real discount rate.
The “required” heritage value of the restored Bridge and present value of amenity
benefits to recreational walkers and cyclists depend on the proportion of
unquantified benefits that are ascribed to heritage benefits versus amenity benefits
(see Table 22).
TABLE 22 REQUIRED HERITAGE AND AMENITY BENEFITS FOR RESTORATION TO BE PREFERRED
OPTION – 7% REAL DISCOUNT RATE, 2013 DOLLARS
Distribution of required benefits Heritage value PV of amenity benefits
25% heritage benefits: 75% amenity benefits $31.3m $93.8m
50% heritage benefits: 50% amenity benefits $62.5m $62.5m
75% heritage benefits: 25% amenity benefits $93.8m $31.3m
SOURCE: ACIL ALLEN
Suppose that the unquantified benefits are to be split evenly between heritage and
amenity benefits, each source of benefits would then need to be at least $62.5
million in present value terms under a 7 per cent real discount rate for Restoration to
emerge as the preferred option.
That is, the broader Sydney community would need to value the heritage aspects of
the Bridge at $62.5 million dollars today. In addition, in regards to amenity benefits,
the community would need to value them at $5.5 million per year in 2013 dollars
over the next 30 years. This equates to $15.20 per trip if 1,000 trips are made daily
across the restored bridge by recreational walkers and cyclists. (1,000 trips per day
equates to about 83 trips per hour assuming that trips are only made during the 12
hours of daylight each day.)
6.3 Sensitivity analysis
To test the robustness of the cost-benefit analysis results, ACIL Allen undertook sensitivity analyses around the key parameters and assumptions underpinning the cost-benefit analysis.
6.3.1 Full Demolition option
Maritime time savings
If the assumed average time saving per vessel after full demolition of the Bridge is
decreased from 10.0 minutes to 5.0 minutes, the BCR of the Full Demolition option
becomes significantly lower at:
2.59 (4 per cent real discount rate)
1.92 (7 per cent real discount rate)
1.51 (10 per cent real discount rate).
If the assumed average time saving per vessel after full demolition of the Bridge is
decreased from 10.0 minutes to just 2.0 minutes, the BCR of the Full Demolition
option becomes even lower at:
1.64 (4 per cent real discount rate)

A C I L A L L E N C O N S U L T I N G
OPTIONS FOR GLEBE ISLAND BRIDGE BRIDGE COST BENEFIT ANALYSIS OF VARIOUS OPTIONS FOR GLEBE ISLAND BRIDGE 37
1.27 (7 per cent real discount rate)
1.04 (10 per cent real discount rate).
Accident reduction
If the demolition of the Bridge results in only a 25 per cent reduction in accidents
(instead of the 50 per cent reduction previously assumed), the BCR of the Full
Demolition option becomes only slightly lower at:
4.07 (4 per cent real discount rate)
2.93 (7 per cent real discount rate)
2.24 (10 per cent real discount rate).
Initial number and growth in vessel movements
If the assumed average number of current vessel movements through the channel
decreases from 300 per day to 180 per day, the BCR of the Full Demolition option
becomes lower at:
2.91 (4 per cent real discount rate)
2.14 (7 per cent real discount rate)
1.67 (10 per cent real discount rate).
If the assumed annual growth rate of vessel movements through the channel
increases from 3.0 per cent to 5.0 percent, the BCR of the Full Demolition option
becomes higher at:
5.20 (4 per cent real discount rate)
3.60 (7 per cent real discount rate)
2.66 (10 per cent real discount rate).
Conversely, if the assumed annual growth rate of vessel movements through the
channel decreases from 3.0 per cent to 1.0 per cent, the BCR of the Full Demolition
option becomes lower at:
3.44 (4 per cent real discount rate)
2.57 (7 per cent real discount rate)
2.03 (10 per cent real discount rate).
6.3.2 Restoration option
Delays to vessel operators
If the expected average delay per vessel after restoration of the Bridge is halved
from 14.3 minutes to 7.15 minutes, the present value of heritage and amenity
benefits required for Restoration to be the preferred option decreases from $125.1
million in 2013 dollars over the 30-year analysis period (under a 7 per cent real
discount rate) to $86.2 million in 2013 dollars.
If this amount is evenly split between heritage and amenity benefits, for Restoration
to be the preferred option the heritage value of the restored Bridge must be at least
$43.1 million while the annual value of amenity benefits to recreational cyclists and
walkers must be at least $3.8 million per year in 2013 dollars. Assuming that 1,000
A C I L A L L E N C O N S U L T I N G
OPTIONS FOR GLEBE ISLAND BRIDGE BRIDGE COST BENEFIT ANALYSIS OF VARIOUS OPTIONS FOR GLEBE ISLAND BRIDGE 38
trips by such cyclists and walkers are made each day, the community must value
each trip at least $10.50.
If the expected average delay per vessel after restoration of the Bridge is increased
from 14.3 minutes to 20 minutes, the present value of heritage and amenity benefits
required for Restoration to be the preferred option increases from $125.1 million to
$156.6 million in 2013 dollars.
Commuter time savings
If the assumed time savings for road commuters is increased by 50 per cent (from
5.0 minutes to 7.5 minutes for cyclists and from 15.0 minutes to 22.5 minutes for
walkers), the present value of commuter time savings over the 30-year analysis
period (under a 7 per cent real discount rate) increases from $15.2 million in 2013
dollars to $22.9 million.
Vessel movements
If the initial number of vessel movements is assumed to be 180 per day instead of
300 per day, the present value of heritage and amenity benefits required for
Restoration to be the preferred option decreases from $125.1 million in 2013 dollars
over the 30-year analysis period (under a 7 per cent real discount rate) to $72.0
million in 2013 dollars.
6.4 Conclusion
The cost-benefit analysis indicates that Full Demolition of the Glebe Island Bridge
generates a relatively high BCR of 3.0 under a 7 per cent real discount rate. About a
quarter of the benefits of this option are attributable to maintenance cost savings
relative to the Base Case, while nearly three-quarters of the benefits are due to
expected maritime travel time savings from the widened channel. The BCR is
therefore sensitive to the assumed average time saving per vessel. If the assumed
average time saving is halved from 10 minutes to 5 minutes, the BCR decreases to
1.92, which remains significantly greater than 1.
Restoration of the Glebe Island Bridge generates benefits from reduced
maintenance costs relative to the Base Case as well as commuter time savings for
some of the cyclists and walkers who currently commute to work over the high-level
Anzac Bridge. However, these benefits are only a third of the value of the estimated
time losses that will be experienced by vessel operators when the bridge is primarily
closed and only periodically opened after restoration.
The heritage value of the restored Bridge and the amenity benefits experienced by
recreational walkers and cyclists have not been explicitly quantified in the cost-
benefit analysis. However, ACIL Allen’s analysis suggests that they have to be at
least $125.1 million in 2013 dollars in present value terms over the 30-year analysis
period (under a 7 per cent real discount rate) in order for Restoration to be the
preferred option.

A C I L A L L E N C O N S U L T I N G
OPTIONS FOR GLEBE ISLAND BRIDGE BRIDGE COST BENEFIT ANALYSIS OF VARIOUS OPTIONS FOR GLEBE ISLAND BRIDGE 39
If these “required” unquantified benefits are to be evenly split between heritage and
amenity benefits, the community must value the heritage aspects of the Glebe Island
Bridge at more than $62.5 million dollars today and value the amenity benefits to
recreational cyclists and walkers at more than $5.5 million a year. Assuming 1,000
trips are made each day by such cyclists and walkers, the community would have to
value each trip at more than $15.20 in 2013 dollars.

A C I L A L L E N C O N S U L T I N G
OPTIONS FOR GLEBE ISLAND BRIDGE BRIDGE COST BENEFIT ANALYSIS OF VARIOUS OPTIONS FOR GLEBE ISLAND BRIDGE 40
References AECOM, 2010. ‘Inner Sydney Regional Bike Plan: Implementation Strategy’, April.
Bays Precinct Taskforce (BPT), 2012. ‘Bays Precinct Strategic Review Framework Report to the NSW Government, Volume 1’, August.
Hasham, 2013. ‘Glebe Island Bridge is rotting away’ <http://www.smh.com.au/nsw/glebe-island-bridge-is-rotting-away-20130402-2h55b.html> Published April 13, Accessed 24/07/2013.
Leichhardt Municipal Council Report ‘Item 19 – Glebe Island Temporary Exhibition Centre’ 8 March 2013.
Urbis, 2012. ‘Glebe Island Bridge Large Marine Operators Consultation Report’, in Bays Precinct Appendix 5.
NSW, 2012, NSW Government Department of Environment and Heritage, 2012, ‘Glebe Island Bridge Statement of Significance’ <http://www.environment.nsw.gov.au/heritageapp/ViewHeritageItemDetails.aspx?ID=5051118> Accessed 22/07/2013.
Office of Best Practice Regulation, 2008. ‘Best Practice Regulation Guidance Note – Value of Statistical Life’, November.
RMS, 2012. ‘Glebe Island Bridge – Vessel Clearance’, source documents provided by RMS.
Transport for NSW, 2012. ‘NSW Long Term Transport Master Plan’, December.
Transport for NSW, 2013. ‘Principles and Guidelines for Economic Appraisal of Transport Investments’, March.
Photo: Balmain & Glebe Heritage