options for processing shrimp landed in south carolina
TRANSCRIPT
RESEARCH REPORT REGIONAL ECONOMIC DEVELOPMENT 01-2005-02 RESEARCH LABORATORY
Options for Processing Shrimp Landed In South Carolina
by
Mark S. HenryDavid L. Barkley
Ferdinand VinuyaBrian Gantt
Regional Economic Development Research LaboratoryDepartment of Applied Economics and Statistics
Clemson Shrimp Fisheries Assistance ProjectClemson University, Clemson, South Carolina
Clemson University Public Service Activities
OPTIONS FOR PROCESSING SHRIMP LANDED IN SOUTH CAROLINA
By Mark S. Henry and David L. Barkley
Professors and Co-Coordinator Regional Economic Development Research Laboratory
And
Ferdinand Vinuya, PhD Candidate
Brian Gantt, Graduate Student
Department of Applied Economics and Statistics Clemson University
Clemson, SC
Copyright © 2005 by Mark S. Henry, David L. Barkley, Ferdinand Vinuya and Brian Gantt. All rights reserved. Readers may make verbatim copies of this document for non-commercial purposes by any means, provided that this copyright notice appears on all copies
2
ACKNOWLEDGEMENTS
Research reported in this research report was supported by a grant from the U.S. Department of Commerce (NOAA) that established the South Carolina Shrimp Fishery Assistance (SCSFA) project. The goal of the project is to increase the profitability and sustainability of the state’s shrimping industry. The SCSFA project is a joint effort involving the SC Shrimpers Association, the SC Seafood Alliance, the Southern Shrimp Alliance, individual fishermen, shrimp aquaculturists, the SC Sea Grant Consortium, Clemson University, SC Department of Natural Resources, SC Commerce Department, the NOAA Hollings Marine Laboratory, and three regional Councils of Government. The authors are especially grateful for the cooperation of dock owners and individual shrimp trawler owner/operators for sharing information on their business operations over the study period.
3
OPTIONS FOR PROCESSING SHRIMP LANDED IN SOUTH CAROLINA
Executive Summary Many participants in the South Carolina shrimp industry believe that capturing more of the value added in processing locally landed shrimp can add to the economic viability of the industry. However, processing shrimp landed in South Carolina faces substantial challenges. The Southeast shrimp processing industry is consolidating resulting in fewer firms that process shrimp in the Gulf Coast and South Atlantic regions. As Keithly, et al (2004) conclude, this consolidation is associated with declining marketing margins and profitability of existing firms. They expect that processors remaining in business over the next decade will increase plant size to maintain profitability. In this report, several options for added processing activity in SC are reviewed. Option 1. Expand shrimp processing in South Carolina with new equipment.
• At Fall 2004 ex-vessel prices for head on shrimp, for a 2 million pound (heads on) processing plant, adding hauling costs to the processing plant, dockside packing fees, and processing costs results in per pound breakeven prices(zero profit) for headed shrimp products at the plant that range from about $4.58 for 26-30s to $3.16 for 61-70s.
• Adding $1 per pound to the Fall 2004 ex-vessel prices of head on shrimp results in per pound breakeven prices at the plant ranging from $6.25 for 26-30s to $4.83 for 61-70s.
• If market prices exceed these breakeven prices, then profits from the processing plant will be available for distribution to Coop or LLC members. With a 2 million run plant and a 10% profit markup over breakeven prices, sales prices for 26-30s would be $5.03 with Fall 2004 ex-vessel prices and $6.56 for mark of quality shrimp. A 1 million run plant sales price with 10% profit markups would require sales prices of $5.56 with Fall 2004 ex-vessel prices and $7.06 for 26-30s if ex-vessel prices increased by $1 per pound.
• Initial investment range: $2 million to $3 million for land and equipment. Includes equipment to peel and devein shrimp as market conditions warrant.
Option 2. Contract with existing processors • No new local processing investment required but hauling equipment and added
freezer capacity may be warranted. • Processing costs (heading, packing and freezing) range from $.37 to $.70 cents
per pound of head on shrimp. Cost for packing and freezing only using shrimp tails ranges from $.25 to $.30 per pound.
• Transportation costs range from about $.08 to $.15 per pound of tails each way. • SC landings can be processed on a separate run and identity preserved by boxing
or bagging with SC logos with a cost of $.06 per pound for containers. • Storage cost (IQF or Blocks) would be about $.05 to $.06 per pound in the
combined receiving and delivery months. Intervening months require an additional $.01 to $.015 per pound per month charge. Assuming average storage time of 3 months, total storage costs at commercial sites in SC or elsewhere would likely be about $.10 per pound per year.
4
• Assuming $.60 processing (heading, boxing and freezing) cost per pound of heads on shrimp (or $1.00 per pounds of tail), $.10 one way transport cost, and storage cost of $.10 per pound, then the total price for processed tails would be about the same as those shown for Option 1 for the 2 million pound processing scenario.
• One benefit of the contractor option is no new processing equipment capital is needed to market SC premium shrimp.
• Drawbacks include: limited quality control by SC interests if sent to out of state processors.
Option 3. Joint Dock/ Trawler owner LLC or Coop • Form an LLC or Coop that requires 25 to 30 members to invest $20,000 each to
establish a small scale plant with freezer capacity. No external debt required but a full time manager is employed.
• Provide head on and headless shell-on product only. • Rely on used equipment. • Provide on-site freezer capacity • Personnel needs include 1 manager, 1 sales person, 1 plant manager, 1or 2
retail/office workers, 3 fulltime floor workers, 6 to 8 part time “on-demand” headers, 5 for freezing/boxing on a part time basis and 2 truck drivers.
• Operating costs are about $.20 per pound to head and $.30 per pound to freeze and box in five pound boxes. With average total costs of about $.50 per pound for heading, boxing and freezing,
• Start with about $500,000 in capital to purchase a used building, used equipment—bins, blast freezers, etc, two used trucks, and a fork lift.
• Secure a $200,000 line of credit to provide operating capital. Have profit sharing but do not pay a premium price to trawler owners/ members.
Related Issues • While no formal analysis has been attempted, individuals in contact with area
restaurants conclude there is a local market for processed clams. • With both clam and shrimp processing, more year round work options would be
available to the local labor force. This could improve the profitability of shrimp processing operations by reducing labor turnover.
• Innovations in retailing to tourists may improve the profitability of processing plants
• If state owned port facilities in Pt. Royal are redeveloped, there is an opportunity to support a move of the Pt. Royal processing activities to a location that will ensure adequate in-state processing capacity for wild caught shrimp that are landed in South Carolina.
Conclusion • There is ample opportunity to process shrimp in South Carolina facilities at rates
that are competitive with out of state processors. Sustained marketing of wild caught shrimp will be needed to provide the market niche and associated price premium for shrimp processed in South Carolina establishments.
5
I. INTRODUCTION Processing shrimp landed in South Carolina faces substantial challenges. The Southeast shrimp processing industry is consolidating resulting in fewer firms that process shrimp in the Gulf Coast and South Atlantic regions. As Keithly, et al (2004) conclude, this consolidation is associated with declining marketing margins and profitability of existing firms. They expect that processors remaining in business over the next decade will increase plant size to maintain profitability.
“The first conclusion is that the processed price for the various products will, in the long run, continue the observed downward trend and the marketing margin will continue to narrow. The continued narrowing of the marketing margin leads directly to the second conclusion: continued consolidation in the industry will continue. While the degree of consolidation is a matter of extreme speculation, there is considerable less uncertainty around the forecast that consolidation will occur. The final conclusion is that the average production per firm will continue to increase. This conclusion is linked directly to the previous two conclusions. Specifically, a narrowing of the marketing margin implies that increased output per firm will be required to maintain a desired level of profitability. Given the declining number of firms, furthermore, domestic landings will be divided among a fewer number of firms.”( Keithly, W. R., Hamady Diop, Richard F. Kazmierczak, Jr and Mike D. Travis, 2004. An Economic Analysis of the Southeast U.S. Shrimp Processing Industry Responses to an Increasing Import Base. p. 11)
Given the trend toward fewer and larger shrimp processing plants, is it reasonable to expect that new or expanded shrimp processing plants can be profitable in South Carolina? The purpose of this report is to provide some answers to that question. We proceed by examining four options for processing shrimp in South Carolina: 1. Building new plants to process from 1 to 2 million pounds of head-on wild caught shrimp landed at SC docks. Most of the total SC landings could be processed with two plants, one located near McClellanville and one near Pt. Royal. 2. Expand existing SC processing plants using some old and some new equipment but adds local freezer capacity with a focus on marketing a premium quality product. 3. Contract with out of state processors but add freezer capacity in SC to market SC landings to local outlets, or 4. Store SC preserved landings out of state with delivery to SC outlets as needed. We begin by investigating the “Cadillac” option that uses new equipment with the flexibility to process shrimp in a variety of ways. In this evaluation, we estimate the output price that the processor would need to remain profitable under two scenarios: paying shrimp trawlers ex-vessel prices that are currently set by imports or paying shrimp trawlers a premium over the market price for raw shrimp that are landed under new ‘quality’ controls – the “mark of quality” initiative. II. EXPANDING SHRIMP PROCESSING IN SOUTH CAROLINA A. Purpose The main issue addressed in this section of the report is the economic feasibility of establishing a plant to process shrimp that are currently sold to out of state processors. If economically feasible, one option for the South Carolina industry is to expand the
6
existing processing plant in Pt. Royal and/or to establish a second shrimp processing plant north of Charleston – most likely in the McClellanville area. The Pt. Royal processing plant is a candidate for upgrading -- to include added freezer capacity, perhaps peeling and deveining equipment, and other facilities as needed. Since this operation is already in place and well known to the industry, analysis of the economics of expanding this plant can be completed using the plant’s data on operating expenses and capital spending plans once they are made available to the research staff. In this section of the report, we focus on a more challenging task from a data perspective – what are the economics of establishing a new processing plant in SC? The working assumption is that all the shrimp landed in SC could be processed by the existing Pt. Royal plant and one new plant. As a rough guideline, it seems that the Pt. Royal plant would continue to serve the docks in the Beaufort area and most of those north to Charleston. The second plant would probably be in the McClellanville area (that's our initial assumption in this feasibility study) and would draw landings from Georgetown docks, McClellanville and south to Shem Creek. Most of the landings at Shem Creek and north are processed out of state currently so that a second SC plant would be a substitute for existing out of state processing activity. As we discuss in Section III of this report, another option is to contract with existing processors to process a SC branded premium shrimp. The Pt. Royal plant does this for headed shell on shrimp – packing and freezing shrimp in five pound boxes on-site. It might expand its freezer capacity and upgrade equipment to meet growth in a premium “niche” market as described below. In addition, in Section IV of this report, we describe how some small scale processors in the Southeast process and market their own shrimp – sharing “value added” earnings between members of a limited liability company (LLC). The focus of this section of the report is on the potential for a new initiative to form a LLC or Coop to establish a new processing plant in the McClellanville area. However, this should be viewed as only part of an industry effort to carve out a niche in an emerging “premium” market that can compete effectively with low cost imported products. The location of a new plant or expansion of existing processing capacity in the Pt. Royal or other areas would face many of the same startup costs and required revenues streams that are depicted in the case study presented for McClellanville. B. Description of the Project. 1. Nature of the Project We examine the potential for a new Carolina Seafood Associates (CSA) which is a group of independent agricultural producers that may organize a limited liability company (LLC) or cooperative (or alternative business organization) to produce (land) wild caught shrimp that will be owned by the CSA from the time that the shrimp are caught and processed until they are sold to the retail outlet. For the sake of illustration, let’s call this new venture, the McClellanville Mark of Quality Shrimp processing plant. It will be owned and operated by the CSA whose independent shrimp producers will catch, land, process and market wild caught domestic shrimp under an identity-preserving marketing
7
system. This value added venture should allow the member producers to compete more effectively in domestic markets currently dominated by imports as they establish a premium quality niche market with regional retail outlets and restaurants. The objective of the CSA members is to increase the value realized by producers of wild caught shrimp (shrimp trawler owners and dock owners) in the town of McClellanville, South Carolina. The processing plant and marketing plan under consideration by CSA, to be known as the McClellanville Mark of Quality, will ensure that quality control procedures are followed from catch to delivery to retail outlets. It will preserve the identity of the shrimp as its physical state changes during processing from raw, head-on shrimp to shrimp tails that may be shelled, deveined and split as market conditions warrant. Labeling of final product will document that the McClellanville Mark of Quality Shrimp conform with best management practices (BMPs) defined by a consortium of land grant universities and Sea Grant offices in eight southern states (Alabama, Florida, Georgia, Louisiana, Mississippi, North Carolina, South Carolina, Texas). The proposed processing plant will have a capacity to process 1,000,000 to 2,000,000 pounds of raw, heads-on shrimp per year. The preferred size of the plant will be determined by the CSA members and the economic feasibility of alternative scales of operations in McClellanville, SC. The plant is proposed to begin operations in 2005 at the earliest using wild caught brown shrimp in the April to July season and white shrimp from August through December. Wild caught shrimp that do not meet quality standards established for the McClellanville Mark of Quality brand or pond raised shrimp from domestic or foreign sources that are processed will be segregated from the Mark of Quality brand for wild caught shrimp. To maintain operations year round and reduce average costs of production, the processing plant may use imported or domestic farm raised shrimp products that are segregated from the wild caught shrimp to fill market demands when wild caught product is not available. Since landings of wild caught shrimp are not likely to increase even as demand for shrimp expands, it is expected that farm raised products and/or imports will need to play a role in supplying the proposed processing/freezing plant. 2. General setting of the Project Location The processing plant under consideration by CSA will be located near the site of the existing Carolina Seafoods, Inc. dock in McClellanville, South Carolina to ensure that quality control procedures are followed from catch to delivery to retail outlets and to reduce transportation costs. It is likely the plant will locate near Highway 17 proximate to the McClellanville exit to capture local and tourist traffic along this busy artery connecting Myrtle Beach and Charleston. McClellanville is north of Charleston, S.C., and lies just off State Highway 17 which runs parallel to the Atlantic coast. Immediately to the North of McClellanville are major tourist and retirement destinations – with Myrtle Beach the dominant center of activity. Georgetown, SC lies between McClellanville and Myrtle Beach along Highway 17. It has several docks that service shrimpers and that have small retail outlets.
8
3. Proposed ownership, structure and management The CSA will be administered by an executive committee selected by the 33 independent producers. The steering committee will collaborate and contract with third party experts to evaluate the economic feasibility of alternative CSA value added ventures, to develop a detailed business plan for the most profitable alternative and to determine the preferred form of business organization. Initially, the CSA will be established as a limited liability company (LLC), subject to review by the steering committee of the CSA and individual members. The LLC is a hybrid entity that has the limited liability feature of corporations and avoids double taxation (on corporate income and on distributed dividends). However, it may require a 15.3% self employment tax on individual members that are active shrimpers. One alternative to be evaluated by the steering committee is a cooperative that will include producers of raw product and will market the branded product. A cooperative is well suited to respond to a Federal buyout program that may limit future entry into the fishery by capturing and sharing quota among coop members (see NMFS, 2004). However, limits placed on shrimping in Federal waters by future NMFS regulations may not have a large harvest impact on CSA area trawlers since much of their catch is made in state waters. 4. Markets to be served and existing suppliers McClellanville is well situated geographically to serve rapidly growing retail and restaurant establishments along the South Carolina coastal region and in bordering markets in North Carolina. CSA members have established good will with area restaurants for decades and have a solid retail customer base stretching from Charleston, SC to Myrtle Beach, SC. This geographic area has seen dramatic growth in resident population, household income and tourism over the past decade and is expected to expand at a steady rate given national demographic trends and the preference retirees and tourists have for warm weather climates. To serve this expanding market with shrimp landed in South Carolina throughout the year will require added freezer capacity as well as a proposed processing plant. SC Coastal Area Restaurants. National chain restaurants and large tourist oriented restaurants that serve buffets and emphasize low prices are supplied by national food service chains – PYA, SYSCO, etc and are not the target market for the CSA quality products. These retail outlets are very likely to continue their use of imported frozen products. However, some restaurants in the Berkeley-Charleston-Dorchester (BCD) multi-county region and north to Myrtle Beach and Murrell’s inlet have indicated a strong preference for wild caught shrimp because of taste and texture advantages over imports. A sample list that indicated a preference in a survey for a brand of “quality wild caught” shrimp is provided in Table 1. One of these restaurants currently purchases Fall white shrimp from Carolina Seafoods. The restaurant freezes the purchase on site for use throughout the year. If the CSA could contract with the equivalent of 15 to 20 similar restaurants in the region, the entire annual output of the proposed CSA processing plant would be absorbed by these restaurants alone.
9
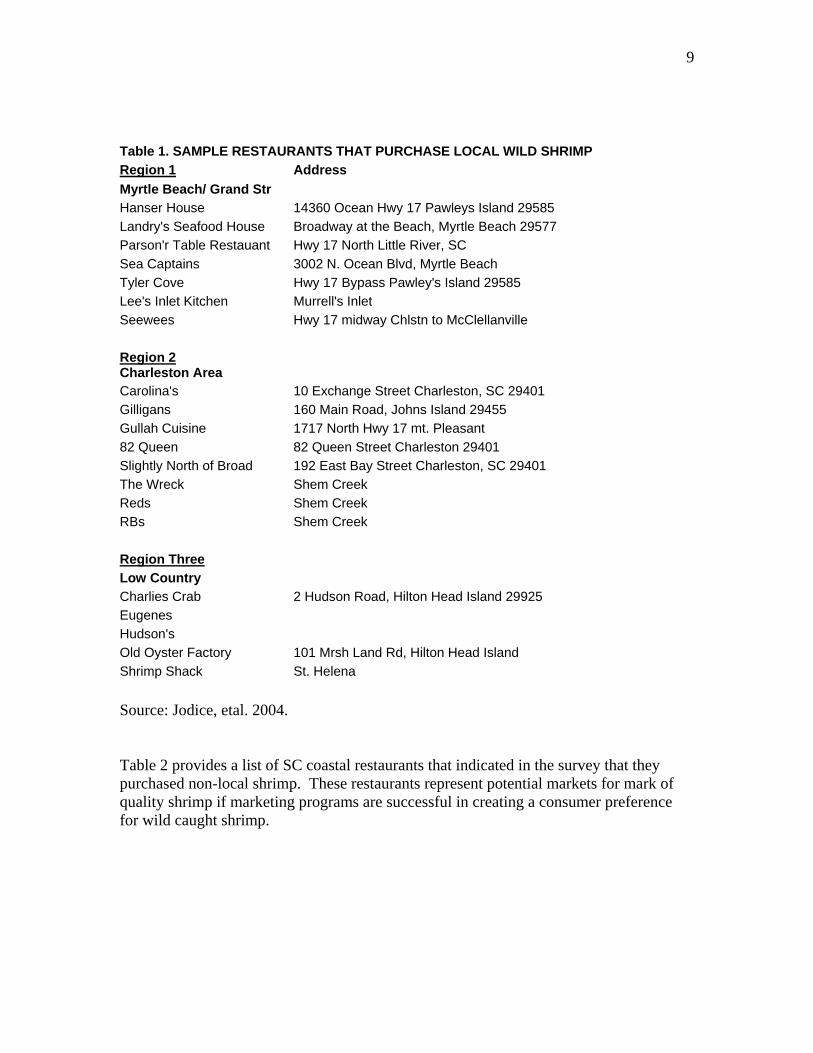
Source: Jodice, etal. 2004. Table 2 provides a list of SC coastal restaurants that indicated in the survey that they purchased non-local shrimp. These restaurants represent potential markets for mark of quality shrimp if marketing programs are successful in creating a consumer preference for wild caught shrimp.
Table 1. SAMPLE RESTAURANTS THAT PURCHASE LOCAL WILD SHRIMP Region 1 Address Myrtle Beach/ Grand Str Hanser House 14360 Ocean Hwy 17 Pawleys Island 29585 Landry's Seafood House Broadway at the Beach, Myrtle Beach 29577 Parson'r Table Restauant Hwy 17 North Little River, SC Sea Captains 3002 N. Ocean Blvd, Myrtle Beach Tyler Cove Hwy 17 Bypass Pawley's Island 29585 Lee's Inlet Kitchen Murrell's Inlet Seewees Hwy 17 midway Chlstn to McClellanville Region 2 Charleston Area Carolina's 10 Exchange Street Charleston, SC 29401 Gilligans 160 Main Road, Johns Island 29455 Gullah Cuisine 1717 North Hwy 17 mt. Pleasant 82 Queen 82 Queen Street Charleston 29401 Slightly North of Broad 192 East Bay Street Charleston, SC 29401 The Wreck Shem Creek Reds Shem Creek RBs Shem Creek
Region Three Low Country Charlies Crab 2 Hudson Road, Hilton Head Island 29925 Eugenes Hudson's Old Oyster Factory 101 Mrsh Land Rd, Hilton Head Island Shrimp Shack St. Helena
10
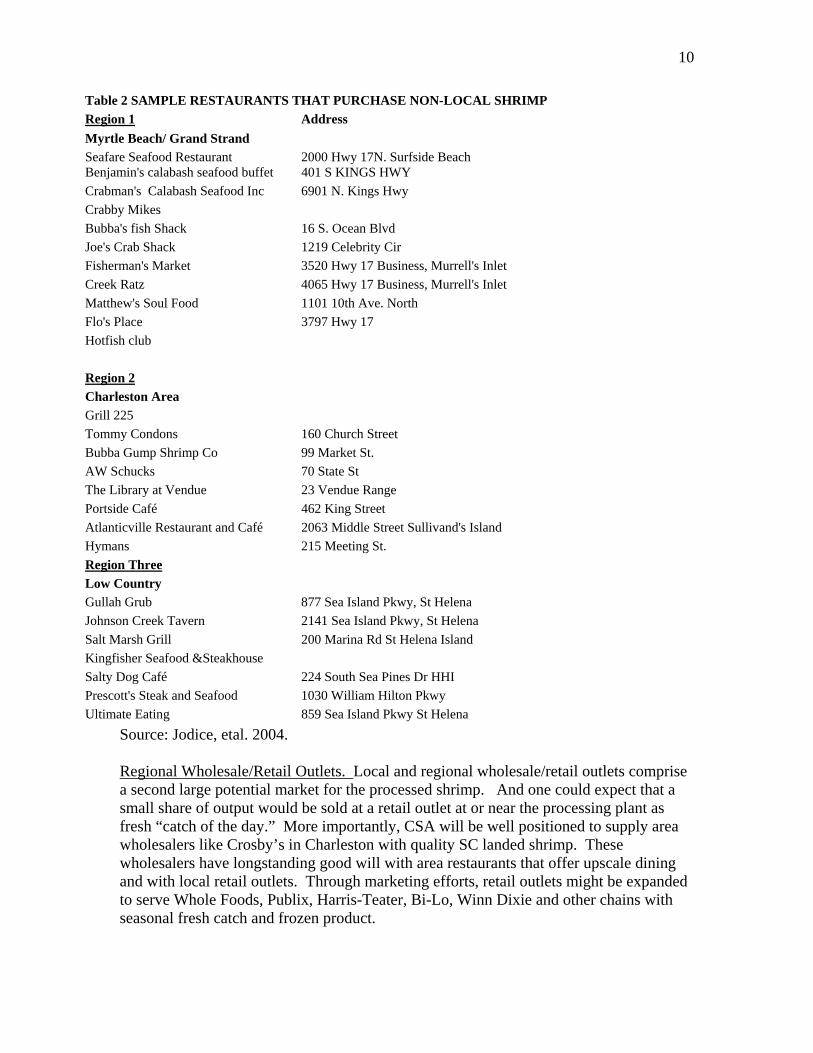
Source: Jodice, etal. 2004. Regional Wholesale/Retail Outlets. Local and regional wholesale/retail outlets comprise a second large potential market for the processed shrimp. And one could expect that a small share of output would be sold at a retail outlet at or near the processing plant as fresh “catch of the day.” More importantly, CSA will be well positioned to supply area wholesalers like Crosby’s in Charleston with quality SC landed shrimp. These wholesalers have longstanding good will with area restaurants that offer upscale dining and with local retail outlets. Through marketing efforts, retail outlets might be expanded to serve Whole Foods, Publix, Harris-Teater, Bi-Lo, Winn Dixie and other chains with seasonal fresh catch and frozen product.
Table 2 SAMPLE RESTAURANTS THAT PURCHASE NON-LOCAL SHRIMP Region 1 Address Myrtle Beach/ Grand Strand Seafare Seafood Restaurant 2000 Hwy 17N. Surfside Beach Benjamin's calabash seafood buffet 401 S KINGS HWY Crabman's Calabash Seafood Inc 6901 N. Kings Hwy Crabby Mikes Bubba's fish Shack 16 S. Ocean Blvd Joe's Crab Shack 1219 Celebrity Cir Fisherman's Market 3520 Hwy 17 Business, Murrell's Inlet Creek Ratz 4065 Hwy 17 Business, Murrell's Inlet Matthew's Soul Food 1101 10th Ave. North Flo's Place 3797 Hwy 17 Hotfish club
Region 2 Charleston Area Grill 225 Tommy Condons 160 Church Street Bubba Gump Shrimp Co 99 Market St. AW Schucks 70 State St The Library at Vendue 23 Vendue Range Portside Café 462 King Street Atlanticville Restaurant and Café 2063 Middle Street Sullivand's Island Hymans 215 Meeting St. Region Three Low Country Gullah Grub 877 Sea Island Pkwy, St Helena Johnson Creek Tavern 2141 Sea Island Pkwy, St Helena Salt Marsh Grill 200 Marina Rd St Helena Island Kingfisher Seafood &Steakhouse Salty Dog Café 224 South Sea Pines Dr HHI Prescott's Steak and Seafood 1030 William Hilton Pkwy Ultimate Eating 859 Sea Island Pkwy St Helena
11
Existing suppliers. Existing suppliers of shrimp are distributed along the coast from North Carolina to New Orleans. Some processors/wholesalers provide a branded wild caught product to the South Carolina coastal market but many offer undifferentiated wild caught shrimp and/or frozen-thawed imported shrimp. These processors provide alternative capacity for processing shrimp caught by CSA members. 5. Products to be produced by CSA and Existing Suppliers. Given the need to meet changing customer needs, the CSA will be equipped to produce headless shell-on shrimp (HSOS), peeled shrimp (PS), and peeled and deveined shrimp (PDS). Breaded products use imports extensively and other regional processors would continue to purchase raw shrimp from the CSA that do not meet quality standards for Mark of Quality HSOS, PS or PDS. Other shrimp products would require packaging other than the five pound boxes or 25 pound bags of frozen wild caught shrimp. These might include flavored or non-flavored peeled and deveined products in plastic pouch containers. It is not intended that the CSA processing plant will produce these products initially, but specialty processors might be a fourth market for CSA landings of wild caught shrimp. Headless Shell-On Shrimp (HSOS): Existing suppliers. According to a recent report by the NMFS (2004), the South Atlantic region (NC, SC, GA and east coast of Florida) has between 10 and 15 plants providing HSOS. In recent years, the average per firm (plant) production of HSOS has been about 1 million pounds per year. Imports are widely available from local seafood dealers and national food distributors. These are mostly farm raised shrimp. Firms in six countries that provide about 75% of the imports have been found to be dumping shrimp on the U.S. market and will be subject to import duties that vary across countries. Peeled Shrimp (PS) Or Peeled And Deveined Shrimp (PDS): Existing suppliers. Local landings that are processed by CSA may be shifted from HSOS to peeled or peeled and deveined forms as market conditions warrant. Declining marketing margins for domestically peeled shrimp products reflect the effects of competition from farm raised imports of peeled products (NMFS, 2004). Domestic processors have responded to lower unit profits on peeled product by increasing output levels to an average of about 2 million pounds per year per plant. The number of South Atlantic suppliers of peeled product has averaged 8 firms in recent years (NMFS, 2004). Imports of PS and PDS are widely available from local seafood dealers and national food distributors. Breaded products . CSA will not produce and market breaded products since they utilize lower size and lower quality landings or farm raised imports for the breaded market. Imported products will dominate this market. Other shrimp products . CSA will not initially produce specialty shrimp products – flavored cooked products, for example, or fresh/frozen pouches of peeled shrimp products. However, small scale production runs of these products may be possible by contracting with specialty processors of local quality landings to enable CSA to test
12
markets for these new products. In addition, head on shrimp sales are expected to remain attractive to some buyers and may increase in volume. 6. Supplies and Competitive Users. The expected members of the CSA own/operate commercial shrimp trawlers generally greater than 50 feet in length. They catch shrimp both off the coast of the Carolinas and in nearby states as market prices and harvest conditions merit. They land their catch in McClellanville, SC using dock space for a small fee at Carolina Seafoods, Inc. Total landings (heads-off pounds and ex-vessel dollars) in the immediate region – Berkekley- Charleston-Dorchester (BCD) counties in 2002 were 1,589,000 pounds heads-off (2.6 million pounds head on) which had a dockside value of $4.4 million. Major docks where these landings were made include Carolina Seafood and Livingston-Bulls Bay in McClellanville, and the Wando and Magwood docks in Shem Creek. North of McClellanville, the Georgetown docks had landings of about 612,000 pounds heads off (1.02 million pounds heads on). South of the BCD region, docks in Colleton County had 126,600 pounds heads off (.21 million pounds heads on) of landings and the Beaufort-Jasper area docks saw landings of about 1.02 million pounds heads off (1.7 million pounds heads on). Trawlers using the Beaufort area docks are unlikely to supply CSA with raw product because of historical ties to their region and potential expansion of processing in the Pt. Royal area. In total there were about 3.347 million pounds of heads off shrimp landed in South Carolina. This is equivalent to 5.578 million pounds of heads on shrimp. Processing two million pounds of heads on shrimp would require about 36% of the total SC landings. The BCD total catch of 2.6 million pounds heads on seems adequate but the share of landings that are of sufficient size for the premium quality run might not be large enough to supply all the plant needs. C. Market Potential, Markets served (current and future) Given the need to meet changing customer needs, the CSA will be equipped to produce headless shell-on shrimp (HSOS), peeled shrimp (PS), and peeled and deveined shrimp (PDS). Breaded products use imports extensively and other regional processors would continue to purchase raw shrimp from the CSA that do not meet quality standards for Mark of Quality HSOS, PS or PDS. Other shrimp products would require packaging other than the five pound boxes of frozen wild caught shrimp. These might include flavored or non-flavored peeled and deveined products in plastic pouch containers. It is not intended that the CSA processing plant will produce these products initially, but specialty processors might be a fourth market for CSA landings of wild caught shrimp. 1. Form and quality of product, markets served and channels used Twenty-five pound bags and Five pound boxes of Headless Shell-On Shrimp (HSOS) that are Individually Quick Frozen (IQF) for ease of use by restaurants will comprise about half of the production at the CSA facility. They will be marketed as Wild Caught American shrimp using existing contracts with current restaurants and through new
13
contracts with area restaurants and retail outlets. Supply will be made available from on-site storage on a year round basis. Peeled Shrimp (PS) Or Peeled and Deveined Shrimp (PDS) are expected to account for about 25% of the production in the first year of production. They also will be packaged in five pound boxes of IQF shrimp. About 10% of the PS and PDS shrimp may be flavored and packaged in pouches for delivery to restaurants, retail outlets and perhaps e-commerce outlets. The remaining 25% of the production of the CSA will be smaller and lower quality shrimp that will be packed in ice as head-on shrimp. Using current distribution channels, some of these shrimp will be sold to jobbers who pick up vats of iced shrimp for delivery to out of state processors. Some will be frozen and stored at CSA facilities to meet local demand for head on product. Four markets will be served. 1. Direct sales to restaurants in the counties that comprise the SC coast and in proximate areas in NC (Calabash region). 2. Sales to wholesalers in the Charleston, SC area – Crosbys, etc. 3. Direct sales to area seafood retailers and grocery stores. 4. CSA retail store and perhaps web site sales directly to the consumer. 2. Projected total demand in markets to be served. A niche market (about 10% of all shrimp sales) for premium wild caught shrimp is being developed through efforts of the Southern Shrimp Alliance (SSA) to raise consumer awareness of taste and texture attributes of wild caught domestic shrimp. The $3.6 million advertising campaign initiated in October, 2004 by the SSA is, in effect, an attempt to shift the demand curve for domestic wild caught shrimp up from its current position --- thus driving up consumer prices for these shrimp, at least in the short run. To the extent that the higher consumer prices filter down to the shrimp trawler owners, there will be an attempt to increase the harvest of premium quality wild shrimp in the South Atlantic and Gulf fisheries. However, given the relatively stable catch over the past two decades, it is likely that most emphasis will be placed on landing and preserving shrimp in ways that enhance the share of shrimp landings that meet mark of quality standards. Meeting these standards as well as existing federal and state regulations on handling as well as ongoing requirements for BRDs and TEDs will mean many shrimp trawler operators are likely to exit the industry even with higher ex-vessel prices for their catch. One recent analysis (Federal Reserve Bank of Dallas, 2004) concludes that shrimp trawling will become organized as a corporate venture with multiple trawlers sharing risks and profits. The “yeoman” trawler owner/operator is likely to be the exception rather than the rule as it is now. The recent National Marine Fisheries Service –NMFS (2004) report provides a summary of the supplies and use of domestic landings and imports. This is displayed in Figure 1.
14
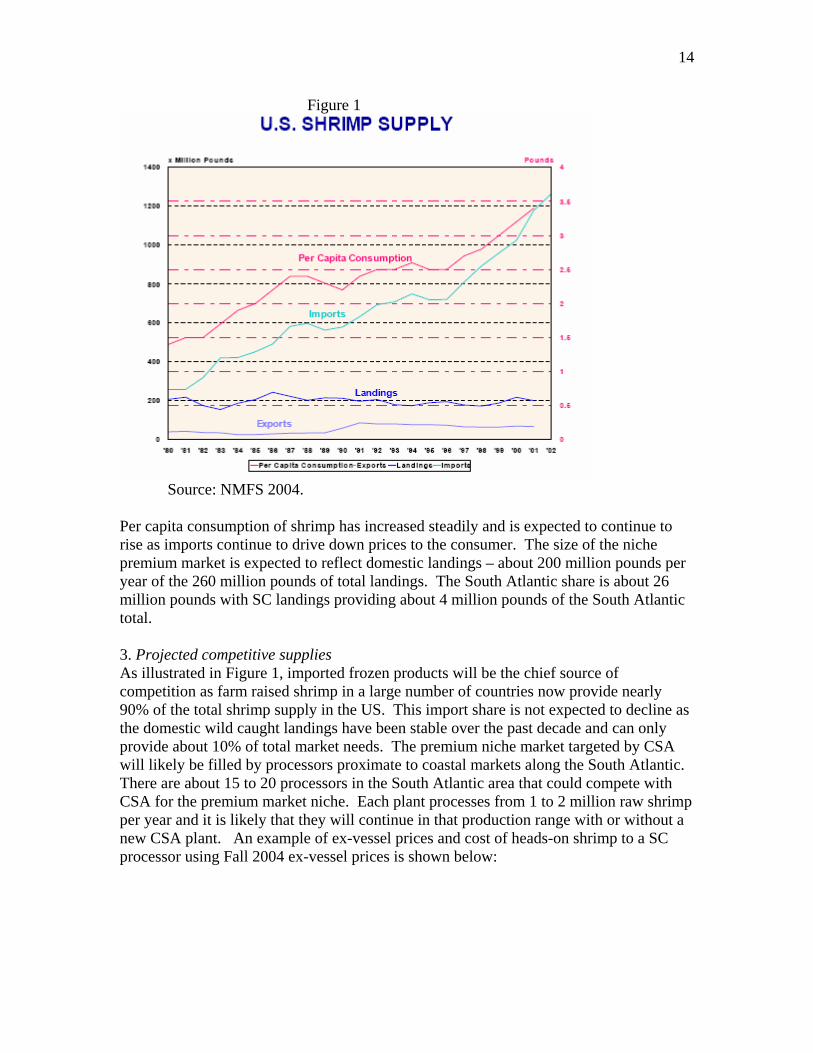
Figure 1
Source: NMFS 2004. Per capita consumption of shrimp has increased steadily and is expected to continue to rise as imports continue to drive down prices to the consumer. The size of the niche premium market is expected to reflect domestic landings – about 200 million pounds per year of the 260 million pounds of total landings. The South Atlantic share is about 26 million pounds with SC landings providing about 4 million pounds of the South Atlantic total. 3. Projected competitive supplies As illustrated in Figure 1, imported frozen products will be the chief source of competition as farm raised shrimp in a large number of countries now provide nearly 90% of the total shrimp supply in the US. This import share is not expected to decline as the domestic wild caught landings have been stable over the past decade and can only provide about 10% of total market needs. The premium niche market targeted by CSA will likely be filled by processors proximate to coastal markets along the South Atlantic. There are about 15 to 20 processors in the South Atlantic area that could compete with CSA for the premium market niche. Each plant processes from 1 to 2 million raw shrimp per year and it is likely that they will continue in that production range with or without a new CSA plant. An example of ex-vessel prices and cost of heads-on shrimp to a SC processor using Fall 2004 ex-vessel prices is shown below:
15
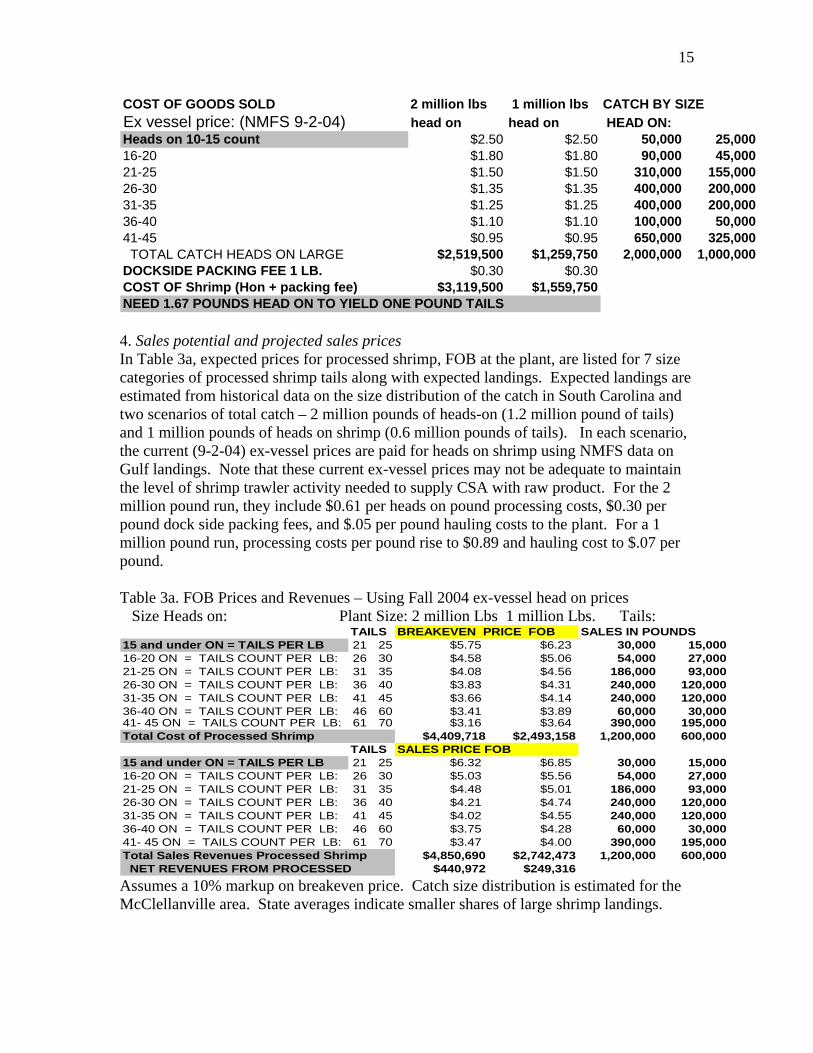
COST OF GOODS SOLD 2 million lbs 1 million lbs CATCH BY SIZEEx vessel price: (NMFS 9-2-04) head on head on HEAD ON:Heads on 10-15 count $2.50 $2.50 50,000 25,00016-20 $1.80 $1.80 90,000 45,00021-25 $1.50 $1.50 310,000 155,00026-30 $1.35 $1.35 400,000 200,00031-35 $1.25 $1.25 400,000 200,00036-40 $1.10 $1.10 100,000 50,00041-45 $0.95 $0.95 650,000 325,000 TOTAL CATCH HEADS ON LARGE $2,519,500 $1,259,750 2,000,000 1,000,000DOCKSIDE PACKING FEE 1 LB. $0.30 $0.30COST OF Shrimp (Hon + packing fee) $3,119,500 $1,559,750NEED 1.67 POUNDS HEAD ON TO YIELD ONE POUND TAILS 4. Sales potential and projected sales prices In Table 3a, expected prices for processed shrimp, FOB at the plant, are listed for 7 size categories of processed shrimp tails along with expected landings. Expected landings are estimated from historical data on the size distribution of the catch in South Carolina and two scenarios of total catch – 2 million pounds of heads-on (1.2 million pound of tails) and 1 million pounds of heads on shrimp (0.6 million pounds of tails). In each scenario, the current (9-2-04) ex-vessel prices are paid for heads on shrimp using NMFS data on Gulf landings. Note that these current ex-vessel prices may not be adequate to maintain the level of shrimp trawler activity needed to supply CSA with raw product. For the 2 million pound run, they include $0.61 per heads on pound processing costs, $0.30 per pound dock side packing fees, and $.05 per pound hauling costs to the plant. For a 1 million pound run, processing costs per pound rise to $0.89 and hauling cost to $.07 per pound. Table 3a. FOB Prices and Revenues – Using Fall 2004 ex-vessel head on prices Size Heads on: Plant Size: 2 million Lbs 1 million Lbs. Tails: TAILS BREAKEVEN PRICE FOB SALES IN POUNDS15 and under ON = TAILS PER LB 21 25 $5.75 $6.23 30,000 15,00016-20 ON = TAILS COUNT PER LB: 26 30 $4.58 $5.06 54,000 27,00021-25 ON = TAILS COUNT PER LB: 31 35 $4.08 $4.56 186,000 93,00026-30 ON = TAILS COUNT PER LB: 36 40 $3.83 $4.31 240,000 120,00031-35 ON = TAILS COUNT PER LB: 41 45 $3.66 $4.14 240,000 120,00036-40 ON = TAILS COUNT PER LB: 46 60 $3.41 $3.89 60,000 30,00041- 45 ON = TAILS COUNT PER LB: 61 70 $3.16 $3.64 390,000 195,000Total Cost of Processed Shrimp $4,409,718 $2,493,158 1,200,000 600,000
TAILS SALES PRICE FOB15 and under ON = TAILS PER LB 21 25 $6.32 $6.85 30,000 15,00016-20 ON = TAILS COUNT PER LB: 26 30 $5.03 $5.56 54,000 27,00021-25 ON = TAILS COUNT PER LB: 31 35 $4.48 $5.01 186,000 93,00026-30 ON = TAILS COUNT PER LB: 36 40 $4.21 $4.74 240,000 120,00031-35 ON = TAILS COUNT PER LB: 41 45 $4.02 $4.55 240,000 120,00036-40 ON = TAILS COUNT PER LB: 46 60 $3.75 $4.28 60,000 30,00041- 45 ON = TAILS COUNT PER LB: 61 70 $3.47 $4.00 390,000 195,000Total Sales Revenues Processed Shrimp $4,850,690 $2,742,473 1,200,000 600,000 NET REVENUES FROM PROCESSED $440,972 $249,316Assumes a 10% markup on breakeven price. Catch size distribution is estimated for the McClellanville area. State averages indicate smaller shares of large shrimp landings.
16
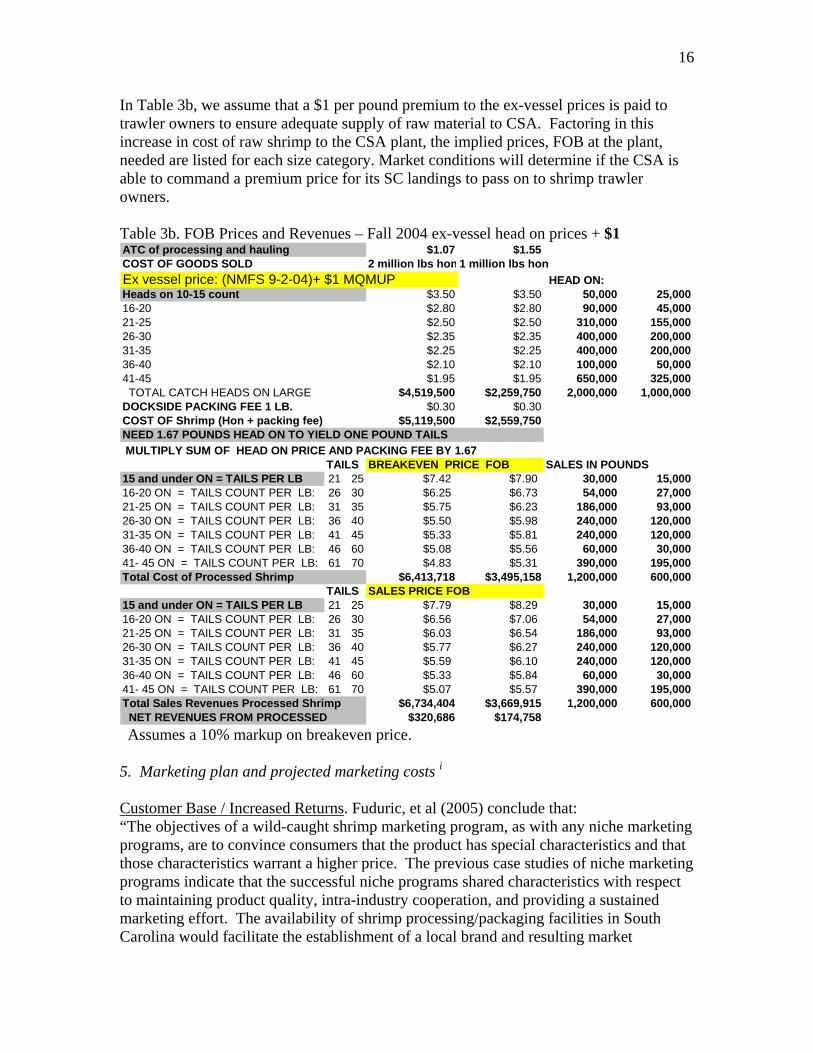
In Table 3b, we assume that a $1 per pound premium to the ex-vessel prices is paid to trawler owners to ensure adequate supply of raw material to CSA. Factoring in this increase in cost of raw shrimp to the CSA plant, the implied prices, FOB at the plant, needed are listed for each size category. Market conditions will determine if the CSA is able to command a premium price for its SC landings to pass on to shrimp trawler owners. Table 3b. FOB Prices and Revenues – Fall 2004 ex-vessel head on prices + $1 ATC of processing and hauling $1.07 $1.55COST OF GOODS SOLD 2 million lbs hon 1 million lbs honEx vessel price: (NMFS 9-2-04)+ $1 MQMUP HEAD ON:Heads on 10-15 count $3.50 $3.50 50,000 25,00016-20 $2.80 $2.80 90,000 45,00021-25 $2.50 $2.50 310,000 155,00026-30 $2.35 $2.35 400,000 200,00031-35 $2.25 $2.25 400,000 200,00036-40 $2.10 $2.10 100,000 50,00041-45 $1.95 $1.95 650,000 325,000 TOTAL CATCH HEADS ON LARGE $4,519,500 $2,259,750 2,000,000 1,000,000DOCKSIDE PACKING FEE 1 LB. $0.30 $0.30COST OF Shrimp (Hon + packing fee) $5,119,500 $2,559,750NEED 1.67 POUNDS HEAD ON TO YIELD ONE POUND TAILS MULTIPLY SUM OF HEAD ON PRICE AND PACKING FEE BY 1.67 TAILS BREAKEVEN PRICE FOB SALES IN POUNDS15 and under ON = TAILS PER LB 21 25 $7.42 $7.90 30,000 15,00016-20 ON = TAILS COUNT PER LB: 26 30 $6.25 $6.73 54,000 27,00021-25 ON = TAILS COUNT PER LB: 31 35 $5.75 $6.23 186,000 93,00026-30 ON = TAILS COUNT PER LB: 36 40 $5.50 $5.98 240,000 120,00031-35 ON = TAILS COUNT PER LB: 41 45 $5.33 $5.81 240,000 120,00036-40 ON = TAILS COUNT PER LB: 46 60 $5.08 $5.56 60,000 30,00041- 45 ON = TAILS COUNT PER LB: 61 70 $4.83 $5.31 390,000 195,000Total Cost of Processed Shrimp $6,413,718 $3,495,158 1,200,000 600,000
TAILS SALES PRICE FOB15 and under ON = TAILS PER LB 21 25 $7.79 $8.29 30,000 15,00016-20 ON = TAILS COUNT PER LB: 26 30 $6.56 $7.06 54,000 27,00021-25 ON = TAILS COUNT PER LB: 31 35 $6.03 $6.54 186,000 93,00026-30 ON = TAILS COUNT PER LB: 36 40 $5.77 $6.27 240,000 120,00031-35 ON = TAILS COUNT PER LB: 41 45 $5.59 $6.10 240,000 120,00036-40 ON = TAILS COUNT PER LB: 46 60 $5.33 $5.84 60,000 30,00041- 45 ON = TAILS COUNT PER LB: 61 70 $5.07 $5.57 390,000 195,000Total Sales Revenues Processed Shrimp $6,734,404 $3,669,915 1,200,000 600,000 NET REVENUES FROM PROCESSED $320,686 $174,758 Assumes a 10% markup on breakeven price. 5. Marketing plan and projected marketing costs i Customer Base / Increased Returns. Fuduric, et al (2005) conclude that: “The objectives of a wild-caught shrimp marketing program, as with any niche marketing programs, are to convince consumers that the product has special characteristics and that those characteristics warrant a higher price. The previous case studies of niche marketing programs indicate that the successful niche programs shared characteristics with respect to maintaining product quality, intra-industry cooperation, and providing a sustained marketing effort. The availability of shrimp processing/packaging facilities in South Carolina would facilitate the establishment of a local brand and resulting market
17
program. A niche marketing program offers much promise for increasing the demand for and value of wild caught South Carolina shrimp. To provide the greatest benefits to the state’s trawlers and dock owners, the program should promote product quality through a sustained marketing campaign financed and administered by the industry.” The McClellanville MOQ processing plant will follow this general strategy as it starts up in Spring 2005. “State marketing specialists from Louisiana to North Carolina are in the early stages of developing a regional campaign designed to distinguish domestic, wild-caught shrimp from imported, farmed shrimp in the marketplace. “The goal is to implement in one to two years a quality-assurance program for domestic shrimp certifying the product is harvested, processed, distributed and sold under a third-party inspection process,” says Ewell Smith, executive director of the Louisiana Seafood Promotion and Marketing Board. The conclusion is that no matter what kind of shrimp (farmed or wild caught) the U.S. shrimp industry is going to brand, effort should always be focused on differentiation to get prices of domestic shrimp up. Peng (2004, p. 6). In sum, the goal of a McClellanville mark of quality program is “To support the marketing efforts which seek to distinguish U.S wild-harvested shrimp from pond-raised imports. The goals of the marketing program targeting niches are:
• Create a premium shrimp product from the South Atlantic fisheries; • Carve a niche out of the billion pound American shrimp market; • Supply it with relatively high-priced product.” Peng (2004, p. 6).
McClellanville MOQ shrimp will concentrate on harvesting sizes that are favored by local restaurants and retail outlets. Using the good will built by Carolina Seafoods, Inc. over the past several decades with area restaurants and retail outlets, contracts will be sought to deliver shrimp products in the form and time needed. As noted above, products destined for the premium niche market could be Head off Shell on Shrimp (HSOS) – fresh or frozen depending on the time of year; Peeled or Peeled and Deveined tails – fresh or frozen. Heads on shrimp and shrimp of lesser quality or size than CSA MOQ shrimp will be sold to jobbers for distribution to other processors. Promotion Tactics. Peng (2004) identified promotional efforts that may be useful for developing a niche market for South Carolina wild caught shrimp. These efforts include:
• The use of Slogans— "Proud to Serve South Carolina Shrimp”. The South Carolina Seafood Alliance has a shrimp promotion and marketing effort underway. For example, stickers for restaurateurs are placed in their front doors and windows indicating that they are serving Wild American Shrimp. The CSA can make use of this program at no cost.
• Putting logos on menus and other places -- Florida promoted its shrimp using a “Fresh from
Florida” logo at many of the state’s supermarket chains, including Kroger, Winn-Dixie, Publix, and Kash N’ Karry. This would be of little cost to CSA other than the effort to partner with these retail outlets and restaurants.
18
• The use of special UPS containers—partnering with the United Parcel Service, the Louisiana seafood promotion board introduced the Louisiana Seafood Box, a cardboard UPS container featuring colorful, bold images of Louisiana seafood. The boxes can be loaded with up to 40 pounds of seafood for delivery to customers. Again, CSA might draw on the SC Seafood Alliance in this effort.
• In January 2001, The Catfish Institute (TCI) introduced its "U.S. Farm-Raised Catfish" seal to
make it easier for retailers and foodservice operators - as well as consumers - to distinguish domestic product from imported basa and tra. TCI also began targeting basa and tra in its advertising with a trade ad titled "Never trust a catfish with a foreign accent." A similar program could be accomplished using the boxing material designed for CSA products with little added packaging cost.
• “None of our shrimp are imported”— http://www.louisianashrimpdirect.com/,
LouisianaShrimpDirect.com is proud to sell fresh, frozen, Louisiana Gulf Shrimp at the VERY BEST PRICE and shipped directly to your home or office! Again, a web site would be inexpensive to use with examples like Russos Seafood in Savannah to emulate how to direct market CSA shrimp. The e-commerce imitative at the Southern Rural Development Center could be helpful in implementing web based sales strategies. http://srdc.msstate.edu/ecommerce/
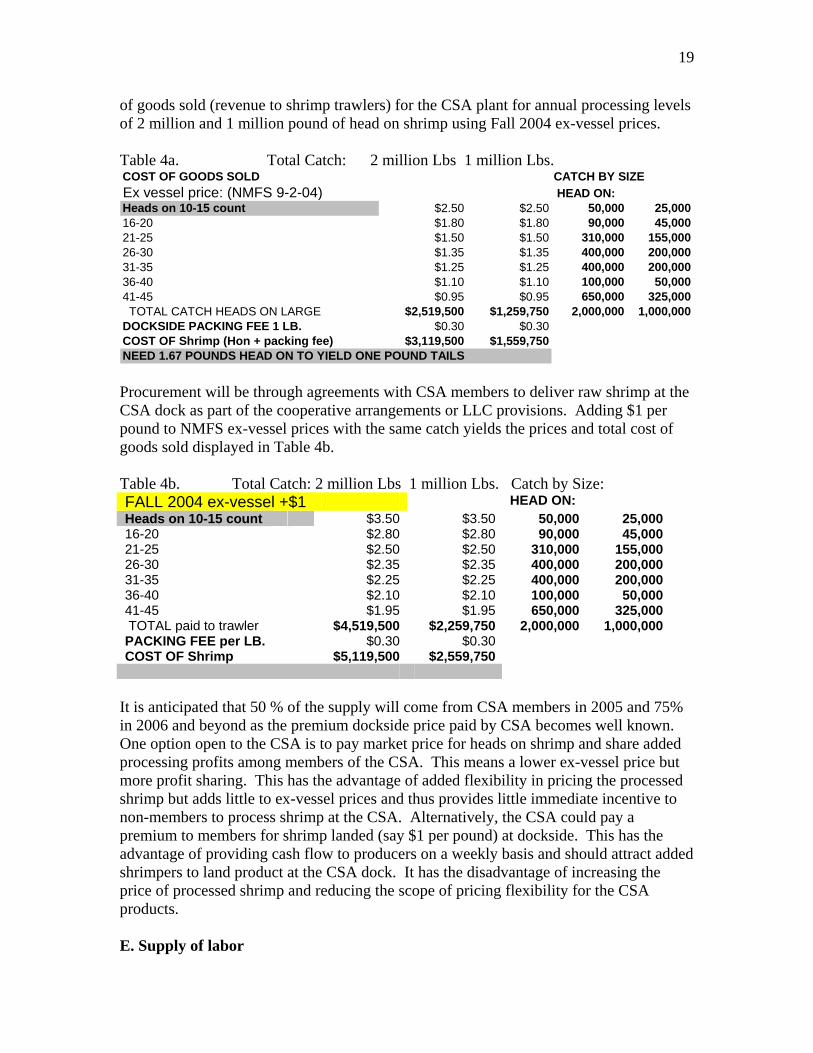
Marketing will build on the efforts of the Southern Shrimp Alliance (SSA) that began in October 2004 to differentiate Wild American Shrimp from imports. With a $3.6 million budget and an Atlanta based marketing firm in place, the CSA will be able to free ride on this campaign. Similarly, CSA can free ride on the efforts of the SC Seafood Alliance to promote SC wild caught shrimp. Accordingly, CSA will incur minimal expenses in added advertising costs. D. Raw material Supply Potential/Procurement Plan 1. Form and Quality of materials required and potential supply sources. For the CSA plant to process 2 million pounds of head on shrimp per year a supply of about 3 million pounds of landings will be required as we assume that only two-thirds of the total landings will be of sufficient size and quality to warrant processing as Mark of Quality shrimp. The remaining one million pounds of shrimp would be sold to jobbers using existing dock operations. Approximately 30 shrimp producers regularly dock at CSA. If these trawlers alone landed an average of 50,000 pounds of heads-on shrimp per year, they could supply only 50% of needed raw product. Accordingly, added landings of about 1.5 million pounds of heads on shrimp will need to be shipped to CSA from the Charleston and Georgetown area docks to allow for operations in of the CSA processing plant at the 2 million pound rate. Docks in the Beaufort area are likely to continue to supply the Port Royal processing plant. Together, the proposed CSA facility and the current Port Royal facility could process the entire landings at all SC docks. 2. Expected Prices and cost of raw shrimp In 2005, each 1 million pounds of heads on landings of premium size would be converted into 600,000 pounds of HSOS, peeled or peeled and deveined products to be delivered as fresh product or frozen and stored for delivery as needed. In Table 4a, we show the cost
19
of goods sold (revenue to shrimp trawlers) for the CSA plant for annual processing levels of 2 million and 1 million pound of head on shrimp using Fall 2004 ex-vessel prices. Table 4a. Total Catch: 2 million Lbs 1 million Lbs. COST OF GOODS SOLD CATCH BY SIZEEx vessel price: (NMFS 9-2-04) HEAD ON:Heads on 10-15 count $2.50 $2.50 50,000 25,00016-20 $1.80 $1.80 90,000 45,00021-25 $1.50 $1.50 310,000 155,00026-30 $1.35 $1.35 400,000 200,00031-35 $1.25 $1.25 400,000 200,00036-40 $1.10 $1.10 100,000 50,00041-45 $0.95 $0.95 650,000 325,000 TOTAL CATCH HEADS ON LARGE $2,519,500 $1,259,750 2,000,000 1,000,000DOCKSIDE PACKING FEE 1 LB. $0.30 $0.30COST OF Shrimp (Hon + packing fee) $3,119,500 $1,559,750NEED 1.67 POUNDS HEAD ON TO YIELD ONE POUND TAILS Procurement will be through agreements with CSA members to deliver raw shrimp at the CSA dock as part of the cooperative arrangements or LLC provisions. Adding $1 per pound to NMFS ex-vessel prices with the same catch yields the prices and total cost of goods sold displayed in Table 4b. Table 4b. Total Catch: 2 million Lbs 1 million Lbs. Catch by Size: FALL 2004 ex-vessel +$1 HEAD ON: Heads on 10-15 count $3.50 $3.50 50,000 25,00016-20 $2.80 $2.80 90,000 45,00021-25 $2.50 $2.50 310,000 155,00026-30 $2.35 $2.35 400,000 200,00031-35 $2.25 $2.25 400,000 200,00036-40 $2.10 $2.10 100,000 50,00041-45 $1.95 $1.95 650,000 325,000 TOTAL paid to trawler $4,519,500 $2,259,750 2,000,000 1,000,000PACKING FEE per LB. $0.30 $0.30 COST OF Shrimp $5,119,500 $2,559,750
It is anticipated that 50 % of the supply will come from CSA members in 2005 and 75% in 2006 and beyond as the premium dockside price paid by CSA becomes well known. One option open to the CSA is to pay market price for heads on shrimp and share added processing profits among members of the CSA. This means a lower ex-vessel price but more profit sharing. This has the advantage of added flexibility in pricing the processed shrimp but adds little to ex-vessel prices and thus provides little immediate incentive to non-members to process shrimp at the CSA. Alternatively, the CSA could pay a premium to members for shrimp landed (say $1 per pound) at dockside. This has the advantage of providing cash flow to producers on a weekly basis and should attract added shrimpers to land product at the CSA dock. It has the disadvantage of increasing the price of processed shrimp and reducing the scope of pricing flexibility for the CSA products. E. Supply of labor
20
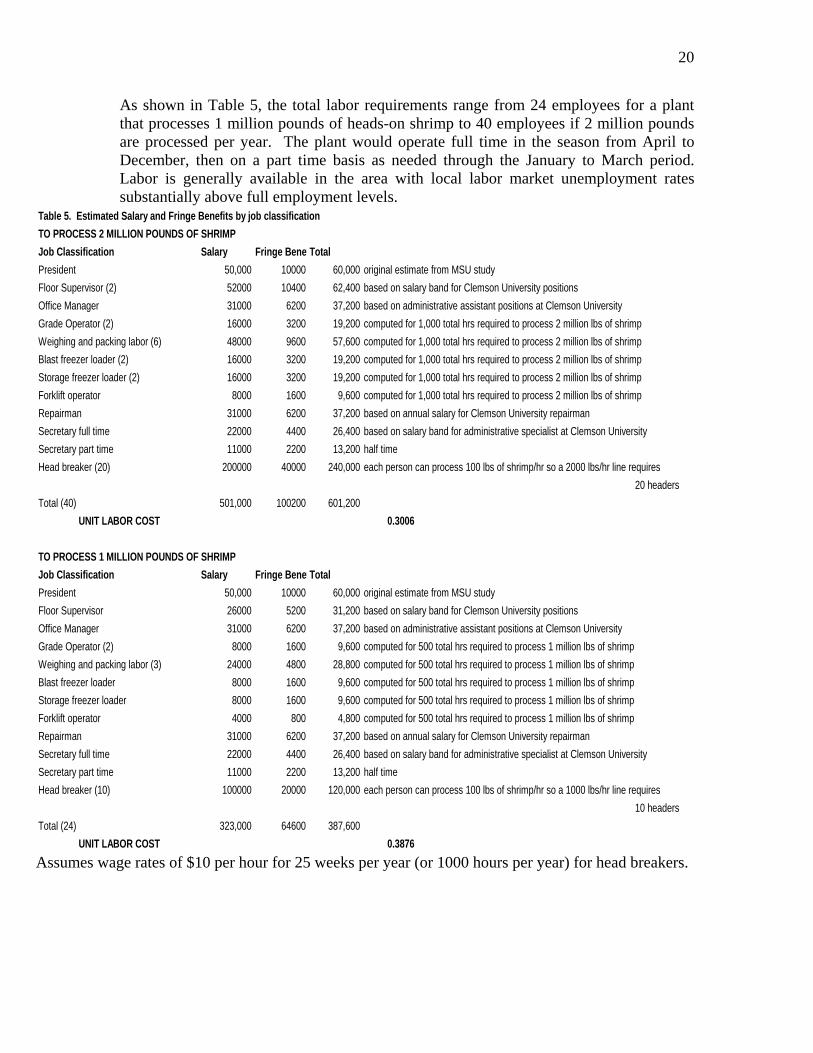
As shown in Table 5, the total labor requirements range from 24 employees for a plant that processes 1 million pounds of heads-on shrimp to 40 employees if 2 million pounds are processed per year. The plant would operate full time in the season from April to December, then on a part time basis as needed through the January to March period. Labor is generally available in the area with local labor market unemployment rates substantially above full employment levels.
Table 5. Estimated Salary and Fringe Benefits by job classification TO PROCESS 2 MILLION POUNDS OF SHRIMPJob Classification Salary Fringe BenefTotalPresident 50,000 10000 60,000 original estimate from MSU studyFloor Supervisor (2) 52000 10400 62,400 based on salary band for Clemson University positionsOffice Manager 31000 6200 37,200 based on administrative assistant positions at Clemson UniversityGrade Operator (2) 16000 3200 19,200 computed for 1,000 total hrs required to process 2 million lbs of shrimp Weighing and packing labor (6) 48000 9600 57,600 computed for 1,000 total hrs required to process 2 million lbs of shrimp Blast freezer loader (2) 16000 3200 19,200 computed for 1,000 total hrs required to process 2 million lbs of shrimp Storage freezer loader (2) 16000 3200 19,200 computed for 1,000 total hrs required to process 2 million lbs of shrimp Forklift operator 8000 1600 9,600 computed for 1,000 total hrs required to process 2 million lbs of shrimp Repairman 31000 6200 37,200 based on annual salary for Clemson University repairmanSecretary full time 22000 4400 26,400 based on salary band for administrative specialist at Clemson UniversitySecretary part time 11000 2200 13,200 half time Head breaker (20) 200000 40000 240,000 each person can process 100 lbs of shrimp/hr so a 2000 lbs/hr line requires
20 headersTotal (40) 501,000 100200 601,200 UNIT LABOR COST 0.3006
TO PROCESS 1 MILLION POUNDS OF SHRIMPJob Classification Salary Fringe BenefTotalPresident 50,000 10000 60,000 original estimate from MSU studyFloor Supervisor 26000 5200 31,200 based on salary band for Clemson University positionsOffice Manager 31000 6200 37,200 based on administrative assistant positions at Clemson UniversityGrade Operator (2) 8000 1600 9,600 computed for 500 total hrs required to process 1 million lbs of shrimp Weighing and packing labor (3) 24000 4800 28,800 computed for 500 total hrs required to process 1 million lbs of shrimp Blast freezer loader 8000 1600 9,600 computed for 500 total hrs required to process 1 million lbs of shrimp Storage freezer loader 8000 1600 9,600 computed for 500 total hrs required to process 1 million lbs of shrimp Forklift operator 4000 800 4,800 computed for 500 total hrs required to process 1 million lbs of shrimp Repairman 31000 6200 37,200 based on annual salary for Clemson University repairmanSecretary full time 22000 4400 26,400 based on salary band for administrative specialist at Clemson UniversitySecretary part time 11000 2200 13,200 half time Head breaker (10) 100000 20000 120,000 each person can process 100 lbs of shrimp/hr so a 1000 lbs/hr line requires
10 headersTotal (24) 323,000 64600 387,600 UNIT LABOR COST 0.3876Assumes wage rates of $10 per hour for 25 weeks per year (or 1000 hours per year) for head breakers.
21
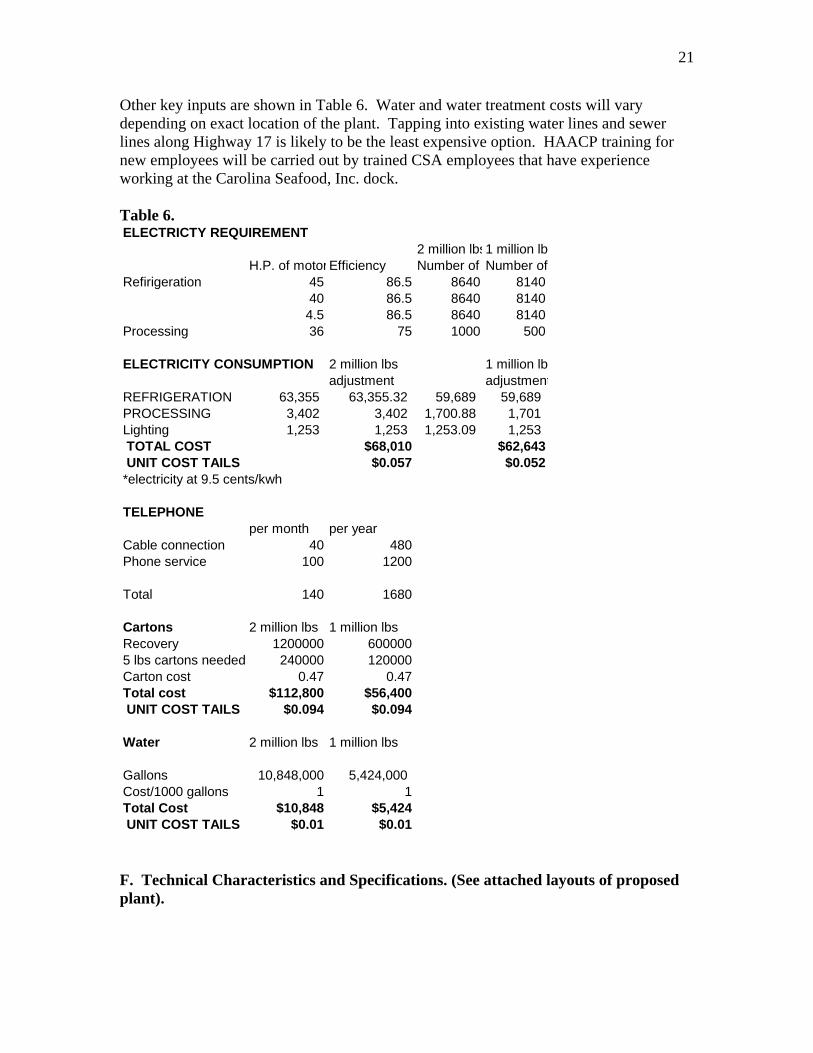
Other key inputs are shown in Table 6. Water and water treatment costs will vary depending on exact location of the plant. Tapping into existing water lines and sewer lines along Highway 17 is likely to be the least expensive option. HAACP training for new employees will be carried out by trained CSA employees that have experience working at the Carolina Seafood, Inc. dock. Table 6. ELECTRICTY REQUIREMENT
2 million lbs1 million lbsH.P. of motorEfficiency Number of Number of
Refirigeration 45 86.5 8640 814040 86.5 8640 81404.5 86.5 8640 8140
Processing 36 75 1000 500
ELECTRICITY CONSUMPTION 2 million lbs 1 million lbsadjustment adjustment
REFRIGERATION 63,355 63,355.32 59,689 59,689 PROCESSING 3,402 3,402 1,700.88 1,701 Lighting 1,253 1,253 1,253.09 1,253 TOTAL COST $68,010 $62,643 UNIT COST TAILS $0.057 $0.052*electricity at 9.5 cents/kwh
TELEPHONEper month per year
Cable connection 40 480Phone service 100 1200
Total 140 1680
Cartons 2 million lbs 1 million lbsRecovery 1200000 6000005 lbs cartons needed 240000 120000Carton cost 0.47 0.47Total cost $112,800 $56,400 UNIT COST TAILS $0.094 $0.094
Water 2 million lbs 1 million lbs
Gallons 10,848,000 5,424,000 Cost/1000 gallons 1 1Total Cost $10,848 $5,424 UNIT COST TAILS $0.01 $0.01 F. Technical Characteristics and Specifications. (See attached layouts of proposed plant).
22
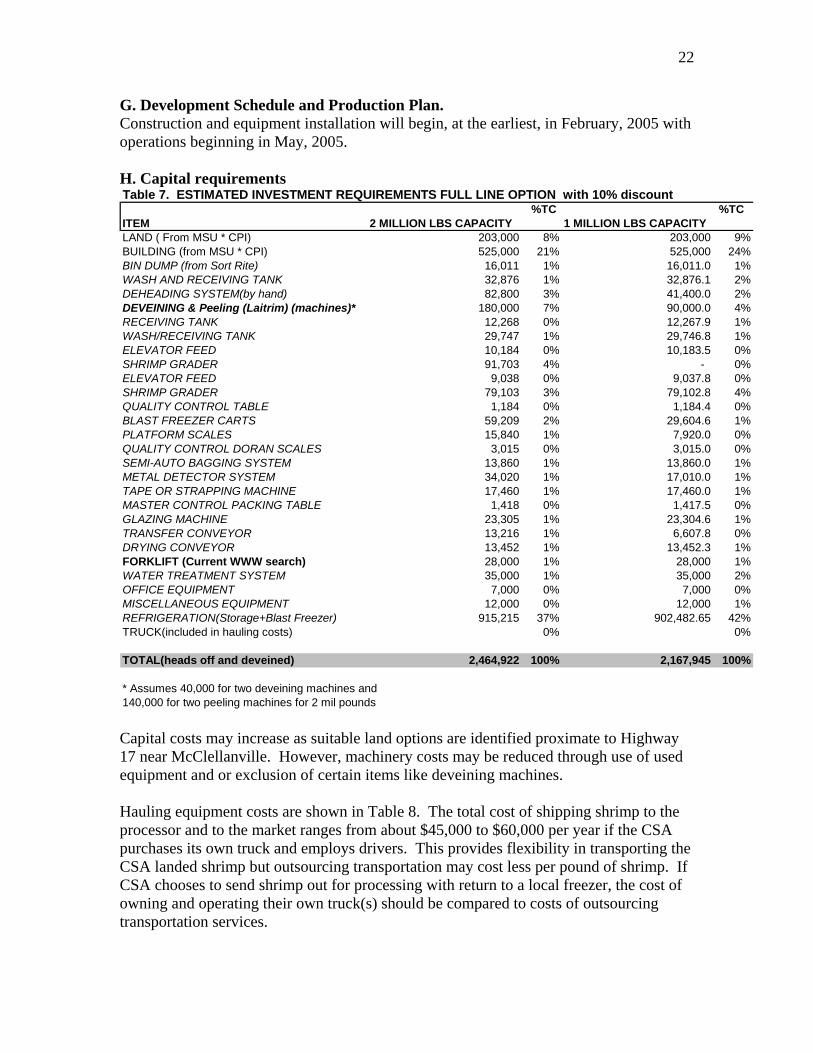
G. Development Schedule and Production Plan. Construction and equipment installation will begin, at the earliest, in February, 2005 with operations beginning in May, 2005. H. Capital requirements Table 7. ESTIMATED INVESTMENT REQUIREMENTS FULL LINE OPTION with 10% discount
%TC %TCITEM 2 MILLION LBS CAPACITY 1 MILLION LBS CAPACITYLAND ( From MSU * CPI) 203,000 8% 203,000 9%BUILDING (from MSU * CPI) 525,000 21% 525,000 24%BIN DUMP (from Sort Rite) 16,011 1% 16,011.0 1%WASH AND RECEIVING TANK 32,876 1% 32,876.1 2%DEHEADING SYSTEM(by hand) 82,800 3% 41,400.0 2%DEVEINING & Peeling (Laitrim) (machines)* 180,000 7% 90,000.0 4%RECEIVING TANK 12,268 0% 12,267.9 1%WASH/RECEIVING TANK 29,747 1% 29,746.8 1%ELEVATOR FEED 10,184 0% 10,183.5 0%SHRIMP GRADER 91,703 4% - 0%ELEVATOR FEED 9,038 0% 9,037.8 0%SHRIMP GRADER 79,103 3% 79,102.8 4%QUALITY CONTROL TABLE 1,184 0% 1,184.4 0%BLAST FREEZER CARTS 59,209 2% 29,604.6 1%PLATFORM SCALES 15,840 1% 7,920.0 0%QUALITY CONTROL DORAN SCALES 3,015 0% 3,015.0 0%SEMI-AUTO BAGGING SYSTEM 13,860 1% 13,860.0 1%METAL DETECTOR SYSTEM 34,020 1% 17,010.0 1%TAPE OR STRAPPING MACHINE 17,460 1% 17,460.0 1%MASTER CONTROL PACKING TABLE 1,418 0% 1,417.5 0%GLAZING MACHINE 23,305 1% 23,304.6 1%TRANSFER CONVEYOR 13,216 1% 6,607.8 0%DRYING CONVEYOR 13,452 1% 13,452.3 1%FORKLIFT (Current WWW search) 28,000 1% 28,000 1%WATER TREATMENT SYSTEM 35,000 1% 35,000 2%OFFICE EQUIPMENT 7,000 0% 7,000 0%MISCELLANEOUS EQUIPMENT 12,000 0% 12,000 1%REFRIGERATION(Storage+Blast Freezer) 915,215 37% 902,482.65 42%TRUCK(included in hauling costs) 0% 0%
TOTAL(heads off and deveined) 2,464,922 100% 2,167,945 100%
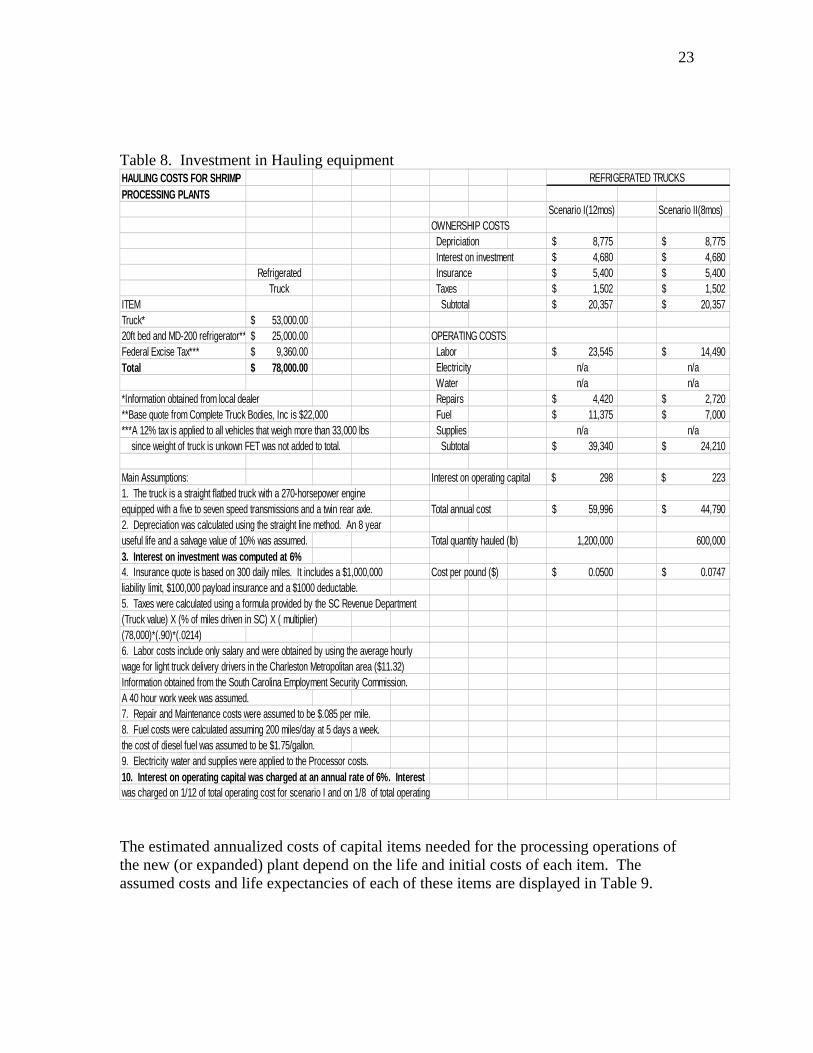
* Assumes 40,000 for two deveining machines and140,000 for two peeling machines for 2 mil pounds Capital costs may increase as suitable land options are identified proximate to Highway 17 near McClellanville. However, machinery costs may be reduced through use of used equipment and or exclusion of certain items like deveining machines. Hauling equipment costs are shown in Table 8. The total cost of shipping shrimp to the processor and to the market ranges from about $45,000 to $60,000 per year if the CSA purchases its own truck and employs drivers. This provides flexibility in transporting the CSA landed shrimp but outsourcing transportation may cost less per pound of shrimp. If CSA chooses to send shrimp out for processing with return to a local freezer, the cost of owning and operating their own truck(s) should be compared to costs of outsourcing transportation services.
23
Table 8. Investment in Hauling equipment HAULING COSTS FOR SHRIMP REFRIGERATED TRUCKSPROCESSING PLANTS
Scenario I(12mos) Scenario II(8mos)OWNERSHIP COSTS Depriciation 8,775$ 8,775$ Interest on investment 4,680$ 4,680$
Refrigerated Insurance 5,400$ 5,400$ Truck Taxes 1,502$ 1,502$
ITEM Subtotal 20,357$ 20,357$ Truck* 53,000.00$ 20ft bed and MD-200 refrigerator** 25,000.00$ OPERATING COSTSFederal Excise Tax*** 9,360.00$ Labor 23,545$ 14,490$ Total 78,000.00$ Electricity n/a n/a
Water n/a n/a*Information obtained from local dealer Repairs 4,420$ 2,720$ **Base quote from Complete Truck Bodies, Inc is $22,000 Fuel 11,375$ 7,000$ ***A 12% tax is applied to all vehicles that weigh more than 33,000 lbs Supplies n/a n/a since weight of truck is unkown FET was not added to total. Subtotal 39,340$ 24,210$
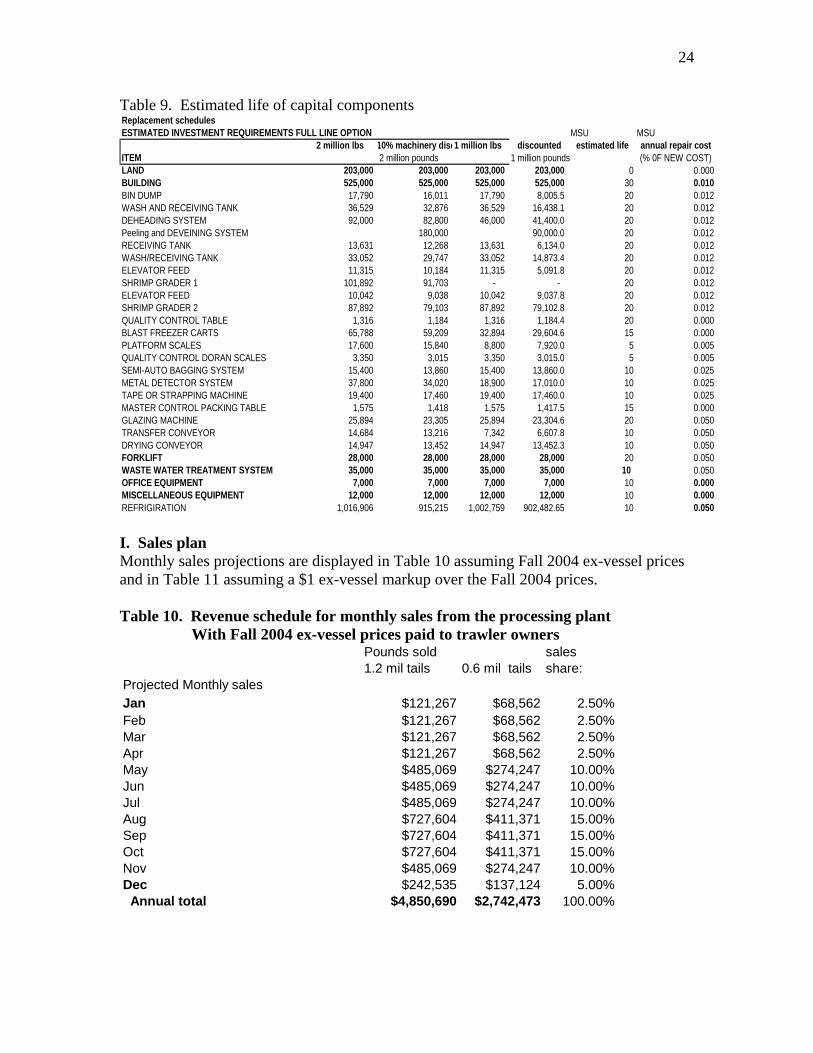
Main Assumptions: Interest on operating capital 298$ 223$ 1. The truck is a straight flatbed truck with a 270-horsepower engine equipped with a five to seven speed transmissions and a twin rear axle. Total annual cost 59,996$ 44,790$ 2. Depreciation was calculated using the straight line method. An 8 yearuseful life and a salvage value of 10% was assumed. Total quantity hauled (lb) 1,200,000 600,0003. Interest on investment was computed at 6%4. Insurance quote is based on 300 daily miles. It includes a $1,000,000 Cost per pound ($) 0.0500$ 0.0747$ liability limit, $100,000 payload insurance and a $1000 deductable.5. Taxes were calculated using a formula provided by the SC Revenue Department(Truck value) X (% of miles driven in SC) X ( multiplier)(78,000)*(.90)*(.0214)6. Labor costs include only salary and were obtained by using the average hourlywage for light truck delivery drivers in the Charleston Metropolitan area ($11.32) Information obtained from the South Carolina Employment Security Commission.A 40 hour work week was assumed.7. Repair and Maintenance costs were assumed to be $.085 per mile.8. Fuel costs were calculated assuming 200 miles/day at 5 days a week. the cost of diesel fuel was assumed to be $1.75/gallon.9. Electricity water and supplies were applied to the Processor costs.10. Interest on operating capital was charged at an annual rate of 6%. Interestwas charged on 1/12 of total operating cost for scenario I and on 1/8 of total operating The estimated annualized costs of capital items needed for the processing operations of the new (or expanded) plant depend on the life and initial costs of each item. The assumed costs and life expectancies of each of these items are displayed in Table 9.
24
Table 9. Estimated life of capital components Replacement schedulesESTIMATED INVESTMENT REQUIREMENTS FULL LINE OPTION MSU MSU
2 million lbs 10% machinery disc1 million lbs discounted estimated life annual repair costITEM 2 million pounds 1 million pounds (% 0F NEW COST)LAND 203,000 203,000 203,000 203,000 0 0.000BUILDING 525,000 525,000 525,000 525,000 30 0.010BIN DUMP 17,790 16,011 17,790 8,005.5 20 0.012WASH AND RECEIVING TANK 36,529 32,876 36,529 16,438.1 20 0.012DEHEADING SYSTEM 92,000 82,800 46,000 41,400.0 20 0.012Peeling and DEVEINING SYSTEM 180,000 90,000.0 20 0.012RECEIVING TANK 13,631 12,268 13,631 6,134.0 20 0.012WASH/RECEIVING TANK 33,052 29,747 33,052 14,873.4 20 0.012ELEVATOR FEED 11,315 10,184 11,315 5,091.8 20 0.012SHRIMP GRADER 1 101,892 91,703 - - 20 0.012ELEVATOR FEED 10,042 9,038 10,042 9,037.8 20 0.012SHRIMP GRADER 2 87,892 79,103 87,892 79,102.8 20 0.012QUALITY CONTROL TABLE 1,316 1,184 1,316 1,184.4 20 0.000BLAST FREEZER CARTS 65,788 59,209 32,894 29,604.6 15 0.000PLATFORM SCALES 17,600 15,840 8,800 7,920.0 5 0.005QUALITY CONTROL DORAN SCALES 3,350 3,015 3,350 3,015.0 5 0.005SEMI-AUTO BAGGING SYSTEM 15,400 13,860 15,400 13,860.0 10 0.025METAL DETECTOR SYSTEM 37,800 34,020 18,900 17,010.0 10 0.025TAPE OR STRAPPING MACHINE 19,400 17,460 19,400 17,460.0 10 0.025MASTER CONTROL PACKING TABLE 1,575 1,418 1,575 1,417.5 15 0.000GLAZING MACHINE 25,894 23,305 25,894 23,304.6 20 0.050TRANSFER CONVEYOR 14,684 13,216 7,342 6,607.8 10 0.050DRYING CONVEYOR 14,947 13,452 14,947 13,452.3 10 0.050FORKLIFT 28,000 28,000 28,000 28,000 20 0.050WASTE WATER TREATMENT SYSTEM 35,000 35,000 35,000 35,000 10 0.050OFFICE EQUIPMENT 7,000 7,000 7,000 7,000 10 0.000MISCELLANEOUS EQUIPMENT 12,000 12,000 12,000 12,000 10 0.000REFRIGIRATION 1,016,906 915,215 1,002,759 902,482.65 10 0.050
I. Sales plan Monthly sales projections are displayed in Table 10 assuming Fall 2004 ex-vessel prices and in Table 11 assuming a $1 ex-vessel markup over the Fall 2004 prices. Table 10. Revenue schedule for monthly sales from the processing plant With Fall 2004 ex-vessel prices paid to trawler owners
Pounds sold sales1.2 mil tails 0.6 mil tails share:
Projected Monthly salesJan $121,267 $68,562 2.50%Feb $121,267 $68,562 2.50%Mar $121,267 $68,562 2.50%Apr $121,267 $68,562 2.50%May $485,069 $274,247 10.00%Jun $485,069 $274,247 10.00%Jul $485,069 $274,247 10.00%Aug $727,604 $411,371 15.00%Sep $727,604 $411,371 15.00%Oct $727,604 $411,371 15.00%Nov $485,069 $274,247 10.00%Dec $242,535 $137,124 5.00% Annual total $4,850,690 $2,742,473 100.00%

25
Table 11. Revenue schedule for monthly sales from the processing plant With Fall 2004 ex-vessel price + $1 per pound for Mark of Quality Shrimp
Pounds sold salesWith Mark of Quality Prices to Trawler 1.2 mil tails 0.6 mil tails share:Projected Monthly salesJan $168,360 $91,748 2.50%Feb $168,360 $91,748 2.50%Mar $168,360 $91,748 2.50%Apr $168,360 $91,748 2.50%May $673,440 $366,992 10.00%Jun $673,440 $366,992 10.00%Jul $673,440 $366,992 10.00%Aug $1,010,161 $550,487 15.00%Sep $1,010,161 $550,487 15.00%Oct $1,010,161 $550,487 15.00%Nov $673,440 $366,992 10.00%Dec $336,720 $183,496 5.00% Annual total $6,734,404 $3,669,915 100.00% Storage at the plant site will be in frozen state IQF in either 5 pound boxes or 25 pound bags with CEA logos. During the peak sales months of August to October, storage time will be weeks on average while off peak storage periods will be one to three months. Over a 15 year planning period, we assume that pounds processed will hold steady but that prices for processed shrimp will rise with the rate of inflation – 3% per year. These assumptions result in the expected annual plant revenues shown in Tables 12 and 13 . Table 12. Expected annual revenues over a 15 year planning period Using current ex-vessl prices Pounds sold Inflation rateFifteen year revenue schedule 1. 2 mil tails 0.6 mil tails 3%
2005 $4,850,690 $2,742,473 1.002006 $4,996,211 $2,824,748 1.032007 $5,146,097 $2,909,490 1.062008 $5,300,480 $2,996,775 1.092009 $5,459,495 $3,086,678 1.132010 $5,623,279 $3,179,278 1.162011 $5,791,978 $3,274,657 1.192012 $5,965,737 $3,372,896 1.232013 $6,144,709 $3,474,083 1.272014 $6,329,051 $3,578,306 1.302015 $6,518,922 $3,685,655 1.342016 $6,714,490 $3,796,224 1.382017 $6,915,924 $3,910,111 1.432018 $7,123,402 $4,027,415 1.472019 $7,337,104 $4,148,237 1.51
26
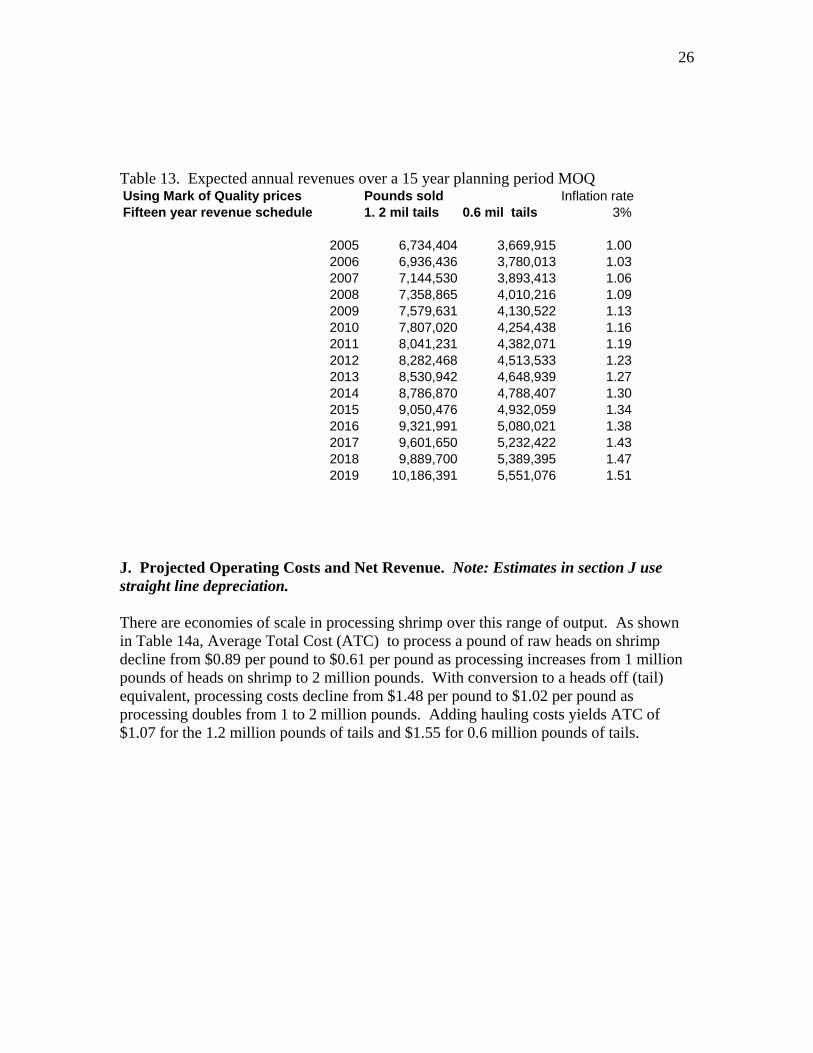
Table 13. Expected annual revenues over a 15 year planning period MOQ Using Mark of Quality prices Pounds sold Inflation rateFifteen year revenue schedule 1. 2 mil tails 0.6 mil tails 3%
2005 6,734,404 3,669,915 1.002006 6,936,436 3,780,013 1.032007 7,144,530 3,893,413 1.062008 7,358,865 4,010,216 1.092009 7,579,631 4,130,522 1.132010 7,807,020 4,254,438 1.162011 8,041,231 4,382,071 1.192012 8,282,468 4,513,533 1.232013 8,530,942 4,648,939 1.272014 8,786,870 4,788,407 1.302015 9,050,476 4,932,059 1.342016 9,321,991 5,080,021 1.382017 9,601,650 5,232,422 1.432018 9,889,700 5,389,395 1.472019 10,186,391 5,551,076 1.51
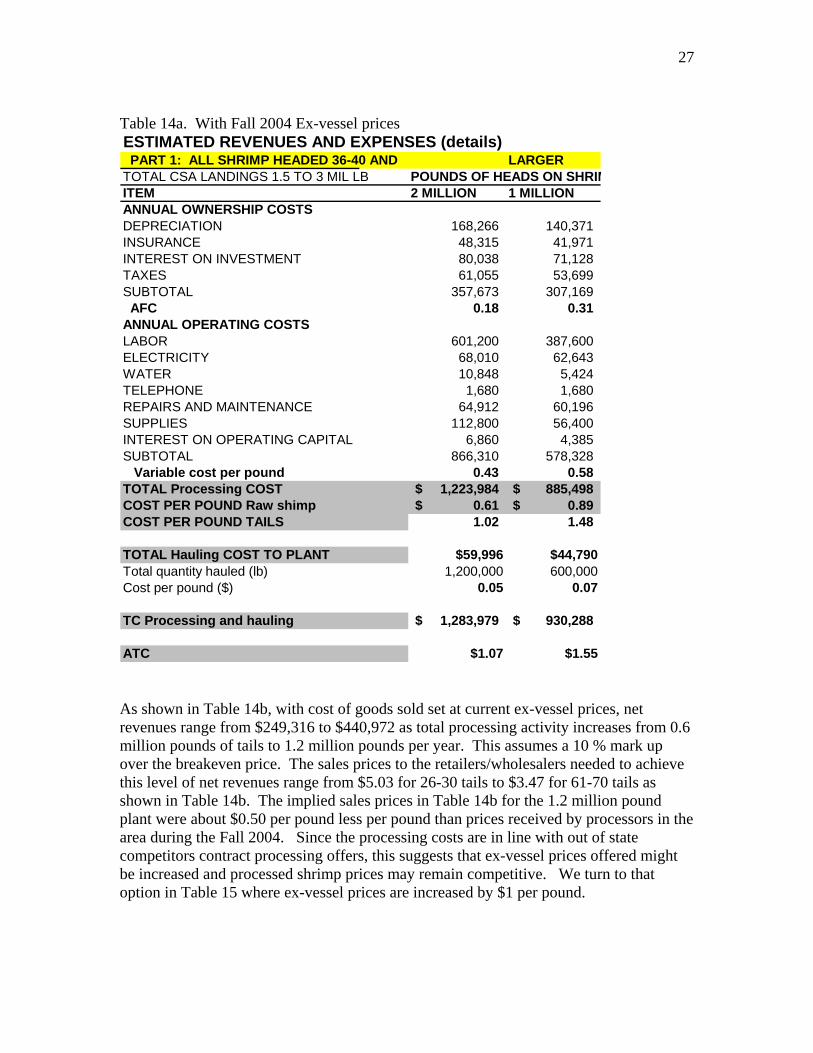
J. Projected Operating Costs and Net Revenue. Note: Estimates in section J use straight line depreciation. There are economies of scale in processing shrimp over this range of output. As shown in Table 14a, Average Total Cost (ATC) to process a pound of raw heads on shrimp decline from $0.89 per pound to $0.61 per pound as processing increases from 1 million pounds of heads on shrimp to 2 million pounds. With conversion to a heads off (tail) equivalent, processing costs decline from $1.48 per pound to $1.02 per pound as processing doubles from 1 to 2 million pounds. Adding hauling costs yields ATC of $1.07 for the 1.2 million pounds of tails and $1.55 for 0.6 million pounds of tails.
27
Table 14a. With Fall 2004 Ex-vessel prices ESTIMATED REVENUES AND EXPENSES (details) PART 1: ALL SHRIMP HEADED 36-40 AND LARGERTOTAL CSA LANDINGS 1.5 TO 3 MIL LB POUNDS OF HEADS ON SHRIMITEM 2 MILLION 1 MILLIONANNUAL OWNERSHIP COSTSDEPRECIATION 168,266 140,371 INSURANCE 48,315 41,971 INTEREST ON INVESTMENT 80,038 71,128 TAXES 61,055 53,699 SUBTOTAL 357,673 307,169 AFC 0.18 0.31 ANNUAL OPERATING COSTSLABOR 601,200 387,600 ELECTRICITY 68,010 62,643 WATER 10,848 5,424 TELEPHONE 1,680 1,680 REPAIRS AND MAINTENANCE 64,912 60,196 SUPPLIES 112,800 56,400 INTEREST ON OPERATING CAPITAL 6,860 4,385 SUBTOTAL 866,310 578,328 Variable cost per pound 0.43 0.58 TOTAL Processing COST 1,223,984$ 885,498$ COST PER POUND Raw shimp 0.61$ 0.89$ COST PER POUND TAILS 1.02 1.48
TOTAL Hauling COST TO PLANT $59,996 $44,790Total quantity hauled (lb) 1,200,000 600,000Cost per pound ($) 0.05 0.07
TC Processing and hauling 1,283,979$ 930,288$
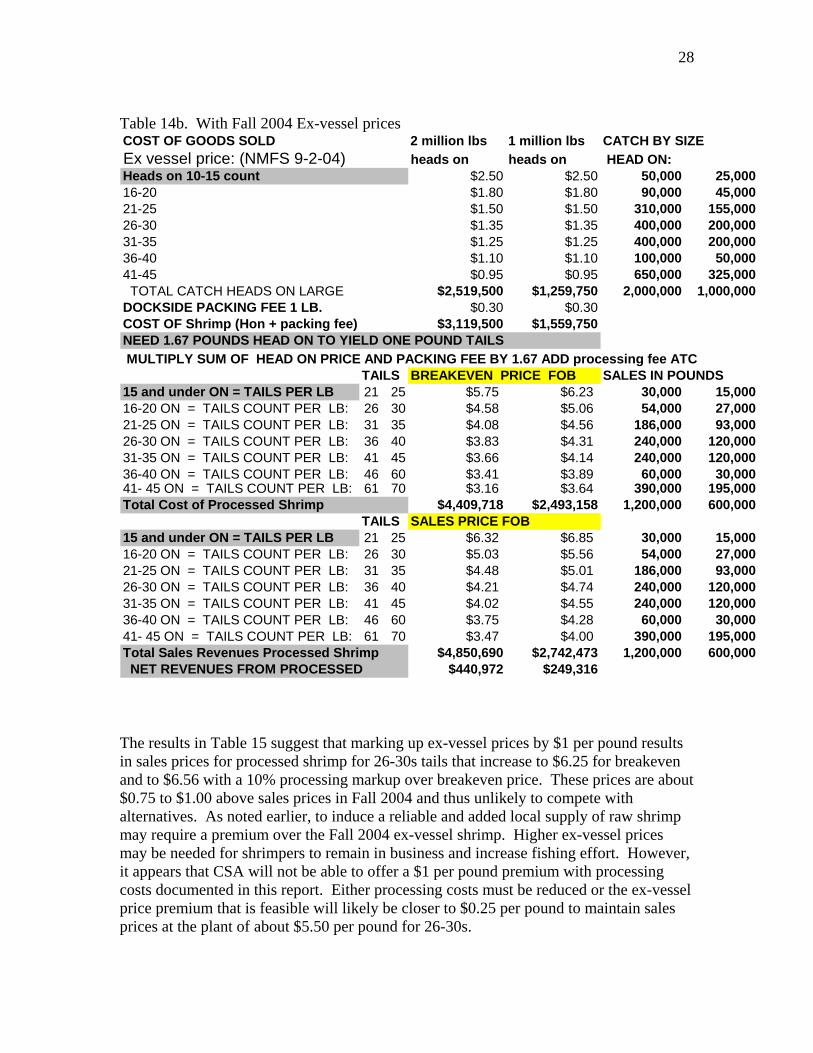
ATC $1.07 $1.55 As shown in Table 14b, with cost of goods sold set at current ex-vessel prices, net revenues range from $249,316 to $440,972 as total processing activity increases from 0.6 million pounds of tails to 1.2 million pounds per year. This assumes a 10 % mark up over the breakeven price. The sales prices to the retailers/wholesalers needed to achieve this level of net revenues range from $5.03 for 26-30 tails to $3.47 for 61-70 tails as shown in Table 14b. The implied sales prices in Table 14b for the 1.2 million pound plant were about $0.50 per pound less per pound than prices received by processors in the area during the Fall 2004. Since the processing costs are in line with out of state competitors contract processing offers, this suggests that ex-vessel prices offered might be increased and processed shrimp prices may remain competitive. We turn to that option in Table 15 where ex-vessel prices are increased by $1 per pound.
28
Table 14b. With Fall 2004 Ex-vessel prices COST OF GOODS SOLD 2 million lbs 1 million lbs CATCH BY SIZEEx vessel price: (NMFS 9-2-04) heads on heads on HEAD ON:Heads on 10-15 count $2.50 $2.50 50,000 25,00016-20 $1.80 $1.80 90,000 45,00021-25 $1.50 $1.50 310,000 155,00026-30 $1.35 $1.35 400,000 200,00031-35 $1.25 $1.25 400,000 200,00036-40 $1.10 $1.10 100,000 50,00041-45 $0.95 $0.95 650,000 325,000 TOTAL CATCH HEADS ON LARGE $2,519,500 $1,259,750 2,000,000 1,000,000DOCKSIDE PACKING FEE 1 LB. $0.30 $0.30COST OF Shrimp (Hon + packing fee) $3,119,500 $1,559,750NEED 1.67 POUNDS HEAD ON TO YIELD ONE POUND TAILS MULTIPLY SUM OF HEAD ON PRICE AND PACKING FEE BY 1.67 ADD processing fee ATC TAILS BREAKEVEN PRICE FOB SALES IN POUNDS15 and under ON = TAILS PER LB 21 25 $5.75 $6.23 30,000 15,00016-20 ON = TAILS COUNT PER LB: 26 30 $4.58 $5.06 54,000 27,00021-25 ON = TAILS COUNT PER LB: 31 35 $4.08 $4.56 186,000 93,00026-30 ON = TAILS COUNT PER LB: 36 40 $3.83 $4.31 240,000 120,00031-35 ON = TAILS COUNT PER LB: 41 45 $3.66 $4.14 240,000 120,00036-40 ON = TAILS COUNT PER LB: 46 60 $3.41 $3.89 60,000 30,00041- 45 ON = TAILS COUNT PER LB: 61 70 $3.16 $3.64 390,000 195,000Total Cost of Processed Shrimp $4,409,718 $2,493,158 1,200,000 600,000
TAILS SALES PRICE FOB15 and under ON = TAILS PER LB 21 25 $6.32 $6.85 30,000 15,00016-20 ON = TAILS COUNT PER LB: 26 30 $5.03 $5.56 54,000 27,00021-25 ON = TAILS COUNT PER LB: 31 35 $4.48 $5.01 186,000 93,00026-30 ON = TAILS COUNT PER LB: 36 40 $4.21 $4.74 240,000 120,00031-35 ON = TAILS COUNT PER LB: 41 45 $4.02 $4.55 240,000 120,00036-40 ON = TAILS COUNT PER LB: 46 60 $3.75 $4.28 60,000 30,00041- 45 ON = TAILS COUNT PER LB: 61 70 $3.47 $4.00 390,000 195,000Total Sales Revenues Processed Shrimp $4,850,690 $2,742,473 1,200,000 600,000 NET REVENUES FROM PROCESSED $440,972 $249,316 The results in Table 15 suggest that marking up ex-vessel prices by $1 per pound results in sales prices for processed shrimp for 26-30s tails that increase to $6.25 for breakeven and to $6.56 with a 10% processing markup over breakeven price. These prices are about $0.75 to $1.00 above sales prices in Fall 2004 and thus unlikely to compete with alternatives. As noted earlier, to induce a reliable and added local supply of raw shrimp may require a premium over the Fall 2004 ex-vessel shrimp. Higher ex-vessel prices may be needed for shrimpers to remain in business and increase fishing effort. However, it appears that CSA will not be able to offer a $1 per pound premium with processing costs documented in this report. Either processing costs must be reduced or the ex-vessel price premium that is feasible will likely be closer to $0.25 per pound to maintain sales prices at the plant of about $5.50 per pound for 26-30s.
29
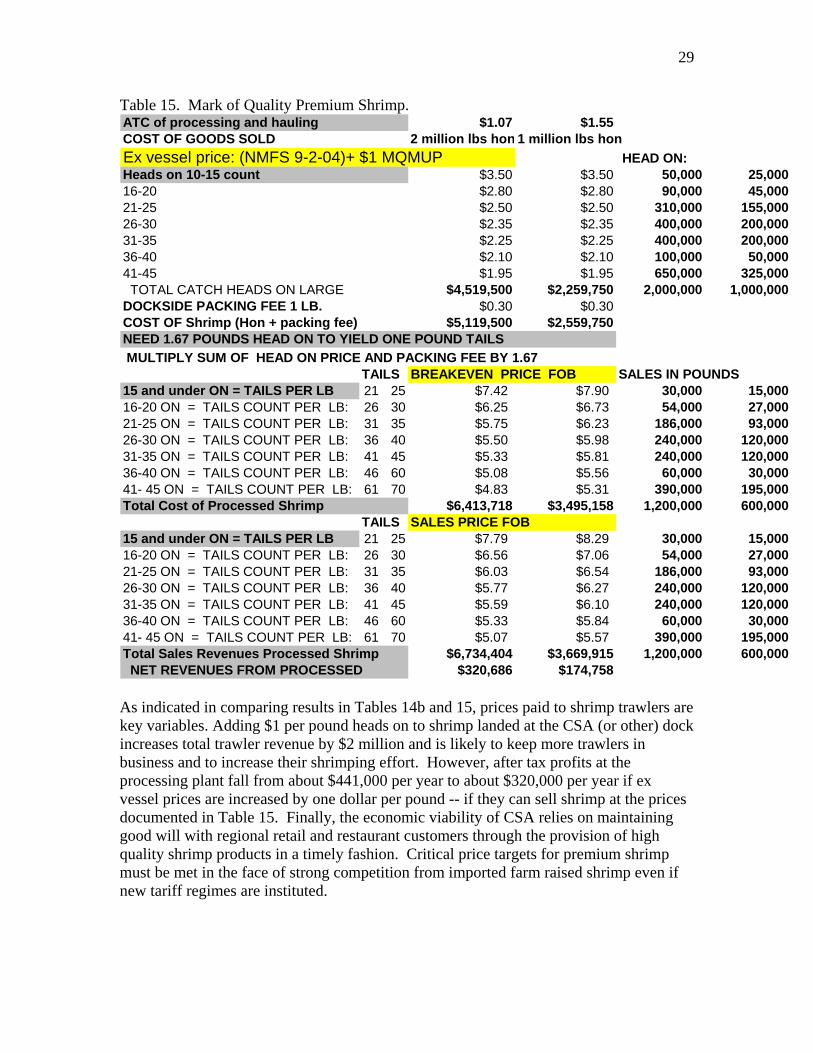
Table 15. Mark of Quality Premium Shrimp. ATC of processing and hauling $1.07 $1.55COST OF GOODS SOLD 2 million lbs hon 1 million lbs honEx vessel price: (NMFS 9-2-04)+ $1 MQMUP HEAD ON:Heads on 10-15 count $3.50 $3.50 50,000 25,00016-20 $2.80 $2.80 90,000 45,00021-25 $2.50 $2.50 310,000 155,00026-30 $2.35 $2.35 400,000 200,00031-35 $2.25 $2.25 400,000 200,00036-40 $2.10 $2.10 100,000 50,00041-45 $1.95 $1.95 650,000 325,000 TOTAL CATCH HEADS ON LARGE $4,519,500 $2,259,750 2,000,000 1,000,000DOCKSIDE PACKING FEE 1 LB. $0.30 $0.30COST OF Shrimp (Hon + packing fee) $5,119,500 $2,559,750NEED 1.67 POUNDS HEAD ON TO YIELD ONE POUND TAILS MULTIPLY SUM OF HEAD ON PRICE AND PACKING FEE BY 1.67 TAILS BREAKEVEN PRICE FOB SALES IN POUNDS15 and under ON = TAILS PER LB 21 25 $7.42 $7.90 30,000 15,00016-20 ON = TAILS COUNT PER LB: 26 30 $6.25 $6.73 54,000 27,00021-25 ON = TAILS COUNT PER LB: 31 35 $5.75 $6.23 186,000 93,00026-30 ON = TAILS COUNT PER LB: 36 40 $5.50 $5.98 240,000 120,00031-35 ON = TAILS COUNT PER LB: 41 45 $5.33 $5.81 240,000 120,00036-40 ON = TAILS COUNT PER LB: 46 60 $5.08 $5.56 60,000 30,00041- 45 ON = TAILS COUNT PER LB: 61 70 $4.83 $5.31 390,000 195,000Total Cost of Processed Shrimp $6,413,718 $3,495,158 1,200,000 600,000
TAILS SALES PRICE FOB15 and under ON = TAILS PER LB 21 25 $7.79 $8.29 30,000 15,00016-20 ON = TAILS COUNT PER LB: 26 30 $6.56 $7.06 54,000 27,00021-25 ON = TAILS COUNT PER LB: 31 35 $6.03 $6.54 186,000 93,00026-30 ON = TAILS COUNT PER LB: 36 40 $5.77 $6.27 240,000 120,00031-35 ON = TAILS COUNT PER LB: 41 45 $5.59 $6.10 240,000 120,00036-40 ON = TAILS COUNT PER LB: 46 60 $5.33 $5.84 60,000 30,00041- 45 ON = TAILS COUNT PER LB: 61 70 $5.07 $5.57 390,000 195,000Total Sales Revenues Processed Shrimp $6,734,404 $3,669,915 1,200,000 600,000 NET REVENUES FROM PROCESSED $320,686 $174,758 As indicated in comparing results in Tables 14b and 15, prices paid to shrimp trawlers are key variables. Adding $1 per pound heads on to shrimp landed at the CSA (or other) dock increases total trawler revenue by $2 million and is likely to keep more trawlers in business and to increase their shrimping effort. However, after tax profits at the processing plant fall from about $441,000 per year to about $320,000 per year if ex vessel prices are increased by one dollar per pound -- if they can sell shrimp at the prices documented in Table 15. Finally, the economic viability of CSA relies on maintaining good will with regional retail and restaurant customers through the provision of high quality shrimp products in a timely fashion. Critical price targets for premium shrimp must be met in the face of strong competition from imported farm raised shrimp even if new tariff regimes are instituted.
30
K. Financial plan. Five year projected cash flows, balance sheets, and net income statements for a 2 million pound processing plant are provided in the Appendix for both the Fall 2004 ex-vessel prices and the $1 markup over ex-vessel price scenarios. All equity financing is preferred to avoid the financial drag of required loan repayments in a business that has an irregular net income stream. Assuming that 30,000 shares of CSA stock are sold, we anticipate an initial investment of about $3 million. The CSA facility earns a positive cash flow each year of the forecast period with ample cash reserves. The rate of return on invested capital is 8% to 10% per year. Cash reserves may be allocated as stock dividends or retained earnings needed to replenish equipment and add capacity as warranted. We should also note that the SC Shrimp Company option discussed in section IV of this report required substantially less initial capital – about $500,000. L. Summary - The “Cadillac” option. Construction of a new processing plant with a capacity of processing 2 million pounds of head on shrimp per year would require investment of $2.5 to $3.5 million dollars for land, new buildings, new equipment that includes peeling and deveining machinery and all heading, grading, freezing and storage equipment. This assumes a new Cooperative or LLC will be formed to manage the plant and that external public/private funds are used to finance new infrastructure and working capital. For example, USDA Rural Development has a Business and Industry guaranteed loan program for processing plants built in rural areas with less than 50,000 population. Rural development can provide up to 80 percent loan guarantee for loans of $5 million or less. This is an incentive for banks to make economic development loans to rural areas. There are probably other state economic development incentives that could be used. Given the current costs for land, building and equipment, we find the following:
1. Processing cost per pound of head on shrimp would be $.61 for a 2 million pound run; $0.89 for a 1 million pound run.
2. Equivalent tail costs per pound are $1.02 and $1.48, respectively. 3. At Fall 2004 ex-vessel prices for head on shrimp, for a 2 million pound (heads on)
processing plant, adding hauling costs to the processing plant, dockside packing fees, and processing costs results in per pound breakeven prices(zero profit) for headed shrimp products at the plant that range from about $4.58 for 26-30s to $3.16 for 61-70s.
4. Adding $1 per pound to the Fall 2004 ex-vessel prices of head on shrimp -- the mark of quality premium – results in per pound breakeven prices at the plant ranging from $6.25 for 26-30s to $4.83 for 61-70s.
5. If market prices exceed these breakeven prices, then profits from the processing plant will be available for distribution to Coop or LLC members. With a 2 million run plant and a 10% profit markup over breakeven prices, sales prices for 26-30s would be $5.03 with Fall 2004 ex-vessel prices and $6.56 for mark of quality shrimp. A 1 million run plant sales price with 10% markups would be $5.56 with Fall 2004 ex-vessel prices and $7.06 for mark of quality shrimp for 26-30s.
31
III. THE CONTRACTING ALTERNATIVE TO A NEW CSA FACILITY Processing wild caught shrimp is only possible during shrimp season, April – December. Therefore, it may be cost-effective for CSA to contract with an existing processing facility to have their shrimp frozen and packaged for sale, rather than installing their own equipment to be used only for six or seven months out of the year (Deantonio, 2003). Four companies in the Southeast region have been contacted. A summary of the results of these personal interviews finds the following:
• No new local investment needed. • Processing costs (heading, packing and freezing) range from $.37 to $.70
cents per pound of head on shrimp. Capacity and willingness to process SC shrimp exist in the Southeast region.
• Transportation costs range from about $.08 to $.15 per pound of tails each way.
• SC landings can be processed on a separate run and identity preserved by boxing or bagging with SC logos with a cost of $.06 per pound for containers.
• Storage cost (IQF or Blocks) would be about $.05 to $.06 per pound in the combined receiving and delivery months. Intervening months require an additional $.01 to $.015 per pound per month charge. Assuming average storage time of 3 months, total storage costs at commercial sites in SC or elsewhere would likely be about $.10 per pound per year.
• Assuming $.60 processing cost per pound of heads on shrimp (or $1.00 per pounds of tail), $.10 one way transport cost, and storage cost of $.10 per pound, then the total price for tails FOB at the plant would be about the same as those shown in Table 14b above for the 2 million pound processing scenario.
• One benefit of the contractor option is no new capital is needed to market SC premium shrimp. Second, production risks are borne by the contractor.
• If shrimp are headed on board the trawlers, contract processing costs would fall to about $.25 to $.30 per pound for boxing and freezing. These reduced processing costs would be countered to some extent by higher ex-vessel prices paid to trawler owners.
• Drawbacks include: limited quality control by SC interests if out of state processors used.
IV. THE “SC SHRIMP COMPANY” OPTION. This option has several basic features:
• Form an LLC or Coop that requires 25 to 30 members to invest $20,000 each to establish a small scale plant with freezer capacity. No external debt required but a full time manager is employed.
• Provide head on and headless shell-on product only. • Use sweat equity and used equipment. • Provide on-site freezer capacity
32
This option is modeled after similar establishments in the region. Assume an LLC with 30 trawlers owner/operators. They elect a 7 member board of directors who in turn hire a manager. Personnel needs include 1 manager, 1 sales person, 1 plant manager, 1or 2 retail/office workers, 3 fulltime floor workers, 6 to 8 part time “on-demand” headers, 5 for freezing/boxing on a part time basis and 2 truck drivers. Their operating costs are about $.20 per pound to head and $.30 per pound to freeze and box in five pound boxes. They start with about $500,000 in capital. They use this to purchase a used building, used equipment—bins, blast freezers, etc, two used trucks, and a fork lift. They also secure a $200,000 line of credit to provide operating capital. They have profit sharing but do not pay a premium price to trawler owners/ members. The price that they offer to trawlers is the “buyer price” less $.20. They will freeze and store tails for $.50 per pound for their customers until fresh shrimp are available in May. They use the line of credit to buy shrimp for storage for the January to April period and sell frozen inventory until May. Cash flow from fresh sales during the May to December period is positive. Restaurants want graded fresh shrimp that they can pick up at the dock usually in 50 pound wax boxes with ice. Sales average 70% fresh and 30% frozen. They buy from their own dock but also proximate docks and boats. Restaurants call them with fresh/frozen orders but the SC Shrimp Company needs a minimum of 1,000 pound order to provide delivery using their trucks. They sell to wholesalers in the region who in turn sell to retail outlets with smaller orders. V. RELATED ISSUES There is interest in clam harvesting and processing to supplement shrimp processing activities. Clam harvesting operations exist in several places along the coast with sales of raw clams to regional outlets. However, according to some in the industry, processing and marketing clam products to area restaurants and retail outlets can be a viable addition to the shrimp processing activities. While no formal analysis has been attempted, individuals have been in contact with area restaurants to ascertain the potential market for processed clam products. If clam processing equipment can be placed in the shrimp plant and provide more year round work options to the local labor force, it is likely to improve the profitability of processing operations. If labor turnover is reduced, the cost of shrimp processing activities might also fall. With sufficient consumer demand for the processed clam products, then the added capital investment may be warranted. Innovations in retailing to tourists can also be explored as ways to improve the profitability of processing plants in South Carolina. A second issue revolves around the possible relocation of the Pt. Royal shrimp processing plant to a Beaufort County industrial park or proximate area. If state owned port facilities in Pt. Royal are redeveloped, there is an opportunity to support a move of the Pt. Royal processing activities to a location that will ensure adequate in-state processing capacity for wild caught shrimp that are landed in South Carolina. As the discussion of the processing options in sections II, III and IV suggest, there is ample opportunity to process shrimp in South Carolina facilities at rates that are competitive with out of state processors.
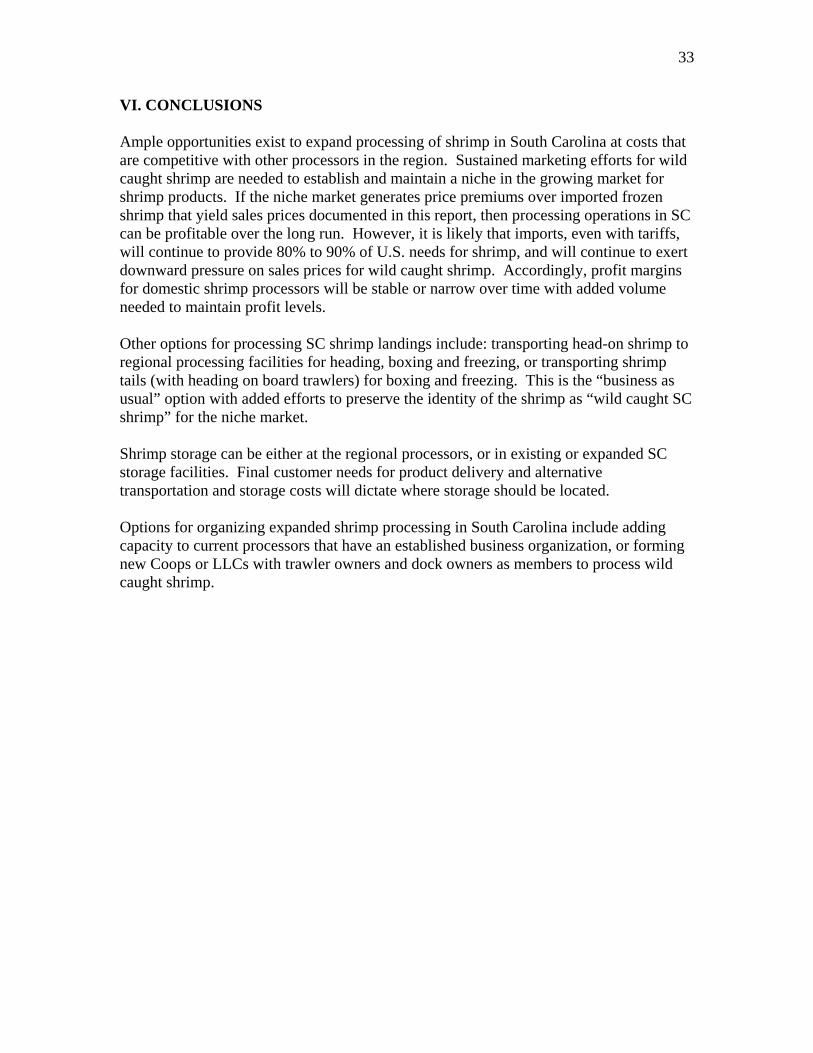
33
VI. CONCLUSIONS Ample opportunities exist to expand processing of shrimp in South Carolina at costs that are competitive with other processors in the region. Sustained marketing efforts for wild caught shrimp are needed to establish and maintain a niche in the growing market for shrimp products. If the niche market generates price premiums over imported frozen shrimp that yield sales prices documented in this report, then processing operations in SC can be profitable over the long run. However, it is likely that imports, even with tariffs, will continue to provide 80% to 90% of U.S. needs for shrimp, and will continue to exert downward pressure on sales prices for wild caught shrimp. Accordingly, profit margins for domestic shrimp processors will be stable or narrow over time with added volume needed to maintain profit levels. Other options for processing SC shrimp landings include: transporting head-on shrimp to regional processing facilities for heading, boxing and freezing, or transporting shrimp tails (with heading on board trawlers) for boxing and freezing. This is the “business as usual” option with added efforts to preserve the identity of the shrimp as “wild caught SC shrimp” for the niche market. Shrimp storage can be either at the regional processors, or in existing or expanded SC storage facilities. Final customer needs for product delivery and alternative transportation and storage costs will dictate where storage should be located. Options for organizing expanded shrimp processing in South Carolina include adding capacity to current processors that have an established business organization, or forming new Coops or LLCs with trawler owners and dock owners as members to process wild caught shrimp.
34
REFERENCES Deantonio, C. 2003. “Carolina Seafoods: A Proposal to the McClellanville Value Added Wild Caught South Atlantic Shrimp Project.” Unpublished manuscript. McClellanville, SC. Federal Reserve Bank of Dallas. 2004. “Texas Shrimpers Face Sea of Regulations, flood of Imports.” Houston Business. July. Fuduric, Joseph A., D.L. Barkley and M. S. Henry 2005. Marketing Wild Caught South Carolina Shrimp: Lessons Learned From Agricultural Niche Marketing Programs. Regional Economic Development Research Laboratory, Department of Applied Economics & Statistics, Clemson University, Clemson, SC. January 12. Jodice, L. et al 2004. Tourism and the Demand for SC Shrimp, manuscript forthcoming, Department of Parks, Recreation and Tourism Management, Clemson University, Clemson, SC. Keithly, W. R., Hamady Diop, Richard F. Kazmierczak, Jr. and Mike D. Travis, 2004. An Economic Analysis of the Southeast U.S. Shrimp Processing Industry Responses to an Increasing Import Base. Unpublished manuscript. National Marine Fisheries Service (NMFS) for the Gulf of Mexico and South Atlantic Shrimp Harvesters. 2004. Draft Shrimp Business Options. Proposals to Develop a Sustainable Shrimp Fishery in the Gulf of Mexico and South Atlantic. With the assistance of: John Ward Office of Constituent Services National Marine Fisheries Service Silver Spring, Maryland Charles Adams, Department of Food and Resource Economics, University of Florida Gainesville, Florida Wade Griffin and Richard Woodward, Department of Agricultural Economics, Texas A&M University College Station, Texas; Mike Haby Texas Cooperative Extension Sea Grant College Program, Texas A&M University System, College Station, Texas; James Kirkley, Virginia Institute of Marine Science, College of William and Mary Gloucester Point, Virginia. August 19. Peng, Shaojie (George). 2004. A Literature Review for the Shrimp Marketing Program. Spiro Center, Clemson University, Clemson, SC. April 9.
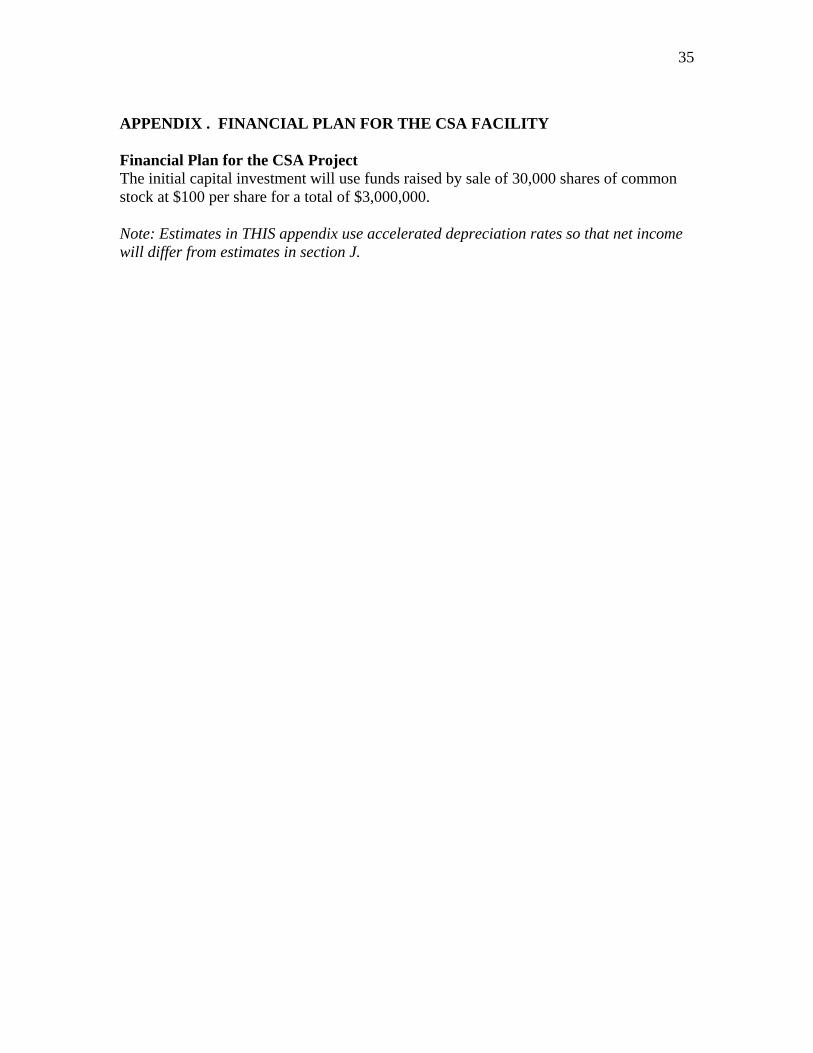
35
APPENDIX . FINANCIAL PLAN FOR THE CSA FACILITY Financial Plan for the CSA Project The initial capital investment will use funds raised by sale of 30,000 shares of common stock at $100 per share for a total of $3,000,000. Note: Estimates in THIS appendix use accelerated depreciation rates so that net income will differ from estimates in section J.
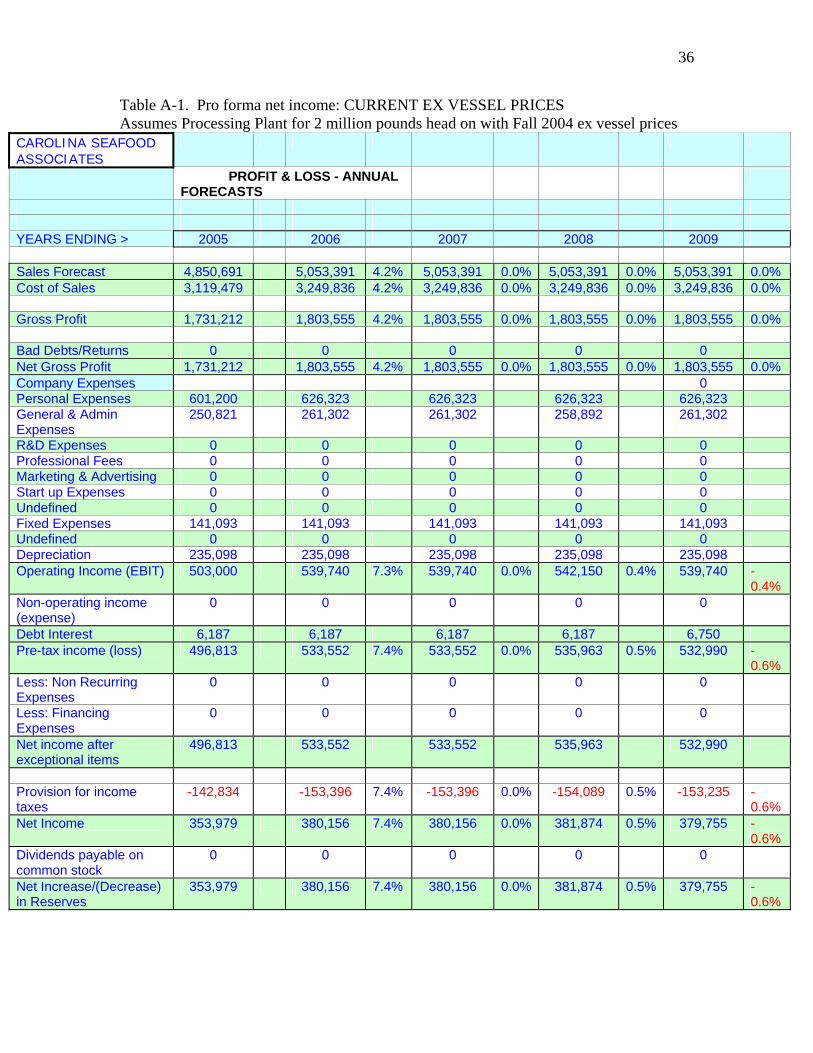
36
Table A-1. Pro forma net income: CURRENT EX VESSEL PRICES Assumes Processing Plant for 2 million pounds head on with Fall 2004 ex vessel prices
CAROLINA SEAFOOD ASSOCIATES
PROFIT & LOSS - ANNUAL FORECASTS
YEARS ENDING > 2005 2006 2007 2008 2009
Sales Forecast 4,850,691 5,053,391 4.2% 5,053,391 0.0% 5,053,391 0.0% 5,053,391 0.0% Cost of Sales 3,119,479 3,249,836 4.2% 3,249,836 0.0% 3,249,836 0.0% 3,249,836 0.0%
Gross Profit 1,731,212 1,803,555 4.2% 1,803,555 0.0% 1,803,555 0.0% 1,803,555 0.0%
Bad Debts/Returns 0 0 0 0 0 Net Gross Profit 1,731,212 1,803,555 4.2% 1,803,555 0.0% 1,803,555 0.0% 1,803,555 0.0% Company Expenses 0 Personal Expenses 601,200 626,323 626,323 626,323 626,323 General & Admin Expenses
250,821 261,302 261,302 258,892 261,302
R&D Expenses 0 0 0 0 0 Professional Fees 0 0 0 0 0 Marketing & Advertising 0 0 0 0 0 Start up Expenses 0 0 0 0 0 Undefined 0 0 0 0 0 Fixed Expenses 141,093 141,093 141,093 141,093 141,093 Undefined 0 0 0 0 0 Depreciation 235,098 235,098 235,098 235,098 235,098 Operating Income (EBIT) 503,000 539,740 7.3% 539,740 0.0% 542,150 0.4% 539,740 -
0.4% Non-operating income (expense)
0 0 0 0 0
Debt Interest 6,187 6,187 6,187 6,187 6,750 Pre-tax income (loss) 496,813 533,552 7.4% 533,552 0.0% 535,963 0.5% 532,990 -
0.6% Less: Non Recurring Expenses
0 0 0 0 0
Less: Financing Expenses
0 0 0 0 0
Net income after exceptional items
496,813 533,552 533,552 535,963 532,990
Provision for income taxes
-142,834 -153,396 7.4% -153,396 0.0% -154,089 0.5% -153,235 -0.6%
Net Income 353,979 380,156 7.4% 380,156 0.0% 381,874 0.5% 379,755 -0.6%
Dividends payable on common stock
0 0 0 0 0
Net Increase/(Decrease) in Reserves
353,979 380,156 7.4% 380,156 0.0% 381,874 0.5% 379,755 -0.6%
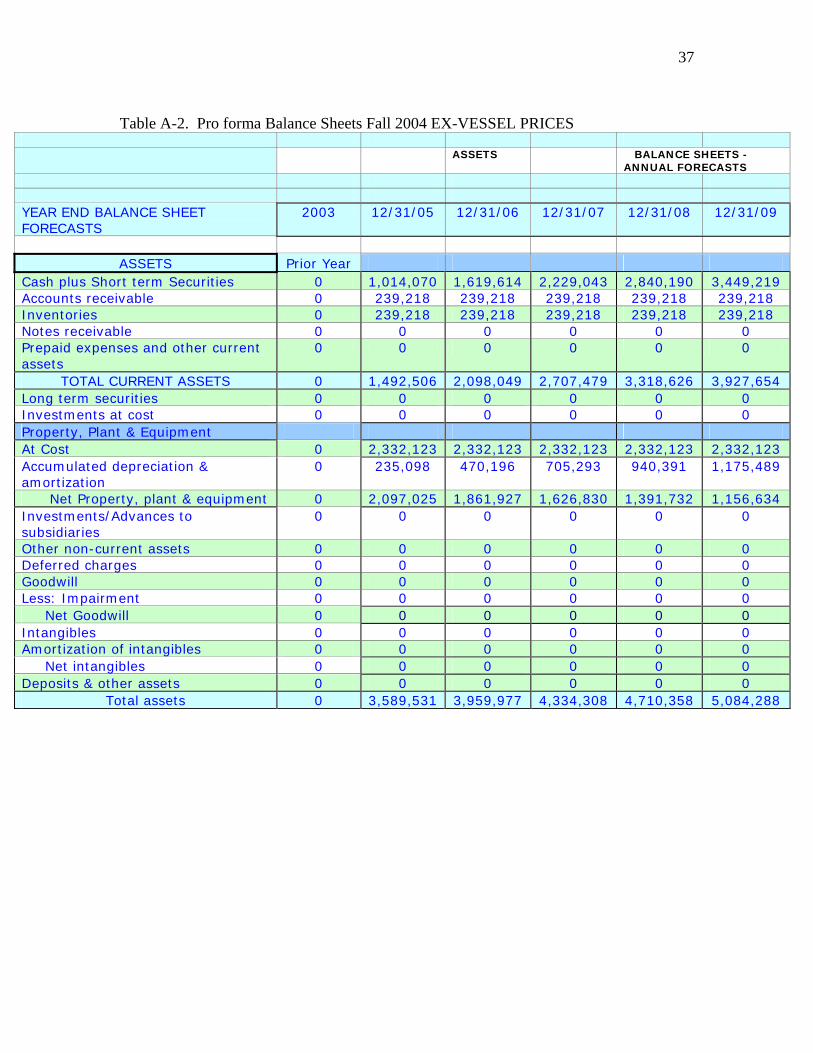
37
Table A-2. Pro forma Balance Sheets Fall 2004 EX-VESSEL PRICES
ASSETS BALANCE SHEETS -
ANNUAL FORECASTS
YEAR END BALANCE SHEET FORECASTS
2003 12/31/05 12/31/06 12/31/07 12/31/08 12/31/09
ASSETS Prior Year
Cash plus Short term Securities 0 1,014,070 1,619,614 2,229,043 2,840,190 3,449,219 Accounts receivable 0 239,218 239,218 239,218 239,218 239,218 Inventories 0 239,218 239,218 239,218 239,218 239,218 Notes receivable 0 0 0 0 0 0 Prepaid expenses and other current assets
0 0 0 0 0 0
TOTAL CURRENT ASSETS 0 1,492,506 2,098,049 2,707,479 3,318,626 3,927,654 Long term securities 0 0 0 0 0 0 Investments at cost 0 0 0 0 0 0 Property, Plant & Equipment At Cost 0 2,332,123 2,332,123 2,332,123 2,332,123 2,332,123 Accumulated depreciation & amortization
0 235,098 470,196 705,293 940,391 1,175,489
Net Property, plant & equipment 0 2,097,025 1,861,927 1,626,830 1,391,732 1,156,634 Investments/Advances to subsidiaries
0 0 0 0 0 0
Other non-current assets 0 0 0 0 0 0 Deferred charges 0 0 0 0 0 0 Goodwill 0 0 0 0 0 0 Less: Impairment 0 0 0 0 0 0 Net Goodwill 0 0 0 0 0 0 Intangibles 0 0 0 0 0 0 Amortization of intangibles 0 0 0 0 0 0 Net intangibles 0 0 0 0 0 0 Deposits & other assets 0 0 0 0 0 0
Total assets 0 3,589,531 3,959,977 4,334,308 4,710,358 5,084,288
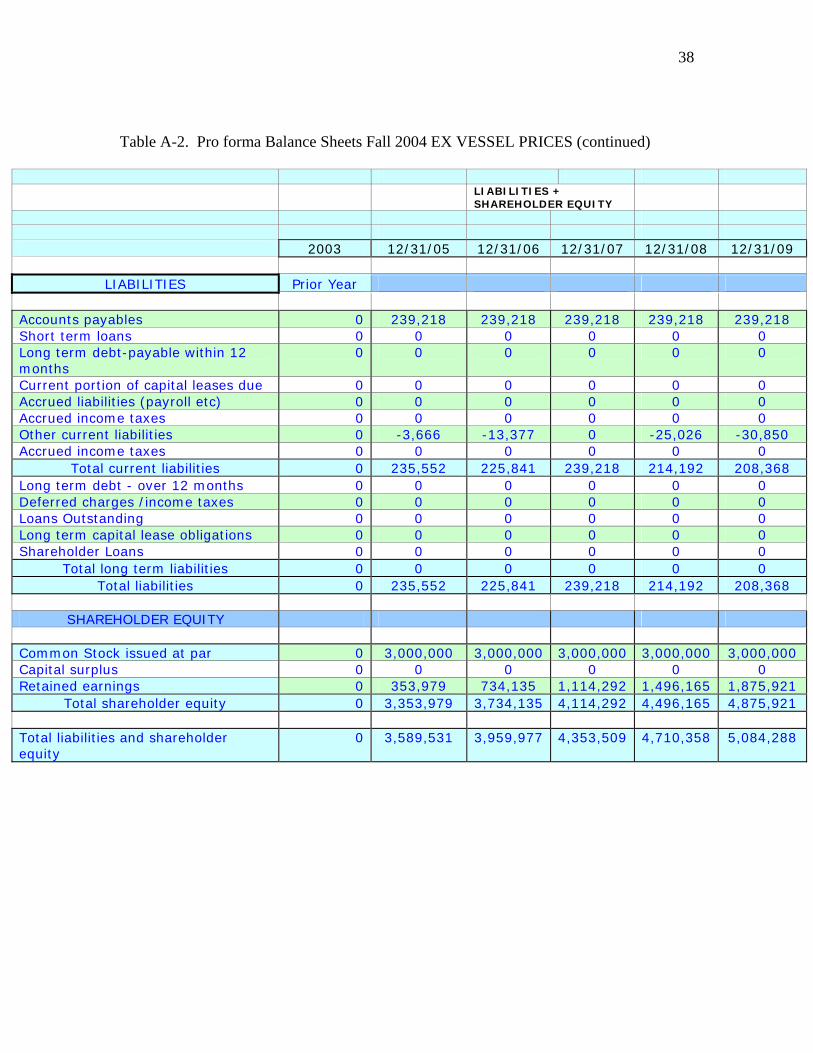
38
Table A-2. Pro forma Balance Sheets Fall 2004 EX VESSEL PRICES (continued)
LIABILITIES +
SHAREHOLDER EQUITY
2003 12/31/05 12/31/06 12/31/07 12/31/08 12/31/09
LIABILITIES Prior Year
Accounts payables 0 239,218 239,218 239,218 239,218 239,218 Short term loans 0 0 0 0 0 0 Long term debt-payable within 12 months
0 0 0 0 0 0
Current portion of capital leases due 0 0 0 0 0 0 Accrued liabilities (payroll etc) 0 0 0 0 0 0 Accrued income taxes 0 0 0 0 0 0 Other current liabilities 0 -3,666 -13,377 0 -25,026 -30,850 Accrued income taxes 0 0 0 0 0 0
Total current liabilities 0 235,552 225,841 239,218 214,192 208,368 Long term debt - over 12 months 0 0 0 0 0 0 Deferred charges /income taxes 0 0 0 0 0 0 Loans Outstanding 0 0 0 0 0 0 Long term capital lease obligations 0 0 0 0 0 0 Shareholder Loans 0 0 0 0 0 0
Total long term liabilities 0 0 0 0 0 0 Total liabilities 0 235,552 225,841 239,218 214,192 208,368
SHAREHOLDER EQUITY
Common Stock issued at par 0 3,000,000 3,000,000 3,000,000 3,000,000 3,000,000 Capital surplus 0 0 0 0 0 0 Retained earnings 0 353,979 734,135 1,114,292 1,496,165 1,875,921
Total shareholder equity 0 3,353,979 3,734,135 4,114,292 4,496,165 4,875,921
Total liabilities and shareholder equity
0 3,589,531 3,959,977 4,353,509 4,710,358 5,084,288
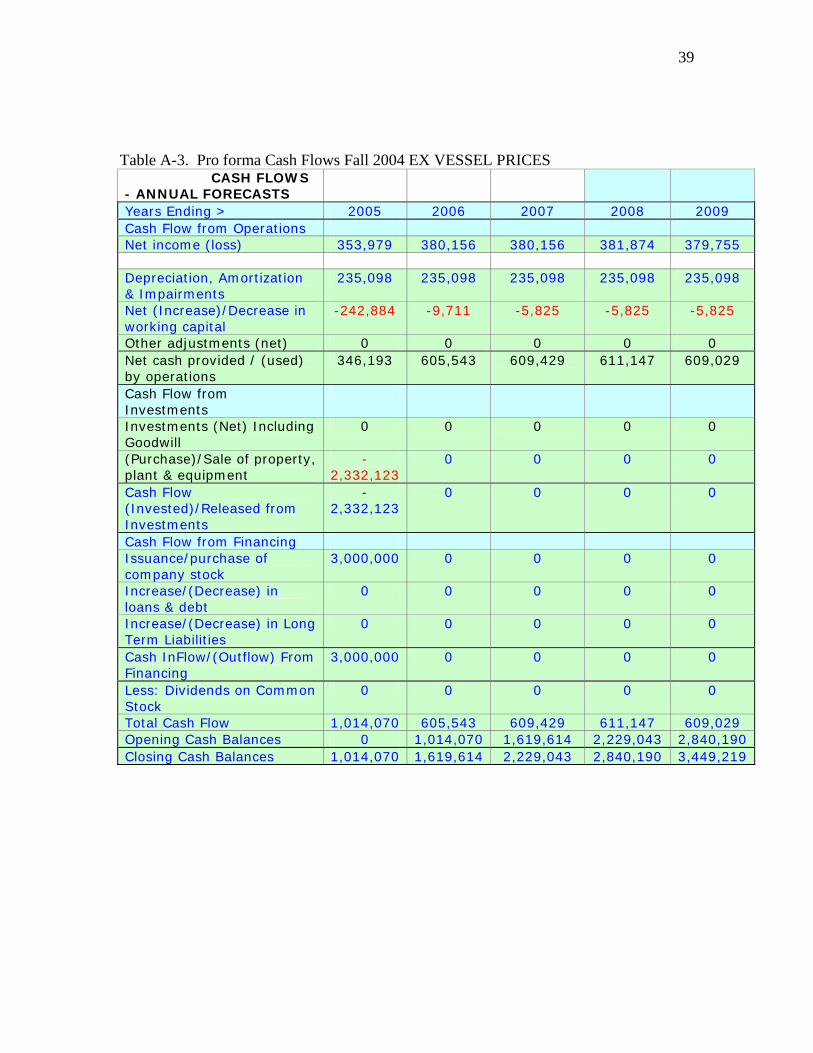
39
Table A-3. Pro forma Cash Flows Fall 2004 EX VESSEL PRICES CASH FLOWS - ANNUAL FORECASTS
Years Ending > 2005 2006 2007 2008 2009 Cash Flow from Operations Net income (loss) 353,979 380,156 380,156 381,874 379,755
Depreciation, Amortization & Impairments
235,098 235,098 235,098 235,098 235,098
Net (Increase)/Decrease in working capital
-242,884 -9,711 -5,825 -5,825 -5,825
Other adjustments (net) 0 0 0 0 0 Net cash provided / (used) by operations
346,193 605,543 609,429 611,147 609,029
Cash Flow from Investments
Investments (Net) Including Goodwill
0 0 0 0 0
(Purchase)/Sale of property, plant & equipment
-2,332,123
0 0 0 0
Cash Flow (Invested)/Released from Investments
-2,332,123
0 0 0 0
Cash Flow from Financing Issuance/purchase of company stock
3,000,000 0 0 0 0
Increase/(Decrease) in loans & debt
0 0 0 0 0
Increase/(Decrease) in Long Term Liabilities
0 0 0 0 0
Cash InFlow/(Outflow) From Financing
3,000,000 0 0 0 0
Less: Dividends on Common Stock
0 0 0 0 0
Total Cash Flow 1,014,070 605,543 609,429 611,147 609,029 Opening Cash Balances 0 1,014,070 1,619,614 2,229,043 2,840,190 Closing Cash Balances 1,014,070 1,619,614 2,229,043 2,840,190 3,449,219
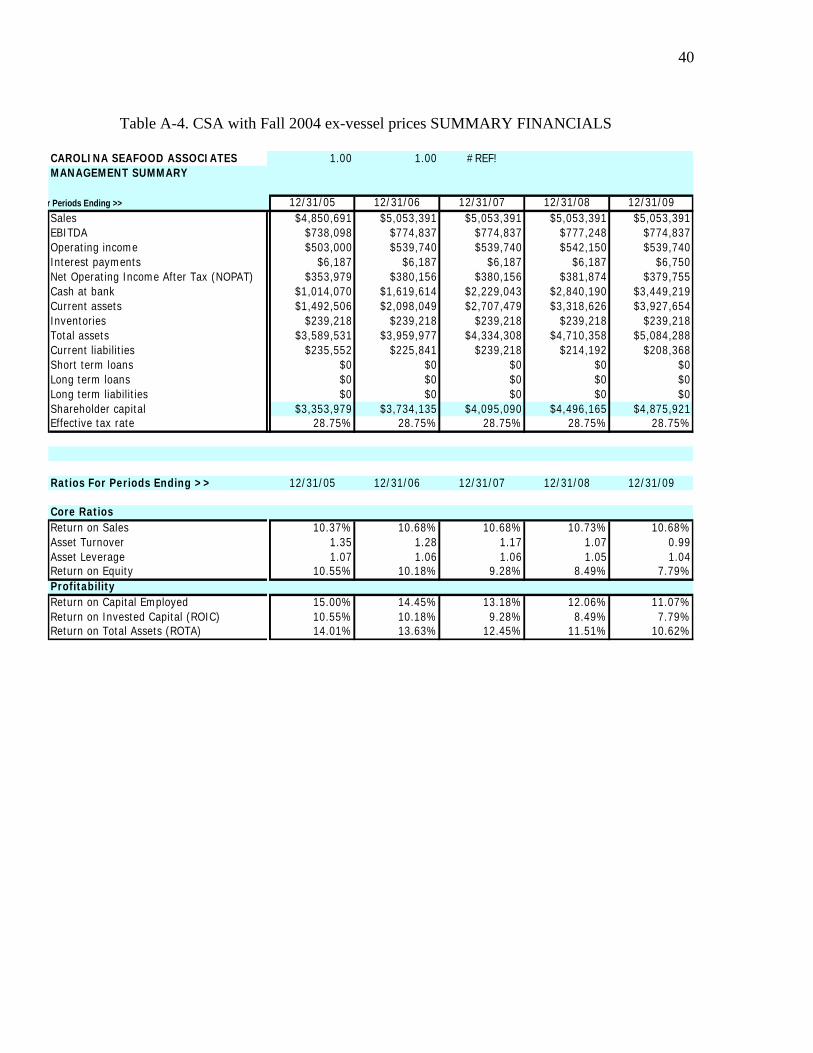
40
Table A-4. CSA with Fall 2004 ex-vessel prices SUMMARY FINANCIALS
CAROLINA SEAFOOD ASSOCIATES 1.00 1.00 #REF!MANAGEMENT SUMMARY
r Periods Ending >> 12/31/05 12/31/06 12/31/07 12/31/08 12/31/09Sales $4,850,691 $5,053,391 $5,053,391 $5,053,391 $5,053,391EBITDA $738,098 $774,837 $774,837 $777,248 $774,837Operating income $503,000 $539,740 $539,740 $542,150 $539,740Interest payments $6,187 $6,187 $6,187 $6,187 $6,750Net Operating Income After Tax (NOPAT) $353,979 $380,156 $380,156 $381,874 $379,755Cash at bank $1,014,070 $1,619,614 $2,229,043 $2,840,190 $3,449,219Current assets $1,492,506 $2,098,049 $2,707,479 $3,318,626 $3,927,654Inventories $239,218 $239,218 $239,218 $239,218 $239,218Total assets $3,589,531 $3,959,977 $4,334,308 $4,710,358 $5,084,288Current liabilities $235,552 $225,841 $239,218 $214,192 $208,368Short term loans $0 $0 $0 $0 $0Long term loans $0 $0 $0 $0 $0Long term liabilities $0 $0 $0 $0 $0Shareholder capital $3,353,979 $3,734,135 $4,095,090 $4,496,165 $4,875,921Effective tax rate 28.75% 28.75% 28.75% 28.75% 28.75%
Ratios For Periods Ending >> 12/31/05 12/31/06 12/31/07 12/31/08 12/31/09
Core RatiosReturn on Sales 10.37% 10.68% 10.68% 10.73% 10.68%Asset Turnover 1.35 1.28 1.17 1.07 0.99Asset Leverage 1.07 1.06 1.06 1.05 1.04Return on Equity 10.55% 10.18% 9.28% 8.49% 7.79%ProfitabilityReturn on Capital Employed 15.00% 14.45% 13.18% 12.06% 11.07%Return on Invested Capital (ROIC) 10.55% 10.18% 9.28% 8.49% 7.79%Return on Total Assets (ROTA) 14.01% 13.63% 12.45% 11.51% 10.62%
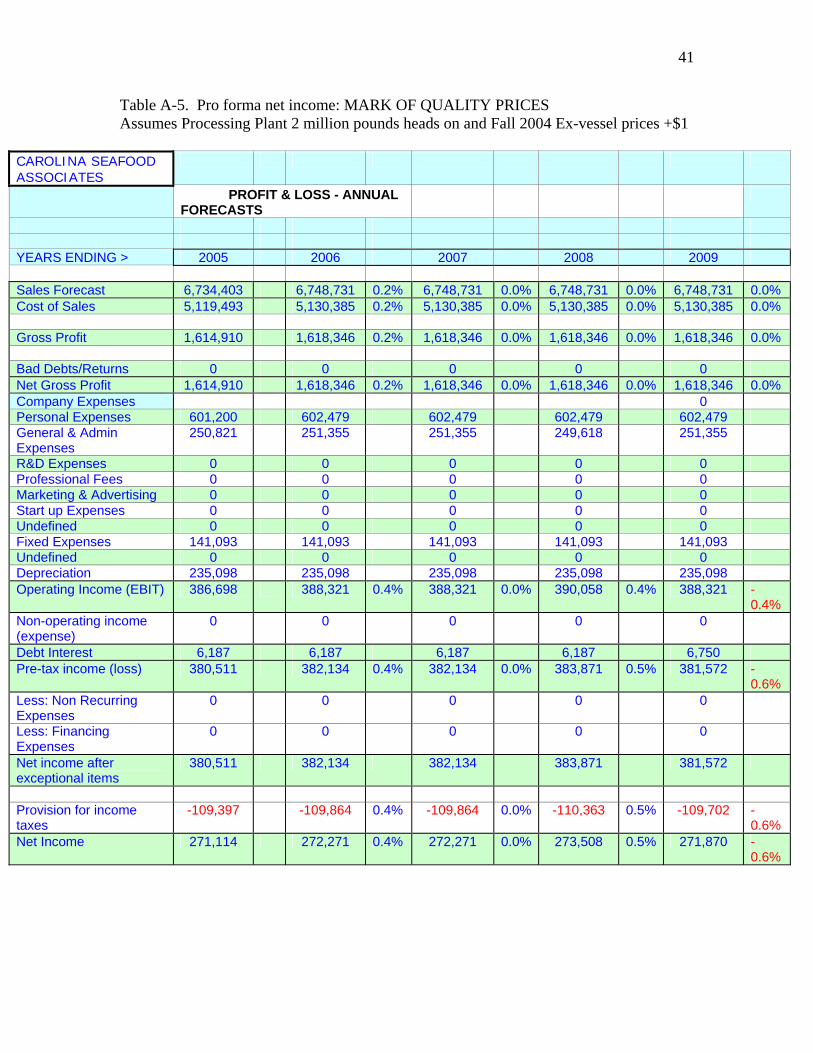
41
Table A-5. Pro forma net income: MARK OF QUALITY PRICES Assumes Processing Plant 2 million pounds heads on and Fall 2004 Ex-vessel prices +$1
CAROLINA SEAFOOD ASSOCIATES
PROFIT & LOSS - ANNUAL FORECASTS
YEARS ENDING > 2005 2006 2007 2008 2009
Sales Forecast 6,734,403 6,748,731 0.2% 6,748,731 0.0% 6,748,731 0.0% 6,748,731 0.0% Cost of Sales 5,119,493 5,130,385 0.2% 5,130,385 0.0% 5,130,385 0.0% 5,130,385 0.0%
Gross Profit 1,614,910 1,618,346 0.2% 1,618,346 0.0% 1,618,346 0.0% 1,618,346 0.0%
Bad Debts/Returns 0 0 0 0 0 Net Gross Profit 1,614,910 1,618,346 0.2% 1,618,346 0.0% 1,618,346 0.0% 1,618,346 0.0% Company Expenses 0 Personal Expenses 601,200 602,479 602,479 602,479 602,479 General & Admin Expenses
250,821 251,355 251,355 249,618 251,355
R&D Expenses 0 0 0 0 0 Professional Fees 0 0 0 0 0 Marketing & Advertising 0 0 0 0 0 Start up Expenses 0 0 0 0 0 Undefined 0 0 0 0 0 Fixed Expenses 141,093 141,093 141,093 141,093 141,093 Undefined 0 0 0 0 0 Depreciation 235,098 235,098 235,098 235,098 235,098 Operating Income (EBIT) 386,698 388,321 0.4% 388,321 0.0% 390,058 0.4% 388,321 -
0.4% Non-operating income (expense)
0 0 0 0 0
Debt Interest 6,187 6,187 6,187 6,187 6,750 Pre-tax income (loss) 380,511 382,134 0.4% 382,134 0.0% 383,871 0.5% 381,572 -
0.6% Less: Non Recurring Expenses
0 0 0 0 0
Less: Financing Expenses
0 0 0 0 0
Net income after exceptional items
380,511 382,134 382,134 383,871 381,572
Provision for income taxes
-109,397 -109,864 0.4% -109,864 0.0% -110,363 0.5% -109,702 -0.6%
Net Income 271,114 272,271 0.4% 272,271 0.0% 273,508 0.5% 271,870 -0.6%
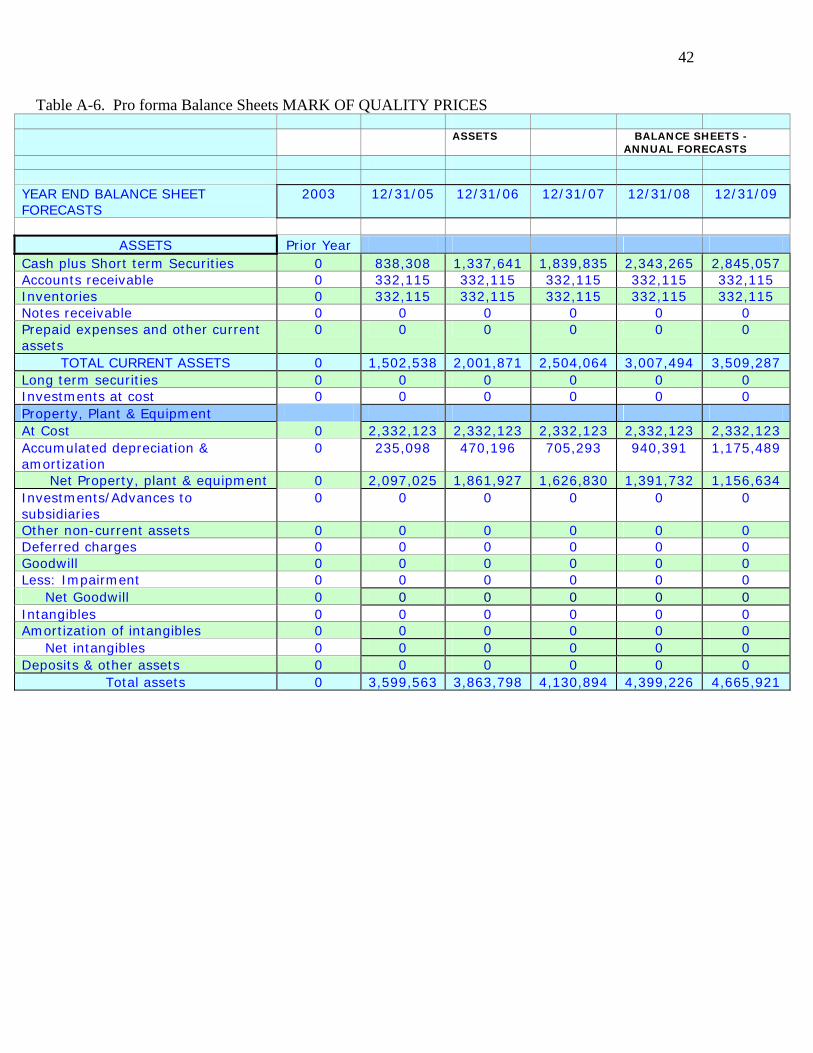
42
Table A-6. Pro forma Balance Sheets MARK OF QUALITY PRICES ASSETS BALANCE SHEETS -
ANNUAL FORECASTS
YEAR END BALANCE SHEET FORECASTS
2003 12/31/05 12/31/06 12/31/07 12/31/08 12/31/09
ASSETS Prior Year
Cash plus Short term Securities 0 838,308 1,337,641 1,839,835 2,343,265 2,845,057 Accounts receivable 0 332,115 332,115 332,115 332,115 332,115 Inventories 0 332,115 332,115 332,115 332,115 332,115 Notes receivable 0 0 0 0 0 0 Prepaid expenses and other current assets
0 0 0 0 0 0
TOTAL CURRENT ASSETS 0 1,502,538 2,001,871 2,504,064 3,007,494 3,509,287 Long term securities 0 0 0 0 0 0 Investments at cost 0 0 0 0 0 0 Property, Plant & Equipment At Cost 0 2,332,123 2,332,123 2,332,123 2,332,123 2,332,123 Accumulated depreciation & amortization
0 235,098 470,196 705,293 940,391 1,175,489
Net Property, plant & equipment 0 2,097,025 1,861,927 1,626,830 1,391,732 1,156,634 Investments/Advances to subsidiaries
0 0 0 0 0 0
Other non-current assets 0 0 0 0 0 0 Deferred charges 0 0 0 0 0 0 Goodwill 0 0 0 0 0 0 Less: Impairment 0 0 0 0 0 0 Net Goodwill 0 0 0 0 0 0 Intangibles 0 0 0 0 0 0 Amortization of intangibles 0 0 0 0 0 0 Net intangibles 0 0 0 0 0 0 Deposits & other assets 0 0 0 0 0 0
Total assets 0 3,599,563 3,863,798 4,130,894 4,399,226 4,665,921
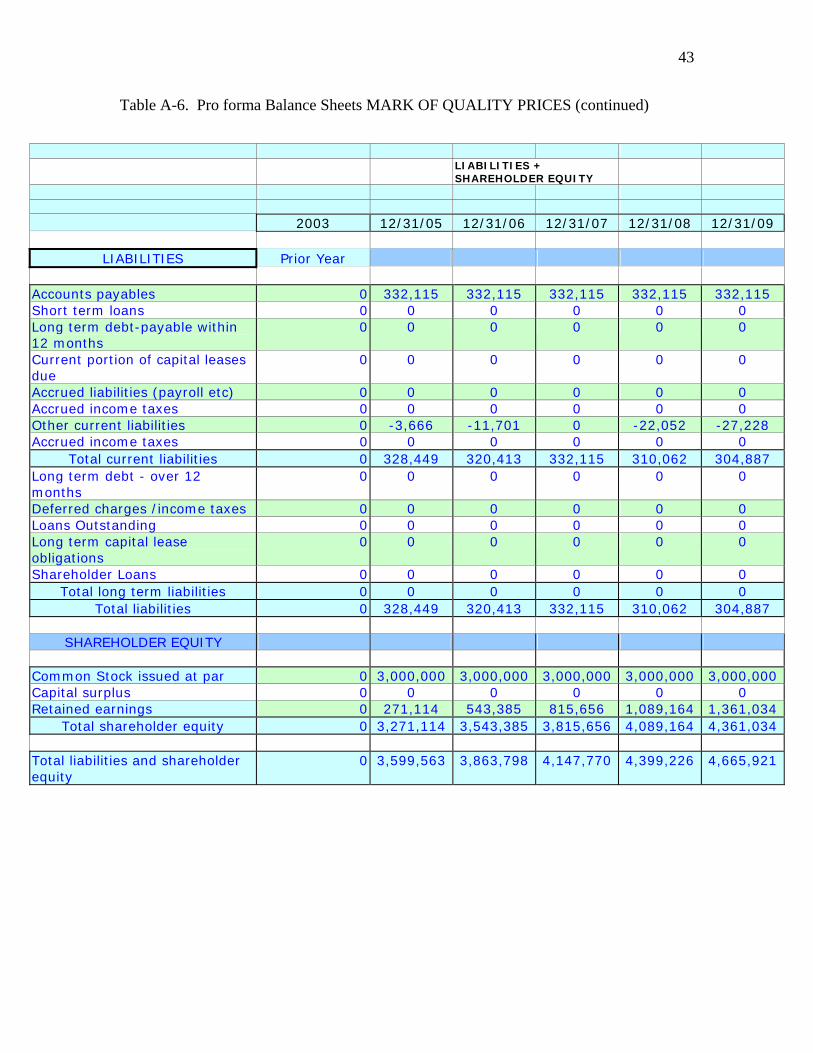
43
Table A-6. Pro forma Balance Sheets MARK OF QUALITY PRICES (continued)
LIABILITIES +
SHAREHOLDER EQUITY
2003 12/31/05 12/31/06 12/31/07 12/31/08 12/31/09
LIABILITIES Prior Year
Accounts payables 0 332,115 332,115 332,115 332,115 332,115 Short term loans 0 0 0 0 0 0 Long term debt-payable within 12 months
0 0 0 0 0 0
Current portion of capital leases due
0 0 0 0 0 0
Accrued liabilities (payroll etc) 0 0 0 0 0 0 Accrued income taxes 0 0 0 0 0 0 Other current liabilities 0 -3,666 -11,701 0 -22,052 -27,228 Accrued income taxes 0 0 0 0 0 0
Total current liabilities 0 328,449 320,413 332,115 310,062 304,887 Long term debt - over 12 months
0 0 0 0 0 0
Deferred charges /income taxes 0 0 0 0 0 0 Loans Outstanding 0 0 0 0 0 0 Long term capital lease obligations
0 0 0 0 0 0
Shareholder Loans 0 0 0 0 0 0 Total long term liabilities 0 0 0 0 0 0
Total liabilities 0 328,449 320,413 332,115 310,062 304,887
SHAREHOLDER EQUITY
Common Stock issued at par 0 3,000,000 3,000,000 3,000,000 3,000,000 3,000,000 Capital surplus 0 0 0 0 0 0 Retained earnings 0 271,114 543,385 815,656 1,089,164 1,361,034
Total shareholder equity 0 3,271,114 3,543,385 3,815,656 4,089,164 4,361,034
Total liabilities and shareholder equity
0 3,599,563 3,863,798 4,147,770 4,399,226 4,665,921
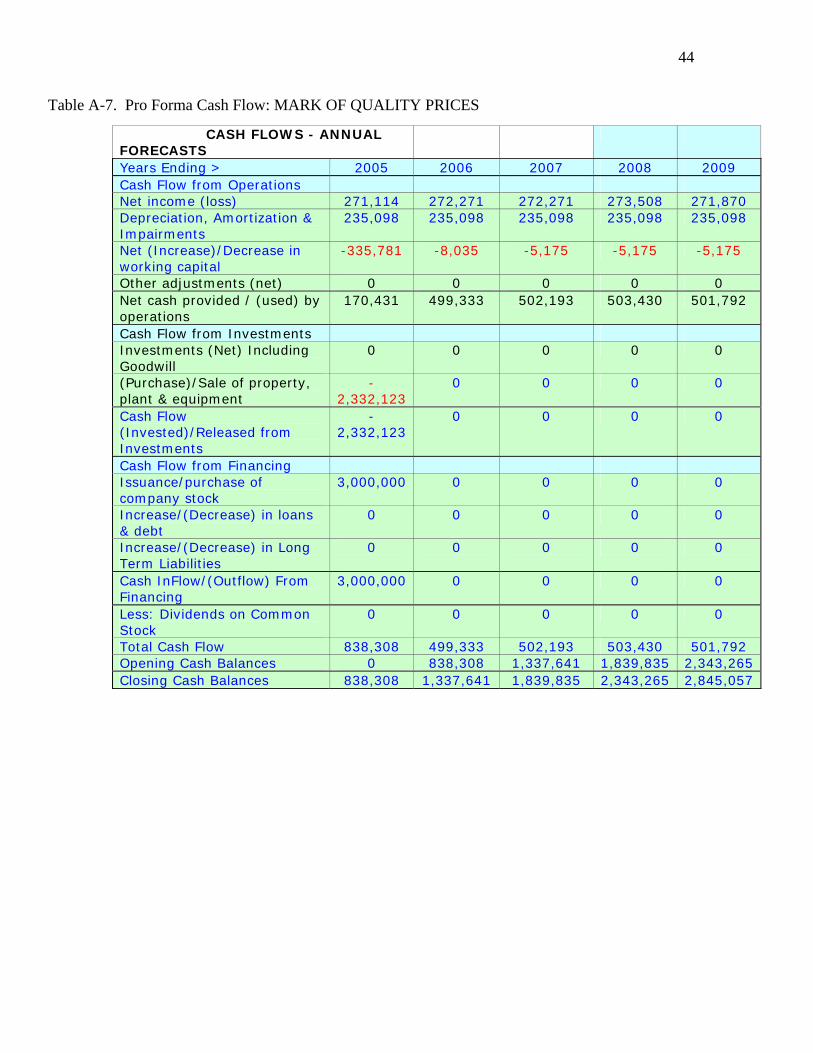
44
Table A-7. Pro Forma Cash Flow: MARK OF QUALITY PRICES
CASH FLOWS - ANNUAL FORECASTS
Years Ending > 2005 2006 2007 2008 2009 Cash Flow from Operations Net income (loss) 271,114 272,271 272,271 273,508 271,870 Depreciation, Amortization & Impairments
235,098 235,098 235,098 235,098 235,098
Net (Increase)/Decrease in working capital
-335,781 -8,035 -5,175 -5,175 -5,175
Other adjustments (net) 0 0 0 0 0 Net cash provided / (used) by operations
170,431 499,333 502,193 503,430 501,792
Cash Flow from Investments Investments (Net) Including Goodwill
0 0 0 0 0
(Purchase)/Sale of property, plant & equipment
-2,332,123
0 0 0 0
Cash Flow (Invested)/Released from Investments
-2,332,123
0 0 0 0
Cash Flow from Financing Issuance/purchase of company stock
3,000,000 0 0 0 0
Increase/(Decrease) in loans & debt
0 0 0 0 0
Increase/(Decrease) in Long Term Liabilities
0 0 0 0 0
Cash InFlow/(Outflow) From Financing
3,000,000 0 0 0 0
Less: Dividends on Common Stock
0 0 0 0 0
Total Cash Flow 838,308 499,333 502,193 503,430 501,792 Opening Cash Balances 0 838,308 1,337,641 1,839,835 2,343,265 Closing Cash Balances 838,308 1,337,641 1,839,835 2,343,265 2,845,057
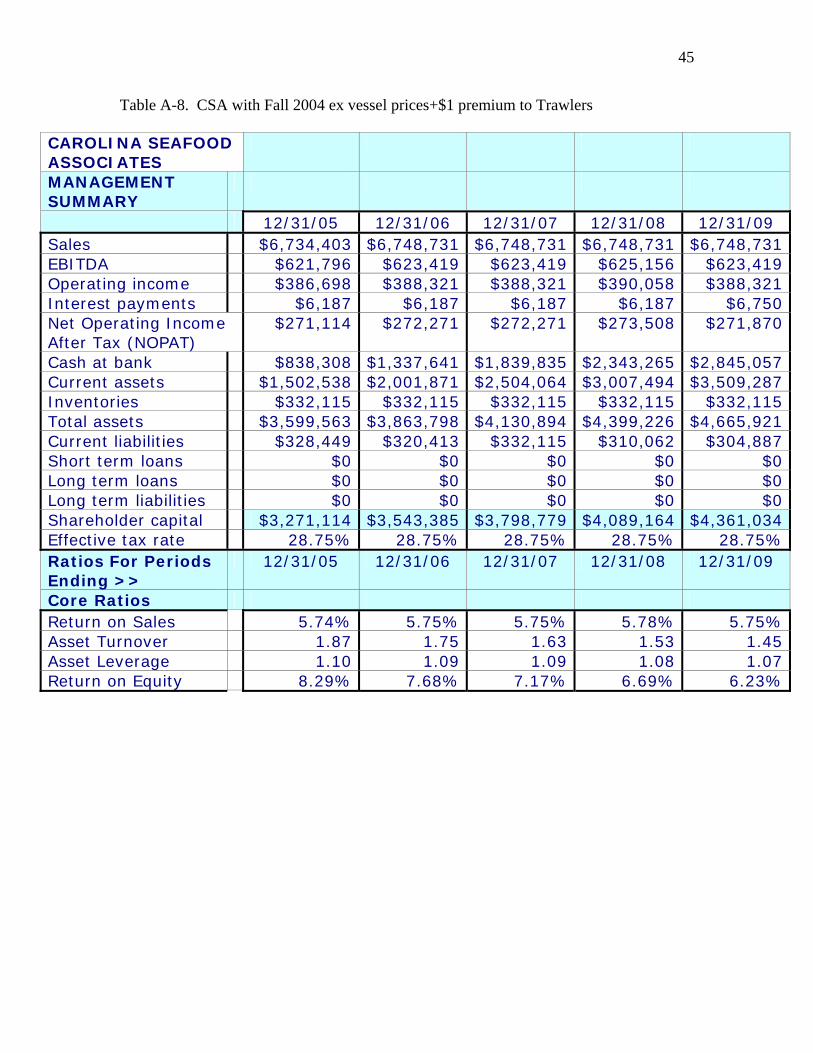
45
Table A-8. CSA with Fall 2004 ex vessel prices+$1 premium to Trawlers
CAROLINA SEAFOOD ASSOCIATES
1.00 1.00 #REF!
MANAGEMENT SUMMARY
12/31/05 12/31/06 12/31/07 12/31/08 12/31/09 Sales $6,734,403 $6,748,731 $6,748,731 $6,748,731 $6,748,731 EBITDA $621,796 $623,419 $623,419 $625,156 $623,419 Operating income $386,698 $388,321 $388,321 $390,058 $388,321 Interest payments $6,187 $6,187 $6,187 $6,187 $6,750 Net Operating Income After Tax (NOPAT)
$271,114 $272,271 $272,271 $273,508 $271,870
Cash at bank $838,308 $1,337,641 $1,839,835 $2,343,265 $2,845,057 Current assets $1,502,538 $2,001,871 $2,504,064 $3,007,494 $3,509,287 Inventories $332,115 $332,115 $332,115 $332,115 $332,115 Total assets $3,599,563 $3,863,798 $4,130,894 $4,399,226 $4,665,921 Current liabilities $328,449 $320,413 $332,115 $310,062 $304,887 Short term loans $0 $0 $0 $0 $0 Long term loans $0 $0 $0 $0 $0 Long term liabilities $0 $0 $0 $0 $0 Shareholder capital $3,271,114 $3,543,385 $3,798,779 $4,089,164 $4,361,034 Effective tax rate 28.75% 28.75% 28.75% 28.75% 28.75% Ratios For Periods Ending >>
12/31/05 12/31/06 12/31/07 12/31/08 12/31/09
Core Ratios Return on Sales 5.74% 5.75% 5.75% 5.78% 5.75% Asset Turnover 1.87 1.75 1.63 1.53 1.45 Asset Leverage 1.10 1.09 1.09 1.08 1.07 Return on Equity 8.29% 7.68% 7.17% 6.69% 6.23%
46
i “Economic theory and a growing body of empirical research have helped to identify characteristics that will increase the likelihood of a successful generic marketing program. With respect to the commodity, there are five basic characteristics that will help generic promotion efforts. First, the commodity in question should be relatively homogeneous. Second, marketing efforts will benefit in instances where the commodity does not lose its identity within marketing channels. Third, marketing efforts will be most successful in instances where the product exhibits clear standards that can be perceived by consumers and these standards should be reasonably stable after purchase. Fourth, generic promotion efforts are likely to be most successful when the number of substitutes is not excessive. Finally, promotional efforts are most successful when increased consumption potentially exists and when consumers have a variety of uses for the targeted commodity.” NMFS (2004, Chap. 4, p. 4). “Industry characteristics that will increase the likelihood of a successful generic promotion program are as follows. First, producers should have common objectives. Second, excessive concentration within the industry can weaken generic promotion efforts. Third, dispersed geographical distribution of producers can hamper generic promotion efforts. Fourth, excessive marketing efforts among brands and for substitute products may diminish the success of promotion efforts. Fifth, unlimited barriers to entry may reduce the long-term effectiveness of marketing. Sixth, the domestic and foreign supply response to rising prices is likely to influence the long-term effectiveness of generic promotion efforts. Finally, adequate current and reserve funds must exist to assure long-term viability of a marketing program.” NMFS (2004, Chap. 4, p. 4).