optiquevqs – towards an ontology-based visual query system for
TRANSCRIPT

OptiqueVQS – Towards an Ontology-based Visual QuerySystem for Big Data
Ahmet Soylu∗
University of OsloOslo, Noway
Martin GieseUniversity of Oslo
Oslo, [email protected]
Ernesto Jimenez-RuizUniversity of Oxford
Oxford, [email protected]
Evgeny KharlamovUniversity of Oxford
Oxford, [email protected]
Dmitry ZheleznyakovUniversity of Oxford
Oxford, [email protected]
Ian HorrocksUniversity of Oxford
Oxford, [email protected]
ABSTRACTA recent EU project, named Optique, with a strong indus-trial perspective, strives to enable scalable end-user accessto Big Data. To this end, Optique employs an ontology-based approach, along with other techniques such as queryoptimisation and parallelisation, for scalable query formu-lation and evaluation. In this paper, we specifically focuson end-user visual query formulation, demonstrate our pre-liminary ontology-based visual query system (i.e., interface),and discuss initial insights for alleviating the affects of BigData.
Categories and Subject DescriptorsH5.2 [[Information Interfaces and Presentation]: UserInterfaces; H5.4 [[Information Interfaces and Presen-tation]: Hypertext/Hypermedia
General TermsDesign, Human Factors
KeywordsVisual Query Systems, Ontologies, Big Data
1. INTRODUCTIONIn an enterprise context, engaging employees directly with
data could substantially increase competitiveness and prof-itability by augmenting the value creation potential (cf. [27]).However, data access is still a major bottleneck for many or-ganisations. This due to the sharp distinction between em-ployees dedicated to extracting data (i.e., database/IT ex-perts, skilled users etc.), and those dedicated to interpreting
∗Corresponding author.
Permission to make digital or hard copies of all or part of this work forpersonal or classroom use is granted without fee provided that copies arenot made or distributed for profit or commercial advantage and that copiesbear this notice and the full citation on the first page. To copy otherwise, torepublish, to post on servers or to redistribute to lists, requires prior specificpermission and/or a fee.MEDES’13 October 28-31, 2013, Neumünster Abbey, LuxembourgCopyright 2013 ACM 978-1-4503-2004-7/10/10 ...$10.00.
and using data (i.e., domain experts, end-users etc.). Sincedomain experts mostly do not posses necessary competencesto formulate queries by using structured query languagessuch as SQL, the following scenarios are commonly practiced(see Figure 1). The first scenario (i.e., simple case) involvesuniform data sources and predefined queries embedded intoapplications; while the second scenario (i.e., complex case)follows a man-in-the-middle approach; domain experts com-municate their information needs to IT experts, who in turntranslate them to formal queries over disparate data sources.The former is limited to the enumeration of possible infor-mation needs, while the latter results in lengthy turn aroundtimes in the range of days to weeks (cf. [10]). Therefore, it isimportant to support domain experts with intuitive and nat-ural visual data access tools for extracting data from legacydata sources.
Visual query formulation (cf. [8]) is built on the idea ofthe direct manipulation (cf. [32]) of visual objects represent-ing the domain elements and is long studied in the litera-ture. However, early approaches mostly suffer from the ab-straction levels they operate on; database schemas, object-oriented models etc. are not meant to capture a domain perse and are not truly natural for end-users. The use of on-tologies as a natural communication medium for end-usersemerged as a prominent approach; however, early attempts(e.g., [9, 1]) remained at experimental stage and did sufferfrom the lack of appropriate frameworks for bridging on-tologies and relational data sources. The picture is almostcomplete with the Semantic Web and ontology-based dataaccess (OBDA) technologies (cf. [29, 22]) that bridge on-tologies and relational data sources. Ontology-based visualquery formulation and data access (e.g., [9, 26]) is still anactive research domain; however, the challenge is further ex-acerbated by the Big Data effect (cf. [24]), which is charac-terised through the volume, complexity, variety, and velocitydimensions of data as well as its schemata. The Big Datanot only introduces efficiency problems for query evaluation,but also perceptual and cognitive problems for visual queryformulation; it becomes harder to communicate and repre-sent large, complex, and varied domain knowledge and datato the end-users.
A recent EU project, named Optique – Scalable End-user

Simple Case
Complex Case
Op.que Solu.on
Applica'on
End-‐user
End-‐user
End-‐user
predefined queries
informa'on need specialized query
Applica'on
Op'que ontology-‐based queries Query Transla'on
translated queries
uniform sources
disparate sources
disparate sources
IT expert
informal
limited
possible mismatch
flexible op'mised
Figure 1: Common data access scenarios in enterprise context and the Optique approach.
Access to Big Data1, strives to alleviate the aforementionedchallenges and employs an ontology-based approach, alongwith other techniques such as query optimisation and par-allelisation, for scalable query formulation and evaluation[12]. The Optique approach for ontology-based visual queryformulation and data access is depicted in Figure 1 (i.e., Op-tique solution) and Figure 2. Users interface with the systemthrough a visual query system (VQS), which is a system ofinteractions, rather than a formal language (i.e., visual querylanguage – VQL), that generates the underlying textual lan-guage – e.g., SPARQL (cf. [11]). The OptiqueVQS relies onan OBDA framework, which is not in the scope of this paper(cf. [12]), that allow access to relational data over ontologies.However, briefly, as depicted in Figure 2, once translatedinto a linguistic structure a query is passed through tworewrite phases to transform it into a complete, correct, andhighly optimised query over data sources (cf. [29, 28]). Thefirst phase rewrites the query by taking ontology constraintsinto account, while the second one translates the query intothe language of underlying data sources (e.g., SQL) throughmappings defined between the ontology and data sources.
The project has two industrial partners, namely Statoil2
and Siemens3, which provide real-life use cases from en-ergy domain. In this paper, we specifically focus on end-user visual query formulation, demonstrate our preliminaryontology-based visual query system OptiqueVQS (i.e., inter-face) over a Statoil use case, and discuss initial insights foralleviating the affects of Big Data. We use the semantic rep-resentation of Norwegian Petroleum Directorate’s database4,that contains public data concerning the petroleum activi-ties on the Norwegian continental shelf (cf. [33]).
The rest of the paper is structured as follows. Section 2provides an elaborate view on challenges and requirementsfor visual query formulation both from a generic and BigData perspective. Section 3 presents the Optique approachand the proposed visual query system, while Section 4 in-troduces the design rationale behind OptiqueVQS. Section5 provides a discussion on OptiqueVQS from expressive-ness and usability point of view and enumerates possibleapproaches to address the Big Data issues. Finally Section6 concludes the paper and provides pointers to other com-ponents that form the OBDA framework of Optique.
1http://www.optique-project.eu2http://www.statoil.com3http://www.siemens.com4http://sws.ifi.uio.no/project/npd-v2/
2. CHALLENGES AND REQUIREMENTSFor a visual query system, expressiveness and usability
form an inclusive frame that spans the main challenges andrequirements (cf. [8]). Expressiveness defines the ability andbreadth of a language or system to characterise the domainknowledge and information need, while usability defines ca-pability of a system to meet its identified aim with effec-tiveness (i.e., doing the right things), efficiency (i.e., doingthe things right), and user-satisfaction (i.e., the perceivedquality of the interface and dialog). There are two typeof data access activities in a visual query formulation sce-nario, which should be elaborated from expressiveness andusability perspectives. These are exploration, which relatesto the activities for understanding and finding schema con-cepts and relationships relevant to information need; and,construction (i.e., formulation), which concerns the compi-lation of relevant concepts and constraints into formal infor-mation needs (cf. [7]).
Concerning expressiveness, for a system or language, apiece of domain knowledge or query type makes value, onlyif end-users need, understand, and use it. Consequently, it isappropriate to approach expressiveness from a user perspec-tive. Therefore, we are primarily interested in the types ofrequests and knowledge that a specific visual query systemor language should accommodate (i.e., necessity/need andpracticality/complexity), rather than the functional capabil-ity of underlying formality and its analysis and development(i.e., ability). Regarding expressiveness in exploration ac-tivities in an ontology-based setting, the main question con-cerns the selection of ontology constructs and semantics thatshould be communicated at the interface level. Some con-structs and semantics are meaningful for aiding users duringquery construction (e.g., disjointness axioms might useful tocommunicate to end-users, since they prevent users to selecttwo disjoint classes for the interpretation of same query vari-able), while on the other hand others might be only mean-ingful at the query answering stage (e.g., transitivity axiomsmight not be valuable to communicate, since end-users areonly interested in the intended meaning rather than its re-alisation). Another concern in this line is the propagativeeffect of semantics (cf. [13]). In an ontology, explicit restric-tions attached to a concept will be inherited by its subcon-cepts (i.e., top-down propagation of property restrictions),and the interpretation of a concept also includes the inter-pretations of all its subconcepts (i.e., bottom-up propagationof property restrictions). Therefore, for a given concept, it

SQL REWRITE REWRITE
Ontology (OWL) mappings
Q QI
disparate sources Visual Query System
End-‐user SPARQL SPARQL
QII
query transforma5on
Siemens (GBs/day)
Statoil (GBs/day)
Energy Turbines
Petroleum ExploraEon
Expressivity Usability
User
System
Explore Construct
IT expert
RDBMS (TBs)
Figure 2: Ontology-based visual query formulation and ontology-based data access.
may also make sense to suggest the (potential) restrictionsof its subconcepts and superconcepts. However, it becomeschallenging, since the amount of information to communi-cate increases drastically. Regarding expressiveness in con-struction activities, queries can be considered in differenttopological forms, such as linear queries and queries withbranching. The latter includes conjunctive queries and dis-junctive queries that include path expressions merged withAND connective and OR connective respectively. Anothernotable form is cyclic queries, in which at least two exis-tentially quantified independent variables range on the in-terpretation of the same concept-node in the ontology graph(cf. [8]). There are also query types for which there is no sim-ple way to formulate them purely with the aforementionedtopological forms, such as queries with quantification (i.e.,universal and existential), negation, and aggregation (e.g.,count, sum, max etc.). The overall challenge here is to findan appropriate compromise between the need and complex-ity, that is only supporting the classes of queries, which arereasonably complex for end-users and do address substantialamount of information needs.
Concerning usability, the challenge is to select and inter-twine representation metaphors, visual attributes, and inter-action styles that require less knowledge, skills and learningeffort, and allow users to discern, comprehend, and commu-nicate the maximum amount of information effortlessly. On-tology visualisation techniques and approaches play a crucialrole in this context (cf. [17]). However, the Big Data effect,which not only concerns data but also its schemata, impedesthe use of visual query systems and languages. Primar-ily, the volume and complexity of domain knowledge (e.g.,schema, ontology etc.) hinders human perception and cog-nition respectively. Secondly, the variety raises the need formore domain-specific presentations and interaction experi-ences adapted to data at hand at any moment, while thevelocity dimension requires data access systems to addressreactive scenarios, where data is automatically detected, as-sessed and acted upon. Such reactive scenarios likely to in-volve queries that do not have any matching results at thetime of authoring but are supposed to detect future possibleoccurrences (e.g., data that describes a fault). A data accesssystem should provide a wide range of support for situatingand orienting users in the conceptual space in order to helpthem to understand and make use of data, and it should beintegrated and adapted to context, such as personal, data-related, task-related, organisational, and environmental. Re-
garding the usability dimension in exploration activities, thevolume and complexity mostly matter in terms of schematarather than the data, since users interact with the systemprimarily at a conceptual level. Exploration with a largenumber of concepts, relationships, and attributes with highcomplexity is a hard problem, since the presentation couldeasily become overcrowded and cluttered and prevent userto reach an overall understanding. The high variety andvelocity have implications on data access systems at explo-ration stage. Specific representations that are best suitedto the nature of data at hand, along with generic presenta-tion facilities, are required to better communicate and in-teract with different types of data. It is also important toallow end-users to explore a domain at instance level in or-der to help them to gain insights on the underlying data.Regarding the usability of construction, the challenge is toguide users to their targets with minimum amount of devi-ations and backtracks. The largeness of domain knowledgetogether with top-down and bottom-up propagation of prop-erty restrictions, that we have discussed previously, increasethe number of possibilities enormously. At any step of queryconstruction, the users are confronted with high number ofconcepts and properties to choose from. This reduces theability of users to quickly decide on the next step. Anotherchallenge is to drive user attention, which is a precious re-source, within the large streams of data (cf. [27]), so thatvaluable data fragments could be exploited. Finally, the us-ability of an ontology, which steers the interface, is an impor-tant consideration. Yet, the usability aspects of ontologiesremain unnoticed to a large extent; the mismatch/gap be-tween users’ understanding of domain and an ontology couldeasily hamper the success of a well-designed interface.
Overall, from the expressiveness perspective, one shouldrealise that a visual query system or language, meant fornaive end-users, should primarily match the level of usersand therefore is likely to be less expressive than the under-lying formal linguistic language (e.g., SPARQL). From us-ability perspective, a visual query system should drive thecapabilities of the output medium and human visual systemat an optimum level, while bridging the gap between thedomain representation and user mental model.
3. OPTIQUE APPROACHOptiqueVQS is designed as a user-interface (UI) mashup
built on widgets. A UI mashup aggregates different applica-

Figure 3: OptiqueVQS – an example query is depicted for the Statoil use case.
tions into a common graphical space and orchestrates themfor common goals (cf. [34]). Widgets5 are the buildingblocks of our VQS and refer to portable, self-contained, full-fledged, and mostly client side applications with limited func-tionality and complexity. Widgets in our system communi-cate with each other by delivering events, generated by useractions, through a client-side communication channel. Eachwidget reacts to events either in a preprogrammed way or byconsidering the semantic and syntactic signatures of events.
We initially have three widgets in our system as depictedin Figure 3. The first widget (W1 - see the bottom-leftpart of Figure 3) is a menu-based query by navigation wid-get and allows users to navigate concepts through pursu-ing relationships between them, hence joining relations in adatabase. The second widget (W2 - see the bottom-rightpart of Figure 3) is a form-based widget, which presents theattributes of a selected concept for selection and projectionoperations. The third widget (W3 - see the top part of Fig-ure 3) is a diagram-based widget and provides an overviewof the constructed query and affordances for manipulation.These three widgets are orchestrated by the system, throughharvesting event notifications generated by each widget as auser interacts, to jointly extract and represent the informa-tion need of a user.
In a typical query construction scenario, a user first se-lects a kernel concept, i.e., the starting concept, from W1,which initially lists all domain concepts accompanied withicons, descriptions, and the potential/approximate numberof results. The selected concept becomes the focus/pivotconcept (i.e., the node coloured in orange or highlighted),appears on the graph (i.e., W3) as a variable-node, W2 dis-plays its attributes, and W1 displays all concept-relationship
5http://www.w3.org/TR/widgets/
pairs pertaining to this concept. The user can select at-tributes to be included in the result list (i.e., using the “eye”button) and/or impose constraints on them through formelements (i.e., W2). Currently, the attributes selected foroutput appear on the corresponding variable-node in blackwith a letter “o”, while constrained attributes appear in bluewith letter “c”. Note that W1 does not purely present rela-tionships, but combine relationship and concept pairs (i.e.,relationship and range) into one selection; this helps us to re-duce the number of navigational levels that a user has to passthrough. The user can select any available option from thelist, which results in a join between two variable-nodes overthe specified relationship and moves focus to the selectedconcept (i.e., pivot). The user has to follow the same stepsto involve new concepts in the query and can always jump toa specific part of the query by clicking on the correspondingvariable-node. The arcs that connect variable-nodes do nothave any direction, since for each active node only outgoingrelationships, including inverse relationships, are presentedfor selection in W1; this allows queries to be always readfrom left to right. In W3, we employ node duplication ap-proach for cyclic queries for the sake of having tree-shapedrepresentations for queries, hence avoiding graph representa-tion, which might be complex for end-users to comprehend.An example query is depicted in Figure 3 for the Statoil usecase. The query asks for all fields that contain an oil pro-ducing facility and are operated by the Statoil company. Inthe output, we would like to see the name of the field andthe name of the facility.
The user can delete nodes by switching to delete mode orassert that two variable-nodes indeed refer to same variable(i.e., cyclic query). Affordances for these are provided bythe buttons at the bottom-left part of the W3. The user

can also switch to SPARQL mode and see the textual fromof the query by clicking on “SPARQL Query” button at thebottom-right part of the W3 as depicted in Figure 4. Theuser can keep interacting with the system in textual formand continue to formulation process by interacting with thewidgets. For this purpose, pivot/focus node is highlightedand every variable-node is made clickable to allow users tochange focus. Currently, the textual SPARQL query is non-editable and is for didactical purposes, so that advancedend-users, who are eager to learn the textual query language,could switch between two modes and see the new query frag-ments added after each interaction. There are also plansfor enabling users to edit the query text in SPARQL mode,which is discussed in Section 5.
An extensive demo of the previous prototype (the SPARQLview is not included) is available online6 as a video.
4. DESIGN RATIONALEThe current design of the interface and architecture is
meant to address core requirements and to provide a goodbasis for the accommodation of others. As stated earlier, weintentionally opt for a visual query system rather than a for-mal visual query language, since a system-based approachcould provide more possibilities in terms of usability and ex-pressivity than a language-based approach. This is becausea systemic approach allows us to avoid rigid boundaries of aformal language and places less burden on users by relyingon their general semantic knowledge (i.e., on manipulatingobjects and computer interaction) rather than their abilityto learn new language and syntax (cf. [32]).
The visual representation and interaction paradigms (cf.[8]), along with underlying metaphors, analogies etc., are ofprimary importance for a VQS. We have observed that asingle representation and interaction paradigm is not suffi-cient for addressing main data access activities, i.e., explo-ration and construction, at an acceptable level of expres-siveness and usability. Therefore, we strive to combine thebest parts of different paradigms for developing a successfulquery formulation interface. The architectural choice of Op-tique plays a crucial role in this respect, a mashup approachbuilt on widgets is meant to ensure flexibility and extensi-bility, so that we can combine different representation andinteraction styles. The core benefits of such an approach arethat it becomes easier to deal with the complexity, since themanagement of functionality and data could be delegated todifferent widgets; each widget could employ a different repre-sentation paradigm that best suits its functionality; widgetscould be used alone or together, in different combinations,for different contexts and experiences; and the functional-ity of the overall interface could be extended by introducingnew widgets.
Although a limited amount work exists on ontology-basedvisual query formulation, the large amount of work on linkeddata browsing and search, available in the Semantic Web do-main, provides considerable feedback for the design choicesunderlying OptiqueVQS (cf. [3]). Faceted search (cf. [37])and Query by Navigation (QbN) (cf. [36]) are prominent ap-proaches in this respect. Faceted search, being an advancedform-based approach, is based on series of orthogonal di-mensions that can be applied in combination to filter theinformation space; each dimension, called facet, corresponds
6http://sws.ifi.uio.no/project/optique/pubshare/medes2013/
to a taxonomy. In its most common form, each facet optionis accompanied with the number of accessible instances upona possible selection. This is to prevent users from reachingempty result sets. QbN exploits the graph-based organisa-tion of information to allow users to construct queries bytraversing the relationships between concepts. Each navi-gation from one concept to another is indeed a join opera-tion. Actually, end-users are quite familiar with both typesof search approaches; faceted search is widely used in com-mercial websites such as eBay and Amazon for listing andfiltering products, while the navigation is the backbone ofweb browsing. Tabulator [2] and SEWASIE project [9], andFlamenco [39] and mSpace [31] are well-known examples ofQbN and faceted search respectively. The examples of QbNprovide weak or no support for select and projection opera-tions; similarly the examples of faceted search do not providesufficient support for joining concepts. Hybrids of both arealso available and combine the power of both paradigms,such as VisiNav [15] and OZONE [35]. Nevertheless, theseapproaches, due to their nature, are highly explorative andinstance oriented. That is, firstly, the navigation is mostlyfor data browsing purposes; a final query, which encompassesthe visited concepts, is not generated. Hence, there is noclear distinction between explorative and constructive useractions and there is a lack of support for view (i.e., the ac-tive phase of a query task) and overview (i.e., the generalsnapshot of a query task). Secondly, frequent interactionwith the data is required (i.e., database-intensive), which isproblematic with large scale data sources.
Although aforementioned works do not address exactlysame research challenge and the domain, they already offera lot in terms of their success with end-users and form abasis for comparison. The interface described in this paperadapts and improves basic and core techniques from theseworks. Concerning the interface design, from a holistic per-spective, OptiqueVQS aims to provide a clear distinctionand support for view and overview. In this context, W3constantly provides an overview of the query, while W1 andW2, always being focused on a certain concept, enable usersto iteratively formulate their queries. Concerning widgets onan individual basis, representation and interaction styles areof crucial importance (cf. [8, 17]). W1 follows a list/menu-based representation style and enables us to present consid-erably higher number of items to the users in an effectiveand efficient manner. End-users are expected to be famil-iar with the navigational interaction style employed by W1as stated earlier (cf. [36]). The form-based representationstyle and range selection interaction style employed by W2are well-known by the end-users and known to be intuitive(cf. [8]). We provide only a limited amount of faceted searchflavour, since frequent database access is not feasible in ourcontext. Finally, the diagram-based approach employed byW3 is good at communicating relationships over a spatialdimension and provides an intuitive overview (cf. [17]).
5. DISCUSSION AND OUTLOOKAn ontology-based visual query system falls into category
of ontology-driven information systems (cf. [30]) and visualquery formulation is an end-user development/programmingpractice (cf. [23]). The challenge is one of usability andwe believe that ontologies have a lot to offer in this re-spect. Although OptiqueVQS relies on an OBDA frame-work, by principle it is suitable for any graph-based data
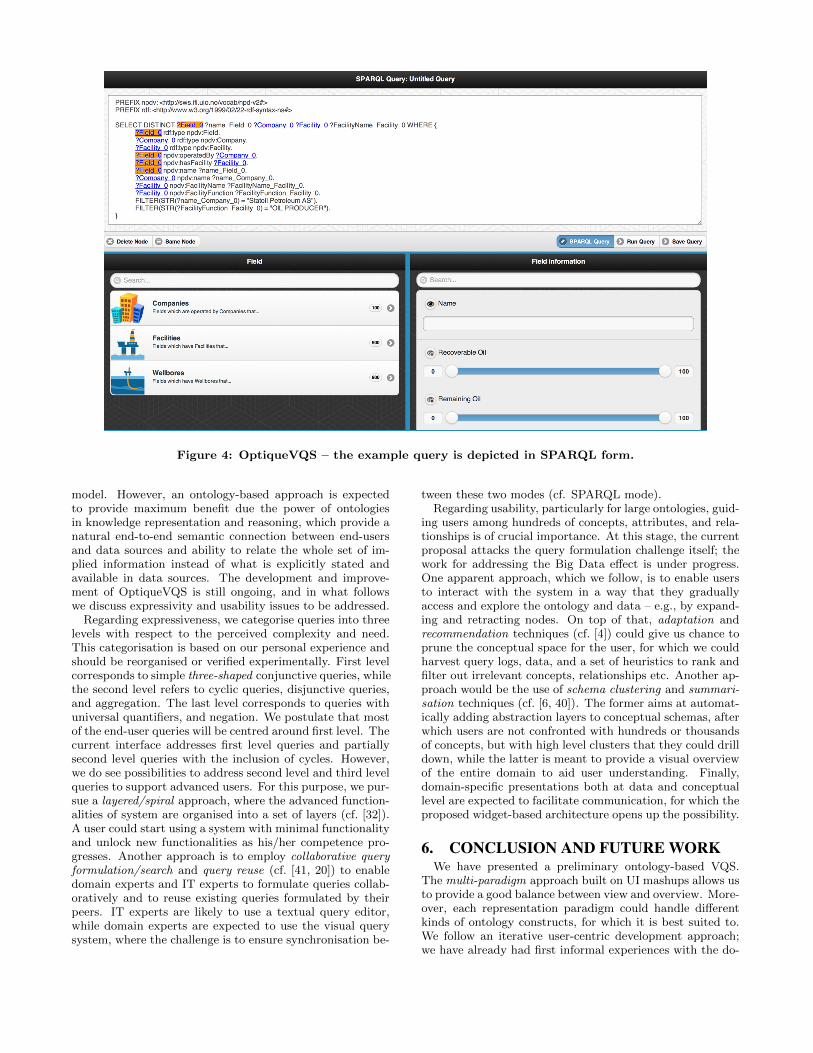
Figure 4: OptiqueVQS – the example query is depicted in SPARQL form.
model. However, an ontology-based approach is expectedto provide maximum benefit due the power of ontologiesin knowledge representation and reasoning, which provide anatural end-to-end semantic connection between end-usersand data sources and ability to relate the whole set of im-plied information instead of what is explicitly stated andavailable in data sources. The development and improve-ment of OptiqueVQS is still ongoing, and in what followswe discuss expressivity and usability issues to be addressed.
Regarding expressiveness, we categorise queries into threelevels with respect to the perceived complexity and need.This categorisation is based on our personal experience andshould be reorganised or verified experimentally. First levelcorresponds to simple three-shaped conjunctive queries, whilethe second level refers to cyclic queries, disjunctive queries,and aggregation. The last level corresponds to queries withuniversal quantifiers, and negation. We postulate that mostof the end-user queries will be centred around first level. Thecurrent interface addresses first level queries and partiallysecond level queries with the inclusion of cycles. However,we do see possibilities to address second level and third levelqueries to support advanced users. For this purpose, we pur-sue a layered/spiral approach, where the advanced function-alities of system are organised into a set of layers (cf. [32]).A user could start using a system with minimal functionalityand unlock new functionalities as his/her competence pro-gresses. Another approach is to employ collaborative queryformulation/search and query reuse (cf. [41, 20]) to enabledomain experts and IT experts to formulate queries collab-oratively and to reuse existing queries formulated by theirpeers. IT experts are likely to use a textual query editor,while domain experts are expected to use the visual querysystem, where the challenge is to ensure synchronisation be-
tween these two modes (cf. SPARQL mode).Regarding usability, particularly for large ontologies, guid-
ing users among hundreds of concepts, attributes, and rela-tionships is of crucial importance. At this stage, the currentproposal attacks the query formulation challenge itself; thework for addressing the Big Data effect is under progress.One apparent approach, which we follow, is to enable usersto interact with the system in a way that they graduallyaccess and explore the ontology and data – e.g., by expand-ing and retracting nodes. On top of that, adaptation andrecommendation techniques (cf. [4]) could give us chance toprune the conceptual space for the user, for which we couldharvest query logs, data, and a set of heuristics to rank andfilter out irrelevant concepts, relationships etc. Another ap-proach would be the use of schema clustering and summari-sation techniques (cf. [6, 40]). The former aims at automat-ically adding abstraction layers to conceptual schemas, afterwhich users are not confronted with hundreds or thousandsof concepts, but with high level clusters that they could drilldown, while the latter is meant to provide a visual overviewof the entire domain to aid user understanding. Finally,domain-specific presentations both at data and conceptuallevel are expected to facilitate communication, for which theproposed widget-based architecture opens up the possibility.
6. CONCLUSION AND FUTURE WORKWe have presented a preliminary ontology-based VQS.
The multi-paradigm approach built on UI mashups allows usto provide a good balance between view and overview. More-over, each representation paradigm could handle differentkinds of ontology constructs, for which it is best suited to.We follow an iterative user-centric development approach;we have already had first informal experiences with the do-

main experts (i.e., end-users) of Statoil. Early impressionssuggest that the overall approach is promising and end-usersare able to use OptiqueVQS. Some minor improvements aresuggested not only at interface level, but also at the onto-logical level, which is inline with our claim on the usabilityof ontologies. Formal experiments are planned to be exe-cuted on non-employee users first (e.g., students) and lateron employees after the first cycle of revisions, since the timeof domain experts are scarce and valuable.
Future work not only includes improvements concerningexpressiveness and Big data affect, but also the developmentof components (i.e., widgets) for exploring domain both ata conceptual and data level (cf. [38, 25]). Currently, Op-tiqueVQS does not provide any explicit support for the ex-ploration of ontology and underlying data. Exploration sup-port is planned to be in two categories: the first categoryrefers to interactive visualisation support, scalable to largeontologies, that allows users to gradually explore the ontol-ogy and underlying data (i.e., ontology visualisation); andthe second category refers to meta-visualisations that sum-marise the ontology and data in order to provide users withgeneric insights about conceptual space and underlying data(i.e., tag-clouds, network visualisations etc.).
Finally, we would like to provide interested readers withthe entry points to the work on different components of Op-tique, which all together form the OBDA framework for BigData. The Optique framework includes components for on-tology and mapping management, time and streams, querytransformation, and distributed query execution. The on-tology and mapping management component includes boot-strapping the ontology and mappings from existing schemasand models, mapping analysis and transformation, and sup-porting evolution and maintenance of the ontology and map-pings (cf. [14]). The query transformation component is re-quired to provide rewriting-based query answering over on-tologies and optimisation with respect to the data source(s)(cf. [5]). The time and streams component is to supportscalable temporal query answering, continuous query an-swering over streams of data, and stream-based event recog-nition (cf. [16]). Last but not the least, the distributedquery execution component will provide distributed tech-niques for query planning and execution for one-time andcontinuous/streaming and temporal queries that scale toTBs of data (cf. [21]). The detailed description of the Op-tique, its architectural description, and the demos of afore-mentioned components can be found in [12, 19, 18].
7. ACKNOWLEDGMENTSThis research is funded by the Seventh Framework Pro-
gram (FP7) of the European Commission under Grant Agree-ment 318338, “Optique”. We would like to thank Martin G.Skjæveland for his help in preparing the dataset of NPD.
8. REFERENCES[1] G. Barzdins, E. Liepins, M. Veilande, and M. Zviedris.
Ontology Enabled Graphical Database Query Tool forEnd-Users. In Eighth International Baltic Conferenceon Databases and Information Systems (DB&IS 2008),volume 187 of Frontiers in Artificial Intelligence andApplications, pages 105–116. IOS Press, 2009.
[2] T. Berners-Lee, Y. Chen, L. Chilton, D. Connolly,R. Dhanaraj, J. Hollenbach, A. Lerer, and D. Sheets.
Tabulator: Exploring and Analyzing linked data onthe Semantic Web. In 3rd International Semantic WebUser Interaction Workshop (SWUI 2006), 2006.
[3] C. Bizer, T. Heath, and T. Berners-Lee. Linked Data -The Story So Far. International Journal on SemanticWeb and Information Systems, 5(3):1–22, 2009.
[4] P. Brusilovsky, A. Kobsa, and W. Nejdl, editors. Theadaptive web: methods and strategies of webpersonalization. Springer-Verlag, Berlin, Heidelberg,2007.
[5] D. Calvanese, I. Horrocks, E. Jimenez-Ruiz,E. Kharlamov, M. Meier, M. Rodriguez-Muro, andD. Zheleznyakov. On Rewriting and AnsweringQueries in OBDA Systems for Big Data (ShortPaper). In OWL Experiences and Directions Workshop(OWLED 2013), 2013.
[6] L. J. Campbell, T. A. Halpin, and H. A. Proper.Conceptual schemas with abstractions making flatconceptual schemas more comprehensible. Data &Knowledge Engineering, 20(1):39–85, 1996.
[7] T. Catarci. What happened when databaseresearchers met usability. Information Systems,25(3):177–212, 2000.
[8] T. Catarci, M. F. Costabile, S. Levialdi, andC. Batini. Visual query systems for databases: Asurvey. Journal of Visual Languages and Computing,8(2):215–260, 1997.
[9] T. Catarci, P. Dongilli, T. Di Mascio, E. Franconi,G. Santucci, and S. Tessaris. An ontology based visualtool for query formulation support. In 16th EuropeanConference on Artificial Intelligence (ECAI 2004),volume 110 of Frontiers in Artificial Intelligence andApplications, pages 308–312. IOS Press, 2004.
[10] J. Crompton. Keynote talk, the W3C Workshop onSemantic Web in Oil & Gas Industry: Houston, TX,USA, 9–10 December, 2008. available fromhttp://www.w3.org/2008/12/ogws-slides/Crompton.pdf.
[11] R. G. Epstein. The TableTalk Query Language.Journal of Visual Languages and Computing,2(2):115–141, 1991.
[12] M. Giese, D. Calvanese, I. Horrocks, Y. Ioannidis,H. Klappi, M. Koubarakis, M. Lenzerini, R. Moller,O. Ozcep, M. Rodriguez Muro, R. Rosati, R. Schlatte,A. Soylu, and A. Waaler. Scalable End-user Access toBig Data. In A. Rajendra, editor, Big DataComputing. Chapman and Hall/CRC, 2013.
[13] B. C. Grau, M. Giese, I. Horrocks, T. Hubauer,E. Jimenez-Ruiz, E. Kharlamov, M. Schmidt,A. Soylu, and D. Zheleznyakov. Towards QueryFormulation and Query-Driven Ontology Extensionsin OBDA Systems. In OWL Experiences andDirections Workshop (OWLED 2013), 2013.
[14] P. Haase, I. Horrocks, D. Hovland, T. Hubauer,E. Jimenez-Ruiz, E. Kharlamov, J. Kluwer, C. Pinkel,R. Rosati, V. Santarelli, A. Soylu, andD. Zheleznyakov. Optique System: Towards Ontologyand Mapping Management in OBDA Solutions. InWorkshop on Debugging Ontologies and OntologyMappings (WoDOOM 2013), volume 999 of CEURWorkshop Proceedings. CEUR-WS.org, 2013.
[15] A. Harth. VisiNav: A system for visual search and

navigation on web data. Journal of Web Semantics,8(4):348–354, 2010.
[16] I. Horrocks, T. Hubauer, E. Jimenez-Ruiz,E. Kharlamov, M. Koubarakis, R. Moller, K. Bereta,C. Neuenstadt, O. Ozcep, M. Roshchin, P. Smeros,and D. Zheleznyakov. Addressing Streaming andHistorical Data in OBDA Systems: Optique’sApproach (Statement of Interest). In Workshop onKnowledge Discovery and Data Mining Meets LinkedOpen Data (Know@LOD 2013), volume 992 of CEURWorkshop Proceedings. CEUR-WS.org, 2013.
[17] A. Katifori, C. Halatsis, G. Lepouras, C. Vassilakis,and E. Giannopoulou. Ontology visualization methods- A survey. ACM Computing Surveys,39(4):10:1–10:43, 2007.
[18] E. Kharlamov, M. Giese, E. Jimenez-Ruiz, M. G.Skjæveland, A. Soylu, D. Zheleznyakov, T. Bagosi,M. Console, P. Haase, I. Horrocks, S. Marciuska,C. Pinkel, M. Rodriguez-Muro, M. Ruzzi,V. Santarelli, D. F. Savo, K. Sengupta, M. Schmidt,E. Thorstensen, J. Trame, and A. Waaler. Optique1.0: Semantic Access to Big Data: The Case ofNorwegian Petroleum Directorate’s FactPages. InInternational Semantic Web Conference (ISWC 2013)Posters and Demonstrations, 2013.
[19] E. Kharlamov, E. Jimenez-Ruiz, D. Zheleznyakov,D. Bilidas, M. Giese, P. Haase, I. Horrocks, H. Kllapi,M. Koubarakis, O. Ozcep, M. Rodrıguez-Muro,R. Rosati, M. Schmidt, R. Schlatte, A. Soylu, andA. Waaler. Optique: Towards OBDA Systems forIndustry. In The Semantic Web: ESWC 2013 SatelliteEvents, volume 7955 of LNCS. Springer, 2013.
[20] N. Khoussainova, Y. Kwon, W.-T. Liao,M. Balazinska, W. Gatterbauer, and D. Suciu.Session-based browsing for more effective query reuse.In 23rd international conference on Scientific andstatistical database management (SSDBM 2011),volume 6809 of LNCS, pages 583–585.Springer-Verlag, 2011.
[21] H. Kllapi, D. Bilidas, I. Horrocks, Y. Ioannidis,E. Jimenez-Ruiz, E. Kharlamov, M. Koubarakis, andD. Zheleznyakov. Distributed Query Processing on theCloud: the Optique Point of View (Short Paper). InOWL Experiences and Directions Workshop (OWLED2013), 2013.
[22] M. R. Kogalovsky. Ontology-Based Data AccessSystems. Programming and Computer Software,38(4):167–182, 2012.
[23] H. Lieberman, F. Paterno, and V. Wulf, editors. EndUser Development, volume 9 of Human-ComputerInteraction Series. Springer, 2006.
[24] S. Madden. From Databases to Big Data. IEEEInternet Computing, 16(3):4–6, 2012.
[25] G. Marchionini. Exploratory search: From finding tounderstanding. Communications of the ACM,49(4):41–46, 2006.
[26] K. Munir, M. Odeh, and R. McClatchey.Ontology-driven relational query formulation using thesemantic and assertional capabilities of OWL-DL.Knowledge-based Systems, 35:144–159, 2012.
[27] J. F. Nunameker, R. O. Briggs, and G.-J. de Vreede.From Information Technology to Value Creation
Technology. In Information Technology and the FutureEnterprise: New Models for Managers, pages 102–124.Prentice-Hall, New York, 2001.
[28] M. Rodriguez-Muro and D. Calvanese. HighPerformance Query Answering over DL-LiteOntologies. In Principles of Knowledge Representationand Reasoning (KR 2012), pages 308–318. AAAIPress, 2012.
[29] M. Rodriguez-Muro and D. Calvanese. Quest, aSystem for Ontology Based Data Access. In OWLExperiences and Directions Workshop 2012 (OWLED2012), volume 849 of CEUR Workshop Proceedings.CEUR-WS.org, 2012.
[30] F. Ruiz and J. R. Hilera. Using Ontologies in SoftwareEngineering and Technology. In C. Calero, F. Ruiz,and M. Piattini, editors, Ontologies for SoftwareEngineering and Software Technology, pages 49–102.Springer-Verlag, 2006.
[31] M. C. Schraefel, M. Wilson, A. Russell, and D. A.Smith. mSpace: improving information access tomultimedia domains with multimodal exploratorysearch. Communications of the ACM, 49(4):47–49,2006.
[32] B. Shneiderman. Direct Manipulation: A Step BeyondProgramming Languages. Computer, 16(8):57–69,1983.
[33] M. G. Skjæveland, E. H. Lian, and I. Horrocks.Publishing the Norwegian Petroleum Directorate’sFactPages as Semantic Web Data. In The SemanticWeb – ISWC 2013, volume 8219 of LNCS, 2013.
[34] A. Soylu, F. Moedritscher, F. Wild,P. De Causmaecker, and P. Desmet. Mashups byorchestration and widget-based personalenvironments: Key challenges, solution strategies, andan application. Program: Electronic Library AndInformation Systems, 46(4):383–428, 2012.
[35] B. Suh and B. B. Bederson. OZONE: A ZoomableInterface for Navigating Ontology Information. InWorking Conference on Advanced Visual Interfaces(AVI 2002), pages 139–143. ACM, 2002.
[36] A. H. M. Ter Hofstede, H. A. Proper, and T. P. VanDer Weide. Query formulation as an informationretrieval problem. Computer Journal, 39(4):255–274,1996.
[37] D. Tunkelang and G. Marchionini. Faceted Search.Synthesis Lectures on Information Concepts,Retrieval, and Services. Morgan and ClaypoolPublishers, 2009.
[38] R. W. White, B. Kules, S. M. Drucker, and M. C.Schraefel. Supporting exploratory search.Communications of the ACM, 49(4):37–39, 2006.
[39] K.-P. Yee, K. Swearingen, K. Li, and M. Hearst.Faceted metadata for image search and browsing. InSIGCHI Conference on Human Factors in ComputingSystems (CHI 2003), pages 401–408. ACM, 2003.
[40] C. Yu and H. V. Jagadish. Schema summarization. In32nd international conference on Very large data bases(VLDB’06), pages 319–330. VLDB Endowment, 2006.
[41] K. Zheng, Q. Mei, and D. A. Hanauer. Collaborativesearch in electronic health records. Journal of theAmerican Medical Informatics Association,18(3):282–291, 2011.