opto tech corporation and subsidiaries · financial performance and its consolidated cash flows for...
TRANSCRIPT
OPTO TECH CORPORATION AND
SUBSIDIARIES
CONSOLIDATED FINANCIAL STATEMENTS AND
REPORT OF INDEPENDENT ACCOUNTANTS
DECEMBER 31, 2018 AND 2017
------------------------------------------------------------------------------------------------------------------------------------
For the convenience of readers and for information purpose only, the auditors’ report and the accompanying
financial statements have been translated into English from the original Chinese version prepared and used in
the Republic of China. In the event of any discrepancy between the English version and the original Chinese
version or any differences in the interpretation of the two versions, the Chinese-language auditors’ report and
financial statements shall prevail.
~1~
OPTO TECH CORPORATION AND SUBSIDIARIES
Declaration of Consolidated Financial Statements of Affiliated Enterprises
For the year ended December 31, 2018, pursuant to the “Criteria Governing Preparation of
Affiliation Reports, Consolidated Business Reports and Consolidated Financial Statements of Affiliated
Enterprises,” the company that is required to be included in the consolidated financial statements of
affiliates, is the same as the company that is required to be included in the consolidated financial
statements of parent and subsidiary companies under International Financial Reporting Standard 10. And
if relevant information that should be disclosed in the consolidated financial statements of affiliates has
all been disclosed in the consolidated financial statements of parent and subsidiary companies, it shall
not be required to prepare separate consolidated financial statements of affiliates.
Hereby declare,
~2~
REPORT OF INDEPENDENT ACCOUNTANTS TRANSLATED FROM CHINESE
To the Board of Directors and Shareholders of OPTO TECH CORPORATION
Opinion
We have audited the accompanying consolidated balance sheets of Opto Tech Corporation and
subsidiaries (the “Group”) as at December 31, 2018 and 2017, and the related consolidated statements
of comprehensive income, of changes in equity and of cash flows for the years then ended, and notes to
the consolidated financial statements, including a summary of significant accounting policies.
In our opinion, the accompanying consolidated financial statements present fairly, in all material respects,
the consolidated financial position of the Group as at December 31, 2018 and 2017, and its consolidated
financial performance and its consolidated cash flows for the years then ended in accordance with the
“Regulations Governing the Preparation of Financial Reports by Securities Issuers” and the International
Financial Reporting Standards, International Accounting Standards, IFRIC Interpretations, and SIC
Interpretations as endorsed by the Financial Supervisory Commission.
Basis for opinion
We conducted our audits in accordance with the “Regulations Governing Auditing and Attestation of
Financial Statements by Certified Public Accountants” and generally accepted auditing standards in the
Republic of China (ROC GAAS). Our responsibilities under those standards are further described in the
Auditor’s Responsibilities for the Audit of the Consolidated Financial Statements section of our report.
We are independent of the Group in accordance with the Code of Professional Ethics for Certified Public
Accountants in the Republic of China (the “Code”), and we have fulfilled our other ethical
responsibilities in accordance with the Code. We believe that the audit evidence we have obtained is
sufficient and appropriate to provide a basis for our opinion.
Key audit matters
Key audit matters are those matters that, in our professional judgement, were of most significance in our
audit of the consolidated financial statements of the current period. These matters were addressed in the
context of our audit of the consolidated financial statements as a whole and, in forming our opinion
thereon, we do not provide a separate opinion on these matters.
~3~
Key audit matters for the Group’s consolidated financial statements of the current period are stated as
follows:
Key audit matter- Allowance for inventory valuation losses
Description
Please refer to Note 4(12) for accounting policies on inventory valuation, Note 5(2) for accounting
estimates and assumption uncertainty on inventory valuation, and Note 6(5) for details of allowance for
inventory valuation losses. As of December 31, 2018, the balances of inventories and allowance for
inventory valuation losses were NT$ 1,696,952 thousand and NT$ 365,551 thousand, respectively.
As the value of the Group’s inventories are effected by market prices and product life cycles, there is a
higher risk of obsolescence. For inventories aged over a certain period of time and individually identified
as obsolete, the net realisable value is estimated based on historical data of inventory closeout. The net
realisable value utilised in evaluating obsolete inventories involves uncertainty of estimation as it is
subject to management’s judgement. Since inventories and allowance for inventory valuation losses
were material to the consolidated financial statements, it was identified as a key audit matter.
How our audit addressed the matter
We performed the following audit procedures in respect of the above key audit matter: assessed the
reasonableness of policies and procedures in the provision of allowance for inventory valuation losses
based on our understanding of the Group’s operations and its industry, such as assessing the data source
of historical inventory closeout and the reasonableness in the identification of obsolete inventories;
validated the appropriateness of system logic of inventory aging report in order to confirm the
compliance with respective policies; and assessed the reasonableness of the Group’s determination of
the provision of allowance for inventory valuation losses through obtaining assessment documents and
supporting evidences in relation to individually identified obsolete or damaged inventories from
management.
~4~
Key audit matter- Estimation of fair values of unlisted securities without active market
Description
Please refer to Note 4(7)(8) for accounting policies on financial assets at fair value through profit or loss
and financial assets at fair value through other comprehensive income or loss, Note 5(2) for accounting
estimates and assumption uncertainty on estimation of financial assets-fair value measurement of
unlisted stocks without active market, and Note 6(2)(3) for details of financial assets at fair value through
profit or loss and financial assets at fair value through other comprehensive income or loss. As of
December 31, 2018, the carrying amount of unlisted securities without active market was NT$ 889,926
thousand.
For unlisted securities without active market held by the Group, management assesses their fair values
through market approach and takes into account the discount for liquidity. Since the valuation method
is subject to management’s judgement and involves uncertainty, which would affect fair value, it was
identified as a key audit matter.
How our audit addressed the matter
We performed the following audit procedures in respect of the above key audit matter: assessed the
comparability and market liquidity of comparable companies referred to by the external appraiser
engaged by the Group; and assessed the reasonableness of price multipliers and discounts for liquidity
in the market.
Other matter–Parent company only financial statements
We have audited and expressed an unmodified opinion on the parent company only financial statements
of Opto Tech Corporation as at and for the years ended December 31, 2018 and 2017.
Responsibilities of management and those charged with governance for the
consolidated financial statements
Management is responsible for the preparation and fair presentation of the consolidated financial
statements in accordance with the “Regulations Governing the Preparation of Financial Reports by
Securities Issuers” and the International Financial Reporting Standards, International Accounting
Standards, IFRIC Interpretations, and SIC Interpretations as endorsed by the Financial Supervisory
Commission, and for such internal control as management determines is necessary to enable the
preparation of consolidated financial statements that are free from material misstatement, whether due
~5~
to fraud or error.
In preparing the consolidated financial statements, management is responsible for assessing the Group’s
ability to continue as a going concern, disclosing, as applicable, matters related to going concern and
using the going concern basis of accounting unless management either intends to liquidate the Group or
to cease operations, or has no realistic alternative but to do so.
Those charged with governance, including audit committee, are responsible for overseeing the Group’s
financial reporting process.
Auditor’s responsibilities for the audit of the consolidated financial statements
Our objectives are to obtain reasonable assurance about whether the consolidated financial statements
as a whole are free from material misstatement, whether due to fraud or error, and to issue an auditor’s
report that includes our opinion. Reasonable assurance is a high level of assurance, but is not a guarantee
that an audit conducted in accordance with ROC GAAS will always detect a material misstatement when
it exists. Misstatements can arise from fraud or error and are considered material if, individually or in
the aggregate, they could reasonably be expected to influence the economic decisions of users taken on
the basis of these consolidated financial statements.
As part of an audit in accordance with ROC GAAS, we exercise professional judgement and maintain
professional skepticism throughout the audit. We also:
1. Identify and assess the risks of material misstatement of the consolidated financial statements,
whether due to fraud or error, design and perform audit procedures responsive to those risks, and
obtain audit evidence that is sufficient and appropriate to provide a basis for our opinion. The risk
of not detecting a material misstatement resulting from fraud is higher than for one resulting from
error, as fraud may involve collusion, forgery, intentional omissions, misrepresentations, or the
override of internal control.
2. Obtain an understanding of internal control relevant to the audit in order to design audit procedures
that are appropriate in the circumstances, but not for the purpose of expressing an opinion on the
effectiveness of the Group’s internal control.
3. Evaluate the appropriateness of accounting policies used and the reasonableness of accounting
estimates and related disclosures made by management.
~6~
4. Conclude on the appropriateness of management’s use of the going concern basis of accounting
and, based on the audit evidence obtained, whether a material uncertainty exists related to events
or conditions that may cast significant doubt on the Group’s ability to continue as a going concern.
If we conclude that a material uncertainty exists, we are required to draw attention in our auditor’s
report to the related disclosures in the consolidated financial statements or, if such disclosures are
inadequate, to modify our opinion. Our conclusions are based on the audit evidence obtained up to
the date of our auditor’s report. However, future events or conditions may cause the Group to cease
to continue as a going concern.
5. Evaluate the overall presentation, structure and content of the consolidated financial statements,
including the disclosures, and whether the consolidated financial statements represent the
underlying transactions and events in a manner that achieves fair presentation.
6. Obtain sufficient appropriate audit evidence regarding the financial information of the entities or
business activities within the Group to express an opinion on the consolidated financial statements.
We are responsible for the direction, supervision and performance of the group audit. We remain
solely responsible for our audit opinion.
We communicate with those charged with governance regarding, among other matters, the planned scope
and timing of the audit and significant audit findings, including any significant deficiencies in internal
control that we identify during our audit.
We also provide those charged with governance with a statement that we have complied with relevant
ethical requirements regarding independence, and to communicate with them all relationships and other
matters that may reasonably be thought to bear on our independence, and where applicable, related
safeguards.
From the matters communicated with those charged with governance, we determine those matters that
were of most significance in the audit of the consolidated financial statements of the current period and
are therefore the key audit matters. We describe these matters in our auditor’s report unless law or
regulation precludes public disclosure about the matter or when, in extremely rare circumstances, we
determine that a matter should not be communicated in our report because the adverse consequences of
doing so would reasonably be expected to outweigh the public interest benefits of such communication.

~7~
Lin, Yu-Kuan Lai, Chung-Hsi
For and on behalf of PricewaterhouseCoopers, Taiwan
March 13, 2019
------------------------------------------------------------------------------------------------------------------------------------------------- The accompanying consolidated financial statements are not intended to present the financial position and results of operations and cash flows in accordance with accounting principles generally accepted in countries and jurisdictions other than the Republic of China. The standards, procedures and practices in the Republic of China governing the audit of such financial statements may differ from those generally accepted in countries and jurisdictions other than the Republic of China. Accordingly, the accompanying consolidated financial statements and report of independent accountants are not intended for use by those who are not informed about the accounting principles or auditing standards generally accepted in the Republic of China, and their applications in practice. As the financial statements are the responsibility of the management, PricewaterhouseCoopers cannot accept any liability for the use of, or reliance on, the English translation or for any errors or misunderstandings that may derive from the translation.

OPTO TECH CORPORATION AND SUBSIDIARIES CONSOLIDATED BALANCE SHEETS
(Expressed in thousands of New Taiwan dollars)
~8~
December 31, 2018 December 31, 2017 Assets Notes AMOUNT % AMOUNT %
Current assets
Cash and cash equivalents 6(1) $ 2,690,226 27 $ 2,544,575 26
Financial assets at fair value through profit
or loss - current
6(2)
220,381 2 300,265 3
Notes receivable, net 6(4) 13,119 - 24,988 -
Accounts receivable - net 6(4) 1,575,749 16 1,446,882 15
Accounts receivable - related parties - net 7 78,517 1 94,934 1
Other receivables 12,793 - 11,133 -
Inventories - net 6(5) 1,331,401 13 1,097,951 11
Prepayments 26,410 - 55,327 1
Other current assets 8 24,488 - 25,320 -
Current Assets 5,973,084 59 5,601,375 57
Non-current assets
Financial assets at fair value through profit
or loss - non-current
6(2)
106,899 1 - -
Financial assets at fair value through other
comprehensive income or loss - non-
current
6(3)
871,546 9 - -
Available-for-sale financial assets - non-
current
12(4)
- - 1,222,491 12
Investments accounted for using equity
method
6(6)
641 - 5,235 -
Property, plant and equipment - net 6(7) and 8 3,071,603 30 2,877,768 29
Intangible assets 6(8) 8,840 - 9,051 -
Deferred tax assets 6(26) 107,588 1 103,868 1
Other non-current assets 6(9) 54,131 - 71,245 1
Non-current assets 4,221,248 41 4,289,658 43
Total assets $ 10,194,332 100 $ 9,891,033 100
(Continued)

OPTO TECH CORPORATION AND SUBSIDIARIES CONSOLIDATED BALANCE SHEETS
(Expressed in thousands of New Taiwan dollars)
The accompanying notes are an integral part of these consolidated financial statements.
~9~
December 31, 2018 December 31, 2017 Liabilities and Equity Notes AMOUNT % AMOUNT %
Current liabilities
Short-term loans 6(10) $ 737,660 7 $ 899,677 9
Notes payable 33 - 2,158 -
Accounts payable 574,007 6 631,573 6
Accounts payable - related parties 7 87,963 1 160,535 2
Other payables 6(11)(29) 599,528 6 536,586 5
Current income tax liabilities 69,490 1 86,294 1
Provisions for liabilities - current 6(15) 11,970 - 13,105 -
Other current liabilities 6(29) 45,855 - 60,194 1
Current Liabilities 2,126,506 21 2,390,122 24
Non-current liabilities
Long-term loans 6(12), 8 and 9 250,000 2 - -
Provisions for liabilities - non-current 6(15) 22,259 - 35,120 -
Deferred tax liabilities 6(26) 68,942 1 42,550 1
Other non-current liabilities 6(13) 195,777 2 199,368 2
Non-current liabilities 536,978 5 277,038 3
Total Liabilities 2,663,484 26 2,667,160 27
Equity attributable to owners of parent
Capital 6(16)
Common stock 4,454,386 44 4,454,386 45
Capital Reserve 6(17)
Capital surplus 702,521 7 701,323 7
Retained Earnings 6(18)
Legal reserve 604,001 6 536,773 5
Special reserve - - 59,227 1
Unappropriated earnings 1,537,426 15 1,269,714 13
Other Equity Adjustments
Other equity interest 6(19) 253,376 2 223,345 2
Treasury stocks
Treasury stocks 6(16) ( 24,503 ) - ( 24,503 ) -
Equity attributable to owners of
parent
7,527,207 74 7,220,265 73
Non-controlling interest 3,641 - 3,608 -
Total equity 7,530,848 74 7,223,873 73
Total liabilities and equity $ 10,194,332 100 $ 9,891,033 100

OPTO TECH CORPORATION AND SUBSIDIARIES CONSOLIDATED STATEMENTS OF COMPREHENSIVE INCOME
(Expressed in thousands of New Taiwan dollar, except earnings per share)
~10~
Year ended December 31
2018 2017
Items Notes AMOUNT % AMOUNT %
Operating revenue 6(20) and 7 $ 5,364,610 100 $ 5,589,853 100
Operating costs 6(5)(24)(25) and
7 ( 3,742,738 ) ( 70 ) ( 3,935,755 ) ( 70 )
Gross profit, net 1,621,872 30 1,654,098 30
Operating expenses 6(24)(25)
Selling expenses ( 117,761 ) ( 2 ) ( 115,252 ) ( 2 )
General and administrative expenses ( 451,353 ) ( 9 ) ( 455,160 ) ( 8 )
Research and development expenses ( 318,329 ) ( 6 ) ( 300,111 ) ( 6 )
Reversal of expected credit gain on
financial assets
12(2)
3,578 - - -
Total operating expenses ( 883,865 ) ( 17 ) ( 870,523 ) ( 16 )
Operating income 738,007 13 783,575 14
Non-operating income and expenses
Other income 6(21) 45,974 1 92,676 2
Other gains and losses 6(22) 27,611 1 ( 40,966 ) ( 1 )
Finance costs 6(23) ( 27,071 ) ( 1 ) ( 26,176 ) -
Share of (loss) profit of associates
and joint ventures accounted for
using equity method
6(6)
( 4,526 ) - 3,722 -
Total non-operating income and
expenses
41,988 1 29,256 1
Profit before income tax 779,995 14 812,831 15
Income tax expense 6(26) ( 126,854 ) ( 2 ) ( 140,518 ) ( 3 )
Net income $ 653,141 12 $ 672,313 12
(Continued)
OPTO TECH CORPORATION AND SUBSIDIARIES CONSOLIDATED STATEMENTS OF COMPREHENSIVE INCOME
(Expressed in thousands of New Taiwan dollar, except earnings per share)
The accompanying notes are an integral part of these consolidated financial statements.
~11~
Year ended December 31
2018 2017
Items Notes AMOUNT % AMOUNT %
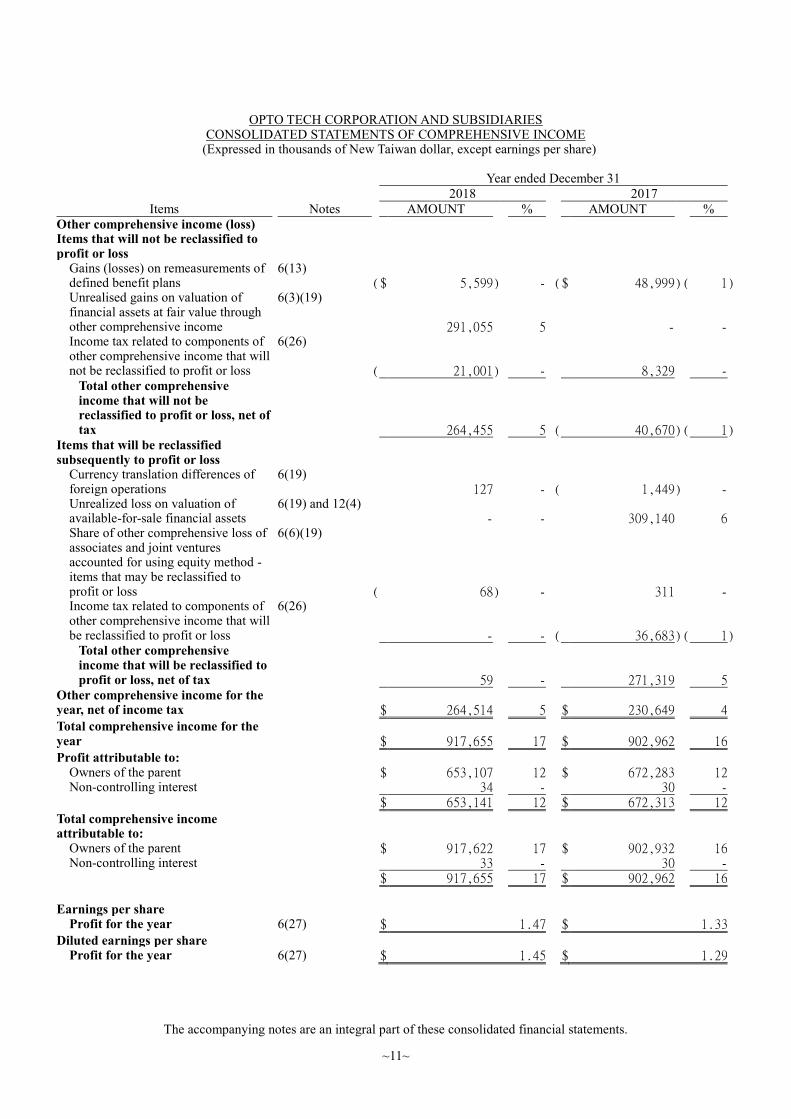
Other comprehensive income (loss) Items that will not be reclassified to profit or loss
Gains (losses) on remeasurements of defined benefit plans
6(13) ( $ 5,599 ) - ( $ 48,999 ) ( 1 )
Unrealised gains on valuation of financial assets at fair value through other comprehensive income
6(3)(19)
291,055 5 - - Income tax related to components of other comprehensive income that will not be reclassified to profit or loss
6(26)
( 21,001 ) - 8,329 - Total other comprehensive income that will not be reclassified to profit or loss, net of tax
264,455 5 ( 40,670 ) ( 1 ) Items that will be reclassified subsequently to profit or loss
Currency translation differences of foreign operations
6(19) 127 - ( 1,449 ) -
Unrealized loss on valuation of available-for-sale financial assets
6(19) and 12(4) - - 309,140 6
Share of other comprehensive loss of associates and joint ventures accounted for using equity method - items that may be reclassified to profit or loss
6(6)(19)
( 68 ) - 311 - Income tax related to components of other comprehensive income that will be reclassified to profit or loss
6(26)
- - ( 36,683 ) ( 1 ) Total other comprehensive income that will be reclassified to profit or loss, net of tax
59 - 271,319 5 Other comprehensive income for the year, net of income tax
$ 264,514 5 $ 230,649 4
Total comprehensive income for the year
$ 917,655 17 $ 902,962 16
Profit attributable to: Owners of the parent $ 653,107 12 $ 672,283 12 Non-controlling interest 34 - 30 - $ 653,141 12 $ 672,313 12
Total comprehensive income attributable to:
Owners of the parent $ 917,622 17 $ 902,932 16 Non-controlling interest 33 - 30 - $ 917,655 17 $ 902,962 16
Earnings per share
Profit for the year 6(27) $ 1.47 $ 1.33
Diluted earnings per share Profit for the year 6(27) $ 1.45 $ 1.29
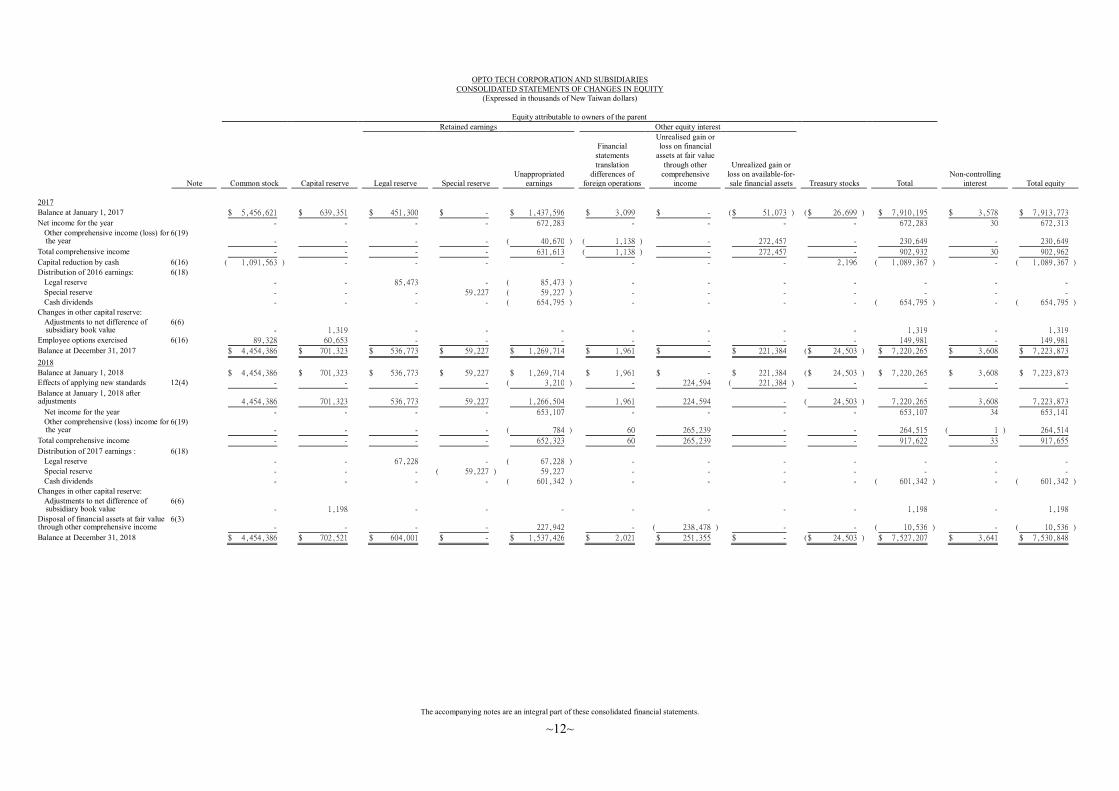
OPTO TECH CORPORATION AND SUBSIDIARIES
CONSOLIDATED STATEMENTS OF CHANGES IN EQUITY
(Expressed in thousands of New Taiwan dollars)
Equity attributable to owners of the parent
Retained earnings Other equity interest
Note
Common stock
Capital reserve
Legal reserve
Special reserve
Unappropriated
earnings
Financial
statements
translation
differences of
foreign operations
Unrealised gain or
loss on financial
assets at fair value
through other
comprehensive
income
Unrealized gain or
loss on available-for-
sale financial assets
Treasury stocks
Total
Non-controlling
interest
Total equity
The accompanying notes are an integral part of these consolidated financial statements.
~12~
2017 Balance at January 1, 2017 $ 5,456,621 $ 639,351 $ 451,300 $ - $ 1,437,596 $ 3,099 $ - ( $ 51,073 ) ( $ 26,699 ) $ 7,910,195 $ 3,578 $ 7,913,773 Net income for the year - - - - 672,283 - - - - 672,283 30 672,313 Other comprehensive income (loss) for
the year 6(19)
- - - - ( 40,670 ) ( 1,138 ) - 272,457 - 230,649 - 230,649 Total comprehensive income - - - - 631,613 ( 1,138 ) - 272,457 - 902,932 30 902,962 Capital reduction by cash 6(16) ( 1,091,563 ) - - - - - - - 2,196 ( 1,089,367 ) - ( 1,089,367 ) Distribution of 2016 earnings: 6(18) Legal reserve - - 85,473 - ( 85,473 ) - - - - - - - Special reserve - - - 59,227 ( 59,227 ) - - - - - - - Cash dividends - - - - ( 654,795 ) - - - - ( 654,795 ) - ( 654,795 ) Changes in other capital reserve: Adjustments to net difference of
subsidiary book value 6(6)
- 1,319 - - - - - - - 1,319 - 1,319 Employee options exercised 6(16) 89,328 60,653 - - - - - - - 149,981 - 149,981 Balance at December 31, 2017 $ 4,454,386 $ 701,323 $ 536,773 $ 59,227 $ 1,269,714 $ 1,961 $ - $ 221,384 ( $ 24,503 ) $ 7,220,265 $ 3,608 $ 7,223,873 2018 Balance at January 1, 2018 $ 4,454,386 $ 701,323 $ 536,773 $ 59,227 $ 1,269,714 $ 1,961 $ - $ 221,384 ( $ 24,503 ) $ 7,220,265 $ 3,608 $ 7,223,873 Effects of applying new standards 12(4) - - - - ( 3,210 ) - 224,594 ( 221,384 ) - - - - Balance at January 1, 2018 after adjustments
4,454,386 701,323 536,773 59,227 1,266,504 1,961 224,594 - ( 24,503 ) 7,220,265 3,608 7,223,873
Net income for the year - - - - 653,107 - - - - 653,107 34 653,141 Other comprehensive (loss) income for
the year 6(19)
- - - - ( 784 ) 60 265,239 - - 264,515 ( 1 ) 264,514 Total comprehensive income - - - - 652,323 60 265,239 - - 917,622 33 917,655 Distribution of 2017 earnings : 6(18) Legal reserve - - 67,228 - ( 67,228 ) - - - - - - - Special reserve - - - ( 59,227 ) 59,227 - - - - - - - Cash dividends - - - - ( 601,342 ) - - - - ( 601,342 ) - ( 601,342 ) Changes in other capital reserve: Adjustments to net difference of
subsidiary book value 6(6)
- 1,198 - - - - - - - 1,198 - 1,198 Disposal of financial assets at fair value through other comprehensive income
6(3) - - - - 227,942 - ( 238,478 ) - - ( 10,536 ) - ( 10,536 )
Balance at December 31, 2018 $ 4,454,386 $ 702,521 $ 604,001 $ - $ 1,537,426 $ 2,021 $ 251,355 $ - ( $ 24,503 ) $ 7,527,207 $ 3,641 $ 7,530,848

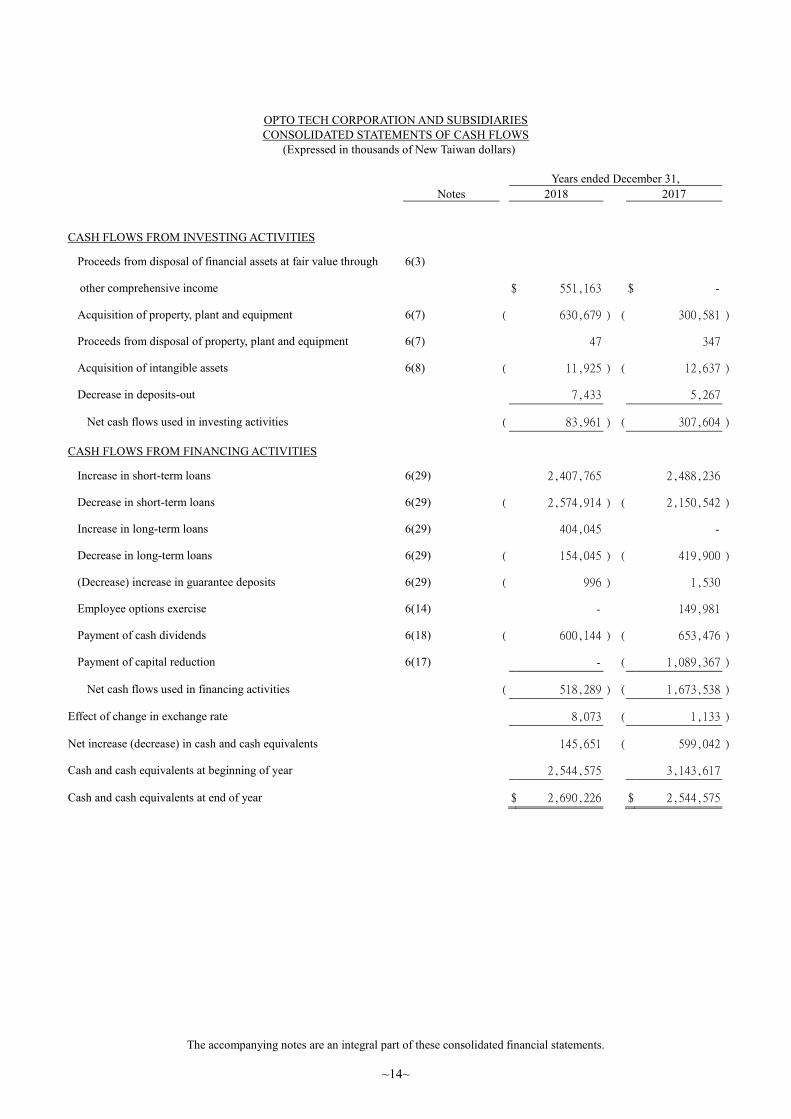
OPTO TECH CORPORATION AND SUBSIDIARIES
CONSOLIDATED STATEMENTS OF CASH FLOWS
(Expressed in thousands of New Taiwan dollars)
Years ended December 31,
Notes 2018 2017
~13~
CASH FLOWS FROM OPERATING ACTIVITIES Profit before tax $ 779,995 $ 812,831 Adjustments Income and expenses having no effect on cash flows Reversal of expected credit loss on financial assets 12(2) ( 3,578 ) - Recovery of bad debts expense 7 and 12(4) - ( 14,911 ) Depreciation 6(7)(24) 432,773 404,688 Amortization 6(8)(24) 12,136 12,899 Amortization of land use right 6(9) 122 105 Net profit on financial assets and liabilities at fair value
through profit or loss 6(2)(22)
( 16,176 ) ( 1,088 ) Interest income 6(21) ( 13,788 ) ( 13,487 ) Dividend income 6(21) ( 15,027 ) ( 21,024 ) Gain on disposal of investments 6(22) ( 1,188 ) ( 2,518 ) Loss on disposal of property, plant and equipment 6(7)(22) 617 400 (Reversal of) impairment loss on non-financial assets 6(7)(22) - ( 28 ) Interest expense 6(23) 26,956 25,231 Share of profit (loss) of associates accounted for using equity
method 6(6)
4,526 ( 3,722 ) Changes in assets/liabilities relating to operating activities Changes in operating assets Acquisition of financial assets at fair value through profit or
loss
81,188 192,518 Notes receivable - net 11,869 724 Accounts receivable - net ( 127,683 ) 66,192 Accounts receivable - related parties - net 19,249 30,444 Other receivables ( 1,245 ) 279 Inventories - net ( 233,450 ) 263,563 Prepayments 28,917 ( 21,278 ) Other current assets 832 803 Other non-current assets 9,499 ( 3,949 ) Net changes in liabilities relating to operating activities Notes payable ( 2,125 ) 617 Accounts payable ( 57,566 ) ( 38,639 ) Accounts payable - related parties ( 72,572 ) ( 35,948 ) Other payables 62,946 ( 5,759 ) Other current liabilities ( 14,339 ) ( 78,486 ) Provisions for liabilities ( 13,782 ) ( 5,499 ) Net defined benefit liability ( 8,194 ) ( 88,548 )
Cash inflow generated from operations 890,912 1,476,410 Interest received 13,373 13,465 Dividend received 15,027 21,024 Interest paid ( 26,960 ) ( 24,045 ) Income tax paid ( 152,524 ) ( 103,621 )
Net cash flows from operating activities 739,828 1,383,233
(Continued)
OPTO TECH CORPORATION AND SUBSIDIARIES
CONSOLIDATED STATEMENTS OF CASH FLOWS
(Expressed in thousands of New Taiwan dollars)
Years ended December 31,
Notes 2018 2017
The accompanying notes are an integral part of these consolidated financial statements.
~14~
CASH FLOWS FROM INVESTING ACTIVITIES
Proceeds from disposal of financial assets at fair value through
other comprehensive income
6(3)
$ 551,163 $ -
Acquisition of property, plant and equipment 6(7) ( 630,679 ) ( 300,581 )
Proceeds from disposal of property, plant and equipment 6(7) 47 347
Acquisition of intangible assets 6(8) ( 11,925 ) ( 12,637 )
Decrease in deposits-out 7,433 5,267
Net cash flows used in investing activities ( 83,961 ) ( 307,604 )
CASH FLOWS FROM FINANCING ACTIVITIES
Increase in short-term loans 6(29) 2,407,765 2,488,236
Decrease in short-term loans 6(29) ( 2,574,914 ) ( 2,150,542 )
Increase in long-term loans 6(29) 404,045 -
Decrease in long-term loans 6(29) ( 154,045 ) ( 419,900 )
(Decrease) increase in guarantee deposits 6(29) ( 996 ) 1,530
Employee options exercise 6(14) - 149,981
Payment of cash dividends 6(18) ( 600,144 ) ( 653,476 )
Payment of capital reduction 6(17) - ( 1,089,367 )
Net cash flows used in financing activities ( 518,289 ) ( 1,673,538 )
Effect of change in exchange rate 8,073 ( 1,133 )
Net increase (decrease) in cash and cash equivalents 145,651 ( 599,042 )
Cash and cash equivalents at beginning of year 2,544,575 3,143,617
Cash and cash equivalents at end of year $ 2,690,226 $ 2,544,575

~15~
OPTO TECH CORPORATION AND SUBSIDIARIES
NOTES TO THE CONSOLIDATED FINANCIAL STATEMENTS
FOR THE YEARS ENDED DECEMBER 31, 2018 AND 2017
(EXPRESSED IN THOUSANDS OF NEW TAIWAN DOLLARS,
EXCEPT AS OTHERWISE INDICATED)
1. HISTORY AND ORGANIZATION
Opto Tech Corporation (the “Company”) was incorporated as a company limited by shares under the
provisions of the Company Law of the Republic of China (R.O.C.). The shares of the Company have
been traded on the Taiwan Stock Exchange since May 2, 1995. The Company and its subsidiaries
(collectively referred herein as the “Group”) are primarily engaged in the manufacture and sales of
semiconductor components as well as research and development, design, manufacture and sales of
systems products.
2. THE DATE OF AUTHORIZATION FOR ISSUANCE OF THE CONSOLIDATED FINANCIAL
STATEMENTS AND PROCEDURES FOR AUTHORIZATION
These consolidated financial statements were reported to the Board of Directors on March 13, 2019.
3. APPLICATION OF NEW STANDARDS, AMENDMENTS AND INTERPRETATIONS
(1) Effect of the adoption of new issuances of or amendments to International Financial Reporting
Standards (“IFRS”) as endorsed by the Financial Supervisory Commission (“FSC”)
New standards, interpretations and amendments endorsed by the FSC effective from 2018 are as
follows:
New Standards, Interpretations and Amendments
Effective date by
International Accounting
Standards Board
Amendments to IFRS 2, ‘Classification and measurement of share-based
payment transactions’
January 1, 2018
Amendments to IFRS 4, ‘Applying IFRS 9, Financial instruments with
IFRS 4, Insurance contracts’
January 1, 2018
IFRS 9, ‘Financial instruments’ January 1, 2018
IFRS 15, ‘Revenue from contracts with customers’ January 1, 2018
Amendments to IFRS 15, ‘Clarifications to IFRS 15, Revenue from
contracts with customers’
January 1, 2018
Amendments to IAS 7, ‘Disclosure initiative’ January 1, 2017
Amendments to IAS 12, ‘Recognition of deferred tax assets for
unrealised losses’
January 1, 2017
Amendments to IAS 40, ‘Transfers of investment property’ January 1, 2018
IFRIC 22, ‘Foreign currency transactions and advance consideration’ January 1, 2018
Annual improvements to IFRSs 2014-2016 cycle - Amendments to IFRS
1, ‘First-time adoption of International Financial Reporting Standards’
January 1, 2018

~16~
Except for the following, the above standards and interpretations have no significant impact to the
Group’s financial condition and financial performance based on the Group’s assessment.
When adopting the new standards endorsed by FSC effective from 2018, the Group applied the new
rules under IFRS 9 retrospectively from January 1, 2018, with the practical expedients permitted
under the statement. For the significant effects of applying the new standards as of January 1, 2018,
please refer to Note 12(4).
(2) Effect of new issuances of or amendments to IFRSs as endorsed by the FSC but not yet adopted by
the Group
New standards, interpretations and amendments endorsed by the FSC effective from 2019 are as
follows:
Except for the following, the above standards and interpretations have no significant impact to the
Group’s financial condition and financial performance based on the Group’s assessment.
IFRS 16, ‘Leases’
IFRS 16, ‘Leases’, replaces IAS 17, ‘Leases’ and related interpretations and SICs. The standard
requires lessees to recognise a 'right-of-use asset' and a lease liability (except for those leases with
terms of 12 months or less and leases of low-value assets). The accounting stays the same for lessors,
which is to classify their leases as either finance leases or operating leases and account for those two
types of leases differently. IFRS 16 only requires enhanced disclosures to be provided by lessors.
The Group expects to recognise the lease contract of lessees using the modified retrospective
approach under IFRS 16. On January 1, 2019, the Group will have to increase ‘right-of-use asset’ by
$269,990, increase lease liability by $265,950, and decrease long-term prepaid rents and prepaid rents
by $3,584 and $456, respectively.
New Standards, Interpretations and Amendments
Effective date by
International Accounting
Standards Board
Annual improvements to IFRSs 2014-2016 cycle - Amendments to IFRS
12, ‘Disclosure of interests in other entities’
January 1, 2017
Annual improvements to IFRSs 2014-2016 cycle - Amendments to IAS
28, ‘Investments in associates and joint ventures’
January 1, 2018
New Standards, Interpretations and Amendments
Effective date by
International Accounting
Standards Board
Amendments to IFRS 9, ‘Prepayment features with negative compensation’ January 1, 2019
IFRS 16, ‘Leases’ January 1, 2019
Amendments to IAS 19, ‘Plan amendment, curtailment or settlement’ January 1, 2019
Amendments to IAS 28, ‘Long-term interests in associates and joint
ventures’
January 1, 2019
IFRIC 23, ‘Uncertainty over income tax treatments’ January 1, 2019
Annual improvements to IFRSs 2015-2017 cycle January 1, 2019
~17~
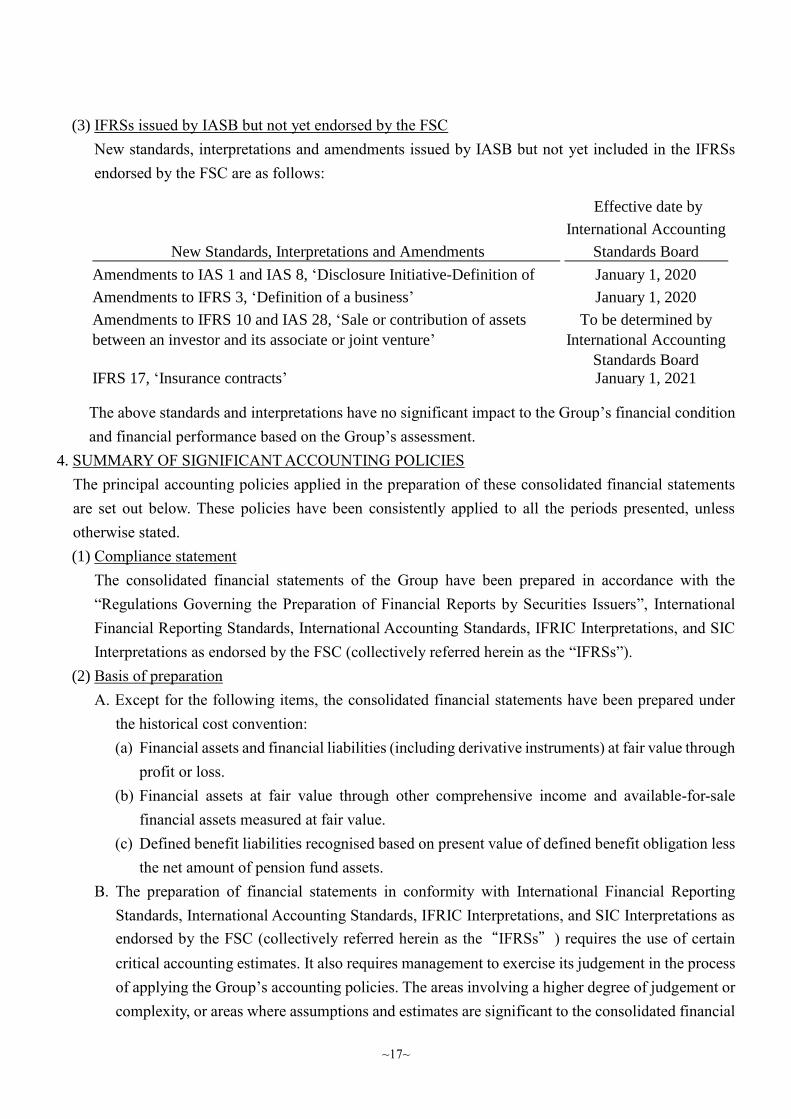
(3) IFRSs issued by IASB but not yet endorsed by the FSC
New standards, interpretations and amendments issued by IASB but not yet included in the IFRSs
endorsed by the FSC are as follows:
The above standards and interpretations have no significant impact to the Group’s financial condition
and financial performance based on the Group’s assessment.
4. SUMMARY OF SIGNIFICANT ACCOUNTING POLICIES
The principal accounting policies applied in the preparation of these consolidated financial statements
are set out below. These policies have been consistently applied to all the periods presented, unless
otherwise stated.
(1) Compliance statement
The consolidated financial statements of the Group have been prepared in accordance with the
“Regulations Governing the Preparation of Financial Reports by Securities Issuers”, International
Financial Reporting Standards, International Accounting Standards, IFRIC Interpretations, and SIC
Interpretations as endorsed by the FSC (collectively referred herein as the “IFRSs”).
(2) Basis of preparation
A. Except for the following items, the consolidated financial statements have been prepared under
the historical cost convention:
(a) Financial assets and financial liabilities (including derivative instruments) at fair value through
profit or loss.
(b) Financial assets at fair value through other comprehensive income and available-for-sale
financial assets measured at fair value.
(c) Defined benefit liabilities recognised based on present value of defined benefit obligation less
the net amount of pension fund assets.
B. The preparation of financial statements in conformity with International Financial Reporting
Standards, International Accounting Standards, IFRIC Interpretations, and SIC Interpretations as
endorsed by the FSC (collectively referred herein as the“IFRSs”) requires the use of certain
critical accounting estimates. It also requires management to exercise its judgement in the process
of applying the Group’s accounting policies. The areas involving a higher degree of judgement or
complexity, or areas where assumptions and estimates are significant to the consolidated financial
New Standards, Interpretations and Amendments
Effective date by
International Accounting
Standards Board
Amendments to IAS 1 and IAS 8, ‘Disclosure Initiative-Definition of
Material’
January 1, 2020
Amendments to IFRS 3, ‘Definition of a business’ January 1, 2020
Amendments to IFRS 10 and IAS 28, ‘Sale or contribution of assets
between an investor and its associate or joint venture’
To be determined by
International Accounting
Standards Board
IFRS 17, ‘Insurance contracts’ January 1, 2021

~18~
statements are disclosed in Note 5.
C. In adopting IFRS 9 and IFRS 15 effective January 1, 2018, the Group has elected to apply modified
retrospective approach whereby the cumulative impact of the adoption was recognised as retained
earnings or other equity as of January 1, 2018 and the financial statements for the year ended
December 31, 2017 and the 3rd quarter of 2017 were not restated. The financial statements for the
year ended December 31, 2017 and the 3rd quarter of 2017 were prepared in compliance with
International Accounting Standard 39 (‘IAS 39’), International Accounting Standard 18 (‘IAS 18’)
and related financial reporting interpretations. Please refer to Note 12(4).
(3) Basis of consolidation
A. Basis for preparation of consolidated financial statements:
(a) All subsidiaries are included in the Group’s consolidated financial statements. Subsidiaries are
all entities controlled by the Group. The Group controls an entity when the Group is exposed,
or has rights, to variable returns from its involvement with the entity and has the ability to
affect those returns through its power over the entity. Consolidation of subsidiaries begins
from the date the Group obtains control of the subsidiaries and ceases when the Group loses
control of the subsidiaries.
(b) Inter-company transactions, balances and unrealised gains or losses on transactions between
companies within the Group are eliminated. Accounting policies of subsidiaries have been
adjusted where necessary to ensure consistency with the policies adopted by the Group.
(c) Profit or loss and each component of other comprehensive income are attributed to the owners
of the parent and to the non-controlling interests. Total comprehensive income is attributed to
the owners of the parent and to the non-controlling interests even if this results in the
noncontrolling interests having a deficit balance.
(d) Changes in a parent’s ownership interest in a subsidiary that do not result in the parent losing
control of the subsidiary (transactions with non-controlling interests) are accounted for as
equity transactions, i.e. transactions with owners in their capacity as owners. Any difference
between the amount by which the non-controlling interests are adjusted and the fair value of
the consideration paid or received is recognised directly in equity.
(e) When the Group loses control of a subsidiary, the Group remeasures any investment retained
in the former subsidiary at its fair value. That fair value is regarded as the fair value on initial
recognition of a financial asset or the cost on initial recognition of the associate or joint venture.
Any difference between fair value and carrying amount is recognised in profit or loss. All
amounts previously recognised in other comprehensive income in relation to the subsidiary
are reclassified to profit or loss on the same basis as would be required if the related assets or
liabilities were disposed of. That is, when the Group loses control of a subsidiary, all gains or
losses previously recognised in other comprehensive income in relation to the subsidiary
should be reclassified from equity to profit or loss, if such gains or losses would be reclassified
to profit or loss when the related assets or liabilities are disposed of.
~19~
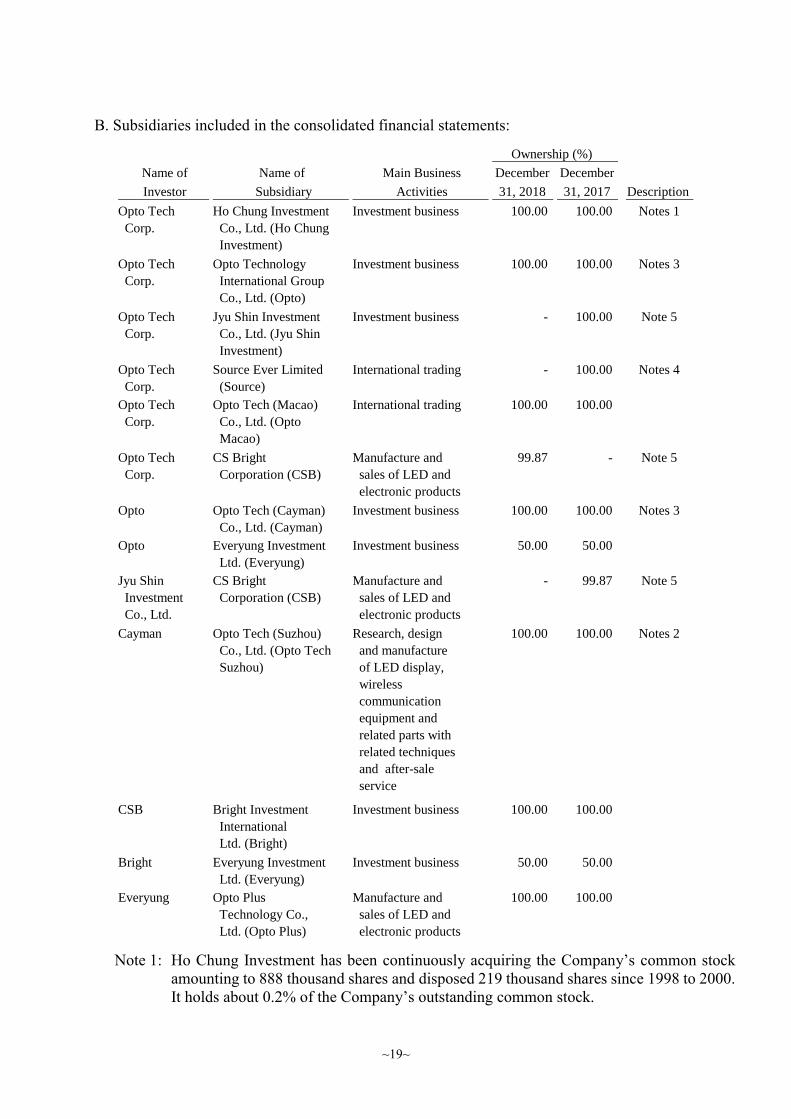
B. Subsidiaries included in the consolidated financial statements:
Note 1: Ho Chung Investment has been continuously acquiring the Company’s common stock
amounting to 888 thousand shares and disposed 219 thousand shares since 1998 to 2000.
It holds about 0.2% of the Company’s outstanding common stock.
Name of
Investor
Name of
Subsidiary
Main Business
Activities
December
31, 2018
December
31, 2017 Description
Opto Tech
Corp.
Ho Chung Investment
Co., Ltd. (Ho Chung
Investment)
Investment business 100.00 100.00 Notes 1
Opto Tech
Corp.
Opto Technology
International Group
Co., Ltd. (Opto)
Investment business 100.00 100.00 Notes 3
Opto Tech
Corp.
Jyu Shin Investment
Co., Ltd. (Jyu Shin
Investment)
Investment business - 100.00 Note 5
Opto Tech
Corp.
Source Ever Limited
(Source)
International trading - 100.00 Notes 4
Opto Tech
Corp.
Opto Tech (Macao)
Co., Ltd. (Opto
Macao)
International trading 100.00 100.00
Opto Tech
Corp.
CS Bright
Corporation (CSB)
Manufacture and
sales of LED and
electronic products
99.87 - Note 5
Opto Opto Tech (Cayman)
Co., Ltd. (Cayman)
Investment business 100.00 100.00 Notes 3
Opto Everyung Investment
Ltd. (Everyung)
Investment business 50.00 50.00
Jyu Shin
Investment
Co., Ltd.
CS Bright
Corporation (CSB)
Manufacture and
sales of LED and
electronic products
- 99.87 Note 5
Cayman Opto Tech (Suzhou)
Co., Ltd. (Opto Tech
Suzhou)
Research, design
and manufacture
of LED display,
wireless
communication
equipment and
related parts with
related techniques
and after-sale
service
100.00 100.00 Notes 2
CSB Bright Investment
International
Ltd. (Bright)
Investment business 100.00 100.00
Bright Everyung Investment
Ltd. (Everyung)
Investment business 50.00 50.00
Everyung Opto Plus
Technology Co.,
Ltd. (Opto Plus)
Manufacture and
sales of LED and
electronic products
100.00 100.00
Ownership (%)
~20~
Note 2: On August 11, 2016, the Board of Directors has resolved to liquidate the Company’s
Mainland China subsidiary, Opto Tech (Suzhou) Co., Ltd. (Opto Tech Suzhou). As of
December 31, 2018, the liquidation is still under process.
Note 3: On August 14, 2017, the Board of Directors has resolved to liquidate the Company’s
offshore company, Opto Technology International Group Co.,Ltd. (Opto) and Opto Tech
(Cayman) Co., Ltd.
Note 4: On August 14, 2017, the Board of Directors has resolved to liquidate Source Ever Limited,
which was dissolved on March, 2018, and the remaining funds were repatriated to Opto
Tech Corp.
Note 5: On November 8, 2018, the Board of Directors at their meeting resolved to enter into a
short-form merger with its subsidiary, Jyu Shin Investment. Under the merger, the
Company will be the surviving company while the Jyu Shin Investment will be the
dissolved company. The effective date is December 10, 2018.
C. Subsidiaries not included in the consolidated financial statements:None.
D. Adjustments for subsidiaries with different balance sheet dates:None.
E. Nature and extent of significant restrictions on its ability to access or use assets, and settle
liabilities of the Group:None.
F. Subsidiaries that have non-controlling interests that are material to the Group:None.
(4) Foreign currency translation
Items included in the financial statements of each of the Group’s entities are measured using the
currency of the primary economic environment in which the entity operates (the “functional
currency”). The consolidated financial statements are presented in New Taiwan dollar, which is the
Company’s functional and the Group’s presentation currency.
A. Foreign currency transactions and balances
(a) Foreign currency transactions are translated into the functional currency using the exchange
rates prevailing at the dates of the transactions or valuation where items are remeasured.
Foreign exchange gains and losses resulting from the settlement of such transactions are
recognised in profit or loss in the period in which they arise.
(b) Monetary assets and liabilities denominated in foreign currencies at the period end are re-
translated at the exchange rates prevailing at the balance sheet date. Exchange differences
arising upon re-translation at the balance sheet date are recognised in profit or loss.
(c) Non-monetary assets and liabilities denominated in foreign currencies held at fair value
through profit or loss are re-translated at the exchange rates prevailing at the balance sheet
date; their translation differences are recognised in profit or loss. Non-monetary assets and
liabilities denominated in foreign currencies held at fair value through other comprehensive
income are re-translated at the exchange rates prevailing at the balance sheet date; their
translation differences are recognised in other comprehensive income. However, non-
monetary assets and liabilities denominated in foreign currencies that are not measured at fair
value are translated using the historical exchange rates at the dates of the initial transactions.

~21~
B. Translation of foreign operations
(a) The operating results and financial position of all the group entities, associates and joint
arrangements that have a functional currency different from the presentation currency are
translated into the presentation currency as follows:
i. Assets and liabilities for each balance sheet presented are translated at the closing exchange
rate at the date of that balance sheet;
ii. Income and expenses for each statement of comprehensive income are translated at average
exchange rates of that period; and
iii. All resulting exchange differences are recognised in other comprehensive income.
(b) When the foreign operation partially disposed of or sold is an associate, exchange differences
that were recorded in other comprehensive income are proportionately reclassified to profit or
loss as part of the gain or loss on sale. In addition, even when the Group retains partial interest
in the former foreign associate or joint arrangement after losing significant influence over the
former foreign associate, or losing joint control of the former joint arrangement, such
transactions should be accounted for as disposal of all interest in these foreign operations.
(c) When the foreign operation partially disposed of or sold is a subsidiary, cumulative exchange
differences that were recorded in other comprehensive income are proportionately transferred
to the non-controlling interest in this foreign operation. In addition, even when the Group
retains partial interest in the former foreign subsidiary after losing control of the former foreign
subsidiary, such transactions should be accounted for as disposal of all interest in the foreign
operation.
(5) Classification of current and non-current items
A. Assets that meet one of the following criteria are classified as current assets; otherwise they are
classified as non-current assets:
(a) Assets arising from operating activities that are expected to be realised, or are intended to be
sold or consumed within the normal operating cycle;
(b) Assets held mainly for trading purposes;
(c) Assets that are expected to be realised within twelve months from the balance sheet date;
(d) Cash and cash equivalents, excluding restricted cash and cash equivalents and those that are
to be exchanged or used to settle liabilities more than twelve months after the balance sheet
date.
B. Liabilities that meet one of the following criteria are classified as current liabilities; otherwise
they are classified as non-current liabilities:
(a) Liabilities that are expected to be settled within the normal operating cycle;
(b) Liabilities arising mainly from trading activities;
(c) Liabilities that are to be settled within twelve months from the balance sheet date;
(d) Liabilities for which the repayment date cannot be extended unconditionally to more than
twelve months after the balance sheet date. Terms of a liability that could, at the option of the
~22~
counterparty, result in its settlement by the issue of equity instruments do not affect its
classification.
(6) Cash equivalents
Cash equivalents refer to short-term, highly liquid investments that are readily convertible to known
amounts of cash and which are subject to an insignificant risk of changes in value. Time deposits that
meet the definition above and are held for the purpose of meeting short-term cash commitments in
operations are classified as cash equivalents.
(7) Financial assets at fair value through profit or loss
A. Financial assets at fair value through profit or loss are financial assets that are not measured at
amortised cost or fair value through other comprehensive income.
B. On a regular way purchase or sale basis, financial assets at fair value through profit or loss are
recognised and derecognised using trade date accounting.
C. At initial recognition, the Group measures the financial assets at fair value and recognises the
transaction costs in profit or loss. The Group subsequently measures the financial assets at fair
value, and recognises the gain or loss in profit or loss.
D. The Group recognises the dividend income when the right to receive payment is established, future
economic benefits associated with the dividend will flow to the Group and the amount of the
dividend can be measured reliably.
(8) Financial assets at fair value through other comprehensive income
A. Financial assets at fair value through other comprehensive income comprise equity securities
which are not held for trading, and for which the Group has made an irrevocable election at initial
recognition to recognise changes in fair value in other comprehensive income and debt instruments
which meet all of the following criteria:
(a) The objective of the Group’s business model is achieved both by collecting contractual cash
flows and selling financial assets; and
(b) The assets’ contractual cash flows represent solely payments of principal and interest.
B. On a regular way purchase or sale basis, financial assets at fair value through other comprehensive
income are recognised and derecognised using trade date accounting.
C. At initial recognition, the Group measures the financial assets at fair value plus transaction costs.
The Group subsequently measures the financial assets at fair value:
The changes in fair value of equity investments that were recognised in other comprehensive
income are reclassified to retained earnings and are not reclassified to profit or loss following the
derecognition of the investment. Dividends are recognised as revenue when the right to receive
payment is established, future economic benefits associated with the dividend will flow to the
Group and the amount of the dividend can be measured reliably.
(9) Accounts and notes receivable
A. Accounts and notes receivable entitle the Group a legal right to receive consideration in exchange
for transferred goods or rendered services.

~23~
B. The short-term accounts and notes receivable without bearing interest are subsequently measured
at initial invoice amount as the effect of discounting is immaterial.
(10) Impairment of financial assets
For accounts receivable or contract assets that do not contain a significant financing component, at
each reporting date, the Group recognises the impairment provision for lifetime expected credit
losses (ECLs).
(11) Derecognition of financial assets
The Group derecognises a financial asset when one of the following conditions is met:
A. The contractual rights to receive the cash flows from the financial asset expire.
B. The contractual rights to receive cash flows of the financial asset have been transferred and the
Group has transferred substantially all risks and rewards of ownership of the financial asset.
C. The contractual rights to receive cash flows of the financial asset have been transferred; however,
the Group has not retained control of the financial asset.
(12) Inventories
Inventories are stated at the lower of cost and net realisable value. Cost is determined using the
weighted-average method. The cost of finished goods and work in progress comprises raw materials,
direct labour, other direct costs and related production overheads (allocated based on normal
operating capacity). It excludes borrowing costs. The item-by-item approach is used in applying the
lower of cost and net realisable value. Net realisable value is the estimated selling price in the
ordinary course of business, less the estimated cost of completion and applicable variable selling
expenses.
(13) Investments accounted for using equity method / associates
A. Associates are all entities over which the Group has significant influence but not control. In
general, it is presumed that the investor has significant influence, if an investor holds, directly or
indirectly 20 percent or more of the voting power of the investee. Investments in associates are
accounted for using the equity method and are initially recognised at cost.
B. The Group’s share of its associates’ post-acquisition profits or losses is recognised in profit or
loss, and its share of post-acquisition movements in other comprehensive income is recognized
in other comprehensive income. When the Group’s share of losses in an associate equals or
exceeds its interest in the associate, including any other unsecured receivables, the Group does
not recognise further losses, unless it has incurred legal or constructive obligations or made
payments on behalf of the associate.
C. When changes in an associate’s equity do not arise from profit or loss or other comprehensive
income of the associate and such changes do not affect the Group’s ownership percentage of the
associate, the Group recognises change in ownership interests in the associate in ‘capital surplus’
in proportion to its ownership.
D. Unrealised gains on transactions between the Group and its associates are eliminated to the extent
of the Group’s interest in the associates. Unrealised losses are also eliminated unless the
~24~
transaction provides evidence of an impairment of the asset transferred. Accounting policies of
associates have been adjusted where necessary to ensure consistency with the policies adopted
by the Group.
E. In the case that an associate issues new shares and the Group does not subscribe or acquire new
shares proportionately, which results in a change in the Group’s ownership percentage of the
associate but maintains significant influence on the associate, then ‘capital surplus’ and
‘investments accounted for under the equity method’ shall be adjusted for the increase or
decrease of its share of equity interest. If the above condition causes a decrease in the Group’s
ownership percentage of the associate, in addition to the above adjustment, the amounts
previously recognised in other comprehensive income in relation to the associate are reclassified
to profit or loss proportionately on the same basis as would be required if the relevant assets or
liabilities were disposed of.
F. Upon loss of significant influence over an associate, the Group remeasures any investment
retained in the former associate at its fair value. Any difference between fair value and carrying
amount is recognised in profit or loss.
G. When the Group disposes its investment in an associate and loses significant influence over this
associate, the amounts previously recognised in other comprehensive income in relation to the
associate, are reclassified to profit or loss, on the same basis as would be required if the relevant
assets or liabilities were disposed of. If it retains significant influence over this associate, the
amounts previously recognised in other comprehensive income in relation to the associate are
reclassified to profit or loss proportionately in accordance with the aforementioned approach.
H. When the Group disposes its investment in an associate and loses significant influence over this
associate, the amounts previously recognised as capital surplus in relation to the associate are
transferred to profit or loss. If it retains significant influence over this associate, the amounts
previously recognised as capital surplus in relation to the associate are transferred to profit or
loss proportionately.
(14) Property, plant and equipment
A. Property, plant and equipment are initially recorded at cost. Borrowing costs incurred during the
construction period are capitalised.
B. Subsequent costs are included in the asset’s carrying amount or recognised as a separate asset, as
appropriate, only when it is probable that future economic benefits associated with the item will
flow to the Group and the cost of the item can be measured reliably. The carrying amount of the
replaced part is derecognised. All other repairs and maintenance are charged to profit or loss
during the financial period in which they are incurred.
C. Land is not depreciated. Other property, plant and equipment apply cost model and are
depreciated using the straight-line method to allocate their cost over their estimated useful lives.
Each part of an item of property, plant, and equipment with a cost that is significant in relation
to the total cost of the item must be depreciated separately.

~25~
D. The assets’ residual values, useful lives and depreciation methods are reviewed, and adjusted if
appropriate, at each financial year-end. If expectations for the assets’ residual values and useful
lives differ from previous estimates or the patterns of consumption of the assets’ future economic
benefits embodied in the assets have changed significantly, any change is accounted for as a
change in estimate under IAS 8, ‘Accounting Policies, Changes in Accounting Estimates and
Errors’, from the date of the change. The estimated useful lives of property, plant and equipment
are as follows:
Buildings and structures 10 ~ 50 years
Machinery and equipment 8 ~ 10 years
Utility equipment 6 ~ 25 years
Pollution prevention facilities 8 ~ 20 years
Transportation equipment 3 ~ 5 years
Office equipment 3 ~ 7 years
Other equipment 3 ~ 25 years
(15) Leased assets/ operating leases (lessee)
Payments made under an operating lease (net of any incentives received from the lessor) are
recognised in profit or loss on a straight-line basis over the lease term.
(16) Intangible assets
Intangible assets, mainly computer software, is stated at cost and amortised on a straight-line basis
over its estimated useful life of 2 to 10 years.
(17) Impairment of non-financial assets
The Group assesses at each balance sheet date the recoverable amounts of those assets where there
is an indication that they are impaired. An impairment loss is recognised for the amount by which
the asset’s carrying amount exceeds its recoverable amount. The recoverable amount is the higher
of an asset’s fair value less costs to sell or value in use. When the circumstances or reasons for
recognizing impairment loss for an asset in prior years no longer exist or diminish, the impairment
loss is reversed. The increased carrying amount due to reversal should not be more than what the
depreciated or amortised historical cost would have been if the impairment had not been recognised.
(18) Borrowings
A. Borrowings are recognised initially at fair value, net of transaction costs incurred. Borrowings
are subsequently stated at amortised cost; any difference between the proceeds (net of transaction
costs) and the redemption value is recognised in profit or loss over the period of the borrowings
using the effective interest method.
B. Fees paid on the establishment of loan facilities are recognised as transaction costs of the loan to
the extent that it is probable that some or all of the facility will be drawn down. In this case, the
fee is deferred until the draw-down occurs. To the extent there is no evidence that it is probable
that some or all of the facility will be drawn down, the fee is capitalised as a pre-payment for
liquidity services and amortised over the period of the facility to which it relates.

~26~
(19) Notes and accounts payable
Notes and accounts payable are obligations to pay for goods or services that have been acquired in
the ordinary course of business from suppliers. They are recognised initially at fair value and
subsequently measured at amortised cost using the effective interest method. However, short-term
accounts payable without bearing interest are subsequently measured at initial invoice amount as
the effect of discounting is immaterial.
(20) Financial liabilities at fair value through profit or loss
A. Financial liabilities are classified in this category of held for trading if acquired principally for
the purpose of repurchasing in the short-term. Derivatives are also categorised as financial
liabilities held for trading unless they are designated as hedges, or financial liabilities at fair value
through profit or loss. Financial liabilities that meet one of the following criteria are designated
as at fair value through profit or loss at initial recognition:
(a) Hybrid (combined) contracts; or
(b) They eliminate or significantly reduce a measurement or recognition inconsistency; or
(c) They are managed and their performance is evaluated on a fair value basis, in accordance with
a documented risk management policy.
B. At initial recognition, the Group measures the financial liabilities at fair value. All related
transaction costs are recognised in profit or loss. The Group subsequently measures these
financial liabilities at fair value with any gain or loss recognised in profit or loss.
C. If the credit risk results in fair value changes in financial liabilities designated as at fair value
through profit or loss, they are recognised in other comprehensive income in the circumstances
other than avoiding accounting mismatch or recognising in profit or loss for loan commitments
or financial guarantee contracts.
(21) Derecognition of financial liabilities
A financial liability is derecognised when the obligation under the liability specified in the contract
is discharged or cancelled or expires.
(22) Offsetting financial instruments
Financial assets and liabilities are offset and reported in the net amount in the balance sheet when
there is a legally enforceable right to offset the recognised amounts and there is an intention to settle
on a net basis or realise the asset and settle the liability simultaneously.
(23) Non-hedging derivatives
Non-hedging derivatives are initially recognised at fair value on the date a derivative contract is
entered into and recorded as financial assets or financial liabilities at fair value through profit or loss.
They are subsequently remeasured at fair value and the gains or losses are recognised in profit or
loss.
(24) Provisions
Provisions, mainly warranties, are recognised when the Group has a present legal or constructive
obligation as a result of past events, and it is probable that an outflow of economic resources will be
~27~
required to settle the obligation and the amount of the obligation can be reliably estimated.
Provisions are measured at the present value of the expenditures expected to be required to settle
the obligation on the balance sheet date, which is discounted using a pre-tax discount rate that
reflects the current market assessments of the time value of money and the risks specific to the
obligation. When discounting is used, the increase in the provision due to passage of time is
recognised as interest expense. Provisions are not recognised for future operating losses.
(25) Employee benefits
A. Short-term employee benefits
Short-term employee benefits are measured at the undiscounted amount of the benefits expected
to be paid in respect of service rendered by employees in a period and should be recognised as
expense in that period when the employees render service.
B. Pensions
(a) Defined contribution plans
For defined contribution plans, the contributions are recognised as pension expense when
they are due on an accrual basis. Prepaid contributions are recognised as an asset to the extent
of a cash refund or a reduction in the future payments.
(b) Defined benefit plans
i. Net obligation under a defined benefit plan is defined as the present value of an amount of
pension benefits that employees will receive on retirement for their services with the Group
in current period or prior periods. The liability recognised in the balance sheet in respect of
defined benefit pension plans is the present value of the defined benefit obligation at the
balance sheet date less the fair value of plan assets. The net defined benefit obligation is
calculated annually by independent actuaries using the projected unit credit method. The
rate used to discount is determined by using interest rates of government bonds (at the
balance sheet date) that are denominated in the currency in which the benefits will be paid,
and that have terms to maturity approximating to the terms of the related pension liability.
ii. Remeasurements arising on defined benefit plans are recognised in other comprehensive
income in the period in which they arise and are recorded as retained earnings.
C. Termination benefits
Termination benefits are employee benefits provided in exchange for the termination of
employment as a result from either the Group’s decision to terminate an employee’s employment
before the normal retirement date, or an employee’s decision to accept an offer of redundancy
benefits in exchange for the termination of employment. The Group recognises expense as it can
no longer withdraw an offer of termination benefits or it recognises relating restructuring costs,
whichever is earlier. Benefits that are expected to be due more than 12 months after balance sheet
date shall be discounted to their present value.
D. Employees’ compensation and directors’ and supervisors’ remuneration
Employees’ compensation and directors’ and supervisors’ remuneration are recognised as
~28~
expense and liability, provided that such recognition is required under legal or constructive
obligation and those amounts can be reliably estimated. Any difference between the resolved
amounts and the subsequently actual distributed amounts is accounted for as changes in estimates.
(26) Employee share-based payment
For the equity-settled share-based payment arrangements, the employee services received are
measured at the fair value of the equity instruments granted at the grant date, and are recognised as
compensation cost over the vesting period, with a corresponding adjustment to equity. The fair value
of the equity instruments granted shall reflect the impact of market vesting conditions and nonmarket
vesting conditions. Compensation cost is subject to adjustment based on the service conditions that
are expected to be satisfied and the estimates of the number of equity instruments that are expected
to vest under the non-market vesting conditions at each balance sheet date.
Ultimately, the amount of compensation cost recognised is based on the number of equity
instruments that eventually vest.
(27) Income tax
A. The tax expense for the period comprises current and deferred tax. Tax is recognised in profit or
loss, except to the extent that it relates to items recognised in other comprehensive income or
items recognised directly in equity, in which cases the tax is recognised in other comprehensive
income or equity.
B. The current income tax expense is calculated on the basis of the tax laws enacted or substantively
enacted at the balance sheet date in the countries where the Company and its subsidiaries operate
and generate taxable income. Management periodically evaluates positions taken in tax returns
with respect to situations in accordance with applicable tax regulations. It establishes provisions
where appropriate based on the amounts expected to be paid to the tax authorities. An additional
10% tax is levied on the unappropriated retained earnings and is recorded as income tax expense
in the year the stockholders resolve to retain the earnings.
C. Deferred tax is recognised, using the balance sheet liability method, on temporary differences
arising between the tax bases of assets and liabilities and their carrying amounts in the
consolidated balance sheet. Deferred tax is provided on temporary differences arising on
investments in subsidiaries, except where the timing of the reversal of the temporary difference
is controlled by the Group and it is probable that the temporary difference will not reverse in the
foreseeable future. Deferred tax is determined using tax rates (and laws) that have been enacted
or substantially enacted by the balance sheet date and are expected to apply when the related
deferred tax asset is realised or the deferred tax liability is settled.
D. Deferred tax assets are recognised only to the extent that it is probable that future taxable profit
will be available against which the temporary differences can be utilised. At each balance sheet
date, unrecognised and recognised deferred tax assets are reassessed.
E. Current income tax assets and liabilities are offset and the net amount reported in the balance
sheet when there is a legally enforceable right to offset the recognised amounts and there is an

~29~
intention to settle on a net basis or realise the asset and settle the liability simultaneously.
Deferred tax assets and liabilities are offset on the balance sheet when the entity has the legally
enforceable right to offset current tax assets against current tax liabilities and they are levied by
the same taxation authority on either the same entity or different entities that intend to settle on
a net basis or realise the asset and settle the liability simultaneously.
(28) Share capital
A. Ordinary shares are classified as equity. Incremental costs directly attributable to the issue of new
shares or stock options are shown in equity as a deduction, net of tax, from the proceeds.
B. Where the Company repurchases the Company’s equity share capital that has been issued, the
consideration paid, including any directly attributable incremental costs (net of income taxes) is
deducted from equity attributable to the Company’s equity holders. Where such shares are
subsequently reissued, the difference between their book value and any consideration received,
net of any directly attributable incremental transaction costs and the related income tax effects,
is included in equity attributable to the Company’s equity holders.
(29) Dividends
Dividends are recorded in the Company’s financial statements in the period in which they are
resolved by the Company’s shareholders. Cash dividends are recorded as liabilities.
(30) Revenue recognition
A. Sales of goods
(a) The Group is primarily engaged in the manufacture and sales of semiconductor components.
Sales are recognised when control of the products has transferred, being when the products
are delivered to the client, the client has full discretion over the channel and price to sell the
products, and there is no unfulfilled obligation. Delivery occurs when the products have been
shipped to the specific location, the risks of obsolescence and loss have been transferred to
the client, and either the client has accepted the products in accordance with the sales contract,
or the Group has objective evidence that all criteria for acceptance have been satisfied. As
the time interval between the transfer of committed goods and the payment of customer does
not exceed one year, the Group does not adjust the transaction price to reflect the time value
of money.
(b) A receivable is recognised when the goods are delivered as this is the point in time that the
consideration is unconditional because only the passage of time is required before the
payment is due.
B. Sales and installation of systems products
(a) Contracts include sales and installation services of systems products. The system products
and the installation services provided by the Group are mostly not distinct and are identified
to be one performance obligation since the installation services involve significant
customisation and modification. Some contracts are accounted for as a separate performance
obligation, and the transaction price will be allocated to each performance obligation based

~30~
on the stand-alone selling prices. The Group recognises revenue when the performance
obligation is satisfied.
(b) The Group provides standard warranties on system products sold. Warranties are estimated
based on historical warranty data of system products, and recognised when the amount can
be reliably estimated.
(31) Operating segments
Operating segments are reported in a manner consistent with the internal reporting provided to the
Chief Operating Decision-Maker. The Group’s Chief Operating Decision-Maker, who is responsible
for allocating resources and assessing performance of the operating segments, has been identified
as the Board of Directors that makes strategic decisions.
(32) Reorganisation
Reorganisation under common control is recognised using book value approach.
5. CRITICAL ACCOUNTING JUDGEMENTS, ESTIMATES AND KEY SOURCES OF ASSUMPTION
UNCERTAINTY
The preparation of these consolidated financial statements requires management to make critical
judgements in applying the Group’s accounting policies and make critical assumptions and estimates
concerning future events. Assumptions and estimates may differ from the actual results and are
continually evaluated and adjusted based on historical experience and other factors. Such assumptions
and estimates have a significant risk of causing a material adjustment to the carrying amounts of assets
and liabilities within the next financial year; and the related information is addressed below:
(1) Critical judgements in applying the Group’s accounting policies
None.
(2) Critical accounting estimates and assumptions
A. Allowance for inventory valuation losses
As the value of the Group’s inventories are effected by market prices and product life cycles, there
is a higher risk of obsolescence. For inventories aged over a certain period of time and individually
identified as obsolete, the net realisable value is estimated based on historical data of inventory
closeout. The net realisable value utilised in evaluating obsolete inventories involves uncertainty
of estimation as it is subject to management’s judgement. Inventories and allowance for inventory
voluation losses were material to the consolidated financial statements.
As of December 31, 2018, the carrying amount of inventories was $1,331,401.
B. Financial assets - fair value measurement of unlisted stocks without active market
For unlisted securities without active market held by the Group, management assesses their fair
values through market approach and takes into account the discount for liquidity. The valuation
method is subject to management’s judgement and involves uncertainty, which would effect fair
value. Please refer to Note 12(c).
As of December 31, 2018, the carrying amount of unlisted stocks without active market was
$889,926.

~31~
6. DETAILS OF SIGNIFICANT ACCOUNTS
(1) Cash and cash equivalents
A. The Group transacts with a variety of financial institutions all with high credit quality to disperse
credit risk, so it expects that the probability of counterparty default is remote.
B. Cash and cash equivalents amounting to $20,860 were pledged to others as collateral, and were
classified as other financial assets. Please refer to Note 8.
(2) Financial assets at fair value through profit or loss
A. The Group recognised net gain of $16,176 on financial assets measured at fair value through profit
or loss for the year ended December 31, 2018.
B. The non-hedging derivative instrument transactions and contract information are as follows:
The Group entered into forward exchange contracts to sell USD and buy TWD to hedge exchange
rate risk of export proceeds. However, these forward exchange contracts are not accounted for
December 31, 2018 December 31, 2017
Cash on hand 608$ 510$
Checking demand deposits 502,047 567,641
Time deposits 1,727,571 1,556,424
Cash equivalents - Resale bonds 460,000 420,000
Total 2,690,226$ 2,544,575$
Items December 31, 2018
Current items:
Financial assets mandatorily measured at
fair value through profit or loss
Funds 215,000$
Valuation adjustment
Funds 5,140
Forward exchange contracts 241
Total 220,381$
Non-current items:
Financial assets mandatorily measured at
fair value through profit and loss
Unlisted stocks 127,048$
Valuation adjustment 20,149)(
Total 106,899$
Derivative Instruments Contract period
Assets - Current items:
Forward exchange contracts USD 3,000$
(thousands)
December 31, 2018
Contract Amount
(Nominal Principal)
December 6, 2018~
January 17, 2019
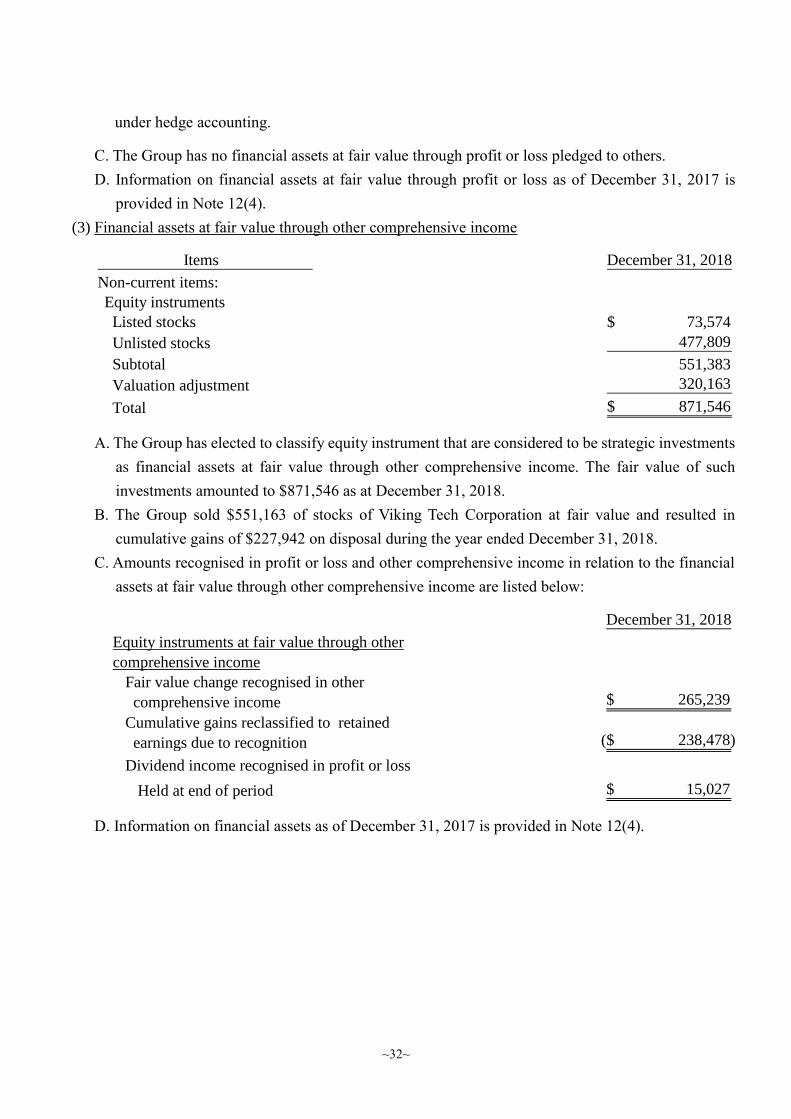
~32~
under hedge accounting.
C. The Group has no financial assets at fair value through profit or loss pledged to others.
D. Information on financial assets at fair value through profit or loss as of December 31, 2017 is
provided in Note 12(4).
(3) Financial assets at fair value through other comprehensive income
A. The Group has elected to classify equity instrument that are considered to be strategic investments
as financial assets at fair value through other comprehensive income. The fair value of such
investments amounted to $871,546 as at December 31, 2018.
B. The Group sold $551,163 of stocks of Viking Tech Corporation at fair value and resulted in
cumulative gains of $227,942 on disposal during the year ended December 31, 2018.
C. Amounts recognised in profit or loss and other comprehensive income in relation to the financial
assets at fair value through other comprehensive income are listed below:
D. Information on financial assets as of December 31, 2017 is provided in Note 12(4).
Items December 31, 2018
Non-current items:
Equity instruments
Listed stocks 73,574$
Unlisted stocks 477,809
Subtotal 551,383
Valuation adjustment 320,163
Total 871,546$
December 31, 2018
Equity instruments at fair value through other
comprehensive income
Fair value change recognised in other
comprehensive income 265,239$
Cumulative gains reclassified to retained
earnings due to recognition 238,478)($
Dividend income recognised in profit or loss
Held at end of period 15,027$

~33~
(4) Notes and accounts receivable
A. The ageing analysis of accounts receivable is as follows:
The ageing analysis was based on the past due collection date.
B. The ageing analysis of notes receivable is as follows:
The ageing analysis was based on the maturity date of the promissory note.
C. Information relating to credit risk of accounts receivable and notes receivable is provided in Note
12(2).
(5) Inventories
The cost of inventories recognised as expense for the period:
December 31, 2018 December 31, 2017
Notes receivable 13,119$ 24,988$
Accounts receivable 1,625,237 1,497,554
Accounts receivable - related parties 79,472 98,722
Less: Allowance for doubtful accounts 49,488)( 50,672)(
Allowance for doubtful accounts -
related parties 955)( 3,788)(
1,667,385$ 1,566,804$
December 31, 2018 December 31, 2017
Without past due 1,595,445$ 1,476,805$
Up to 180 days 68,875 78,696
181 to 360 days 7,098 2,265
Over 361 days 33,291 38,510
1,704,709$ 1,596,276$
December 31, 2018 December 31, 2017
Without past due 13,119$ 24,988$
December 31, 2018 December 31, 2017
Raw materials 364,099$ 215,355$
Supplies 210,858 222,323
Work in process 286,521 317,501
Semi-finished goods 152,427 60,317
Finished goods 317,496 282,455
Total 1,331,401$ 1,097,951$
2018 2017
Cost of goods sold 3,855,780$ 3,858,091$
(Loss on) gain from reversal of decline in
market value 113,042)( 77,664
3,742,738$ 3,935,755$
For the years ended December 31,

~34~
During the year ended December 31, 2018, the Group reversed a previous inventory write-down and
accounted for as reduction of cost of goods sold because prices of products increased and inventory
of low-priced stocks declined.
During the year ended December 31, 2017, the Group wrote down inventory from cost to net
realisable value accounted for as ‘cost of goods sold’.
(6) Investments accounted for using equity method
2018 2017
At January 1 5,235$ 1,202$
Share of (loss) profit of investments accounted
for using equity method 4,526)( 3,722
Change in other equity items (Note 6(19)) 68)( 311
At December 31 641$ 5,235$
Associated enterprises December 31, 2018 December 31, 2017
VML TECHNOLOGIES B.V. 641$ 5,235$

~35~
(7) Property, plant and equipment
Construction in
Pollution progress and
Buildings Utility prevention Transportation Office Other prepayment for
At January 1, 2018 and structures Machinery facilities facilities equipment equipment equipment equipment Total
Cost 2,023,361$ 5,123,400$ 1,064,064$ 677,355$ 9,151$ 65,902$ 1,846,504$ 137,628$ 10,947,365$
Accumulated depreciation 1,023,900)( 4,027,610)( 920,795)( 562,632)( 6,559)( 60,142)( 1,459,826)( - 8,061,464)(
Accumulated impairment 59)( 7,809)( - - - 143)( 122)( - 8,133)(
999,402$ 1,087,981$ 143,269$ 114,723$ 2,592$ 5,617$ 386,556$ 137,628$ 2,877,768$
2018
Opening net book amount 999,402$ 1,087,981$ 143,269$ 114,723$ 2,592$ 5,617$ 386,556$ 137,628$ 2,877,768$
Additions 2,579 62,925 14,588 3,195 619 2,760 20,501 523,512 630,679
Disposals - 51)( - - 179)( - 434)( - 664)(
Reclassifications 6,675 382,291 17,551 25,964 - 9,333 44,478 486,292)( -
Depreciation expense 60,514)( 271,009)( 25,098)( 14,436)( 918)( 5,281)( 55,517)( - 432,773)(
Net exchange differences 2,583)( 812)( - - 8)( 4)( - - 3,407)(
Closing net book amount 945,559$ 1,261,325$ 150,310$ 129,446$ 2,106$ 12,425$ 395,584$ 174,848$ 3,071,603$
At December 31, 2018
Cost 2,027,334$ 5,520,427$ 1,097,977$ 706,514$ 8,969$ 76,724$ 1,899,447$ 174,848$ 11,512,240$
Accumulated depreciation 1,081,716)( 4,251,295)( 947,667)( 577,068)( 6,863)( 64,280)( 1,503,780)( - 8,432,669)(
Accumulated impairment 59)( 7,807)( - - - 19)( 83)( - 7,968)(
945,559$ 1,261,325$ 150,310$ 129,446$ 2,106$ 12,425$ 395,584$ 174,848$ 3,071,603$

~36~
Construction in
Pollution progress and
Buildings Utility prevention Transportation Office Other prepayment for
At January 1, 2017 and structures Machinery facilities facilities equipment equipment equipment equipment Total
Cost 2,019,203$ 5,008,102$ 1,044,489$ 655,617$ 10,227$ 67,582$ 1,786,569$ 128,924$ 10,720,713$
Accumulated depreciation 964,073)( 3,818,898)( 901,013)( 567,712)( 7,389)( 58,322)( 1,409,791)( - 7,727,198)(
Accumulated impairment 59)( 7,866)( - - 63)( 205)( 144)( - 8,337)(
1,055,071$ 1,181,338$ 143,476$ 87,905$ 2,775$ 9,055$ 376,634$ 128,924$ 2,985,178$
2017
Opening net book amount 1,055,071$ 1,181,338$ 143,476$ 87,905$ 2,775$ 9,055$ 376,634$ 128,924$ 2,985,178$
Additions 6,198 63,125 14,950 2,219 396 644 10,790 202,259 300,581
Disposals - 206)( - 308)( 208)( 17)( 8)( - 747)(
Reclassifications 1,420 100,484 4,625 35,867 585 - 50,574 193,555)( -
Depreciation expense 61,419)( 256,087)( 19,782)( 10,960)( 943)( 4,056)( 51,441)( - 404,688)(
Reversal of impairment loss - 3 - - - 18 7 - 28
Net exchange differences 1,868)( 676)( - - 13)( 27)( - - 2,584)(
Closing net book amount 999,402$ 1,087,981$ 143,269$ 114,723$ 2,592$ 5,617$ 386,556$ 137,628$ 2,877,768$
At December 31, 2017
Cost 2,023,361$ 5,123,400$ 1,064,064$ 677,355$ 9,151$ 65,902$ 1,846,504$ 137,628$ 10,947,365$
Accumulated depreciation 1,023,900)( 4,027,610)( 920,795)( 562,632)( 6,559)( 60,142)( 1,459,826)( - 8,061,464)(
Accumulated impairment 59)( 7,809)( - - - 143)( 122)( - 8,133)(
999,402$ 1,087,981$ 143,269$ 114,723$ 2,592$ 5,617$ 386,556$ 137,628$ 2,877,768$

~37~
A. Amount of borrowing costs capitalised as part of property, plant and equipment and the range of
the interest rates for such capitalization are as follows:
B. Information about the property, plant and equipment that were pledged to others as collaterals is
provided in Note 8.
(8) Intangible assets
2018 2017
Amount capitalised 2,064$ 405$
Interest rate 0.58%~1.40% 0.17%~0.92%
For the years ended December 31,
At January 1, 2018 Software
Cost 32,231$
Accumulated amortisation 23,180)(
9,051$
Opening net book amount 9,051$
Additions 11,925
Amortisation expense 12,136)(
Closing net book amount 8,840$
At December 31, 2018
Cost 31,627$
Accumulated amortisation 22,787)(
8,840$
For the year ended December 31, 2018
At January 1, 2017 Software
Cost 33,543$
Accumulated amortisation 24,230)(
9,313$
Opening net book amount 9,313$
Additions 12,637
Amortisation expense 12,899)(
Closing net book amount 9,051$
At December 31, 2017
Cost 32,231$
Accumulated amortisation 23,180)(
9,051$
For the year ended December 31, 2017

~38~
Details of amortisation on intangible assets are as follows:
(9) Long-term prepaid rents (shown as “Other non-current assets”)
The Group signed the land-use rights contract in the People’s Republic of China. The expiration date
of the contract is in year 2053. The entire lease payment had been prepaid when the contract was
signed. The amortised expense recognised was $122 and $105 for the years ended December 31, 2018
and 2017, respectively.
(10) Short-term borrowings
(11) Other payables
(12) Long-term borrowings
December 31, 2017: None.
2018 2017
Operating costs 4,156$ 4,687$
Selling expenses 687 749
General and administration expenses 4,606 4,813
Research and development expenses 2,687 2,650
Total 12,136$ 12,899$
For the years ended December 31,
December 31, 2018 December 31, 2017
Land-use rights 3,584$ 3,764$
Type of borrowings December 31, 2018 December 31, 2017
Unsecured bank borrowings 737,660$ 899,677$
Interest rate range 0.53%~5.25% 0.53%~6.50%
December 31, 2018 December 31, 2017
Salaries and bonus payable 177,565$ 155,464$
Compensation payable to employee 112,897 117,173
Remuneration payable to directors and
supervisors 37,632 35,078
Others 271,434 228,871
Total 599,528$ 536,586$
Interest rate
Type of borrowings Credit line Period range
Unsecured Bank borrowings
from Land Bank of Taiwan
200,000$ 2018.09.20~
2021.08.28
1.30% 200,000$
Unsecured Bank borrowings
from Mega Bank
50,000 2018.12.06~
2021.06.07
1.83% 50,000
-
250,000$
December 31, 2018
Less: Current portion (shown as “Other non-current liabilities”)
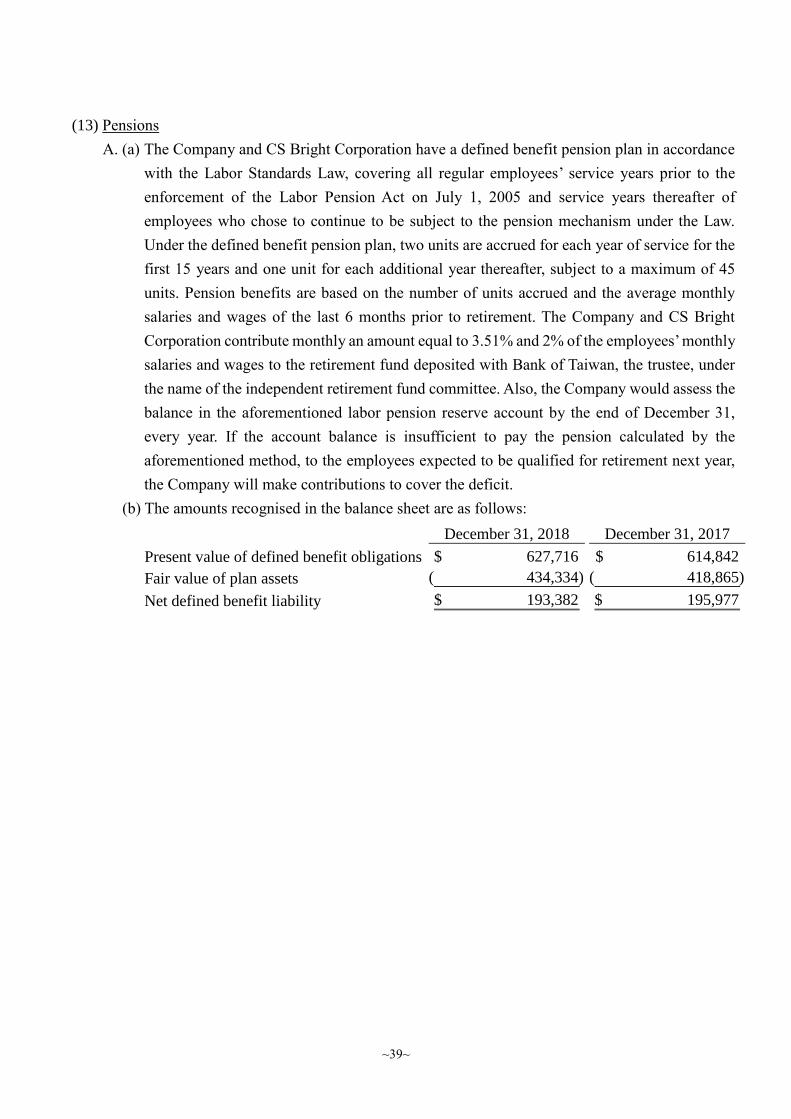
~39~
(13) Pensions
A. (a) The Company and CS Bright Corporation have a defined benefit pension plan in accordance
with the Labor Standards Law, covering all regular employees’ service years prior to the
enforcement of the Labor Pension Act on July 1, 2005 and service years thereafter of
employees who chose to continue to be subject to the pension mechanism under the Law.
Under the defined benefit pension plan, two units are accrued for each year of service for the
first 15 years and one unit for each additional year thereafter, subject to a maximum of 45
units. Pension benefits are based on the number of units accrued and the average monthly
salaries and wages of the last 6 months prior to retirement. The Company and CS Bright
Corporation contribute monthly an amount equal to 3.51% and 2% of the employees’ monthly
salaries and wages to the retirement fund deposited with Bank of Taiwan, the trustee, under
the name of the independent retirement fund committee. Also, the Company would assess the
balance in the aforementioned labor pension reserve account by the end of December 31,
every year. If the account balance is insufficient to pay the pension calculated by the
aforementioned method, to the employees expected to be qualified for retirement next year,
the Company will make contributions to cover the deficit.
(b) The amounts recognised in the balance sheet are as follows:
December 31, 2018 December 31, 2017
Present value of defined benefit obligations 627,716$ 614,842$
Fair value of plan assets 434,334)( 418,865)(
Net defined benefit liability 193,382$ 195,977$
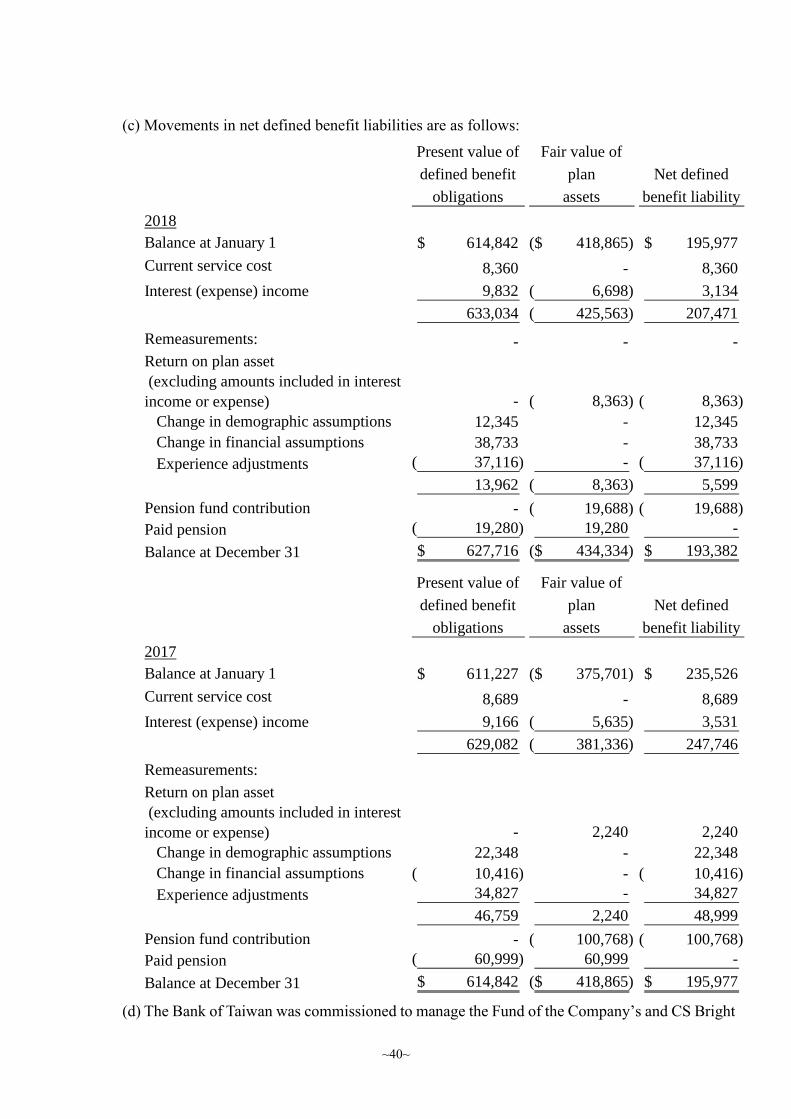
~40~
(c) Movements in net defined benefit liabilities are as follows:
(d) The Bank of Taiwan was commissioned to manage the Fund of the Company’s and CS Bright
Present value of
defined benefit
obligations
Fair value of
plan
assets
Net defined
benefit liability
2018
Balance at January 1 614,842$ 418,865)($ 195,977$
Current service cost 8,360 - 8,360
Interest (expense) income 9,832 6,698)( 3,134
633,034 425,563)( 207,471
Remeasurements: - - -
Return on plan asset
(excluding amounts included in interest
income or expense) - 8,363)( 8,363)(
Change in demographic assumptions 12,345 - 12,345
Change in financial assumptions 38,733 - 38,733
Experience adjustments 37,116)( - 37,116)(
13,962 8,363)( 5,599
Pension fund contribution - 19,688)( 19,688)(
Paid pension 19,280)( 19,280 -
Balance at December 31 627,716$ 434,334)($ 193,382$
Present value of
defined benefit
obligations
Fair value of
plan
assets
Net defined
benefit liability
2017
Balance at January 1 611,227$ 375,701)($ 235,526$
Current service cost 8,689 - 8,689
Interest (expense) income 9,166 5,635)( 3,531
629,082 381,336)( 247,746
Remeasurements:
Return on plan asset
(excluding amounts included in interest
income or expense) - 2,240 2,240
Change in demographic assumptions 22,348 - 22,348
Change in financial assumptions 10,416)( - 10,416)(
Experience adjustments 34,827 - 34,827
46,759 2,240 48,999
Pension fund contribution - 100,768)( 100,768)(
Paid pension 60,999)( 60,999 -
Balance at December 31 614,842$ 418,865)($ 195,977$

~41~
Corporation’s defined benefit pension plan in accordance with the Fund’s annual investment
and utilisation plan and the “Regulations for Revenues, Expenditures, Safeguard and
Utilisation of the Labor Retirement Fund” (Article 6: The scope of utilisation for the Fund
includes deposit in domestic or foreign financial institutions, investment in domestic or
foreign listed, over-the-counter, or private placement equity securities, investment in
domestic or foreign real estate securitization products, etc.). With regard to the utilisation of
the Fund, its minimum earnings in the annual distributions on the final financial statements
shall be no less than the earnings attainable from the amounts accrued from two-year time
deposits with the interest rates offered by local banks. If the earnings is less than
aforementioned rates, government shall make payment for the deficit after being authorized
by the Regulator. The Company and CS Bright Corporation have no right to participate in
managing and operating that fund and hence the Company and CS Bright Corporation are
unable to disclose the classification of plan assets fair value in accordance with IAS 19
paragraph 142. The composition of fair value of plan assets as of December 31, 2018 and
2017 is given in the Annual Labor Retirement Fund Utilisation Report announced by the
government.
(e) The principal actuarial assumptions used were as follows:
Future mortality rate was estimated based on the 5th Taiwan Standard Ordinary Experience
Mortality Table.
Because the main actuarial assumption changed, the present value of defined benefit
obligation is affected. The analysis was as follows:
The sensitivity analysis above is based on one assumption which changed while the other
conditions remain unchanged. In practice, more than one assumption may change all at once.
The method of analysing sensitivity and the method of calculating net pension liability in the
balance sheet are the same.
2018 2017
Discount rate 1.125%~1.2% 1.25%~1.60%
Future salary increases 1.75%~3% 1.75%~3%
For the years ended December 31,
Increase
0.25%~0.5%
Decrease
0.25%~0.5%
Increase
0.25%~0.5%
Decrease
0.25%~0.5%
December 31, 2018
Effect on present value of
defined benefit obligation 48,840)($ 53,873$ 52,616$ 48,249)($
December 31, 2017
Effect on present value of
defined benefit obligation 49,667)($ 54,975$ 53,913$ 49,252)($
Discount rate Future salary increases

~42~
The methods and types of assumptions used in preparing the sensitivity analysis did not
change compared to the previous period.
(f) Expected contributions to the defined benefit pension plans of the Group for the year ending
December 31, 2019 amount to $9,682.
(g) As of December 31, 2018, the Company’s and CS Bright Corporation’s weighted average
duration of the retirement plan is 16 and 12 years, respectively. The analysis of timing of
the future pension payment was as follows:
B. (a) Effective July 1, 2005, the Company and its CS Bright Corporation established a defined
contribution pension plan (the “New Plan”) under the Labor Pension Act (the “Act”),
covering all regular employees with R.O.C. nationality. Under the New Plan, the Company
and CS Bright Corporation contribute monthly an amount based on 6% of the employees’
monthly salaries and wages to the employees’ individual pension accounts at the Bureau of
Labor Insurance. The benefits accrued are paid monthly or in lump sum upon termination of
employment.
(b) The Company’s Mainland China subsidiaries, Opto Tech (Suzhou) Co., Ltd. and Opto Plus
Technology Co., Ltd., have defined contribution plans. Monthly contributions to an
independent fund administered by the government in accordance with the pension regulations
in the People’s Republic of China (P.R.C.) are based on certain percentage of employees’
monthly salaries and wages. The above Mainland China subsidiaries’ contribution percentage
for both the years ended December 31, 2018 and 2017 was 20% and 14%, respectively. Other
than the monthly contributions, the Group has no further obligations.
(c) The pension costs under defined contribution pension plans of the Group for the years ended
December 31, 2018 and 2017 were $40,256 and $38,700, respectively.
(14) Share-based payment
A. Details of the employee stock options are set forth below:
Within 1 year 478,064$
1-2 year(s) 14,698
2-5 years 14,445
Over 5 years 1,462
508,669$

~43~
B. The weighted-average stock price of stock options at exercise dates for the year ended December
31, 2017 was $18.03.
C. On August 14, 2017, the Board of Directors of the Company approved the issuance of employee
stock options authorized in 2010. The exercise price were adjusted from $14.6 (in dollars) to
$18.2 (in dollars).
D. On July 7, 2017, the Board of Directors of the Company approved the issuance of employee stock
options authorized in 2010. The exercise price were adjusted from $15.7 (in dollars) to $14.6 (in
dollars).
(15) Provisions
Analysis of total provisions:
The Group provides warranties on LED products sold. Provision for warranties is estimated based
on historical warranty data of LED products.
(16) Share capital
A. As of December 31, 2018, the Company’s authorized capital was $10,000,000, consisting of
1,000,000 thousand shares of common stock, and the paid-in capital was $4,454,386, consisting
of 445,439 thousand shares of common stock with a par value of $10 (in dollars) per share. All
proceeds from shares issued have been collected. Movements in the number of the Company’s
ordinary shares outstanding for years ended December 31, 2018 and 2017, are as follows
(Treasury stock was deducted):
No. of shares Weighted-average
Stock options (in thousands) exercise price (in dollars)
Options outstanding at
beginning of period
10,755 15.70$
Options exercised 8,933)( 16.79
Options revoked 1,822)( -
Options outstanding at end of period - -
Options exercisable at end of period - -
For the year ended December 31, 2017
Warranty 2018 2017
At January 1 48,225$ 53,868$
Accrued during the year 1,745)( 8,526
Used during the period 12,037)( 14,025)(
Exchange differences 214)( 144)(
At December 31 34,229$ 48,225$
December 31, 2018 December 31, 2017
Current 11,970$ 13,105$
Non-current 22,259$ 35,120$
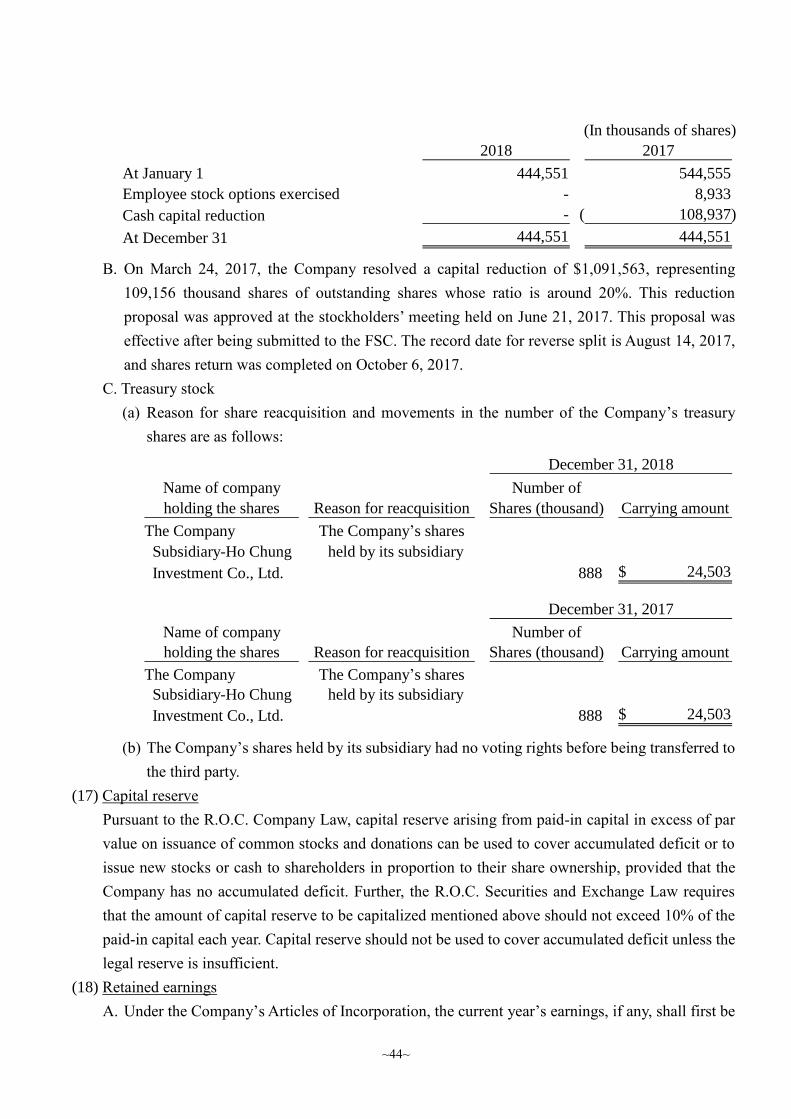
~44~
B. On March 24, 2017, the Company resolved a capital reduction of $1,091,563, representing
109,156 thousand shares of outstanding shares whose ratio is around 20%. This reduction
proposal was approved at the stockholders’ meeting held on June 21, 2017. This proposal was
effective after being submitted to the FSC. The record date for reverse split is August 14, 2017,
and shares return was completed on October 6, 2017.
C. Treasury stock
(a) Reason for share reacquisition and movements in the number of the Company’s treasury
shares are as follows:
(b) The Company’s shares held by its subsidiary had no voting rights before being transferred to
the third party.
(17) Capital reserve
Pursuant to the R.O.C. Company Law, capital reserve arising from paid-in capital in excess of par
value on issuance of common stocks and donations can be used to cover accumulated deficit or to
issue new stocks or cash to shareholders in proportion to their share ownership, provided that the
Company has no accumulated deficit. Further, the R.O.C. Securities and Exchange Law requires
that the amount of capital reserve to be capitalized mentioned above should not exceed 10% of the
paid-in capital each year. Capital reserve should not be used to cover accumulated deficit unless the
legal reserve is insufficient.
(18) Retained earnings
A. Under the Company’s Articles of Incorporation, the current year’s earnings, if any, shall first be
(In thousands of shares)
2018 2017
At January 1 444,551 544,555
Employee stock options exercised - 8,933
Cash capital reduction - 108,937)(
At December 31 444,551 444,551
Name of company Number of
holding the shares Reason for reacquisition Shares (thousand) Carrying amount
The Company The Company’s shares
Subsidiary-Ho Chung held by its subsidiary
Investment Co., Ltd. 888 24,503$
December 31, 2018
Name of company Number of
holding the shares Reason for reacquisition Shares (thousand) Carrying amount
The Company The Company’s shares
Subsidiary-Ho Chung held by its subsidiary
Investment Co., Ltd. 888 24,503$
December 31, 2017

~45~
distributed as follows:
(a) Offset prior years’ operating losses.
(b) 10% of the remaining amount shall be set aside as legal reserve, unless the accumulated legal
reserve equals the total capital of the Company.
(c) Special reserve set aside in accordance with relevant laws or regulations or as required for
operations.
(d) After allocation of the above, the Board of Directors proposes a dividend distribution plan
for approval by resolution at the shareholders’ meeting.
B. The Company operates in the high-tech industry and its business life cycle is in the growth stage.
In view of its capital expenditure demand and comprehensive financial plan for continuous
development, the Company issues both stock and cash dividends. The proportion of dividends
to be distributed in stocks and cash is determined based on the Company’s rate of growth and
capital expenditures. However, the amount of cash dividends shall not be lower than 50% of the
dividends distributed.
C. Except for covering accumulated deficit or issuing new stocks or cash to shareholders in
proportion to their share ownership, the legal reserve shall not be used for any other purpose.
The use of legal reserve for the issuance of stocks or cash to shareholders in proportion to their
share ownership is permitted, provided that the balance of the reserve excess 25% of the
Company’s paid-in capital.
D. In accordance with the regulations, the Company shall set aside special reserve from the debit
balance on other equity items at the balance sheet date before distributing earnings. When debit
balance on other equity items is reversed subsequently, the reversed amount could be included
in the distributable earnings.
E. The appropriation of 2017 and 2016 earnings had been resolved at the stockholders’ meeting on
June 20, 2018 and June 21, 2017, respectively. Details are summarized below:
The above-mentioned 2017 earnings appropriation as approved by the stockholders were in
agreement with those amount approved by the Board of Directors on March 28, 2018.
Information on the appropriation of the Company’s earnings as resolved by the Board of
Directors and approved by the stockholders will be posted in the “Market Observation Post
System” at the website of the Taiwan Stock Exchange.
Dividends Dividends
per share per share
Amount (in dollars) Amount (in dollars)
Legal reserve 67,228$ 85,473$
Special reserve 59,227)( 59,227
Cash dividends 601,342 1.35$ 654,795 1.20$
Total 609,343$ 799,495$
2017 2016

~46~
(19) Other equity items
(20) Operating revenue
The Group derives revenue in the following major product lines:
Currency translation
differences of foreign Unrealized gain (loss)
operations on valuation Total
At January 1, 2018 1,961$ 221,384$ 223,345$
Effects of applying new standards - 3,210 3,210
Balance at January 1 after adjustments 1,961 224,594 226,555
Financial assets at fair value through
other comprehensive income
Revaluation - Group - 291,055 291,055
Tax on revaluation 25,816)( 25,816)(
Revaluation transferred to
retained earnings - 238,478)( 238,478)(
Currency translation differences:
-Group 128 - 128
-Associates 68)( - 68)(
At December 31, 2018 2,021$ 251,355$ 253,376$
Currency translation
differences of foreign Unrealized gain (loss)
operations on valuation Total
At January 1, 2017 3,099$ 51,073)($ 47,974)($
Available-for-sale financial assets
Revaluation - Group - 309,140 309,140
Tax on revaluation - Group - 36,683)( 36,683)(
Currency translation differences:
-Group 1,449)( - 1,449)(
-Associates 311 - 311
At December 31, 2017 1,961$ 221,384$ 223,345$
For the year ended December 31, 2018
Revenue from contracts with customers 5,364,610$
For the year ended
December 31, 2018
LED and
Silicon Sensor
Chips Group
Displays and
Lighting
Group
Packaging
Business
Group
Other
segments
Revenue from external
customer contracts 4,142,551$ 920,588$ 296,631$ 4,840$ 5,364,610$
Total
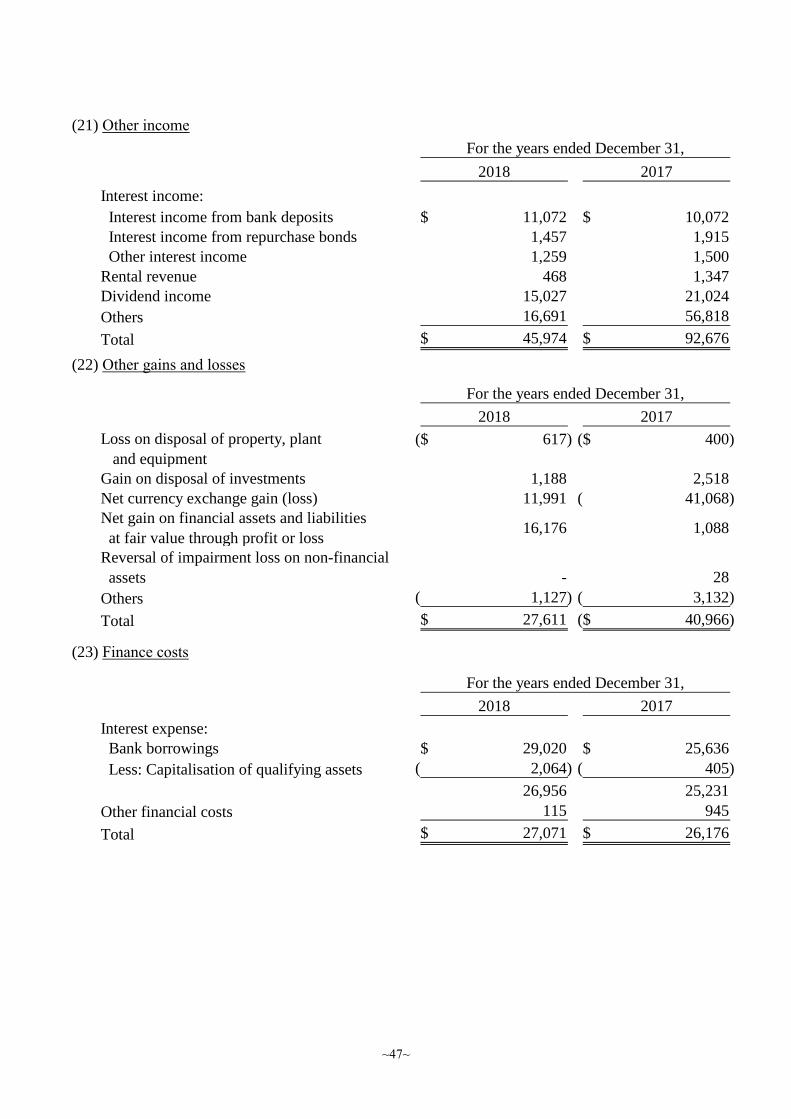
~47~
(21) Other income
(22) Other gains and losses
(23) Finance costs
2018 2017
Interest income:
Interest income from bank deposits 11,072$ 10,072$
Interest income from repurchase bonds 1,457 1,915
Other interest income 1,259 1,500
Rental revenue 468 1,347
Dividend income 15,027 21,024
Others 16,691 56,818
Total 45,974$ 92,676$
For the years ended December 31,
2018 2017
Loss on disposal of property, plant
and equipment
617)($ 400)($
Gain on disposal of investments 1,188 2,518
Net currency exchange gain (loss) 11,991 41,068)(
Net gain on financial assets and liabilities
at fair value through profit or loss16,176 1,088
Reversal of impairment loss on non-financial
assets - 28
Others 1,127)( 3,132)(
Total 27,611$ 40,966)($
For the years ended December 31,
2018 2017
Interest expense:
Bank borrowings 29,020$ 25,636$
Less: Capitalisation of qualifying assets 2,064)( 405)(
26,956 25,231
Other financial costs 115 945
Total 27,071$ 26,176$
For the years ended December 31,

~48~
(24) Expenses by nature
(25) Employee benefit expense
A. According to the Articles of Incorporation of the Company, if the Company has profit during the
year, the Company shall distribute bonus to the employees that account for 10%~15% and pay
remuneration to the directors and supervisors that shall not be higher than 5%, of the total
distributed amount. If the Company has an accumulated deficit, earnings should be used to cover
losses. Employees’ compensation can be distributed in the form of shares or in cash.
Qualification requirements of employees, including the employees of subsidiaries of the
Company meeting certain specific requirements, entitled to receive aforementioned stock or cash
may be specified in the Articles of Incorporation.
B. For the years ended December 31, 2018 and 2017, the employees’ compensation was accrued at
$108,576 and $105,235, respectively; directors’ and supervisors’ remuneration was accrued at
$36,192 and $35,078, respectively. The aforementioned amounts were recognised in salary
expense. The employees’ compensation and directors’ and supervisors’ remuneration were
estimated and accrued based on 11.7% and 3.90%, respectively, of distributable profit of current
period distributable as of the end of reporting period.
2018 2017
Employee benefit expense 1,266,529$ 1,212,688$
Depreciation on property, plant
and equipment 432,773 404,688
Amortisation on intangible assets 12,136 12,899
Total 1,711,438$ 1,630,275$
For the years ended December 31,
2018 2017
Wages and salaries 1,058,778$ 1,014,363$
Labor and health insurance fees 90,190 84,968
Pension costs 51,750 50,920
Directors’ and supervisors’ remuneration 38,892 38,038
Other personnel expenses 26,919 24,399
1,266,529$ 1,212,688$
For the years ended December 31,

~49~
C. For the years ended December 31, 2018 and 2017, CS Bright Corporation’s, the indirect
subsidiary of the Company, employees’ compensation was accrued at $4,321 and $776,
respectively; directors’ and supervisors’ remuneration was accrued at $1,440 and $0, respectively.
The aforementioned amounts were recognised in salary expense. The employees’ compensation
and directors’ and supervisors’ remuneration were estimated and accrued based on 15% and 5%
of distributable profit of current period as of the end of reporting period.
D. Employees’ compensation and directors’ and supervisors’ remuneration of 2017 as resolved by
the Board of Directors are the same as the amount recognised in the consolidated financial
statements.
E. Information about employees’ compensation and directors’ and supervisors’ remuneration of the
Company as resolved at the Board of Directors’ meeting will be posted in the “Market
Observation Post System” at the website of the Taiwan Stock Exchange.
(26) Income tax
A. Income tax expense
(a) Components of income tax expense:
(b) The income tax charge relating to components of other comprehensive income are as follows:
2018 2017
Current tax:
Current tax on profits for the period 118,940$ 128,559$
Tax on undistributed surplus earnings 6,243 2,230
Prior year income tax underestimation - 699
Total current tax 125,183 131,488
Deferred tax:
Origination and reversal of temporary
differences19,031 5,241
Impact of tax losses 2,599)( 3,789
Impact of change in tax rate 14,761)( -
Total deferred tax 1,671 9,030
Income tax expense 126,854$ 140,518$
For the years ended December 31,
2018 2017
Remeasurement of defined benefit
obligations1,163)($ 8,329)($
Changes in fair value of financial
assets at fair value through other
comprehensive income 18,229 36,683
Impact of change in tax rate 3,935 -
Total 21,001$ 28,354$
For the years ended December 31,
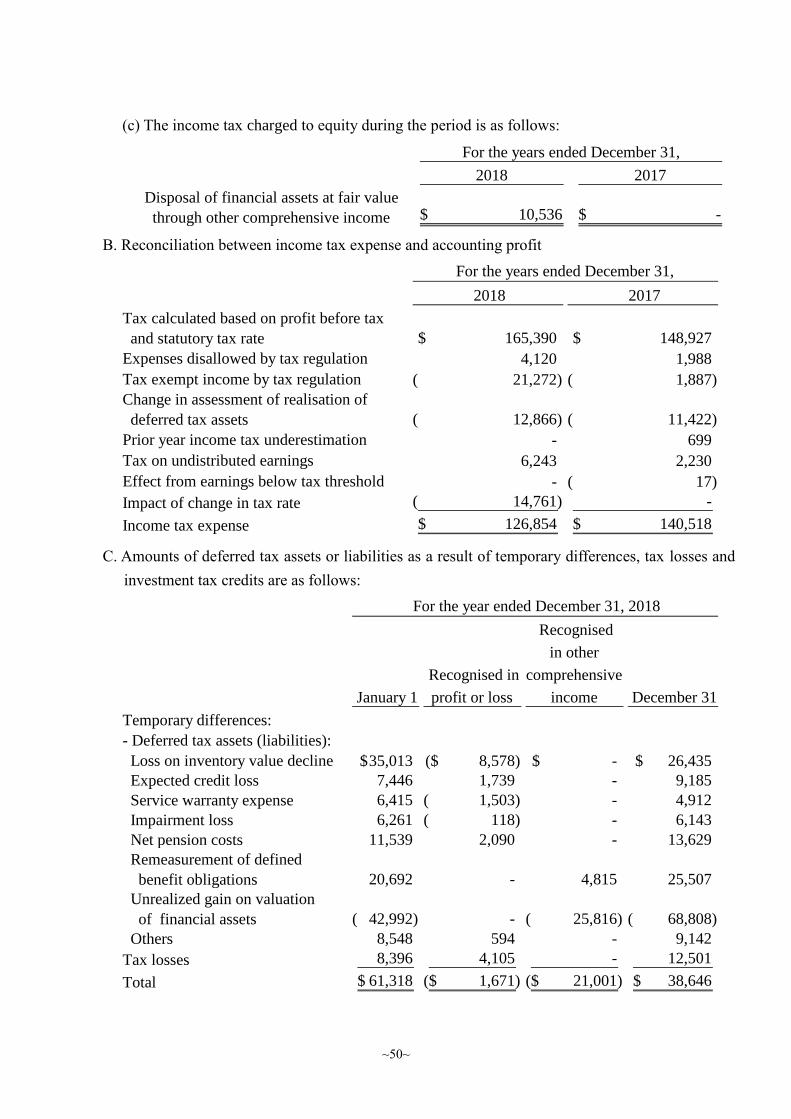
~50~
(c) The income tax charged to equity during the period is as follows:
B. Reconciliation between income tax expense and accounting profit
C. Amounts of deferred tax assets or liabilities as a result of temporary differences, tax losses and
investment tax credits are as follows:
2018 2017
Disposal of financial assets at fair value
through other comprehensive income 10,536$ -$
For the years ended December 31,
2018 2017
Tax calculated based on profit before tax
and statutory tax rate 165,390$ 148,927$
Expenses disallowed by tax regulation 4,120 1,988
Tax exempt income by tax regulation 21,272)( 1,887)(
Change in assessment of realisation of
deferred tax assets 12,866)( 11,422)(
Prior year income tax underestimation - 699
Tax on undistributed earnings 6,243 2,230
Effect from earnings below tax threshold - 17)(
Impact of change in tax rate 14,761)( -
Income tax expense 126,854$ 140,518$
For the years ended December 31,
January 1
Recognised in
profit or loss
Recognised
in other
comprehensive
income December 31
Temporary differences:
- Deferred tax assets (liabilities):
Loss on inventory value decline 35,013$ 8,578)($ -$ 26,435$
Expected credit loss 7,446 1,739 - 9,185
Service warranty expense 6,415 1,503)( - 4,912
Impairment loss 6,261 118)( - 6,143
Net pension costs 11,539 2,090 - 13,629
Remeasurement of defined
benefit obligations 20,692 - 4,815 25,507
Unrealized gain on valuation
of financial assets 42,992)( - 25,816)( 68,808)(
Others 8,548 594 - 9,142
Tax losses 8,396 4,105 - 12,501
Total 61,318$ 1,671)($ 21,001)($ 38,646$
For the year ended December 31, 2018
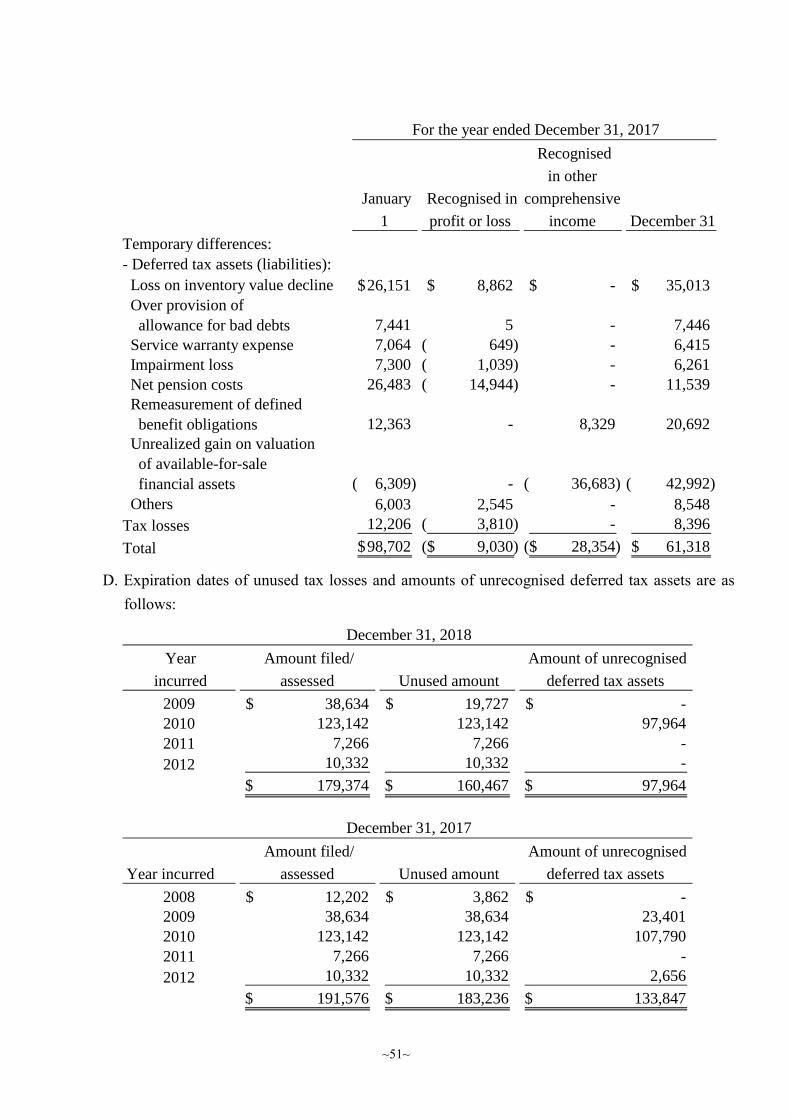
~51~
D. Expiration dates of unused tax losses and amounts of unrecognised deferred tax assets are as
follows:
January
1
Recognised in
profit or loss
Recognised
in other
comprehensive
income December 31
Temporary differences:
- Deferred tax assets (liabilities):
Loss on inventory value decline 26,151$ 8,862$ -$ 35,013$
Over provision of
allowance for bad debts 7,441 5 - 7,446
Service warranty expense 7,064 649)( - 6,415
Impairment loss 7,300 1,039)( - 6,261
Net pension costs 26,483 14,944)( - 11,539
Remeasurement of defined
benefit obligations 12,363 - 8,329 20,692
Unrealized gain on valuation
of available-for-sale
financial assets 6,309)( - 36,683)( 42,992)(
Others 6,003 2,545 - 8,548
Tax losses 12,206 3,810)( - 8,396
Total 98,702$ 9,030)($ 28,354)($ 61,318$
For the year ended December 31, 2017
Year
incurred
Amount filed/
assessed Unused amount
Amount of unrecognised
deferred tax assets
2009 38,634$ 19,727$ -$
2010 123,142 123,142 97,964
2011 7,266 7,266 -
2012 10,332 10,332 -
179,374$ 160,467$ 97,964$
December 31, 2018
Year incurred
Amount filed/
assessed Unused amount
Amount of unrecognised
deferred tax assets
2008 12,202$ 3,862$ -$
2009 38,634 38,634 23,401
2010 123,142 123,142 107,790
2011 7,266 7,266 -
2012 10,332 10,332 2,656
191,576$ 183,236$ 133,847$
December 31, 2017
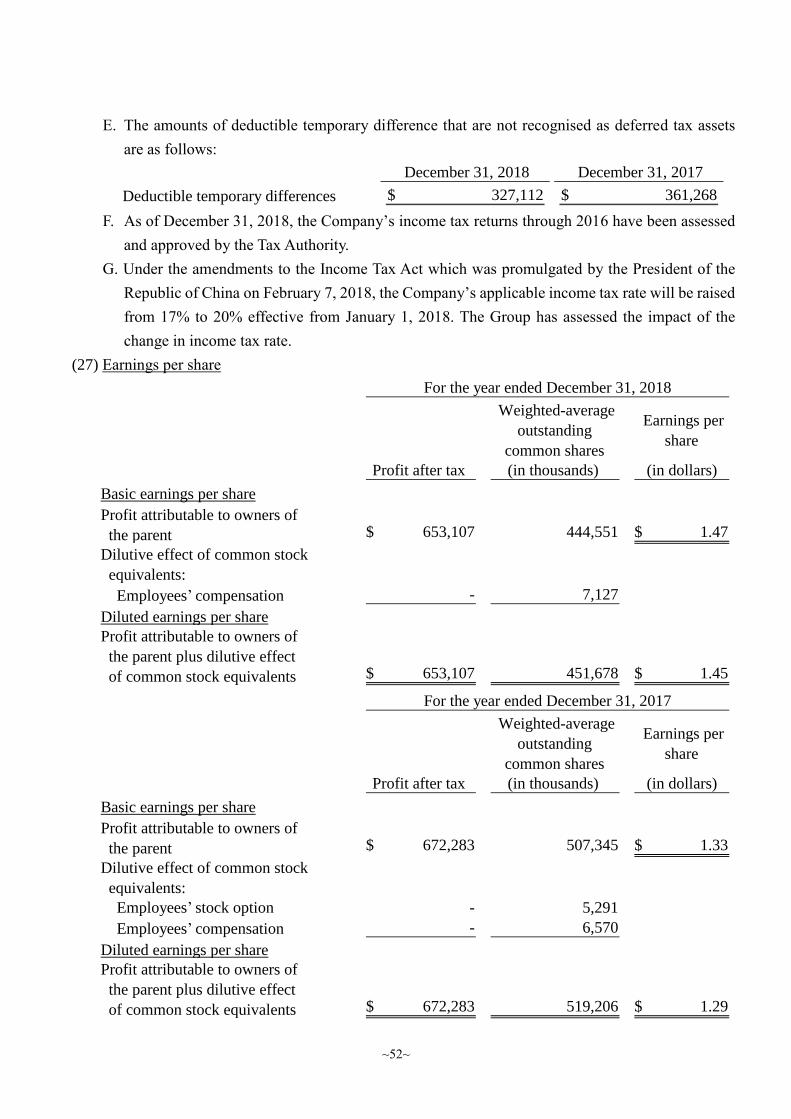
~52~
E. The amounts of deductible temporary difference that are not recognised as deferred tax assets
are as follows:
F. As of December 31, 2018, the Company’s income tax returns through 2016 have been assessed
and approved by the Tax Authority.
G. Under the amendments to the Income Tax Act which was promulgated by the President of the
Republic of China on February 7, 2018, the Company’s applicable income tax rate will be raised
from 17% to 20% effective from January 1, 2018. The Group has assessed the impact of the
change in income tax rate.
(27) Earnings per share
December 31, 2018 December 31, 2017
Deductible temporary differences 327,112$ 361,268$
Weighted-average
outstanding
common shares
Earnings per
share
Profit after tax (in thousands) (in dollars)
Basic earnings per share
Profit attributable to owners of
the parent 653,107$ 444,551 1.47$
Dilutive effect of common stock
equivalents:
Employees’ compensation - 7,127
Diluted earnings per share
Profit attributable to owners of
the parent plus dilutive effect
of common stock equivalents 653,107$ 451,678 1.45$
For the year ended December 31, 2018
Weighted-average
outstanding
common shares
Earnings per
share
Profit after tax (in thousands) (in dollars)
Basic earnings per share
Profit attributable to owners of
the parent 672,283$ 507,345 1.33$
Dilutive effect of common stock
equivalents:
Employees’ stock option - 5,291
Employees’ compensation - 6,570
Diluted earnings per share
Profit attributable to owners of
the parent plus dilutive effect
of common stock equivalents 672,283$ 519,206 1.29$
For the year ended December 31, 2017
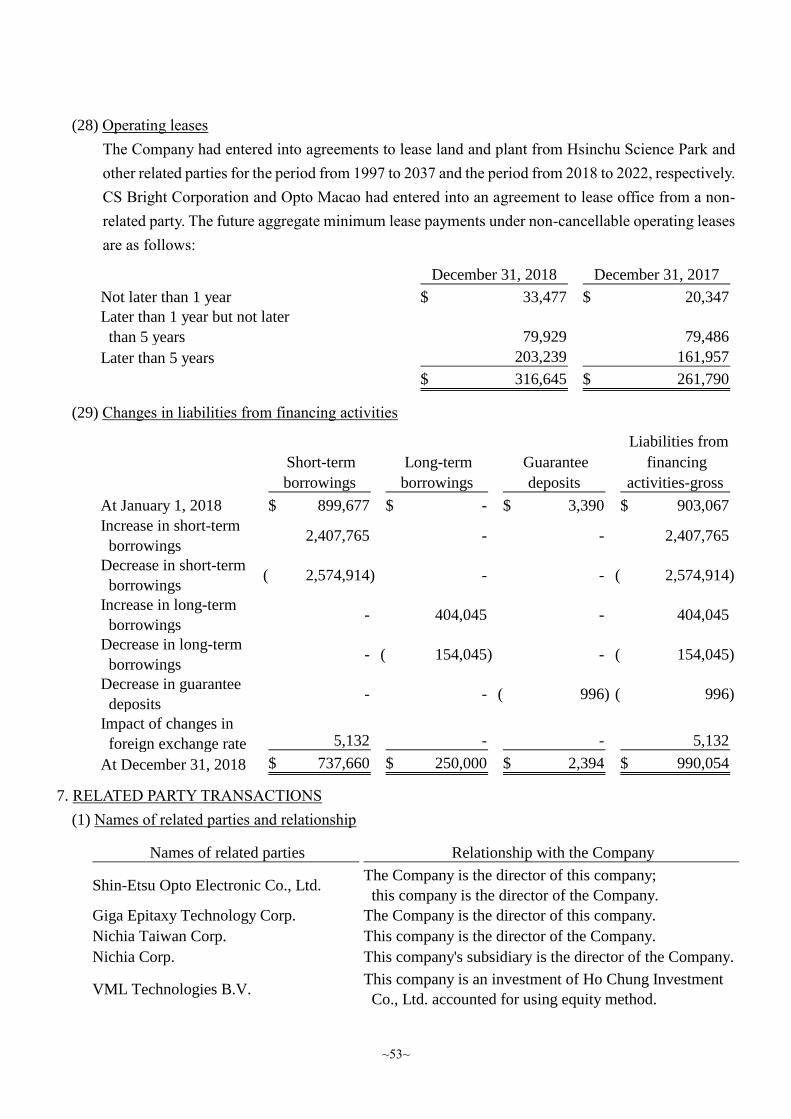
~53~
(28) Operating leases
The Company had entered into agreements to lease land and plant from Hsinchu Science Park and
other related parties for the period from 1997 to 2037 and the period from 2018 to 2022, respectively.
CS Bright Corporation and Opto Macao had entered into an agreement to lease office from a non-
related party. The future aggregate minimum lease payments under non-cancellable operating leases
are as follows:
(29) Changes in liabilities from financing activities
7. RELATED PARTY TRANSACTIONS
(1) Names of related parties and relationship
December 31, 2018 December 31, 2017
Not later than 1 year 33,477$ 20,347$
Later than 1 year but not later
than 5 years 79,929 79,486
Later than 5 years 203,239 161,957
316,645$ 261,790$
Liabilities from
Short-term Long-term Guarantee financing
borrowings borrowings deposits activities-gross
At January 1, 2018 899,677$ -$ 3,390$ 903,067$
Increase in short-term
borrowings2,407,765 - - 2,407,765
Decrease in short-term
borrowings2,574,914)( - - 2,574,914)(
Increase in long-term
borrowings- 404,045 - 404,045
Decrease in long-term
borrowings- 154,045)( - 154,045)(
Decrease in guarantee
deposits- - 996)( 996)(
Impact of changes in
foreign exchange rate 5,132 - - 5,132
At December 31, 2018 737,660$ 250,000$ 2,394$ 990,054$
Names of related parties Relationship with the Company
Shin-Etsu Opto Electronic Co., Ltd.The Company is the director of this company;
this company is the director of the Company.
Giga Epitaxy Technology Corp. The Company is the director of this company.
Nichia Taiwan Corp. This company is the director of the Company.
Nichia Corp. This company's subsidiary is the director of the Company.
VML Technologies B.V.This company is an investment of Ho Chung Investment
Co., Ltd. accounted for using equity method.
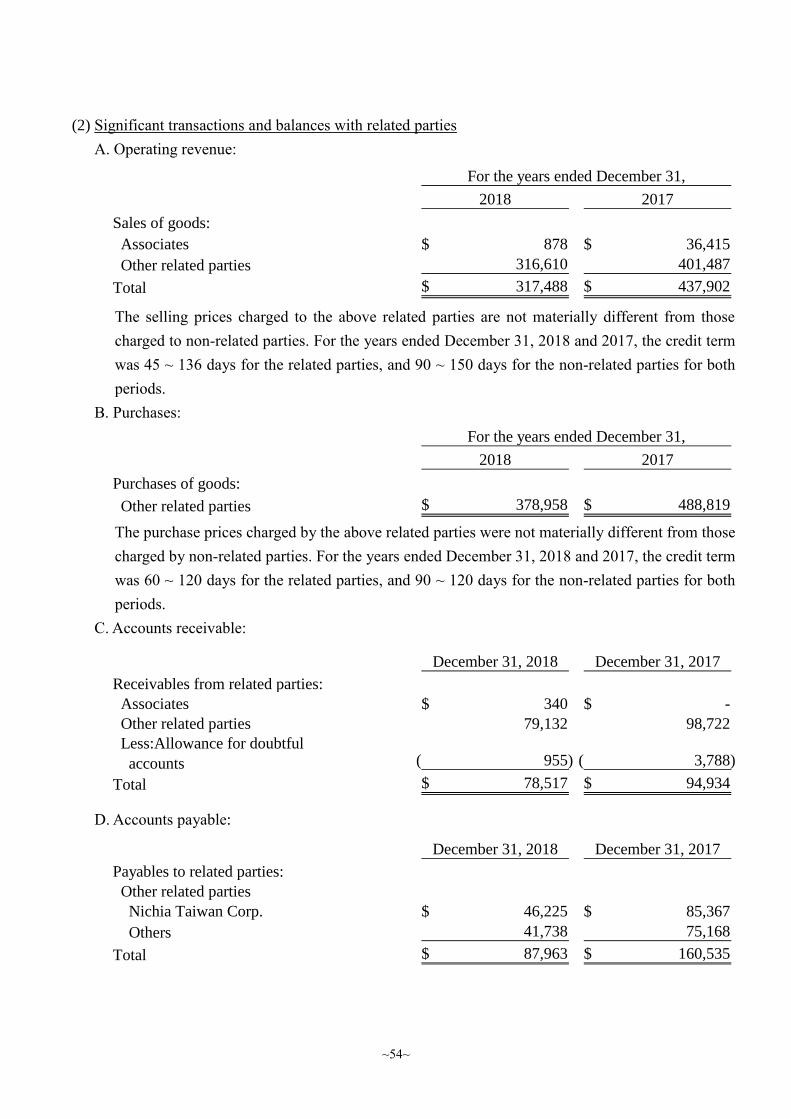
~54~
(2) Significant transactions and balances with related parties
A. Operating revenue:
The selling prices charged to the above related parties are not materially different from those
charged to non-related parties. For the years ended December 31, 2018 and 2017, the credit term
was 45 ~ 136 days for the related parties, and 90 ~ 150 days for the non-related parties for both
periods.
B. Purchases:
The purchase prices charged by the above related parties were not materially different from those
charged by non-related parties. For the years ended December 31, 2018 and 2017, the credit term
was 60 ~ 120 days for the related parties, and 90 ~ 120 days for the non-related parties for both
periods.
C. Accounts receivable:
D. Accounts payable:
2018 2017
Sales of goods:
Associates 878$ 36,415$
Other related parties 316,610 401,487
Total 317,488$ 437,902$
For the years ended December 31,
2018 2017
Purchases of goods:
Other related parties 378,958$ 488,819$
For the years ended December 31,
December 31, 2018 December 31, 2017
Receivables from related parties:
Associates 340$ -$
Other related parties 79,132 98,722
Less:Allowance for doubtful
accounts 955)( 3,788)(
Total 78,517$ 94,934$
December 31, 2018 December 31, 2017
Payables to related parties:
Other related parties
Nichia Taiwan Corp. 46,225$ 85,367$
Others 41,738 75,168
Total 87,963$ 160,535$
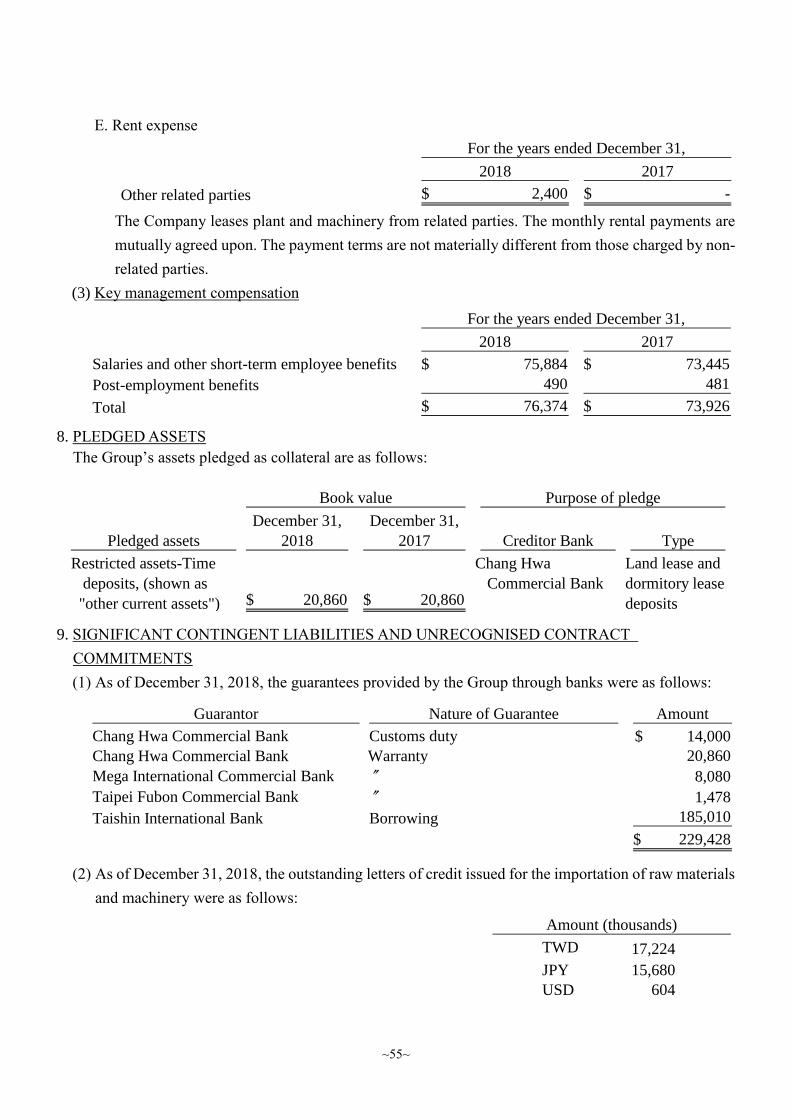
~55~
E. Rent expense
The Company leases plant and machinery from related parties. The monthly rental payments are
mutually agreed upon. The payment terms are not materially different from those charged by non-
related parties.
(3) Key management compensation
8. PLEDGED ASSETS
The Group’s assets pledged as collateral are as follows:
9. SIGNIFICANT CONTINGENT LIABILITIES AND UNRECOGNISED CONTRACT
COMMITMENTS
(1) As of December 31, 2018, the guarantees provided by the Group through banks were as follows:
(2) As of December 31, 2018, the outstanding letters of credit issued for the importation of raw materials
and machinery were as follows:
2018 2017
Other related parties 2,400$ -$
For the years ended December 31,
2018 2017
Salaries and other short-term employee benefits 75,884$ 73,445$
Post-employment benefits 490 481
Total 76,374$ 73,926$
For the years ended December 31,
December 31, December 31,
Pledged assets 2018 2017 Creditor Bank Type
Restricted assets-Time
deposits, (shown as
"other current assets") 20,860$ 20,860$
Chang Hwa
Commercial Bank
Land lease and
dormitory lease
deposits
Book value Purpose of pledge
Guarantor Nature of Guarantee Amount
Chang Hwa Commercial Bank Customs duty 14,000$
Chang Hwa Commercial Bank Warranty 20,860
Mega International Commercial Bank 〞 8,080
Taipei Fubon Commercial Bank 〞 1,478
Taishin International Bank Borrowing 185,010
229,428$
TWD 17,224
JPY 15,680
USD 604
Amount (thousands)
~56~
(3) Operating lease commitments:
Please refer to Note 6(28).
(4) As of December 31, 2018, the promissory notes issued by the Company and CS Bright Corporation
for loans, performance guarantee for purchases and loans granted for subsidiaries amounted to
$4,644,810.
(5) As of December 31, 2018, the capital expenditure contracted but not yet incurred is $40,788.
10. SIGNIFICANT DISASTER LOSS
None.
11. SIGNIFICANT EVENTS AFTER THE BALANCE SHEET DATE
(1) On January 15, 2019, the Company signed a joint credit grant of $1.2 billion with four financial
institutions including China Trust Commercial Bank. The Company promised that the current ratio
should be no less than 100% and the debt ratio should not be higher than 100% per half year. The
interest coverage ratio shall not be less than 300% and the tangible net value shall be maintained at
more than 5 billion yuan (inclusive). If the financial ratio of the previous opening is not met or the
default of the majority of the credit bank group is found, the banking group will stop the allocation.
The item also requires the payment of the full unliquidated balance of the claim in advance.
(2) The Company passed a resolution of the Board of Directors on March 13, 2019. As a result of the
liquidation and dissolution of Opto Tech (Suzhou) Co., Ltd. (Opto Tech Suzhou), a 100%-transferred
investment company, it agreed to exempt the company from the payment of 1.25 million US dollar
claims.
12. OTHERS
(1) Capital risk management
The Group’s objectives when managing capital are to safeguard the Group’s ability to continue as a
going concern in order to provide returns for shareholders and to maintain an optimal capital
structure to reduce the cost of capital. In order to maintain or adjust the capital structure, the Group
may adjust the amount of dividends paid to shareholders or issue new shares to reduce debt. The
Group monitors capital on the basis of the gearing ratio. This ratio is calculated as net debt divided
by total capital. Net debt is calculated as total borrowings less cash and cash equivalents. Total
capital is calculated as ‘equity’ as shown in the consolidated balance sheet plus net debt.
As of December 31, 2018 and 2017, the gearing ratios were (29.21%) and (29.48%), respectively.
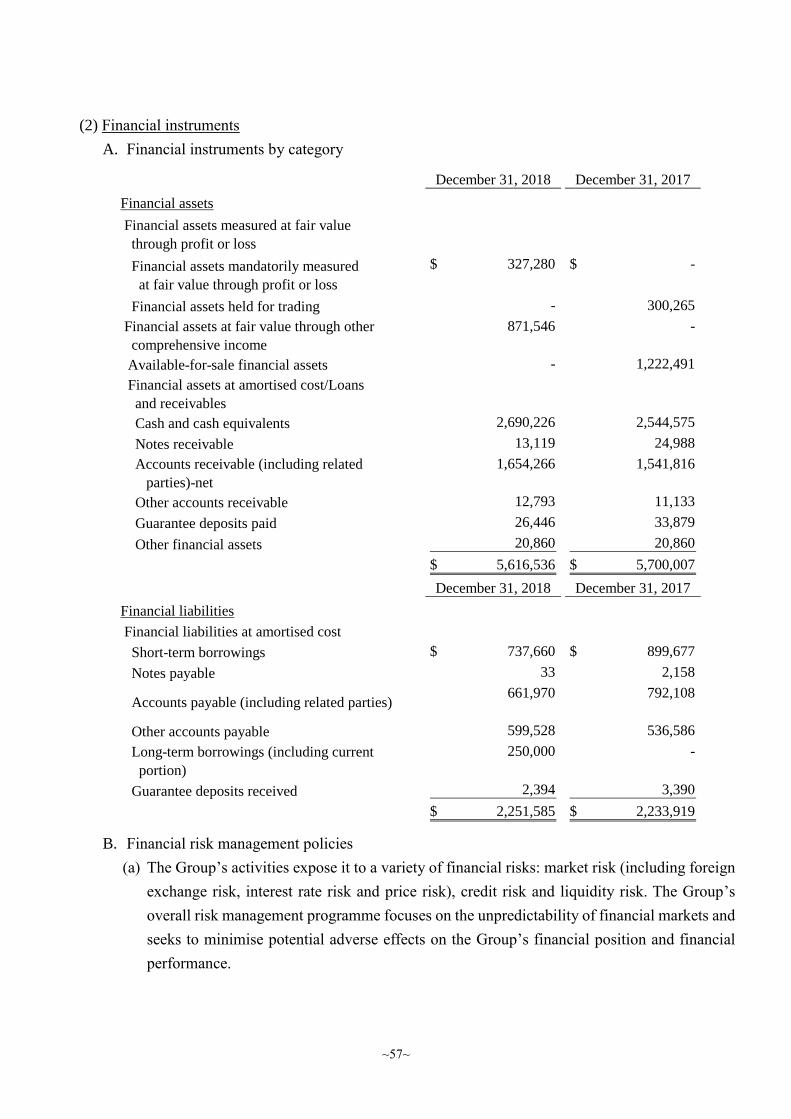
~57~
(2) Financial instruments
A. Financial instruments by category
B. Financial risk management policies
(a) The Group’s activities expose it to a variety of financial risks: market risk (including foreign
exchange risk, interest rate risk and price risk), credit risk and liquidity risk. The Group’s
overall risk management programme focuses on the unpredictability of financial markets and
seeks to minimise potential adverse effects on the Group’s financial position and financial
performance.
December 31, 2018 December 31, 2017
Financial assets
Financial assets measured at fair value
through profit or loss
Financial assets mandatorily measured
at fair value through profit or loss
327,280$ -$
Financial assets held for trading - 300,265
Financial assets at fair value through other
comprehensive income
871,546 -
Available-for-sale financial assets - 1,222,491
Financial assets at amortised cost/Loans
and receivables
Cash and cash equivalents 2,690,226 2,544,575
Notes receivable 13,119 24,988
Accounts receivable (including related
parties)-net
1,654,266 1,541,816
Other accounts receivable 12,793 11,133
Guarantee deposits paid 26,446 33,879
Other financial assets 20,860 20,860
5,616,536$ 5,700,007$
December 31, 2018 December 31, 2017
Financial liabilities
Financial liabilities at amortised cost
Short-term borrowings 737,660$ 899,677$
Notes payable 33 2,158
Accounts payable (including related parties)661,970 792,108
Other accounts payable 599,528 536,586
Long-term borrowings (including current
portion)
250,000 -
Guarantee deposits received 2,394 3,390
2,251,585$ 2,233,919$

~58~
(b) The plans for material treasury activities are reviewed by Board of Directors in accordance
with procedures required by relevant regulations or internal controls. During the
implementation of such plans, Corporate Treasury function must comply with certain treasury
procedures that provide guiding principles for overall financial risk management and
segregation of duties.
C. Significant financial risks and degrees of financial risks
(a) Market risk
Foreign exchange risk
i. The Group operates internationally and is exposed to foreign exchange risk arising from
the transactions of the Company and its subsidiaries used in various functional currency,
primarily with respect to the USD and JPY. Exchange rate risk arises from future
commercial transactions and recognised assets and liabilities.
ii. To manage their foreign exchange risk arising from future commercial transactions and
recognised assets and liabilities, entities in the Group use forward foreign exchange
contracts, transacted with Group treasury. The expired dates of these forward foreign
exchange contracts are shorter than 6 months and are not accounted for under hedge
accounting. Foreign exchange risk arises when future commercial transactions or
recognised assets or liabilities are denominated in a currency that is not the entity’s
functional currency.
iii. As the foreign operations are strategic investments, the Company does not hedge for them.
iv. The Group’s businesses involve some non-functional currency operations (the Company’s
and certain subsidiaries’ functional currency: TWD; other subsidiaries’ functional
currency: CNY). The information on assets and liabilities denominated in foreign
currencies whose values would be materially affected by the exchange rate fluctuations is
as follows:

~59~
Note: If the consolidated entities’ functional currency is not TWD, the foreign currency
denominated assets and liabilities of the consolidated entities should be disclosed. For
example, when the functional currency of a subsidiary is CNY, its USD foreign currency
positions should also be disclosed.
Foreign
currency
amount
(in
thousands)
Exchange
rate
Book value
(TWD)
Extent
of
variation
Effect
on profit
or loss
Effect
on other
compre-
hensive
income
Unrealized
exchange
gain or
(loss)
(Foreign currency:
functional currency)
Financial assets
Monetary items
USD : TWD 49,332$ 30.665 1,512,766$ 1% 15,128$ -$ 4,423)($
JPY : TWD 183,614 0.2762 50,714 1% 507 - 551
CNY : TWD 20,384 4.447 90,648 1% 906 - 279)(
USD : CNY (Note) 993 6.8683 30,500 1% 305 - 55
Financial liabilities
Monetary items
USD : TWD 24,616$ 30.765 757,311$ 1% 7,573)($ -$ 4,325$
JPY : TWD 442,719 0.2802 124,050 1% 1,241)( - 2,519)(
USD : CNY (Note) 21 6.8683 645 1% 6)( - 6
For the year ended December 31, 2018
December 31, 2018 Sensitivity Analysis
Foreign
currency
amount
(in
thousands)
Exchange
rate
Book value
(TWD)
Extent
of
variation
Effect
on profit
or loss
Effect
on other
compre-
hensive
income
Unrealized
exchange
gain or
(loss)
(Foreign currency:
functional currency)
Financial assets
Monetary items
USD : TWD 49,197$ 29.710 1,461,643$ 1% 14,616$ -$ 16,908)($
JPY : TWD 411,206 0.2622 107,818 1% 1,078 - 1,803)(
CNY : TWD 22,160 4.5400 100,606 1% 1,006 - 165
USD : CNY (Note) 712 6.5192 21,189 1% 212 - 209
Financial liabilities
Monetary items
USD : TWD 29,024$ 29.810 865,205$ 1% 8,652)($ -$ 13,763$
JPY : TWD 675,234 0.2662 179,747 1% 1,797)( - 1,226
USD : CNY (Note) 28 6.5192 833 1% 8)( - 12
For the year ended December 31, 2017
December 31, 2017 Sensitivity Analysis
~60~
Price risk
i. The Group’s equity securities, which are exposed to price risk, are the held financial assets
at fair value through profit or loss, financial assets at fair value through other
comprehensive income and available-for- sale financial assets. To manage its price risk
arising from investments in equity securities, the Group diversifies its portfolio.
ii. The Group’s investments in equity securities comprise domestic listed and unlisted stocks.
The prices of equity securities would change due to the change of the future value of
investee companies. If the prices of these domestic funds, equity securities of listed
company or unlisted company had increased/decreased by 5%, 20% or 10%, respectively,
with all other variables held constant, post-tax profit the year ended December 31, 2018
and 2017 would have increased/decreased by $21,697 and $15,007, respectively, as a result
of gains/losses on equity securities classified as at fair value through profit or loss. Other
components of equity would have increased/decreased by $96,007 and $118,355 as a result
of gains/losses on equity securities classified as financial assets at fair value through other
comprehensive income or loss and available-for-sale.
Interest rate risk
i. The Group’s interest rate risk arises from long-term borrowings. Borrowings issued at
floating rates expose the Group to cash flow interest rate risk which is partially offset by
cash and cash equivalents held at floating rates. During the years ended December 31,
2018 and 2017, the Group’s borrowings at floating rate were denominated in TWD, USD
and JPY.
ii. At December 31, 2018 and 2017, if interest rates on borrowings had been 100 basis point
higher/lower with all other variables held constant, post-tax profit for the years ended
December 31, 2018 and 2017 would have been $8,206 and $6,628 lower/higher,
respectively, mainly as a result of higher/lower interest expense on floating rate
borrowings.
(b) Credit risk
i. Credit risk refers to the risk of financial loss to the Group arising from default by the
clients or counterparties of financial instruments on the contract obligations. According
to the Group’s credit policy, each local entity in the Group is responsible for managing
and analysing the credit risk for each of their new clients before standard payment and
delivery terms and conditions are offered. Internal risk control assesses the credit quality
of the customers, taking into account their financial position, past experience and other
factors, the utilisation of credit limits is regularly monitored. Credit risk arises from cash
and equivalents, derivative financial instruments and deposits with bank and financial
institutions, as well as operating activities, including outstanding receivables.
ii. The default occurs when the contract payments are past due over 181 days for distributors
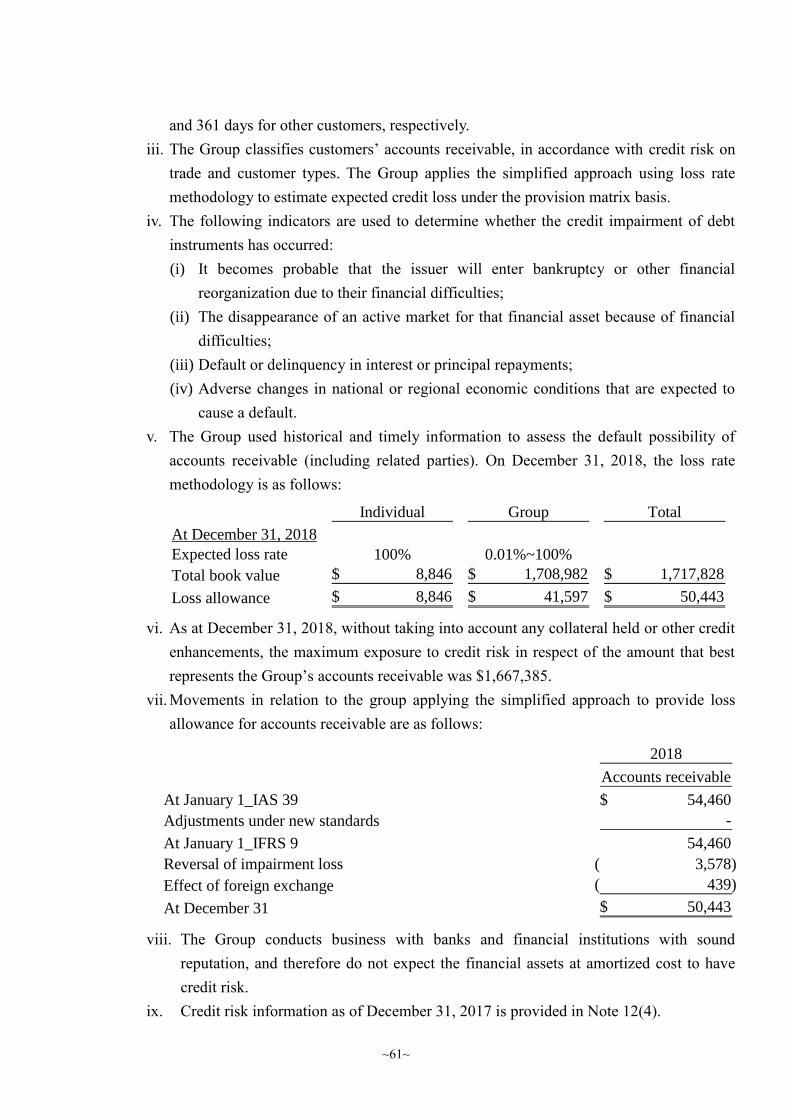
~61~
and 361 days for other customers, respectively.
iii. The Group classifies customers’ accounts receivable, in accordance with credit risk on
trade and customer types. The Group applies the simplified approach using loss rate
methodology to estimate expected credit loss under the provision matrix basis.
iv. The following indicators are used to determine whether the credit impairment of debt
instruments has occurred:
(i) It becomes probable that the issuer will enter bankruptcy or other financial
reorganization due to their financial difficulties;
(ii) The disappearance of an active market for that financial asset because of financial
difficulties;
(iii) Default or delinquency in interest or principal repayments;
(iv) Adverse changes in national or regional economic conditions that are expected to
cause a default.
v. The Group used historical and timely information to assess the default possibility of
accounts receivable (including related parties). On December 31, 2018, the loss rate
methodology is as follows:
vi. As at December 31, 2018, without taking into account any collateral held or other credit
enhancements, the maximum exposure to credit risk in respect of the amount that best
represents the Group’s accounts receivable was $1,667,385.
vii. Movements in relation to the group applying the simplified approach to provide loss
allowance for accounts receivable are as follows:
viii. The Group conducts business with banks and financial institutions with sound
reputation, and therefore do not expect the financial assets at amortized cost to have
credit risk.
ix. Credit risk information as of December 31, 2017 is provided in Note 12(4).
Individual Group Total
At December 31, 2018
Expected loss rate 100% 0.01%~100%
Total book value 8,846$ 1,708,982$ 1,717,828$
Loss allowance 8,846$ 41,597$ 50,443$
2018
Accounts receivable
At January 1_IAS 39 54,460$
-
At January 1_IFRS 9 54,460
Reversal of impairment loss 3,578)(
Effect of foreign exchange 439)(
At December 31 50,443$
Adjustments under new standards
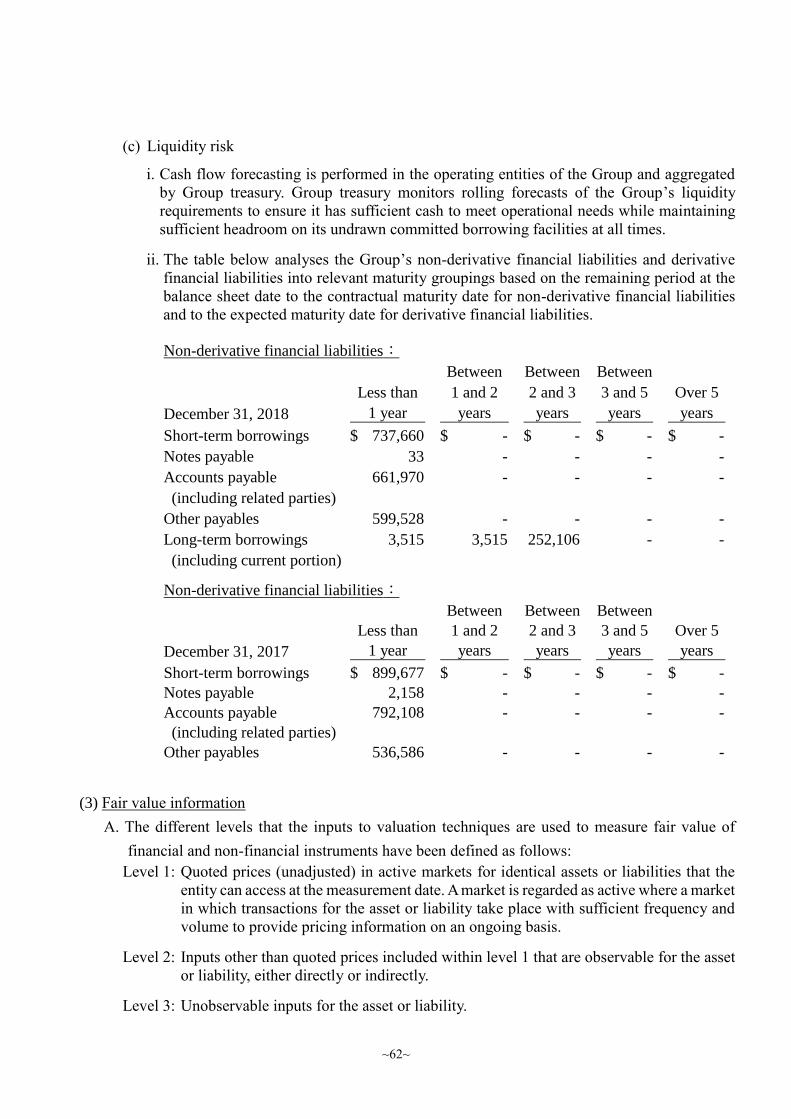
~62~
(c) Liquidity risk
i. Cash flow forecasting is performed in the operating entities of the Group and aggregated
by Group treasury. Group treasury monitors rolling forecasts of the Group’s liquidity
requirements to ensure it has sufficient cash to meet operational needs while maintaining
sufficient headroom on its undrawn committed borrowing facilities at all times.
ii. The table below analyses the Group’s non-derivative financial liabilities and derivative
financial liabilities into relevant maturity groupings based on the remaining period at the
balance sheet date to the contractual maturity date for non-derivative financial liabilities
and to the expected maturity date for derivative financial liabilities.
(3) Fair value information
A. The different levels that the inputs to valuation techniques are used to measure fair value of
financial and non-financial instruments have been defined as follows:
Level 1: Quoted prices (unadjusted) in active markets for identical assets or liabilities that the
entity can access at the measurement date. A market is regarded as active where a market
in which transactions for the asset or liability take place with sufficient frequency and
volume to provide pricing information on an ongoing basis.
Level 2: Inputs other than quoted prices included within level 1 that are observable for the asset
or liability, either directly or indirectly.
Level 3: Unobservable inputs for the asset or liability.
Between Between Between
Less than 1 and 2 2 and 3 3 and 5 Over 5
December 31, 2018 1 year years years years years
Short-term borrowings 737,660$ -$ -$ -$ -$
Notes payable 33 - - - -
Accounts payable 661,970 - - - -
(including related parties)
Other payables 599,528 - - - -
Long-term borrowings 3,515 3,515 252,106 - -
(including current portion)
Non-derivative financial liabilities:
Between Between Between
Less than 1 and 2 2 and 3 3 and 5 Over 5
December 31, 2017 1 year years years years years
Short-term borrowings 899,677$ -$ -$ -$ -$
Notes payable 2,158 - - - -
Accounts payable 792,108 - - - -
(including related parties)
Other payables 536,586 - - - -
Non-derivative financial liabilities:
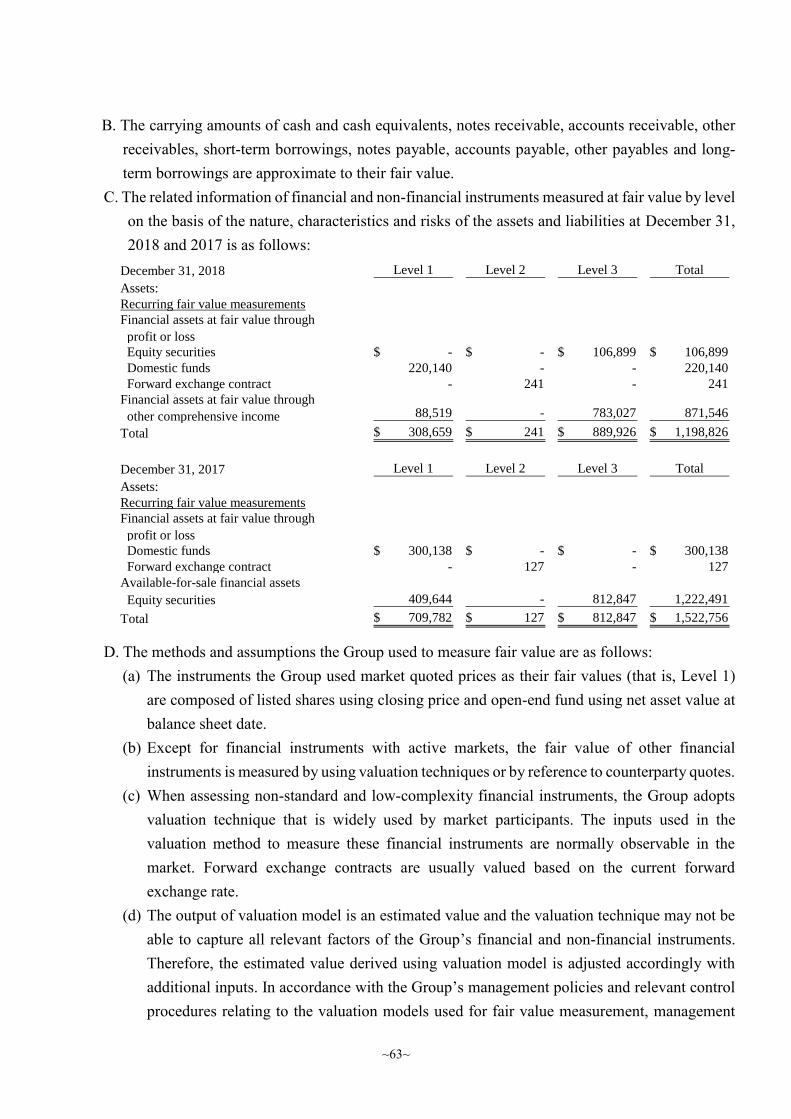
~63~
B. The carrying amounts of cash and cash equivalents, notes receivable, accounts receivable, other
receivables, short-term borrowings, notes payable, accounts payable, other payables and long-
term borrowings are approximate to their fair value.
C. The related information of financial and non-financial instruments measured at fair value by level
on the basis of the nature, characteristics and risks of the assets and liabilities at December 31,
2018 and 2017 is as follows:
D. The methods and assumptions the Group used to measure fair value are as follows:
(a) The instruments the Group used market quoted prices as their fair values (that is, Level 1)
are composed of listed shares using closing price and open-end fund using net asset value at
balance sheet date.
(b) Except for financial instruments with active markets, the fair value of other financial
instruments is measured by using valuation techniques or by reference to counterparty quotes.
(c) When assessing non-standard and low-complexity financial instruments, the Group adopts
valuation technique that is widely used by market participants. The inputs used in the
valuation method to measure these financial instruments are normally observable in the
market. Forward exchange contracts are usually valued based on the current forward
exchange rate.
(d) The output of valuation model is an estimated value and the valuation technique may not be
able to capture all relevant factors of the Group’s financial and non-financial instruments.
Therefore, the estimated value derived using valuation model is adjusted accordingly with
additional inputs. In accordance with the Group’s management policies and relevant control
procedures relating to the valuation models used for fair value measurement, management
December 31, 2018 Level 1 Level 2 Level 3 Total
Assets:
Recurring fair value measurements
Financial assets at fair value through
profit or loss
Equity securities -$ -$ 106,899$ 106,899$
Domestic funds 220,140 - - 220,140
Forward exchange contract - 241 - 241
Financial assets at fair value through
other comprehensive income 88,519 - 783,027 871,546
Total 308,659$ 241$ 889,926$ 1,198,826$
December 31, 2017 Level 1 Level 2 Level 3 Total
Assets:
Recurring fair value measurements
Financial assets at fair value through
profit or loss
Domestic funds 300,138$ -$ -$ 300,138$
Forward exchange contract - 127 - 127
Available-for-sale financial assets
Equity securities 409,644 - 812,847 1,222,491
Total 709,782$ 127$ 812,847$ 1,522,756$

~64~
believes adjustment to valuation is necessary in order to reasonably represent the fair value
of financial and non-financial instruments at the consolidated balance sheet. The inputs and
pricing information used during valuation are carefully assessed and adjusted based on
current market conditions.
E. For the years ended December 31, 2018 and 2017, there was no transfer between Level 1 and
Level 2.
F. The following chart is the movement of Level 3 financial instruments of equity securities for the
years ended December 31, 2018 and 2017.
Note: Recorded as unrealized valuation gain or loss of financial assets at fair value through other
comprehensive income and available-for-sale financial assets.
G. For the years ended December 31, 2018 and 2017, there was no transfer into or out from Level
3.
H. Financial segment is in charge of valuation procedures for fair value measurements being
categorized within Level 3, which is to verify independent fair value of financial instruments.
Such assessment is to ensure the valuation results are reasonable by applying independent
information to make results close to current market conditions and reviewing periodically.
I. The following is the qualitative information of significant unobservable inputs and sensitivity
analysis of changes in significant unobservable inputs to valuation model used in Level 3 fair
value measurement:
2018 2017
At January 1 812,847$ 602,534$
Losses recognised in income (Note) 16,060 -
Losses recognised in other
comprehensive income (Note) 61,019 210,313
At December 31 889,926$ 812,847$
Fair
value at
December Valuation
Significant
unobservable
Range
(weighted
Relationship
of inputs to
31, 2018 technique input average) fair value
Unlisted shares 889,926$ Market Price to 0.82~1.20 The higher the multiple,
comparable earnings the higher the fair value.
companies ratio multiple
Discount for 17.72%~27.90% The higher the discount
lack of for lack of marketability,
volatility the lower the fair value.
Non-derivative
equity:
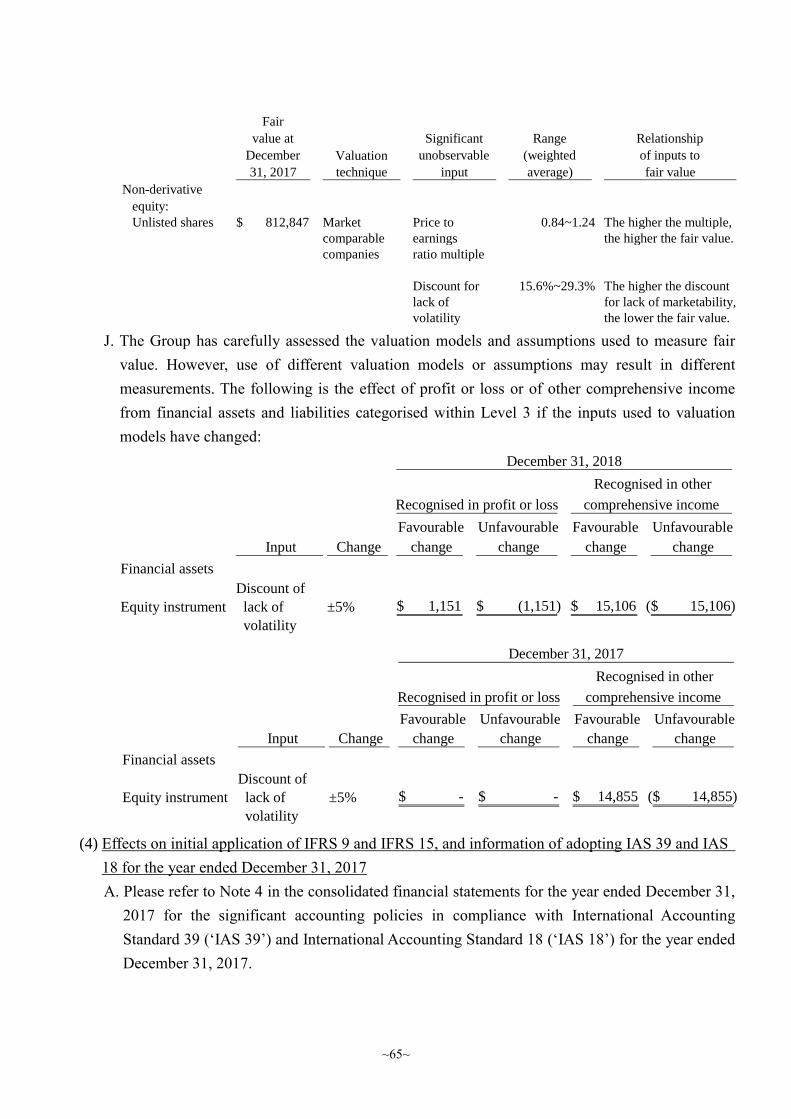
~65~
J. The Group has carefully assessed the valuation models and assumptions used to measure fair
value. However, use of different valuation models or assumptions may result in different
measurements. The following is the effect of profit or loss or of other comprehensive income
from financial assets and liabilities categorised within Level 3 if the inputs used to valuation
models have changed:
(4) Effects on initial application of IFRS 9 and IFRS 15, and information of adopting IAS 39 and IAS
18 for the year ended December 31, 2017
A. Please refer to Note 4 in the consolidated financial statements for the year ended December 31,
2017 for the significant accounting policies in compliance with International Accounting
Standard 39 (‘IAS 39’) and International Accounting Standard 18 (‘IAS 18’) for the year ended
December 31, 2017.
Fair
value at
December Valuation
Significant
unobservable
Range
(weighted
Relationship
of inputs to
31, 2017 technique input average) fair value
Unlisted shares 812,847$ Market Price to 0.84~1.24 The higher the multiple,
comparable earnings the higher the fair value.
companies ratio multiple
Discount for 15.6%~29.3% The higher the discount
lack of for lack of marketability,
volatility the lower the fair value.
Non-derivative
equity:
Favourable Unfavourable Favourable Unfavourable
Input Change change change change change
Financial assets
Equity instrument
Discount of
lack of
volatility
±5% 1,151$ (1,151)$ 15,106$ 15,106)($
December 31, 2018
Recognised in other
Recognised in profit or loss comprehensive income
Favourable Unfavourable Favourable Unfavourable
Input Change change change change change
Financial assets
Equity instrument
Discount of
lack of
volatility
±5% -$ -$ 14,855$ 14,855)($
December 31, 2017
Recognised in other
Recognised in profit or loss comprehensive income
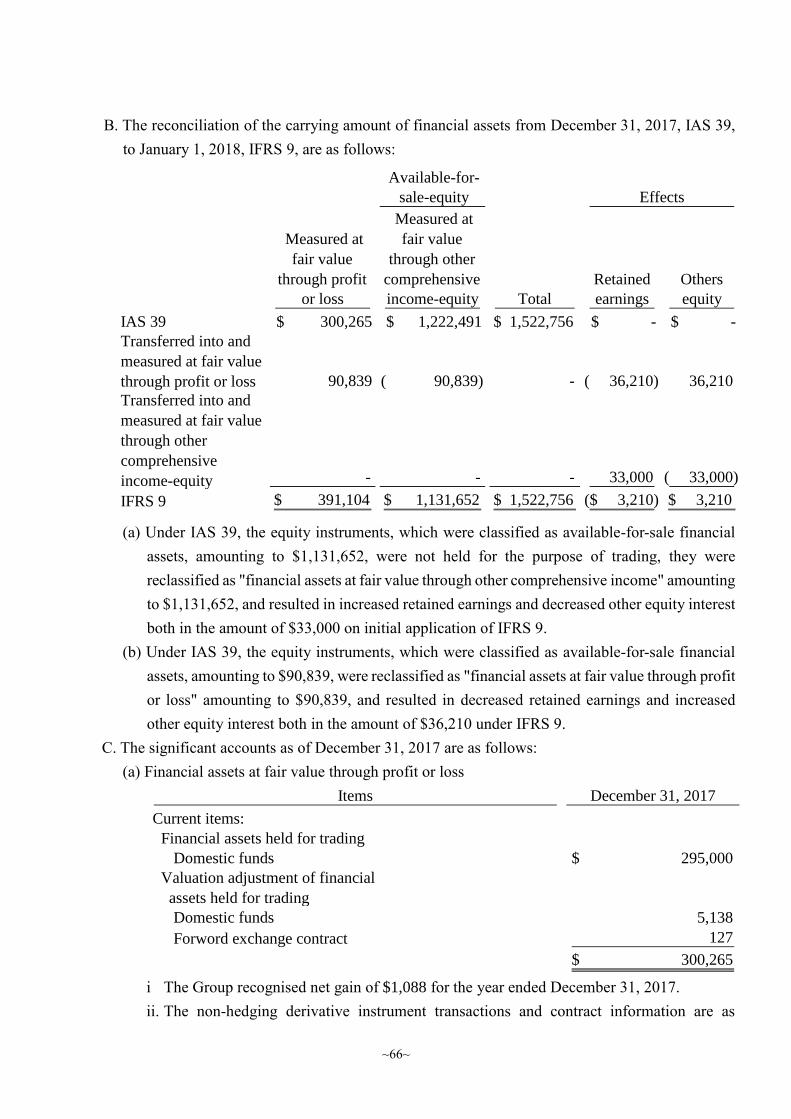
~66~
B. The reconciliation of the carrying amount of financial assets from December 31, 2017, IAS 39,
to January 1, 2018, IFRS 9, are as follows:
(a) Under IAS 39, the equity instruments, which were classified as available-for-sale financial
assets, amounting to $1,131,652, were not held for the purpose of trading, they were
reclassified as "financial assets at fair value through other comprehensive income" amounting
to $1,131,652, and resulted in increased retained earnings and decreased other equity interest
both in the amount of $33,000 on initial application of IFRS 9.
(b) Under IAS 39, the equity instruments, which were classified as available-for-sale financial
assets, amounting to $90,839, were reclassified as "financial assets at fair value through profit
or loss" amounting to $90,839, and resulted in decreased retained earnings and increased
other equity interest both in the amount of $36,210 under IFRS 9.
C. The significant accounts as of December 31, 2017 are as follows:
(a) Financial assets at fair value through profit or loss
i The Group recognised net gain of $1,088 for the year ended December 31, 2017.
ii. The non-hedging derivative instrument transactions and contract information are as
Available-for-
sale-equity
Measured at
fair value
through profit
Measured at
fair value
through other
comprehensive Retained Others
or loss income-equity Total earnings equity
IAS 39 $ 300,265 $ 1,222,491 $ 1,522,756 $ - $ -
Transferred into and
measured at fair value
through profit or loss 90,839 ( 90,839) - 36,210)( 36,210
Transferred into and
measured at fair value
through other
comprehensive
income-equity - - - 33,000 33,000)(
IFRS 9 $ 391,104 $ 1,131,652 $ 1,522,756 ($ 3,210) $ 3,210
Effects
Items December 31, 2017
Current items:
Financial assets held for trading
Domestic funds 295,000$
Valuation adjustment of financial
assets held for trading
Domestic funds 5,138
Forword exchange contract 127
300,265$
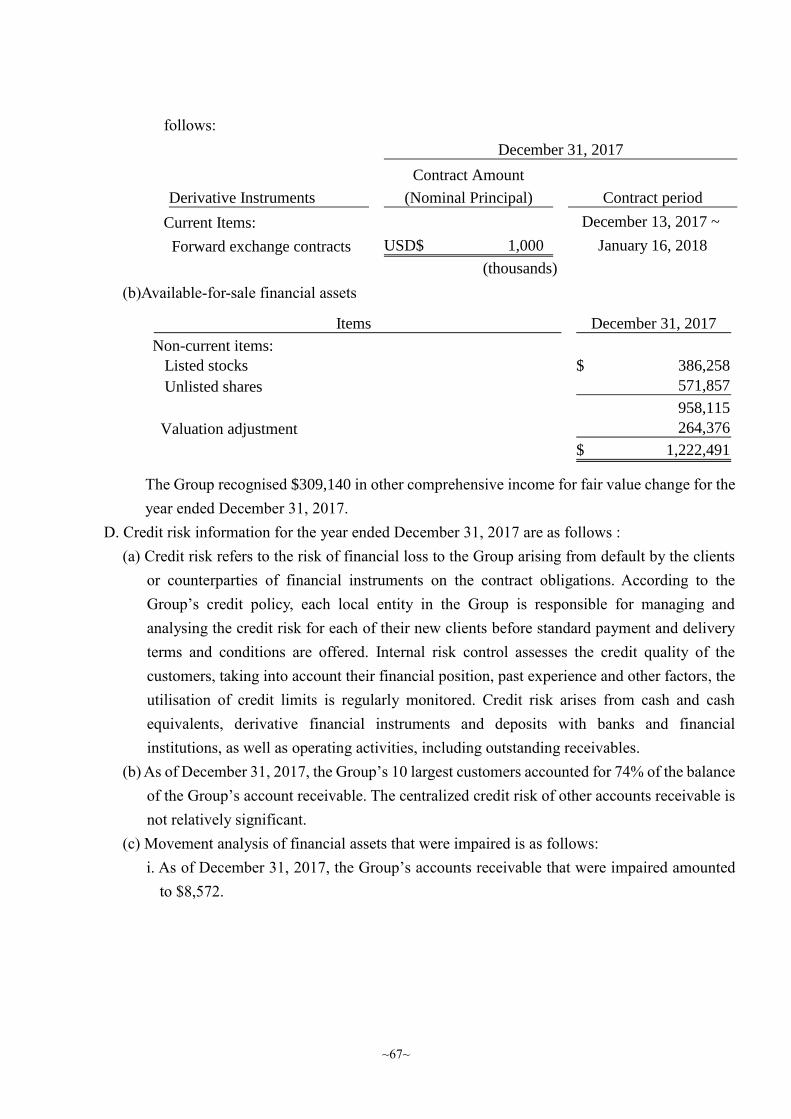
~67~
follows:
(b)Available-for-sale financial assets
The Group recognised $309,140 in other comprehensive income for fair value change for the
year ended December 31, 2017.
D. Credit risk information for the year ended December 31, 2017 are as follows :
(a) Credit risk refers to the risk of financial loss to the Group arising from default by the clients
or counterparties of financial instruments on the contract obligations. According to the
Group’s credit policy, each local entity in the Group is responsible for managing and
analysing the credit risk for each of their new clients before standard payment and delivery
terms and conditions are offered. Internal risk control assesses the credit quality of the
customers, taking into account their financial position, past experience and other factors, the
utilisation of credit limits is regularly monitored. Credit risk arises from cash and cash
equivalents, derivative financial instruments and deposits with banks and financial
institutions, as well as operating activities, including outstanding receivables.
(b) As of December 31, 2017, the Group’s 10 largest customers accounted for 74% of the balance
of the Group’s account receivable. The centralized credit risk of other accounts receivable is
not relatively significant.
(c) Movement analysis of financial assets that were impaired is as follows:
i. As of December 31, 2017, the Group’s accounts receivable that were impaired amounted
to $8,572.
Contract Amount
Derivative Instruments (Nominal Principal) Contract period
Current Items: December 13, 2017 ~
Forward exchange contracts USD$ 1,000 January 16, 2018
(thousands)
December 31, 2017
Items December 31, 2017
Non-current items:
Listed stocks 386,258$
Unlisted shares 571,857
958,115
Valuation adjustment 264,376
1,222,491$
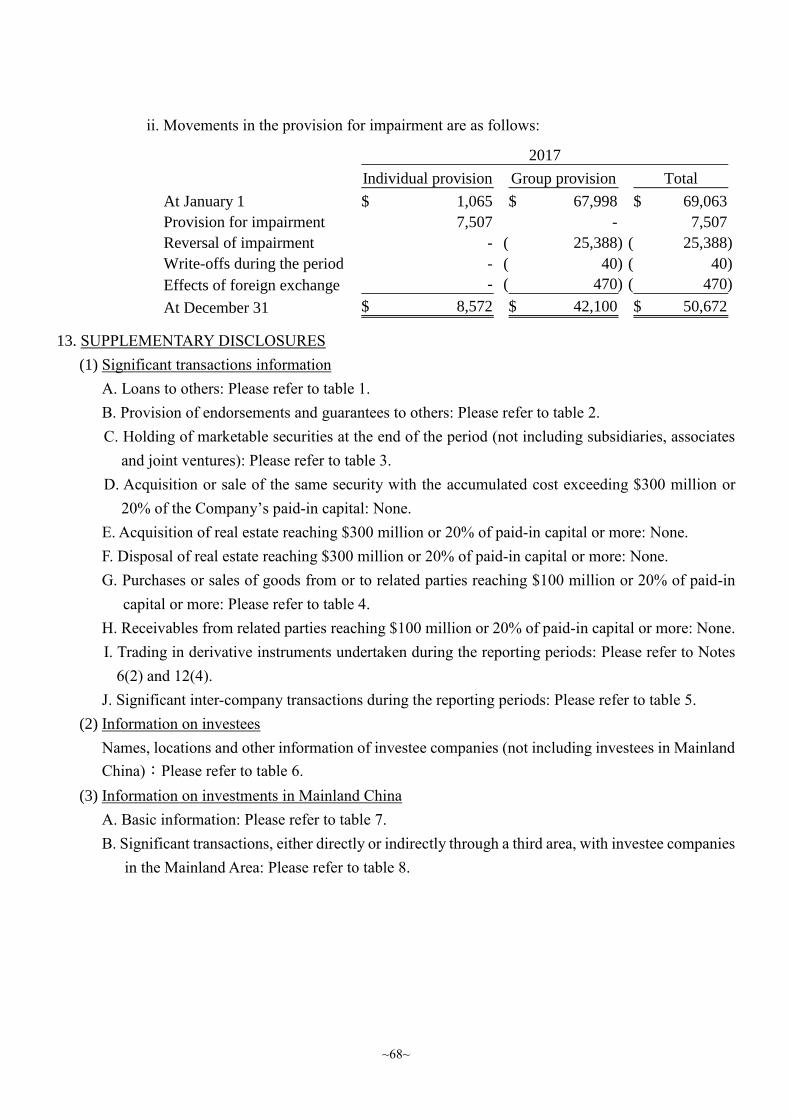
~68~
ii. Movements in the provision for impairment are as follows:
13. SUPPLEMENTARY DISCLOSURES
(1) Significant transactions information
A. Loans to others: Please refer to table 1.
B. Provision of endorsements and guarantees to others: Please refer to table 2.
C. Holding of marketable securities at the end of the period (not including subsidiaries, associates
and joint ventures): Please refer to table 3.
D. Acquisition or sale of the same security with the accumulated cost exceeding $300 million or
20% of the Company’s paid-in capital: None.
E. Acquisition of real estate reaching $300 million or 20% of paid-in capital or more: None.
F. Disposal of real estate reaching $300 million or 20% of paid-in capital or more: None.
G. Purchases or sales of goods from or to related parties reaching $100 million or 20% of paid-in
capital or more: Please refer to table 4.
H. Receivables from related parties reaching $100 million or 20% of paid-in capital or more: None.
I. Trading in derivative instruments undertaken during the reporting periods: Please refer to Notes
6(2) and 12(4).
J. Significant inter-company transactions during the reporting periods: Please refer to table 5.
(2) Information on investees
Names, locations and other information of investee companies (not including investees in Mainland
China):Please refer to table 6.
(3) Information on investments in Mainland China
A. Basic information: Please refer to table 7.
B. Significant transactions, either directly or indirectly through a third area, with investee companies
in the Mainland Area: Please refer to table 8.
Individual provision Group provision Total
At January 1 1,065$ 67,998$ 69,063$
Provision for impairment 7,507 - 7,507
Reversal of impairment - 25,388)( 25,388)(
Write-offs during the period - 40)( 40)(
Effects of foreign exchange - 470)( 470)(
At December 31 8,572$ 42,100$ 50,672$
2017
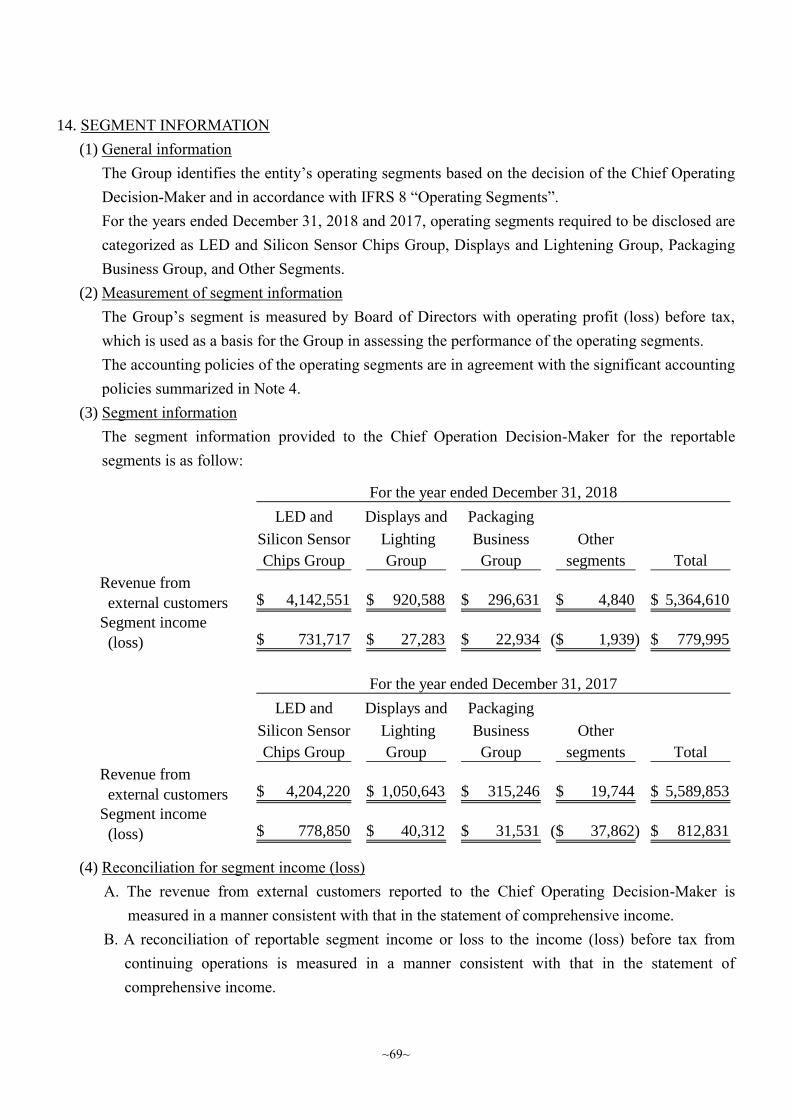
~69~
14. SEGMENT INFORMATION
(1) General information
The Group identifies the entity’s operating segments based on the decision of the Chief Operating
Decision-Maker and in accordance with IFRS 8 “Operating Segments”.
For the years ended December 31, 2018 and 2017, operating segments required to be disclosed are
categorized as LED and Silicon Sensor Chips Group, Displays and Lightening Group, Packaging
Business Group, and Other Segments.
(2) Measurement of segment information
The Group’s segment is measured by Board of Directors with operating profit (loss) before tax,
which is used as a basis for the Group in assessing the performance of the operating segments.
The accounting policies of the operating segments are in agreement with the significant accounting
policies summarized in Note 4.
(3) Segment information
The segment information provided to the Chief Operation Decision-Maker for the reportable
segments is as follow:
(4) Reconciliation for segment income (loss)
A. The revenue from external customers reported to the Chief Operating Decision-Maker is
measured in a manner consistent with that in the statement of comprehensive income.
B. A reconciliation of reportable segment income or loss to the income (loss) before tax from
continuing operations is measured in a manner consistent with that in the statement of
comprehensive income.
LED and Displays and Packaging
Silicon Sensor Lighting Business Other
Chips Group Group Group segments Total
Revenue from
external customers 4,142,551$ 920,588$ 296,631$ 4,840$ 5,364,610$
Segment income
(loss) 731,717$ 27,283$ 22,934$ 1,939)($ 779,995$
For the year ended December 31, 2018
LED and Displays and Packaging
Silicon Sensor Lighting Business Other
Chips Group Group Group segments Total
Revenue from
external customers 4,204,220$ 1,050,643$ 315,246$ 19,744$ 5,589,853$
Segment income
(loss) 778,850$ 40,312$ 31,531$ 37,862)($ 812,831$
For the year ended December 31, 2017
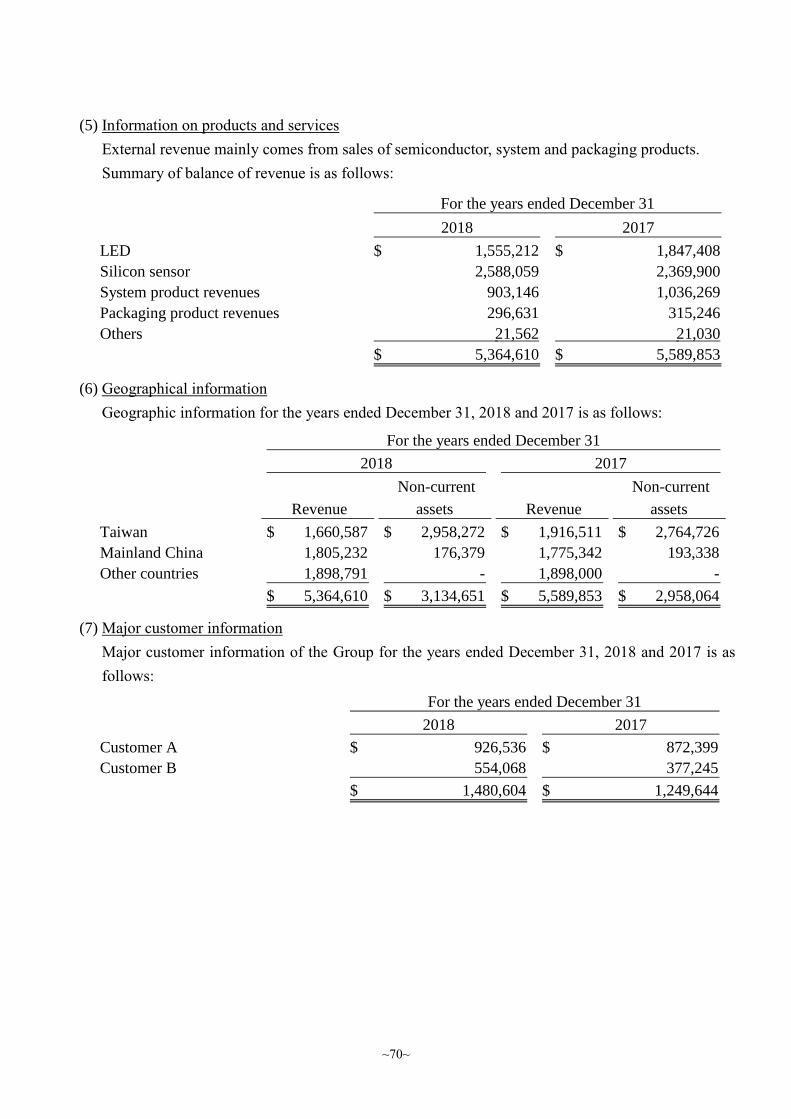
~70~
(5) Information on products and services
External revenue mainly comes from sales of semiconductor, system and packaging products.
Summary of balance of revenue is as follows:
(6) Geographical information
Geographic information for the years ended December 31, 2018 and 2017 is as follows:
(7) Major customer information
Major customer information of the Group for the years ended December 31, 2018 and 2017 is as
follows:
2018 2017
LED 1,555,212$ 1,847,408$
Silicon sensor 2,588,059 2,369,900
System product revenues 903,146 1,036,269
Packaging product revenues 296,631 315,246
Others 21,562 21,030
5,364,610$ 5,589,853$
For the years ended December 31
Revenue
Non-current
assets Revenue
Non-current
assets
Taiwan 1,660,587$ 2,958,272$ 1,916,511$ 2,764,726$
Mainland China 1,805,232 176,379 1,775,342 193,338
Other countries 1,898,791 - 1,898,000 -
5,364,610$ 3,134,651$ 5,589,853$ 2,958,064$
2018 2017
For the years ended December 31
2018 2017
Customer A 926,536$ 872,399$
Customer B 554,068 377,245
1,480,604$ 1,249,644$
For the years ended December 31
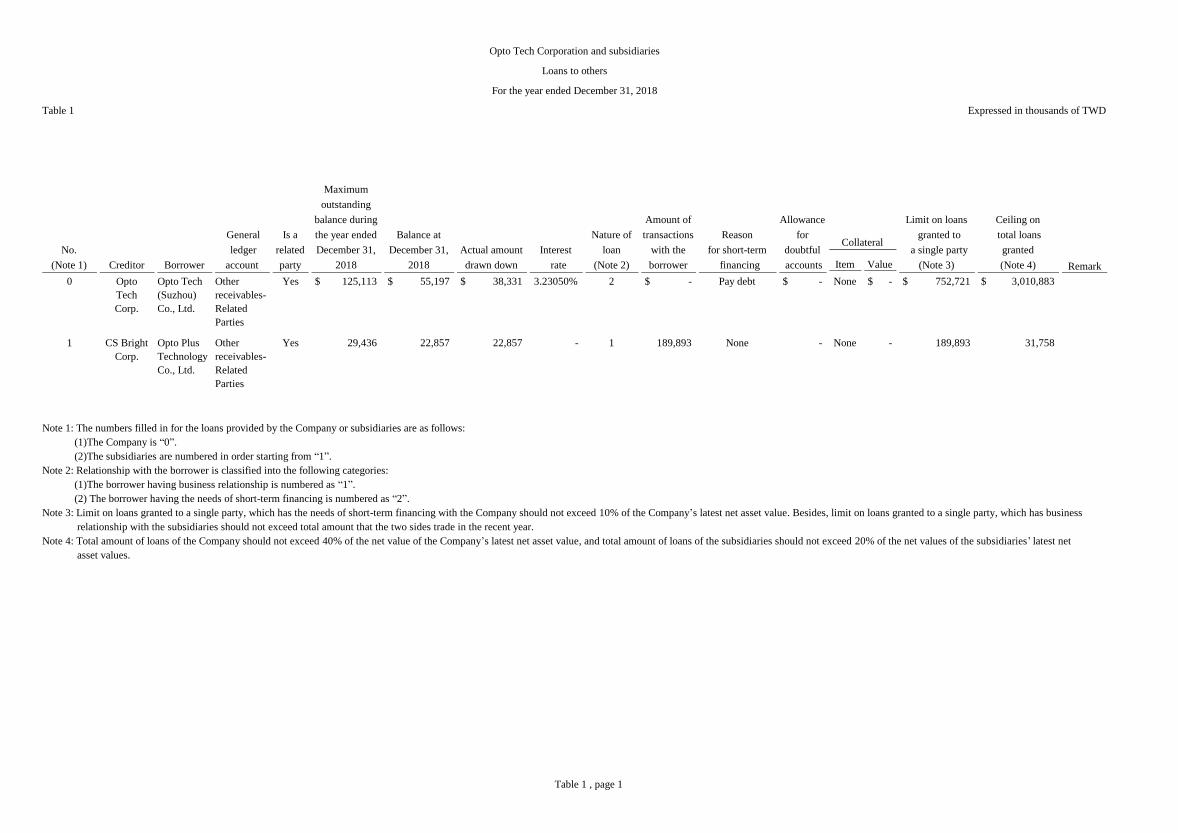
Item Value
0 Opto
Tech
Corp.
Opto Tech
(Suzhou)
Co., Ltd.
Other
receivables-
Related
Parties
Yes 125,113$ 55,197$ 38,331$ 3.23050% 2 -$ Pay debt -$ None -$ 752,721$ 3,010,883$
1 CS Bright
Corp.
Opto Plus
Technology
Co., Ltd.
Other
receivables-
Related
Parties
Yes 29,436 22,857 22,857 - 1 189,893 None - None - 189,893 31,758
Note 1: The numbers filled in for the loans provided by the Company or subsidiaries are as follows:
(1)The Company is “0”.
(2)The subsidiaries are numbered in order starting from “1”.
Note 2: Relationship with the borrower is classified into the following categories:
(1)The borrower having business relationship is numbered as “1”.
(2) The borrower having the needs of short-term financing is numbered as “2”.
Note 3: Limit on loans granted to a single party, which has the needs of short-term financing with the Company should not exceed 10% of the Company’s latest net asset value. Besides, limit on loans granted to a single party, which has business
relationship with the subsidiaries should not exceed total amount that the two sides trade in the recent year.
Note 4: Total amount of loans of the Company should not exceed 40% of the net value of the Company’s latest net asset value, and total amount of loans of the subsidiaries should not exceed 20% of the net values of the subsidiaries’ latest net
asset values.
Table 1 Expressed in thousands of TWD
Amount of
transactions
with the
borrower
Maximum
outstanding
balance during
the year ended
December 31,
2018
Balance at
December 31,
2018
Actual amount
drawn down
Interest
rate
Nature of
loan
(Note 2)
Collateral
Allowance
for
doubtful
accounts
Limit on loans
granted to
a single party
(Note 3)
Ceiling on
total loans
granted
(Note 4) Remark
Opto Tech Corporation and subsidiaries
Loans to others
For the year ended December 31, 2018
Reason
for short-term
financing
No.
(Note 1) Creditor Borrower
General
ledger
account
Is a
related
party
Table 1 , page 1

Company
name
Relationship with
the endorser/
guarantor
(Note 2)
0 Opto
Tech
Corp.
CS Bright
Corp.
2 1,505,441$ 58,943$ 30,000$ 10,000$ -$ 0.40% 3,763,604$ Y N N -
0 Opto
Tech
Corp.
Opto Plus
Technology Co.,
Ltd.
2 1,505,441 186,060 184,590 143,407 - 2.45% 3,763,604 Y N Y -
Note 1: The numbers filled in for the endorsements/guarantees provided by the Company or subsidiaries are as follows:
(1)The Company is “0”.
(2)The subsidiaries are numbered in order starting from “1”.
Note 2: Relationship between the endorser/guarantor and the party being endorsed/guaranteed is classified into the following seven categories; fill in the number of category each case belongs to:
(1) Having business relationship.
(2)The endorser/guarantor parent company owns directly and indirectly more than 50% voting shares of the endorsed/guaranteed subsidiary.
(3) The endorsed/guaranteed company owns directly and indirectly more than 50% voting shares of the endorser/guarantor parent company.
(4) The endorser/guarantor parent company owns directly and indirectly more than 90% voting shares of the endorsed/guaranteed company.
(5) Mutual guarantee of the trade made by the endorsed/guaranteed company or joint contractor as required under the construction contract.
(6) Due to joint venture, all shareholders provide endorsements/guarantees to the endorsed/guaranteed company in proportion to its ownership.
(7) Joint guarantee of the performance guarantee for pre-sold home sales contract as required under the Consumer Protection Act.
Note 3: Under the Company’s “Procedures for Provision of Endorsements and Guarantees”, the Company’s total guarantees and endorsements to others should not exceed 50% of the Company’s net asset value, and total guarantees and
endorsements provided for a single party should not exceed 20% of the Company’s net asset value. The calculation is shown below:
(1) $7,527,207 thousand dollars × 20% = $1,505,441 thousand dollars
(2) $7,527,207 thousand dollars × 50% = $3,763,604 thousand dollars
Outstanding
endorsement/
guarantee
amount at December
31, 2018
Number
(Note 1)
Endorser/
guarantor
Limit on
endorsements/
guarantees
provided for a single
party
(Note 3)
Maximum outstanding
endorsement/
guarantee
amount as of December
31, 2018
Party being
endorsed/guaranteedProvision of
endorsements/
guarantees
to the party
in Mainland
China Remark
Actual amount
drawn down
Amount of
endorsements/
guarantees
secured with
collateral
Ratio of accumulated
endorsement/
guarantee amount to net
asset value of the
endorser/
guarantor company
Ceiling on
total amount of
endorsements/
guarantees
provided
(Note 3)
Provision of
endorsements/
guarantees
by parent
company to
subsidiary
Provision of
endorsements/
guarantees
by subsidiary
to parent
company
Expressed in thousands of TWDTable 2
Opto Tech Corporation and subsidiaries
Provision of endorsements and guarantees to others
For the year ended December 31, 2018
Table 2 , page 1

Table 3
Number of shares Book value Ownership (%) Fair value
Opto Tech Corp. Stock AXT, Inc. None. Financial assets at fair value
through profit or loss
124,100 -$ - -$ Note
〞 〞 Nichia Corp. This company is the parent
company of Nichia Taiwan Corp.
Financial assets at fair value
through other comprehensive
income
10,000 723,290 0.45 723,290 None
〞 〞 Viking Tech Corporation. None. 〞 2,873,994 88,519 2.45 88,519 None
〞 〞 Lu Zhu Development
Co., Ltd.
None. Financial assets at fair value
through profit or loss
12,551,625 106,899 6.38 106,899 None
〞 〞 Giga Epitaxy
Technology Corp.
The Company is the director of this
company.
Financial assets at fair value
through other comprehensive
income
4,950,491 26,515 19.00 26,515 None
〞 〞 Shin-Etsu Opto
Electronic Co., Ltd.
The Company is the director of this
company.
〞 2,000,000 33,222 10.00 33,222 None
〞 〞 Top Increasing
Technology Co., Ltd.
None. Financial assets at fair value
through profit or loss
10,000,000 - 16.67 - None
Ho Chung Investment Co., Ltd. 〞 Opto Tech Corp. Parent company 〞 887,698 16,112 0.20 16,112 None
Opto Tech (Suzhou) Co., Ltd. Others Jin Misa Technology
Co., Ltd.
None. Financial assets at fair value
through other comprehensive
income
- - 15.00 - None
Opto Tech Corp. Fund Yuanta Wan Tai Money
Market fund
None. Financial assets at fair value
through profit or loss
2,714,629 41,060 None 41,060 None
〞 〞 Franklin Templeton Sinoam
Money Market fund
None. 〞 4,448,043 45,908 None 45,908 None
〞 〞 Capital Money Market fund None. 〞 635,397 10,237 None 10,237 None
〞 〞 UPAMC James Bond Money
Market fund
None. 〞 1,224,826 20,437 None 20,437 None
〞 〞 Taishin 1699 Money Market
fund
None. 〞 2,280,623 30,805 None 30,805 None
〞 〞 FSITC Taiwan Money Market
fund
None. 〞 4,022,602 61,451 None 61,451 None
〞 〞 Jih Sun Money Market fund None. 〞 692,329 10,242 None 10,242 None
Note : The 124,000 shares of AXT, Inc. which are owned by the Company, are preferred stocks.
RemarkSecurities held by
Type of
marketable
securities
Relationship with the
securities issuer General ledger account
As of December 31, 2018
Opto Tech Corporation and subsidiaries
Holding of marketable securities at the end of the period (not including subsidiaries, associates and joint ventures)
December 31, 2018
Expressed in thousands of TWD
Name of marketable
securities
Table 3 , page 1
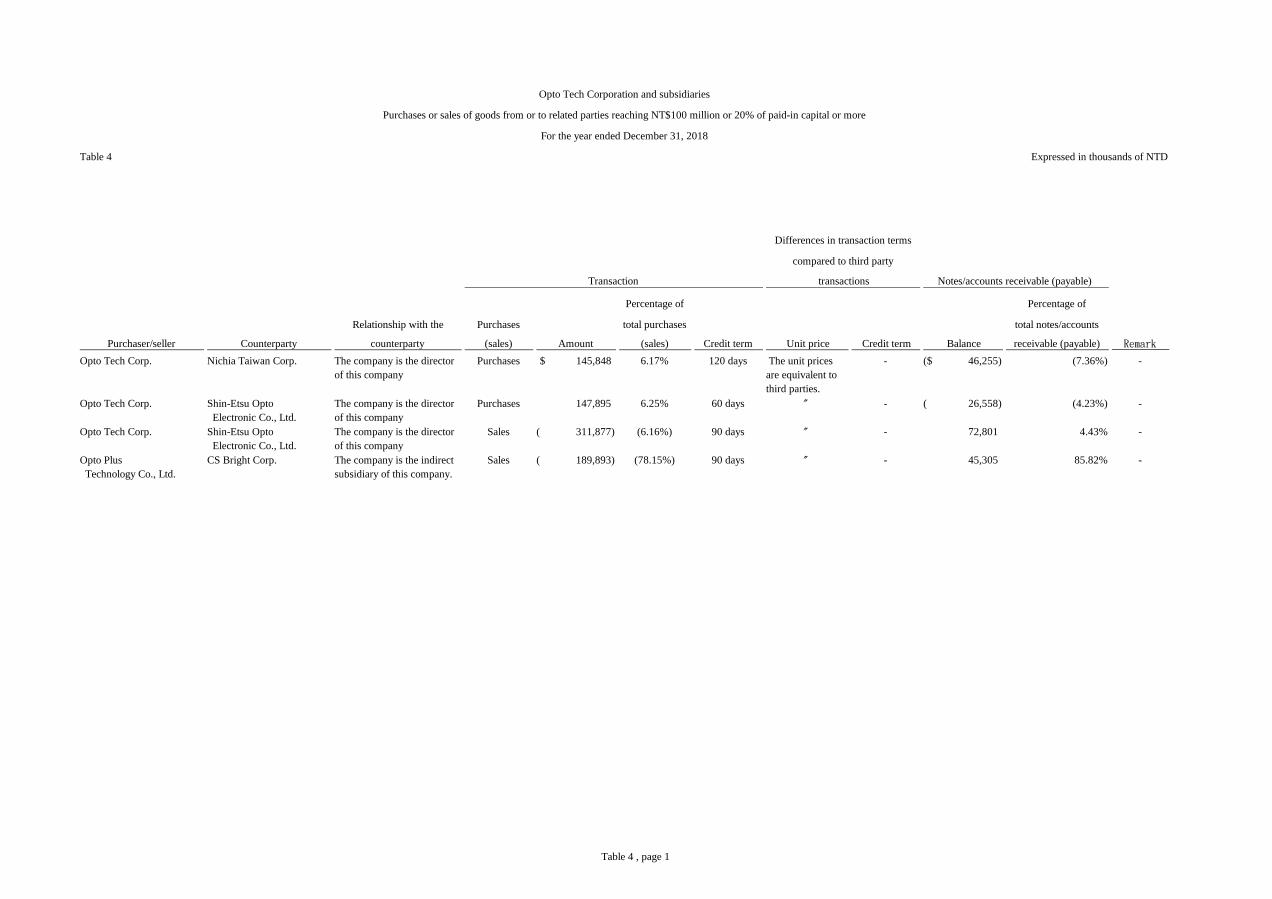
Table 4
Percentage of Percentage of
Relationship with the Purchases total purchases total notes/accounts
Purchaser/seller Counterparty counterparty (sales) Amount (sales) Credit term Unit price Credit term Balance receivable (payable) Remark
Opto Tech Corp. Nichia Taiwan Corp. The company is the director
of this company
Purchases 145,848$ 6.17% 120 days The unit prices
are equivalent to
third parties.
- 46,255)($ (7.36%) -
Opto Tech Corp. Shin-Etsu Opto
Electronic Co., Ltd.
The company is the director
of this company
Purchases 147,895 6.25% 60 days 〞 - 26,558)( (4.23%) -
Opto Tech Corp. Shin-Etsu Opto
Electronic Co., Ltd.
The company is the director
of this company
Sales 311,877)( (6.16%) 90 days 〞 - 72,801 4.43% -
Opto Plus
Technology Co., Ltd.
CS Bright Corp. The company is the indirect
subsidiary of this company.
Sales 189,893)( (78.15%) 90 days 〞 - 45,305 85.82% -
Transaction transactions Notes/accounts receivable (payable)
Opto Tech Corporation and subsidiaries
Purchases or sales of goods from or to related parties reaching NT$100 million or 20% of paid-in capital or more
For the year ended December 31, 2018
Expressed in thousands of NTD
Differences in transaction terms
compared to third party
Table 4 , page 1

Table 5
General ledger account Amount Transaction terms
Percentage of consolidated total operating
revenues or total assets
1 Opto Tech Corporation Opto Tech (Suzhou) Co.
Ltd.
1 Other receivable-related party 38,331$ - 0.38%
2 CS Bright Corp. Opto Plus Technology
Co., Ltd.
3 Sales 10,378 Note 4 0.19%
2 CS Bright Corp. Opto Plus Technology
Co., Ltd.
3 Accounts receivable 59,098 Note 4 0.58%
2 CS Bright Corp. Opto Plus Technology
Co., Ltd.
3 Other receivable-related party 22,857 - 0.22%
3 Opto Plus Technology Co., Ltd. CS Bright Corp. 3 Sales 189,893 Note 4 3.54%
3 Opto Plus Technology Co., Ltd. CS Bright Corp. 3 Accounts receivable 45,305 Note 4 0.44%
Note 1: The numbers filled in for the transaction company in respect of inter-company transactions are as follows:
(1)Parent company is “0”.
(2)The subsidiaries are numbered in order starting from “1”.
Note 2: Relationship between transaction company and counterparty is classified into the following three categories:
(1)Parent company to subsidiary.
(2)Subsidiary to parent company.
(3)Subsidiary to subsidiary.
Note 3: Regarding percentage of transaction amount to consolidated total operating revenues or total assets, it is computed based on period-end balance of transaction to consolidated total assets for balance sheet accounts and based on
accumulated transaction amount for the period to consolidated total operating revenues for income statement accounts.
Note 4: The unit sales prices are equivalent to third parties. The credit term was 30~85 days for the related parties.
Note 5: The disclosure standard requires above $10,000 thousand for the transaction amount. Only assets and revenue are disclosed, related transactions are not disclosed.
Number Company name Counterparty
Opto Tech Corporation and subsidiaries
Significant inter-company transactions during the reporting periods
Relationship
Transaction
For the year ended December 31, 2018
Expressed in thousands of TWD
Table 5 , page 1
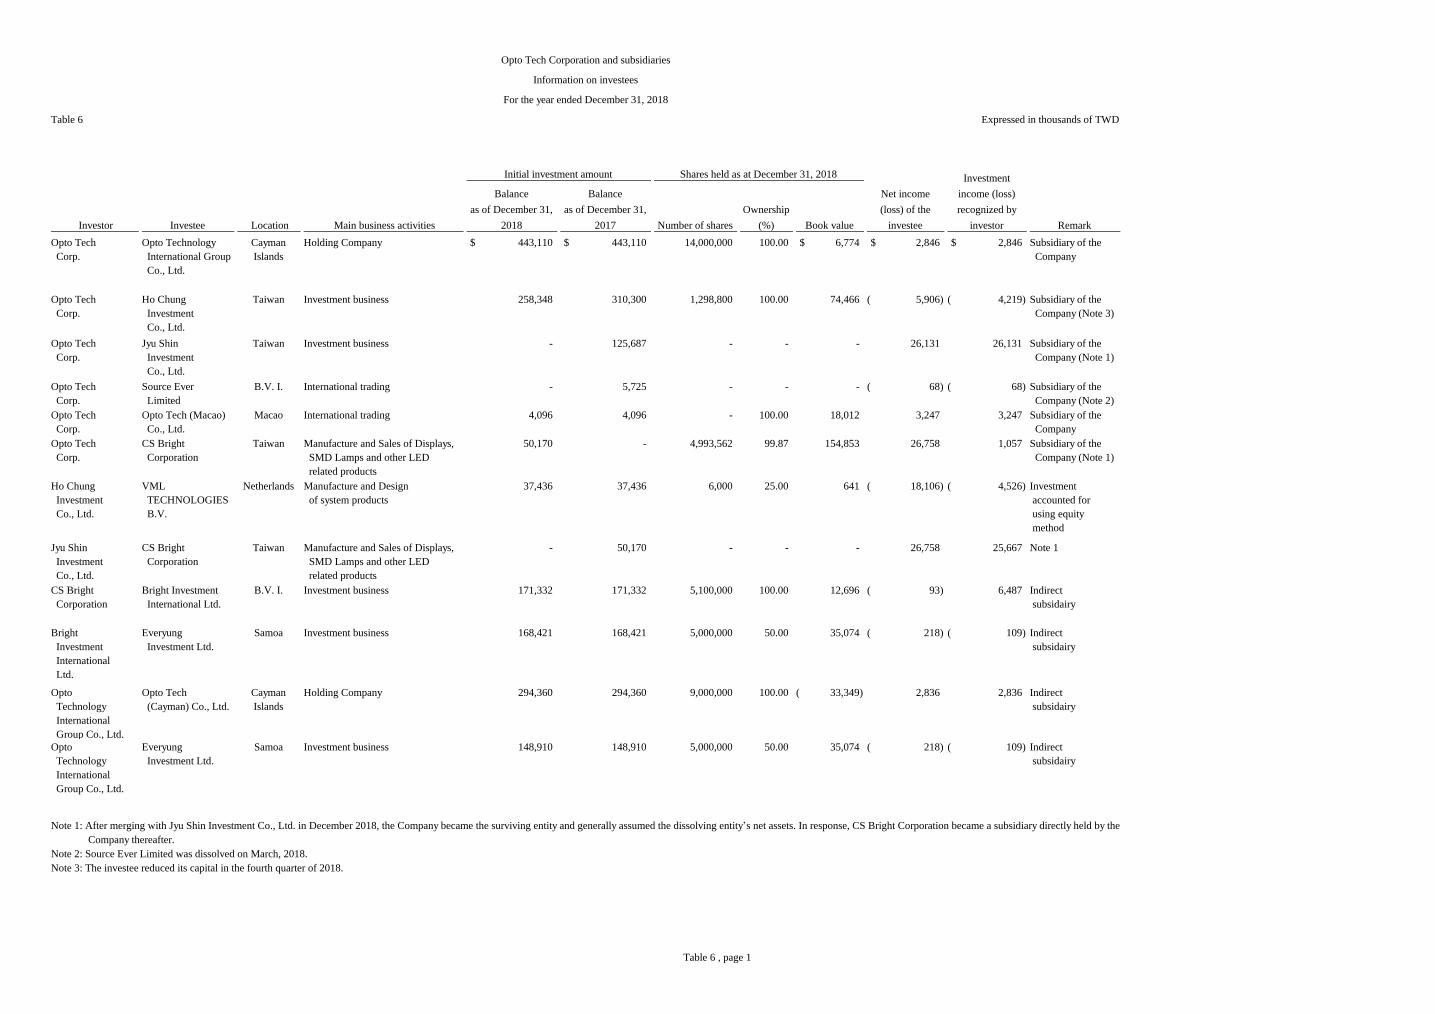
Table 6
Balance
as of December 31,
2018
Balance
as of December 31,
2017 Number of shares
Ownership
(%) Book value
Opto Tech
Corp.
Opto Technology
International Group
Co., Ltd.
Cayman
Islands
Holding Company 443,110$ 443,110$ 14,000,000 100.00 6,774$ 2,846$ 2,846$ Subsidiary of the
Company
Opto Tech
Corp.
Ho Chung
Investment
Co., Ltd.
Taiwan Investment business 258,348 310,300 1,298,800 100.00 74,466 5,906)( 4,219)( Subsidiary of the
Company (Note 3)
Opto Tech
Corp.
Jyu Shin
Investment
Co., Ltd.
Taiwan Investment business - 125,687 - - - 26,131 26,131 Subsidiary of the
Company (Note 1)
Opto Tech
Corp.
Source Ever
Limited
B.V. I. International trading - 5,725 - - - 68)( 68)( Subsidiary of the
Company (Note 2)
Opto Tech
Corp.
Opto Tech (Macao)
Co., Ltd.
Macao International trading 4,096 4,096 - 100.00 18,012 3,247 3,247 Subsidiary of the
Company
Opto Tech
Corp.
CS Bright
Corporation
Taiwan Manufacture and Sales of Displays,
SMD Lamps and other LED
related products
50,170 - 4,993,562 99.87 154,853 26,758 1,057 Subsidiary of the
Company (Note 1)
Ho Chung
Investment
Co., Ltd.
VML
TECHNOLOGIES
B.V.
Netherlands Manufacture and Design
of system products
37,436 37,436 6,000 25.00 641 18,106)( 4,526)( Investment
accounted for
using equity
method
Jyu Shin
Investment
Co., Ltd.
CS Bright
Corporation
Taiwan Manufacture and Sales of Displays,
SMD Lamps and other LED
related products
- 50,170 - - - 26,758 25,667 Note 1
CS Bright
Corporation
Bright Investment
International Ltd.
B.V. I. Investment business 171,332 171,332 5,100,000 100.00 12,696 93)( 6,487 Indirect
subsidairy
Bright
Investment
International
Ltd.
Everyung
Investment Ltd.
Samoa Investment business 168,421 168,421 5,000,000 50.00 35,074 218)( 109)( Indirect
subsidairy
Opto
Technology
International
Group Co., Ltd.
Opto Tech
(Cayman) Co., Ltd.
Cayman
Islands
Holding Company 294,360 294,360 9,000,000 100.00 33,349)( 2,836 2,836 Indirect
subsidairy
Opto
Technology
International
Group Co., Ltd.
Everyung
Investment Ltd.
Samoa Investment business 148,910 148,910 5,000,000 50.00 35,074 218)( 109)( Indirect
subsidairy
Note 1: After merging with Jyu Shin Investment Co., Ltd. in December 2018, the Company became the surviving entity and generally assumed the dissolving entity’s net assets. In response, CS Bright Corporation became a subsidiary directly held by the
Company thereafter.
Note 2: Source Ever Limited was dissolved on March, 2018.
Note 3: The investee reduced its capital in the fourth quarter of 2018.
Net income
(loss) of the
investee
Investment
income (loss)
recognized by
investor
Opto Tech Corporation and subsidiaries
Information on investees
For the year ended December 31, 2018
Expressed in thousands of TWD
Remark Investor Investee Location Main business activities
Initial investment amount Shares held as at December 31, 2018
Table 6 , page 1

Table 7
Opto Tech
(Suzhou) Co.,
Ltd.
Research, Design and
Manufacture of LED
Display, Wireless
Communication
Equipment and
related parts
294,708$ (2) 294,708$ -$ -$ 294,708$ 2,535$ 100.00% 2,535$ 42,007)($ -$ -
Opto Plus
Technology
Co., Ltd.
Manufacture and
Sales of LED and
Electronic products
317,341 (2) 317,341 - - 317,341 217)( 99.94% 217)( 70,148 - -
Note 1: The investment methods are classified into three categories as follows:
(1) Directly investing in the investee company in Mainland China.
(2) Through investing in an existing company in the third area, which then invested in the investee company in Mainland China. (Opto Tech (Cayman) Co., Ltd. invests Opto Tech (Suzhou) Co., Ltd. and
Everyung Investment Ltd. invests Opto plus Technology Co., Ltd.)
(3) Others.
Note 2: The investment income or loss was recognised by indirect weighted ownership based on the financial statements of these investees which were audited by the independent accountants of the parent company for the
corresponding periods.
Investments in Mainland China for the year ended December 31, 2018:
Name of company
Accumulated amount
of remittance from
Taiwan to Mainland
China
as of December 31,
2018
Investment
amount
approved by the
Investment
Commission of
the Ministry of
Economic
Affairs (MOEA)
Ceiling on
investments in
Mainland China
imposed by the
Investment
Commission of
MOEA
Opto Tech Corp. $ 612,049 $ 612,557 $ 4,516,324
Accumulated
amount
of investment
income
remitted back to
Taiwan as of
December 31,
2018 Remark
Accumulated
amount
of remittance to
Mainland China
as of December
31, 2018
Net income
of investee as
of December
31, 2018
Ownership
held by
the
Company
(direct or
indirect)
Investment income
(loss) recognised
by the Company
for the year ended
December 31, 2018
(Note 2)
Book value of
investments in
Mainland China
as of December
31, 2018
Opto Tech Corporation and subsidiaries
Information on investments in Mainland China
For the year ended December 31, 2018
Expressed in thousands of TWD
Amount
remitted
back to
Taiwan
during the
periodPaid-in capital
Investment
method
(Note 1)
Accumulated
amount of
remittance to
Mainland
China
as of January 1,
2018
Investee in Mainland
China
Main business
activities
Amount
remitted
to Mainland
China
during the
period
Table 7 , page 1

Table 8
Amount % Amount %
Balance at
December 31,
2018 %
Balance at
December 31,
2018 Purpose
Maximum balance during
the year ended December
31, 2018
Balance at
December 31, 2018 Interest rate
Interest during the
year ended December
31, 2018
Opto Tech
(Suzhou) Co.,
Ltd.
$ - - $ - - $ - - $ - - $ 125,113 55,197$ 3.23050% 1,226$ None
Opto Plus
Technology
Co., Ltd.
10,378 0.19 - - 59,098 3.57 184,590 Guarantee of
bank line of
credit
- - - - None
Opto Plus
Technology
Co., Ltd.
( 189,893) (8.03) - - ( 45,305) (6.84) - - 29,436 22,857 - - None
Others
Investee in
Mainland
China
Sale (purchase) Property transaction
Accounts receivable
(payable)
Provision of
endorsements/guarantees
or collaterals Financing
Expressed in thousands of TWD
Opto Tech Corporation and its subsidiaries
Significant transactions conducted with investees in Mainland China directly or indirectly through other companies in the third areas
For the year ended December 31, 2018
Table 8 , page 1