optpbe-vdw density functional theory study of liquid water ... · draft 6 98 the dft-d2 and...
TRANSCRIPT

Draft
optPBE-vdW Density Functional Theory Study of Liquid
Water and Pressure-Induced Structural Evolution in Ice Ih
Journal: Canadian Journal of Chemistry
Manuscript ID cjc-2017-0201.R1
Manuscript Type: Article
Date Submitted by the Author: 27-Apr-2017
Complete List of Authors: Yong, Xue; University of Saskatchewan, Physics and Engineering Physics Tse, John; University of Saskatchewan, Physics English, Niall; University College Dublin,
Is the invited manuscript for consideration in a Special
Issue?: TK Sham
Keyword: ab initio molecular dynamics, pressure effect, ice, density functionals
https://mc06.manuscriptcentral.com/cjc-pubs
Canadian Journal of Chemistry

Draft
1
optPBE-vdW Density Functional Theory Study of Liquid Water and Pressure-1
Induced Structural Evolution in Ice Ih 2
Xue Yong1, John S. Tse1* and Niall J. English2* 3
1Department of Physics and Engineering Physics, University of Saskatchewan, Saskatoon, 4
Saskatchewan, S7N 5E2, Canada, 5
2School of Chemical and Bioprocess Engineering, University College Dublin, Belfield, 6
Dublin 4, Ireland. 7
* Corresponding authors: [email protected], tel (306) 966 6410, fax: (306) 966-6400, 8
[email protected], +353 1 7161646 9
10
11
Page 1 of 28
https://mc06.manuscriptcentral.com/cjc-pubs
Canadian Journal of Chemistry

Draft
2
ABSTRACT 12
The accuracy of several local and non-local van der Waals-corrected exchange correlation 13
functionals on the description of the effect of pressure on ice has been investigated. In a 14
preliminary survey, the non-local van der Waals-correction used in conjunction with the optPBE 15
functional was shown to provide the best overall agreement on the structural parameters of ice Ih 16
with experiments. More importantly, this combination reproduced correctly the recently 17
observed crystal → crystal transformation in ice-Ih at 80 K prior to amorphisation. The predicted 18
transition pressure of 1.9 GPa is somewhat higher, showing the current generation of vdW-19
functionals are still not sufficiently accurate for the ice system. The existence of an intermediate 20
crystalline state with a shear-hexagonal structure confirms the earlier prediction that the collapse 21
of crystalline structure under compression originates from the softening of phonon modes in ice 22
Ih’s basal plane. 23
Key words: pressure, DFT, vdw 24
25
Page 2 of 28
https://mc06.manuscriptcentral.com/cjc-pubs
Canadian Journal of Chemistry

Draft
3
26
Introduction 27
Under different temperature and pressure conditions, water can exist in as many as 16 28
crystalline forms1,2 and several amorphous states3–6. The discovery of pressure-induced 29
transformation from crystalline ice Ih to a high-density amorphous (HDA) phase at 77 K and 1 30
GPa in 19843 was a major milestone in the study of the physics and chemistry of ice. HDA was 31
believed originally to be related to thermodynamic melting3, but it was later suggested that at low 32
temperatures (< 160 K), the formation of HDA is the result of a mechanical instability in the 33
water lattice where one of Born’s stability conditions (Born’s stability criteria require that all 34
elastics energy are positive definite)7 was violated8. It was conjectured that this putative violation 35
led to the collapse of the crystalline structure and resulted in the formation of the metastable 36
HDA form8. However, recently, experimental X-ray diffraction measurements9 under quasi-37
hydrostatic conditions have led to discovery of a crystal→ crystal transition at ~1.1 GPa prior to 38
HDA formation. This observation has been reproduced by constant-pressure molecular-dynamics 39
(MD) calculations using the TIP4P/ice10 water potential by small pressure increment steps. This 40
experimental finding and MD analysis have provided significant and new information on the 41
modifications of the hexagonal lattice of crystalline ice leading to amorphisation, and detailed 42
characterisation of the resultant amorphous structure. 43
The accuracy of computed water properties depends critically on the methodology as well as on 44
the quality of the intermolecular potential. MD employing empirical force-fields has succeeded 45
reasonably well in reproducing many experimental properties of ice and liquid water under a 46
variety of thermodynamic conditions. Examples of properties include site-site radial distribution 47
functions, X-ray and neutron structure factors, the heat of vaporisation, and the maximum 48
density of liquid water11,12. Naturally, the use of empirical force fields requires substantially less 49
Page 3 of 28
https://mc06.manuscriptcentral.com/cjc-pubs
Canadian Journal of Chemistry

Draft
4
computational resources than first-principles-based methods, and can be applied to large systems. 50
Recently, and perhaps more desirably for future studies, Density Functional Theory (DFT)-based 51
ab initio-MD (AIMD) methods have also been used to model the structure and properties of 52
water and ice in a wide range of environments13,14. 53
The currently available generation of exchange-correlation functionals within the framework of 54
the Generalised Gradient Approximation (GGA) is known to suffer from several known 55
deficiencies when applied to the study of water, such as self-interaction error and lack of nuclear 56
quantum effects. Another important reason for the failure of GGA functionals in the prediction 57
of the structure of liquid water lies in the neglect of van der Waals (vdW) dispersion interactions. 58
Indeed, based on such an approach, the polarisability of the water molecule is overestimated, 59
leading to the cooperative enhancement of hydrogen bonding and “over-structuring”15–18. Thus, 60
there is a very low diffusion rate at room temperature with such a “pure” GGA approach, due to 61
substantial underestimation of the fraction of broken hydrogen bonds. GGA functionals also 62
produce inaccurate pressure-volume relationships15–17. For example, an ambient-pressure and 63
temperature equilibrium density of 0.80 g/cm3 was obtained by simulations performed within the 64
isobaric-isothermal (NPT) ensemble using the PBE functional19. Recently, the application of 65
DFT to water has been reviewed and the crucial role of dispersion interaction is explained13,14. 66
Uses of vdW-correction have led to better description on the structures of gas-phase clusters and 67
liquid water. However, a similar understanding regarding the properties of ice remains elusive, 68
although English had discussed the structures and system-size effects on liquid water and ice Ih 69
with the Dion’s non-local dispersion approach20. Santra et al. evaluated the vdW effects from the 70
contribution of vdW interaction to the lattice energy and density on several ice phases at ambient 71
and at high pressures21. In the present study, we compare the performance of several vdW 72
exchange-correlation functionals implemented in the periodic electronic structure code, Vienna 73
Page 4 of 28
https://mc06.manuscriptcentral.com/cjc-pubs
Canadian Journal of Chemistry

Draft
5
ab initio simulation package (VASP)22–25 on ice Ih. The best functional will be used to 74
investigate the pressure-induced structural evolution of ice Ih. by AIMD simulations. 75
76
Computational methodology 77
The objective of this study is to determine the best-performing vdW-GGA functional suitable 78
for simulation of water in the condensed phase. For this purpose, we test the fidelity of several 79
vdW functionls in reproducing the experimental structural parameters on a proton-disordered 80
hexagonal ice Ih configuration21 consisting of 12 water molecules (labelled as ‘Ice-Ih-12’, see 81
Figure 1a) We have studied the Grimme’s empirical DFT-D226 and DFT-D327 (the latter with 82
and without Becke-Johnson damping27,28), and non-local vdW-DF proposed by Dion et al29. in 83
conjunction with the optPBE-vdW and rPW86-vdW functionals30,31. Electron orbitals were 84
expanded by PW basis sets with an energy cut-off of 1000 eV. Γ-point Brillouin-zone sampling 85
was used. A time step of 1.0 fs was used for all MD calculations, using Born-Oppenheimer 86
propagation. The SCF energy convergence threshold was set to 10-5 eV. As will be shown below 87
(vide infra), the optPBE-vdW functional was found to be most suitable for our purposes. 88
To investigate the structural evolution of ice Ih under mechanical pressure, an orthorhombic 89
proton-disordered ice model with 96 molecules (taken from ref. 32 and labelled ‘Ice-Ih-96’), 90
Figure 1b was used. The system was first equilibrated at 80 K and 0.0 GPa with AIMD in the 91
canonical (NVT) ensemble. This was followed by a series of AIMD calculations in the NPT 92
ensemble with Langevin thermostat; these were performed from 0.0 GPa to 0.9 GPa with in step 93
of 0.2 GPa. Each simulation was run for at least 10 ps. Near the anticipated phase transition 94
between 1.0 GPa to 2.0 GPa, a smaller pressure increment of 0.1 GPa was used. Each simulation 95
was run for 30 ps. Additional calculations were performed at 2.2 GPa, 2.4 GPa and 3.0 GPa after 96
collapse of the ice structure. Each simulation was run for 10 ps. In addition, for completeness, 97
Page 5 of 28
https://mc06.manuscriptcentral.com/cjc-pubs
Canadian Journal of Chemistry

Draft
6
the DFT-D2 and optPBE-vdW functional was also used to simulate liquid water via AIMD, on a 98
model system consisted of 96 molecules at a density of 1.0 g/cm3. After initial relaxation, MD 99
simulations at 300 and 330 K were performed in the NVT ensemble for at least 10 ps. 100
Results and Discussion 101
Comparison of vdW-corrected functionals on the prediction of the cell constants of ice Ih 102
Table 1 compares the experimental33 and fully optimised internal coordinates and lattice 103
constants from a variety of vdW-corrected functionals on the Ice-Ih-12 model. Within this group 104
of functionals, results obtained with the non-local rPW96-vdW and optPBE-vdW functionals are 105
in better agreement with experimental data than the empirical Grimme’s vdW empirical D2 and 106
D3 functionals. The rPW96-vdW-predicted a and b cell constants are 0.12 Å longer, and the c 107
axis is 0.30 Å shorter. In comparison, the optPBE-vdW-predicted a- and b- axis lengths of 7.72 Å 108
are in reasonable agreement with experiment, whilst that of the c-axis is also underestimated, by 109
0.47 Å. The overall volume predicted by optPBE-vdW functional is in slightly better agreement 110
with the experimental value and, although this functional is not perfect, it was chosen for ensuing 111
ice Ih AIMD calculations 112
113
Pressure-induced structural transformations in ice Ih 114
It is known from experiment that if ice is compressed at 80 K, it transforms to a high-density 115
amorphous form3. The underlying transformation mechanism is debated. Recently, from 116
experiment under quasi-hydrostatic condition, we found that ice Ih transformed to a new 117
crystalline structure prior to amorphisation9. This observation was reproduced by carefully 118
compressed NPT MD calculations with the TIP4P/ice water potential. Indeed, reproducing this 119
result would constitute a challenging problem for AIMD, and we pursue this goal further here. In 120
so doing, we performed NPT AIMD using the optPBE-vdW functional. The evolution of the 121
Page 6 of 28
https://mc06.manuscriptcentral.com/cjc-pubs
Canadian Journal of Chemistry
Draft
7
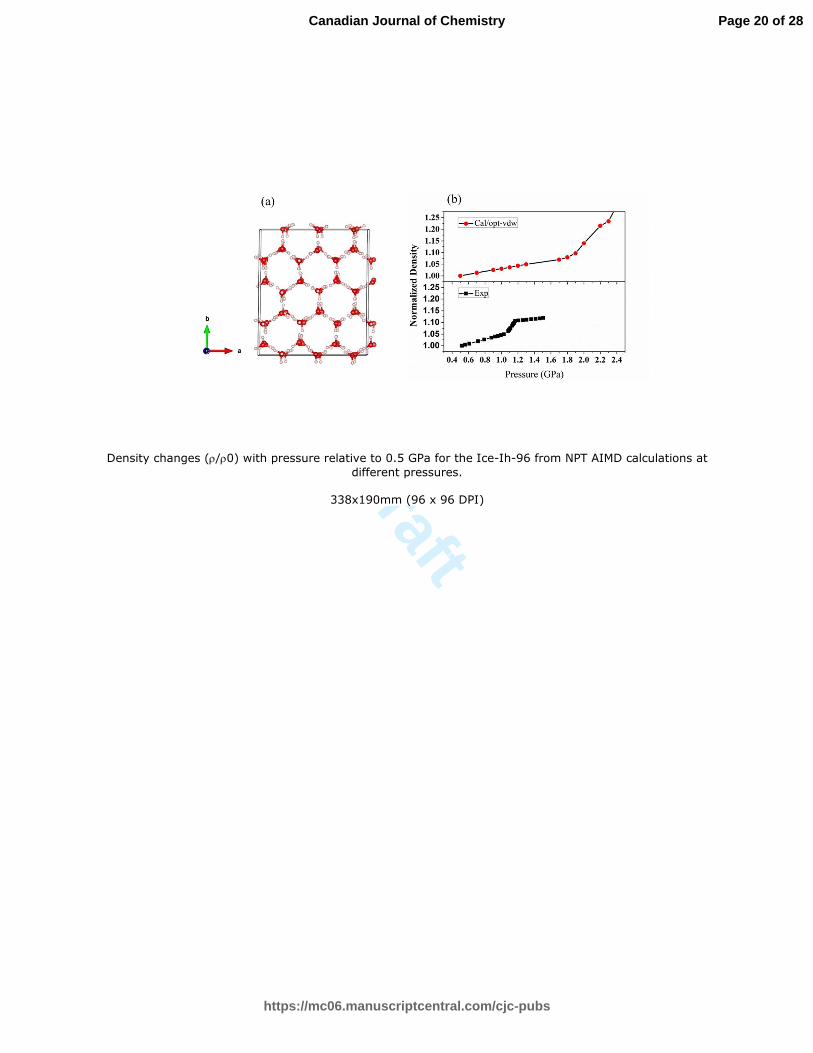
computed density with pressure at 80 K is shown in Figure 2. Up to 1.8 GPa, density increased 122
monotonically until 1.9 GPa, where a sudden jump was observed. Examination of the resulting 123
structure indicated it was not amorphous and remained crystalline. Therefore, a crystal → crystal 124
transformation has occurred. Further compression led to complete amorphisation at 2.3 GPa. 125
Snapshots of the temporal changes in the structure taken from the AIMD trajectory at different 126
pressures are shown in Figure 3. A clearly distorted oxygen lattice was observed. The static 127
structure factor S(q) calculated from the MD trajectory for this intermediate crystalline phase 128
shows splitting of the Bragg reflections, and is in reasonable agreement with the observed x-ray 129
diffraction pattern, as shown in Figure 4. The occurrence of a novel crystal → crystal structural 130
transformation was correctly reproduced by the present AIMD as well as classical MD 131
calculations using the TIP4P/ice model; naturally, pressures were adjusted carefully in small 132
increments near the phase transition. The AIMD crystalline transition pressure of ~1.9 GPa is 133
higher than the experiment pressure and that predicted by TIP4P/ice-based MD calculations of 134
1.1 – 1.3 GPa. A higher calculated transition pressure of ca. 0.8 GPa is not unreasonable, as vdW 135
corrected density functional calculations also overestimate the transition pressures between 136
several high- pressure crystalline forms of ice13. This seems to be a deficiency of the current 137
generation of vdW-functionals. 138
To examine structural changes in compressed ice, we have computed the O-O-O angle (θ, see 139
Figure 5a) distribution function, P(θ) (cf. Figure 5b). The results depicted in Figure 5b show 140
three types of distributions. Before the transition, the O-O-O angle is distributed between 90° 141
and 120°, with the maximum at 109°, the expected tetrahedral angle in ice Ih. For the 142
intermediate crystalline phase, P(θ) becomes broadened, spanning between 80 and 140°, with the 143
mean angle shifted to ~100°. In the amorphous state at 2.4 GPa, P(θ) is very broad with a plateau 144
Page 7 of 28
https://mc06.manuscriptcentral.com/cjc-pubs
Canadian Journal of Chemistry

Draft
8
region spread between 70° and 120°. The analysis shows that the main structural change in the 145
transition to the sheared form is the distortion of the O-O-O angle from the ideal tetrahedral 146
arrangement. 147
We now focus on how the local environment of individual water molecules were affected by 148
pressure and how these changes are related to the phase transitions. Figure 6a depicts the local 149
chemical environment of a water molecule (labeled as 0) in ice, where the four hydrogen-bonded 150
molecules (1–4) to 0 formed the 1st-nearest neighbour shell of 0. The 2nd-nearest neighbour shell 151
of 0 is shown as molecule 5, which can be both hydrogen-bonded and non-hydrogen bonded to 0. 152
Figure 6a shows the oxygen-oxygen radial distribution functions, gOO(r) for ice at different 153
pressures: ice Ih at 1.6 GPa, shared-crystalline ice at 2.0 GPa, and HDA at 2.4 GPa and 3.0 GPa, 154
and ice XV at 0.9 GPa. From Figure 6b, it is clearly visible that the positions of the first peak 155
(first coordination shell) in gOO(r) for all of the ice forms are similar at different pressures. 156
However, profound differences in the profiles and interatomic O-O distances of the second peak 157
are found. In ice-Ih, the first and second peaks are clearly separated with a gap of ~1.0 Å. In 158
comparison, in the intermediate crystalline phase, the width of the second peak (i.e., the oxygen 159
distribution in the second coordination shell) is broader, and its onset moves closer to the first 160
peak, and is only separated from the first peak by ~0.4 Å. In HDA, the second peak is even 161
broader, and moves gradually towards the first peak. The absence of a clear separation between 162
the first and second O-O peaks indicates that the oxygen atoms in the second shell are now 163
compressed closer to the first coordination shell. Incidentally, the mean position of the second 164
peak in the gOO(r) of HDA at 3.0 GPa is similar to that of crystalline ice XV. 165
To better identify the structures of the first and second coordination shells, the oxygen-oxygen 166
radial distributions of the fourth (gOO4(r)) and fifth (gOO5(r)) neighbours (cf. Figure 6a) of the ice 167
Page 8 of 28
https://mc06.manuscriptcentral.com/cjc-pubs
Canadian Journal of Chemistry

Draft
9
systems were computed, and the results are shown in Figure 7. The calculated gOO4(r) of the ices 168
are quite similar, except the width is clearly much broader in the HDA case. In comparison, the 169
peak in the gOO5(r) distribution shifts progressively from 4 Å in lower-density ice Ih to 3.0 Å in 170
HDA and approaches the peak position of gOO4(r), which corresponds well with that of 171
crystalline ice XV. Moreover, the peak width also becomes broader with increasing pressure. 172
The observation leads again to the same conclusion that water molecules in the second 173
coordination shell are compressed into the first coordination shell, a fact known already from a 174
previous study8. It is important to identify the origin of the water molecule forced into the empty 175
space, as it can be either linked to the central water through a hydrogen bond (e.g., 4th water) or 176
not linked directly (non-hydrogen bond, i.e., 5th water). To distinguish the two possibilities, the 177
probabilities of hydrogen-bonded (phb(r)) and non-hydrogen bonded (pnhb(r)) of the fourth and 178
fifth water in ice Ih, the intermediate crystalline phase, and HDA were computed and are 179
compared in Figure 6c. In ice Ih, water molecules situated in the first and second coordination 180
shells are linked to water molecule’s oxygen atom via continuous hydrogen-bond networks, and, 181
therefore, pnhb(r) is zero. Upon compression, in HDA, pnhb(r) increases significantly, and, at 3.0 182
GPa, the mean positions of phb(r) and pnhb(r) of HDA-3.0 GPa almost overlaps with that of ice-183
XV at 3 Å. This indicates that in the second shell, the fourth and fifth water molecules are 184
actually located in the first coordination shell. The comparable pnhb(r) of HDA with ice XV bears 185
the hallmark of incipient formation of an independent and inter-penetrating network, a feature of 186
high-density ice XV and VIII. Therefore, HDA ice may simply be regarded as an intermediate 187
structure between the continuous hydrogen-bonding network of lower-pressure ices (ice Ih, II 188
and IX) and the independent inter-penetrating hydrogen-bonded network structure in high-189
density ices. In fact, when HDA ice is compressed beyond 4.5 GPa, a structure with gOO(r) 190
reminiscent of ice VIII has been predicted and was observed experimentally34. It is expected that 191
Page 9 of 28
https://mc06.manuscriptcentral.com/cjc-pubs
Canadian Journal of Chemistry

Draft
10
substantial energy will be required to surpass the energy barrier for such a large-magnitude 192
displacement required to re-arrange the hydrogen atoms in order to convert a continuous 193
hydrogen-bonded network (e.g., as in ice Ih) into independent and inter-penetrating hydrogen-194
bonded networks (a quintessential signature of ices XV and VIII). The required energy is likely 195
to be inaccessible at low temperatures, and, therefore, compression of ice Ih at below 150 K led 196
to the formation of a frustrated, disordered dense ice (HDA) structure. 197
Structure of liquid water with vdW-corrected functionals 198
Even though the structure and properties of liquid water computed from AIMD has been 199
thoroughly reviewed recently13, we compare for completeness the performance of the 200
empirically-corrected (D2) and optPBE-vdW functionals on the simulation of liquid water. The 201
DFT-D2 calculated oxygen-oxygen (gOO(r)), oxygen-hydrogen (gOH(r)), and hydrogen-hydrogen 202
(gHH(r)) radial distribution functions (g(r)) at 300 K and 330 K are shown in Figure 9. Compared 203
to PBE results, significant improvements are observed - in essential agreement with experiment 204
for the peak positions and heights for (gOO(r)), (gOH(r)), and (gHH(r)). However, the optPBE-vdW 205
calculations provide even better radial distribution functions for liquid water when compared to 206
experiment. Compared to DFT-D2 and PBE, the first peak of (gOO(r)) of 2.78 Å obtained from 207
optPBE-vdW shifted by 0.02 Å to a longer distance (Figure 9a). Moreover, the height of the first 208
peak is reduced significantly. Hence, the optPBE-vdW produced a “softer” structure and is in 209
better agreement with experiment. These results are consistent with previous investigations19,20, 210
where a similar systematic improvement vis-à-vis PBE in gOH(r) and gHH(r) was observed from 211
the inclusion of non-local vdW effects (cf. Figure 9b-c). 212
We further examined the effects of vdW-treatment on hydrogen bonding. A hydrogen bond is 213
defined based on the geometry constraint related to the hydrogen-bond acceptor (A) and donor 214
(D) atoms. Two H2O molecules are considered to be hydrogen bonded when the O-O distance is 215
Page 10 of 28
https://mc06.manuscriptcentral.com/cjc-pubs
Canadian Journal of Chemistry

Draft
11
less than 3.5 Å and the HD-OD-OA angle (β) is less than 30o 11,16 (cf. Figure 10a). We computed 216
the average number of intact hydrogen bonds on one water molecule, and decomposed them into 217
hydrogen-bond-accepting-(A) and donating-(D) types. The results suggest that the DFT-D2, 218
vdW-DF (specifically, optPBE-vdW), and PBE functionals all produce liquid water with most 219
molecules (~80%) adopting the A2D2 type of hydrogen bond – featuring two acceptors and two 220
donors, i.e., the commonly-accepted tetrahedral environment (cf. Figure 10b). This is the 221
traditional condensed-phase picture of a water molecule, which accepts and donates two 222
hydrogen bonds. However, some water molecules have partially broken hydrogen bonds, and 223
therefore adopt A1D1, A1D2, A2D1 and A3D2 motifs, but at much lower probabilities. The 224
main difference in the results obtained from DFT-D2, vdW-DF, and PBE functionals lies in the 225
relative ratios between A1D1:A1D2:A2D1:A3D2. DFT-D2 and PBE produced similar results. 226
For non-local vdW-DF functional calculations, the number of A2D2 hydrogen bonds decreases 227
slightly, whilst there is a concomitant increase in the number of A1D1, A2D1 and A1D2 species. 228
These results indicate once again that the non-local vdW effect is to ‘soften’ the water structure, 229
leading to a greater prevalence of broken hydrogen bonds. This is in agreement with the broader 230
peaks in the RDF of liquid water obtained from the vdW-DF functional. It is significant to point 231
out the A1D1:A1D2:A2D1:A3D2 ratios obtained from the present vdW-DF calculations are 232
almost identical to previous work where a more elaborate functional including exact exchange 233
and non-local vdW correction was used19. The calculated diffusion coefficient 234
(21 d
D r(t) r(t 0)6 dt
= − ) from optPBE-vdW is 1.5 ×10⁻⁹ m2/s at 330 K and 1.4 ×10⁻⁹ m2/s at 300 235
K. In comparison to the experimental values of 2.3 – 2.4 ×10⁻⁹ m2/s35–37 at 300K, the theoretical 236
values are somewhat lower but not unreasonable. In addition, the current results are very similar 237
Page 11 of 28
https://mc06.manuscriptcentral.com/cjc-pubs
Canadian Journal of Chemistry
Draft
12
to a more elaborate DFT study of liquid water 19 which included exact-exchange and dispersion 238
effects. 239
Conclusions 240
Compared to local vdW-corrected DFT-D2/3 and PBE functionals, if is found that the non-local 241
vdw-corrected optPBE-vdW functional gave the best lattice parameters of crystalline ic Ih in 242
comparison with experiment. Significantly, the recently observed crystal→ crystal transition 243
prior to amorphisation at 80 K was also correctly reproduced with AIMD calculations using this 244
functional. The results confirm the transformation from the ice Ih to the intermediate sheared 245
lattice is due to a sheared instability predicted in an earlier study8. The presented results suggest 246
that, at 80 K, pressure-induced amorphisation of ice Ih is not a one-step process, as conjectured 247
previously, but takes place rather via an intermediate crystalline structure. The major structural 248
change accompanying pressurisation lies in the collapse of the second coordination shell into the 249
first, gradually forming an independent inter-penetrating hydrogen-boding network similar to 250
that underlying crystalline ice XV which is the thermodynamically stable polymorph in the same 251
pressure range. It is also shown the optPBE-vdW functional reproduces a softer liquid water 252
structure with the calculated radial distribution functions and hydrogen-bonding network in 253
better agreement with experiment. 254
Acknowledgements 255
XY acknowledges the financial support from the China Scholarship Council. All authors thank 256
the Irish Centre for High-End Computing and Compute Canada for provision of computational 257
facilities. 258
259
Page 12 of 28
https://mc06.manuscriptcentral.com/cjc-pubs
Canadian Journal of Chemistry

Draft
13
References 260
(1) Falenty, A.; Hansen, T. C.; Kuhs, W. F. Nature 2014, 516 (7530), 231. 261
(2) Salzmann, C. G.; Radaelli, P. G.; Hallbrucker, A.; Mayer, E.; Finney, J. L. Science (80-. ). 262
2006, 311 (5768), 1758. 263
(3) Mishima, O.; Calvert, L. D.; Whalley, E. Nature 1984, 310 (5976), 393. 264
(4) Mishima, O.; Calvert, L. D.; Whalley, E. Nature 1985, 314 (6006), 76. 265
(5) Loerting, T.; Salzmann, C.; Kohl, I.; Mayer, E.; Hallbrucker, A. Phys. Chem. Chem. Phys. 266
2001, 3 (24), 5355. 267
(6) Nelmes, R. J.; Loveday, J. S.; Strassle, T.; Bull, C. L.; Guthrie, M.; Hamel, G.; Klotz, S. 268
Nat. Phys. 2006, 2 (6), 414. 269
(7) Nye, J. F. Physical Properties of Crystals; Oxford, 1957. 270
(8) Tse, J. S. J. Chem. Phys. 1992, 96 (7), 5482. 271
(9) Lin, C.; Yong, X.; Tse, J. S.; Smith, J. S.; Kenney-Benson, C.; Shen, G. to be Submitt. 272
2017. 273
(10) Abascal, J. L. F.; Sanz, E.; Fernandez, R. G.; Vega, C. J. Chem. Phys. 2005, 122 (23). 274
(11) Paesani, F.; Iuchi, S.; Voth, G. A. J. Chem. Phys. 2007, 127 (7), 74506. 275
(12) Pi, H. L.; Aragones, J. L.; Vega, C.; Noya, E. G.; Abascal, J. L. F.; Gonzalez, M. A.; 276
McBride, C. Mol. Phys. 2009, 107 (4–6), 365. 277
(13) Gillan, M. J.; Alfè, D.; Michaelides, A. J. Chem. Phys. 2016, 144 (13), 130901. 278
(14) Morawietz, T.; Singraber, A.; Dellago, C.; Behler, J. Proc. Natl. Acad. Sci. U. S. A. 2016, 279
113 (30), 8368. 280
(15) Schmidt, J.; VandeVondele, J.; Kuo, I. F. W.; Sebastiani, D.; Siepmann, J. I.; Hutter, J.; 281
Page 13 of 28
https://mc06.manuscriptcentral.com/cjc-pubs
Canadian Journal of Chemistry
Draft
14
Mundy, C. J. J. Phys. Chem. B 2009, 113 (35), 11959. 282
(16) Lin, I. C.; Seitsonen, A. P.; Coutinho-Neto, M. D.; Tavernelli, I.; Rothlisberger, U. J. Phys. 283
Chem. B 2009, 113 (4), 1127. 284
(17) Wang, J.; Roman-Perez, G.; Soler, J. M.; Artacho, E.; Fernandez-Serra, M. V. J. Chem. 285
Phys. 2011, 134 (2), 24516. 286
(18) Sprik, M.; Hutter, J.; Parrinello, M. J. Chem. Phys. 1996, 105 (3), 1142. 287
(19) DiStasio, R. A.; Santra, B.; Li, Z.; Wu, X.; Car, R. J. Chem. Phys. 2014, 141 (8), 84502. 288
(20) English, N.; J., N. Energies 2015, 8 (9), 9383. 289
(21) Santra, B.; Klimes, J.; Tkatchenko, A.; Alfe, D.; Slater, B.; Michaelides, A.; Car, R.; 290
Scheffler, M. J. Chem. Phys. 2013, 139 (15), 154702. 291
(22) Kresse, G.; Furthmüller, J. Comput. Mater. Sci. 1996, 6 (1), 15. 292
(23) Kresse, G.; Furthmüller, J. Phys. Rev. B 1996, 54 (16), 11169. 293
(24) Kresse, G.; Hafner, J. Phys. Rev. B 1993, 47 (1), 558. 294
(25) Kresse, G.; Hafner, J. Phys. Rev. B 1994, 49 (20), 14251. 295
(26) Grimme, S. J. Comput. Chem. 2006, 27 (15), 1787. 296
(27) Grimme, S.; Antony, J.; Ehrlich, S.; Krieg, H. J. Chem. Phys. 2010, 132 (15), 154104. 297
(28) Grimme, S.; Ehrlich, S.; Goerigk, L. J. Comput. Chem. 2011, 32 (7), 1456. 298
(29) Dion, M.; Rydberg, H.; Schroder, E.; Langreth, D. C.; Lundqvist, B. I. Phys Rev Lett 2004, 299
92 (24), 246401. 300
(30) Klimeš, J.; Bowler, D. R.; Michaelides, A. J. Phys. Condens. Matter 2010, 22 (2), 22201. 301
(31) Klimeš, J.; Bowler, D. R.; Michaelides, A. Phys. Rev. B 2011, 83 (19), 195131. 302
(32) Hayward, J. A.; Reimers, J. R. J. Chem. Phys. 1997, 106 (4), 1518. 303
Page 14 of 28
https://mc06.manuscriptcentral.com/cjc-pubs
Canadian Journal of Chemistry

Draft
15
(33) Rottger, K.; Endriss, A.; Ihringer, J.; Doyle, S.; Kuhs, W. F. Acta Crystallogr. Sect. B 304
1994, 50 (6), 644. 305
(34) Hemley, R. J.; Jephcoat, A. P.; Mao, H. K.; Ming, L. C.; Manghnani, M. H. Nature 1988, 306
334 (6177), 52. 307
(35) Krynicki, K.; Green, C. D.; Sawyer, D. W. Faraday Discuss. Chem. Soc. 1978, 66, 199. 308
(36) Hardy, E. H.; Zygar, A.; Zeidler, M. D.; Holz, M.; Sacher, F. D. J. Chem. Phys. 2001, 114 309
(7), 3174. 310
(37) Mills, R. J. Phys. Chem. 1973, 77 (5), 685. 311
(38) Soper, A. K. ISRN Phys. Chem. 2013, 2013, 67. 312
313
314
Page 15 of 28
https://mc06.manuscriptcentral.com/cjc-pubs
Canadian Journal of Chemistry

Draft
16
Figure 1. Structure of (a) Ice-Ih-12 and (b) Ice-Ih- 96. 315
Figure 2. Density changes (ρ/ρ0) with pressure relative to 0.5 GPa for the Ice-Ih-96 from NPT 316
AIMD calculations at different pressures. 317
Figure 3. Structure of the Ice-Ih-96 at 0 GPa, the intermediate phase at 1.9 GPa, and amorphised 318
ice at 2.2 GPa. 319
Figure 4. X-ray diffraction patterns for the intermediate phase from AIMD calculations (red) at 320
2.0 GPa and experimental X-ray diffraction patterns (black) at 1.13 GPa corresponding to that of 321
the sheared structure9. 322
Figure 5. (a) Schematic representation of the O-O-O angle, (θ), in ice. (b) The θ-angle 323
distribution function, P(θ) in ice Ih, the intermediate crystalline phase, and HDA. 324
Figure 6 (a) Schematic representation of the local environment of a water molecule (labeled as 0) 325
in ice, where the four hydrogen bonded molecules (1–4) to 0 form the 1st nearest neighbour shell 326
of 0. The 2nd nearest neighbour of 0 is shown as molecule 5, which can be both hydrogen-bonded 327
and non-hydrogen bonded to 0. (b) Oxygen-oxygen radial distribution functions, gOO(r) for ice-328
Ih (1.6 GPa), intermediate crystalline phase (2.0 GPa), HDA at 2.4 and 3.0 GPa and ice XV (0.9 329
GPa). (c) The probability of hydrogen bonded (phb(r)) and non-hydrogen bonded (pnhb(r)) 2nd 330
nearest neighbour for ice Ih, sheared phase, and HDA at 2.4 GPa. 331
Figure 7. Comparison of the distribution of the (a) fourth and (b) fifth nearest neighbour water in 332
ice Ih, intermediate crystalline phase, the HDA at 2.4 and 3.0 GPa with ice XV. 333
Figure 8. (a) Calculated oxygen-oxygen radial distribution functions (goo(r)) for ice XV 334
(labelled as ice XV) and HDA at 3.0 GPa (labelled as HDA-3.0GPa). (b) The probability of 335
Page 16 of 28
https://mc06.manuscriptcentral.com/cjc-pubs
Canadian Journal of Chemistry

Draft
17
hydrogen-bonded (phb(r)) and non-hydrogen-bonded (pnhb(r)) 2nd nearest neighbour for ice XV 336
and HDA at 3.0 GPa. 337
Figure 9. The (a) oxygen-oxygen (gOO(r)), (b) oxygen-hydrogen (gOH(r)) and (c) hydrogen - 338
hydrogen (gHH(r)) radial distribution function obtained from NVT-MD simulations at 300 and 339
330 K and 0.0 GPa using different exchange-correlation functionals compared with the 340
experimental data38; the vdW-DF used is optPBE-vdW. 341
Figure 10. (a) Depiction of the geometric position for the definition of a hydrogen bonding in ice, 342
where OD and OA are the hydrogen-bonding donor and acceptor. The HD-OD-OA angle is labelled 343
as β. Two oxygen atoms are considered as hydrogen bonded if their distance is within 3.5 Å and 344
the related angle β is less than 30°. (b) Percentage-wise decomposition into hydrogen-bond-345
accepting-(A), and donating-(D) types of the intact hydrogen bonds per water molecules in liquid 346
water from NPT AIMD simulations at 300 K; the vdW-DF used is optPBE-vdW. 347
348
Page 17 of 28
https://mc06.manuscriptcentral.com/cjc-pubs
Canadian Journal of Chemistry

Draft
Table 1. Comparison of calculated and experimental lattice constants and volume for ice Ih-12
Functional a (Å) b (Å) c(Å) Volume (Å3/H2O)
PBE 7.64 7.64 7.19 30.32
DFT-D2 7.52 7.52 7.08 28.90
DFT-D3 7.55 7.55 7.09 29.18
DFT-BJ 7.55 7.55 7.09 29.15
optPBE-vdW 7.72 7.72 7.26 31.27
rPW86-vdW 7.90 7.90 7.43 33.45
Expa 7.78 7.78 7.73 32.05
a Experimental results taken from ref. 33
Page 18 of 28
https://mc06.manuscriptcentral.com/cjc-pubs
Canadian Journal of Chemistry

Draft
Fig. 1 Structure of (a) Ice-Ih-12 and (b) Ice-Ih- 96.
80x29mm (192 x 192 DPI)
Page 19 of 28
https://mc06.manuscriptcentral.com/cjc-pubs
Canadian Journal of Chemistry
Draft
Density changes (ρ/ρ0) with pressure relative to 0.5 GPa for the Ice-Ih-96 from NPT AIMD calculations at
different pressures.
338x190mm (96 x 96 DPI)
Page 20 of 28
https://mc06.manuscriptcentral.com/cjc-pubs
Canadian Journal of Chemistry

Draft
Structure of the Ice-Ih-96 at 0 GPa, the intermediate phase at 1.9 GPa, and amorphised ice at 2.2 GPa.
338x190mm (96 x 96 DPI)
Page 21 of 28
https://mc06.manuscriptcentral.com/cjc-pubs
Canadian Journal of Chemistry

Draft
X-ray diffraction patterns for the intermediate phase from AIMD calculations (red) at 2.0 GPa and experimental X-ray diffraction patterns (black) at 1.13 GPa corresponding to that of the sheared structure9.
238x165mm (96 x 96 DPI)
Page 22 of 28
https://mc06.manuscriptcentral.com/cjc-pubs
Canadian Journal of Chemistry

Draft
Figure 5. (a) Schematic representation of the O-O-O angle, (θ), in ice. (b) The θ-angle distribution function, P(θ) in ice Ih, the intermediate crystalline phase, and HDA.
207x105mm (96 x 96 DPI)
Page 23 of 28
https://mc06.manuscriptcentral.com/cjc-pubs
Canadian Journal of Chemistry

Draft
(a) Schematic representation of the local environment of a water molecule (labeled as 0) in ice, where the four hydrogen bonded molecules (1–4) to 0 form the 1st nearest neighbour shell of 0. The 2nd nearest
neighbour of 0 is shown as molecule 5, which can be both hydrogen-bonded and non-hydrogen bonded to 0. (b) Oxygen-oxygen radial distribution functions, gOO(r) for ice-Ih (1.6 GPa), intermediate crystalline phase (2.0 GPa), HDA at 2.4 and 3.0 GPa and ice XV (0.9 GPa). (c) The probability of hydrogen bonded (phb(r)) and non-hydrogen bonded (pnhb(r)) 2nd nearest neighbour for ice Ih, sheared phase, and HDA at 2.4 GPa.
217x144mm (192 x 192 DPI)
Page 24 of 28
https://mc06.manuscriptcentral.com/cjc-pubs
Canadian Journal of Chemistry

Draft
Comparison of the distribution of the (a) fourth and (b) fifth nearest neighbour water in ice Ih, intermediate crystalline phase, the HDA at 2.4 and 3.0 GPa with ice XV.
332x122mm (96 x 96 DPI)
Page 25 of 28
https://mc06.manuscriptcentral.com/cjc-pubs
Canadian Journal of Chemistry

Draft
(a) Calculated oxygen-oxygen radial distribution functions (goo(r)) for ice XV (labelled as ice XV) and HDA at 3.0 GPa (labelled as HDA-3.0GPa). (b) The probability of hydrogen-
174x212mm (96 x 96 DPI)
Page 26 of 28
https://mc06.manuscriptcentral.com/cjc-pubs
Canadian Journal of Chemistry

Draft
Page 27 of 28
https://mc06.manuscriptcentral.com/cjc-pubs
Canadian Journal of Chemistry

Draft
229x144mm (192 x 192 DPI)
Page 28 of 28
https://mc06.manuscriptcentral.com/cjc-pubs
Canadian Journal of Chemistry