opvc continuing project report: project year opvc project...
TRANSCRIPT

OPVC CONTINUING PROJECT REPORT: 2014 PROJECT YEAR: 1 OPVC Project Number: Project Title: Enhanced efficiency fertilizer technologies for improved production in sweet corn (2014)
PI: Dan M. Sullivan, Dept. Crop & Soil Science Co-PI: Aaron Heinrich, Dept. of Horticulture Co-PI: Ed Peachey, Dept. of Horticulture Organization: Oregon State University Telephone: 541-737-5715 (Sullivan) Email: [email protected] Address: 3017 Ag & Life Sciences Bldg. City/State/Zip: Corvallis, OR 97331
Cooperators: Joe Fitts (Wigrich Farms) Total Project Request (all years): Year 1: $28,421 Year 2: TBA Other funding sources: Agency Name: KOCH Agronomic Services, LLC Proposal title: Enhanced efficiency fertilizer technologies for improved production in sweet corn (2014) Amt. awarded for 2014: $3000 ($2500 for direct cost; $500 for OSU indirect cost) Notes: Koch is vendor for an EEF product (SuperU)

2. EXECUTIVE SUMMARY
Enhanced efficiency fertilizer (EEF) technologies have the potential to improve the crop N use
efficiency (NUE) as well as minimize negative environmental losses compared to conventional
fertilizers. The EEF fertilizer products consist of urea plus additives (to inhibit N loss). The
major pathways for N loss in our sweet corn cropping systems are 1) N leached below the root
zone as water soluble nitrate-N (NO3-N), and 2) gaseous ammonia loss (NH3-N) to the
atmosphere following a surface urea application.
Field studies and a laboratory incubation study were conducted in 2014 to evaluate the potential
for benefit from EEF products via reduced nitrate-N leaching. Three products were evaluated:
ESN (polymer coated urea), SuperU (prilled urea containing both a urease and nitrification
inhibitor), and Instinct (urea + nitrification inhibitor). Concentrations of soil ammonium-N and
nitrate-N were measured in the lab and in the field to assess product efficacy in controlling
nitrate-N release vs. urea alone. In general, about 20 to 50% of the urea-N applied was protected
from conversion to nitrate-N for the first 3 to 6 weeks after fertilizer application. In a field trial
at the OSU Vegetable Farm, corn ear yields were not different for urea alone vs. the EEF
products applied at the same N rates. This field trial was managed to maximize opportunity for
nitrate leaching (8.6 inches water was supplied via extra irrigations plus rainfall during the first 6
weeks after planting). We conclude that EEF products had measurable efficacy in slowing the
rate of conversion of urea-N to leachable nitrate-N. However, even under a “worst case”
leaching scenario on a medium-textured soil, the use of inhibitors was ineffective in achieving a
corn ear yield response.
A field study was conducted to quantify gaseous ammonia loss from surface-applied urea
(without tillage to incorporate fertilizer), and to evaluate SuperU for efficacy in reducing gaseous
ammonia loss. Passive flux masts were used to capture and quantify ammonia lost during the
first weeks after fertilizer application. Despite favorable soil moisture and temperature
conditions for ammonia loss, the measured ammonia loss for urea alone was very small (< 2% of
urea-N applied), so it was not possible to quantify benefit from SuperU. Additional research is
needed to verify these results (insignificant gaseous ammonia loss) across a wider range of soil,
crop management and weather scenarios.

3. FULL REPORT
3a. Background
Enhanced Efficiency Fertilizers (EEF) have the potential to improve the crop N use efficiency
(NUE) as well as minimize negative environmental losses compared to conventional urea fertilizer
(Guertal, 2009; Shoji et al., 2001). Depending on the product, they have the potential to reduce
ammonia loss and/or nitrate leaching.
Nitrate Leaching
The goal of EEF products that are slow/controlled release or contain a nitrification inhibitor is
to limit the amount of nitrate in the soil early in the season when N uptake is minimal and the
leaching hazard is highest due to spring rains. Once fertilizer N has converted to nitrate, it is
susceptible to leaching with irrigation or rainfall. By protecting the fertilizer N from leaching and
keeping it in the root zone, there is the potential to reduce N applications thereby increasing the
crop N use efficiency.
Many growers prefer to apply all N fertilizer at planting instead of splitting N into pre-plant
and mid-season application. Although EEFs are more expensive than conventional fertilizers,
farmers like this strategy because it eliminates a pass through their fields in the middle of summer
when they are busiest. Also, EEF fertilizers may directly benefit crop growth by maintaining a
more uniform soil moisture. With EEF fertilizers, growers do not have to suspend irrigation in
order to apply a sidedress N fertilizer application with a tractor-mounted spreader.
Despite the benefits of applying all N fertilizer at planting there is a potential risk of doing so.
Early in the growing season, crop N uptake is minimal and rainfall is likely, resulting in a high
leaching hazard. Not only does this nitrate leached from the crop root zone potentially increase
groundwater nitrate concentrations, but less N is available for crop growth, which could result in a
deficiency and lower ear yields. The timing of N release from controlled release fertilizers vs. crop
needs is the major issue. Ideally, the EEF delays N release until just prior to rapid growth of corn.
The period between seeding and the beginning of stem elongation (jointing) is when potential for
N loss is greatest. But, if N release from EEF is too slow, the crop will not have sufficient N for
peak growth rate during stem elongation growth phase. Conversely, if EEFs do nothing to alter the
timing of N fertilizer conversion to nitrate-N, then it provides no benefit over untreated urea
fertilizer, and it is a wasted expense.
Although some EEF products have been marketed for many years, their effectiveness at
increasing the NUE of corn in Western Oregon has been variable (Hart et al., 2010). In a few years
with wet springs, yields were increased by the application of a nitrification inhibitor to the preplant
fertilizer. But, in other experiments, EEF products have been found to have no benefit regardless
of weather conditions (Hart et al., 2010).
Ammonia Loss
When urea is broadcast, some of the applied fertilizer N may be lost as ammonia. Although
this loss can be minimized by applying irrigation water as close to the application as possible
(within 24 hrs), in many cases several days up to a week may elapse before irrigation is applied.
When applied to soil, water and the urease enzyme hydrolyze the urea, resulting in a zone of high
pH around the fertilizer granule. As a result, the balance between ammonium and ammonia is
temporarily shifted towards ammonia, which is volatile. Given the right environmental conditions
(soil moisture, pH, texture, temperature, wind speed, humidity, etc), surface applied urea can result

in significant N loss. In eastern Oregon, N loss has been measured to be as high as 50% of applied
urea-N when the urea was left on the soil surface for 1 week (Holcomb et al., 2011). But, soil and
climate are different east of the Cascades and N loss rates need to be validated for western
Oregon. For example, soils in western Oregon tend to have a lower pH and a higher OM and clay
content, which can buffer the soil against an increase in pH due to urea hydrolysis and thus
reduce ammonia loss.
Studies have shown that by using a product with a urease inhibitor such as NBPT (the active
ingredient in Agrotain and SuperU), ammonia loss from broadcast urea can be significantly
reduced (Rawluk, 2000). It works by keeping the urea from converting to ammonia/ammonium.
Because NAPT degrades in 10-14 days, the soil should be irrigated as soon as possible after
application to minimize ammonia loss even when this product is used. The goal of this part of the
project is to determine how much urea-N can be lost when broadcast in the summer, and how
much a product containing a urease inhibitor can reduce this loss. If the savings are significant
there may be an opportunity for growers to reduce their N fertilizer applications and increase the
nitrogen use efficiency of their crop.
3b. Objectives
Nitrate leaching:
1. Quantify the amount of applied fertilizer N that can be protected from leaching by the
EEF products ESN, SuperU, and Instinct.
2. Determine if and by how much the EEF products tested can increase yield/product
quality under high leaching conditions (sandy soil with frequent, high intensity
irrigations) early in the growth cycle (2-5 weeks).
Ammonia volatilization:
1. Quantify ammonia volatilization losses under a worst-case scenario (urea broadcast onto
moist soil and 7+ days without irrigation).
2. Determine if and how much a product containing a urease inhibitor (SuperU) can reduce
ammonia volatilization, and if the savings are enough to justify the higher cost of the EEF
product tested.
3c. Significant findings
Nitrate leaching:
All products tested have the ability to prevent nitrate leaching under the right conditions (i.e.,
very sandy soils with high spring rainfall occurring within ~4 weeks after fertilizer application).
In a laboratory soil incubation, these products were effective for 6+ weeks, but under field
conditions they appear to be most effective for ~4 weeks. Despite a high leaching potential in
this study, we measured no yield benefit to any of these fertilizers. Overall the products tested
are most effective within 4 weeks after application, though Instinct appeared to be effective for at
least 6 weeks. Performance of individual products is given below.
ESN:
In a laboratory soil incubation, recovery of N from the polymer coated urea was
significantly less than conventional urea over the entire study period (6 weeks),

demonstrating that the product was effective at slowly releasing urea. From Week 2 to 6,
ESN was protecting 25-35% of added N from leaching.
By Week 6 in the lab incubation, ESN prills had released 83% of added urea-N. Although
60% of the prills were fully “intact” at Week 6 (plump with no dimpling), they were full
of liquid and much of the urea-N had diffused out of the prill.
Under field conditions ESN was measured to be effective up to the Week 4 sampling
period, protecting between 43 and 37% of applied N from leaching at Week 2 and 4,
respectively.
Some agronomic service companies recommend applying conventional urea with ESN to
prevent an early season crop N deficiency, based on the idea that ESN might reduce
nitrate-N too slowly to meet crop needs.. Based on the 2014 data, this practice is not
warranted. Nitrogen uptake by sweet corn is minimal in the first month after planting.
ESN released enough N to meet early season crop N needs.
SuperU:
In the lab incubation, the nitrification inhibitor in SuperU was effective for 6 weeks at
preventing the conversion of ammonium to nitrate. At Week 6, 51% of added SuperU-N
was in the form of ammonium compared to 13% for Urea-N. From Week 3 to 6, SuperU
was protecting between 47-53% of added SuperU-N from leaching compared to urea-N.
Under field conditions SuperU was measured to be effective up to the Week 4 sampling
period, protecting between 53 and 51% of applied N from leaching at Week 2 and 4,
respectively. By Week 6 there were no differences between urea alone vs urea + SuperU.
Instinct:
In 2014, the urea was broadcast and Instinct sprayed over the soil surface followed by
immediate incorporation. Unlike the other products tested, Instinct performed better in the
field than in the lab incubation. Possibly we were unable to sufficiently replicate the field
spray conditions for the lab incubation.
In the lab Instinct was most effective around Week 2 to 3. At Week 2 and 3, Instinct was
protecting 12 and 27%, respectively, of added N from leaching compared to urea. After
Week 3 it did not perform much better than urea.
Under field conditions Instinct was measured to be effective up to 6 weeks and possibly
beyond. At Week 2, 4, and 6 an average of 53, 51, 50%, respectively of total N applied
was potentially protected against leaching compared to urea.
Ammonia loss
Despite favorable soil moisture and temperature conditions for ammonia loss, the
measured ammonia loss from conventional urea was small (< 2% of urea-N applied), so it
was not possible to quantify the benefit from SuperU.
Likely the high pH buffering potential of our soil reduced the opportunity for ammonia
loss. Our data are in stark contrast to research done in Hermiston, OR where researchers
measured loss of up to 60% of urea-N from surface applied urea. But, the loamy sand soil

used in the Hermiston study had higher initial pH and had less ability to maintain pH
below the threshold pH for ammonia loss (approximately pH 7.5). Our soil had greater
clay, organic matter, and CEC than the Hermiston soil, making it less susceptible to
ammonia loss.
An additional trial conducted at the OSU Vegetable Research Farm to double check the
ammonia trapping methodology also demonstrated very low ammonia loss from a loamy,
acidic, Willamette Valley soil over a 15-d period.
We propose to repeat this study next year on a wider variety of soil types including
sandier, less well buffered soils.
3d. Methods
Description of EEF fertilizers
ESN® (Environmentally Smart Nitrogen) manufactured by Agrium Advanced Technologies,
Inc. This product is a polymer coated urea and contains 44%N. The coating allows water to move
into the granule and dissolve the urea, which then diffuses into the soil. The rate at which the urea
solution moves out through the coating is determined by soil, temperature, and moisture. In cool
soils when the crop is growing slowly and N demand is minimal, N release is slow, but as the soil
warms and crop growth increases, the granules release N more rapidly. At current urea market
prices, using ESN costs an additional ~$0.15/lb N.
SuperU® manufactured by Agrotain International (a subsidiary of Koch Agronomic Services).
This product is a granular urea product containing both a urease inhibitor (NBPT) and
nitrification inhibitor (DCD), and contains 46%N. The combined action of the inhibitors can
reduce ammonia volatilization losses and slow the conversion of ammonium into nitrate. As a
result, the fertilizer-N should be less susceptible to leaching in the early part of the season when
crop N uptake is minimal.
Instinct™ (formulation used very similar to Instinct™ II) is manufactured by Dow
Agrosciences. It contains the nitrification inhibitor nitrapyrin in an encapsulated form. This
encapsulation is designed to prevent loss from volatilization and fixation on clay particles and
organic matter. This allows it to remain on the soil surface longer before incorporation. This
product is registered for use in sweet corn in Oregon and has the following replant restrictions:
“Corn (field, sweet, pop), sorghum, wheat, other cereals, oilseed crops (including soybeans), and
leafy vegetables, may be rotated 120 days from the last application of N-Serve 24 [a formulation
of nitrapyrin]. All other crops are not to be rotated in less than one year after the last application.”
The nitrapyrin (0.5 lb A.I. per acre) was sprayed on urea that had been broadcast, which was then
immediately incorporation.
Field trial: Ear yield response and product efficacy in protecting N from leaching. This trial was
located at OSU’s Vegetable Research Farm in Corvallis. The soil (0-12 inches) had the following
properties: pH 6.3, 1.8% OM (LOI), estimated CEC of 16 meq/100g, Bray 1P 51 ppm, and 220
ppm K. Using the hydrometer method for measuring soil particle size distribution, the soil
texture from 0-12 inches was a sandy loam (15% clay and 59% sand) and from 12-24 inches was
also a sandy loam (17% clay and 57% sand). On May 7, fertilizer was broadcast by hand in plots
10 x 40 ft. See Table 1 for treatments and rates. Following application, the fertilizer was
incorporated with a power harrow to a depth of ~3-4 inches. Walking in front of the tractor that
was incorporating the fertilizer, Instinct was applied at a rate of 0.5 lb A.I. per acre @ 35 gal per
acre using a boom with 5 nozzles (80-03VS XR TeeJet @ 20 psi) on 20 inch spacing. Time

between Instinct application and incorporation was less than 3 minutes. A soil temperature probe
(Hobo pendant) was installed at a depth of 3 inches. The treatments were arranged in a
randomized complete block design with 5 replications.
Seven days after application, sweet corn var. ‘Captain’ was seeded and ~4 weeks after
application doubles and plants spaced closer than 4-6 inches were removed. The final stand was
~21,000 plants/acre. At planting 34 lb P2O5 (from TSP) and 26 lb K2O (from KCl and K-Mag)
was banded. Soil was sampled every 2 weeks after the fertilizer application for 6 weeks from 0-
10 and 10-20 inches just in the treatments receiving 50 or 75 lb N/acre in 4 replications.
Samples were extracted with 2M KCl and analyzed for ammonium and nitrate by OSU Central
Analytical Laboratory. To increase nitrate leaching, we applied ~5.0 inches of irrigation water
(as measured by placing 6 buckets randomly in the field) over 6 weeks. The total amount of
water on the field from rain and irrigation was 8.6 inches.
At harvest on August 25 (103 days after planting), ears from forty feet of row (20 ft. from the
middle two rows in each plot) were hand harvested. Gross ear weight, dry matter, and other
parameters (tip fill, length, width, unhusked wt) were measured.
Table 1. Fertilizers and N rates used in EEF field trial.
Treatment Fertilizer N rate
lb/acre
1 None 0
2 Urea 25
3 Urea 50
4 Urea 75
5 Urea 100
6 Urea 125
7 ESN 50
8 ESN 75
9 SuperU 50
10 SuperU 75
11 Instinct 50
12 Instinct 75
Aerobic soil EEF fertilizer incubation:
The top 6 inches of soil was collected from the field where the EEF field trial was located and
sieved through a 2 mm mesh screen. Fertilizer (urea, ESN, and SuperU) was added to 450 g of
oven dry soil at a rate of 400 lb N/acre (assumptions: 5-inch incorporation depth with a bulk
density of 1.33 g/cm3). After incorporating into the soil, deionized water was added with a spray
bottle while mixing the soil until a gravimetric moisture content of ~17% was reached (near field
capacity for this soil). For the product Instinct, field moist soil was placed in pots and urea was
distributed over the soil surface. The pots were placed randomly in a 5 by 20 ft. area and Instinct
was sprayed over top (0.5 lb A.I. per acre @ a rate of 35 gal per acre) using a wand with the
same nozzles and spacing described in the field trial below.
After fertilizer application, soil was placed in zippered plastic bags with a straw inserted into the
top corner of each bag to facilitate air exchange. Soil was incubated in the dark at 71.0±0.4
degrees F. Additional DI water was added to the bags weekly to make up for moisture loss.
Three replicates of each bag per treatment were destructively sampled at Week 1, 2, 3, 4, 5, and
6 after application. On each sampling date, the bags were thoroughly mixed and a 10-15 g soil
subsample was extracted with 2M KCl for ammonium-N and nitrate-N determination at the OSU
Central Analytical Laboratory.
Ammonia volatilization trial (on-farm):
The ammonia volatilization trial was conducted on a commercial farm located near
Independence. The experiment was done in an 80 acre field adjacent to the Willamette River and
is in the seasonal floodplain. The soil mapping units in the field were Newberg loam and fine
sandy loam, Cloquato silt loam, and Chehalis silty clay loam. Due to the large field size and soil
changes across the field, soil samples (0-1 inches) were taken at each ammonia collection tower
receiving fertilizer. See Table 2 for soil properties. Soil particle size analysis was measured using
the hydrometer method.
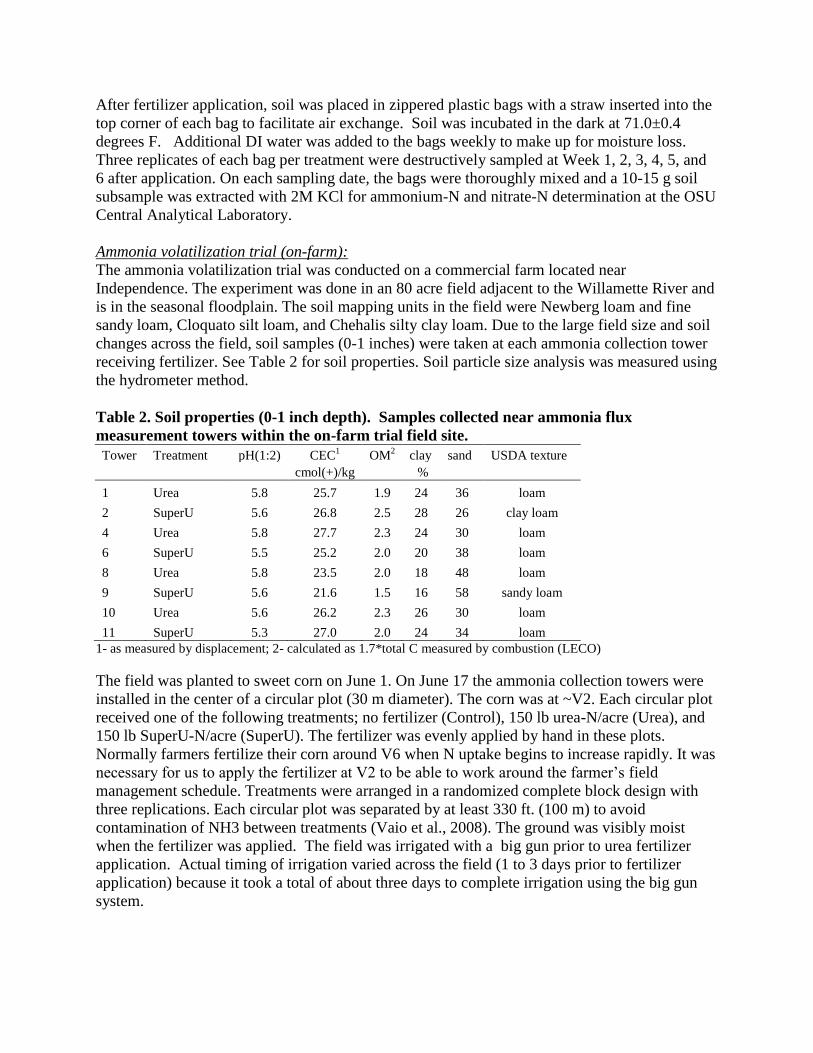
Table 2. Soil properties (0-1 inch depth). Samples collected near ammonia flux
measurement towers within the on-farm trial field site.
Tower Treatment pH(1:2) CEC1
OM2
clay sand USDA texture
cmol(+)/kg %
1 Urea 5.8 25.7 1.9 24 36 loam
2 SuperU 5.6 26.8 2.5 28 26 clay loam
4 Urea 5.8 27.7 2.3 24 30 loam
6 SuperU 5.5 25.2 2.0 20 38 loam
8 Urea 5.8 23.5 2.0 18 48 loam
9 SuperU 5.6 21.6 1.5 16 58 sandy loam
10 Urea 5.6 26.2 2.3 26 30 loam
11 SuperU 5.3 27.0 2.0 24 34 loam
1- as measured by displacement; 2- calculated as 1.7*total C measured by combustion (LECO)
The field was planted to sweet corn on June 1. On June 17 the ammonia collection towers were
installed in the center of a circular plot (30 m diameter). The corn was at ~V2. Each circular plot
received one of the following treatments; no fertilizer (Control), 150 lb urea-N/acre (Urea), and
150 lb SuperU-N/acre (SuperU). The fertilizer was evenly applied by hand in these plots.
Normally farmers fertilize their corn around V6 when N uptake begins to increase rapidly. It was
necessary for us to apply the fertilizer at V2 to be able to work around the farmer’s field
management schedule. Treatments were arranged in a randomized complete block design with
three replications. Each circular plot was separated by at least 330 ft. (100 m) to avoid
contamination of NH3 between treatments (Vaio et al., 2008). The ground was visibly moist
when the fertilizer was applied. The field was irrigated with a big gun prior to urea fertilizer
application. Actual timing of irrigation varied across the field (1 to 3 days prior to fertilizer
application) because it took a total of about three days to complete irrigation using the big gun
system.

Volatilized NH3 measurements were initiated immediately after fertilizer application using the
modified passive flux method (Wood et al., 2000; Vaio et al., 2008). This consisted of a rotating
mast placed at the center of each circular plot that was modified with a tripod to stabilize the
mast during high wind events. Each mast was equipped with passive flux samplers at five heights
(0.45, 0.75, 1.50, 2.25, and 3.00 m; Leuning et al., 1985). Each passive flux sampler consisted of
a glass tube (0.7-cm i.d. by 20 cm long) with the inside surface coated with 3% (w/v) oxalic acid
in acetone to scrub the NH3 in the air flowing through the tube. Each tube had an attached nozzle
with a 1-mm hole to restrict incoming air flow to prevent NH3 saturation of the oxalic acid. Flux
samplers were sealed in a Ziploc bag after being coated to ensure an NH3–free environment and
were only removed when being placed on the masts.
Ammonia flux samplers were replaced every day for 8 days following fertilizer application.
Immediately after collection of the flux samplers from the masts, they were capped at both ends,
placed in a sealed Ziploc bag, and stored in a refrigerator. The samples were extracted within 3
weeks of being collected. Flux samplers were extracted by adding 2 mL of deionized water and
shaking for 10 min. The extracts were analyzed colorimetrically for ammonium-N.
The horizontal and vertical NH3 flux (Fx, μg N m−2
s−1
) for each flux sampler was calculated
using the equations given by Schjoerring et al. (1992), Wood et al. (2000), and Vaio et al.
(2008). A weather station (Onset Computer Corp model Hobo U30-NRC) was installed to
measure wind speed, air and soil temperature (at 1-inch depth), and relative humidity every 15
minutes. Although wind speed was measured every minute, the data logger provided a 15 minute
average.
Ammonia volatilization trial (OSU Research Farm):
An additional trial was conducted at OSU’s Vegetable Research Farm (Corvallis) to check our
methods and the sensitivity of the measurements. This soil had the following characteristics:
CEC= 16 meq/100g (by sum of cations method), pH 5.9, OM= 1.8%, and loam texture (18%
clay and 46% sand). This was an unreplicated study that only had three treatments; 1-control (no
aiflow control disc), 2- Urea at 150 lb N/acre (airflow control disc inserted into NH3
measurement tubes), and 3- Urea at 150 lb N/acre (no airflow control disc). Normally the
ammonia collection tubes have a disc with a very small hole (0.5 mm). By removing the disc, we
wanted to see if we could increase the sensitivity of the measurements. Treatments 2&3 were
placed side-by-side in the same circular measurement area. All other methods were the same as
described above. When calculating the flux for the tubes with no disc, a correction factor of
9.09*Fx was applied.
3e. Results & Discussion
Enhanced efficiency fertilizers (EEF). Effect on nitrate leaching potential and ear yield):
Lab incubations:
Fertilizer N was applied at a high rate (~0.26 g fertilizer per 450 g OD soil; equivalent to
approximately 400 lb N/acre). This N rate was chosen to achieve reproducible mixing of
fertilizer prills with soil. The N incorporation rate was 2 to 4x more than a farmer would apply.
The higher urea application rate used in the incubation could have influenced the rate of

nitrification (conversion of ammonium-N to nitrate-N). Therefore, extrapolating the incubation
results to performance under field conditions should be made with caution. Additionally, in the
field, soil wets and dries (moisture is not constant). Wetting and drying cycles could also affect
the performance of EEF products. Diffusion is required for N release from ESN (polymer-
coated prills). Diffusion rate is increased by greater soil moisture (present immediately after rain
or irrigation in the field). Rain and irrigation may also dilute nitrification inhibitors, reducing
their effectiveness.
The average incubation temperature was 71.0±0.4 degrees F, while the average temperature at 3
inches in the field trial over 6 weeks was 67±8.4 degrees F. Although the average temperatures
were similar, there was significant variability in the field (range 51-90 degrees F). Again, due to
the differences in lab and field conditions, extrapolation of data should be done with care.
At Week 1 very little nitrate was present to leach and the amount that these products protected
was negligible (Table 3). By Week 2 all fertilizer products protected 12-25% of added fertilizer
N from leaching. By Week 3, all fertilizer N from urea, SuperU, and Instinct could be accounted
for in the soil as either nitrate or ammonium (Figure 1). However, the application of either
SuperU or Instinct maintained more of the N in the ammonium form, indicating that the
inhibitors were effective. ESN and SuperU remained effective in maintaining some of the N in
ammonium form through Week 6, while Instinct was mostly ineffective after Week 3.
Table 3. Potential reduction in nitrate leaching from EEF products compared to urea1.
Laboratory incubation study.
Trt Week 1 Week 2 Week 3 Week 4 Week 5 Week 6
% of added fertilizer N protected from leaching compared to urea
ESN 5 25 38 32 35 32
SuperU 3 23 47 53 47 45
Instinct 0 12 27 0* 0* 12 1Calculated as the difference between NO3-N accumulation between urea and EEF products in soil at each sampling
date.
*Because these NO3-N values were not statistically different vs. the conventional urea treatment, they are shown as
“0”.

Figure 1. Nitrate and ammonium as a percentage recovered of total fertilizer N added to soil during a 6 week
aerobic incubation. Error bars represent the SE (n=3). For each date, different letters represent a statistical
difference (Fisher LSD P<0.05) among treatments.
a b
b
a
a
a a
a a
a
a
b
b
b bcc
b b
b
c
c
c c c
a a
a
a
a
a a a
a
b
b
b
b b b
b b
b
b
c c
c
bc d
a
b
c
d
a a a
b
a a a
b
a a a
b
a a a
b
a a a
b

Measurements of soil N in the EEF field trial:
Soil mineral N
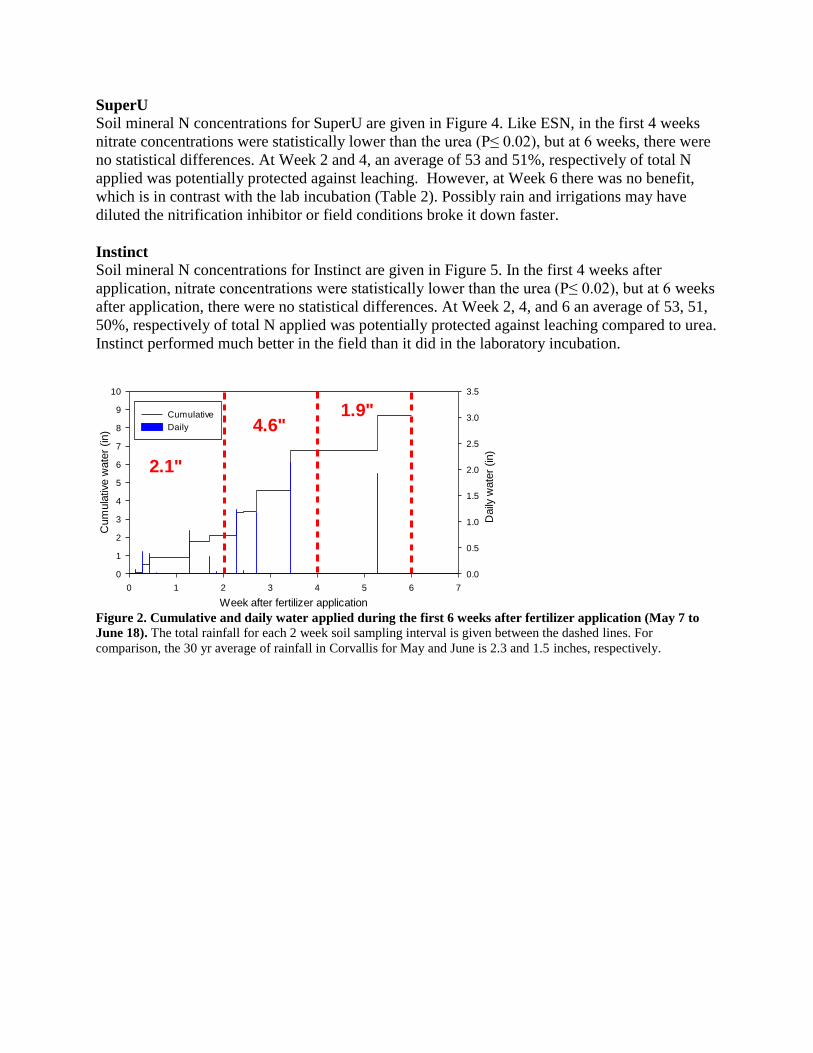
Soil was sampled for 6 weeks after fertilizer application). During this period, the field received a
total of 8.6 inches of water from irrigation (7.3 inches) and rainfall (1.3 inches; Figure 2). These
irrigations were used to simulate a “worst case” nitrate leaching scenario; a wet spring with
heavy rainfall. Based on reference evapotranspiration (ET) from the Hyslop Agronomy Farm
weather station and estimated crop ET coefficients for corn, we estimate that the
evapotranspiration over 6 weeks was approximately 2 inches. Cumulative water applied was 2.1
inches for Weeks 0-2, 4.6 inches for Weeks 2-4, and 1.9 inches for Weeks 4-6. Water applied
was greater than the 30 year historical average for Corvallis (average = 2.3 inches in May, 1.5
inches in June). Irrigation intensity (~0.75 inches per hour) was likely greater than precipitation.
However, even though the field received excessive irrigation, nitrate leaching appears to have
been minimal. Soil nitrate + ammonium-N were higher in the 0-10 inch depth than in the 10-20
inch depth for all treatments at all sampling dates.
Soil mineral N concentrations for ESN, SuperU, and Instinct are given in Figures 3, 4 and 5,
respectively. This study was not designed to quantify nitrate-N leached. Percent recovery of
applied N (0-20 inch depth) was variable and sometimes exceeded 100% due to variability
inherent in soil sampling. Percent of fertilizer N that was protected from leaching was calculated
as:
(Urea NO3-N - EEF fertilizer NO3-N)/(total fertilizer N applied) x 100
Where:
Urea NO3-N = nitrate-N measured for conventional urea fertilizer treatment (control),
ppm
ESN NO3-N = nitrate-N measured for EEF fertilizer treatment, ppm
Total N fertilizer applied, ppm
Nitrate-N that leached below sampling depth (0-20 inches) was not accounted for by this
calculation method.
At 6 weeks after fertilizer application, ammonium + nitrate-N (0-20 inch depth) was the same for
conventional urea and all of the EEF fertilizer treatments.
ESN
Soil mineral N concentrations for ESN are given in Figure 3. In the first 4 weeks after
application, nitrate concentrations were statistically lower than the urea (P≤ 0.02), but at Week 6,
there were no statistical differences. At Week 2 and 4, an average of 43 and 37%, respectively of
total N applied was potentially protected against leaching. This is equivalent to protecting 18
lb/acre when 50 lb N /acre of N fertilizer was applied, or 30 lb N/acre when 75 lb N/acre was
applied. After Week 4, there was little or no benefit. Soil nitrate concentrations at 10-20 inch
depth had lower nitrate-N for ESN than for urea, another qualitative indicator of ESN efficacy.
However, some or all of the nitrate-N leached below the 20-inch depth was likely available for
uptake by corn during the growing season.
SuperU
Soil mineral N concentrations for SuperU are given in Figure 4. Like ESN, in the first 4 weeks
nitrate concentrations were statistically lower than the urea (P≤ 0.02), but at 6 weeks, there were
no statistical differences. At Week 2 and 4, an average of 53 and 51%, respectively of total N
applied was potentially protected against leaching. However, at Week 6 there was no benefit,
which is in contrast with the lab incubation (Table 2). Possibly rain and irrigations may have
diluted the nitrification inhibitor or field conditions broke it down faster.
Instinct
Soil mineral N concentrations for Instinct are given in Figure 5. In the first 4 weeks after
application, nitrate concentrations were statistically lower than the urea (P≤ 0.02), but at 6 weeks
after application, there were no statistical differences. At Week 2, 4, and 6 an average of 53, 51,
50%, respectively of total N applied was potentially protected against leaching compared to urea.
Instinct performed much better in the field than it did in the laboratory incubation.
Figure 2. Cumulative and daily water applied during the first 6 weeks after fertilizer application (May 7 to
June 18). The total rainfall for each 2 week soil sampling interval is given between the dashed lines. For
comparison, the 30 yr average of rainfall in Corvallis for May and June is 2.3 and 1.5 inches, respectively.
Week after fertilizer application
0 1 2 3 4 5 6 7
Cum
ula
tive w
ate
r (in)
0
1
2
3
4
5
6
7
8
9
10
Daily
wate
r (in)
0.0
0.5
1.0
1.5
2.0
2.5
3.0
3.5
Cumulative
Daily
2.1"
4.6"1.9"

Nitrate 10-20"
Nit
rate
N (
pp
m)
0
5
10
15
20
25
30
Ammonium 0-10"
Am
mo
niu
m N
(p
pm
)
0
5
10
15
20
25
30
Nitrate 0-10"
Nit
rate
N (
pp
m)
0
5
10
15
20
25
30
Zero N
Urea 50N
Urea 75N
ESN 50N
ESN 75N
Total 0-10"
Week
1 2 3 4 5 6 7
Nit
rate
+a
mm
on
ium
N (
pp
m)
0
10
20
30
40
50
Ammonium 10-20"
Am
mo
niu
m N
(p
pm
)
0
5
10
15
20
25
30
Total 10-20"
Week
1 2 3 4 5 6 7
Nit
rate
+a
mm
on
ium
N (
pp
m)
0
10
20
30
40
50
60
Figure 3. ESN- Soil mineral N from 0-10 and 10-20 inches. Each point is an average of 4 values. Error bars were
excluded for ease of viewing.

Ammonium 0-10"
Am
mo
niu
m N
(p
pm
)
0
5
10
15
20
25
30
Nitrate 0-10"
Nit
rate
N (
pp
m)
0
5
10
15
20
25
30
Zero N
Urea 50N
Urea 75N
SuperU 50N
SuperU 75N
Total 0-10"
Week
1 2 3 4 5 6 7
Nit
rate
+a
mm
on
ium
N (
pp
m)
0
10
20
30
40
50
Ammonium 10-20"
Am
mo
niu
m N
(p
pm
)
0
5
10
15
20
25
30
Nitrate 10-20"
Nit
rate
N (
pp
m)
0
5
10
15
20
25
30
Total 10-20"
Week
1 2 3 4 5 6 7
Nit
rate
+a
mm
on
ium
N (
pp
m)
0
10
20
30
40
50
Figure 4. SuperU- Soil mineral N from 0-10 and 10-20 inches. Each point is an average of 4 values. Error bars
were excluded for ease of viewing.

Nitrate 10-20"
Nitra
te N
(ppm
)
0
5
10
15
20
25
30
Ammonium 0-10"
Am
moniu
m N
(ppm
)
0
5
10
15
20
25
30
Nitrate 0-10"
Nitra
te N
(ppm
)
0
5
10
15
20
25
30
Zero N
Urea 50N
Urea 75N
Instinct 50N
Instinct 75N
Total 0-10"
Week
1 2 3 4 5 6 7
Nitra
te+
am
moniu
m N
(ppm
)
0
10
20
30
40
50
Ammonium 10-20"
Am
moniu
m N
(ppm
)
0
5
10
15
20
25
30
Total 10-20"
Week
1 2 3 4 5 6 7
Nitra
te+
am
moniu
m N
(ppm
)
0
10
20
30
40
50
Figure 5. Instinct- Soil mineral N from 0-10 and 10-20 inches. Each point is an average of 4 values. Error bars
were excluded for ease of viewing.
Ear Yield
No differences were measured in gross ear yield (Figure 6) or ear characteristics (data not
shown) between urea and EEF products for a given N rate. At the 50 and 75 lb N/acre fertilizer
rate the plants were N deficient, which is what we wanted. Because corn plants were growing
within the N deficiency range, the potential of measuring a yield response increased. For
example, if the EEF fertilizers reduced nitrate leaching (i.e., kept N in the root zone), then we
would likely see a yield increase for those products. However, we saw no differences for a given
fertilizer rate, which is what we would expect based on soil N concentrations at Week 6 in which
there were small or no difference between Urea and the EEF products. Although the soil
sampling suggested that there was more leaching below 20”, possibly the corn plants were able
to access nitrate below this level.

Figure 6. Gross ear yield from urea vs. EEF products for different N rates.
Error bars represent SE of the mean (n=5) .
Ammonia volatilization on-farm field trial:
Environmental conditions
Environmental conditions were favorable for ammonia loss (Figure 7). Total precipitation at the
study site was 0.25 inch which occurred between 6/25 and 6/28 (8 to 11 days after application).
Relative humidity fluctuated from 26 to 98%, with an average of 71%. The air temperature
varied between 44 to 84°F, with an average of 64°F. The soil temperature at 1 inch varied from
50 to 101°F, with an average of 74°F. Wind speeds varied from 0 to 13.5 mph, with an average
of 4 mph. Averages were derived from measurements taken every 15 min.
The 80-acre field site was surrounded by other crops (hazelnuts, grass seed, and snap beans) as
well as bordered by a riparian buffer adjacent to the Willamette River. No fertilizers applied to
any of these adjacent areas during the trial. Background ammonia loss (NH3-N captured from
the atmosphere in the absence of N fertilizer application) was approximately 25 lb N/acre.
The field had been irrigated over the 3 days prior to urea application (it took them 3 days to
move across the field using big guns). As a result, there was visible moisture on the soil surface.
Within the first day ~50% of the fertilizer had dissolved and by 3 days after application, all prills
had disappeared. Once the prills have dissolved, there usually is a 2-3 day lag period before
ammonia loss increases dramatically. Holcomb et al. (2011) observed that 70% of total ammonia
loss occurred between day 2 and 8 days after irrigation. Because there was sufficient moisture
(from soil and air) to dissolve the prills in our experiment, but no rain to wash it into the soil or
dilute it, conditions should have been ideal to measure gaseous ammonia loss. However, we
measured no differences between control and fertilizer treatments (Figure 8). We measured a
cumulative ammonia-N loss of 23 lb/acre for all treatments over the entire 7-day period.
Soil characteristics may explain some of the differences between our data and that of Holcomb et
al. (2011). Table 3 shows the relevant soil characteristics for our field site and the field site used
by Holcomb et al. (2011). As the urea hydrolyzes, it raises the pH around the prill. The pH
7
8
9
10
11
12
13
14
Urea ESN SuperU Instinct
Gro
ss e
ar y
ield
(to
n/a
cre
) 0 lb N/A50 lb N/A75 lb N/A100 lb N/A125 lb N/A

present around the prill is depends on the capacity of the soil to “dampen” or buffer a rise in pH.
In a poorly buffered soil, the pH around prills will be higher, and more ammonia will be lost.
Apparently, our soil had sufficient buffering capacity to prevent pH rise above the threshold for
ammonia loss (pH 7.5). Our soil was well buffered compared to the soil from Holcomb’s field
site. Our soil had CEC that was three times greater, OM that was 2X greater, and clay content
that was 4X greater than the soil from Holcomb’s field site.
The urease inhibitor NBPT (active ingredient in SuperU) has been shown to be effective in
reducing ammonia loss (Engel and Wallander, 2012). Our results suggest that ammonia loss
may be minimal when urea is applied to a well buffered, acidic Willamette Valley loamy soil.
Table 3. Soil characteristics from the Holcomb et al. study vs. those from our field sites.
Property Holcomb
field
On farm field OSU Research
Farm field
pH 6.5 5.6 5.9
CEC (meq/100g) 8.0 25 17
OM (%) <1 2.1 1.8
clay (%) 6 23 18
sand (%) 60 38 46
USDA texture sandy loam loam loam
For the Holcomb et al. (2011) field site, only soil pH was reported.
Other soil characteristics listed here are based on NRCS soil map data.
Soil test values for mast locations within the on-farm field site are given
in Table 2.
Ammonia volatilization OSU Research farm field trial:
The soil at the research farm was less buffered than the soil present at the on-farm trial, but it had
a much greater pH buffering capacity than the soil used by Holcomb et al. (2011). At one day
after application, about 80% of the prills dissolved due to heavy morning dew. At 4 days after
application, about 20% of prills remained, decreasing to 10% remaining at 5 days after
application (following a light rain of 0.02 inches). At 12 days after application, prills were not
visible on the soil surface.
Ammonia loss is shown in Figure 9. Despite removing the disc from the ammonia collection
tubes, there was little difference in measured ammonia flux compared to the tubes with the disc.
This suggests that the method we used in the on-farm trial should have been sensitive enough to
measure treatment differences (i.e., removing the disc in the on farm trial would likely not have
improved the results). Compared to the control, the urea treatments only lost about 2 lb N/acre
over 15 days, which is only about 1.3% of total N applied. Although 80% of the prills rapidly
dissolved in the first day after application, the soil was dry, likely slowing the rate of which may
have slowed urea hydrolysis.
Although this trial was unreplicated, it suggests that with moderately to well buffered soils,
ammonia loss may be small even when conditions should be ideal for loss (i.e., enough moisture
to dissolve prills, but not enough to move urea deeper into the soil.

Figure 7. Environmental conditions at the on-farm field site. On-farm ammonia loss
experiment. Fertilizer was applied on 6/17. By 6/18 ~50% of prills had dissolved and by 6/20 all
the prills had dissolved (3 days after application). Between 6/25 to 6/28, 0.25 inches of rain was
recorded.
0
20
40
60
80
100
120
6/17 6/19 6/21 6/23 6/25 6/27 6/29 7/1
Re
lati
ve h
um
idit
y (%
)
0
2
4
6
8
10
12
14
6/17 6/19 6/21 6/23 6/25 6/27 6/29 7/1
Win
d s
pe
ed
(m
ph
)
40
50
60
70
80
90
6/17 6/19 6/21 6/23 6/25 6/27 6/29 7/1
Air
te
mp
(F)
40
50
60
70
80
90
100
110
6/17 6/19 6/21 6/23 6/25 6/27 6/29 7/1
Soil
tem
p (
F)

Figure 8. Cumulative ammonia loss following fertilizer addition. On-farm trial. Ammonia
loss measurement via passive flux tower equipped with airflow control discs within the ammonia
measurement tubes. Error bars represent SE of the mean (n=4).
Figure 9. Cumulative ammonia-N loss at the OSU Vegetable Research Farm. This study
was designed to test the sensitivity of ammonia trapping to measurement technique (passive flux
mast equipped with or without airflow control discs).
0
2
4
6
8
10
12
14
0 2 4 6 8 10 12 14 16
NH
3-N
loss
(lb
N/a
cre
)
Days after application
Cumulative ammonia loss
Control
Urea nodisk
Urea disk
0
5
10
15
20
25
30
0 2 4 6 8
Am
mo
nia
N lo
ss (
lb N
/acr
e)
Day after fertilizer application
Control
Urea
SuperU

References
Engel, R., E. Williams and R. Wallander. 2012. NBPT degradation and mitigation of ammonia loss
from surface-applied urea in an acidic and alkaline soil. Great Plains Soil Fertility Conference
Proceedings. 14:23-29. March 6-7, 2012, Denver, Colorado.
Guertal, E.A. Slow-release Nitrogen Fertilizers in Vegetable Production: A Review. 2009.
HortTech, 19: 16-19
Hart, J., D.M. Sullivan, J.R. Myers, and R.E. Peachey. 2010. Nutrient Management Guide for
Sweet Corn (Western Oregon). Oregon State University Extension Publication EM 9010-E
Holcomb, J.C., D.M. Sullivan, D.A. Horneck, and G.H. Clough. 2011. Effect of Irrigation Rate on
Ammonia Volatilization. Soil Sci. Soc. of Am. Journal. 75:2341-2347
Leuning, R., J.R. Freney, O.T. Denmead, and J.R. Simpson. 1985. A sampler for measuring
atmospheric ammonia flux. Atmos. Environ. 19:1117–1124
Rawluk, C.D.L. 2000. Effect of soil texture, temperature and irrigation on the performance of urea
fertilizers amended with the urease inhibitor N-(N-butyl) thiophosphoric triamide. Thesis.
University of Manitoba, Canada.
Schjoerring, J.K., S.G. Sommer, and M. Ferm. 1992. A simple passive sampler for measuring
ammonia emission in the field. Water Air Soil Pollut. 62:13–24
Shoji, S., J. Delgado, A. Mosier and Y. Miura. 2001. Use of Controlled Release Fertilizers and
Nitrification Inhibitors to Increase Nitrogen Use Efficiency and to Conserve Air and Water
Quality. Com. in Soil Sci. and Plant Anal., 32:1051-1070
Vaio, N., M.L. Cabrera, D.E. Kissel, J.A. Rema, J.F. Newsome, and V.H. Calvert III. 2008.
Ammonia volatilization from urea-based fertilizers applied to tall fescue pastures in
Georgia, USA. Soil Sci. Soc. Am. J. 72:1665–1671
Wood, C.W., S.B. Marshall, and M.L. Cabrera. 2000. Improved method for field-scale
measurement of ammonia volatilization. Commun. Soil Sci. Plant Anal. 31:581–590.

4. BUDGET DETAILS
Category 2014 Budget Items 2014 (Year 1)
Salary & Benefits
Salary, Heinrich 10000
OPE, Heinrich (67%) 6700
Wages & Benefits
Wages (Summer labor) 2200
Benefits, summer labor, 8% 176
Equipment Equipment 0
Supplies Supplies (field and lab) 1000
Travel Travel 600
Plot Fees Plot Fees (land rental) 1385
Other Other (nutrient analyses, ammonia trapping, plant, soil)
6360
Total Total 28421