oracle 10g analytical sql for business intelligence reporting
DESCRIPTION
Oracle 10g analytical SQL for Business Intelligence Reporting. Simay Alpoge Next Information Systems, Inc. Oracle 10g analytical SQL for Business Intelligence Reporting AGENDA. Windowing aggregate functions. Reporting aggregate functions. LAG/LEAD functions. - PowerPoint PPT PresentationTRANSCRIPT

Oracle 10g analytical Oracle 10g analytical SQL for Business SQL for Business
Intelligence ReportingIntelligence Reporting
Simay AlpogeSimay Alpoge Next Information Next Information
Systems, Inc.Systems, Inc.

March 1, 2007March 1, 2007 Next Information SystemsNext Information Systems 22
Oracle 10g analytical SQL forOracle 10g analytical SQL for Business IntelligenceBusiness Intelligence ReportingReporting
AGENDAAGENDA• Windowing aggregate functions.Windowing aggregate functions.• Reporting aggregate functions.Reporting aggregate functions.• LAG/LEAD functions.LAG/LEAD functions.• FIRST/LAST functions.FIRST/LAST functions.• Hypothetical Rank and Distribution Functions.Hypothetical Rank and Distribution Functions.• Defining histograms with CASE statement.Defining histograms with CASE statement.• Data densification for business intelligence Data densification for business intelligence
reporting.reporting.• Analytical functions vs conventional Analytical functions vs conventional
techniques.techniques.

March 1, 2007March 1, 2007 Next Information SystemsNext Information Systems 33
Oracle 10g analytical SQL for Oracle 10g analytical SQL for Business Intelligence ReportingBusiness Intelligence Reporting
analytic_functionanalytic_function([ arguments ]) ([ arguments ]) OVER OVER (analytic_clause) (analytic_clause)
where analytic_clause = where analytic_clause = [ query_partition_clause ] [ query_partition_clause ] [ order_by_clause [ [ order_by_clause [ windowing_clausewindowing_clause ] ] ] ]
and and query_partition_clausequery_partition_clause = = PARTITION BYPARTITION BY { value_expr[, value_expr ]... | { value_expr[, value_expr ]... |
( value_expr[, value_expr ]... ) } ( value_expr[, value_expr ]... ) }

March 1, 2007March 1, 2007 Next Information SystemsNext Information Systems 44
Oracle 10g analytical SQL for Oracle 10g analytical SQL for Business Intelligence ReportingBusiness Intelligence Reporting
windowing_clausewindowing_clause = = { { ROWS | RANGEROWS | RANGE } }{ BETWEEN { UNBOUNDED PRECEDING | { BETWEEN { UNBOUNDED PRECEDING |
CURRENT ROW |CURRENT ROW | value_expr { PRECEDING | FOLLOWING } } value_expr { PRECEDING | FOLLOWING } } AND { UNBOUNDED FOLLOWING |AND { UNBOUNDED FOLLOWING |CURRENT ROW | value_expr { PRECEDING | CURRENT ROW | value_expr { PRECEDING |
FOLLOWING } } FOLLOWING } } OROR{ UNBOUNDED PRECEDING | CURRENT ROW { UNBOUNDED PRECEDING | CURRENT ROW
| value_expr PRECEDING } }| value_expr PRECEDING } }
March 1, 2007March 1, 2007 Next Information SystemsNext Information Systems 55
Oracle 10g analytical SQL for Oracle 10g analytical SQL for Business Intelligence ReportingBusiness Intelligence Reporting
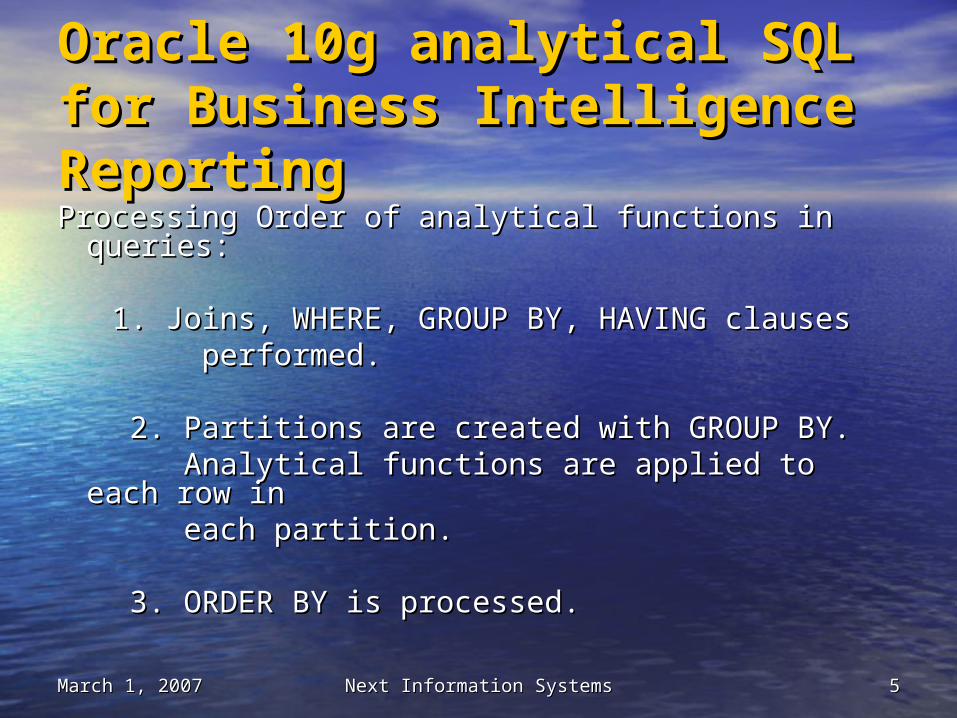
Processing Order of analytical functions in queries: Processing Order of analytical functions in queries:
1. Joins, WHERE, GROUP BY, HAVING clauses 1. Joins, WHERE, GROUP BY, HAVING clauses performed.performed.
2. Partitions are created with GROUP BY.2. Partitions are created with GROUP BY. Analytical functions are applied to each row inAnalytical functions are applied to each row in each partition. each partition. 3. ORDER BY is processed.3. ORDER BY is processed.
March 1, 2007March 1, 2007 Next Information SystemsNext Information Systems 66
Oracle 10g analytical SQL for Oracle 10g analytical SQL for Business Intelligence ReportingBusiness Intelligence Reporting
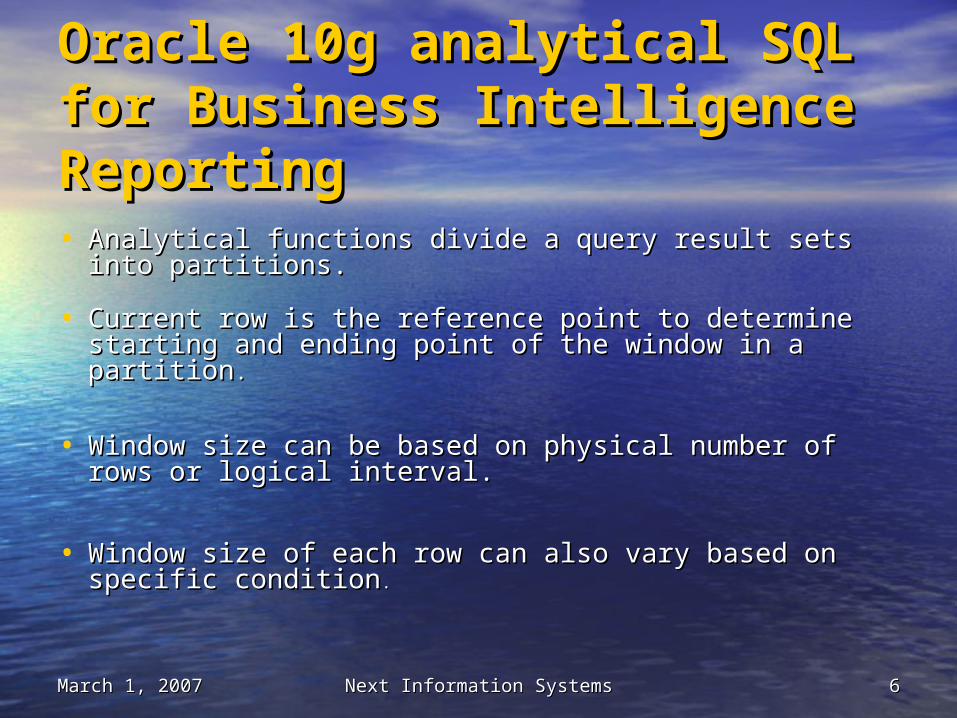
• Analytical functions divide a query result sets into Analytical functions divide a query result sets into partitions. partitions.
• Current row is the reference point to determine Current row is the reference point to determine starting and ending point of the window in a partitionstarting and ending point of the window in a partition. .
• Window size can be based on physical number of Window size can be based on physical number of rows or logical interval. rows or logical interval.
• Window size of each row can also vary based on Window size of each row can also vary based on specific conditionspecific condition. .
March 1, 2007March 1, 2007 Next Information SystemsNext Information Systems 77
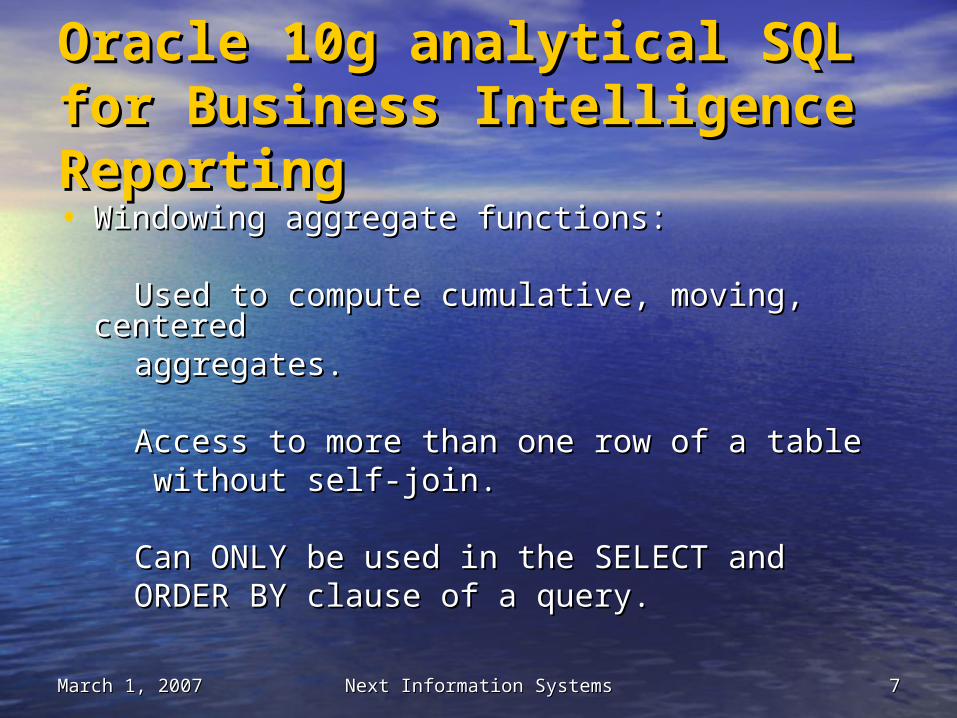
Oracle 10g analytical SQL for Oracle 10g analytical SQL for Business Intelligence ReportingBusiness Intelligence Reporting• Windowing aggregate functions:Windowing aggregate functions: Used to compute cumulative, moving, centered Used to compute cumulative, moving, centered aggregates.aggregates.
Access to more than one row of a table Access to more than one row of a table without self-join.without self-join.
Can ONLY be used in the SELECT and Can ONLY be used in the SELECT and ORDER BY clause of a query.ORDER BY clause of a query.

March 1, 2007March 1, 2007 Next Information SystemsNext Information Systems 88
Oracle 10g analytical SQL for Oracle 10g analytical SQL for Business Intelligence ReportingBusiness Intelligence Reporting
Windowing function with Windowing function with LOGICALLOGICAL offset offset
ConstantConstant - RANGE 5- RANGE 5
IntervalInterval -RANGE INTERVAL N -RANGE INTERVAL N DAY/MONTH/YEAR … expression DAY/MONTH/YEAR … expression
Multiple sort keys with Multiple sort keys with analytical ORDER BYanalytical ORDER BY
RANGE BETWEEN UNBOUNDED RANGE BETWEEN UNBOUNDED PRECEDING/FOLLOWINGPRECEDING/FOLLOWING
Windowing function with Windowing function with PHYSICALPHYSICAL offset offset
Ordering expression have to be unique.Ordering expression have to be unique.

March 1, 2007March 1, 2007 Next Information SystemsNext Information Systems 99
Oracle 10g analytical SQL for Oracle 10g analytical SQL for Business Intelligence ReportingBusiness Intelligence Reporting
Cumulative AggregateCumulative Aggregate
SELECT REGION, QUARTER , SELECT REGION, QUARTER , SUM(SALES) Q_SALES, SUM(SALES) Q_SALES,
SUM(SUM(SALES)) SUM(SUM(SALES)) OVEROVER ( (PARTITION BYPARTITION BY REGION REGION ORDER BYORDER BY REGION, QUARTER REGION, QUARTER
ROWS UNBOUNDED PRECEDINGROWS UNBOUNDED PRECEDING) CUMULATIVE_SALES) CUMULATIVE_SALES FROM SALES S, TIMES T, LOCATION LFROM SALES S, TIMES T, LOCATION L
WHERE S.TIME_ID = T.TIME_IDWHERE S.TIME_ID = T.TIME_ID AND S.LOCATION_ID = L.LOCATION_IDAND S.LOCATION_ID = L.LOCATION_ID AND T.CALENDAR_YEAR = ‘2006’AND T.CALENDAR_YEAR = ‘2006’ AND L.LOCATION_ID IN (234, 356,780)AND L.LOCATION_ID IN (234, 356,780) GROUP BY REGION, QUARTERGROUP BY REGION, QUARTER ORDER BY REGION, QUARTER ;ORDER BY REGION, QUARTER ;

March 1, 2007March 1, 2007 Next Information SystemsNext Information Systems 1010
Oracle 10g analytical SQL for Oracle 10g analytical SQL for Business Intelligence ReportingBusiness Intelligence Reporting
Region Quarter Region Quarter Q_Sales Q_Sales Cumulative_SalesCumulative_Sales
East 01-2006East 01-2006 100.90100.90 100.90 100.90EastEast 02-2006 02-2006 150.75150.75 251.65 251.65EastEast 03-2006 03-2006 200.00200.00 451.65 451.65East 04-2006 East 04-2006 500.00 951.65500.00 951.65West 01-2006 1100.00 West 01-2006 1100.00 1100.00 1100.00WestWest 02-2006 02-2006 875.00 875.00 1975.00 1975.00West 03-2006 950.78 West 03-2006 950.78 2925.78 2925.78West 04-2006West 04-2006 1200.00 1200.00 4125.78 4125.78

March 1, 2007March 1, 2007 Next Information SystemsNext Information Systems 1111
Oracle 10g analytical SQL for Oracle 10g analytical SQL for Business Intelligence ReportingBusiness Intelligence Reporting
Centered AggregateCentered Aggregate
SELECT C_MONTH_ID, SELECT C_MONTH_ID, SUM(SALES) M_SALES, SUM(SALES) M_SALES,
AVGAVG(SUM(SALES)) (SUM(SALES)) OVEROVER ((ORDER BYORDER BY C_MONTH_ID C_MONTH_ID RANGE BETWEEN INTERVAL RANGE BETWEEN INTERVAL
‘1’ MONTH PRECEEDING AND ‘1’ MONTH FOLLOWING‘1’ MONTH PRECEEDING AND ‘1’ MONTH FOLLOWING) ) 3_MONTH_SALES3_MONTH_SALES FROM SALES S, TIMES TFROM SALES S, TIMES T
WHERE S.TIME_ID = T.TIME_IDWHERE S.TIME_ID = T.TIME_ID AND T.CALENDAR_YEAR = ‘2006’AND T.CALENDAR_YEAR = ‘2006’ AND C_MONTH_ID BETWEEN 1 AND 6AND C_MONTH_ID BETWEEN 1 AND 6 GROUP BY C_MONTH_IDGROUP BY C_MONTH_ID ORDER BY C_MONTH_ID ;ORDER BY C_MONTH_ID ;

March 1, 2007March 1, 2007 Next Information SystemsNext Information Systems 1212
Oracle 10g analytical SQL for Oracle 10g analytical SQL for Business Intelligence ReportingBusiness Intelligence Reporting
C_Month_Id C_Month_Id M_Sales M_Sales 3_Month_Sales 3_Month_Sales
11 500.00 500.00 350.00 350.00
2 2 200.00 200.00 300.00 300.00
3 3 200.00 200.00 300.00 300.00
4 500.00 4 500.00 500.00 500.00
55 800.00 633.33 800.00 633.33
66 600.00 600.00 700.00 700.00

March 1, 2007March 1, 2007 Next Information SystemsNext Information Systems 1313
Oracle 10g analytical SQL for Oracle 10g analytical SQL for Business Intelligence ReportingBusiness Intelligence Reporting
Moving AggregateMoving Aggregate
SELECT REGION, QUARTER , SELECT REGION, QUARTER , SUM(SALES) Q_SALES, SUM(SALES) Q_SALES,
AVGAVG(SUM(SALES)) (SUM(SALES)) OVEROVER ( (PARTITION BYPARTITION BY REGION REGION ORDER BYORDER BY REGION, QUARTER REGION, QUARTER
ROWS 2 PRECEDINGROWS 2 PRECEDING) MOVING_AVG_SALES) MOVING_AVG_SALES FROM SALES S, TIMES T, LOCATION LFROM SALES S, TIMES T, LOCATION L
WHERE S.TIME_ID = T.TIME_IDWHERE S.TIME_ID = T.TIME_ID AND S.LOCATION_ID = L.LOCATION_IDAND S.LOCATION_ID = L.LOCATION_ID AND T.CALENDAR_YEAR = ‘2006’AND T.CALENDAR_YEAR = ‘2006’ AND L.LOCATION_ID IN (234, 356,780)AND L.LOCATION_ID IN (234, 356,780) GROUP BY REGION, QUARTERGROUP BY REGION, QUARTER ORDER BY REGION, QUARTER;ORDER BY REGION, QUARTER;

March 1, 2007March 1, 2007 Next Information SystemsNext Information Systems 1414
Oracle 10g analytical SQL for Oracle 10g analytical SQL for Business Intelligence ReportingBusiness Intelligence Reporting
Region Quarter Q_Sales Region Quarter Q_Sales Moving_Avg_SalesMoving_Avg_Sales
East 01-2006East 01-2006 100.90 100.90 100.90 100.90EastEast 02-2006 150.75 02-2006 150.75 125.83 125.83EastEast 03-2006 03-2006 200.00 200.00 150.55 150.55East 04-2006 500.00 East 04-2006 500.00
283.58283.58West 01-2006 1100.00 West 01-2006 1100.00 1100.00 1100.00WestWest 02-2006 875.00 02-2006 875.00 987.50 987.50West 03-2006 950.78 West 03-2006 950.78 975.26 975.26 West 04-2006West 04-2006 1200.00 1200.00 1008.59 1008.59
March 1, 2007March 1, 2007 Next Information SystemsNext Information Systems 1515
Oracle 10g analytical SQL for Oracle 10g analytical SQL for Business Intelligence ReportingBusiness Intelligence Reporting
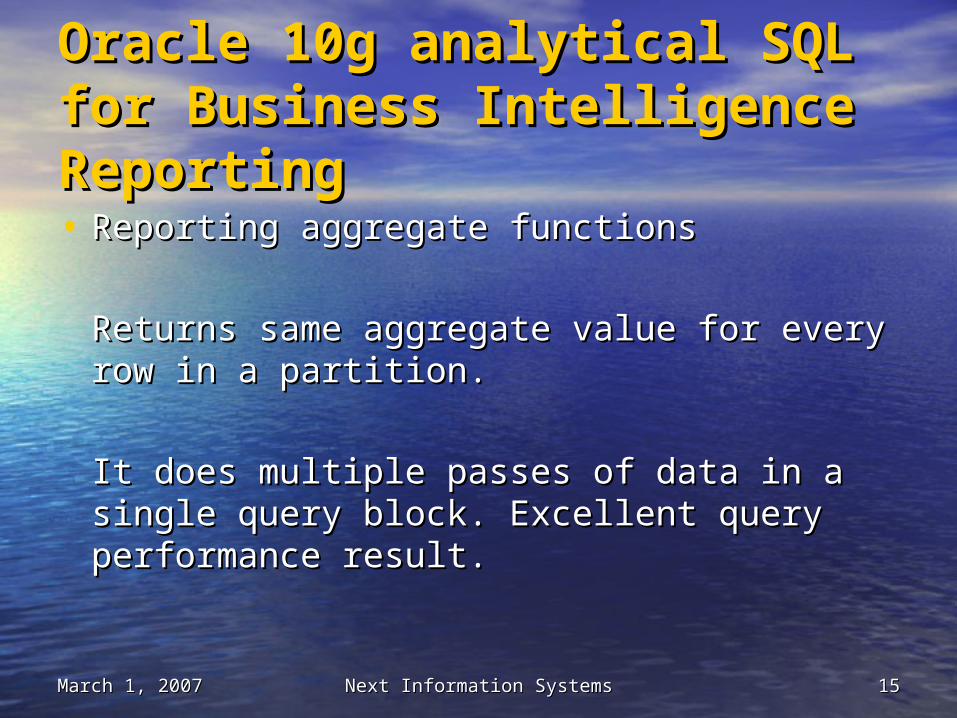
• Reporting aggregate functionsReporting aggregate functions
Returns same aggregate value for every Returns same aggregate value for every row in a partition.row in a partition.
It does multiple passes of data in a single It does multiple passes of data in a single query block. Excellent query performance query block. Excellent query performance result.result.

March 1, 2007March 1, 2007 Next Information SystemsNext Information Systems 1616
Oracle 10g analytical SQL for Oracle 10g analytical SQL for Business Intelligence ReportingBusiness Intelligence ReportingSELECT store_name, prod_grp_desc, tot_sales, tot_costsSELECT store_name, prod_grp_desc, tot_sales, tot_costsFROM (SELECT prod_grp_name,FROM (SELECT prod_grp_name,
store_name, store_name, SUM(sales) tot_sales, SUM(sales) tot_sales, SUM(costs) tot_costs, SUM(costs) tot_costs, MAX(SUM(sales)) OVER (PARTITION BY prod_grp_cd) MAX(SUM(sales)) OVER (PARTITION BY prod_grp_cd)
top_sales,top_sales, MAX(SUM(costs)) OVER (PARTITION BY prod_grp_cd) MAX(SUM(costs)) OVER (PARTITION BY prod_grp_cd)
top_coststop_costs FROM sales_hist sh, store s, product_grp p inv_major mFROM sales_hist sh, store s, product_grp p inv_major m
WHERE sh.store_cd = s.store_cdWHERE sh.store_cd = s.store_cd AND sh.mjr_cd = m.inv_mjr_cd AND sh.mjr_cd = m.inv_mjr_cd AND m.prod_grp_cd = p.product_grp_cd AND m.prod_grp_cd = p.product_grp_cd AND sh.s_date = TO_DATE(’01-FEB-2007’) AND sh.s_date = TO_DATE(’01-FEB-2007’) GROUP BY prod_grp_name, store_name)GROUP BY prod_grp_name, store_name)WHERE tot_costs <= top_costsWHERE tot_costs <= top_costs AND tot_sales = top_salesAND tot_sales = top_sales

March 1, 2007March 1, 2007 Next Information SystemsNext Information Systems 1717
Oracle 10g analytical SQL for Oracle 10g analytical SQL for Business Intelligence ReportingBusiness Intelligence Reporting
Inner query resultsInner query results
PROD_GRP_ STORE_ TOT_ TOT_ TOP_ TOP_PROD_GRP_ STORE_ TOT_ TOT_ TOP_ TOP_NAME NAME SALES COSTS SALES COSTSNAME NAME SALES COSTS SALES COSTS
ACCESSORIES 5ACCESSORIES 5thth Ave Ave 10001000 200 200 1000 1000 200 200ACCESSORIES Brooklyn 500ACCESSORIES Brooklyn 500 150 150 1000 1000 200 200
LADIES SHOES 5LADIES SHOES 5thth Ave Ave 30003000 750 750 3000 3000 1000 1000LADIES SHOES BrooklynLADIES SHOES Brooklyn 20002000 500 500 3000 3000 1000 1000LADIES SHOES San FranciscoLADIES SHOES San Francisco 25002500 1000 3000 1000 3000 1000 1000
CHILDREN CHILDREN Houston Houston 30003000 650 650 4000 4000 1000 1000CHILDRENCHILDREN 5 5thth Ave Ave 40004000 900 900 4000 4000 1000 1000CHILDRENCHILDREN Brooklyn Brooklyn 30003000 1000 4000 1000 1000 4000 1000

March 1, 2007March 1, 2007 Next Information SystemsNext Information Systems 1818
Oracle 10g analytical SQL for Oracle 10g analytical SQL for Business Intelligence ReportingBusiness Intelligence Reporting
Final resultFinal result
PROD_GRP_ STORE_ TOT_ TOT_ TOP_ TOP_PROD_GRP_ STORE_ TOT_ TOT_ TOP_ TOP_
NAME NAME SALES COSTS SALES NAME NAME SALES COSTS SALES COSTSCOSTS
ACCESSORIES 5ACCESSORIES 5thth Ave Ave 10001000 200 200 1000 1000 200 200
LADIES SHOES 5LADIES SHOES 5thth Ave Ave 30003000 750 750 3000 3000 1000 1000
CHILDRENCHILDREN 5 5thth Ave Ave 40004000 900 900 4000 4000 1000 1000
March 1, 2007March 1, 2007 Next Information SystemsNext Information Systems 1919
Oracle 10g analytical SQL for Oracle 10g analytical SQL for Business Intelligence ReportingBusiness Intelligence Reporting
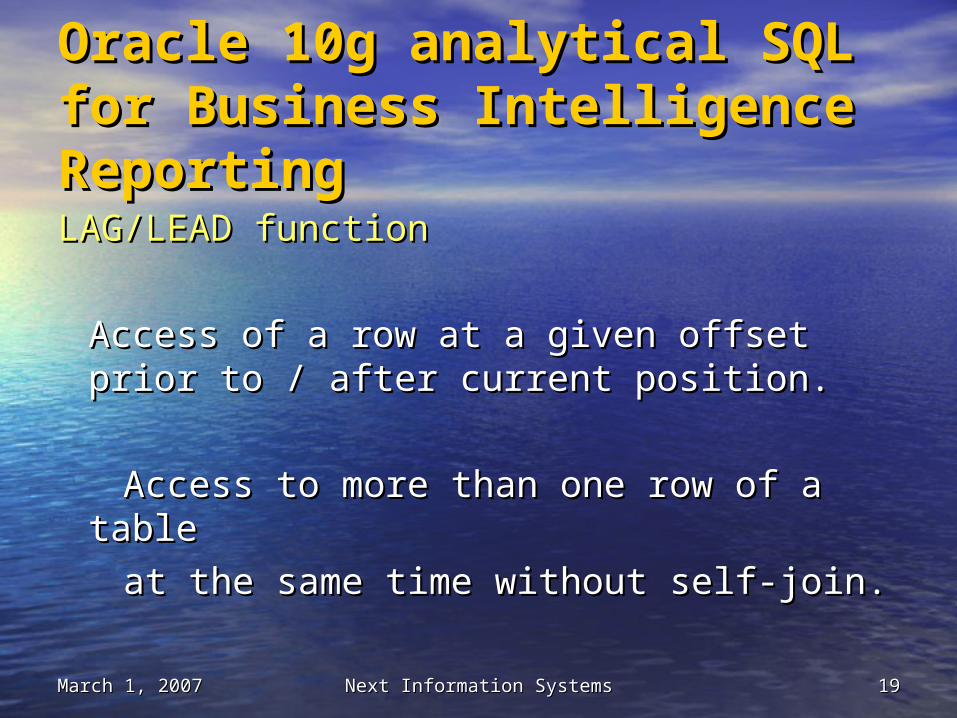
LAG/LEAD functionLAG/LEAD function
Access of a row at a given offset prior Access of a row at a given offset prior to / after current position. to / after current position.
Access to more than one row of a tableAccess to more than one row of a table
at the same time without self-join.at the same time without self-join.
March 1, 2007March 1, 2007 Next Information SystemsNext Information Systems 2020
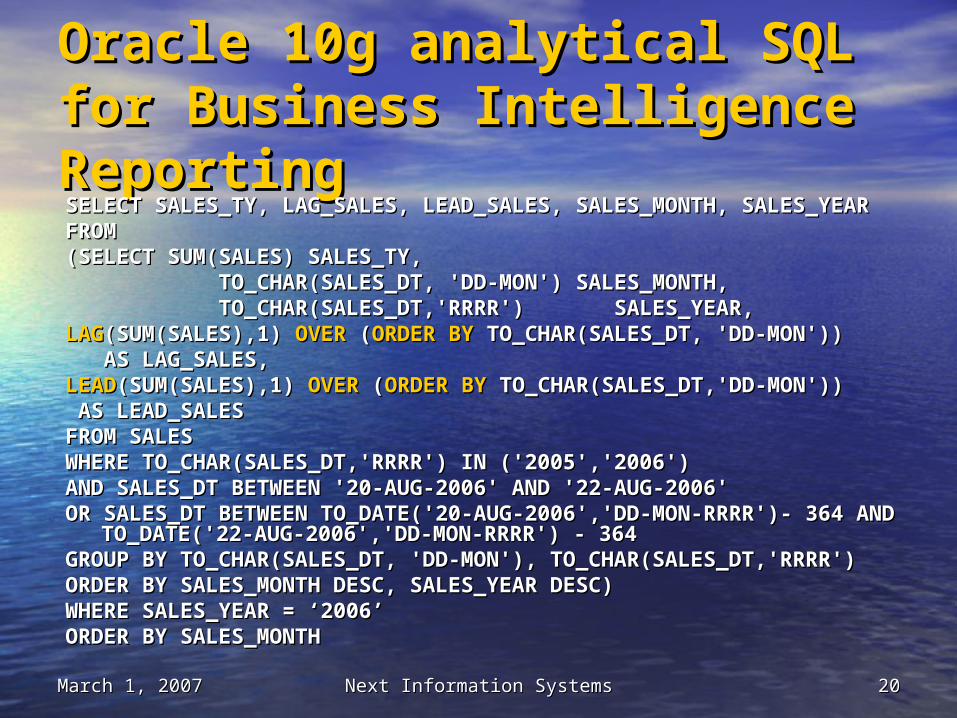
Oracle 10g analytical SQL for Oracle 10g analytical SQL for Business Intelligence ReportingBusiness Intelligence ReportingSELECT SALES_TY, LAG_SALES, LEAD_SALES, SALES_MONTH, SELECT SALES_TY, LAG_SALES, LEAD_SALES, SALES_MONTH,
SALES_YEARSALES_YEARFROMFROM(SELECT SUM(SALES) SALES_TY, (SELECT SUM(SALES) SALES_TY, TO_CHAR(SALES_DT, 'DD-MON') SALES_MONTH, TO_CHAR(SALES_DT, 'DD-MON') SALES_MONTH, TO_CHAR(SALES_DT,'RRRR') SALES_YEAR, TO_CHAR(SALES_DT,'RRRR') SALES_YEAR, LAGLAG(SUM(SALES),1) (SUM(SALES),1) OVEROVER ( (ORDER BYORDER BY TO_CHAR(SALES_DT, 'DD-MON')) TO_CHAR(SALES_DT, 'DD-MON')) AS LAG_SALES,AS LAG_SALES,LEADLEAD(SUM(SALES),1) (SUM(SALES),1) OVEROVER ( (ORDER BYORDER BY TO_CHAR(SALES_DT,'DD-MON')) TO_CHAR(SALES_DT,'DD-MON')) AS LEAD_SALESAS LEAD_SALESFROM SALESFROM SALESWHERE TO_CHAR(SALES_DT,'RRRR') IN ('2005','2006')WHERE TO_CHAR(SALES_DT,'RRRR') IN ('2005','2006')AND SALES_DT BETWEEN '20-AUG-2006' AND '22-AUG-2006'AND SALES_DT BETWEEN '20-AUG-2006' AND '22-AUG-2006'OR SALES_DT BETWEEN TO_DATE('20-AUG-2006','DD-MON-RRRR')- 364 OR SALES_DT BETWEEN TO_DATE('20-AUG-2006','DD-MON-RRRR')- 364
AND TO_DATE('22-AUG-2006','DD-MON-RRRR') - 364AND TO_DATE('22-AUG-2006','DD-MON-RRRR') - 364GROUP BY TO_CHAR(SALES_DT, 'DD-MON'), TO_CHAR(SALES_DT,'RRRR')GROUP BY TO_CHAR(SALES_DT, 'DD-MON'), TO_CHAR(SALES_DT,'RRRR')ORDER BY SALES_MONTH DESC, SALES_YEAR DESC)ORDER BY SALES_MONTH DESC, SALES_YEAR DESC)WHERE SALES_YEAR = ‘2006’WHERE SALES_YEAR = ‘2006’ORDER BY SALES_MONTH ORDER BY SALES_MONTH

March 1, 2007March 1, 2007 Next Information SystemsNext Information Systems 2121
Oracle 10g analytical SQL for Oracle 10g analytical SQL for Business Intelligence ReportingBusiness Intelligence Reporting
Inner query results :Inner query results :
SALES_ SALES_ SALES_ LAG_ LEAD_SALES_ SALES_ SALES_ LAG_ LEAD_TY MONTH YEAR SALES SALESTY MONTH YEAR SALES SALES
5000 20-AUG 20065000 20-AUG 2006 350035003500 20-AUG 2005 50004500 21-AUG 20064500 21-AUG 2006 670067006700 21-AUG 2005 6700 21-AUG 2005 4500 45008300 22-AUG 2006 8300 22-AUG 2006 9500950095009500 22-AUG 2005 22-AUG 2005 8300 8300
March 1, 2007March 1, 2007 Next Information SystemsNext Information Systems 2222
Oracle 10g analytical SQL for Oracle 10g analytical SQL for Business Intelligence ReportingBusiness Intelligence Reporting
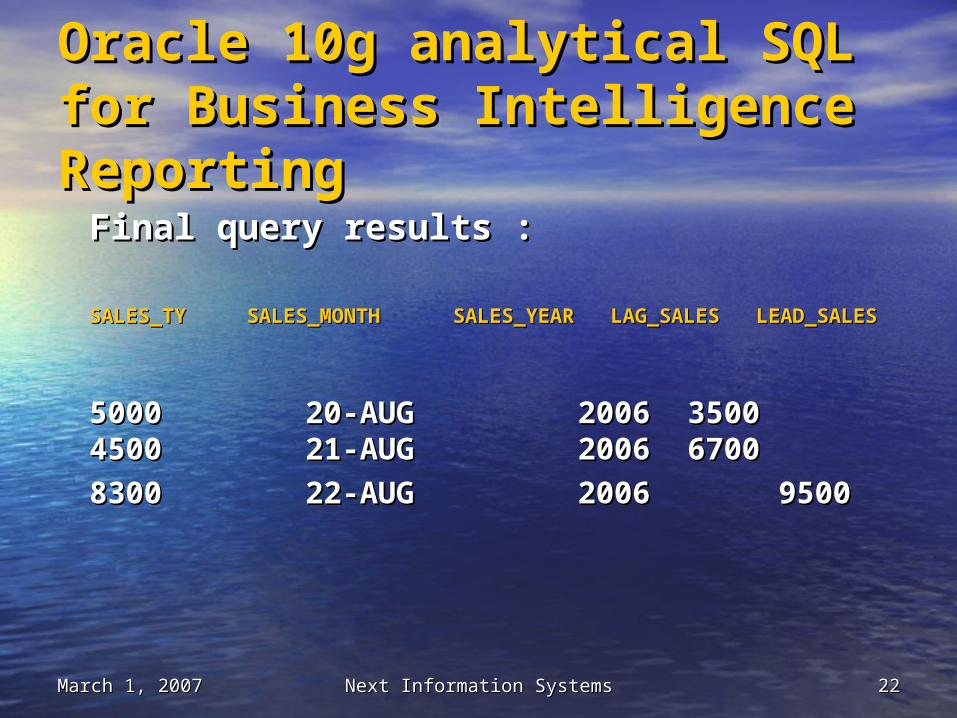
Final query results :Final query results :
SALES_TY SALES_MONTH SALES_YEAR LAG_SALES SALES_TY SALES_MONTH SALES_YEAR LAG_SALES LEAD_SALESLEAD_SALES
5000 5000 20-AUG 2006 20-AUG 2006 3500 35004500 4500 21-AUG 2006 21-AUG 2006 6700 6700
8300 8300 22-AUG 2006 22-AUG 2006 9500 9500
March 1, 2007March 1, 2007 Next Information SystemsNext Information Systems 2323
Oracle 10g analytical SQL for Oracle 10g analytical SQL for Business Intelligence ReportingBusiness Intelligence Reporting
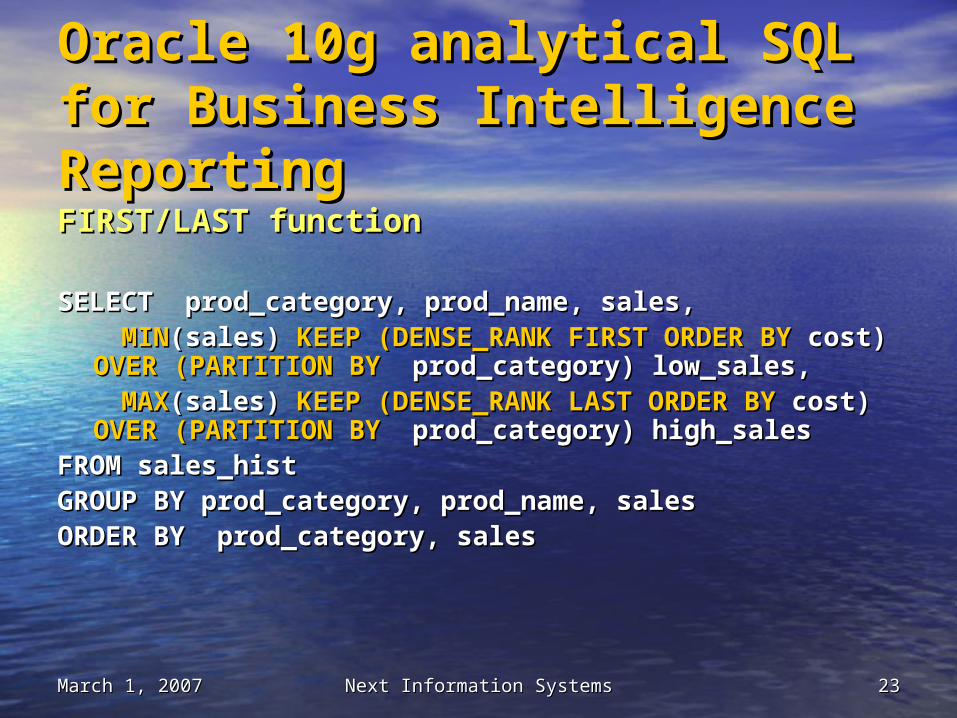
FIRST/LAST functionFIRST/LAST function
SELECT prod_category, prod_name, sales,SELECT prod_category, prod_name, sales, MINMIN(sales) (sales) KEEP (DENSE_RANK FIRSTKEEP (DENSE_RANK FIRST ORDER BYORDER BY
cost) cost) OVER (PARTITION BYOVER (PARTITION BY prod_category) low_sales, prod_category) low_sales, MAXMAX(sales) (sales) KEEP (DENSE_RANK LAST ORDER BYKEEP (DENSE_RANK LAST ORDER BY cost) cost)
OVER (PARTITION BYOVER (PARTITION BY prod_category) high_sales prod_category) high_salesFROM sales_histFROM sales_histGROUP BY prod_category, prod_name, salesGROUP BY prod_category, prod_name, salesORDER BY prod_category, salesORDER BY prod_category, sales

March 1, 2007March 1, 2007 Next Information SystemsNext Information Systems 2424
Oracle 10g analytical SQL for Oracle 10g analytical SQL for Business Intelligence ReportingBusiness Intelligence Reporting
Prod Prod Prod Sales Prod Sales CostCost Low High Low HighCategory Name Sales SalesCategory Name Sales SalesAccessories Leader Belt 200 Accessories Leader Belt 200 5050 100 100 500 500……Accessories Leader Belt 100 Accessories Leader Belt 100 5050 100 100 300 300
Accessories Silk Scarf 600 Accessories Silk Scarf 600 100100 200 200 600 600……Accessories Silk Scarf 800 Accessories Silk Scarf 800 150150 300 300 800 800
Handbag LVHandbag LV 5000 5000 500500 3000 35000 3000 35000Handbag Coach 8000 Handbag Coach 8000 400400 8000 12000 8000 12000 RL Shirt 600 RL Shirt 600 4545 600 600 600 600

March 1, 2007March 1, 2007 Next Information SystemsNext Information Systems 2525
Oracle 10g analytical SQL for Oracle 10g analytical SQL for Business Intelligence ReportingBusiness Intelligence Reporting
Prod Prod Prod Sales Low HighProd Sales Low High
Category Name Sales SalesCategory Name Sales Sales
Accessories Leader Belt 100 100Accessories Leader Belt 100 100 300 300
Accessories Silk Scarf 600 Accessories Silk Scarf 600 200200 600 600
Handbag LVHandbag LV 5000 3000 35000 5000 3000 35000
Handbag Coach 8000 8000 12000Handbag Coach 8000 8000 12000
RL Shirt 600 RL Shirt 600 600 600600 600
March 1, 2007March 1, 2007 Next Information SystemsNext Information Systems 2626
Oracle 10g analytical SQL for Oracle 10g analytical SQL for Business Intelligence ReportingBusiness Intelligence Reporting
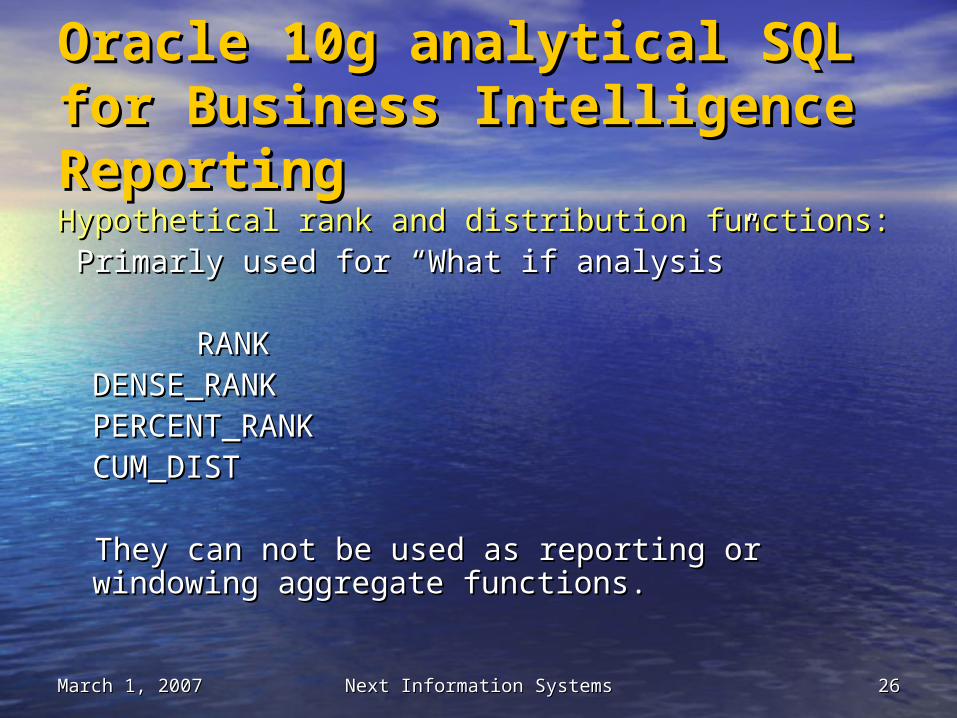
Hypothetical rank and distribution functions:Hypothetical rank and distribution functions: Primarly used for “What if analysis”Primarly used for “What if analysis”
RANKRANKDENSE_RANKDENSE_RANKPERCENT_RANKPERCENT_RANKCUM_DISTCUM_DIST
They can not be used as reporting or windowing They can not be used as reporting or windowing aggregate functions.aggregate functions.
March 1, 2007March 1, 2007 Next Information SystemsNext Information Systems 2727
Oracle 10g analytical SQL for Oracle 10g analytical SQL for Business Intelligence ReportingBusiness Intelligence Reporting
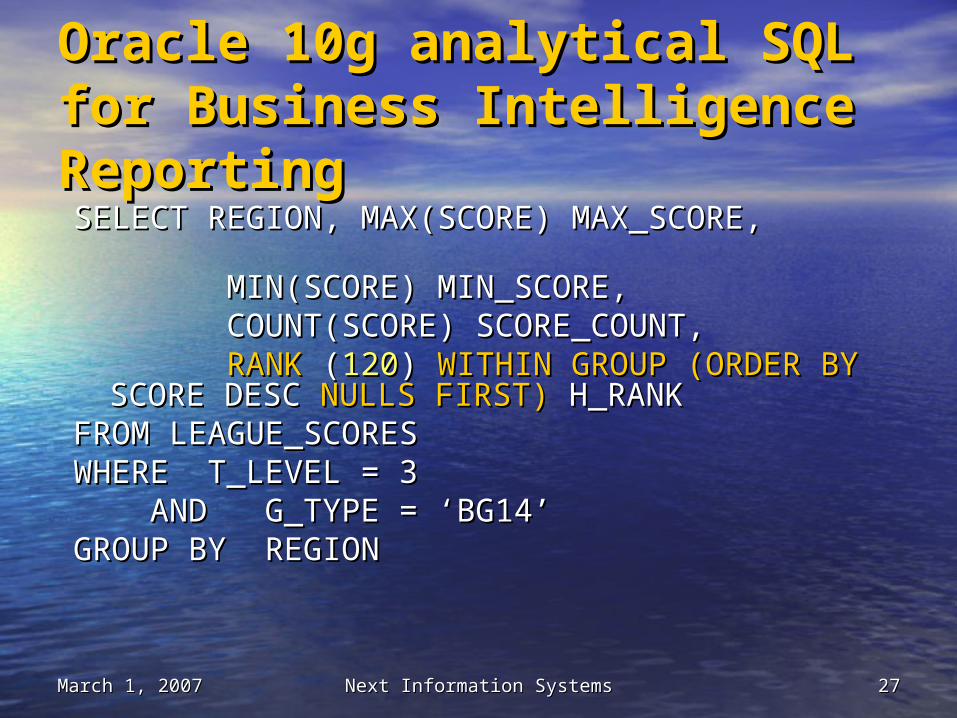
SELECT REGION, MAX(SCORE) MAX_SCORE, SELECT REGION, MAX(SCORE) MAX_SCORE, MIN(SCORE) MIN_SCORE,MIN(SCORE) MIN_SCORE, COUNT(SCORE) SCORE_COUNT,COUNT(SCORE) SCORE_COUNT, RANK RANK ((120120) ) WITHIN GROUP (ORDER BYWITHIN GROUP (ORDER BY
SCORE DESC SCORE DESC NULLS FIRST) NULLS FIRST) H_RANKH_RANKFROM LEAGUE_SCORESFROM LEAGUE_SCORESWHERE T_LEVEL = 3WHERE T_LEVEL = 3 AND G_TYPE = ‘BG14’AND G_TYPE = ‘BG14’GROUP BY REGIONGROUP BY REGION
March 1, 2007March 1, 2007 Next Information SystemsNext Information Systems 2828
Oracle 10g analytical SQL for Oracle 10g analytical SQL for Business Intelligence ReportingBusiness Intelligence Reporting
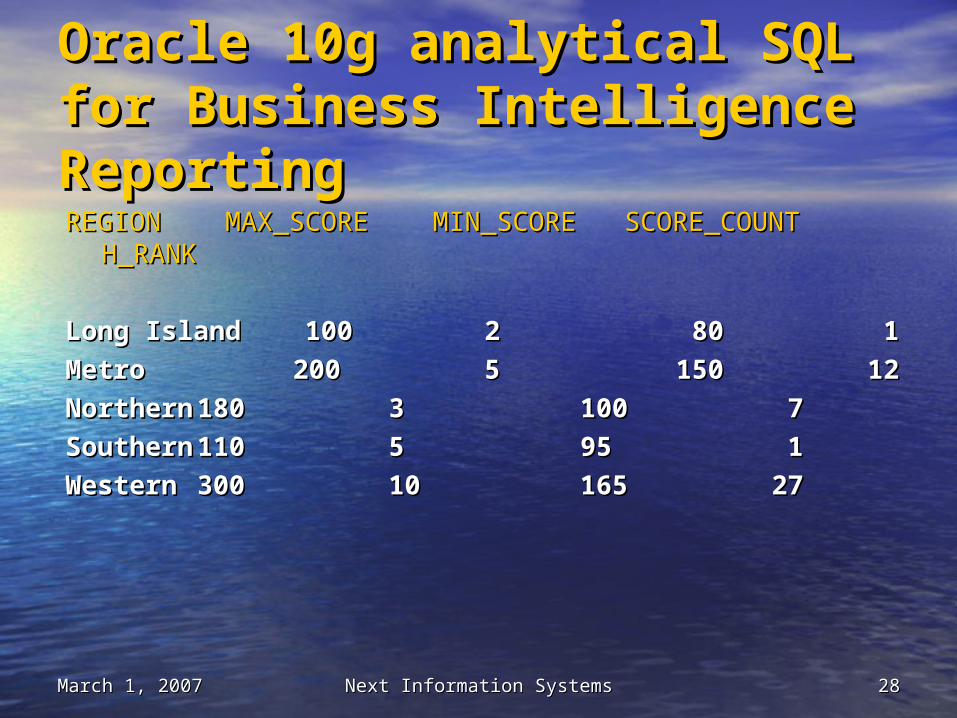
REGION MAX_SCORE MIN_SCORE SCORE_COUNT REGION MAX_SCORE MIN_SCORE SCORE_COUNT H_RANKH_RANK
Long Island 100Long Island 100 22 80 80 1 1
MetroMetro 200200 55 1501501212
NorthernNorthern 180180 33 100100 7 7
SouthernSouthern 110110 55 9595 1 1
WesternWestern 300300 1010 165165 2727

March 1, 2007March 1, 2007 Next Information SystemsNext Information Systems 2929
Oracle 10g analytical SQL for Oracle 10g analytical SQL for Business Intelligence ReportingBusiness Intelligence Reporting
Histograms with CASEHistograms with CASE SELECT SUM (CASE WHEN SALES BETWEEN 100 AND SELECT SUM (CASE WHEN SALES BETWEEN 100 AND
5000 5000
THEN 1 ELSE 0 END) AS “100 – 5000”,THEN 1 ELSE 0 END) AS “100 – 5000”,
SUM(CASE WHEN SALES BETWEEN 5001 AND 15000 SUM(CASE WHEN SALES BETWEEN 5001 AND 15000
THEN 1 ELSE 0 END) AS “5001 – 15000”,THEN 1 ELSE 0 END) AS “5001 – 15000”,
SUM (CASE WHEN SALES BETWEEN 15001 AND 25000 SUM (CASE WHEN SALES BETWEEN 15001 AND 25000
THEN 1 ELSE 0 END ) AS “15001 – 25000”THEN 1 ELSE 0 END ) AS “15001 – 25000”
FROM SALES FROM SALES
WHERE REGION = ‘WEST’WHERE REGION = ‘WEST’
March 1, 2007March 1, 2007 Next Information SystemsNext Information Systems 3030
Oracle 10g analytical SQL for Oracle 10g analytical SQL for Business Intelligence ReportingBusiness Intelligence Reporting
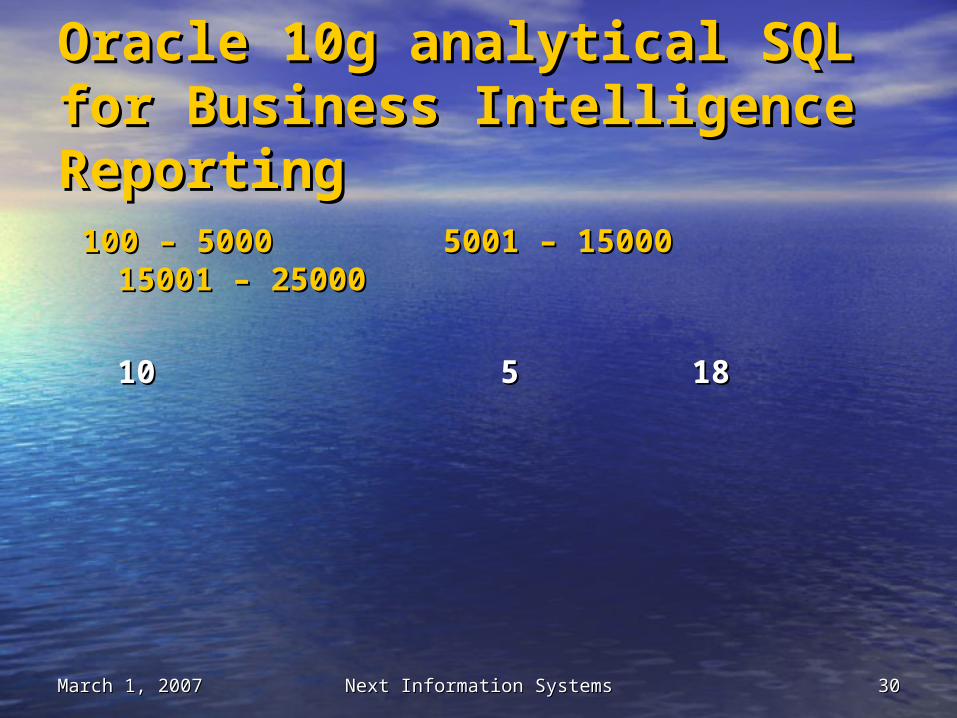
100 – 5000100 – 5000 5001 – 15000 5001 – 15000 15001 15001 – 25000– 25000
1010 55 1818
March 1, 2007March 1, 2007 Next Information SystemsNext Information Systems 3131
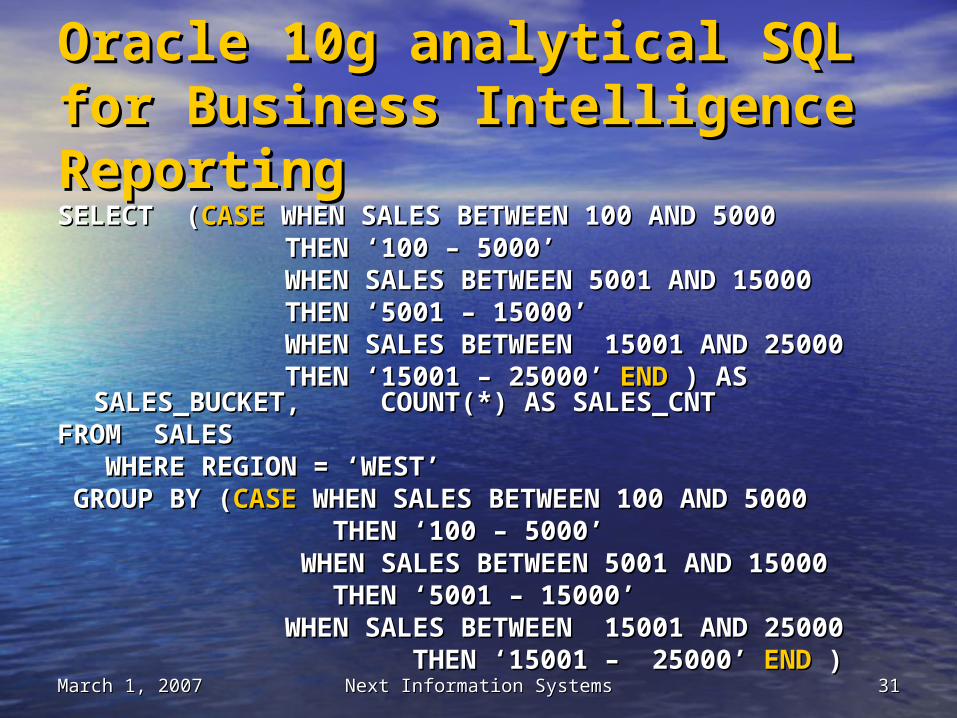
Oracle 10g analytical SQL for Oracle 10g analytical SQL for Business Intelligence ReportingBusiness Intelligence ReportingSELECT (SELECT (CASECASE WHEN SALES BETWEEN 100 AND 5000 WHEN SALES BETWEEN 100 AND 5000
THEN ‘100 – 5000’THEN ‘100 – 5000’ WHEN SALES BETWEEN 5001 AND 15000 WHEN SALES BETWEEN 5001 AND 15000
THEN ‘5001 – 15000’THEN ‘5001 – 15000’ WHEN SALES BETWEEN 15001 AND 25000 WHEN SALES BETWEEN 15001 AND 25000
THEN ‘15001 – 25000’ THEN ‘15001 – 25000’ ENDEND ) AS ) AS SALES_BUCKET, SALES_BUCKET, COUNT(*) AS SALES_CNTCOUNT(*) AS SALES_CNT
FROM SALESFROM SALES WHERE REGION = ‘WEST’WHERE REGION = ‘WEST’ GROUP BY (GROUP BY (CASECASE WHEN SALES BETWEEN 100 AND 5000 WHEN SALES BETWEEN 100 AND 5000
THEN ‘100 – 5000’THEN ‘100 – 5000’ WHEN SALES BETWEEN 5001 AND 15000 WHEN SALES BETWEEN 5001 AND 15000
THEN ‘5001 – 15000’THEN ‘5001 – 15000’ WHEN SALES BETWEEN 15001 AND 25000 WHEN SALES BETWEEN 15001 AND 25000
THEN ‘15001 – 25000’ THEN ‘15001 – 25000’ ENDEND ) )
March 1, 2007March 1, 2007 Next Information SystemsNext Information Systems 3232
Oracle 10g analytical SQL for Oracle 10g analytical SQL for Business Intelligence ReportingBusiness Intelligence Reporting
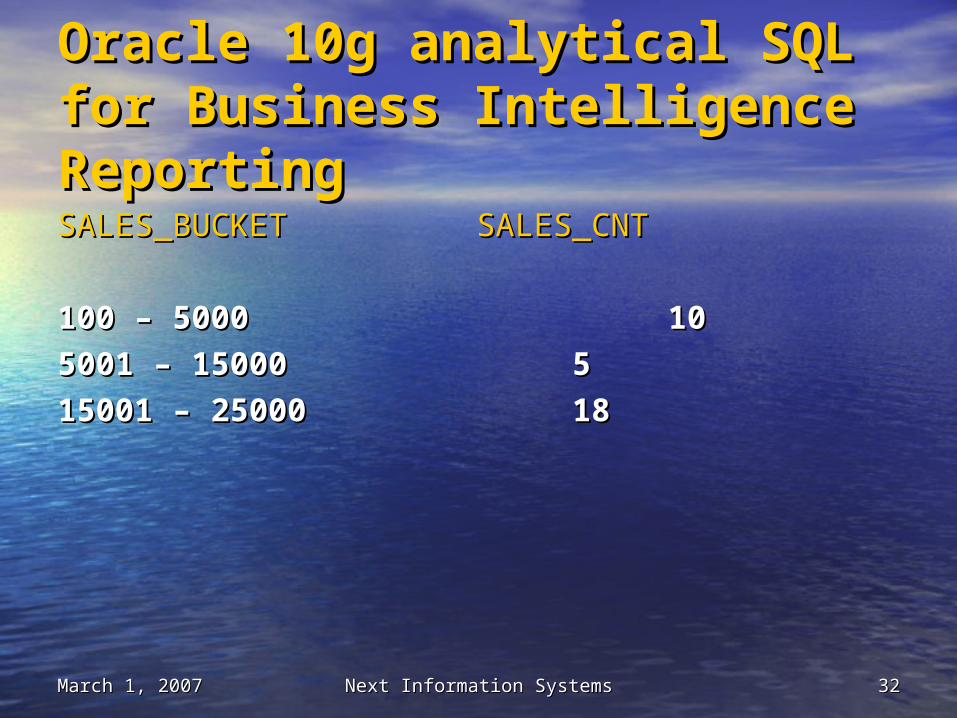
SALES_BUCKETSALES_BUCKET SALES_CNTSALES_CNT
100 – 5000100 – 5000 1010
5001 – 150005001 – 15000 55
15001 – 2500015001 – 25000 1818

March 1, 2007March 1, 2007 Next Information SystemsNext Information Systems 3333
Oracle 10g analytical SQL for Oracle 10g analytical SQL for Business Intelligence ReportingBusiness Intelligence Reporting
Data densificationData densification
Process of converting sparse data into dense form.Process of converting sparse data into dense form.
SELECT ..... FROM table_reference SELECT ..... FROM table_reference PARTITION BY (expr [, expr ]... ) PARTITION BY (expr [, expr ]... ) RIGHT OUTER JOIN table_referenceRIGHT OUTER JOIN table_reference
Partition outer join fills the gaps in time series or Partition outer join fills the gaps in time series or any other dimensions.any other dimensions.
March 1, 2007March 1, 2007 Next Information SystemsNext Information Systems 3434
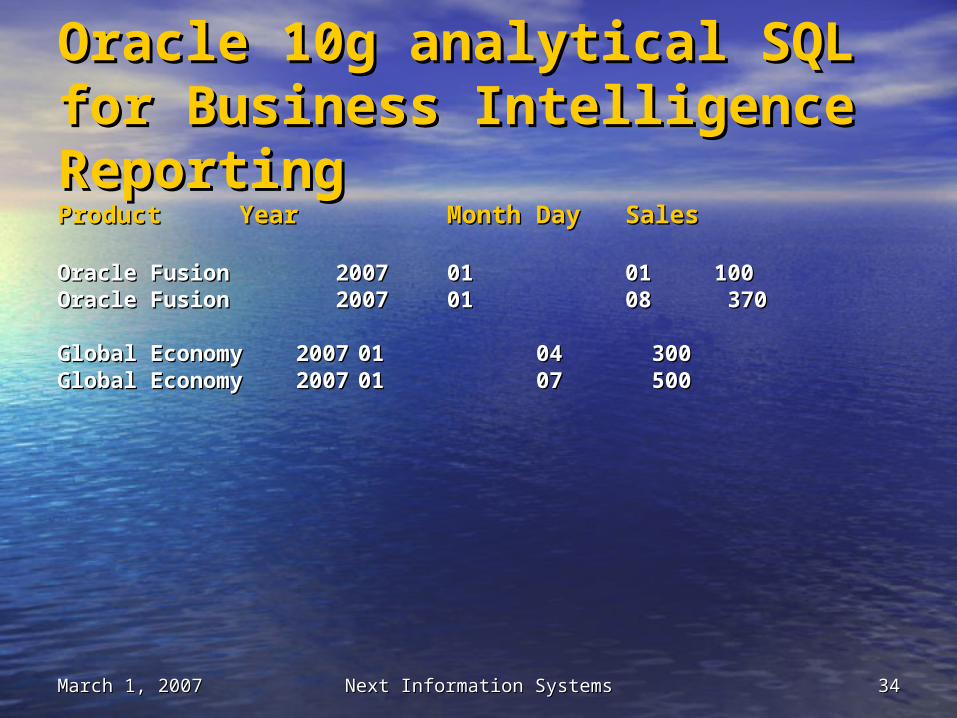
Oracle 10g analytical SQL for Oracle 10g analytical SQL for Business Intelligence ReportingBusiness Intelligence ReportingProductProduct Year Year MonthMonth DayDay
SalesSales
Oracle Fusion 2007Oracle Fusion 2007 0101 0101 100100Oracle Fusion 2007Oracle Fusion 2007 0101 0808 370 370
Global Economy 2007Global Economy 2007 0101 0404 300 300Global Economy 2007Global Economy 2007 0101 0707 500 500

March 1, 2007March 1, 2007 Next Information SystemsNext Information Systems 3535
Oracle 10g analytical SQL for Oracle 10g analytical SQL for Business Intelligence ReportingBusiness Intelligence Reporting
Select product, day, NVL(sales,0) SALES Select product, day, NVL(sales,0) SALES FROMFROM(Select Day, Product, SUM(Sales) Sales(Select Day, Product, SUM(Sales) SalesFROM sales s, f_calendar f, products pFROM sales s, f_calendar f, products pWHERE s.sale_date = f.cal_dateWHERE s.sale_date = f.cal_dateAND s.product_id = p.product_idAND s.product_id = p.product_idAND f.cal_year = ‘2007’ AND f.cal_mnth = ’01’AND f.cal_year = ‘2007’ AND f.cal_mnth = ’01’AND f.day between ’01’ and ’08’AND f.day between ’01’ and ’08’GROUP BY Product, Day) xGROUP BY Product, Day) xPARTITION BY (product)PARTITION BY (product)RIGHT OUTER JOINRIGHT OUTER JOIN(SELECT day FROM f_calendar (SELECT day FROM f_calendar WHERE cal_year = ‘2007’ AND cal_mnth = ’01’ WHERE cal_year = ‘2007’ AND cal_mnth = ’01’ AND day between ’01’ and ’08’) ffAND day between ’01’ and ’08’) ffON (ff.day = x.day))ON (ff.day = x.day))ORDER BY product, dayORDER BY product, day

March 1, 2007March 1, 2007 Next Information SystemsNext Information Systems 3636
Oracle 10g analytical SQL for Oracle 10g analytical SQL for Business Intelligence ReportingBusiness Intelligence ReportingProductProduct DayDay SalesSales
Oracle Fusion Oracle Fusion 0101 100 100Oracle FusionOracle Fusion 0202 0 0Oracle Fusion Oracle Fusion 0303 0 0Oracle Fusion Oracle Fusion 0404 0 0Oracle Fusion Oracle Fusion 0505 0 0Oracle Fusion Oracle Fusion 0606 0 0Oracle Fusion Oracle Fusion 0707 0 0Oracle Fusion Oracle Fusion 0808 370 370Global Economy Global Economy 0101 0 0Global Economy Global Economy 0202 0 0Global Economy Global Economy 0303 0 0Global Economy Global Economy 0404 300 300Global Economy Global Economy 0505 0 0Global Economy Global Economy 0606 0 0Global Economy Global Economy 0707 500 500Global Economy Global Economy 0808 0 0

March 1, 2007March 1, 2007 Next Information SystemsNext Information Systems 3737
Oracle 10g analytical SQL for Oracle 10g analytical SQL for Business Intelligence ReportingBusiness Intelligence ReportingPartition outer join repeating valuePartition outer join repeating value
Inventory table :Inventory table :
Product Product Time_id Time_id QuantityQuantityOracle FusionOracle Fusion 03-Feb-0703-Feb-07 10 10Oracle FusionOracle Fusion 05-Feb-0705-Feb-07 30 30Oracle FusionOracle Fusion 10-Feb-0710-Feb-07 35 35Global EconomyGlobal Economy 03-Feb-0703-Feb-07 45 45Global EconomyGlobal Economy 05-Feb-0705-Feb-07 15 15Global EconomyGlobal Economy 10-Feb-0710-Feb-07 25 25

March 1, 2007March 1, 2007 Next Information SystemsNext Information Systems 3838
Oracle 10g analytical SQL for Oracle 10g analytical SQL for Business Intelligence ReportingBusiness Intelligence Reporting
SELECT PRODUCT,TIME_ID, QUANTITY,SELECT PRODUCT,TIME_ID, QUANTITY,LAST_VALUE (QUANTITY, IGNORE NULLS) LAST_VALUE (QUANTITY, IGNORE NULLS) OVER (PARTITION BY product
ORDER BY time_id ) R_QUANTITY FROM ( SELECT times.time_id, product, quantity FROM inventory PARTITION BY (product) RIGHT OUTER JOIN times ON (times.time_id=inventory.time_id) );

March 1, 2007March 1, 2007 Next Information SystemsNext Information Systems 3939
Oracle 10g analytical SQL for Oracle 10g analytical SQL for Business Intelligence ReportingBusiness Intelligence ReportingProduct Time_id Product Time_id Quantity Quantity
R_QuantityR_QuantityOracle FusionOracle Fusion 03-Feb-0703-Feb-07 10 10 1010Oracle FusionOracle Fusion 04-Feb-0704-Feb-07 1010Oracle FusionOracle Fusion 05-Feb-0705-Feb-07 30 30 3030Oracle FusionOracle Fusion 06-Feb-0706-Feb-07 3030Oracle FusionOracle Fusion 07-Feb-0707-Feb-07 3030Oracle FusionOracle Fusion 08-Feb-0708-Feb-07 3030Oracle FusionOracle Fusion 09-Feb-0709-Feb-07 3030Oracle FusionOracle Fusion 10-Feb-0710-Feb-07 35 35 3535
Global EconomyGlobal Economy 03-Feb-07 03-Feb-07 45 45 4545Global EconomyGlobal Economy 04-Feb-07 04-Feb-07 4545Global EconomyGlobal Economy 05-Feb-07 05-Feb-07 15 15 1515Global EconomyGlobal Economy 06-Feb-07 06-Feb-07 1515Global EconomyGlobal Economy 07-Feb-07 07-Feb-07 1515Global EconomyGlobal Economy 08-Feb-07 08-Feb-07 1515Global EconomyGlobal Economy 09-Feb-07 09-Feb-07 1515Global EconomyGlobal Economy 10-Feb-07 10-Feb-07 25 25 2525

March 1, 2007March 1, 2007 Next Information SystemsNext Information Systems 4040
Oracle 10g analytical SQL for Oracle 10g analytical SQL for Business Intelligence ReportingBusiness Intelligence Reporting
Analytical functions vs conventional techniquesAnalytical functions vs conventional techniques
Cumulative/Moving aggregation – PL/SQL tables, Cumulative/Moving aggregation – PL/SQL tables, permenant/temporary tables.permenant/temporary tables.
Windowing – Multiple sub-queries/views.Windowing – Multiple sub-queries/views.
Densification – Temporary/Permenant Densification – Temporary/Permenant tables. tables.
UNION/UNION ALLUNION/UNION ALLViewsViews
March 1, 2007March 1, 2007 Next Information SystemsNext Information Systems 4141
Oracle 10g analytical SQL for Oracle 10g analytical SQL for Business Intelligence ReportingBusiness Intelligence Reporting
References:References:
http://www.oracle.com/technology/documentation/index.htmlhttp://www.oracle.com/technology/documentation/index.html
http://www.asktom.oracle.comhttp://www.asktom.oracle.com
THANK YOU.THANK YOU.
[email protected]@aol.com