oracle financial services software limited · oracle financial services software – annual report...
TRANSCRIPT

Oracle Financial Services Software LimitedAnnual Report
2012-2013


From the Chairman’s desk
It is my pleasure to report the results for the financial year ended March 31, 2013. In the year under review, on a consolidated basis, our net profit increased by 18 percent to ` 10,751 million. Our focus on innovation and operational excellence has reinforced our leadership in the marketplace, and a growing number of financial services organizations, worldwide, are selecting our products to achieve competitive differentiation, ensure regulatory compliance and deliver personalized service to their customers. In addition, these institutions value the consulting services provided by your Company.
Our strategy has been centered around consolidation of our position in markets where we are already present, and expansion of our addressable market by launching relevant offerings to segments hereto not addressed and opening major markets.
We maintain our focus on key areas of opportunity, including mobile banking, direct banking and Shariah-compliant banking. Your Company intends to stay ahead of competition by making substantial investments to our product suites that address these opportunities. We launched Oracle FLEXCUBE 12.0 earlier this year. The suite now includes in its ken Oracle FLEXCUBE Direct Banking and Private Banking functionality. This synthesized version also enables enhanced mobile banking with iPhone, iPad and Java ME devices.
During the financial year, we reported several marquee deals with Tier One banks, especially in North America, Europe, Middle East and Africa (EMEA) regions, relating to our risk management solutions stack. These are a direct result of the investments we have continued to make in our risk solutions portfolio to keep it at the leading edge.
This year, we announced the availability of Oracle Financial Services Analytical Applications for Customer Insight, a comprehensive solution that enables institutions to gain a 360-degree view of customer relationships across finance, risk management and marketing for extended and actionable insight into customer behavior. To address the specific requirements of complex regulations such as Basel III, Dodd Frank, and Foreign Account Tax Compliance Act (FATCA), we expanded our Enterprise Risk Management suite and the Enterprise Stress Testing & Capital Planning Analytics suite. We also launched the Oracle Financial Services Loan Loss Forecasting & Provisioning System, a new analytical application that helps organizations accurately forecast credit losses and compute loan loss provisions.
Your Company announced general availability of Oracle Banking Platform for banks in September 2012. The new offering already has gained the first two deployments in Asia. Oracle Banking Platform strengthens the portfolio and capability of your Company to address replacements at Tier 1 Retail Banking Institutions in Europe, North America and Asia.
Our track-record, technology assets and investments place us, along with Oracle, in an excellent position to leverage the opportunities that we see ahead of us, providing an application set that is complete and optimized on Oracle Hardware, along with the necessary services.
On behalf of the Board of Directors and the Management of Oracle Financial Services Software, I would like to thank you for your support over the financial year. I look forward to your continued patronage to help us achieve our mission of being the most preferred technology partner of banks across the world.
Regards,
S VenkatachalamChairmanOracle Financial Services Software Limited

Oracle Financial Services Software – Annual Report 2012-2013
This page has been intentionally left blank.

3
Contents
Financials at a Glance 4
Corporate Information 6
Directors’ Report 9
Corporate Governance Report 17
Management’s Discussion and Analysis 33
Consolidated Financials 47
Unconsolidated Financials 79
Notice of Annual General Meeting 117
Attendance Slip & Proxy Form 127
Annual General Meeting
Day and Date : Wednesday, August 14, 2013Time : 3.00 p.m.Venue : The Leela Kempinski
Sahar, Andheri (East)Mumbai 400059

Oracle Financial Services Software – Annual Report 2012-2013
(All figures in ` million except EPS & Book Value)Our 10 years in the industry
2003-04 2004-05 2005-06 2006-07 2007-08 2008-09 2009-10 2010-11 2011-12 2012-13 Operating Revenue 7,881.29 11,385.93 14,823.00 20,609.38 23,802.36 29,276.20 28,739.74 29,969.32 31,466.76 34,739.99 Interest and Other Income (expense) 136.58 259.28 290.54 367.28 631.16 1,763.89 (858.03) 1,668.26 4,217.49 4,595.44 Total Revenue 8,017.87 11,645.21 15,113.54 20,976.66 24,433.52 31,040.09 27,881.71 31,637.58 35,684.25 39,335.43 Total Expenses 5,703.26 8,693.82 12,176.60 16,837.91 19,835.95 22,839.30 18,947.38 19,157.57 21,515.23 23,203.42 EBT 2,314.61 2,951.39 2,936.94 4,138.75 4,597.57 8,200.79 8,934.33 12,480.01 14,169.02 16,132.01 Tax 526.75 627.06 560.41 415.95 441.68 835.36 1,197.69 1,370.12 5,076.29 5,380.58 EAT 1,787.86 2,324.33 2,376.53 3,722.80 4,155.89 7,365.43 7,736.64 11,109.89 9,092.73 10,751.43 EPS 21.27 27.65 28.27 44.28 49.44 87.62 92.03 132.16 108.16 127.89 Book Value 110.97 136.24 164.12 280.95 330.34 416.92 510.27 643.03 751.48 881.03
Note: All EPS and Book Values are computed based on the current equity capital base of 84,065,478 shares as on March 31, 2013.
Key performance indicators 2012-2013
Fiscal year 2012-2013 break up in terms of operating revenue by region, operating revenue by portfolio and expense by category
Financials at a glance
As per Indian GAAP Consolidated results
Operating revenue by portfolio
North America33%
Europe, Middle East, Africa 32%
Asia Pacific35%
Products75%
Services22%
BPO Services3%
Expense by category
Operating revenue by region
Staff cost 74%
Travel cost7%
Professional fees 8%
Facility costs2%
Other expenses 6%
Depreciationand amortization
3%

5
Key metrics 2003-2013
Operating revenue Operating income
Net income Earnings per share
Earnings per share is computed on the equity capital base of 84,065,478 shares as on March 31, 2013.
Book value
Book Value is computed on the equity capital base of 84,065,478 shares as on March 31, 2013.
Number of employees including subsidiaries
... in countriesCustomers serviced
03-04 04-05 05-06 06-07 07-08 08-09 09-10 10-11 11-12 12-13
7,881.29
11,385.93
14,823.00
20,609.38
23,802.36
29,276.20 28,739.7429,969.32
31,466.76
34,739.99
0.00
5,000.00
10,000.00
15,000.00
20,000.00
25,000.00
30,000.00
35,000.00
40,000.00
in `
mill
ion
in `
mill
ion
1,787.86 2,324.33 2,376.53
3,722.80 4,155.89
7,365.437,736.64
11,109.89
9,092.73
10,751.43
0.00
2,000.00
4,000.00
6,000.00
8,000.00
10,000.00
12,000.00
03-04 04-05 05-06 06-07 07-08 08-09 09-10 10-11 11-12 12-13
in `
110.97 136.24164.12
280.95330.34
416.92
510.27
643.03
751.48
881.03
100.00
200.00
300.00
400.00
500.00
600.00
700.00
800.00
900.00
1,000.00
03-04 04-05 05-06 06-07 07-08 08-09 09-10 10-11 11-12 12-130.00
Num
ber o
f cus
tom
ers
480544
642
753814
882922
971 1,028 1,084
0
200
400
600
800
1,000
1,200
03-04 04-05 05-06 06-07 07-08 08-09 09-10 10-11 11-12 12-13
in `
mill
ion
03-04 04-05 05-06 06-07 07-08 08-09 09-10 10-11 11-12 12-13
2,176.002,692.11 2,744.00
3,771.47 3,966.41
7,196.85
9,792.3610,811.75 10,644.85
11,536.57
2,000.00
4,000.00
6,000.00
8,000.00
10,000.00
12,000.00
14,000.00
0.00
in `
21.2727.65 28.27
44.28 49.44
87.6292.03
132.16
108.16
127.89
20.00
40.00
60.00
80.00
100.00
120.00
140.00
03-04 04-05 05-06 06-07 07-08 08-09 09-10 10-11 11-12 12-130.00
Num
ber o
f em
ploy
ees
2,974
4,747
6,858
9,068
11,006 11,38610,451
9,652 9,682 9,969
03-04 04-05 05-06 06-07 07-08 08-09 09-10 10-11 11-12 12-13
12,000
10,000
8,000
6,000
4,000
2,000
0
Cou
ntry
bas
e
108 112123
128133 137 137 139 141 141
0
20
40
60
80
100
120
140
160
03-04 04-05 05-06 06-07 07-08 08-09 09-10 10-11 11-12 12-13
Oracle Financial Services Software – Annual Report 2012-2013
Corporate informationOracle Financial Services Software Limited
Board of Directors
S Venkatachalam, Chairman
Chaitanya Kamat, Managing Director & CEO
Derek H Williams
Harinderjit Singh
Richard Jackson
Robert K Weiler
Samantha Wellington
William Corey West
Y M Kale
Management Team
Abhik Ray
Arvind Gulhati
Atul Kumar Gupta
Bhaskar Jayaraman
Dinesh V Shetty
Don Ganguly
Edwin Niranjan Moses
George Thomas
Girish Chhatpar
H S Teji
Jambu Natarajan P V
K K Davis
Kishore Kapoor
Laura Balachandran
Mahesh Kandavar Rao
Manmath Kulkarni
Manoj Narayan Kulkarni
Meenakshy Iyer
Mini Muralidhar
Nikos Goutsoulas
Parmeet Soin
Rajaram N Vadapandeshwara
Rajendra Potdar
Rajesh Makhija
Ravikumar M
Ravikumar V
S Bhargava
Sanjay Bajaj
Sanjay V Deshpande
Sanjeet Prakash Rao
Surendra Shukla
Suresh Kumar Pinglay
Sivaramakrishnan G
Venkata Subramanian
Venkatesh Srinivasan
Vijay Alexander
Vikram Gupta
Vinayak L Hampihallikar
Company Secretary
Hoshi D Bhagwagar
Chief Financial Officer
Makarand Padalkar
Chief Accounting Officer
Avadhut (Vinay) Ketkar
Auditors
S. R. Batliboi & Associates LLP
Bankers
Bank of India
Canara Bank
Central Bank of Libya
Citibank, N.A.
HDFC Bank Ltd.
Kotak Mahindra Bank Ltd.
J P Morgan Chase
Syndicate Bank
Yes Bank Ltd.
Registrars & Transfer Agents
Link Intime India Private LimitedC-13 Pannalal Silk Mills CompoundL.B.S. Marg, Bhandup (West)Mumbai 400078

7
Registered Office
Oracle Financial Services Software LimitedOracle ParkOff Western Express HighwayGoregaon (East)Mumbai 400063 Maharashtra, India
Offices
Nirlon CompoundOff Western Express HighwayGoregaon (East)Mumbai 400063 Maharashtra, India
Oracle ParkAmbrosiaPune 411021 Maharashtra, India
Embassy Business ParkC.V. Raman NagarBangalore 560093 Karnataka, India
Gopalan Enterprises (I) Pvt. Ltd., (SEZ)Global Axis, Unit 1 & 2Plot # 152, EPIP ZoneWhitefieldBangalore 560066 Karnataka, India
Green I-Tech, # 5Muthiah Mudali StreetOff Cathedral RoadChennai 600086 Tamil Nadu, India
18 Krasnopresnenskaya nab.Block C, 9th floorMoscow 123317, Russia
3rd Floor-Right Wing, Building # 6, Dubai Internet CityP O Box 500053, Dubai, UAE
Subsidiary Offices – India
Oracle (OFSS) ASP Private LimitedOracle ParkOff Western Express HighwayGoregaon (East)Mumbai 400063 Maharashtra, India
Oracle (OFSS) Processing Services LimitedOracle ParkOff Western Express HighwayGoregaon (East)Mumbai 400063 Maharashtra, India
SDF-1, Unit 12SEEPZ - SEZAndheri (East)Mumbai 400096 Maharashtra, India
Block A, NR Enclave, 4th FloorPlot No. 1, EPIP Industrial AreaVillage limits of HoodiKrishnarajapuram HobliWhitefieldBangalore 560066 Karnataka, India
Subsidiary Offices – Asia Pacific
Oracle Financial Services Software (Shanghai) LimitedUnit 806 in Henderson Metropolitan155 Tianjin RoadShanghai, PRC, China 200001
Oracle Financial Services Software Pte. Ltd.27, International Business Park#02-01 iQUEST@IBP BuildingSingapore 609924
Offices
Akasaka Center Building 13F, 1-3-13 Motoakasaka, Minato-ku, Tokyo 107-0051
16F ASEM Tower159-1 Samsung-dong, Kangnam-gu,Seoul, South Korea
Level 4, 4 Julius AvenueNorth RydeSydney, NSW 2113, Australia
Oracle Financial Services Consulting Pte. Ltd.
(subsidiary of Oracle Financial Services Software Pte. Ltd.)27, International Business Park#04-05 iQUEST@IBP BuildingSingapore 609924
Subsidiary Office – Europe
Oracle Financial Services Software B.V.Claude Debussylaan 3214th floor, Vinoly Building1082 MD Amsterdam, The Netherlands
Offices
Mainzer Landstrasse 49a60329 Frankfurt am Main, Germany

Oracle Financial Services Software – Annual Report 2012-2013
Level 29, 40 Bank StreetCanary WharfLondon E14 5NR, UK
Suite 22Portes de la Defense15, boulevard Charles de Gaulle92700 Colombes, France
Molyneux HouseBride Street, Dublin 8Ireland
Oracle Financial Services Software SA14nr Paradeisou Str. & 1nr Patroklou Str. 151 25Marousi, Athens, Greece
Subsidiary Offices – North America
Oracle Financial Services Software America, Inc.Oracle Financial Services Software, Inc. & Mantas Inc.399 Thornall Street, 6th FloorEdison, NJ 08837 USA
Subsidiary Offices – South America
Oracle Financial Services Software Chile LimitadaEdificio 12, Avenida del Valle 537 - 3rd FloorCiudad EmpresarialHuechurabaSantiago, Chile, CP 8580678
Subsidiary Office – Mauritius
ISP Internet (Mauritius) CompanyC/o Cim Global BusinessRogers House5 President John Kennedy StreetPort Louis, Mauritius
Offices
Oracle (OFSS) BPO Services Inc.17901 Von Karman Ave. Suite # 800Irvine, CA 92614 USA
Oracle (OFSS) BPO Services LimitedDLF Infinity Tower A, 3rd FloorDLF Cyber City, Phase IIGurgaon 122002 Haryana, India

9
Directors’ report Financial year 2012-2013
Dear Members,
The Directors present their report on the business and operations of your Company along with the Annual Report and audited financial statements for the financial year 2012-2013.
Financial highlights
As per Indian GAAP Consolidated financial statements:(Amounts in ` million)
Particulars Year endedMarch 31, 2013
Year endedMarch 31, 2012
Revenue from operations 34,739.99 31,466.76Other income, net 4,595.44 4,217.49Total income 39,335.43 35,684.25Depreciation and amortization (655.02) (466.17)Profit before exceptional item and tax 16,132.01 14,862.34Exceptional item – (693.32)Profit before tax 16,132.01 14,169.02Tax expenses (5,380.58) (5,076.29)Profit for the year 10,751.43 9,092.73
As per Indian GAAP Unconsolidated financial statements:(Amounts in ` million)
Particulars Year endedMarch 31, 2013
Year endedMarch 31, 2012
Revenue from operations 29,377.01 26,058.54Other income, net 4,403.20 3,750.34Total income 33,780.21 29,808.88Depreciation and amortization (586.08) (401.19)Profit before exceptional items and tax 15,047.60 13,243.95Exceptional items, net – 2,414.98Profit before tax 15,047.60 15,658.93Tax expenses (4,755.00) (4,766.60)Profit for the year 10,292.60 10,892.33
PerformanceOn consolidated basis, your Company’s revenue, stood at ` 34,740 million this year, an increase of 10% from ` 31,467 million as compared to the previous financial year. The net income increased to ` 10,751 million this year, an increase of 18%.On an unconsolidated basis, your Company’s revenue grew to ` 29,377 million during the financial year 2012-2013 from` 26,058 million last year. This represents a growth of 13%. The Company’s profit for the financial year 2012-2013 has decreased to` 10,293 million, a decrease of 5.5% over the previous financial year.
A detailed analysis of the financials is given in the Management’s discussion and analysis report that forms a part of this Directors’ report.
Dividend The Board has decided to conserve the funds of the Company for organic and inorganic growth opportunities. Accordingly, the Board has decided not to declare a dividend for the financial year 2012-2013.
Transfer to reserves The Company does not propose to transfer any amount to the General Reserve out of the amount available for appropriation. An amount of ` 52,548.64 million is proposed to be retained in the Profit & Loss Account.
Share capital During the year, the Company allotted 91,721 equity shares of face value of ` 5/- each to its eligible employees, who exercised their options under the prevailing Employee Stock Option Schemes of the Company. As a result, as on March 31, 2013, the paid-up equity share capital of the Company was ` 420,327,390/- divided into 84,065,478 equity shares of face value of ` 5/- each.

Oracle Financial Services Software – Annual Report 2012-2013
Oracle’s holding in the Company
As on March 31, 2013, Oracle Global (Mauritius) Limited, the Promoter held 67,481,698 equity shares constituting 80.27% of the equity capital of the Company.
With reference to SEBI Guidelines including Clause 40A of the Listing Agreement on Minimum Public Shareholding of 25%, Oracle Global (Mauritius) Ltd. (“OGML”), the Promoter of the Company, had come out with an “Offer for Sale through the Stock Exchange Mechanism” on May 22, 2013 for reducing its holding from 80.27% to 75% as required. Pursuant to the said offer for sale, the shareholding of OGML as on May 24, 2013 was reduced to 75%. The current shareholding of OGML is 74.99% and the Company is in compliance with the SEBI Guidelines including Clause 40A of the Listing Agreement which requires a Minimum Public Shareholding of 25% of the paid-up capital.
Directors
Mr. Derek H Williams and Mr. Chaitanya Kamat, Directors of the Company, retire by rotation at the ensuing Annual General Meeting and being eligible, offer themselves for re-appointment.
The Board appointed Mr. Richard Jackson, Ms. Samantha Wellington and Mr. Harinderjit Singh as Additional Directors with effect from December 12, 2012, April 10, 2013 and July 10, 2013 respectively. They hold office up to the date of the ensuing Annual General Meeting. The Company has received Notices in writing from Members, pursuant to Section 257 of the Companies Act, 1956, proposing the candidature of Mr. Richard Jackson, Ms. Samantha Wellington and Mr. Harinderjit Singh for the office of a Director.
As stipulated under Clause 49 of the Listing Agreement entered into with the stock exchanges, brief resumes of the Directors proposed to be appointed/re-appointed, the nature of their expertise in specific functional areas and the names of companies in which they hold directorships and membership/chairmanship of Board Committees, etc. are provided in the Notice and/or Report on Corporate Governance forming a part of the Annual Report.
The Board recommends to the Members the resolutions for re-appointment of Mr. Derek H Williams and Mr. Chaitanya Kamat as Directors of the Company. The Board also recommends the appointment of Mr. Richard Jackson, Ms. Samantha Wellington and Mr. Harinderjit Singh as Directors.
Mr. William T Comfort, Jr., resigned as a Director and Chairman of the Company with effect from May 11, 2012. The Board appointed Mr. S Venkatachalam as the Chairman of the Board with effect from May 12, 2012. Mr. Frank Brienzi resigned as a Director of the Company with effect from July 2, 2013. The Board placed on record its appreciation of the services rendered by Mr. William T Comfort, Jr., and Mr. Frank Brienzi during their tenure as Directors of the Company.
Infrastructure
The Company maintains optimal infrastructure for its operations. The Company made significant addition to the communication infrastructure in the year to facilitate remote working and team collaboration.
Global alliances
Your Company furthered its commitment to expand its footprint through partners. In order to provide a specific focus, a dedicated group for consulting partners was established. This group nurtures a robust partner ecosystem and develops strategic partners with sound delivery capabilities in the consulting services around the products.
Specific programs have been designed to build the capability of the partners to deliver high quality implementation services. The programs support partners and end-customers through all stages; from identifying the right solution for the customers’ needs, progressing through the various stages of implementation cycle, and even after go-live.
Subsidiaries
Your Company has subsidiaries in Greece, India, Republic of Chile, Republic of China, Republic of Mauritius, Singapore, The Netherlands and USA for sales and marketing and customer support in these regions.
The Ministry of Corporate Affairs has issued a General Circular No.: 2/2011 dated February 8, 2011 granting a general exemption to the companies stating that the provisions of Section 212 of the Companies Act, 1956 (“Act”) shall not apply in relation to subsidiaries of companies subject to the company fulfilling certain conditions stated in the said circular. The Company is in compliance with the conditions stipulated by the Ministry of Corporate Affairs. Therefore, the accounts and related reports of the subsidiary companies are not attached to the Annual Report of the Company for the year ended March 31, 2013. The Company will make available the accounts and related information of the subsidiary companies upon request by any member/investor of the Company or its subsidiaries. Further, the accounts and related information of the subsidiary companies will be kept open for inspection by any Member, at the registered office of the Company and at the registered office of the subsidiaries during office hours of the Company/subsidiaries and the same will also be made available on the website of the Company www.oracle.com/financialservices.

11
Fixed deposits
During the financial year 2012-2013, the Company has not accepted any fixed deposits within the meaning of Section 58A of the Companies Act, 1956, and as such, no amount of principal or interest was outstanding as of the date of the Balance Sheet.
Corporate governance
The Company has taken appropriate steps and measures to comply with all the corporate governance and related requirements as envisaged under Clause 49 of the Listing Agreement entered with stock exchanges and Section 292A of the Companies Act, 1956, except that there was a delay of 34 days beyond the specified time limit provided under clause 49(I)(C)(iv) in appointing a new Independent Director on the Board, after the resignation of an existing Independent Director.
Your Company has constituted five committees consisting of Board Members and other senior officials of the Company,namely, Audit Committee, Compensation Committee, ESOP Allotment Committee, Transfer Committee and Shareholders’ Grievances Committee. There is a separate report on Corporate Governance which forms a part of this Annual Report. A certificate of Statutory Auditors, M/s. S. R. Batliboi & Associates LLP, Chartered Accountants, with regard to compliance of conditions ofCorporate Governance as stipulated in Clause 49 of the Listing Agreement is annexed herewith. The Company is alsosupporting the Go Green initiative announced by the Ministry of Corporate Affairs allowing paperless compliance.
A certificate from the Managing Director & CEO and Chief Financial Officer of the Company confirming internalcontrols and checks pertaining to financial statements, as also declaring that all Board Members and senior managerial personnelhave affirmed compliance with the Code of Ethics and Business Conduct for the financial year ended March 31, 2013, was placed before the Board of Directors and the Board has noted the same. The said certificate is annexed to the Directors’ report.
A list of the committees of the Board, names of their Members, scope and other related information are detailed in the Corporate Governance Report.
Business Responsibility Report
Securities and Exchange Board of India (SEBI) through circular dated August 13, 2012, has mandated the inclusion of Business Responsibility Report (“BR Report”) as part of the Annual Report for the top 100 listed entities based on their market capitalization on BSE Limited and National Stock Exchange of India Limited as at March 31, 2012. The SEBI circular is effective from financial year ending on or after December 31, 2012. In line with the press release and FAQ’s dated May 10, 2013 issued by SEBI, the BR Report which forms part of this Annual Report has been hosted on the Company’s website www.oracle.com/financialservices. Members who wish to obtain a printed copy of the report, may write to the Company Secretary at the Registered Office of the Company.
Employee Stock Option Plan (‘ESOP’)
The Members at their Annual General Meeting held on August 14, 2001 approved grant of ESOPs to the employees/directors of the Company and its subsidiaries up to 7.5% of the issued and paid-up capital of the Company from time to time. This said limit was enhanced and approved up to 12.5% of the issued and paid-up capital of the Company from time to time, by the Members at their Annual General Meeting held on August 18, 2011. This extended limit is an all inclusive limit applicable for stock options granted in the past and in force and those that will be granted by the Company under this authorization.
Pursuant to ESOP scheme approved by the Members of the Company on August 14, 2001, the Board of Directors, on March 4, 2002 approved the Employees Stock Option Scheme (“Scheme 2002”) for issue of 4,753,600 options to the employees and directors of the Company and its subsidiaries. According to the Scheme 2002, the Company has granted 4,548,920 options prior to the IPO and 619,000 options at various dates after IPO (including the grants of options out of options forfeited earlier).
On August 25, 2010, the Board of Directors approved the Employees Stock Option Plan 2010 Scheme (“Scheme 2010”) for issue of 618,000 options to the employees and directors of the Company and its subsidiaries. According to the Scheme 2010, the Company has granted 638,000 options (including the grants of options out of options forfeited earlier).
Pursuant to ESOP scheme approved by the Members of the Company in their meeting held on August 18, 2011, the Board of Directors approved the Employees Stock Option Plan 2011 Scheme (“Scheme 2011”) for issue of 5,100,000 options to the employees and directors of the Company and its subsidiaries. According to the Scheme 2011, the Company has granted 1,285,500 options till March 31, 2013.
As per the above schemes, each of 20% of the total options granted will vest to the eligible employees and directors on completion of 12, 24, 36, 48 and 60 months from the date of grant and is subject to continued employment of the employee or directorship of the director with the Company or its subsidiaries. Options have exercise period of 10 years from the date of grant. The employee/director pays the exercise price upon exercise of option.

Oracle Financial Services Software – Annual Report 2012-2013
The details of the options granted under the ESOP 2002, ESOP 2010 and ESOP 2011 Schemes to eligible employees/directors from time to time are given below:
Particulars Scheme TotalESOP 2002 ESOP 2010 ESOP 2011
Number of options granted till March 31, 2013 5,167,920 638,000 1,285,500 7,091,420 Number of options lapsed* 614,725 245,883 89,950 950,558 Number of options exercised 4,439,915 36,254 24,215 4,500,384 Total number of options in force as on March 31, 2013 113,280 355,863 1,171,335 1,640,478 Pricing Formula At the market price as on the date of grantVariation of terms of options None None None
* includes number of options forfeited.
The details of options granted to Directors and Senior Managerial Personnel under ESOP 2011 Scheme during the financial year ended March 31, 2013 are as follows:
Particulars Number of Optionsi. Directors:
Mr. Chaitanya Kamat 100,000
Senior Managerial Personnel:Mr. Atul Kumar Gupta 7,500Mr. Avadhut Ketkar 3,000Mr. Edwin N Moses 15,000Mr. Hoshi D Bhagwagar 1,000Mr. Kishore Kapoor 12,500Mr. Makarand Padalkar 40,000Mr. Manmath Kulkarni 17,250Mr. Vikram Gupta 20,000
ii. Any other employee, who receives grant in any one year of option amounting to 5% or more of option granted during the year
Mr. Chaitanya Kamat 100,000Mr. Makarand Padalkar 40,000
iii. Identified employees who were granted option, during any one year, equal to or exceeding 1% of the issued capital (excluding outstanding warrants and conversions) of the Company at the time of grant
Nil
iv. Diluted Earnings Per Share (EPS) pursuant to the issue of shares on exercise of option calculated in accordance with Accounting Standard 20 ‘Earnings Per Share’ issued by the Institute of Chartered Accountants of India
` 121.96
Had compensation cost for the Company’s ESOP been determined based on fair value at the grant dates, Company’s net profit and earnings per share would have been reduced to proforma amounts indicated below:
(Amounts in ` million, except per share data)Particulars Year ended March 31, 2013
Profit as reported 10,292.60Add: Employee stock compensation under intrinsic value method NilLess: Employee stock compensation under fair value method (385.97)
Proforma profit 9,906.63
Earnings Per ShareBasic
As reported 122.52Proforma 117.93
DilutedAs reported 121.96Proforma 117.59
All stock options under the Employee Stock Option Plans were granted at market price on the date of grant. Accordingly, we have calculated the compensation cost arising on account of stock options granted using the intrinsic value method. Hence, the disclosure in terms of Clause 12.1(n) of the Securities and Exchange Board of India (Employee Stock Option Scheme and Employee Stock Purchase Scheme) Guidelines, 1999, is not applicable.

13
A summary of the activities in the Company’s ESOP 2002, ESOP 2010 and ESOP 2011 Schemes are as follows:
Particulars Year ended March 31, 2013ESOP 2002 ESOP 2010 ESOP 2011
Shares arising from options
Weighted average
exercise price (`)
Shares arising from options
Weighted average
exercise price (`)
Shares arising from options
Weighted average
exercise price (`)
Outstanding at beginning of year 145,212 1,721 428,344 2,064 617,500 1,937Granted – – – – 645,000 3,131Exercised (31,932) 1,290 (35,574) 2,050 (24,215) 1,964Forfeited – – (36,907) 2,050 (66,950) 1,984Outstanding at end of the year 113,280 1,843 355,863 2,066 1,171,335 2,591
Vested options 77,280 121,853 88,935 Unvested options 36,000 234,010 1,082,400
The weighted average share price for the year over which stock options were exercised was ` 2,859. Money realized by exercise of options during the financial year 2012-2013 was ` 161,669,419.
The details of options unvested and options vested and exercisable as on March 31, 2013 are as follows:
Exercise price(`)
Number of options Weighted average exercise price
(`)
Weighted average remaining contractual
life (Years)Options unvested 1,930 408,400 1,930 8.7
2,032 32,000 2,032 8.72,050 218,010 2,050 7.42,333 36,000 2,333 7.62,342 16,000 2,342 8.33,127 627,000 3,127 9.93,320 15,000 3,320 9.8
Options vested and exercisable 1,291 53,280 1,291 3.11,930 88,935 1,930 8.72,050 117,853 2,050 7.42,333 24,000 2,333 7.62,342 4,000 2,342 8.3
1,640,478 2,426 8.7
The fair value of stock options granted during the financial year 2012-2013 under ESOP 2011 Scheme was ` 1,912 (granted on January 14, 2013) and ` 1,762 (granted on February 5, 2013), calculated as per the Black Scholes valuation model as stated in 24b in the notes to accounts.
The Company has recovered Perquisite Tax on the options exercised by the employees during the year.
Employee Stock Purchase Scheme (‘ESPS’)
The Company has the ESPS administered through a Trust (“the Trust”) to provide equity based incentives to key employees of the Company. As per the scheme, the Trust can purchase shares of the Company from market using the proceeds of loans obtained from the Company. Such shares are allocated by the Trust to nominated employees at an exercise price, which approximates the fair value on the date of the grant. The shares vest in the employees over a period of five years and the employees can purchase the shares from the Trust over a period of ten years based on continued employment, until which, the Trust holds the shares for the benefit of the employees. The employees are entitled to receive dividends, bonus, etc., that may be declared by the Company from time to time for the entire portion of shares held by the Trust on behalf of the employees.
On the acceptance of the offer, the selected employee undertakes to purchase the shares from the Trust within ten years from the date of acceptance of the offer. In case an employee resigns from employment, the rights relating to vested shares, which are eligible for exercise, may be purchased by the employee by payment of the exercise price whereas, the balance shares are forfeited in favor of the Trust. The Trustees have the right of recourse against the employees for any amounts that may remain unpaid on the shares accepted by them. As of the balance sheet date, the Trust has repaid the entire loan obtained from the Company on receipt of payments from employees against shares exercised.

Oracle Financial Services Software – Annual Report 2012-2013
A summary of the activities in the Company’s ESPS is as follows:
(Number of shares)Particulars Year ended Year ended
March 31, 2013 March 31, 2012Opening balance of unallocated shares 166,142 166,142Shares forfeited during the year – –Closing balance of unallocated shares 166,142 166,142
Opening balance of allocated shares 18,817 29,081Shares exercised during the year (16,067) (10,264)Shares forfeited during the year – –Closing balance of allocated shares 2,750 18,817
Shares eligible for exercise 2,750 18,817Shares not eligible for exercise – –Total allocated shares 2,750 18,817
Human resources
Employees are our key assets and we continuously invest in them to retain our competitive edge. We have created a healthy and productive environment, together with a strong performance management system to encourage excellence. Our HR practices are among the best in the industry. Our people development initiative offers the best and latest in technology, finance domain and develops contemporary leadership attitude and practices in our employees.
Our total manpower at the end of March 2013 was 9,969 as compared to 9,682 as on March 2012 (including employees of subsidiaries).
Directors’ responsibility statementAs required under Section 217(2AA) of the Companies Act, 1956, for the financial year ended on March 31, 2013, the Directors hereby confirm that:i. In preparation of the annual accounts, the applicable accounting standards have been followed along with proper explanation
relating to material departures;ii. The Directors have selected such accounting policies and applied them consistently and made judgments and estimates that are
reasonable and prudent so as to give a true and fair view of the state of affairs of the Company at the end of the financial year and of the profit of the Company for that period;
iii. The Directors have taken proper and sufficient care for the maintenance of adequate accounting records in accordance with the provisions of this Act for safeguarding the assets of the Company and for preventing and detecting fraud and other irregularities; and
iv. The Directors have prepared the annual accounts on a ‘going concern’ basis.
Auditors
The Members may note that, S.R. Batliboi & Associates, Chartered Accountants (Registration no. 101049W), were appointed as the Statutory Auditors of the Company by the Members at their Twenty Third Annual General Meeting held on August 17, 2012 to hold office till the conclusion of the ensuing Annual General Meeting. They have vide letter dated April 1, 2013 intimated the Company about the change in their name pursuant to their conversion as a Limited Liability Partnership. Consequently, their name is changed from “S.R. Batliboi & Associates” to “S.R. Batliboi & Associates LLP” with effect from April 1, 2013. This change of name does not affect their rights and obligations as the Statutory Auditors of the Company. Further, they have confirmed their eligibility and willingness to accept office, if appointed as the Statutory Auditors at the ensuing Annual General Meeting.
Auditors’ ReportWith regard to the Auditors’ comment in the CARO report concerning delays in payment of a few tax payments, e.g., Foreign Income Taxes, Foreign Value Added Tax and Foreign Withholding Tax, the Company would like to state the following:i. The Company has engaged international tax experts in the interpretation of laws and regulations relating to corporate taxes
and VAT in foreign countries. The Company has however, been continuously evaluating and accruing towards any material tax exposures in the books taking a conservative approach and payments are made based on the advice of the tax experts.
ii. The Company continually assesses Payroll Tax implications in various jurisdictions outside India on salaries and travel related reimbursements paid to its employees posted therein and accordingly makes accruals in the books. The Company is in the process of filing the returns for Payroll Tax in such jurisdiction for which the provision is already made in the books. As per the local laws of most host countries, the tax is payable by the employee, however in a few countries tax payment is a responsibility of the employer, which amounts to ` 3.94 crore. The Company and the employees ensure tax compliance in such countries as advised by the tax consultants.

15
Conservation of energy, technology absorption and foreign exchange earnings and outgo
The particulars as prescribed under sub-section (1)(e) of Section 217 of the Companies Act, 1956 read with Companies (Disclosure of Particulars in the Report of Board of Directors) Rules, 1988, the relevant data pertaining to conservation of energy, technology absorption and foreign exchange earnings and outgo are furnished hereunder:
i. Conservation of energy and technology absorption:
The Company regularly strives to utilize newer technologies with the view to conserve the energy and create an environmentally friendly work environment. The initiatives taken by the Company are summarized below:
Data Center Consolidation: During the year, we consolidated and modernized our data centers. This has brought about significant business benefits such as space and power conservation, strengthened IT Security architecture and a reduced network complexity.
Disaster recovery: A significant technology overhaul for the backup and restoration technology was undertaken during the year. This has significantly reduced the backup media requirement for a greener work environment. This eventually leads to cost benefits due to decrease in efforts, lesser number of tapes required for the same back up, longer tape life, as well as lower probability of human error.
VOIP: During the year, we carried out a complete upgrade of the communication infrastructure with the objective to provide a seamless multi-channel communication to all our employees. The new infrastructure supports a mobile office that enables employees to work flexibly out of any location. This initiate has resulted in significant direct as well as indirect cost benefits to the business. This has also been beneficial in reducing carbon footprint by reducing the travel cost.
Virtualization: Virtualization has been further ingrained into the OFSS IT architecture, wherein the OFSS computing environment is almost completely virtualized. This has lead to better performance, better utilization of resources (i.e., space and power), increased operating efficiencies and leads to a greener work environment.
Asset disposal: Disposal of End of Life equipment has been centralized and standardized uniformly across the Company and follows the best global practices. Secure means of disposal have been adopted which helps secure e-waste as per the government guidelines as well as ensures complete cleansing of any kind of confidential information.
Technology advancements supplemented by enhanced operating efficiencies result in synchronized benefits to the organization, blending in cost efficiency along with environment sustenance.
ii. Foreign exchange earnings and outgo:
(Amounts in ` million)Foreign Exchange Earnings 28,094.87(excluding reimbursement of travelling expenses)Foreign Exchange Outgo 8,533.71(including capital goods & other expenditure)
Activities relating to exports; initiatives taken to increase exports; development of new export markets for products and services; and export plans:
Your Company has established an extensive global presence across leading markets through its sales and marketing network. We will continue to focus on tapping various potential markets available globally. Experienced sales and marketing specialists focus on building strong international business presence to develop new export markets for your Company.
Prospects
The prolonged period of slower growth in the global economy has impacted banking operations. Banks are coping and realigning to earn, sustain and grow their businesses. The increasing influence of new consumer and banking regulations in the past 24 months across countries continues to add to the existing challenges banks face.
Oracle is simplifying IT by engineering hardware and software to work together-from servers and storage to the database and middleware to applications. The idea behind Oracle’s integrated technology stack is that the whole is greater than the sum of the parts. There are best-of-breed products throughout the stack, and every product and every layer of the technology stack are designed and engineered to work together. That’s not all. Integrated solutions engineered for specific industries make delivering IT simpler. In the past years, your Company invested to build the Oracle Banking Platform to leverage this vision. The general availability of Oracle Banking Platform for banks to deploy was announced in September 2012. The new offering already has gained the first two deployments in Asia. Oracle Banking Platform strengthens the portfolio and capability of your Company to address replacements at Tier 1 Retail Banking Institutions in Europe, North America and Asia.
Your Company in the last fiscal year stayed focused to deliver solutions to banks in countries that faced significant challenges. The Oracle Financial Analytical Applications Suite has helped your Company deliver and engage in multi-year transformation projects at Tier 1 banks. The application suite now supports new regulations for FATCA, Capital Adequacy and Stress Testing. Your Company along with Oracle is well placed to address the opportunity at banks by providing the application that is complete and optimized on Oracle Hardware along with the necessary services.

Oracle Financial Services Software – Annual Report 2012-2013
Your Company announced the availability of Oracle FLEXCUBE 12.0 during the year. This release enables more personalized and convenient service to customers across all channels. It also offers a harmonized infrastructure and open development environment that allows more flexible deployment options and upgrade paths. With this release, your Company made a strategic shift including new versions Oracle FLEXCUBE Private Banking and Oracle FLEXCUBE Direct Banking along with Oracle FLEXCUBE 12.0. The past year we did see an increasing number of partners who have invested to train, certify and provide services around Oracle FLEXCUBE 12.0 to banks that deploy. Oracle FLEXCUBE customers have leveraged the extreme performance on Oracle Exadata and Oracle Exalogic for their operations.
Your Company’s products continue to win accolades from the international analyst community for its leadership and execution capability. Banking Technology named Oracle FLEXCUBE the Best Core Banking Product for 2012. Banks who have deployed your Company’s products have won the recognition too. EcoBank won the Euromoney Award for the Best Bank in Africa. Mashreq Bank’s FLEXCUBE deployment won the Asian Banker Technology Award for the Best Core Banking Implementation in the Middle East.
Consulting Services provided by your Company are very valued by the banks. This continues to play a key and vital role in your Company’s annual revenue and profitability each year. Support services for our applications continue to grow and banks see this service as vital for operations at their banks.
Employee particulars
Information as per Section 217(2A) of the Companies Act, 1956, read with the Companies (Particulars of Employees) Rules, 1975 for the financial year ended on March 31, 2013 forms part of this Report. As per the provisions of Section 219(1)(b)(iv) of the Act, the Directors’ Report and the Accounts are being sent to the Members excluding the statement giving particulars of employees under Section 217(2A) of the Act.
Members who wish to obtain a copy of the statement, may write to the Company Secretary at the Registered Office of the Company.
Acknowledgements
Your Directors take this opportunity to thank the Company’s customers, members, vendors and bankers for their continued support during the year. Your Directors also wish to thank the Government of India and its various agencies, Department of Electronics, the Software Technology Parks - Bangalore, Chennai, Mumbai, NOIDA and Pune, Special Economic Zone authorities at SEEPZ and Cochin, the Customs and Excise Department, Ministry of Commerce, Ministry of Finance, Ministry of External Affairs, Ministry of Corporate Affairs, Department of Telecommunication, the Reserve Bank of India, the State Governments of Maharashtra, Karnataka, Haryana and Tamil Nadu and other local Government Bodies, for their support and look forward to their continued support in the future.
Your Directors also place on record their appreciation for the excellent contribution made by employees of the Company through their commitment, competence, co-operation and diligence with a view to achieving consistent growth for the Company.
For and on behalf of the Board
S VenkatachalamChairman
July 11, 2013

17
Corporate governance report
The detailed report on Corporate Governance of Oracle Financial Services Software Limited (“the Company”) for the financial year 2012-2013 as per Clause 49 of the Listing Agreement entered with Stock Exchanges is set out below.
1. Company’s philosophy on code of governance
The Company believes in adopting and adhering to globally recognized corporate governance practices and continuously benchmarking itself against such practices. The Company understands and respects its fiduciary role and responsibility to its Members and strives to meet their expectations.
2. Board of Directors
2.1 Composition and category
The composition of the Board of Directors of the Company (“the Board”) as on March 31, 2013, was as under:
Name of the Director Designation Category Directorshipsin other
Companies
Chairmanship of Committees
of Boards of other
Companies
Membership of Committees of
Boards of other Companies
Mr. S Venkatachalam Chairman Non-Executive,Independent Director
3 2 Nil
Mr. Chaitanya Kamat Managing Director & CEO
Executive, Non-Independent Director
Nil Nil Nil
Mr. Derek H Williams Director Non-Executive, Non-Independent Director
1 1 Nil
Mr. Frank Brienzi Director Non-Executive, Non-Independent Director
2 Nil Nil
Mr. Richard Jackson Director Non-Executive,Independent Director
Nil Nil Nil
Mr. Robert K Weiler Director Non-Executive, Non-Independent Director
Nil Nil Nil
Mr. William Corey West Director Non-Executive, Non-Independent Director
18 Nil Nil
Mr. Y M Kale Director Non-Executive,Independent Director
5 Nil 1
Notes:1. Mr. William T Comfort, Jr., resigned as a Director and the Chairman of the Board with effect from May 11, 2012.2. Mr. S Venkatachalam was appointed as the Chairman of the Board with effect from May 12, 2012.3. Mr. Richard Jackson was appointed as an Additional Director with effect from December 12, 2012.4. Directorships of Mr. Y M Kale include being an Alternate Director in three companies.5. Only the Audit Committee and the Shareholders’ Grievances Committee are considered.6. All Directorships of Mr. Frank Brienzi, Mr. William Corey West and Mr. Derek H Williams are in foreign companies. 7. None of the Directors are related inter se.8. Changes in the Board after March 31, 2013: • Ms. Samantha Wellington was appointed as an Additional Director with effect from April 10, 2013. • Mr. Frank Brienzi resigned as a Director with effect from July 2, 2013. • Mr. Harinderjit Singh was appointed as an Additional Director with effect from July 10, 2013.
2.2 Attendance of each Director at the Board Meetings and the last Annual General Meeting
The Company holds Board Meetings at regular intervals. The detailed agenda along with the explanatory notes is circulated in advance. The Directors can suggest inclusion of any item to the agenda at the Board Meeting. The Independent Directors actively participate in the Board Meetings and contribute to the decision making process by expressing their opinions, views and suggestions.During the Financial Year 2012-2013, six Board Meetings were held on the following dates:May 11, 2012, July 10, 2012, August 2, 2012, August 17, 2012, October 31, 2012 and January 29, 2013.

Oracle Financial Services Software – Annual Report 2012-2013
The attendance of the Directors at the Board Meetings and the Annual General Meeting held during the financial year 2012-2013 was as under:
Name of the Director Number of Board Meetings attended
Number of Board Meetings attended Last AGMattended
In person On phone
Mr. William T Comfort, Jr.* 1 – 1 NAMr. Chaitanya Kamat 6 6 – YesMr. Derek H Williams 5 2 3 YesMr. Frank Brienzi 3 – 3 NoMr. Richard Jackson 1 – 1 NAMr. Robert K Weiler 5 – 5 NoMr. S Venkatachalam 6 6 – YesMr. William Corey West 4 – 4 NoMr. Y M Kale 6 6 – Yes
* resigned with effect from May 11, 2012.
2.3 Details of other directorships
Details of the directorships of the Company’s Directors in other companies as on March 31, 2013 were as under:
Name of the Director Other directorships
Mr. S Venkatachalam State Bank of India Equifax Credit Information Services Private LimitedCanara Robecco Asset Management Company Limited
Mr. Chaitanya Kamat –
Mr. Derek H Williams Nihon Oracle Kabushiki Kaisha
Mr. Frank Brienzi NPower, TexasAidmatrix
Mr. Richard Jackson –
Mr. Robert K Weiler –
Mr. William Corey West BEA Crossgain InternationalEontec LimitedJ.D. Edwards Europe LimitedNetsure Telecom LimitedOCAPAC Distributor PartnerOCAPAC Hardware PartnerOCAPAC Holding CompanyOCAPAC Research CompanyOCAPAC Research PartnerOracle Australia Holdings Pty. Ltd.Oracle Consolidation Australia Pty. Ltd.Oracle Global (Mauritius) Ltd.Oracle Hong Kong Holdings LimitedOracle Singapore Holdings Pte Ltd.Oracle Technology CompanyPillar Data Systems NRI Ltd.Siebel Systems Ireland Holding Ltd.Sun Microsystems Technology Limited
Mr. Y M Kale Ashok Leyland Limited (Alternate Director)Gulf Oil Marine Limited Hinduja Foundries Limited (Alternate Director)IndusInd Bank Limited (Alternate Director)Hinduja Leyland Finance Limited

19
2.4 Details of Memberships of Board Committees
None of the Directors of the Company hold Memberships in more than ten Committees, nor is any Director a Chairman in more than five Committees of the Boards of the companies where he holds directorships. For this purpose, “Committees” include Audit Committee and Shareholders’ Grievances Committee of a company.
The details of the Memberships of the Company’s Directors in the above mentioned committees of all the Indian Public Limited Companies (including the Company) of which they are Members as on March 31, 2013 were as under:
Name of the Director Audit Committee Shareholders’ Grievances CommitteeChairman Member Chairman Member
Mr. S Venkatachalam 1 1 2 –Mr. Chaitanya Kamat – – – –Mr. Derek H Williams – – – –Mr. Frank Brienzi – – – –Mr. Richard Jackson – – – –Mr. Robert K Weiler – – – –Mr. William Corey West – 1 – –Mr. Y M Kale 1 1 – –
3. Audit committee
3.1 Primary objectives and powers of the Audit Committee
The primary objective of Audit Committee is to monitor and provide effective supervision of the management’s financial reporting process and to ensure accurate, timely and proper disclosures and transparency, integrity and quality of financial reporting.
The powers of the Audit Committee include the following:
1. To investigate any activity within its terms of reference.
2. To seek information from any employee.
3. To obtain external legal or other professional advice.
4. To secure attendance of outsiders with relevant expertise, if considered necessary.
3.2 Broad terms of reference
The terms of reference of the Audit Committee are as follows:
1. Oversight of the Company’s financial reporting process and the disclosure of its financial information to ensure that the financial statements are correct, sufficient and credible.
2. Recommending to the Board, the appointment, re-appointment and, if required, the replacement or removal of the statutory auditor and their audit fees.
3. Approval of fees for any other services rendered by the statutory auditors.
4. Reviewing, with the management, the annual financial statements before submission to the Board for approval, with particular reference to:
a. Matters required to be included in the Director’s Responsibility Statement to be included in the Directors’ Report in terms of Section 217(2AA) of the Companies Act, 1956
b. Changes, if any, in accounting policies and practices and reasons for the same
c. Major accounting entries involving estimates based on the exercise of judgment by management
d. Significant adjustments made in the financial statements arising out of audit findings
e. Compliance with listing and other legal requirements relating to financial statements
f. Disclosure of any related party transactions
g. Qualifications in the draft audit report
5. Reviewing, with management, the quarterly financial statements before submission to the Board for approval.
6. Reviewing, with management, the performance of statutory and internal auditors and the adequacy of the internal control systems.
7. Reviewing the adequacy of the internal audit function including the structure of the internal audit department, staffing and seniority of the official heading the department, reporting structure coverage and frequency of internal audit.

Oracle Financial Services Software – Annual Report 2012-2013
8. Discussion with internal auditors regarding any significant findings and any follow-up required.
9. Reviewing the findings of any internal investigations by the internal auditors into matters where there is suspected fraud or irregularity or a failure of internal control systems of a material nature and reporting the matter to the Board.
10. Discussion with statutory auditors before the audit commences about the nature and scope of the audit as well as post-audit discussion to determine any areas of concern.
11. To determine the reasons for any substantial defaults in the payment to depositors, debenture holders, shareholders (in case of non payment of declared dividends) and creditors.
12. To review the functioning of the Whistle Blower mechanism.
13. Carrying out any other function as is mentioned in the terms of reference of the Audit Committee.
3.3 Composition of the committee
The Composition of Audit Committee as on March 31, 2013 was as under:
Name of the Member
Mr. Y M Kale Chairman, Non-Executive, Independent Director Mr. S Venkatachalam Member, Non-Executive, Independent DirectorMr. William Corey West Member, Non-Executive, Non - Independent Director
3.4 Meetings and attendance
During the financial year 2012-2013, four meetings of the Committee were held on May 11, 2012, August 2, 2012, October 31, 2012 and January 29, 2013.
The Member’s attendance at the Committee Meetings is as under:
Name of the Member Number of meetings attendedIn person On phone
Mr. Y M Kale 4 –Mr. S Venkatachalam 4 –Mr. William Corey West – 4
The auditors of the Company were invited for the above meetings.
3.5 Audit committee’s recommendations
The Committee reviewed the financial results of the Company prepared in accordance with the Indian GAAP (including consolidated results) as at and for the quarters ended June 30, 2012, September 30, 2012 and December 31, 2012 as also for the year ended March 31, 2013 and recommended the same to the Board for adoption.
The Committee recommended to the Board the re-appointment of M/s. S. R. Batliboi & Associates LLP, Chartered Accountants (Registration no. 101049W), as Statutory Auditors of the Company for the financial year 2013-2014.
The Internal Audit Group of the Company headed by Mr. Atul Kumar Gupta, Business Planning Vice President - Operations, is the Internal Auditor of the Company.
The Committee also reviewed Internal Auditors’ reports and related reports on actions taken, risk management policies, compliance report on corporate governance, litigation and compliance ethics report, etc. from time to time.
4. Compensation committee
4.1 Brief description of terms of reference
The scope of Compensation Committee is to determine the compensation policy as well as profit linked bonus policies for the Directors and key managerial personnel of the Company. The Compensation Committee also approves, allocates and administers the Employee Stock Option Plans - ESOP 2002 Scheme, ESOP 2010 Scheme and ESOP 2011 Scheme, reviews performance appraisal criteria and sets norms for ESOP allocations.

21
4.2 The Composition of the Committee
The Composition of Compensation Committee as on March 31, 2013 was as under:
Name of the Member
Mr. William T Comfort, Jr.* Chairman, Non-Executive, Independent Director Mr. Frank Brienzi** Member, Non-Executive, Non-Independent DirectorMr. Y M Kale Member, Non-Executive, Independent Director
* Mr. William T Comfort, Jr. resigned with effect from May 11, 2012. ** Mr. Frank Brienzi resigned with effect from July 2, 2013.
Mr. Richard Jackson was appointed as the Chairman of the Compensation Committee on April 10, 2013.Mr. Harinderjit Singh was appointed as a member of the Compensation Committee on July 11, 2013.
4.3 Meeting and attendance
During the year no meeting of the Committee was held and the business was dealt with by passing circular resolutions.
4.4 Compensation policyThe Compensation Committee determines and recommends to the Board the compensation payable to the Directors and key managerial personnel of the Company. The limit for the commission to be paid to the Board Members and the remuneration payable to the Managing Director & CEO of the Company are approved by the Members of the Company. The annual compensation of the Non-Executive Directors is approved by the Compensation Committee, within the parameters set by the Members of the Company.The criteria for payment of commission to the non-executive directors include a base commission plus incremental commission depending on the number and type of committees where they are members or chairpersons.The Committee also has the mandate to review and recommend norms for ESOP allocation.
4.5 Details of remuneration paid to the Directors during the financial year 2012-2013 were as under:
(Amounts in ` thousands, except number of ESOPs)Name of the Director Options granted
under ESOPs during the year
Commission paid
Salary Contribution to Provident Fund and other funds
Total Amount paid
Mr. William T Comfort, Jr. – – – – –Mr. S Venkatachalam – 2,350 – – 2,350Mr. Chaitanya Kamat 100,000 – 26,256 1,681 27,937Mr. Derek H Williams – – – – –Mr. Frank Brienzi – – – – –Mr. Richard Jackson – 365 – – 365Mr. Robert K Weiler – – – – –Mr. William Corey West – – – – –Mr. Y M Kale – 1,950 – – 1,950TOTAL 100,000 4,665 26,256 1,681 32,602
The Company accrues for gratuity benefit, compensated absences and bonus for all employees as a whole. It is not possible to ascertain the provision for individual director and hence the same has not been disclosed above. The Company discloses such benefits on cash basis.
During the year, the Compensation Committee granted 100,000 options to Mr. Chaitanya Kamat, Managing Director & CEO under the ESOP 2011 Scheme at an exercise price of ` 3,126.85.
The managerial remuneration paid to Mr. Chaitanya Kamat was within the limits envisaged in the Companies Act, 1956. The remuneration paid to Mr. Y M Kale and Mr. S Venkatachalam and payable to Mr. Richard Jackson, the Non-Executive, Independent Directors of the Company by way of commission, as approved by the Members of the Company, does not exceed 1% of the net profits of the Company in any one financial year.
There was no other remuneration paid to the Directors during the financial year 2012-2013 except as stated above.
During the financial year ended March 31, 2013, the Compensation Committee granted 645,000 options to the eligible employees including Directors of the Company and its Subsidiaries as under:
Date of Grant No. of Options granted Exercise price (`)
January 14, 2013 15,000 3,320.10February 5, 2013 630,000 3,126.85

Oracle Financial Services Software – Annual Report 2012-2013
The terms of Employee Stock Options granted to the Directors was as under:
Name of the Director Scheme Options outstanding
as at April 1, 2012
Options exercised
during the year
Options outstanding
as at March 31, 2013
Exercise price (`)
Expiry Date
Mr. William T Comfort, Jr. – – – – – –Mr. S Venkatachalam ESOP 2011 10,000 Nil 10,000 1,929.95 December 19, 2021Mr. Chaitanya Kamat ESOP 2002 60,000 Nil 60,000 2,333.45 October 24, 2020
ESOP 2011 30,000 Nil 30,000 1,929.95 December 19, 2021ESOP 2011 – Nil 100,000 3,126.85 February 4, 2023
Mr. Derek H Williams – – – – – –Mr. Frank Brienzi – – – – – –Mr. Richard Jackson – – – – – –Mr. Robert K Weiler – – – – – –Mr. William Corey West – – – – – –Mr. Y M Kale* – – – – – –
* all the options granted under the ESOP 2002 Scheme at an exercise price of ` 418.92 have already been exercised.
The above options were issued at prevailing market price of shares on the respective dates of grant. The options vest over a period of 5 years from the date of grant and are subject to continued employment/directorship with the Company.
As on March 31, 2013, none of the Directors of the Company held any equity shares of the Company, except Mr. S Venkatachalam, who held 1,000 equity shares of the Company.
5. Shareholders’ Grievances Committee
5.1 Composition of the Committee
The composition of Shareholders’ Grievances Committee as on March 31, 2013 was as under:
Name of the Member
Mr. S Venkatachalam Chairman, Non-Executive, Independent DirectorMr. Makarand Padalkar Member, Chief Financial Officer
5.2 Scope of Shareholders’ Grievances Committee’s activities
The scope of the Shareholders’ Grievances Committee is to review and address the grievances of the Members in respect of share transfers, transmission, dematerialization and rematerialization of shares and other share related activities.
During the year, three meetings of the Committee were held on May 11, 2012, August 2, 2012 and January 15, 2013.
The Member’s attendance at the Committee Meetings was as under:
Name of the Member Number of meetings attendedIn person
Mr. S Venkatachalam 3Mr. Makarand Padalkar 3
6. Transfer Committee
6.1 Composition of the Committee
The composition of Transfer Committee as on March 31, 2013 was as under:
Name of the Member
Mr. S Venkatachalam Chairman, Non-Executive, Independent DirectorMr. Makarand Padalkar Member, Chief Financial Officer
6.2 Scope of Transfer Committee
The scope of Transfer Committee is to consider and approve requests for transfer, transmission, rematerialization of shares and other investor related matters.
During the year, five meetings of the Committee were held on May 25, 2012, July 4, 2012, August 2, 2012, September 27, 2012 and January 15, 2013.

23
The Member’s attendance at the Committee Meetings was as under:
Name of the Member Number of meetings attendedIn person
Mr. S Venkatachalam 5Mr. Makarand Padalkar 5
7. ESOP Allotment Committee
7.1 Composition of the Committee
The composition of ESOP Allotment Committee as on March 31, 2013 was as under:
Name of the Member
Mr. Y M Kale Chairman, Non-Executive, Independent DirectorMr. Chaitanya Kamat Member, Managing Director & Chief Executive OfficerMr. S Venkatachalam Member, Non-Executive, Independent DirectorMr. Makarand Padalkar Member, Chief Financial Officer
7.2 Scope of ESOP Allotment Committee
The scope of ESOP Allotment Committee is to consider and approve requests for allotment of shares on exercise of stock options by eligible employees.
During the year, eight meetings of the Committee were held on May 23, 2012, July 4, 2012, August 29, 2012, October 10, 2012, December 5, 2012, January 31, 2013, February 26, 2013 and March 20, 2013.
The Member’s attendance at the Committee Meetings was as under:
Name of the Member Number of meetings attendedIn person On Phone
Mr. Y M Kale 8 –Mr. Chaitanya Kamat – 5Mr. S Venkatachalam 6 –Mr. Makarand Padalkar 8 –
8. Company Secretary and Compliance OfficerCompany Secretary and Compliance Officer Mr. Hoshi D BhagwagarAddress Oracle Financial Services Software Limited
Oracle ParkOff Western Express HighwayGoregaon (East), Mumbai 400 063 Maharashtra, India
Tel. + 91-22-6718 4493Fax + 91-22-6718 4604e-mail [email protected]
9. Details of shareholders’ complaints received, resolved and outstanding during the financial year 2012-2013
Particulars No. of Complaints
Complaints outstanding on April 1, 2012 1Complaints received during the financial year ended March 31, 2013 7Complaints resolved during the financial year ended March 31, 2013 7Complaints outstanding on March 31, 2013 1
Number of pending share transfers as on March 31, 2013 – Nil

Oracle Financial Services Software – Annual Report 2012-2013
10. General body meetings
10.1 Location, date and time where last three Annual General Meetings were held:
Financial Year Venue Day Date Time
2011-2012 The Leela Kempinski, Friday August 17, 2012 3.00 p.m.Sahar, Andheri (East), Mumbai 400 059
2010-2011 The Leela Kempinski, Thursday August 18, 2011 3.00 p.m.Sahar, Andheri (East), Mumbai 400 059
2009-2010 The Leela Kempinski, Wednesday August 25, 2010 3.00 p.m.Sahar, Andheri (East), Mumbai 400 059
10.2 The details of Special Resolutions passed in AGMs during the last three years are as under:
Financial Year Day, Date & Time Venue Gist of Special Resolution passed
2011-2012 Friday, August 17, 2012at 3.00 p.m.
The Leela Kempinski,Sahar, Andheri (East), Mumbai 400 059
No special resolution was passed.
2010-2011 Thursday, August 18, 2011at 3.00 p.m.
The Leela Kempinski, Sahar, Andheri (East), Mumbai 400 059
Payment of Commission to Directors of the Company (excluding the Managing Director and Whole-time Directors), not exceeding in the aggregate one per cent per annum of the net profits of the Company, which shall be calculated in accordance with the provisions of Sections 198, 349 and 350 of the Companies Act, 1956; for a further period of five years from April 1, 2012 to March 31, 2017.
Authority to grant stock option to the present and future employees and Directors (whole-time or otherwise) of the Company, such number of options as the Board may decide which could give rise to equity shares of face value of ` 5/- each of the Company, not exceeding 12.5% of the issued and paid-up share capital of the Company at any given time.
Authority to grant stock option to the present and future employees and Directors (whole-time or otherwise) of the Company's present and future subsidiaries, such number of options as the Board may decide which could give rise to equity shares of face value of ` 5/- each of the Company, not exceeding the aforesaid limit of 12.5% of the issued and paid-up share capital of the Company at any given time.
2009-2010 Wednesday,August 25, 2010at 3.00 p.m.
The Leela Kempinski,Sahar, Andheri (East), Mumbai 400 059
No special resolution was passed.
10.3 There was no Extra-Ordinary General Meeting held during the Financial Years 2009-2010, 2010-2011 and 2011-2012.
10.4 There were no matter requiring approval of the Members through Postal Ballot during the financial year ended March 31, 2013.
10.5 No special resolution is currently proposed to be conducted through postal ballot.

25
10.6 Procedure for the Postal Ballot process:
After receiving the approval of the Board of Directors for matters requiring Members approval by postal ballot, notice of the Postal Ballot, text of the Resolution along with Explanatory Statement, Postal Ballot Form and self-addressed postage pre-paid envelopes are required to be sent to the Members to enable them to consider and vote for or against the proposal within a period of 30 days from the date of dispatch. The calendar of events containing the activity chart is to be filed with the Registrar of Companies within 7 days of the passing of the Resolution by the Board of Directors of the Company. After the last date for receipt of the ballots, the Scrutinizer after due verification, is required to submit the results to the Chairman of the Board of Directors of the Company. Thereafter, the Chairman declares the result of the Postal ballot. The same is required to be published in the Newspapers and displayed on the website and the Notice Board at the registered office of the Company. In addition to the above, Clause 35B of the listing agreement requires the Company to offer electronic voting facility to Members for matters requiring approval by postal ballot. The Company has entered into agreement with the National Securities Depository Ltd. (“NSDL”) and Central Depository Services (India) Limited (“CDSL”) for offering e-Voting platform in respect of those businesses, which are required to be transacted through postal ballot.
11. Disclosures
a. All the relevant information in respect of materially significant related party transactions, i.e., transactions of the Company of material nature with its promoters, directors or management or their relatives, subsidiaries of the Company, etc. has been disclosed in the respective financial statements presented in the Annual Report. The Company did not undertake any transaction with any related party having potential conflict with the interest of the Company at large.
b. The Company has complied with statutory compliances and no penalty or stricture is imposed on the Company by the Stock Exchanges or Securities and Exchange Board of India (SEBI) or any other statutory authority on any matter related to the capital markets during the last three years.
c. The Company has a Whistle Blower mechanism which provides adequate safeguards to employees who wish to raise concerns about violations of the Code of Ethics and Business Conduct, incorrect or misrepresentation of any financial statements and reports, unethical behavior, etc. No employee has been denied access to the Audit Committee. The Whistle Blower mechanism forms part of the Code of Ethics and Business Conduct.
d. The Company is compliant with the applicable mandatory requirements of Clause 49 of the listing agreement entered with the Stock Exchanges, except that there was a delay of 34 days beyond the specified time limit provided under Clause 49(I)(C)(iv) in appointing a new Independent Director on the Board, after the resignation of an existing Independent Director. This was due to the fact that the Company did not get suitable candidate for the appointment within the stipulated timeline. Of the non-mandatory requirements, the Company has a Compensation Committee and also has a Whistle Blower mechanism in place through its Code of Ethics and Business Conduct.
e. The Ministry of Corporate Affairs, Government of India had issued the Corporate Governance Voluntary Guidelines, 2009 (“the Guidelines”). The objective of these Guidelines is to encourage companies to voluntarily adopt best practices in corporate governance. The Guidelines focuses on matters relating to functions of the Board, Audit Committee, Auditors role and Secretarial Compliance. The corporate governance framework of the Company already encompasses a significant portion of the recommendations contained in the Guidelines.
f. Unclaimed Shares
In terms of clause 5A of the listing agreement entered with stock exchanges, the information with regard to unclaimed/undelivered shares relating to the initial public offering was as under:
Particulars No. of Shareholders No. of Shares of ` 5/- each
Aggregate number of Shareholders and outstanding shares in the suspense account as on April 1, 2012
2 40
Number of shareholders who approached the Company for transfer of shares from the suspense account during the year
– –
Number of shareholders and shares transferred from suspense account during the year
– –
Aggregate number of Shareholders and shares held in suspense account as on March 31, 2013
2 40
The shares are in the Unclaimed Shares Demat Suspense Account and the Voting rights of these unclaimed/undelivered shares remain frozen until the same are claimed by the shareholders.
g. In terms of Clause 55 of the Listing Agreement, a Business Responsibility Report forms part of this Annual Report.

Oracle Financial Services Software – Annual Report 2012-2013
12. Means of communication
During the Financial Year 2012-2013:
• The quarterly and annual financial results of the Company were published in widely circulated English and Marathi newspapers, namely, The Business Standard and Sakal. Notices with regard to issue of duplicate share certificates of the Company were also published in widely circulated English and Marathi newspapers, namely, The Free Press Journal and Navshakti.
• The Company’s quarterly financial results, press releases, Annual Reports and other relevant corporate documents are posted on the Company’s website www.oracle.com/financialservices
• Detailed Management’s discussion and analysis Report covering Indian GAAP consolidated and unconsolidated financials has been included in this Annual Report.
• The Company has uploaded the information relating to its financial results, shareholding pattern and report on corporate governance on website – www.corpfiling.co.in
• As per National Stock Exchange’s letter dated September 29, 2011, introducing Electronic filing of Corporate Governance and Shareholding Pattern, through NSE Electronic Application Processing System (NEAPS), the Company has been uploading the information relating to its Shareholding Pattern, Report on corporate governance, listing & trading applications and financial results on website – http://www.connect2nse.com/LISTING
• Securities and Exchange Board of India (SEBI) introduced a centralized web based SEBI Complaints Redress System (SCORES) vide Circular no. CIR/OIAE/2/2011 dated June 3, 2011 for all Listed Companies. The Company has been online viewing the complaints, uploading Action Taken Reports (ATRs) and monitoring its current status on website – http://scores.gov.in/Admin
• As per the Circular issued by Ministry of Corporate Affairs, the Company has filed its Balance Sheet and Profit and Loss Account in extensible Business Reporting Language (XBRL), for the financial year ended March 31, 2012.
• As a part of Green Initiative in Corporate Governance, the Ministry of Corporate Affairs vide its Circular No. 17/2011 dated April 21, 2011 and Circular No. 18/2011 dated April 29, 2011 has clarified that a company would have complied with Section 53 of the Companies Act, 1956, if the service of a document has been made through electronic mode, provided the company has obtained e-mail address for sending the notice/documents through e-mail by giving an advance opportunity to the Members to register their e-mail address and changes therein from time to time with the Company. The Company has since been annually sending communications to the incremental Members of the Company seeking their preference for receiving corporate documents and has issued/dispatched Annual Reports accordingly.
13. General shareholder information
Annual General Meeting
Day and Date Wednesday, August 14, 2013Time 3.00 p.m.Venue The Leela Kempinski,
Sahar, Andheri (East), Mumbai 400 059
Financial Year April 1, 2012 to March 31, 2013
Dividend Payment Date Not Applicable
Date of Book Closure Thursday, August 8, 2013 to Wednesday, August 14, 2013(both days inclusive) for Annual General Meeting
Listing on Stock Exchanges at BSE Ltd. (BSE); andNational Stock Exchange of India Limited (NSE)
Stock CodeBSE Ltd. (BSE) 532466National Stock Exchange of India Limited (NSE) OFSS

27
Listing
The annual listing fees for the financial year 2013-2014 have been paid to BSE and NSE.
The Company has also paid Annual Custodial fees for the financial year 2013-2014 to National Securities Depository Limited and Central Depository Services (India) Limited on the basis of average number of beneficial accounts maintained by them during the previous financial year ended March 31, 2013.
Unclaimed Dividend
Pursuant to Sections 205A, 205C and other applicable provisions, if any, of the Companies Act, 1956, any money transferred to the unpaid dividend account which remains unpaid or unclaimed for a period of 7 years from the date they become due for payment, is required to be transferred to the ‘Investor Education and Protection Fund’ set up by the Central Government. Accordingly, the amount of unclaimed dividend for the financial year ended March 31, 2006 will be transferred to the ‘Investor Education and Protection Fund’ in due course. Once the amount is so transferred, no claims shall lie against the aforesaid fund or the Company in respect of such dividend amount thereafter. The Members are requested to send to the Company their claims, if any, for the dividend for financial year ended March 31, 2006 immediately.
14. Market price data
Monthly high, low and volume of the shares of the Company traded on the stock exchanges from April 1, 2012 to March 31, 2013 are given below:
Month and Year BSE NSEHigh (`) Low (`) Volume of shares High (`) Low (`) Volume of shares
April 2012 2,765.90 2,510.00 249,859 2,762.80 2,505.00 1,268,763May 2012 2,642.60 2,360.00 80,149 2,648.90 2,353.00 762,805June 2012 2,600.00 2,386.00 78,019 2,649.00 2,380.00 591,736July 2012 2,600.00 2,450.00 96,386 2,620.00 2,426.00 958,926August 2012 3,009.65 2,535.00 494,432 3,020.50 2,534.00 2,889,270September 2012 3,066.00 2,880.00 773,773 3,067.00 2,816.00 1,443,232October 2012 3,125.00 2,894.00 75,474 3,126.00 2,884.05 747,879November 2012 2,990.05 2,797.00 111,150 2,990.00 2,792.05 705,253December 2012 3,340.00 2,848.05 186,822 3,339.80 2,846.10 1,450,991January 2013 3,414.00 3,150.15 232,827 3,415.00 3,161.15 964,674February 2013 3,205.00 2,700.00 87,578 3,210.00 2,664.30 720,426March 2013 2,970.35 2,520.00 139,466 2,975.00 2,513.20 989,489

Oracle Financial Services Software – Annual Report 2012-2013
Relative movement chart
The chart below gives the comparison of your Company’s share price movement on NSE vis-a-vis the movement of S&P CNX NIFTY for the financial year 2012-2013.
The chart below gives the comparison of your Company’s share price movement on NSE vis-a-vis the movement of S&P CNX NIFTY since the listing of the share on NSE.
4,000
5,000
6,000
7,000
Apr-12 May-12 Jun-12 Jul-12 Aug-12 Sep-12 Oct-12 Nov-12 Dec-12 Jan-13 Feb-13 Mar-13
2,000
2,500
3,000
3,500
S&P
CNX
NIF
TY
OFS
SL P
rice
( `)
S&P CNX NIFTYOFSSL Price
100
200
300
400
500
600
700
800
900
1,000
1,100
1,200
1,300
1,400
Relat
ive
mov
emen
t
Jul 2002 Jul 2003 Jul 2004 Jul 2005 Jul 2006 Jul 2007 Jul 2008 Jul 2009 Jul 2010 Jul 2011 Jul 2012 Jul 2013
0
S&P CNX NIFTYOFSSL Price

29
15. Registrars and Transfer Agents
Link Intime India Private Limited (formerly Intime Spectrum Registry Limited) are the Registrars and Transfer Agents of the Company (“the RTA”) and their contact details are:
Name Link Intime India Private LimitedAddress C-13, Pannalal Silk Mills Compound, L.B.S. Marg, Bhandup (West),
Mumbai 400078Tel. +91-22-2594 6970Fax +91-22-2594 6969Contact person Mr. Dnyanesh Gharote, Asst. Vice President - Corporate RegistryE-mail [email protected]
16. Physical share certificate transfer system
The RTA, on receipt of transfer deed along with share certificate(s) scrutinizes the same and verifies signature(s) of transferor(s) on the transfer deed with specimen signature(s) registered with the Company. A list of such transfers is prepared and checked thoroughly and a transfer register is prepared accordingly. The transfer register is placed before the Transfer Committee for approval, which meets as and when required.
During the last financial year, there was 1 request received for transfer of 1,600 shares in physical mode.
Reconciliation of share capital audit
A qualified Practicing Chartered Accountant has carried out reconciliation of Share Capital Audit for every quarter of financial year 2012-2013 to reconcile the share capital held with depositories and in physical form with the issued/listed capital. The audit confirms that the total issued/paid-up/listed share capital is in agreement with the aggregate total number of shares in physical form and the total number of dematerialized shares held with NSDL and CDSL.
17. Distribution of shareholding as on March 31, 2013
Paid-up share capital(in `)
Number of shareholders
% to total shareholders
No. of shares Paid-up value (Face value ` 5/- each)
% to Total no. of shares
Up to 2,500 17,972 92.55 665,076 3,325,380 0.792,501 – 5,000 374 1.92 287,082 1,435,410 0.345,001 – 10,000 324 1.67 489,703 2,448,515 0.5810,001 – 20,000 283 1.46 846,284 4,231,420 1.0120,001 – 30,000 100 0.51 498,439 2,492,195 0.5930,001 – 40,000 87 0.45 612,723 3,063,615 0.7340,001 – 50,000 45 0.23 413,579 2,067,895 0.4950,001 – 100,000 116 0.60 1,595,876 7,979,380 1.90100,001 & Above 118 0.61 78,656,716 393,283,580 93.57Total 19,419 100.00 84,065,478 420,327,390 100.00
18. Shareholding pattern as on March 31, 2013
Category of shareholders Number of shares %
Promoters: Oracle Global (Mauritius) Limited 67,481,698 80.27Mutual Funds/UTI 1,719,789 2.05Financial Institutions/Banks 16,293 0.02Central Government 4,000 0.00Insurance Companies – –Foreign Institutional Investors 4,082,272 4.86Bodies Corporate 982,690 1.17Individuals–i. Holding nominal share capital up to ` 1 lakh 3,829,100 4.56ii. Holding nominal share capital in excess of ` 1 lakh 1,660,967 1.98NRI (Repatriate) 474,931 0.56NRI (Non-Repatriate) 791,161 0.94Foreign Mutual Fund 2,784,414 3.31Clearing Member 32,721 0.04

Oracle Financial Services Software – Annual Report 2012-2013
Category of shareholders Number of shares %
Directors/Relatives 2,000 0.00HUF 14,678 0.02Market Maker 2,336 0.00Overseas Corporate Bodies 800 0.00Trust 185,628 0.22Foreign Nationals – –Total 84,065,478 100.00
During the financial year 2012-2013:1. The Company issued and allotted 91,721 equity shares to eligible employees who exercised their ESOPs during the year.2. The Company has not issued any ADR/GDR/Warrants/other convertible instruments except ESOPs.3. The promoters have not pledged any of the shares held in the Company.
19. Dematerialization of shares and liquidity
The shares of the Company are tradable under compulsory demat mode. Under the Depository System, the International Securities Identification Number (ISIN) allotted to the Company’s shares is INE881D01027.
In order to avoid the possibility of dealing in shares of a company before the receipt of final listing/trading approval from the stock exchanges, the Securities and Exchange Board of India vide circular no. CIR/MRD/DP/21/2012 and CIR/MRD/DP/24/2012 dated August 2, 2012 and September 11, 2012 respectively, directed that any additional issue of shares shall be first credited to a new temporary ISIN which shall be kept frozen and only upon receipt of final listing/trading permission from the stock exchanges, the no. of shares shall be moved out of the temporary ISIN into the pre-existing ISIN of the Company. The temporary ISIN for the equity shares of the Company is IN8881D01018. The pre-existing ISIN for the equity shares of the Company is INE881D01027.
As on March 31, 2013, 99.15% of the shares of the Company were in electronic form and 99.42% of the Members held shares in electronic form. Members holding shares in physical form are requested to consider the option of holding shares in dematerialized form.
20. Address for correspondence
The Company SecretaryOracle Financial Services Software LimitedOracle Park, Off Western Express HighwayGoregaon (East), Mumbai 400 063 Maharashtra, IndiaTel +91-22- 6718 2822 Fax +91-22- 6718 4604e-mail: [email protected] website: www.oracle.com/financialservices
The details of other office addresses have been mentioned in the corporate information section of the Annual Report.

31
Annexure to Directors’ report
ToThe Board of DirectorsOracle Financial Services Software LimitedMumbai
This is to certify that:
(a) We have reviewed financial statements and the cash flow statement of Oracle Financial Services Software Limited (“the Company”) for the financial year ended March 31, 2013 and that to the best of our knowledge and belief:
(i) These statements do not contain any materially untrue statement/figures or omit any material fact or contain statements/figures that might be misleading;
(ii) These statements together present a true and fair view of the Company’s affairs and are in compliance with existing accounting standards, applicable laws and regulations.
(b) There are, to the best of our knowledge and belief, no transactions entered into by the Company during the financial year ended March 31, 2013 which are fraudulent, illegal or violative of the Company’s code of conduct.
(c) We accept responsibility for establishing and maintaining internal controls for financial reporting and that we have evaluated the effectiveness of the internal control systems of the Company pertaining to financial reporting and we have disclosed to the auditors and the Audit Committee, deficiencies in the design or operation of such internal controls, if any, of which we are aware and the steps we have taken or propose to take to rectify these deficiencies.
(d) We have indicated to the auditors and the Audit Committee:
(i) Significant changes in internal control over financial reporting during the financial year ended March 31, 2013, if any;
(ii) Significant changes in accounting policies during the financial year ended March 31, 2013, if any; and that the same have been disclosed in the notes to the financial statements; and
(iii) instances of significant fraud of which we have become aware and the involvement therein, if any, of the management or an employee having a significant role in the Company’s internal control system over financial reporting.
(e) We further declare that all Board members and Senior Management Personnel have affirmed compliance with Code of Ethics and Business Conduct for the financial year ended March 31, 2013.
For Oracle Financial Services Software Limited
Chaitanya Kamat Makarand PadalkarManaging Director & CEO Chief Financial Officer
May 7, 2013

Oracle Financial Services Software – Annual Report 2012-2013
ToThe Members of Oracle Financial Services Software Limited
We have examined the compliance of conditions of corporate governance by Oracle Financial Services Software Limited (the “Company”), for the year ended on March 31, 2013, as stipulated in clause 49 of the Listing Agreement of the said Company with stock exchange(s).
The compliance of conditions of corporate governance is the responsibility of the management. Our examination was limited to procedures and implementation thereof, adopted by the Company for ensuring the compliance of the conditions of the Corporate Governance. It is neither an audit nor an expression of opinion on the financial statements of the Company.
In our opinion and to the best of our information and according to the explanations given to us, subject to a delay of 34 days beyond the specified time limit provided under Clause 49(I)(C)(iv) in appointing a new Independent Director on the Board, after the resignation of an existing Independent Director, we certify that the Company has complied with the conditions of Corporate Governance as stipulated in the above mentioned Listing Agreement.
We further state that such compliance is neither an assurance as to the future viability of the Company nor the efficiency or effectiveness with which the management has conducted the affairs of the Company.
For S. R. Batliboi & Associates LLPChartered AccountantsICAI Firm registration number: 101049W
per Amit MajmudarPartnerMembership No.: 36656
Mumbai, IndiaDate: July 11, 2013
Auditors’ Certificate

33
Management’s discussion and analysis offinancial condition and results of operations
Technology in the financial services industry
Banks worldwide are reexamining and realigning their current operations to remain profitable. In the wake of the global financial crisis, a wave of greater regulatory scrutiny and obligations has swept the banking industry. The long-term impact of this in terms of capital allocations, costs and profitability is significant for banks. In the backdrop of a continuing business environment of changing customer needs, competition from established brands in other domains, and a proliferation of delivery channels, the challenges banks face become sharper in relief.
The way forward for banks is quite clear. To succeed, banks need to innovate irrespective of their size. And innovation in the banking industry is supported by—if not led by—technology. Limited by technology, many financial institutions are forced to adopt rigid strategies, relying on their branch networks to acquire customers, build relationships and extend their businesses. Further, any response to the changing customer needs is met by further complicating their IT landscape. By focusing too narrowly on “branch banking”—by building processes and creating products reliant on the branch as a delivery channel—many banks in evolved and emerging economies, have missed prime opportunities, which others have capitalized upon. There are number of instances of how other financial institutions approaching these challenging times with an alternative, creative mindset have succeeded. OFSS products and solutions provide precisely this edge to banks.
Your Company believes that the momentum for change in the industry will continue. We see this in the abiding success and recognition we receive, year after year, for the offerings we deliver. Your Company’s products consistently win accolades from the international analyst community for its leadership and delivery capability. Banking Technology named Oracle FLEXCUBE the Readers’ Choice for Best Core Banking Product for 2012. Banks who have deployed your Company’s products have won recognition too. Mashreq Bank’ FLEXCUBE deployment won the Asian Banker Technology Award for the Best Core Banking Implementation in the Middle East.
Your Company’s strategy continues to be centered on consolidation of the position in existing markets and expansion of our addressable market by launching relevant offerings to segments hereto not addressed and opening major markets.
Business overview
Oracle Financial Services Software Limited (‘‘OFSS’’), majority owned by Oracle, is a world leader in providing IT solutions to the financial services industry. With its experience of delivering value based IT solutions to global financial institutions, Oracle Financial Services Software understands the specific challenges that financial institutions face: the need for building customer intimacy and competitive advantage through cost-effective solutions while, simultaneously, adhering to the stringent demands of a dynamic regulatory environment.
Our mission is to enable financial institutions to excel through the effective use of information technology. We offer financial institutions the world’s most comprehensive and contemporary banking applications and a technology footprint that addresses their complex IT and business requirements.
Together with Oracle, we offer a comprehensive suite of offerings encompassing retail, corporate, and investment banking, funds, cash management, trade, treasury, payments, lending, private wealth management, asset management, compliance, enterprise risk and business analytics, among others. With a process-driven approach for service-oriented architecture (SOA) deployments, we offer banks the combined benefits of interoperability, extensibility, and standardization. We also offer best-of-breed functionality for financial institutions that need to operate flexibly and competitively and respond rapidly to market dynamics in a fiercely challenging business environment.
We have two major business segments - the products business (comprising product licensing, consulting and support) and consulting services (comprising IT application and technology services). We also have a smaller business segment that offers business process outsourcing services to financial institutions.
These segments are described in detail below:
Products
Oracle FLEXCUBE is a complete banking product suite for consumer, corporate, investment, private wealth management, mobile and internet banking, consumer lending, asset management and investor servicing, including payments. Oracle FLEXCUBE enables banks to standardize operations across multiple countries, transform their local operations as well as address niche business models like mobile banking, direct banking and Shariah-compliant banking. Financial institutions use Oracle FLEXCUBE to respond faster to market dynamics, define and track processes, while ensuring compliance.
Oracle FLEXCUBE Enterprise Limits and Collateral Management offers a single source for managing exposure across a business portfolio. It enables centralized collateral management, limits definition, tracking and exposure measurement for effective exposure management and resource utilization.

Oracle Financial Services Software – Annual Report 2012-2013
Oracle FLEXCUBE Private Banking is a comprehensive solution for private banking. It gives wealth managers a unified view and analyses of their customers’ wealth across asset classes, and provides the added benefits of performance tracking and improved customer relationship management. The application is a comprehensive, customer centric solution that offers a wealth management portal, a customer interaction tool, and portfolio management capabilities – all of which can be integrated with the existing core banking solutions used by a bank.
Oracle FLEXCUBE Investor Servicing is a process enabled transfer agency and investor servicing solution. It helps financial institutions manage the complete fund lifecycle and reduce operational costs through process automation across fund structures, intermediary hierarchies, and investors. The ISO 20022 and 15022 compliant Oracle FLEXCUBE Investor Servicing ensures enhanced STP processing through support for a wide variety of SWIFT NET 4.0 messages. With a comprehensive business rules engine for products – hedge funds, mutual funds and investment linked products, funds, and fee structures, Oracle FLEXCUBE Investor Servicing allows fund management companies to configure and launch new products rapidly.
Oracle Financial Services Leasing and Lending is a family of products provides functional coverage across lending, leasing, and mortgage lifecycles for consumer, commercial, syndicated, Islamic, and SME functions. The solution supports the complete business lifecycle across origination, servicing, and collections and enables financial institutions to provide better service and minimize delinquency rates through comprehensive and flexible processing of booking, disbursement, and payment. It centralizes origination functions, enabling them to improve customer experience and reduce transactional overheads.
Oracle Financial Services Analytical Applications are a complete and fully integrated portfolio of analytical solutions covering enterprise risk, performance management, regulatory compliance and customer insight. They are built upon a shared analytical infrastructure consisting of a unified financial services data model, shared analytical computations and the industry leading Oracle Business Intelligence platform.
The suite of applications contains comprehensive set of point solutions that can be integrated to give a holistic view across all analytical applications. Financial institutions need an integrated approach that combines a diverse set of compliance and risk solutions to help them address not only present regulatory needs, but also emerging and future risk and regulatory requirements. The framework is rules driven, and readily adapts to change. Unlike other hard coded solutions, Oracle Financial Services Analytical Applications provide both prebuilt rules and the capability to create and modify rules. This flexibility allows financial institutions to easily create custom rules for their own analytical requirements and to cost effectively address ever changing compliance regulations. Any rule can be viewed and audited for its underlying definition to enable supervisory oversight.
Oracle Banking Platform is a comprehensive suite of business applications for large global banks. Oracle Banking Platform is designed to help banks respond strategically to today’s business challenges and progressively transform their business models and processes, driving productivity improvements across both front and back offices, and reducing operating costs. The solution supports banks as they grow their businesses through new distribution strategies, including multi-brand or white labeling, to tap new markets and enterprise product origination supporting multi-product and packages to drive an increased customer-to-product ratio. Oracle Banking Platform is designed as a native service-oriented architecture (SOA) platform, helping banks implement key enterprise services, deliver on customer centricity, enrich channel capability, drive process improvement and tie it in with their existing applications and technology landscape. Through pre-integrated enterprise applications and the underlying Oracle technology stack, the solution can also help to reduce in-house integration and testing efforts, ultimately, reducing IT costs and improving time-to-market. Oracle Banking Platform provides a comprehensive suite of applications that makes the replacement of core systems viable for large banks, enabling strategic choices as well as providing a high level of flexibility and value. Oracle Banking Platform complements Oracle’s FLEXCUBE core banking product, which will continue to be sold globally to banks seeking a fully integrated banking solution, addressing the need for universal, commercial banking and international operations.
Services
Oracle Financial Services PrimeSourcing
offers an end-to-end consulting partnership, providing comprehensive business and technology solutions that enable financial services enterprises to improve process efficiencies; optimize costs; meet risk and compliance requirements; define IT architecture; and, manage the transformation process. Consulting services are offered in the areas of business transformation, risk and compliance, program management, IT architecture, IT governance and process improvement.
PrimeSourcing Value based Offerings
With a singular focus on the financial services segment, PrimeSourcing has proven domain expertise across Capital Markets, Private Banking, Global Wealth Management, Corporate Banking, Retail Banking & Risk and compliance. PrimeSourcing’s service offerings cut across all the domains keeping the specific needs of each sector in perspective.
PrimeSourcing’s Value based offerings are designed to provide specialized solutions for Banking & Financial Services in areas such as Access Channels, Payments, Business Intelligence, Regulatory Reporting, & Business Process Management and enabling financial institutions to address their unique needs and leverage technology innovations.
PrimeSourcing Consulting Services
PrimeSourcing offers end-to-end consulting services in the areas of Business & IT consulting and process improvement and transformation, Quality Consulting, SOA Strategy & Governance, IT Architecture Planning, Product Evaluation & Selection, IT Portfolio Assessment, program management, IT architecture and governance.

35
PrimeSourcing Application Services
PrimeSourcing provides comprehensive customized IT solutions for banking, securities and insurance those encompass the complete lifecycle of an IT application asset from conceptualization to creation and maintenance. This includes the expertise around specialized practice lines like payments, trade finance, business intelligence, CRM, Oracle Technology and Applications and testing; services include ADM Services, Testing, System Integration, implementation and Migration.
Oracle Product Related Services
PrimeSourcing with its extensive knowledge on Oracle Product line also offers Oracle Product related offerings to help customers make the most out of Oracle investments they have made. Our experts help in Process consulting, Surround Application integration, Reporting & Upgrade support across Banking Applications, Risk & Analytical Applications and Enterprise Applications.
PrimeSourcing Technology Services
PrimeSourcing offers expertise in conceptualization, design, evaluation, implementation and management of IT infrastructure for financial institutions under two service lines. First line is of Technology Management Services, covering Data Management, Mainframe Services, Application Deployment, Monitoring & Management and Risk & Security Assessment. The second service line is of Remote Infrastructure Management where PrimeSourcing manages remotely monitors and supports customer’s applications and infrastructure providing them economies of scale, arbitrage benefits while keeping the best in class processes.
Oracle Business Process Outsourcing Services (BPO)
Oracle Business Process Outsourcing Services (‘BPO’) offering excels in providing cost effective and high quality BPO services ranging from complex back-office work to contact center services for the banking, capital markets, insurance and asset management domains. This comprehensive ecosystem of BPO services also draws upon software applications such as Oracle FLEXCUBE and is backed by a mature process and consulting framework. The BPO offerings are ISO 9001 certified for quality management and ISO 27001 certified for information security management.
Corporate development
Mantas Limited, UK, wholly owned subsidiaries of Mantas Inc. was dissolved with effect from April 10, 2012.
SWOT analysis
Strengths:
– World-leader in technology innovation with substantial annual spend on R&D
– 100% focused on banks and financial services companies
– Provides comprehensive suite of products that run mission critical operations
– Largest number of modern core banking deployments globally
– Software product based financial model with recurring revenue and high margins
– Unique and beneficial strategic relationship with Oracle
Weaknesses:
– Exposure to various economies
– Local resources in new markets
Opportunities:
– Global IT spend in banking set to grow to ~USD 180 billion
– Ideally positioned to capitalize on key technology trends (big data, mobility, cloud, consumerization)
– Consistent presence in transformation deals in Tier One banks
Threats:
– Competitive pressures from low cost providers
– Low growth due to global economic conditions
– Technology investments by banks likely to be delayed by “postponement” tendency
– Geo-politic factors

Oracle Financial Services Software – Annual Report 2012-2013
Outlook
Your Company strategy is to expand its market by gaining competitive edge through product differentiation. We will continue to invest heavily in product enhancements, both in terms of functional capability and technology.
We will also continue to extend our reach across the world, especially in large, promising, markets, such as China and Brazil, as indeed Latin America in general. We have a focused investment plan for these new markets. Our success rate at replacing legacy core banking systems, even in complex business environments, continues to be impressive with respect to competition. Our efforts at maintaining this leadership position include expanding our footprint with our existing clients. Our partnership with many of our clients is strategic: we are well-positioned to address their changing, growing, technology needs for the long haul. Your Company’s ability to deliver unified technology platforms for both organic and inorganic expansion is proven and recognized. Our multi-country rollout capabilities for large, Tier One, banks is unmatched in the industry, and we will build on our capabilities in this area to stay ahead of the field. Your Company, along with Oracle, is well placed to address these opportunities by providing a technology stack that is complete and optimized for the industry, along with the necessary services.
Internal control systems and their adequacy
Oracle Financial Services Software group has in place adequate systems for internal control and documented procedures covering all financial and operating functions. These systems are designed to provide reasonable assurance with regard to maintaining proper accounting controls, monitoring economy and efficiency of operations, protecting assets from unauthorized use or losses, and ensuring reliability of financial and operational information. The Group continuously strives to align all its processes and controls with global best practices.
Analysis of our consolidated financial resultsThe following discussion is based on our audited consolidated financial statements, which have been prepared in conformity with accounting principles generally accepted in India and complying in all material respects with the Accounting Standards notified by Companies (Accounting Standards) Rules, 2006 (as amended) and the relevant provisions of the Companies Act, 1956.
The consolidated financial statements are consolidated for Oracle Financial Services Software Group that includes Oracle Financial Services Software Limited (“the Company”), its subsidiaries and associate company (together referred to as “OFSS Group” as described in Note 1 to the consolidated financial statements) (“the Group”) as at March 31, 2013.
You should read the following discussion of our financial condition and results of operations together with the detailed consolidated Indian GAAP financial statements and the notes to those statements. Our fiscal year ends on March 31 of each year.
Our total revenues in fiscal 2013 were ` 34,739.99 million, representing an increase of 10% from ` 31,466.76 million in fiscal 2012. The profit for the year in fiscal 2013 was ` 10,751.43 million, as against ` 9,092.73 million in fiscal 2012. Our profit margin is at 31% and 29% for the fiscal years 2013 and 2012 respectively. We define profit margins for a particular period as the ratio of profit to total revenues from operations during such period.
Products business
(Amounts in ` million)Year ended
March 31, 2013Year ended
March 31, 2012Products revenues 26,011.00 22,822.81Operating expenses (15,389.88) (13,078.20)Income from operations 10,621.12 9,744.61Operating margin 41% 43%
Products revenues
As of March 31, 2013, our product revenues were ` 26,011.00 million, an increase of 14% from ` 22,822.81 million during the fiscal year ended March 31, 2012. Product revenues represented 75% and 73% of total revenues for fiscal years ended 2013 and 2012, respectively.
Our product revenues comprise license fees, professional fees for implementation and enhancement services and annual maintenance contract (Post Contract Support – PCS) fees for our products.
License fee
Our standard licensing arrangements for products provide the bank a right to use the product up to a limit on number of users or sites or such other usage metric upon the payment of a license fee. The license fee is a function of a variety of quantitative and qualitative factors, including the number of copies sold, the number of users supported, the number and combination of the modules sold and the number of sites and geographical locations supported. The licenses are perpetual, non-exclusive, personal, non-transferable and royalty free.

37
Consulting fee
Along with licenses for our products, our customers can also optionally avail consulting services related to the implementation of products at their sites, integration with other systems or enhancements to address their specific requirements. The customer is typically charged a service fee on either a fixed price basis or a time and material basis based on the professional efforts incurred and associated out of pocket expenses.
Annual maintenance contract (PCS) fees
Customers typically sign an Annual Maintenance Contract with us under which, we provide technical support, maintenance, problem resolution and upgrades for the licensed products. These support agreements typically cover a period of 12 months.
The revenues generated from license fees and consulting services rendered by us depends on factors such as the number of new customers added, milestones achieved, implementation time, etc. Therefore, such revenues typically vary from year to year. The annual maintenance contracts generate steady revenues and would grow to the extent that new customers are entering a support agreement.
The percentages of our revenues from these streams are as follows:
Year endedMarch 31, 2013
Year endedMarch 31, 2012
License fees 14% 13%Consulting fees 59% 60%PCS arrangements 27% 27%Total 100% 100%
Operating expenses
The operating expenses of our product business segment consist of costs attributable to the implementation, enhancement, maintenance and continued development, including research and development efforts, of our products. These costs primarily consist of compensation expenses for all professionals working in the products business, project related travel expenses, professional fees paid to software services vendors, the cost of application software for internal use, selling and marketing expenses that consist of commissions payable to our partners, product advertising and marketing expenses and allocated overhead expenses associated with support and monitoring functions such as human resources, facilities and infrastructure expenses, quality assurance and finance and depreciation and amortization. We recognize these expenses as incurred.
Research and development costs are expensed as incurred. Software product development costs are expensed as incurred unless technical feasibility of project is established, future economic benefits are probable, the Group has an intention and ability to complete and use or sell the software and the cost can be measured reliably. Software product development cost incurred subsequent to the achievement of technological feasibility are not material and are expensed as incurred.
Services business
(Amounts in ` million)Year ended
March 31, 2013Year ended
March 31, 2012Services revenues 7,737.45 7,821.55Operating expenses (6,151.45) (5,866.80)Income from operations 1,586.0 1,954.75Operating margin 21% 25%
Services revenues
Our services revenues represented 22% and 25% of our total revenues for the fiscal year ended March 31, 2013 and March 31, 2012. Our services revenues were ` 7,737.45 million in the fiscal year ended March 31, 2013, representing a decrease of 1% from ` 7,821.55 million in the fiscal year ended March 31, 2012.
The contracts relating to our services business are either time or material contracts or fixed price contracts. The percentage of total services revenues from time and material contracts was 70% in fiscal 2013 and 75% in fiscal 2012, with the remainder of our services revenues attributable to fixed price contracts.
We render services through offshore centers located in India, onsite teams operating at our customers’ premises and our development centers located in other parts of the world. Offshore services revenues consists of revenues from work conducted at our development centers in India and for Indian customers at their locations. Onsite revenues consist of work conducted at customer premises outside India and our development centers outside India. The composition of our onsite and offshore revenues is determined by the project lifecycle. Typically, the work involving the design of new systems or relating to a system rollout would be conducted onsite, while the core software development, maintenance and support activity may be conducted offshore. We received 46% and 47% of our services revenues from onsite work and 54% and 53% from offshore work during the fiscal years 2013 and 2012 respectively.

Oracle Financial Services Software – Annual Report 2012-2013
Operating expenses
The operating expenses for services consists primarily of compensation expenses for our employees; cost of application software for internal use, travel expenses and professional fees paid to vendors, facilities related expenses and other overhead expenses associated with support and monitoring functions such as human resources, corporate marketing, information management systems, quality assurance and financial control and depreciation. We recognize these costs as incurred.
Business Process Outsourcing (BPO) services business
(Amounts in ` million)Year ended
March 31, 2013Year ended
March 31, 2012Revenues 991.54 822.40Operating Expenses (597.77) (537.16)Income from operations 393.77 285.24Operating margin 40% 35%
Business Process Outsourcing (BPO) services revenues
Our BPO services revenues represented 3% and 2% of our total revenues for the fiscal year ended March 31, 2013 and 2012 respectively. Our BPO services revenues were ` 991.54 million in the fiscal year ended March 31, 2013, an increase of 21% from` 822.40 million in the fiscal year ended March 31, 2012.
Operating expenses
The operating expenses for BPO Services consist primarily of compensation expenses for our professionals, travel expenses, professional fees paid to vendors, facilities related expenses and other expenses. We recognize these costs as incurred.
Geographic breakup of revenues
Our overall revenues continue to be well diversified. The following table represents the percentage breakup of our revenues for our products and services business by region:
Year ended March 31, 2013 Year ended March 31, 2012Products Revenues
Services Revenues
Total Revenues
Products Revenues
Services Revenues
Total Revenues
North America (NA) 24% 59% 33% 27% 62% 36%Europe, Middle East, Africa (EMEA) 37% 19% 32% 40% 18% 34%Asia Pacific (JAPAC) 39% 22% 35% 33% 20% 30%Total 100% 100% 100% 100% 100% 100%
Customer concentration
Our operations and business depend on our relationships with a large number of customers. Our revenue from our top ten customers, as a percentage of our total revenues is at 38% for fiscal 2013 as against 36% for fiscal year 2012. The top ten customers in our services business contributed 60% of the total services revenues, and the top ten customers in our products business, contributed 40% of the total products revenues during fiscal 2013.
The percentage of total revenues during fiscal years 2013 and 2012 that we derived from our largest customer, largest five customers and largest ten customers is provided in the accompanying table. In the table, various affiliates of Citigroup are classified as separate customers and the last row sets forth the percentage of total revenues we earned from the various affiliates of Citigroup with respect to our products and services business individually and with respect to our business taken as a whole.
Products Revenues Services Revenues Total Revenues2013 2012 2013 2012 2013 2012
Largest customer 18% 14% 10% 14% 14% 11%Top 5 customers 31% 24% 41% 39% 29% 25%Top 10 customers 40% 34% 60% 59% 38% 36%Citigroup and its affiliates 8% 10% 48% 50% 18% 21%
Trade receivables
Trade receivables as of fiscal March 31, 2013 and 2012 were ` 7,279.58 million and ` 8,972.14 million respectively. Our days sales outstanding (which is the ratio of sundry debtors to total sales in a particular year multiplied by 365) for fiscal 2013 and 2012 were

39
approximately 77 and 104 respectively. The Group periodically reviews its trade receivables outstanding as well as the ageing, quality of the trade receivables, customer relationship and the history of the client. The following table represents the age profile of our trade receivables:
Period in days Year endedMarch 31, 2013
Year endedMarch 31, 2012
0-180 91% 80%More than 180 9% 20%Total 100% 100%
Foreign currency and treasury operations
A substantial portion of our revenues is generated in foreign currencies while a majority of our expenses are incurred in Indian Rupees (INR), with the remaining expenses are incurred in various currencies mainly in US Dollars (USD), Australian Dollars (AUD), Singapore Dollars (SGD) and European currencies.
Our philosophy for treasury operations is conservative and we invest funds predominantly in time deposits with well-known and highly rated Indian and foreign banks. The Group has ensured adequate internal controls over asset management, including cash management operations, credit management and debt collection.
The Group also maintains funds mainly in USD, EUR, GBP, JPY and SGD bank accounts or in deposits based on comparative exchange rates, interest rates and currency requirements. The Group books forward covers from time to time in line with its treasury management philosophy.
Comparison of fiscal 2013 with fiscal 2012
Revenues from operations
Our total revenues in the fiscal year ended March 31, 2013 were ` 34,739.99 million, an increase of 10% over our total revenues of ` 31,466.76 million in the fiscal year ended March 31, 2012. The increase in revenues was primarily attributable to an increase in the revenues from our products business.
Products revenues
Our products revenues in the fiscal year ended March 31, 2013 were ` 26,011.00 million, an increase of 14% over our products revenues of ̀ 22,822.81 million in the fiscal year ended March 31, 2012 on the strength of large customer wins in EMEA and JAPAC. The revenues from license fees comprised 14% of the revenues, implementation and customization fees comprised 59% and Annual Maintenance Contracts comprised 27% of the revenues for the fiscal 2013.
Services revenues
Our services revenues represented 22% and 25% of our total revenues for the fiscal year ended March 31, 2013 and March 31, 2012. Our services revenues were ` 7,737.45 million in the fiscal year ended March 31, 2013, a decrease of 1% from ` 7,821.55 million in the fiscal year ended March 31, 2012. Revenues from time and material contracts comprised 70% of the services revenues and fixed price contracts comprised 30% for the fiscal 2013.
Business Process Outsourcing (BPO) revenues
Our revenues from BPO services in the fiscal year ended March 31, 2013 were ` 991.54 million, increase of 21% over our revenues from BPO services of ` 822.40 million in the fiscal year ended March 31, 2012.
Other income, net
Our other income in the fiscal year ended March 31, 2013, was ` 4,595.44 million, as compared to ` 4,217.49 million in the fiscal year ended March 31, 2012. The higher interest income on Bank deposits of ` 1,223.90 million and reduction in net foreign exchange gain of ` 939.70 million have primarily attributed to overall increase of ` 377.95 million in other income.

Oracle Financial Services Software – Annual Report 2012-2013
Expenses
Employee costs
Our employee costs increased by 14% to ` 17,243.55 million in the fiscal year ended March 31, 2013 from ` 15,186.98 million in the fiscal year ended March 31, 2012. Employee costs relate to salaries and bonuses paid to employees.
Travel related expenses (net of recoveries)
Our travel related expenditure increased by 14% to ` 1,645.75 million in the fiscal year ended March 31, 2013 from ` 1,445.10 million in the fiscal year ended March 31, 2012. The overall travel expenses represents 5% of revenue from operations for both the fiscal year ended March 31, 2013 and March 31, 2012.
Professional fees
Our professional fees related expenditure decreased by 10% to ` 1,810.51 million in the fiscal year ended March 31, 2013 from ` 2,005.03 million in the fiscal year ended March 31, 2012. The overall professional fees represents 5% and 6% of revenue from operations for the fiscal year ended March 31, 2013 and March 31, 2012 respectively. Professional fees include services hired from external consultants for various projects.
Other expenses
Our other expenditure increased by 8% to ` 1,848.59 million in the fiscal year ended March 31, 2013 from ` 1,718.63 million in the fiscal year ended March 31, 2012. The other expenses represent 5% of revenue from operations for both the years ended March 31, 2013 and 2012. Other expenses primarily consist of various facilities costs, application software, communication and other miscellaneous expenses.
Depreciation and amortization
Our Depreciation and amortization charge for the year was ` 655.02 million and ` 466.17 million for the year ended March 31, 2013 and March 31, 2012 respectively representing 2% and 1% of revenues from operations for the fiscal year ended March 31, 2013 and March 31, 2012 respectively.
Exceptional item
There are no exceptional items reported during the year ended March 31, 2013.
During the year ended March 31, 2012, the Company settled a customer dispute for full release of all alleged claims and accordingly accounted the balance settlement amount, net of insurance claim, and disclosed the same as an exceptional item.
Income taxes
Our provision for income taxes in the fiscal year ended March 31, 2013 was ` 5,380.58 million, an increase of 6% over our provision for income taxes of ` 5,076.29 million in the fiscal year ended March 31, 2012. Our effective tax rate was 33% in the fiscal year ended March 31, 2013 compared to 36% in the fiscal year ended March 31, 2012.
Profit for the year
As a result of the foregoing factors, net profit has increased by 18% to ` 10,751.43 million in fiscal 2013 from ` 9,092.73 million in fiscal 2012. Our net profit margin has improved to 31% for the fiscal year 2013 as against 29% in the fiscal year 2012. We define profit margins for a particular period as the ratio of profit for the year to revenue from operations during such period.
Liquidity and capital resources
Our capital requirement relate primarily to financing the growth of our business. We have historically financed the majority of our working capital, capital expenditure and other requirements through our operating cash flow. During fiscal 2013 and 2012, we generated cash from operations of ` 11,343.52 million and ` 7,714.09 million respectively.
Oracle Financial Services Software is a zero debt company. We expect that our primary financing requirements in the future will be capital expenditure and working capital requirements in connection with the expansion of our business. We believe that the cash generated from operations will be sufficient to satisfy our currently foreseeable capital expenditure and working capital requirements.
Human capital
We recruit graduates from leading engineering and management institutions. We also hire functional experts from the banking industry. Our employee headcount at the end of the fiscal year ended March 2013 was 9,969 as compared to the employee headcount as on March 2012 at 9,682. The blend of functional knowledge and technical expertise, coupled with in-house training and real–life, experiences in working with financial institutions make our employees unique.
We enjoy cordial relationships with our employees and endeavour to give them an excellent, professionally rewarding and enriching work environment. We operate an effective performance management system, with a focus on employee development. These measures key result areas, competencies and training requirements ensuring all-round employee development.

41
Risks and concerns
Quantitative and Qualitative Disclosures about Market Risk
Our primary market risk exposures are due to the following:
– Foreign exchange rate fluctuations
– Fluctuations in interest rates.
As of March 31, 2013, we had Cash and Bank Balances of ̀ 54,710.29 million out of which ̀ 49,718.30 million was in interest–bearing bank deposits. Consequently, we face an exposure on account of fluctuation in interest rates. These funds were mainly invested in bank deposits of longer maturity (more than 90 days) to earn a higher rate of interest income.
A substantial portion of our revenues is generated in foreign currencies while a majority of our expenses are incurred in Indian Rupees and the balance in US Dollars and European currencies. Our functional currency for Indian operations and consolidated financials is the Indian Rupee. We expect that the majority of our revenues will continue to be generated in foreign currencies for the foreseeable future and a significant portion of our expenses, including personnel costs and capital and operating expenditure, to continue to be incurred in Indian Rupees.
In addition, we face normal business risks such as global competition and country risks pertaining to countries that we operate in.
Analysis of our unconsolidated resultsThe following discussion is based on our audited unconsolidated financial statements, which have been prepared in conformity with accounting principles generally accepted in India and complying in all material respects with the Accounting Standards notified by Companies (Accounting Standards) Rules, 2006 (as amended) and the relevant provisions of the Companies Act, 1956.
You should read the following discussion of our financial condition and results of operations together with the detailed unconsolidated Indian GAAP financial statements and the notes to those statements. Our fiscal year ends on March 31 of each year.
Our total revenues in fiscal 2013 were ` 29,377.01 million, representing an increase of 13% from ` 26,058.54 million in fiscal 2012. The net income in fiscal 2013 was ` 10,292.60 million, against ` 10,892.33 million in fiscal 2012. Our net income margin in fiscal 2013 is at 35% as against 42% in fiscal 2012. We define income margins for a particular period as the ratio of profit for the year to revenue from operations during such period.
Products business
(Amounts in ` million)Year ended
March 31, 2013Year ended
March 31, 2012Product revenues 22,397.34 19,121.73Operating expenses (12,327.08) (10,300.73)Income from operations 10,070.26 8,821.00Operating margin 45% 46%
Products revenues
As of March 31, 2013, our product revenues were ` 22,397.34 million, an increase of 17% from ` 19,121.73 million during the fi scal year ended March 31, 2012. Product revenues represented 76% and 73% of total revenues for fi scal years ended 2013 and 2012 respectively.
Our products revenues comprise license fees, professional fees for implementation and enhancement services and annual maintenance contract (Post Contract Support - PCS) fees for our products.
License fee
Our standard licensing arrangements for products provide the bank a right to use the product up to a limit on number of users or sites or such other usage metric upon the payment of a license fee. The license fee is a function of a variety of quantitative and qualitative factors, including the number of copies sold, the number of users supported, the number and combination of the modules sold and the number of sites and geographical locations supported. The licenses are perpetual, non-exclusive, personal, non transferable and royalty free.
Consulting fee
Along with licenses for our products, our customers can also optionally avail consulting services related to the implementation of products at their sites, integration with other systems or enhancements to address their specifi c requirements. The customer is typically charged a service fee on either a fi xed price basis or a time and material basis based on the professional efforts incurred and associated out of pocket expenses.

Oracle Financial Services Software – Annual Report 2012-2013
Annual maintenance contract (PCS) fees
Customers typically sign an Annual Maintenance Contract with us under which, we provide technical support, maintenance, problem resolution and upgrades for the licensed products. These support agreements typically cover a period of 12 months.
The revenues generated from license fees and consulting services rendered by us depend on factors such as the number of new customers added, milestones achieved, implementation time, etc. Therefore, such revenues typically vary from year to year. The annual maintenance contracts generate steady revenues and would grow to the extent that new customers are entering into a support agreement.
The percentages of our revenues from these streams are as follows:
Year endedMarch 31, 2013
Year endedMarch 31, 2012
License fees 15% 12%Consulting fees 58% 61%PCS arrangements 27% 27%Total 100% 100%
Operating expenses
The operating expenses of our product business segment consist of costs attributable to the implementation, enhancement, maintenance and continued development, including research and development efforts, of our products. These costs primarily consist of compensation expenses for all professionals working in the products business, project related travel expenses, professional fees paid to software services vendors, the cost of application software for internal use, selling and marketing expenses that consist of, product advertising and marketing expenses and allocated overhead expenses associated with support and monitoring functions such as human resources, facilities and infrastructure expenses, quality assurance, fi nance, depreciation and amortization. We recognize these expenses as incurred.
Research and development costs are expensed as incurred. Software product development costs are expensed as incurred unless technical feasibility of project is established, future economic benefi ts are probable, the Group has an intention and ability to complete and use or sell the software and the cost can be measured reliably. Software product development cost incurred subsequent to the achievement of technological feasibility are not material and are expensed as incurred.
Services business
(Amounts in ` million)Year ended
March 31, 2013Year ended
March 31, 2012Services revenues 6,979.67 6,936.81Operating expenses (5,675.33) (5,248.55)Income from operations 1,304.34 1,688.26Operating margin 19% 24 %
Services revenuesOur services revenues represented 24% and 27% of our total revenues for the fi scal year ended March 31, 2013 and 2012 respectively. Our services revenues were ` 6,979.67 million in the fi scal year ended March 31, 2013 and ` 6,936.81 million in the fi scal year ended March 31, 2012.The contracts relating to our services business are either time or material contracts or fi xed price contracts. The percentage of total services revenues from time and material contracts was 71% in fi scal 2013 and 74% in fi scal 2012, with the remainder of our services revenues attributable to fi xed price contracts.We render services through offshore centers located in India, onsite teams operating at our customers’ premises and our development centers located in other parts of the world. Offshore services revenues consists of revenues from work conducted at our development centers in India and for Indian customers at their locations. Onsite revenues consist of work conducted at customer premises outside India and our development center’s outside India. The composition of our onsite and offshore revenues is determined by the project lifecycle. Typically, the work involving the design of new systems or relating to a system rollout would be conducted onsite, while the core software development, maintenance and support activity may be conducted offshore. We received 48% of our services revenues from onsite work and 52% from offshore work during the fi scal years 2013 as against 47% and 53% respectively in the fi scal year 2012.

43
Operating expenses
The operating expenses for services consists primarily of compensation expenses for our software professionals; cost of application software for internal use, travel expenses, professional fees paid to software services vendors, selling, general and administrative expenses and allocated overhead expenses associated with support and monitoring functions such as human resources, corporate marketing, information management systems, quality assurance and fi nancial control and depreciation. We recognize these expenses as incurred.
Geographic breakup of revenues
Our overall revenues continue to be well diversifi ed. The following table represents the percentage breakup of our revenues for our products and services business by region:
Year ended March 31, 2013 Year ended March 31, 2012Products Revenues
Services Revenues
Total Revenues
Products Revenues
Services Revenues
Total Revenues
North America (NA) 22% 54% 30% 24% 57% 33%Europe, Middle East, Africa (EMEA) 39% 22% 35% 38% 18% 33%Asia Pacifi c (JAPAC) 39% 24% 35% 38% 25% 34%Total 100% 100% 100% 100% 100% 100%
Customer concentration
Our operations and business depend on our relationships with a large number of customers. Our revenues from our top ten customers, as a percentage of our total revenues are at 40% for fi scal 2013 as against 34% for fi scal year 2012. The top ten customers in our services business contributed 63% of the total services revenues and the top ten customers in our products business, contributed 42% of the total products revenues during fi scal 2013.
The percentage of total revenues during fi scal years 2013 and 2012 that we derived from our largest customer, largest fi ve customers and largest ten customers is provided in the accompanying table. In the table, various affi liates of Citigroup are classifi ed as separate customers and the last row sets forth the percentage of total revenues we earned from the various affi liates of Citigroup with respect to our products and services business individually and with respect to our business taken as a whole.
Products Revenues Services Revenues Total Revenues2013 2012 2013 2012 2013 2012
Largest customer 18% 14% 11% 12% 14% 11%Top 5 customers 32% 25% 42% 39% 30% 27%Top 10 customers 42% 34% 63% 56% 40% 34%Citigroup and its affi liates 7% 10% 52% 53% 18% 21%
Trade receivables
Trade receivables as of fi scal March 31, 2013 and 2012 were ` 9,685.82 million and ` 11,442.93 million respectively. Our days sales outstanding (which is the ratio of Trade receivables to total revenue from operations in a particular year multiplied by 365) for fi scal 2013 and 2012 were approximately 120 and 160 respectively. The Company periodically reviews its trade receivables outstanding as well as the ageing, quality of the trade receivables, customer relationship and history of the client. The following table represents the age profi le of our trade receivables:
Period in days Year ended March 31, 2013
Year ended March 31, 2012
0-180 81% 84%More than 180 19% 16%Total 100% 100%
Foreign currency and treasury operations
A substantial portion of our revenues is generated in foreign currencies while a majority of our expenses are incurred in Indian Rupees (INR), with the remaining expenses are incurred in various currencies mainly in US Dollars (USD), Australian Dollars (AUD), Singapore Dollars (SGD) and European currencies.
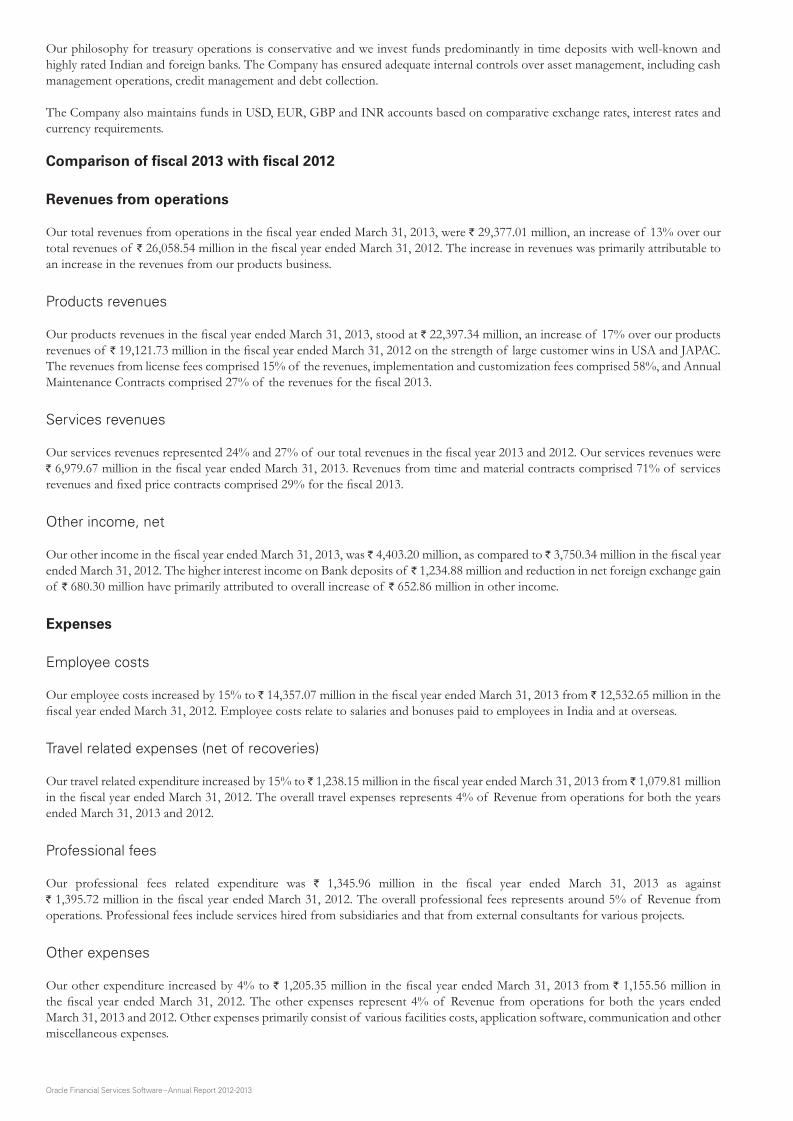
Oracle Financial Services Software – Annual Report 2012-2013
Our philosophy for treasury operations is conservative and we invest funds predominantly in time deposits with well-known and highly rated Indian and foreign banks. The Company has ensured adequate internal controls over asset management, including cash management operations, credit management and debt collection.
The Company also maintains funds in USD, EUR, GBP and INR accounts based on comparative exchange rates, interest rates and currency requirements.
Comparison of fiscal 2013 with fiscal 2012
Revenues from operations
Our total revenues from operations in the fi scal year ended March 31, 2013, were ` 29,377.01 million, an increase of 13% over our total revenues of ` 26,058.54 million in the fi scal year ended March 31, 2012. The increase in revenues was primarily attributable to an increase in the revenues from our products business.
Products revenues
Our products revenues in the fi scal year ended March 31, 2013, stood at ` 22,397.34 million, an increase of 17% over our products revenues of ` 19,121.73 million in the fi scal year ended March 31, 2012 on the strength of large customer wins in USA and JAPAC. The revenues from license fees comprised 15% of the revenues, implementation and customization fees comprised 58%, and Annual Maintenance Contracts comprised 27% of the revenues for the fi scal 2013.
Services revenues
Our services revenues represented 24% and 27% of our total revenues in the fi scal year 2013 and 2012. Our services revenues were ` 6,979.67 million in the fi scal year ended March 31, 2013. Revenues from time and material contracts comprised 71% of services revenues and fi xed price contracts comprised 29% for the fi scal 2013.
Other income, net
Our other income in the fi scal year ended March 31, 2013, was ` 4,403.20 million, as compared to ` 3,750.34 million in the fi scal year ended March 31, 2012. The higher interest income on Bank deposits of ̀ 1,234.88 million and reduction in net foreign exchange gain of ` 680.30 million have primarily attributed to overall increase of ` 652.86 million in other income.
Expenses
Employee costs
Our employee costs increased by 15% to ` 14,357.07 million in the fi scal year ended March 31, 2013 from ` 12,532.65 million in the fi scal year ended March 31, 2012. Employee costs relate to salaries and bonuses paid to employees in India and at overseas.
Travel related expenses (net of recoveries)
Our travel related expenditure increased by 15% to ` 1,238.15 million in the fi scal year ended March 31, 2013 from ` 1,079.81 million in the fi scal year ended March 31, 2012. The overall travel expenses represents 4% of Revenue from operations for both the years ended March 31, 2013 and 2012.
Professional fees
Our professional fees related expenditure was ` 1,345.96 million in the fi scal year ended March 31, 2013 as against ` 1,395.72 million in the fi scal year ended March 31, 2012. The overall professional fees represents around 5% of Revenue from operations. Professional fees include services hired from subsidiaries and that from external consultants for various projects.
Other expenses
Our other expenditure increased by 4% to ` 1,205.35 million in the fi scal year ended March 31, 2013 from ` 1,155.56 million in the fi scal year ended March 31, 2012. The other expenses represent 4% of Revenue from operations for both the years ended March 31, 2013 and 2012. Other expenses primarily consist of various facilities costs, application software, communication and other miscellaneous expenses.
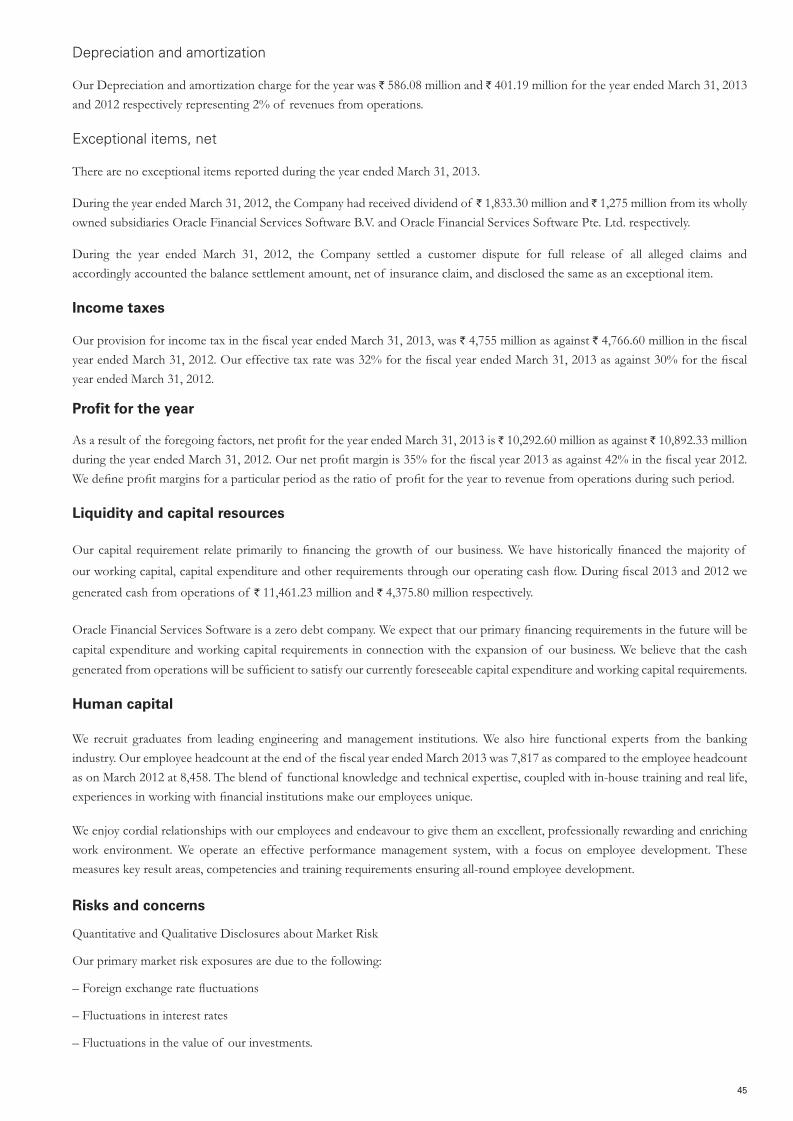
45
Depreciation and amortization
Our Depreciation and amortization charge for the year was ` 586.08 million and ` 401.19 million for the year ended March 31, 2013 and 2012 respectively representing 2% of revenues from operations.
Exceptional items, net
There are no exceptional items reported during the year ended March 31, 2013.
During the year ended March 31, 2012, the Company had received dividend of ` 1,833.30 million and ` 1,275 million from its wholly owned subsidiaries Oracle Financial Services Software B.V. and Oracle Financial Services Software Pte. Ltd. respectively.
During the year ended March 31, 2012, the Company settled a customer dispute for full release of all alleged claims andaccordingly accounted the balance settlement amount, net of insurance claim, and disclosed the same as an exceptional item.
Income taxes
Our provision for income tax in the fi scal year ended March 31, 2013, was ` 4,755 million as against ` 4,766.60 million in the fi scal year ended March 31, 2012. Our effective tax rate was 32% for the fi scal year ended March 31, 2013 as against 30% for the fi scal year ended March 31, 2012.
Profit for the year
As a result of the foregoing factors, net profi t for the year ended March 31, 2013 is ` 10,292.60 million as against ` 10,892.33 million during the year ended March 31, 2012. Our net profi t margin is 35% for the fi scal year 2013 as against 42% in the fi scal year 2012. We defi ne profi t margins for a particular period as the ratio of profi t for the year to revenue from operations during such period.
Liquidity and capital resources
Our capital requirement relate primarily to fi nancing the growth of our business. We have historically fi nanced the majority of our working capital, capital expenditure and other requirements through our operating cash fl ow. During fi scal 2013 and 2012 we generated cash from operations of ` 11,461.23 million and ` 4,375.80 million respectively.
Oracle Financial Services Software is a zero debt company. We expect that our primary fi nancing requirements in the future will be capital expenditure and working capital requirements in connection with the expansion of our business. We believe that the cash generated from operations will be suffi cient to satisfy our currently foreseeable capital expenditure and working capital requirements.
Human capital
We recruit graduates from leading engineering and management institutions. We also hire functional experts from the banking industry. Our employee headcount at the end of the fi scal year ended March 2013 was 7,817 as compared to the employee headcount as on March 2012 at 8,458. The blend of functional knowledge and technical expertise, coupled with in-house training and real life, experiences in working with fi nancial institutions make our employees unique.
We enjoy cordial relationships with our employees and endeavour to give them an excellent, professionally rewarding and enriching work environment. We operate an effective performance management system, with a focus on employee development. These measures key result areas, competencies and training requirements ensuring all-round employee development.
Risks and concerns
Quantitative and Qualitative Disclosures about Market Risk
Our primary market risk exposures are due to the following:
– Foreign exchange rate fl uctuations
– Fluctuations in interest rates
– Fluctuations in the value of our investments.

Oracle Financial Services Software – Annual Report 2012-2013
As of March 31, 2013, we had Cash and Bank Balances of ` 50,183.44 million, out of which ` 49,314.84 million was in interest bearing bank deposits. Consequently, we face an exposure on account of fl uctuation in interest rates. These funds were mainly invested in bank deposits of longer maturity (more than 90 days) to earn a higher rate of interest income.
A substantial portion of our revenues is generated in foreign currencies, while a majority of our expenses are incurred in Indian Rupees and the balance in US Dollars and European currencies. Our functional currency for Indian operations is the Indian Rupee. We expect that the majority of our revenues will continue to be generated in foreign currencies for the foreseeable future and a signifi cant portion of our expenses, including personnel costs and capital and operating expenditure, to continue to be incurred in Indian Rupees.
In addition, we face normal business risks such as global competition and country risks pertaining to countries that we operate in.

47
Consolidated Financials
Financial statements for the year ended March 31, 2013 prepared in accordance with Indian Generally Accepted Accounting Principles (Indian GAAP) (Consolidated).

Oracle Financial Services Software – Annual Report 2012-2013
This page has been intentionally left blank.

49
Independent Auditor’s Report
To the Board of Directors of Oracle Financial Services Software Limited
Report on the Consolidated Financial Statements
We have audited the accompanying consolidated financial statements of Oracle Financial Services Software Limited (the ‘Company’), its subsidiaries and an associate, which comprise the consolidated balance sheet as at March 31, 2013, and the consolidated statement of profit and loss and the consolidated cash flow statement for the year then ended, and a summary of significant accounting policies and other explanatory information.
Management’s Responsibility for the Consolidated Financial Statements
Management is responsible for the preparation of these consolidated financial statements that give a true and fair view of the consolidated financial position, consolidated financial performance and consolidated cash flows of the Company in accordance with accounting principles generally accepted in India. This responsibility includes the design, implementation and maintenance of internal control relevant to the preparation and presentation of the consolidated financial statements that give a true and fair view and are free from material misstatement, whether due to fraud or error.
Auditor’s Responsibility
Our responsibility is to express an opinion on these consolidated financial statements based on our audit. We conducted our audit in accordance with the Standards on Auditing issued by the Institute of Chartered Accountants of India. Those Standards require that we comply with ethical requirements and plan and perform the audit to obtain reasonable assurance about whether the consolidated financial statements are free from material misstatement.
An audit involves performing procedures to obtain audit evidence about the amounts and disclosures in the consolidated financial statements. The procedures selected depend on the auditor’s judgement, including the assessment of the risks of material misstatement of the consolidated financial statements, whether due to fraud or error. In making those risk assessments, the auditor considers internal control relevant to the Company’s preparation and presentation of the consolidated financial statements that give a true and fair view in order to design audit procedures that are appropriate in the circumstances. An audit also includes evaluating the appropriateness of accounting policies used and the reasonableness of the accounting estimates made by management, as well as evaluating the overall presentation of the consolidated financial statements. We believe that the audit evidence we have obtained is sufficient and appropriate to provide a basis for our audit opinion.
Opinion
In our opinion and to the best of our information and according to the explanations given to us, the consolidated financial statements give a true and fair view in conformity with the accounting principles generally accepted in India:
(a) in the case of the consolidated balance sheet, of the state of affairs of the Company as at March 31, 2013;
(b) in the case of the consolidated statement of profit and loss, of the profit for the year ended on that date; and
(c) in the case of the consolidated cash flow statement, of the cash flows for the year ended on that date.
For S. R. Batliboi & Associates LLPChartered AccountantsICAI Firm registration number: 101049W
per Amit MajmudarPartnerMembership No.: 36656
Mumbai, IndiaMay 7, 2013

Oracle Financial Services Software – Annual Report 2012-2013
Consolidated balance sheet as at March 31, 2013
As per our report of even date For and on behalf of the Board of Directors of Oracle Financial Services Software Limited
For S. R. Batliboi & Associates LLP S Venkatachalam Chaitanya Kamat Chartered Accountants Chairman Managing Director ICAI Firm Registration No. 101049W & Chief Executive Officer
per Amit Majmudar Y M Kale Hoshi D Bhagwagar Partner Director Company Secretary Membership No. 36656 & Compliance Officer
Mumbai, India Mumbai, IndiaMay 7, 2013 May 7, 2013
(Amounts in ` million)Notes March 31, 2013 March 31, 2012
EQUITY AND LIABILITIESShareholders’ funds
Share capital 3 420.33 419.87Reserves and surplus 4 73,644.04 62,753.79
74,064.37 63,173.66
Share application money pending allotment 3 (e) – 1.24Non-current liabilities
Deferred tax liability 5 39.56 92.58Other Long-term liabilities 6 276.98 228.54Long-term provisions 7 601.09 563.58
917.63 884.70
Current liabilitiesTrade payables 6 236.93 272.15Other current liabilities 6 7,704.10 6,917.97Short-term provisions 7 1,245.20 929.99
9,186.23 8,120.11
TOTAL 84,168.23 72,179.71
ASSETSNon-current assets
Fixed assetsTangible assets 8 (a) 3,858.39 3,726.89Intangible assets 8 (b) 6,086.63 6,086.63Capital work-in-progress 8 (a) 132.70 544.47
Non-current investments 9 – –Deferred tax assets 5 711.75 707.33Long-term loans and advances 11 6,127.92 4,962.84Other non-current assets 12 1.25 2.85
16,918.64 16,031.01
Current assetsCurrent investments 10 9.98 9.98Trade receivables 13 7,279.58 8,972.14Cash and bank balances 14 54,710.29 39,475.91Short-term loans and advances 11 789.60 2,939.08Other current assets 12 4,460.14 4,751.59
67,249.59 56,148.70
TOTAL 84,168.23 72,179.71
Summary of significant accounting policies 2
The accompanying notes form an integral part of the consolidated financial statements.

51
Consolidated statement of profit and loss for the year ended March 31, 2013
(Amounts in ` million, except share data)Notes Year ended
March 31, 2013 Year ended
March 31, 2012INCOME
Revenue from operations 15 34,739.99 31,466.76Other income, net 16 4,595.44 4,217.49Total income 39,335.43 35,684.25
EXPENSES
Employee costs 17 17,243.55 15,186.98Travel related expenses (net of recoveries) 1,645.75 1,445.10Professional fees 1,810.51 2,005.03Other expenses 18 1,848.59 1,718.63Depreciation and amortization 8 655.02 466.17
Total expenses 23,203.42 20,821.91
Profit before exceptional item and tax 16,132.01 14,862.34Exceptional item 19 – 693.32Profit before tax 16,132.01 14,169.02
Tax expensesCurrent tax 27 5,441.83 5,030.25Deferred tax (61.25) 46.04
Total tax expenses 5,380.58 5,076.29
Profit for the year 10,751.43 9,092.73
Earnings per equity share of par value of ` 5(March 31, 2012 ` 5) each (in `)
20
Basic 127.98 108.34Diluted 127.40 108.23
Summary of significant accounting policies 2
The accompanying notes form an integral part of the consolidated financial statements.
As per our report of even date For and on behalf of the Board of Directors of Oracle Financial Services Software Limited
For S. R. Batliboi & Associates LLP S Venkatachalam Chaitanya Kamat Chartered Accountants Chairman Managing Director ICAI Firm Registration No. 101049W & Chief Executive Officer
per Amit Majmudar Y M Kale Hoshi D Bhagwagar Partner Director Company Secretary Membership No. 36656 & Compliance Officer
Mumbai, India Mumbai, IndiaMay 7, 2013 May 7, 2013

Oracle Financial Services Software – Annual Report 2012-2013
Note 1: Corporate information
Oracle Financial Services Software Limited (the “Company”) was incorporated in India with limited liability on September 27, 1989. The Company is a subsidiary of Oracle Global (Mauritius) Limited (“Oracle”) with Oracle holding 80.27% (March 31, 2012 - 80.36%) ownership interest in the Company as at March 31, 2013.
The Company along with its subsidiaries and associate is principally engaged in the business of providing information technology solutions and knowledge processing services to the financial services industry worldwide. The Company has a suite of banking products, which caters to the needs of corporate, retail, investment banking, treasury operations and data warehousing.
The Company has following subsidiaries and associate (hereinafter collectively referred as the “OFSS group”):
Companies Country of Incorporation
Ownership Interest
Relationship
Direct holdingOracle Financial Services Software B.V. The Netherlands 100% SubsidiaryOracle Financial Services Software Pte. Ltd. Singapore 100% SubsidiaryOracle Financial Services Software America, Inc. United States of America 100% SubsidiaryISP Internet Mauritius Company Republic of Mauritius 100% SubsidiaryOracle (OFSS) Processing Services Limited India 100% SubsidiaryOracle (OFSS) ASP Private Limited India 100% SubsidiaryOracle Financial Services Software Chile Limitada Chile 100% SubsidiaryOracle Financial Services Software (Shanghai) Limited Republic of China 100% SubsidiaryLogin SA France 33% AssociateSubsidiaries of Oracle Financial Services Software America, Inc. Oracle Financial Services Software, Inc. United States of America 100% SubsidiaryMantas Inc. United States of America 100% SubsidiarySubsidiaries of Mantas Inc.Mantas Limited (dissolved on April 10, 2012) United Kingdom 100% SubsidiarySotas Inc. United States of America 100% SubsidiaryMantas Singapore Pte. Ltd. (dissolved on March 1, 2012) Singapore 100% SubsidiarySubsidiaries of Sotas Inc.Mantas India Private Limited India 100% SubsidiarySubsidiary of Oracle Financial Services Software B.V.Oracle Financial Services Software SA Greece 100% SubsidiarySubsidiary of Oracle Financial Services Software Pte. Ltd.Oracle Financial Services Consulting Pte. Ltd. Singapore 100% SubsidiarySubsidiaries of ISP Internet Mauritius CompanyOracle (OFSS) BPO Services Inc. United States of America 100% SubsidiaryOracle (OFSS) BPO Services Limited India 100% Subsidiary
Note 2: Summary of significant accounting policies
(a) Basis of presentation and consolidation
The consolidated financial statements includes the accounts of the Company and its subsidiaries and are prepared in accordance with accounting principles generally accepted in India under the historical cost convention on the accrual basis of accounting and complying in all material respects with the Accounting Standards notified by Companies (Accounting Standards) Rules, 2006 (as amended). The consolidated financial statements have been prepared using uniform accounting policies for like transactions and other events in similar circumstances. The accounting policies have been consistently applied by the OFSS group and are consistent with those used in the previous years’. As these financial statements are not statutory financial statements, full compliance with the Companies Act, 1956 (the ‘Act’) is not required and hence these financial statements do not reflect all the disclosure requirements of the Act.
The consolidated financial statements are prepared in accordance with the principles and procedures required for the preparation and presentation of consolidated financial statements as laid down under Accounting Standard (‘AS’) 21, ‘Consolidated Financials Statements’ and AS 23, ‘Accounting for Investments in Associates in Consolidated Financial Statements’, notified by Companies (Accounting Standards) Rules, 2006 (as amended). The financial statements of the Company and its subsidiaries are consolidated
Notes annexed to and forming part of consolidated financial statements for the year ended March 31, 2013

53
on a line to line basis by adding together like items of assets, liabilities, income and expenses, after eliminating intra-group balances and intra-group transactions resulting in unrealized profits or unrealized cash losses. Any excess of the cost to the parent company of its investment in a subsidiary over the parent company’s portion of equity of subsidiary at the date, at which investment in the subsidiary is made, is described as goodwill and recognized separately as an asset in the consolidated financial statements. Investment in associate company is accounted under equity method in consolidated financial statements.
The significant accounting policies adopted by the OFSS group, in respect of the consolidated financial statements are set out as below:
(b) Use of estimates
The preparation of financial statements in conformity with generally accepted accounting principles requires management to make estimates and assumptions that affect the reported amounts of assets and liabilities and disclosure of contingent liabilities at the date of the financial statements and the results of operations during the reporting year end. Although these estimates are based upon management’s best knowledge of current events and actions, actual results could differ from these estimates.
(c) Fixed assets including intangibles and capital work-in-progress, depreciation, amortization and impairment
Fixed assets including intangibles and capital work-in-progress
Fixed assets including assets under finance lease arrangements are stated at cost less accumulated depreciation. The OFSS group capitalizes all direct costs relating to the acquisition and installation of fixed assets. The cost of fixed assets not ready to use before balance sheet date are disclosed under ‘Capital work-in-progress’. Product Intellectual property rights (IPRs) are capitalized based on a fair value. The OFSS group records the difference between considerations paid to acquire these IPRs and the fair value of assets and liabilities acquired as goodwill. The OFSS group purchases certain specific-use application software, which is in ready to use condition, for internal use. It is estimated that such software has a relatively short useful life, usually less than one year. The OFSS group, therefore, charges to income the cost of acquiring such software.Depreciation and amortization
Depreciation and amortization are computed using straight-line method, at the rates specified in Schedule XIV to the Act or based on the estimated useful life of assets, whichever is higher. Individual assets costing ` 5,000 or less are fully depreciated in the year of acquisition. The estimated useful life considered for depreciation of fixed assets is as follows:
Asset description Asset life (in years) Tangible assetsImprovement of leasehold premises Lesser of 7 years or lease termBuildings 20Computer equipments 3Office equipments 2-7Electricals and other installations 2-7Furniture and fixtures 2-7Vehicles under finance lease Lesser of 3 to 5 years or lease term
Intangible assetsGoodwill on acquisition 3 to 5Product IPR 5PeopleSoft ERP 5
Impairment
Goodwill arising on consolidation is evaluated for impairment annually.
The carrying amounts of assets are reviewed at each balance sheet date if there is any indication of impairment based on internal/external factors. An impairment loss is recognized wherever the carrying amount of an asset exceeds its recoverable amount. The recoverable amount is the greater of the assets net selling price and value in use. In assessing value in use, the estimated future cash flows are discounted to their present value using a pre-tax discount rate that reflects current market assessments of the time value of money and risks specific to assets. After impairment, depreciation is provided on a revised carrying amount of assets over its remaining useful life.
(d) Investments
Investments that are readily realizable and intended to be held for not more than a year from the date on which such investments are made are classified as current investments. All other investments are classified as long-term investments. Trade investments refer to the investments made with the aim of enhancing the OFSS group’s business interests in providing information technology solutions to the financial services industry worldwide.
Long term investments are stated at cost less provision for diminution on account of other than temporary decline in the value of the investment.
Current investments are stated at lower of cost and fair value determined on an individual investment basis.
Oracle Financial Services Software – Annual Report 2012-2013
(e) Foreign currency transactions
Initial recognition
- Foreign currency transactions are recorded in the reporting currency, by applying to the foreign currency amount the exchange rate between the reporting currency and the foreign currency at the date of the transaction.
Conversion
- Foreign currency denominated monetary items are translated into reporting currency at the closing rates of exchange prevailing at the date of the balance sheet. Non-monetary items, which are carried in terms of historical cost denominated in a foreign currency, are reported using the exchange rate at the date of the transaction.
Translation of integral and non-integral foreign operation
- Foreign operations of the OFSS group are classified under integral and non integral foreign operations. The financial statements of integral foreign operations are translated as if the transactions of foreign operations have been those of the Company itself.
- In translating the financial statements of non-integral foreign operations for incorporation in financial statements, the assets and liabilities, both monetary and non-monetary, of the non-integral foreign operations are translated at closing rate, income and expense items of the non-integral foreign operations are translated at the average exchange rate; all the resulting exchange differences are accumulated in foreign currency translation reserve until the disposal of the net investment.
- On the disposal of a non-integral foreign operation, the cumulative amount of the exchange differences which have deferred and which relate to that operation are recognized as income or a expenses in the same period in which the gain or loss on disposal is recognized.
- When there is a change in the classification of a foreign operation, the translation procedures applicable to the revised classification are applied from the date of the change in the classification.
Exchange differences
- Exchange differences arising on the settlement of monetary items or on reporting Company’s monetary items at rates different from those at which they were initially recorded or reported in previous financial statement, are recognized as income or as expenses in the year in which they arise except those arising from investments in non-integral operations.
Forward exchange contracts entered into to hedge foreign currency risk of an existing asset
- The premium or discount arising at the inception of forward exchange contract is amortized and recognized as an expense/income over the life of the contract. Exchange differences on such contracts are recognized in the statement of profit and loss in the period in which the exchange rates change. Any profit or loss arising on cancellation or renewal of such forward exchange contract is also recognized as income or as expense for the period.
(f) Revenue recognition
Revenue is recognized as follows:
Product licenses and related revenue:
- License fees are recognized, on delivery and subsequent milestone schedule as per the terms of the contract with the end user.
- Implementation and customization services are recognized as services are provided, when arrangements are on a time and material basis. Revenue for fixed price contracts is recognized using the proportionate completion method till contracts reach 90% completion. Balance revenue is recognized at the time of receipt of customer acceptance.
- Proportionate completion is measured based upon the efforts incurred to date in relation to the total estimated efforts to complete the contract. The OFSS group monitors estimates of total contract revenue and cost on a routine basis throughout the delivery period. The cumulative impact of any change in estimates of the contract revenue or costs is reflected in the period in which the changes become known. In the event that a loss is anticipated on a particular contract, provision is made for the estimated loss.
- Product maintenance revenue is recognized, over the period of the maintenance contract on a straight line basis.
IT solutions and consulting services:
- Revenue from IT solutions and consulting services are recognized as services are provided, when arrangements are on a time and material basis.
- Revenue from fixed price contracts is recognized using the proportionate completion method till contracts reach 90% completion. Balance revenue is recognized at the time of receipt of customer acceptance. Proportionate completion is measured based upon the efforts incurred to date in relation to the total estimated efforts to complete the contract. The OFSS group monitors estimates of total contract revenue and cost on a routine basis throughout the delivery period. The cumulative impact of any change in estimates of the contract revenue or costs is reflected in the period in which the changes become known. In the event that a loss is anticipated on a particular contract, provision is made for the estimated loss.

55
Business processing services (‘BPO’):
- Revenue from BPO services are recognized as services are provided, as per the arrangement with customers.
The OFSS group presents revenues net of service tax and value added taxes in its consolidated statement of profit and loss.
Cost and revenue in excess of billing is classified as unbilled revenue while billing in excess of revenue is classified as deferred revenue.
Interest income
Interest income is recognized on a time proportion basis taking into account the amount outstanding and the rate applicable.
(g) Research and development expenses for software products
Research costs are expensed as incurred. Software product development costs are expensed as incurred unless technical feasibility of project is established, future economic benefits are probable, the OFSS group has an intention and ability to complete and use or sell the software and the cost can be measured reliably. Software product development costs incurred subsequent to the achievement of technical feasibility are not material and are expensed as incurred.
(h) Retirement and other employee benefits
Provident fund and superannuation fund are defined contribution schemes and the OFSS group has no further obligation beyond the contributions made to the fund. Contributions are charged to statement of profit and loss in the year in which they accrue.
Gratuity liability is a defined benefit obligation and is recorded based on actuarial valuation on projected unit credit method made at the end of the year. Under the gratuity plan, every employee who has completed at least five years of service gets a gratuity on departure @ 15 days of last drawn salary for each completed year of service. The gratuity liability and net periodic gratuity cost is actuarially determined after considering discount rates, expected long term return on plan assets and increase in compensation levels. All actuarial gain/loss are immediately recorded to statement of profit and loss and are not deferred. The Company makes contributions to a fund administered and managed by the Life Insurance Corporation of India (LIC) to fund the gratuity liability. Under this scheme, the obligation to pay gratuity remains with the Company, although LIC administers the scheme.
Short term compensated absences are provided for based on estimates. Long term compensated absences are provided for based on actuarial valuation. The actuarial valuation is done as per projected unit credit method. All actuarial gains/losses are immediately recognized to the statement of profit and loss and are not deferred. The OFSS group presents the entire leave as a current liability in the balance sheet, since it does not have an unconditional right to defer its settlement for 12 months after the balance sheet date.
(i) Leases
Where the Company is the lessee
Lease of assets under which substantially all the risks and benefits incidental to ownership are transferred to the Company are classified as finance leases. These assets are capitalized at the lower of the fair value and present value of the minimum lease payments at the inception of the lease term and disclosed as leased assets. Lease payments are apportioned between the finance charges and reduction of the lease liability based on the implicit rate of return. Finance charges are recognized as finance cost in the statement of profit and loss. Lease management fees, legal charges and other initial direct costs are capitalized.
Leases of assets under which all the risks and rewards of ownership are effectively retained by the lessor are classified as operating leases. Lease payments under operating leases are recognized as an expense in statement of profit and loss on a straight-line basis over the lease term.
(j) Income-tax
Tax expense comprises of current and deferred tax. Current income tax for the Company is measured at the amount expected to be paid to the tax authorities in accordance with the Indian Income Tax Act, 1961.Tax expense relating to overseas operations is determined in accordance with tax laws applicable in countries where such operations are domiciled. Advance taxes and provisions for current income taxes are presented in the balance sheet after off-setting advance taxes paid and income tax provisions arising in the same tax jurisdiction and enterprise.
Deferred income taxes are recognized for the future tax consequences attributable to timing differences between the financial statement determination of income and their recognition for tax purposes. The effect on deferred tax assets and liabilities of a change in tax rates is recognized in statement of profit and loss using the tax rates and tax laws that have been enacted or substantively enacted by the balance sheet date. Deferred tax assets and deferred tax liabilities across various countries of operation are not set off against each other as the company does not have a legal right to do so. Deferred tax assets are recognized and carried forward only to the extent that there is a reasonable certainty that sufficient future taxable income will be available against which such deferred tax assets can be realized. In situations where there are carry forward losses, deferred tax asset is recognized only if there is virtual certainty supported by convincing evidence that future taxable income will be available against which deferred tax asset can be realized. Unrecognized deferred tax assets of earlier years are re-assessed and recognized to the extent that it has become reasonably certain or virtually certain that future taxable income will be available against which deferred tax assets can be realized.

Oracle Financial Services Software – Annual Report 2012-2013
Minimum Alternative Tax (MAT) credit is recognized as an asset only when and to the extent there is convincing evidence that the OFSS group will pay normal income tax during the specified period. In the year in which the MAT credit becomes eligible to be recognized as an asset in accordance with the recommendations contained in guidance note issued by the Institute of Chartered Accountants of India (‘ICAI’), the said asset is created by way of a credit to the statement of profit and loss and shown as MAT Credit Entitlement. The OFSS group reviews the same at each balance sheet date and writes down the carrying amount of MAT Credit Entitlement to the extent there is no longer convincing evidence to the effect that OFSS group will pay normal Income Tax during the specified period.
(k) Earnings per share
The earnings considered in ascertaining the OFSS group’s earnings per share comprise the net profit after tax. The number of shares used in computing basic earnings per share is the weighted average number of shares outstanding during the year. The number of shares used in computing diluted earnings per share comprises the weighted average number of shares considered for deriving basic earnings per share, and also the weighted average number of shares, if any which would have been issued on the conversion of all dilutive potential equity shares. The weighted average number of shares and potentially dilutive equity shares are adjusted for the bonus shares and sub-division of shares. For the purpose of calculating diluted earnings per share, the net profit or loss for the year attributable to equity shareholders and the weighted average number of shares outstanding during the year are adjusted for the effects of all dilutive potential equity shares.
(l) Share based compensation/payments
Measurement and disclosure of the employee share-based payment plans is done in accordance with Securities Exchange Board of India (SEBI) (Employee Stock Option Scheme and Employee Stock Purchase Scheme) Guidelines, 1999 and the Guidance Note on Accounting for Employee Share-based Payments, issued by the ICAI. The OFSS group uses the intrinsic value method of accounting for its employee share based compensation plan and other share based arrangements. Under this method compensation expense is recorded over the vesting period of the option on straight line basis, if the fair market value of the underlying stock exceeds the exercise price at the grant date.
(m) Provisions
A provision is recognized when an enterprise has a present obligation as a result of past event and it is probable that an outflow of resources will be required to settle the obligation, in respect of which a reliable estimate can be made. Provisions are not discounted to its present value and are determined based on management estimate required to settle the obligation at the balance sheet date. These are reviewed at each balance sheet date and adjusted to reflect the current management estimates.
(n) Contingent liabilities
A contingent liability is a possible obligation that arises from past events whose existence will be confirmed by the occurrence or non-occurrence of one or more uncertain future events beyond the control of the OFSS group or a present obligation that is not recognized because it is not probable that an outflow of resources will be required to settle the obligation. The OFSS group does not recognize a contingent liability but discloses its existence in the financial statements.
(o) Cash and cash equivalents
Cash and cash equivalents for purpose of cash flow statement comprise cash at bank and in hand and short term investments with an original maturity of three months or less.

57
(Amounts in ` million)March 31, 2013 March 31, 2012
Note 3: Share capitalAuthorized:100,000,000 (March 31, 2012 - 100,000,000) equity shares of ` 5 each 500.00 500.00
Issued, subscribed and fully paid-up:84,065,478 (March 31, 2012 - 83,973,757) equity shares of ` 5 each 420.33 419.87(a) The Company has only one class of equity shares having a par value of ` 5 per share. Each holder of equity shares is entitled to
one vote per share. In the event of liquidation of the Company, the holders of equity shares will be entitled to receive remaining assets of the
Company, after distribution of all preferential amounts. The distribution will be in proportion to the number of equity shares held by the shareholders.
(b) Details of shareholders holding more than 5% equity shares in the company:
March 31, 2013 March 31, 2012Name of shareholder No. of equity
shares% of equity
sharesNo. of equity
shares% of equity
sharesOracle Global (Mauritius) Limited, holding company 67,481,698 80.27% 67,481,698 80.36%
As per records of the Company, including its register of shareholders/members and other declarations received from shareholders regarding beneficial interest, the above shareholding represents both legal and beneficial ownerships of equity shares.
(c) Reconciliation of equity shares outstanding at the beginning and at the end of the year
March 31, 2013 March 31, 2012No. of equity
sharesAmounts in `
millionNo. of equity
sharesAmounts in `
millionOutstanding at the beginning of year 83,973,757 419.87 83,894,802 419.47Issued during the year - ESOP 91,721 0.46 78,955 0.40Outstanding at the end of year 84,065,478 420.33 83,973,757 419.87
(d) Refer note 24 (b) for details of shares reserved for issue under the employee stock option (ESOP) plan of the Company.
(e) Share application money pending allotment for the year ended March 31, 2012 represents the money received from employees of the Company towards exercise of 500 options at the exercise price of ` 1,290.85 under Employee Stock Option Scheme 2002 (“Scheme 2002”) and 289 options at the exercise price of ̀ 2,050.00 under Employee Stock Option Plan 2010 Scheme (“Scheme 2010”). Each option will entitle one equity share of ` 5 each of the Company at a premium of ` 1,285.85 under Scheme 2002 and ` 2,045.00 under Scheme 2010.
(Amounts in ` million) March 31, 2013 March 31, 2012
Note 4: Reserves and surplus
Securities premiumBalance, beginning of the year 9,648.38 9,574.46Received during the year on exercise of employee stock options 161.23 73.92Balance, end of the year 9,809.61 9,648.38
General reserve 10,145.19 10,145.19
Foreign currency translation reserveBalance, beginning of the year (852.68) (803.60)Addition during the year on net investment in Non integral operations (22.41) (49.08)Balance, end of the year (875.09) (852.68)
Surplus in the statement of profit and lossBalance, beginning of year 43,812.90 34,720.17Profit for the year 10,751.43 9,092.73Balance, end of the year 54,564.33 43,812.90
Total reserves and surplus 73,644.04 62,753.79

Oracle Financial Services Software – Annual Report 2012-2013
(Amounts in ` million) March 31, 2013 March 31, 2012
Note 5: Deferred tax asset (liability)
Deferred tax assetDifference between book and tax depreciation 60.93 98.78Provision for compensated absence 173.25 136.48Provision for gratuity 167.45 136.48Provision for doubtful debts 173.27 218.51Others 136.85 117.08
711.75 707.33Deferred tax liability
Difference between book and tax depreciation –Deferred revenue (39.56) (92.58)
(39.56) (92.58)
672.19 614.75
March 31, 2013 March 31, 2012 Non-current Current Non-current Current
Note 6: Liabilities
Trade payables - Micro and small enterprises* – – – – - Others – 236.93 – 272.15
– 236.93 – 272.15
Accrued Expenses 252.15 2,598.80 216.26 2,530.04Deferred Revenue 24.83 4,472.85 12.28 3,719.51Forward contract payable, net – – – 24.41Advance from customers – 1.88 – 28.84Investor Education and Protection Fund to be credited by unclaimed dividends**
– 1.54 – 2.21
Other liabilities - Withholding and other taxes – 475.90 – 476.73 - Other statutory dues – 153.13 – 136.23
276.98 7,704.10 228.54 6,917.97
276.98 7,941.03 228.54 7,190.12* The identification of Micro and Small Enterprises is based on Management’s knowledge of their status.
** There is no amount due and outstanding as at balance sheet date to be credited to the Investor Education and Protection Fund.
Note 7: ProvisionsFor employee benefits
For gratuity 446.03 77.78 345.18 90.26For compensated absence – 685.04 – 572.57
446.03 762.82 345.18 662.83Other Provision
Taxation, net of advance tax 155.06 482.38 218.40 267.16 155.06 482.38 218.40 267.16
601.09 1,245.20 563.58 929.99

59
No
te 8
(a)
: Tan
gib
le a
sset
s(A
mou
nts i
n `
mill
ion)
Parti
cular
s G
ross
blo
ck
Dep
recia
tion
Net
blo
ckA
s at
Apr
il 01
, 20
12
Add
ition
s S
ale/
delet
ions
Tr
ansla
tion
gain
(los
s)A
s at
Mar
ch 3
1,
2013
As a
tA
pril
01,
2012
For
the
year
S
ale/
delet
ions
Tr
ansla
tion
gain
(los
s) A
s at
Mar
ch 3
1,
2013
As a
tM
arch
31,
20
13
As a
tM
arch
31,
20
12
Free
hold
Lan
d 5
38.3
1 –
–
–
5
38.3
1 –
–
–
–
–
5
38.3
1 5
38.3
1Im
prov
emen
t to
lease
hold
pre
mise
s 4
84.3
6 1
61.1
6 9
0.93
–
5
54.5
9 2
45.8
0 6
0.69
9
0.35
–
2
16.1
4 3
38.4
5 2
38.5
6Bu
ildin
gs [R
efer
not
e be
low
] 1
,985
.92
1.1
3 –
–
1
,987
.05
337
.40
99.
29
–
–
436
.69
1,5
50.3
6 1
,648
.52
Com
pute
r equ
ipm
ents
Ow
ned
1,6
51.5
1 3
34.6
7 5
2.80
0
.68
1,9
34.0
6 1
,361
.04
230
.34
52.
71
0.6
8 1
,539
.35
394
.71
290
.47
Und
er fi
nanc
e lea
se 7
.23
–
7.2
3 –
–
7
.23
–
7.2
3 –
–
–
–
Offi
ce e
quip
men
ts 2
34.1
5 9
.13
21.
45
0.1
0 2
21.9
3 1
70.5
6 2
4.17
2
0.65
0
.10
174
.18
47.
75
63.
59E
lectri
cals
and
othe
r ins
talla
tions
1,0
01.3
6 1
26.2
4 6
9.62
–
1
,057
.98
408
.12
125
.82
67.
45
–
466
.49
591
.49
593
.24
Furn
iture
and
fixt
ures
Ow
ned
778
.33
160
.72
67.
87
–
871
.18
436
.55
108
.53
65.
63
–
479
.45
391
.73
341
.78
Und
er fi
nanc
e lea
se 2
.98
–
2.9
8 –
–
2
.98
–
2.9
8 –
–
–
–
Veh
icles
und
er fi
nanc
e lea
se 3
2.40
–
6
.68
–
25.
72
19.
98
6.1
8 6
.03
–
20.
13
5.5
9 1
2.42
Tota
l 6
,716
.55
793
.05
319
.56
0.7
8 7
,190
.82
2,9
89.6
6 6
55.0
2 3
13.0
3 0
.78
3,3
32.4
3 3
,858
.39
3,7
26.8
9
As a
t Mar
ch 3
1, 2
012
6,2
79.3
9 9
72.4
8 5
36.9
3 1
.61
6,7
16.5
5 3
,020
.27
466
.17
497
.86
1.0
8 2
,989
.66
Cap
ital w
ork-
in-p
rogr
ess
132
.70
544
.47
3,9
91.0
9 4
,271
.36
Not
e:In
clude
s 10
(Mar
ch 3
1, 2
012
- 10)
shar
es o
f `
50/-
eac
h in
Tak
shila
Bui
ldin
g N
o. 9
, Co-
op H
ousin
g So
ciety
Ltd
., M
umba
i.

Oracle Financial Services Software – Annual Report 2012-2013
No
te 8
(b
): In
tan
gib
le a
sset
s
(Am
ount
s in
` m
illio
n)Pa
rticu
lars
Gro
ss b
lock
A
mor
tizat
ion
and
impa
irmen
t los
ses
Net
blo
ck
As a
t A
pril
01,
2012
Add
ition
s S
ale/
delet
ions
Tr
ansla
tion
gain
(los
s)A
s at
Mar
ch 3
1,
2013
As a
t A
pril
01,
2012
For
the
year
S
ale/
delet
ions
Tr
ansla
tion
gain
(los
s)A
s at
Mar
ch 3
1,
2013
As a
t M
arch
31,
20
13
As a
t M
arch
31,
20
12
Goo
dwill
on
co
nsol
idat
ion
[Ref
er
note
belo
w]
6,1
37.7
6 –
–
–
6
,137
.76
51.
13
–
–
–
51.
13
6,0
86.6
3 6
,086
.63
Goo
dwill
on
acqu
isitio
n 1
97.4
7 –
–
–
1
97.4
7 1
97.4
7 –
–
–
1
97.4
7 –
–
Pr
oduc
t IPR
138
.62
–
–
–
138
.62
138
.62
–
–
–
138
.62
–
–
Peop
leSof
t ERP
53.
77
–
–
–
53.
77
53.
77
–
–
–
53.
77
–
–
Tota
l 6
,527
.62
–
–
–
6,5
27.6
2 4
40.9
9 –
–
–
4
40.9
9 6
,086
.63
6,0
86.6
3
As a
t Mar
ch 3
1, 2
012
6,5
27.6
2 –
–
–
6
,527
.62
440
.99
–
–
–
440
.99
Not
e:A
ccum
ulat
ed am
ortiz
atio
n an
d im
pairm
ent l
osse
s as a
t Apr
il 1,
201
2 co
nsist
s of i
mpa
irmen
t of g
oodw
ill o
f Sup
erSo
lutio
ns C
orpo
ratio
n [m
erge
d w
ith O
racle
Fin
ancia
l Ser
vice
s Sof
twar
e, In
c. ef
fect
ive
Janu
ary
2, 2
008]
am
ount
ing
to `
51.
13 m
illio
n.

61
(Amounts in ` million) March 31, 2013 March 31, 2012
Note 9: Non-current investments (trade) (unquoted)(at cost, unless otherwise stated)Sarvatra Technologies Private Limited (formerly known as EBZ Online Private Limited)242,240 (March 31, 2012 - 242,240) equity shares of ` 10 each, fully paid-up 45.00 45.00Less: Provision for diminution in value of investment (45.00) (45.00)Aggregate amount of unquoted investments – –
Aggregate amount of provision for diminution in value ofunquoted trade investments
45.00 45.00
Note 10: Current investments (at cost or fair value, whichever is lower)Non trade (quoted)9% Dhanalakshmi Bank Bond Series VI10 (March 31, 2012 - 10) Bonds of ` 1,000,000 each, fully paid-up 9.98 9.98Aggregate market value of quoted investment 9.98 9.98
March 31, 2013 March 31, 2012 Non-current Current Non-current Current
Note 11: Loans and advances(unsecured, considered good)
Advances recoverable in cash or in kind or for value to be received: Deposits for premises and others 2,470.01 69.10 2,207.63 640.34 Prepaid expenses 8.74 168.32 6.13 226.05 Forward contract receivable, net – 23.48 – – Other advances 425.52 353.96 332.31 487.08 Advance tax, net of provision for taxes ` 13,379.48 million (March 31, 2012 ` 10,353.74 million) 3,193.51 174.74 2,366.82 7.52 MAT credit entitlement 30.14 – 49.95 1,578.09
6,127.92 789.60 4,962.84 2,939.08
Note 12: Other assets
Non-current bank balances [Refer note 14] 1.06 – 2.52 –
Interest accrued on Bank deposits 0.19 916.81 0.33 613.44 Unbilled revenue – 3,401.76 – 3,999.26 Recoverable expenses - billed – 141.57 – 138.89
0.19 4,460.14 0.33 4,751.59
1.25 4,460.14 2.85 4,751.59
Note 13: Trade receivables (unsecured)
(a) Outstanding for a period exceeding six months from date they are due for payment
Consider good – 673.51 – 1,750.76 Consider doubtful 170.74 338.98 631.98 198.79
170.74 1,012.49 631.98 1,949.55 Provision for doubtful receivables (170.74) (338.98) (631.98) (198.79)
– 673.51 – 1,750.76 (b) Other receivables Consider good – 6,606.07 – 7,221.38 Consider doubtful – 16.27 – 0.41
– 6,622.34 – 7,221.79 Provision for doubtful receivables – (16.27) – (0.41)
– 6,606.07 – 7,221.38
– 7,279.58 – 8,972.14
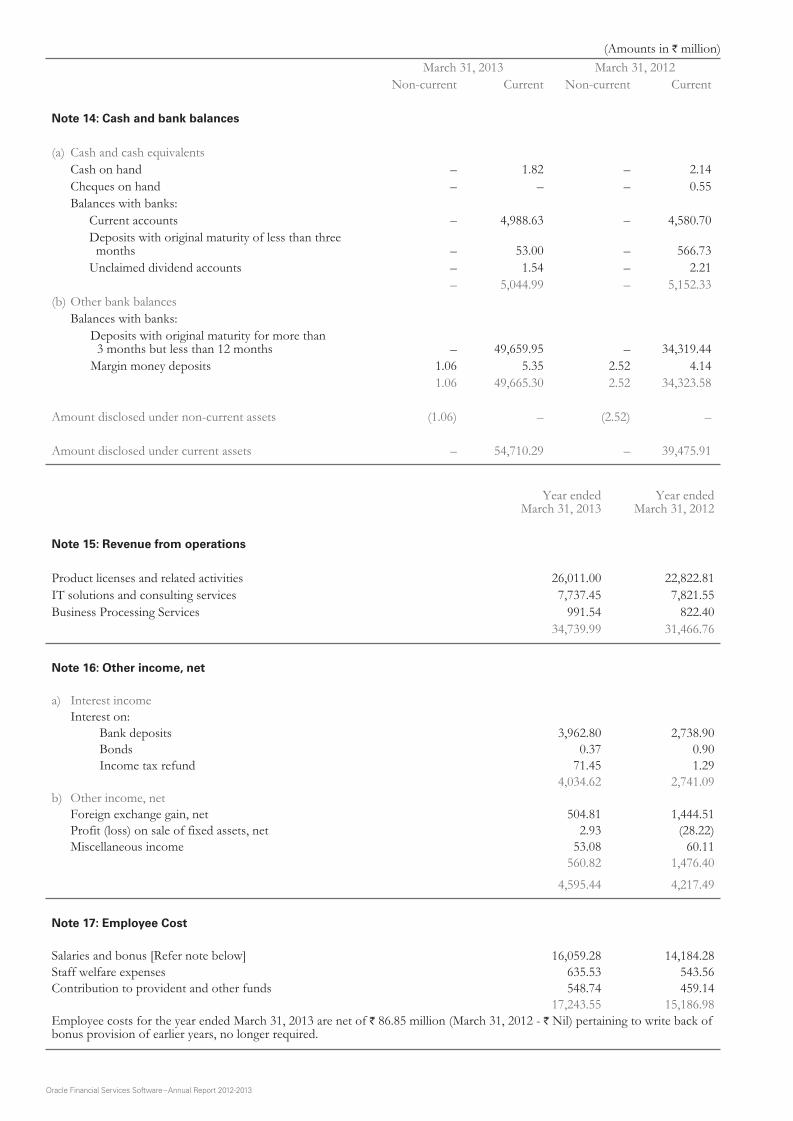
Oracle Financial Services Software – Annual Report 2012-2013
(Amounts in ` million) March 31, 2013 March 31, 2012
Non-current Current Non-current Current
Note 14: Cash and bank balances
(a) Cash and cash equivalents Cash on hand – 1.82 – 2.14 Cheques on hand – – – 0.55 Balances with banks:
Current accounts – 4,988.63 – 4,580.70 Deposits with original maturity of less than three
months – 53.00 – 566.73 Unclaimed dividend accounts – 1.54 – 2.21
– 5,044.99 – 5,152.33 (b) Other bank balances Balances with banks: Deposits with original maturity for more than
3 months but less than 12 months – 49,659.95 – 34,319.44 Margin money deposits 1.06 5.35 2.52 4.14
1.06 49,665.30 2.52 34,323.58
Amount disclosed under non-current assets (1.06) – (2.52) –
Amount disclosed under current assets – 54,710.29 – 39,475.91
Year endedMarch 31, 2013
Year endedMarch 31, 2012
Note 15: Revenue from operations
Product licenses and related activities 26,011.00 22,822.81 IT solutions and consulting services 7,737.45 7,821.55 Business Processing Services 991.54 822.40
34,739.99 31,466.76
Note 16: Other income, net
a) Interest income Interest on:
Bank deposits 3,962.80 2,738.90 Bonds 0.37 0.90 Income tax refund 71.45 1.29
4,034.62 2,741.09 b) Other income, net Foreign exchange gain, net 504.81 1,444.51 Profit (loss) on sale of fixed assets, net 2.93 (28.22) Miscellaneous income 53.08 60.11
560.82 1,476.40
4,595.44 4,217.49
Note 17: Employee Cost
Salaries and bonus [Refer note below] 16,059.28 14,184.28 Staff welfare expenses 635.53 543.56 Contribution to provident and other funds 548.74 459.14
17,243.55 15,186.98 Employee costs for the year ended March 31, 2013 are net of ` 86.85 million (March 31, 2012 - ` Nil) pertaining to write back of bonus provision of earlier years, no longer required.

63
(Amounts in ` million) Year ended
March 31, 2013Year ended
March 31, 2012Note 18: Other expenses
Application software 152.08 149.28Communication expenses 187.92 192.97Rent 538.57 651.62Advertising expenses 3.47 18.19Power 233.95 247.00Insurance 35.33 25.67Repairs and maintenance:
Buildings and leasehold premises 35.15 37.26Computer equipments 42.91 51.98Others 59.59 59.83
Rates and taxes 181.40 157.98Finance charge on leased assets 1.46 1.92Provision for doubtful debts, net (351.28) (182.47)Bad debts 444.31 69.09Miscellaneous expenses 283.73 238.31
1,848.59 1,718.63
Note 19: Exceptional item
Claim against the Company [Refer note below] – 693.32 A customer had filed a lawsuit against the Company and one of its subsidiaries, claiming damages of upwards of ` 5,784.19 million. During the year ended March 31, 2012, the Company settled the said customer dispute for full release of all alleged claims and accordingly accounted the settlement amount, net of insurance claim and disclosed the same as an exceptional item.
Note 20: Reconciliation of basic and diluted shares used in computing earnings per share
Weighted average shares outstanding for basic earnings per share 84,005,687 83,929,749 Add: Effect of dilutive stock options 385,300 82,950 Weighted average shares outstanding for diluted earnings per share 84,390,987 84,012,699
(Amounts in ` million)Note 21: Capital and other commitmentsParticulars March 31, 2013 March 31, 2012Contracts remaining to be executed on capital account not provided for (net of advances) 193.41 470.44Note 22: Leases
Where Company is lessee
Finance lease
The OFSS group takes vehicles under finance lease of upto five years. None of the lease agreements have an escalation clause. Future minimum lease payments under finance lease as at March 31, 2013 and 2012 are as follows:
As at March 31, 2013Principal Interest Total
Not later than one year 5.00 0.52 5.52Later than one year but not later than five years 1.73 0.08 1.81Total minimum payments 6.73 0.60 7.33
As at March 31, 2012Principal Interest Total
Not later than one year 7.25 1.33 8.58Later than one year but not later than five years 7.14 0.64 7.78Total minimum payments 14.39 1.97 16.36

Oracle Financial Services Software – Annual Report 2012-2013
Operating lease
The OFSS group has taken certain office premises and residential premises for employees under operating lease, which expire at various dates through year 2025. Some of these lease agreements have a price escalation clause. Gross rental expenses for the year ended March 31, 2013 aggregated to ` 532.64 million (March 31, 2012 ` 642.34 million). The minimum rental payments to be made in future in respect of these leases are as follows:
March 31, 2013 March 31, 2012Not later than one year 552.86 516.40Later than one year but not later than five years 1,604.35 1,236.92Later than five years 950.18 1,118.38
3,107.39 2,871.70
Note 23: Derivative instruments and unhedged foreign currency exposure
The Company enters into forward foreign exchange contracts where the counter party is a bank. The Company purchases forward foreign exchange contracts to mitigate the risks of change in foreign exchange rate on receivables denominated in certain foreign currencies. The Company considers the risk of non-performance by the counter party as non-material. As at March 31, 2013 the Company has following outstanding derivative instrument:
(Amount in US Dollar million)Particulars March 31, 2013 March 31, 2012Forward contracts – Sell 66.82 30.50in US Dollar
As of balance sheet date, the OFSS group’s net foreign currency exposure that is not hedged is ` 13,873.62 million (March 31, 2012 ` 22,430.78 million).
Note 24: Share based compensation/payments
a) Employee Stock Purchase Scheme (‘ESPS’)
The Company has adopted the ESPS administered through a Trust (“the Trust”) to provide equity based incentives to key employees of the Company. As per the scheme, the Trust can purchase shares of the Company from market using the proceeds of loans obtained from the Company. Such shares are allocated by the Trust to nominated employees at an exercise price, which approximates the fair value on the date of the grant. The shares vest in the employees over a period of five years and the employees can purchase the shares from the Trust over a period of ten years based on continued employment, until which, the Trust holds the shares for the benefit of the employees. The employees are entitled to receive dividends, bonus, etc., that may be declared by the Company from time to time for the entire portion of shares held by the Trust on behalf of the employees. On the acceptance of the offer, the selected employee undertakes to purchase the shares from the Trust within ten years from the date of acceptance of the offer. In case an employee resigns from employment, the rights relating to vested shares, which are eligible for exercise, may be purchased by the employee by payment of the exercise price whereas, the balance shares are forfeited in favor of the Trust. The Trustees have the right of recourse against the employees for any amounts that may remain unpaid on the shares accepted by them. As of the balance sheet date, the Trust has repaid the entire loan obtained from the Company on receipt of payments from employees against shares exercised.The Securities and Exchange Board of India (‘SEBI’) has issued the Employee Stock Option Scheme and Stock Purchase Guidelines, 1999 (‘SEBI guidelines’), which are applicable to stock purchase schemes for employees of all Indian listed companies. In accordance with these guidelines, the excess of market price of the underlying equity shares on the date of grant of the stock options over the exercise price of the options is to be recognized in the books of account and amortized over the vesting period. However, no compensation cost has been recorded as the scheme terms are fixed and the exercise price equals the market price of the underlying stock on the grant date.A summary of the activity in the Company’s ESPS is as follows:
Year endedMarch 31, 2013
Year endedMarch 31, 2012
(Number of shares) (Number of shares)Opening balance of unallocated shares 166,142 166,142Shares forfeited during the year – –Closing balance of unallocated shares 166,142 166,142
Opening balance of allocated shares 18,817 29,081Shares exercised during the year (16,067) (10,264)Shares forfeited during the year – –Closing balance of allocated shares 2,750 18,817Shares eligible for exercise 2,750 18,817Shares not eligible for exercise – –Total allocated shares 2,750 18,817

65
b) Employee Stock Option Plan (‘ESOP’)
Pursuant to ESOP scheme approved by the shareholders of the Company on August 14, 2001, the Board of Directors, onMarch 4, 2002 approved the Employees Stock Option Scheme (“Scheme 2002”) for issue of 4,753,600 options to the employees and directors of the Company and its subsidiaries. According to the Scheme 2002, the Company has granted 4,548,920 options prior to the IPO and 619,000 options at various dates after IPO (including the grants of options out of options forfeited earlier).
On August 25, 2010, the Board of Directors approved the Employees Stock Option Plan 2010 Scheme (“Scheme 2010”) for issue of 618,000 options to the employees and directors of the Company and its subsidiaries. According to the Scheme 2010, the Company has granted 638,000 options (including the grants of options out of options forfeited earlier).
Pursuant to ESOP scheme approved by the shareholders of the Company in their meeting held on August 18, 2011, the Board of Directors approved the Employees Stock Option Plan 2011 Scheme (“Scheme 2011”) for issue of 5,100,000 options to the employees and directors of the Company and its subsidiaries. According to the Scheme 2011, the Company has granted 1,285,500 options till March 31, 2013.
As per the above schemes, each of 20% of the total options granted will vest to the eligible employees and directors on completion of 12, 24, 36, 48 and 60 months from the date of grant and is subject to continued employment of the employee or directorship of the director with the Company or its subsidiaries. Options have exercise period of 10 years from the date of grant. The employee pays the exercise price upon exercise of option.
A summary of the activity in the Company’s ESOP (Scheme 2002) is as follows:
Year ended March 31, 2013 Year ended March 31, 2012 Shares arising from options
Weighted average exercise price (`)
Shares arising from options
Weighted average exercise price (`)
Outstanding at beginning of year 145,212 1,721 245,837 1,414Granted – – – –Exercised (31,932) 1,290 (78,275) 932Forfeited – – (22,350) 1,107Outstanding at end of the year 113,280 1,843 145,212 1,721
Vested options 77,280 97,212Unvested options 36,000 48,000
A summary of the activity in the Company’s ESOP (Scheme 2010) is as follows:
Year ended March 31, 2013 Year ended March 31, 2012 Shares arising from options
Weighted average exercise price (`)
Shares arising from options
Weighted average exercise price (`)
Outstanding at beginning of year 428,344 2,064 561,865 2,050Granted – – 20,000 2,342Exercised (35,574) 2,050 (680) 2,050Forfeited (36,907) 2,050 (152,841) 2,050Outstanding at end of the year 355,863 2,066 428,344 2,064
Vested options 121,853 81,596Unvested options 234,010 346,748
A summary of the activity in the Company’s ESOP (Scheme 2011) is as follows:
Year ended March 31, 2013 Year ended March 31, 2012 Shares arising from options
Weighted average exercise price (`)
Shares arising from options
Weighted average exercise price (`)
Outstanding at beginning of year 617,500 1,937 – –Granted 645,000 3,131 640,500 1,936Exercised (24,215) 1,964 – –Forfeited (66,950) 1,984 (23,000) 1,930Outstanding at end of the year 1,171,335 2,591 617,500 1,937Vested options 88,935 –Unvested options 1,082,400 617,500
The weighted average share price for the year over which stock options were exercised was ` 2,859 (March 31, 2012 - ` 2,234).

Oracle Financial Services Software – Annual Report 2012-2013
The details of options unvested and options vested and exercisable as on March 31, 2013 are as follows:
Exerciseprice (`)
Number of options
Weighted average exerciseprice (`)
Weighted average
remaining contractual life (Years)
Options unvested 1,930 408,400 1,930 8.72,032 32,000 2,032 8.72,050 218,010 2,050 7.42,333 36,000 2,333 7.62,342 16,000 2,342 8.3 3,127 627,000 3,127 9.93,320 15,000 3,320 9.8
Options vested and exercisable 1,291 53,280 1,291 3.1 1,930 88,935 1,930 8.7
2,050 117,853 2,050 7.42,333 24,000 2,333 7.62,342 4,000 2,342 8.3
1,640,478 2,426 8.7
The details of options unvested and options vested and exercisable as on March 31, 2012 were as follows:
Exerciseprice (`)
Number of options
Weighted average exerciseprice (`)
Weighted average
remaining contractual life (Years)
Options unvested 1,930 577,500 1,930 9.72,032 40,000 2,032 9.72,050 326,748 2,050 8.42,333 48,000 2,333 8.62,342 20,000 2,342 9.3
Options vested and exercisable 515 32 515 1.31,291 85,180 1,291 4.12,050 81,596 2,050 8.42,333 12,000 2,333 8.6
1,191,056 1,956 8.8
Stock Options granted during the financial year ended March 31, 2013:
The weighted average fair value of stock options granted during the year was ` 1,765 (March 31, 2012 - ` 1,195).
The Black Scholes valuation model has been used for computing the above weighted average fair value of stock options granted considering the following inputs:
Scheme 2011 Scheme 2011
Exercise Price (in `) 3,320 3,127Expected Volatility 45% 42%Historical Volatility 45% 42%Life of the options granted (Vesting and exercise period) in years 10 10Expected dividends Nil NilAverage risk-free interest rate 7.88% 7.99%Expected dividend rate Nil Nil

67
The expected volatility was determined based on historical volatility data; historical volatility includes early years of the Company’s life; the Company expects the volatility of its share price to reduce as it matures.
The Company measures the cost of ESOP using intrinsic value method. Had compensation cost been determined in a manner consistent with the fair value approach, the Company’s net profit and earnings per share as reported would have changed to the amounts indicated below:
(Amounts in ` million except per share data) March 31, 2013 March 31, 2012Profit as reported 10,751.43 9,092.73 Add: Employee stock compensation under intrinsic value method – – Less: Employee stock compensation under fair value method (385.97) (190.48)Proforma profit 10,365.46 8,902.25
Earnings Per ShareBasic - As reported 127.98 108.34 - Proforma 123.39 106.07Diluted- As reported 127.40 108.23- Proforma 123.03 106.01
Note 25: Employee Benefits Obligation
Defined contribution plans During the year ended March 31, 2013 and 2012, the OFSS group contributed following amounts to defined contributions plans:
(Amounts in ` million)Particulars Year ended
March 31, 2013Year ended
March 31, 2012Provident fund 246.81 212.02Superannuation fund 108.17 81.52
354.98 293.54
Defined benefit plan – gratuity
The amounts recognized in the statement of profit and loss are as follows:
(Amounts in ` million)Particulars Year ended
March 31, 2013Year ended
March 31, 2012Current service cost 60.93 63.77Interest cost 33.14 33.06Expected return on plan assets (0.11) (0.32)Recognized net actuarial loss 41.54 22.87Total included in ‘employee benefit expense’ 135.50 119.38Actual return on plan assets 0.55 0.61
The amounts recognized in the balance sheet are as follows:
Particulars Year ended March 31, 2013
Year ended March 31, 2012
Present value of funded obligations 496.42 408.90Present value of unfunded obligations 31.17 27.99Total defined benefit obligations 527.59 436.89Fair value of plan assets (3.78) (1.45)Net liability 523.81 435.44

Oracle Financial Services Software – Annual Report 2012-2013
Changes in present value of defined benefit obligation representing reconciliation of opening and closing balances thereof are as follows:
(Amounts in ` million)Particulars Year ended
March 31, 2013Year ended
March 31, 2012Defined benefit obligation at beginning of the year 436.89 394.24Current service cost 60.93 63.77Interest cost 33.14 33.06Benefits paid (45.35) (80.64)Actuarial loss 41.98 23.15Liabilities related to employees transferred from a subsidiary – 3.31Defined benefit obligation at end of the year 527.59 436.89
Changes in the fair value of plan assets representing reconciliation of opening and closing balances thereof are as follows:
Particulars Year ended March 31, 2013
Year ended March 31, 2012
Fair value of plan assets at beginning of the year 1.45 15.12Expected return on plan assets 0.11 0.32Actuarial gain 0.44 0.28Contributions by employer 43.28 56.24Benefits paid (41.50) (73.82)Assets related to employees transferred from a subsidiary – 3.31Fair value of plan assets at end of the year 3.78 1.45
Plan assets are administered by LIC and 100% of the plan assets are invested in lower risk assets, primarily in debt securities.
The assumptions used in accounting for the gratuity plan are set out as below:
March 31, 2013 March 31, 2012Discount rate 8.00% 8.30%-8.47%Expected returns on plan assets 7.50% 7.50%Salary escalation rate 8.00% 6.00%-8.00%
The estimates of future salary increase, considered in actuarial valuation, take account of inflation, seniority, promotions and other relevant factors such as supply and demand in the employment market.
The OFSS group evaluates these assumptions annually based on its long-term plans of growth and industry standards. The discount rates are based on current market yields on government bonds consistent with the currency and estimated term of the post employment benefits obligations. Plan assets are administered by the LIC and invested in lower risk assets, primarily debt securities. The expected rate of return on plan assets is based on the expected average long term rate of return on investments of the fund during the terms of the obligation.
The OFSS group’s contribution to gratuity for the year ending March 31, 2014 is expected to be ` 81.55 million.
The expected benefit payments as of March 31, 2013 are below:
Year ending March 31,2014 71.08 2015 65.76 2016 61.96 2017 58.092018-2022 228.72
Present value of the defined benefit obligation, fair value of the plan assets, deficit and experience adjustments in the plan assets and liabilities for current and previous four years are as follows:
Particulars Year March 31, 2013
Year March 31, 2012
Year March 31, 2011
Year March 31, 2010
Year March 31, 2009
Present value of funded obligations (496.42) (408.90) (370.12) (257.77) (231.67)Present value of unfunded obligations (31.17) (27.99) (24.12) (16.04) (8.07)Fair value of plan assets 3.78 1.45 15.12 2.36 1.47Deficit (523.81) (435.44) (379.12) (271.45) (238.27)
Experience adjustments on plan liabilities 26.56 37.17 48.35 (10.68) 3.20Experience adjustments on plan assets 0.44 0.28 0.45 (2.18) 0.26

69
Note 26: Names of Related Parties and description of relationship:
Relationship Names of related parties
(i) Related parties where control exists
Ultimate Holding Company Oracle Corporation
Holding Company Oracle Global (Mauritius) Limited
(ii) Related parties with whom transactions have taken place during the year
Fellow Subsidiaries Oracle America, Inc.Oracle Austria GmbHOracle Bilgisayar Sistemleri Limited SirketiOracle Canada ULCOracle Caribbean, Inc.Oracle (China) Software Systems Company LimitedOracle Colombia LimitadaOracle Corporation (Thailand) Company LimitedOracle Corporation Australia Pty. LimitedOracle Corporation JapanOracle Corporation Malaysia Sdn. Bhd.Oracle Corporation Singapore Pte. Ltd.Oracle Corporation (South Africa)(Pty) LimitedOracle Corporation UK LimitedOracle Czech s.r.o.Oracle Danmark ApSOracle de Mexico, S.A. de C.V.Oracle Deutschland B.V & Co. KGOracle Do Brasil Sistemas LimitadaOracle East Central Europe LimitedOracle East Central Europe Services B.V.Oracle Egypt LimitedOracle France, S.A.S.Oracle Hellas, S.A.Oracle Iberica, S.R.L.Oracle Hungary Kft.Oracle Italia S.r.l.Oracle India Private LimitedOracle Information Systems (Japan) K.K.Oracle Korea, Ltd.Oracle Nederland B.V.Oracle New ZealandOracle Norge ASOracle (Philippines) CorporationOracle Polska, Sp.z.o.o.Oracle Portugal - Sistemas de Informacao Lda.Oracle Research & Development Center, Shenzhen, Ltd.Oracle Romania SRLOracle Software (Schweiz) GmbHOracle Software Systems Israel LimitedOracle Solution Services (India) Private Ltd.Oracle Serbia and Montenegro d.o.oOracle SRBIJA CRNA GORA d.o.o.Oracle Systems Hong Kong limitedOracle Systems Limited - CyprusOracle Systems Limited - Saudi ArabiaOracle Systems Limited - DubaiOracle Systems Pakistan (Private) LimitedOracle Taiwan LLCOracle Vietnam Pte. Ltd.PT Oracle IndonesiaSistemas Oracle de Chile, S.A.
Key Managerial Personnel ('KMP') Chaitanya Kamat - Managing Director & Chief Executive Officer

Oracle Financial Services Software – Annual Report 2012-2013
Transactions and balances outstanding with these parties are described below:
(Amounts in ` million)Transactions Amount receivable (payable)
Year ended March 31, 2013
Year ended March 31, 2012
As at March 31, 2013
As at March 31, 2012
RevenueFellow Subsidiaries
Oracle America, Inc. 1,453.13 916.02 202.62 319.06 Oracle (Philippines) Corporation 63.28 128.85 18.34 111.29 Oracle Austria GmbH 5.05 2.73 – 2.79 Oracle Bilgisayar Sistemleri Limited Sirketi 69.23 1.21 42.46 2.95 Oracle Canada ULC 183.68 115.83 73.38 75.71 Oracle Caribbean, Inc. 31.87 – – – Oracle (China) Software Systems Company Limited 12.77 47.11 – – Oracle Colombia Limitada 211.46 343.03 63.42 197.71 Oracle Corporation (South Africa)(Pty) Limited 665.66 179.12 304.60 104.07 Oracle Corporation (Thailand) Company Limited 158.05 177.62 31.82 91.33 Oracle Corporation Australia Pty. Limited 4,940.05 3,431.61 757.27 1,536.01 Oracle Corporation Malaysia Sdn. Bhd. 98.43 19.22 11.11 37.21 Oracle Corporation Singapore Pte. Ltd. 106.45 3.75 37.50 1.78 Oracle Corporation UK Limited 315.62 176.24 395.22 343.53 Oracle Czech s.r.o. 27.06 30.21 10.37 21.09 Oracle Danmark ApS 224.16 16.90 86.16 7.12 Oracle de Mexico, S.A. de C.V. 18.88 – – – Oracle Deutschland B.V & Co. KG 148.55 – 28.62 – Oracle Do Brasil Sistemas Limitada – 60.18 2.17 2.04 Oracle East Central Europe Limited 88.99 – 77.26 – Oracle East Central Europe Services B.V. 303.35 283.49 33.88 109.93 Oracle Egypt Limited 13.64 28.78 18.06 35.28 Oracle France, S.A.S. 54.78 – 76.73 – Oracle Hellas, S.A. 7.45 – 10.02 – Oracle Hungary Kft. 39.36 35.38 14.89 26.43 Oracle Iberica, S.R.L. 25.19 6.96 18.62 7.49 Oracle India Private Limited 17.96 1.92 – 1.80 Oracle Information Systems (Japan) K.K. 15.10 – – – Oracle Italia S.r.l. 96.36 37.38 35.20 34.38 Oracle Korea, Ltd. 49.73 – 9.39 – Oracle Nederland B.V. 54.25 96.71 68.40 2.24 Oracle New Zealand 10.60 46.54 – – Oracle Norge AS 24.78 51.69 0.11 39.86 Oracle Polska, Sp.z.o.o. 154.98 56.47 26.04 30.25 Oracle Portugal - Sistemas de Informacao Lda. 161.04 219.03 139.43 201.55 Oracle Software (Schweiz) GmbH – 2.66 0.36 2.63 Oracle Serbia and Montenegro d.o.o 47.12 10.36 7.38 – Oracle SRBIJA CRNA GORA d.o.o. 7.85 9.80 4.70 1.51 Oracle Systems Hong Kong limited 519.70 457.14 193.72 113.45 Oracle Systems Limited - Saudi Arabia 510.22 168.86 434.36 186.49 Oracle Systems Pakistan (Private) Limited 96.76 – 22.46 – Oracle Taiwan LLC 100.55 100.49 48.35 114.07 Oracle Vietnam Pte. Ltd. 76.50 103.33 27.47 37.16 PT Oracle Indonesia 74.62 79.11 6.17 9.43 Oracle Romania SRL 214.43 181.41 27.00 110.54 Sistemas Oracle de Chile, S.A. 102.15 0.45 – –
Provision for doubtful debtsFellow subsidiaries
Oracle America, Inc. (7.92) 1.18 (1.32) (9.25)Oracle (Philippines) Corporation 0.01 – (0.01) – Oracle Do Brasil Sistemas Limitada 1.63 – (1.63) –

71
(Amounts in ` million)Transactions Amount receivable (payable)
Year ended March 31, 2013
Year ended March 31, 2012
As at March 31, 2013
As at March 31, 2012
Oracle Canada ULC 3.39 – (3.39) – Oracle Corporation (South Africa)(Pty) Limited 1.04 – (1.04) – Oracle Corporation (Thailand) Company Limited 4.64 – (4.64) – Oracle Corporation Australia Pty. Limited 3.44 – (3.44) – Oracle Corporation Malaysia Sdn. Bhd. 0.12 – (0.12) – Oracle Egypt Limited 5.82 – (5.82) – Oracle Hungary Kft. 0.18 – (0.18) – Oracle Nederland B.V. 0.20 – (0.20) – Oracle Polska, Sp.z.o.o. 0.15 – (0.15) – Oracle Portugal - Sistemas de Informacao Lda. 9.48 – (9.48) – Oracle Systems Hong Kong limited 10.36 – (10.36) – Oracle Systems Limited - Saudi Arabia 0.05 – (0.05) – Oracle Taiwan LLC 0.14 – (0.14) – Oracle Vietnam Pte. Ltd. 0.24 – (0.24) – PT Oracle Indonesia 1.17 – (1.17) – Oracle Romania SRL 0.01 – (0.01) –
Unbilled revenueFellow subsidiaries
Oracle America, Inc. – – 157.73 285.36 Oracle (China) Software Systems Company Limited – – – 47.11 Oracle Canada ULC – – 14.86 29.57 Oracle Colombia Limitada – – 15.65 48.02 Oracle Corporation (South Africa)(Pty) Limited – – 38.21 29.03 Oracle Corporation (Thailand) Company Limited – – 90.39 90.30 Oracle Corporation Australia Pty. Limited – – 1,160.65 591.18 Oracle Corporation Malaysia Sdn. Bhd. – – 10.52 7.27 Oracle Corporation Singapore Pte. Ltd. – – 19.66 – Oracle Czech s.r.o. – – 0.75 7.01 Oracle Danmark ApS – – 19.12 7.01 Oracle East Central Europe Limited – – 8.19 – Oracle de Mexico, S.A. de C.V. – – 18.88 – Oracle East Central Europe Services B.V. – – 42.25 25.26 Oracle Egypt Limited – – – 12.29 Oracle Hungary Kft. – – 0.26 8.34 Oracle India Private Limited – – 17.71 – Oracle Italia S.r.l. – – 7.50 2.04 Oracle Korea, Ltd. – – 3.01 – Oracle Nederland B.V. – – – 82.96 Oracle New Zealand – – – 46.54 Oracle Norge AS – – – 1.23 Oracle (Philippines) Corporation – – 0.50 2.64 Oracle Serbia and Montenegro d.o.o – – 1.56 10.36 Oracle SRBIJA CRNA GORA d.o.o. – – 1.33 1.91 Oracle Polska, Sp.z.o.o. – – 6.63 6.09 Oracle Portugal - Sistemas de Informacao Lda. – – 9.67 15.77 Oracle Romania SRL – – 28.35 39.38 Oracle Systems Hong Kong limited – – 37.16 130.94 Oracle Systems Limited - Saudi Arabia – – 79.24 8.08 Oracle Systems Pakistan (Private) Limited – – 2.99 – Oracle Taiwan LLC – – 13.91 1.55 Oracle Vietnam Pte. Ltd. – – 0.11 36.76 PT Oracle Indonesia – – 16.28 10.75 Sistemas Oracle de Chile, S.A. – – – 0.45

Oracle Financial Services Software – Annual Report 2012-2013
(Amounts in ` million)Transactions Amount receivable (payable)
Year ended March 31, 2013
Year ended March 31, 2012
As at March 31, 2013
As at March 31, 2012
Deferred RevenueFellow subsidiaries
Oracle America, Inc. – – (89.77) (20.82)Oracle Austria GmbH – – (2.98) (1.50)Oracle Bilgisayar Sistemleri Limited Sirketi – – (4.18) – Oracle Canada ULC – – (1.20) – Oracle Caribbean, Inc. – – (7.43) – Oracle Colombia Limitada – – (50.89) (24.35)Oracle Corporation (Thailand) Company Limited – – (11.55) (6.93)Oracle Corporation Australia Pty. Limited – – (320.75) (210.28)Oracle Corporation Malaysia Sdn. Bhd. – – (9.69) (15.99)Oracle Corporation Singapore Pte. Ltd. – – (14.48) (1.99)Oracle Corporation UK Limited – – (174.01) (149.50)Oracle Corporation (South Africa)(Pty) Limited – – (54.10) (3.36)Oracle East Central Europe Limited – – (14.90) – Oracle Czech s.r.o. – – (0.02) – Oracle Danmark ApS – – (0.18) – Oracle Deutschland B.V & Co. KG – – (4.55) – Oracle East Central Europe Services B.V. – – (17.16) (6.01)Oracle Egypt Limited – – – (8.33)Oracle France, S.A.S. – – (11.86) – Oracle Hellas, S.A. – – (0.98) – Oracle Hungary Kft. – – (0.45) – Oracle Iberica, S.R.L. – – (7.64) (6.43)Oracle Italia S.r.l. – – (11.68) (4.38)Oracle Korea, Ltd. – – (0.25) – Oracle Nederland B.V. – – (20.87) (2.32)Oracle New Zealand – – (7.54) – Oracle Norge AS – – – (21.53)Oracle (Philippines) Corporation – – (8.04) (1.15)Oracle Polska, Sp.z.o.o. – – (1.98) (1.17)Oracle Portugal - Sistemas de Informacao Lda. – – (32.37) (28.98)Oracle Serbia and Montenegro d.o.o – – (2.70) – Oracle SRBIJA CRNA GORA d.o.o. – – (0.80) (0.25)Oracle Systems Hong Kong limited – – (33.75) (7.51)Oracle Systems Limited - Saudi Arabia – – (58.53) (27.89)Oracle Systems Pakistan (Private) Limited – – (8.83) – Oracle Taiwan LLC – – (16.52) (13.43)Oracle Vietnam Pte. Ltd. – – (7.36) (2.48)PT Oracle Indonesia – – (16.89) (2.42)Oracle Romania SRL – – (13.11) – Sistemas Oracle de Chile, S.A. – – (8.44) –
Professional fee expensesFellow subsidiaries
Oracle America, Inc. 20.21 0.04 (20.21) – Oracle India Private Limited 200.66 89.71 (181.11) (80.74)Oracle Solution Services (India) Private Ltd. – 1.84 – – Oracle Research & Development Center, Shenzhen, Ltd. 114.61 133.23 (23.42) (81.54)Oracle Iberica, S.R.L. 8.01 – (3.71) – Oracle Bilgisayar Sistemleri Limited Sirketi – (0.01) – – Oracle Canada ULC – 0.12 – – Oracle Do Brasil Sistemas Limitada – – – (0.01)Oracle Corporation (Thailand) Company Limited – (0.73) – (1.54)Oracle Corporation Australia Pty. Limited – 1.65 – (0.59)

73
(Amounts in ` million)Transactions Amount receivable (payable)
Year ended March 31, 2013
Year ended March 31, 2012
As at March 31, 2013
As at March 31, 2012
Oracle Corporation Malaysia Sdn. Bhd. – 0.02 – (0.12)Oracle Egypt Limited – – – (0.18)Oracle Portugal - Sistemas de Informacao Lda. – 0.01 – (1.33)Oracle Systems Hong Kong limited – (0.11) – – Oracle Vietnam Pte. Ltd. – (0.05) – – Sistemas Oracle de Chile, S.A. – (0.11) – –
Application software expensesFellow subsidiaries
Oracle India Private Limited 58.35 64.40 (11.33) (18.90)Oracle Systems Limited - Saudi Arabia – 0.37 – (0.74)Oracle Caribbean, Inc. 1.19 – (1.73) (0.21)Oracle Software Systems Israel Limited 0.86 0.42 (0.42) – Oracle Corporation Singapore Pte. Ltd. 2.77 – – –
Other expensesFellow subsidiaries
Oracle America, Inc. – 0.26 – – Oracle India Private Limited 4.21 1.39 – – Oracle Corporation Singapore Pte. Ltd. 3.93 1.48 – (0.16)Oracle Corporation (South Africa)(Pty) Limited 12.40 12.39 – – Oracle Hellas, S.A. 0.08 0.50 – –
Procurement of fixed assetsFellow Subsidiaries
Oracle Corporation Singapore Pte. Ltd. 64.23 46.91 – –
Security DepositOracle India Private Limited – – 0.89 0.89
Rent expensesFellow subsidiaries
Oracle India Private Limited 4.22 6.17 – – Oracle Korea, Ltd. 0.12 0.15 (0.12) – Oracle (China) Software Systems Company Limited 0.52 – (0.15) – Oracle Corporation Australia Pty. Limited 5.63 1.98 (3.43) – Oracle Corporation UK Limited (6.96) (2.31) 2.34 (2.31)Oracle Corporation Singapore Pte. Ltd. 1.84 1.30 – 1.30 Oracle (Philippines) Corporation – 0.02 – – Oracle Corporation Malaysia Sdn. Bhd. 0.13 0.19 – 0.03 Oracle America, Inc. 18.59 17.03 – – Oracle Systems Limited - Cyprus – 0.43 – (0.08)Oracle Systems Hong Kong limited 1.06 1.58 (0.05) 0.13 Oracle Nederland B.V. 16.18 7.09 (1.63) 1.86 Oracle France, S.A.S. 2.32 1.94 – – Oracle Taiwan LLC 1.03 0.92 (0.09) 0.08 Oracle Corporation Japan 24.45 22.54 – – Sistemas Oracle de Chile, S.A. – 18.47 – – Oracle Systems Limited - Dubai 12.02 – – –
Rent incomeFellow subsidiaries
Oracle India Private Limited 13.91 – – –
Key Managerial personnelRemuneration [Refer note 1 below] 27.94 29.41 – –
Note 1: Remuneration includes salary, bonus and perquisites. The bonus is included on payment basis. As the liabilities for gratuity and compensated absence are provided on an actuarial basis for the Company as a whole, the amounts pertaining to individual KMP are not included above. During the year, 100,000 options under the Scheme 2011 (March 31, 2012 - 30,000 options under the Scheme 2011) were granted to KMP.

Oracle Financial Services Software – Annual Report 2012-2013
Note 27: Tax expenses
Current tax charge for the year ended March 31, 2013 includes prior year net reversal of ` 321.15 million.
Note 28: Segment information
Business segments are defined as a distinguishable component of an enterprise that is engaged in providing a group of related products or services and that is subject to differing risks and returns and about which separate financial information is available. This information is reviewed and evaluated regularly by the management in deciding how to allocate resources and in assessing the performance.The OFSS group is organized by business segment and geographically. For management purposes the OFSS group is primarily organized on a worldwide basis into three business segments:a) Product licenses and related activities (‘Products’)b) IT solutions and consulting services (‘Services’) and c) Business Processing Services (‘BPO - Services’)The business segments are the basis on which the OFSS group reports its primary operational information to management. Product licenses and related activities segment deals with various banking software products. The related activities include enhancements, implementation and maintenance activities.IT solutions and consulting services segment offers services spanning the entire lifecycle of applications used by financial service institutions. The division’s portfolio includes Consulting, Application, Support and Technology Services that help institutions improve efficiency, optimize costs, meet risk and compliance mandates and implement IT solutions finely attuned to their business needs. BPO - Services comprises of business process outsourcing services to the Lending, Collections, Customer Service, Capital Markets industry.
(Amounts in ` million)Year ended
March 31, 2013Particulars Products Services BPO - Services Total
Revenue 26,011.00 7,737.45 991.54 34,739.99
Segment result 10,621.12 1,586.00 393.77 12,600.89 Unallocable expenses (1,064.32)Other income, net 4,595.44 Profit before tax 16,132.01 Tax expenses [Refer note 27] (5,380.58)Net profit 10,751.43
Year endedMarch 31, 2012
Particulars Products Services BPO - Services Total Revenue 22,822.81 7,821.55 822.40 31,466.76
Segment result 9,744.61 1,954.75 285.24 11,984.60
Unallocable expenses (1,339.75)Other income, net 4,217.49 Profit before exceptional item and tax 14,862.34 Exceptional item [Refer note 19] (693.32)Profit before tax 14,169.02 Tax expenses (5,076.29)Net profit 9,092.73

75
(Amounts in ` million)Year ended
March 31, 2013 Other information
Particulars Products Services BPO - Services
Unallocable Total
Capital expenditure by segment Tangible assets 659.31 98.12 2.37 33.25 793.05 Depreciation and amortization 349.27 208.73 13.03 83.99 655.02 Other non cash expenses 71.11 22.90 (0.98) – 93.03 Segment assets 16,663.71 4,485.05 242.86 62,776.61 84,168.23 Segment liabilities 7,606.14 2,177.00 153.45 167.27 10,103.86 Shareholders' funds 74,064.37 74,064.37
Year endedMarch 31, 2012
Other information Particulars Products Services BPO -
Services Unallocable Total
Capital expenditure by segment Tangible assets 469.81 361.51 9.59 131.56 972.47 Depreciation and amortization 195.71 163.69 21.99 84.78 466.17 Other non cash expenses (80.00) (31.63) (1.75) – (113.38)Segment assets 18,402.49 4,173.98 245.72 49,357.52 72,179.71 Segment liabilities 6,190.42 2,096.91 136.07 581.41 9,004.81 Share application money pending allotment 1.24 1.24 Shareholders' funds 63,173.66 63,173.66
Segment revenue and expense:
Revenue is generated through licensing of software products as well as by providing software solutions to the customers including consulting services and business process outsourcing services. The expenses which are not directly attributable to a business segment are classified as unallocable expenses.
Segment assets and liabilities:
Segment assets include all operating assets used by a segment and consist principally of trade receivables, net of allowances, unbilled revenue, deposits for premises and fixed assets. Segment liabilities primarily includes deferred revenues, advance from customer, Accrued employee cost and other current liabilities. While most such assets and liabilities can be directly attributed to individual segments, the carrying amount of certain assets and liabilities used jointly by two or more segments is allocated to the segment on a reasonable basis. Assets and liabilities that cannot be allocated between the segments are shown as part of unallocable assets and liabilities.
Geographical segments:
The following table shows the distribution of the OFSS group’s consolidated sales by geographical market:
Year endedMarch 31, 2013
Year endedMarch 31, 2012
Regions Amounts in ` million
% Amounts in ` million
%
United States of America 10,609.38 30% 10,670.58 34%Europe 6,704.28 19% 6,238.09 20%Asia Pacific 10,707.85 31% 9,342.97 30%Middle East, India and Africa 5,837.87 17% 4,528.60 14%Latin America and Caribbean 880.61 3% 686.52 2%
34,739.99 100% 31,466.76 100%

Oracle Financial Services Software – Annual Report 2012-2013
The following table shows the OFSS group’s consolidated assets by geographical market:
Year endedMarch 31, 2013
Year endedMarch 31, 2012
Regions Amounts in ` million
% Amounts in ` million
%
United States of America 8,227.02 10% 9,078.88 13%Europe 4,519.13 5% 5,028.98 7%Asia Pacific 7,193.02 9% 9,055.63 13%Middle East, India and Africa 63,661.48 75% 48,658.29 66%Latin America and Caribbean 567.58 1% 357.93 1%
84,168.23 100% 72,179.71 100%
The following table shows the OFSS group’s consolidated additions to fixed assets and intangible assets by geographical market:
Year endedMarch 31, 2013
Year endedMarch 31, 2012
Regions Amounts in ` million
% Amounts in ` million
%
United States of America 5.45 1% 12.36 1%Europe 3.10 0% 49.57 5%Asia Pacific 5.84 1% 8.82 1%Middle East, India and Africa 777.84 98% 901.06 93%Latin America and Caribbean 0.82 0% 0.66 0%
793.05 100% 972.47 100%
Note 29:
Previous year’s figures have been reclassified, where necessary to conform with current period’s presentation.
As per our report of even date For and on behalf of the Board of Directors of Oracle Financial Services Software Limited
For S. R. Batliboi & Associates LLP S Venkatachalam Chaitanya Kamat Chartered Accountants Chairman Managing Director ICAI Firm Registration No. 101049W & Chief Executive Officer
per Amit Majmudar Y M Kale Hoshi D Bhagwagar Partner Director Company Secretary Membership No. 36656 & Compliance Officer
Mumbai, India Mumbai, IndiaMay 7, 2013 May 7, 2013
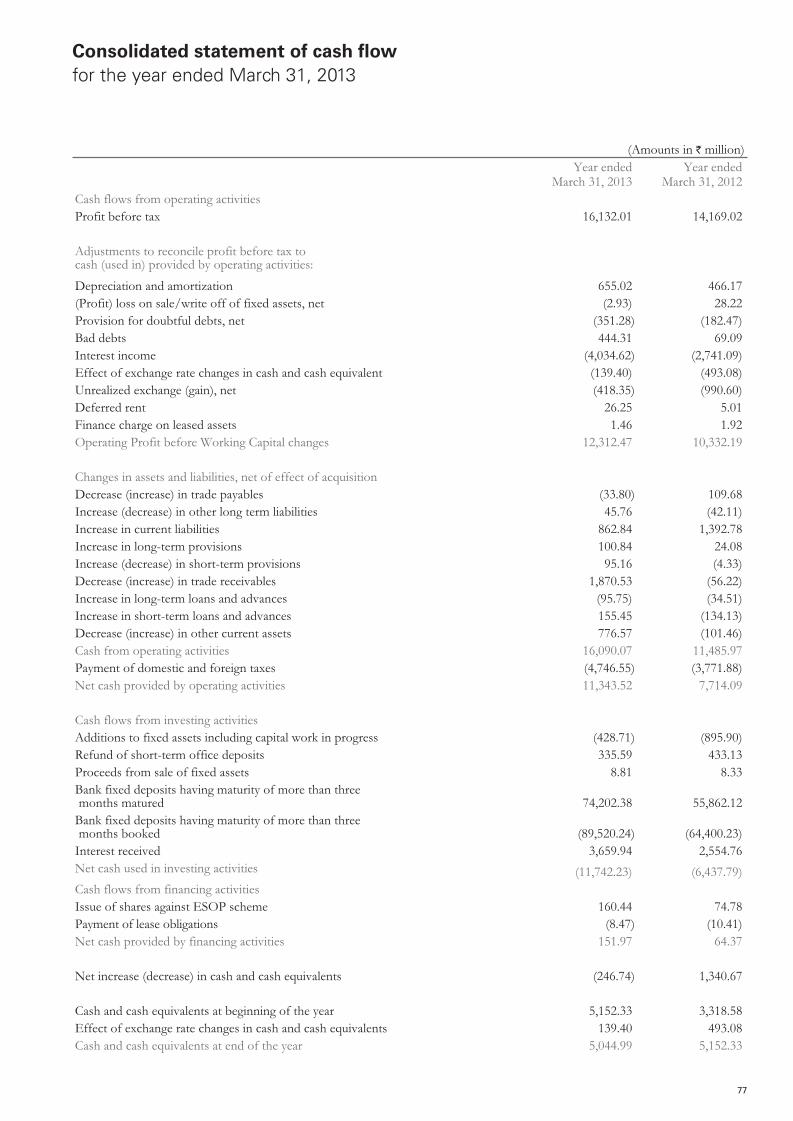
77
(Amounts in ` million) Year ended
March 31, 2013 Year ended
March 31, 2012Cash flows from operating activitiesProfit before tax 16,132.01 14,169.02
Adjustments to reconcile profit before tax tocash (used in) provided by operating activities:Depreciation and amortization 655.02 466.17 (Profit) loss on sale/write off of fixed assets, net (2.93) 28.22 Provision for doubtful debts, net (351.28) (182.47)Bad debts 444.31 69.09 Interest income (4,034.62) (2,741.09)Effect of exchange rate changes in cash and cash equivalent (139.40) (493.08)Unrealized exchange (gain), net (418.35) (990.60)Deferred rent 26.25 5.01 Finance charge on leased assets 1.46 1.92 Operating Profit before Working Capital changes 12,312.47 10,332.19
Changes in assets and liabilities, net of effect of acquisitionDecrease (increase) in trade payables (33.80) 109.68 Increase (decrease) in other long term liabilities 45.76 (42.11)Increase in current liabilities 862.84 1,392.78 Increase in long-term provisions 100.84 24.08 Increase (decrease) in short-term provisions 95.16 (4.33)Decrease (increase) in trade receivables 1,870.53 (56.22)Increase in long-term loans and advances (95.75) (34.51)Increase in short-term loans and advances 155.45 (134.13)Decrease (increase) in other current assets 776.57 (101.46)Cash from operating activities 16,090.07 11,485.97 Payment of domestic and foreign taxes (4,746.55) (3,771.88)Net cash provided by operating activities 11,343.52 7,714.09
Cash flows from investing activitiesAdditions to fixed assets including capital work in progress (428.71) (895.90)Refund of short-term office deposits 335.59 433.13 Proceeds from sale of fixed assets 8.81 8.33 Bank fixed deposits having maturity of more than three months matured 74,202.38 55,862.12
Bank fixed deposits having maturity of more than three months booked (89,520.24) (64,400.23)
Interest received 3,659.94 2,554.76 Net cash used in investing activities (11,742.23) (6,437.79)Cash flows from financing activitiesIssue of shares against ESOP scheme 160.44 74.78 Payment of lease obligations (8.47) (10.41)Net cash provided by financing activities 151.97 64.37
Net increase (decrease) in cash and cash equivalents (246.74) 1,340.67
Cash and cash equivalents at beginning of the year 5,152.33 3,318.58 Effect of exchange rate changes in cash and cash equivalents 139.40 493.08 Cash and cash equivalents at end of the year 5,044.99 5,152.33
Consolidated statement of cash flowfor the year ended March 31, 2013

Oracle Financial Services Software – Annual Report 2012-2013
Consolidated statement of cash flowfor the year ended March 31, 2013 (continued)
(Amounts in ` million) Year ended
March 31, 2013 Year ended
March 31, 2012Component of cash and cash equivalentsCash on hand 1.82 2.14 Cheques on hand – 0.55 Balances with banks: Current accounts 4,988.63 4,580.70 Deposit accounts with original maturity of less than 3 months 53.00 566.73 Unclaimed dividend accounts 1.54 2.21 Total cash and cash equivalents [Refer note 14 (a)] 5,044.99 5,152.33
As per our report of even date For and on behalf of the Board of Directors of Oracle Financial Services Software Limited
For S. R. Batliboi & Associates LLP S Venkatachalam Chaitanya Kamat Chartered Accountants Chairman Managing Director ICAI Firm Registration No. 101049W & Chief Executive Officer
per Amit Majmudar Y M Kale Hoshi D Bhagwagar Partner Director Company Secretary Membership No. 36656 & Compliance Officer
Mumbai, India Mumbai, IndiaMay 7, 2013 May 7, 2013

79
Unconsolidated Financials
Financial statements for the year ended March 31, 2013 prepared in accordance with Indian Generally Accepted Accounting Principles (Indian GAAP) (Unconsolidated).

Oracle Financial Services Software – Annual Report 2012-2013
This page has been intentionally left blank.

81
Independent Auditor’s Report
To the Members of Oracle Financial Services Software Limited
Report on the Financial Statements
We have audited the accompanying financial statements of Oracle Financial Services Software Limited (the ‘Company’), which comprise the balance sheet as at March 31, 2013, and the statement of profit and loss and cash flow statement for the year then ended, and a summary of significant accounting policies and other explanatory information.Management’s Responsibility for the Financial Statements
Management is responsible for the preparation of these financial statements that give a true and fair view of the financial position, financial performance and cash flows of the Company in accordance with accounting principles generally accepted in India, including the Accounting Standards referred to in sub-section (3C) of section 211 of the Companies Act, 1956 (the ‘Act’). This responsibility includes the design, implementation and maintenance of internal control relevant to the preparation and presentation of the financial statements that give a true and fair view and are free from material misstatement, whether due to fraud or error.Auditor’s Responsibility
Our responsibility is to express an opinion on these financial statements based on our audit. We conducted our audit in accordance with the Standards on Auditing issued by the Institute of Chartered Accountants of India. Those Standards require that we comply with ethical requirements and plan and perform the audit to obtain reasonable assurance about whether the financial statements are free from material misstatement.An audit involves performing procedures to obtain audit evidence about the amounts and disclosures in the financial statements. The procedures selected depend on the auditor’s judgment, including the assessment of the risks of material misstatement of the financial statements, whether due to fraud or error. In making those risk assessments, the auditor considers internal control relevant to the Company’s preparation and fair presentation of the financial statements in order to design audit procedures that are appropriate in the circumstances. An audit also includes evaluating the appropriateness of accounting policies used and the reasonableness of the accounting estimates made by management, as well as evaluating the overall presentation of the financial statements. We believe that the audit evidence we have obtained is sufficient and appropriate to provide a basis for our audit opinion.Opinion
In our opinion and to the best of our information and according to the explanations given to us, the financial statements give the information required by the Act in the manner so required and give a true and fair view in conformity with the accounting principles generally accepted in India:(a) in the case of the balance sheet, of the state of affairs of the Company as at March 31, 2013;(b) in the case of the statement of profit and loss, of the profit for the year ended on that date; and(c) in the case of the cash flow statement, of the cash flows for the year ended on that date.Report on Other Legal and Regulatory Requirements
1. As required by the Companies (Auditor’s Report) Order, 2003 (the ‘Order’) issued by the Central Government of India in terms of sub-section (4A) of section 227 of the Act, we give in the Annexure a statement on the matters specified in paragraphs 4 and 5 of the Order.
2. As required by section 227(3) of the Act, we report that:(a) We have obtained all the information and explanations which to the best of our knowledge and belief were necessary for
the purpose of our audit;(b) In our opinion proper books of account as required by law have been kept by the Company so far as appears from our
examination of those books;(c) The balance sheet, statement of profit and loss, and cash flow statement dealt with by this Report are in agreement with the
books of account;(d) In our opinion, the balance sheet, statement of profit and loss, and cash flow statement comply with the Accounting
Standards referred to in subsection (3C) of section 211 of the Act;(e) On the basis of written representations received from the directors as on March 31, 2013, and taken on record by the Board
of Directors, none of the directors is disqualified as on March 31, 2013, from being appointed as a director in terms of clause (g) of sub-section (1) of section 274 of the Act.
For S.R. Batliboi & Associates LLPChartered AccountantsICAI Firm registration number: 101049W
per Amit MajmudarPartnerMembership No.: 36656Mumbai, IndiaMay 7, 2013

Oracle Financial Services Software – Annual Report 2012-2013
(i) (a) The Company has maintained proper records showing full particulars, including quantitative details and situation of fixed assets.
(b) Fixed assets have been physically verified by the management during the year and no material discrepancies were identified on such verification.
(c) There was no disposal of a substantial part of fixed assets during the year.
(ii) The Company’s business does not involve inventories and, accordingly, the requirements under paragraph 4 (ii) of the Order are not applicable to the Company.
(iii) (a) According to the information and explanations given to us, the Company has not granted any loans, secured or unsecured to companies, firms or other parties covered in the register maintained under section 301 of the Act. Accordingly, the provisions of clause 4 (iii) (a) to (d) of the Order are not applicable to the Company and hence not commented upon.
(b) According to the information and explanations given to us, the Company has not taken any loans, secured or unsecured from companies, firms or other parties covered in the register maintained under section 301 of the Act. Accordingly, the provisions of clause 4 (iii) (e) to (g) of the Order are not applicable to the Company and hence not commented upon.
(iv) In our opinion and according to the information and explanations given to us, there is an adequate internal control system commensurate with the size of the Company and the nature of its business, for the purchase of fixed assets, sale of licenses and sale of services. During the course of our audit, we have not observed any major weakness or continuing failure to correct any major weakness in the internal control system of the Company in respect of these areas. The activities of the Company do not involve purchase of inventory.
(v) In our opinion there are no contracts or arrangements that need to be entered into the register maintained under section 301 of the Act. Accordingly, the provisions of clause 4 (v) (b) of the Order is not applicable to the Company and hence not commented upon.
(vi) The Company has not accepted any deposits from the public.
(vii) In our opinion, the Company has an internal audit system commensurate with the size of the Company and nature of its business.
(viii) To the best of our knowledge and as explained, the Central Government has not prescribed maintenance of cost records under clause (d) of sub-section (1) of section 209 of the Act for the products of the Company.
(ix) (a) Undisputed statutory dues including provident fund, investor education and protection fund, employees’ state insurance, income-tax, sales-tax, wealth-tax, service tax, customs duty, cess and other material statutory dues have generally been regularly deposited with the appropriate authorities though there have been considerable delays in few cases of foreign income taxes, foreign value added tax and foreign withholding tax. As explained to us, the Company did not have any dues of excise duty.
(b) According to the information and explanations given to us, undisputed dues in respect of provident fund, investor education and protection fund, employees’ state insurance, income-tax, wealth-tax, service tax, sales-tax, customs duty, cess and other material statutory dues which were outstanding, at the year end for a period of more than six months from the date they became payable are as follows:
Name of the statute
Nature of the dues Amount (Rs) Period to which the amount relates
Due Date Date of Payment
Foreign Tax Income Tax 256,403,226 April 2005 to March 2011 Various dates Not yet paidValue added Tax (‘VAT’)
27,229,963 April 2007 to March 2009 Various dates Not yet paid
Withholding Tax 39,390,825 July 2007 to March 2012 Various dates Not yet paid
Annexure referred to in our report of even dateRe: Oracle Financial Services Software Limited (the ‘Company’)

83
(c) According to the records of the Company, the dues outstanding of income-tax, sales-tax, wealth-tax, service tax, custom duty and cess on account of any dispute, are as follows:
Name of the statute Nature of the dues
Amount (Rs) Period to which the amount relates
Forum where dispute is pending
The Karnataka Value Added Tax Act, 2003
VAT and interest, penalty thereon
16,646,456 April 2005 to March 2007 Joint Commissioner of commercial taxes (Appeal)
The Central Sales Tax Act, 1956
CST and interest, penalty thereon
8,009,557 April 2002 to March 2003 and April 2005 to March 2007
Joint Commissioner of commercial taxes (Appeal)
The Karnataka Sales Tax Act, 1957
VAT 145,113 April 2002 to March 2004 Joint Commissioner of commercial taxes(Appeal)
The Karnataka Value Added Tax Act 2003
VAT and penalty thereon
581,668 April 2004 to March 2005 Appellate Tribunal, Bangalore
The Central Sales Tax Act 1956
CST and penalty thereon
616,622 April 2004 to March 2005 Appellate Tribunal, Bangalore
The Income Tax Act, 1961
Income Tax and interest thereon
81,279,735 April 2007 to March 2008 Commissioner of Appeal (Income-tax)
The Income Tax Act, 1961
Tax deduction at source and interest thereon
52,547,270 April 2008 to March 2009 Commissioner of Appeal (Income-tax)
The Income Tax Act, 1961
Income Tax and interest thereon
454,845,270 April 2008 to March 2009*
Commissioner of Appeal (Income-tax)
*Appeal filed on 19 April 2013
(x) The Company has no accumulated losses at the end of the financial year and it has not incurred cash losses in the current and immediately preceding financial year.
(xi) The Company did not have any dues to any financial institution, bank or debenture holder during the year.
(xii) According to the information and explanations given to us and based on the documents and records produced to us, the Company has not granted loans and advances on the basis of security by way of pledge of shares, debentures and other securities.
(xiii) In our opinion, the Company is not a chit fund or a nidhi/mutual benefit fund/society. Therefore, the provisions of clause 4(xiii) of the Order are not applicable to the Company.
(xiv) In our opinion, the Company is not dealing in or trading in shares, securities, debentures and other investments. Accordingly, the provisions of clause 4(xiv) of the Order are not applicable to the Company.
(xv) According to the information and explanations given to us, the Company has not given any guarantee for loans taken by others from bank or financial institutions.
(xvi) The Company did not have any term loans outstanding during the year.
(xvii) According to the information and explanations given to us and on an overall examination of the balance sheet of the Company, we report that no funds raised on short-term basis have been used for long-term investment.
(xviii) The Company has not made any preferential allotment of shares to parties or companies covered in the register maintained under section 301 of the Act.
(xix) The Company did not have any outstanding debentures during the year.
(xx) The Company has not raised any money by public issue during the year.
(xxi) Based upon the audit procedures performed for the purpose of reporting the true and fair view of the financial statements and as per the information and explanations given by the management, we report that no fraud on or by the Company has been noticed or reported during the year.
For S.R. Batliboi & Associates LLPChartered AccountantsICAI Firm registration number: 101049W
per Amit MajmudarPartnerMembership No.: 36656
Mumbai, IndiaMay 7, 2013

Oracle Financial Services Software – Annual Report 2012-2013
(Amounts in ` million)Notes March 31, 2013 March 31, 2012
EQUITY AND LIABILITIES
Shareholders’ funds Share capital 3 420.33 419.87 Reserves and surplus 4 72,503.14 62,049.31
72,923.47 62,469.18 Share application money pending allotment 3 (e) – 1.24
Non-current liabilitiesOther long-term liabilities 5 183.12 133.23 Long-term provisions 6 421.41 332.41
604.53 465.64 Current liabilities
Trade payables 5 139.16 181.74 Other current liabilities 5 8,674.54 7,215.90 Short-term provisions 6 917.19 804.45
9,730.89 8,202.09
TOTAL 83,258.89 71,138.15
ASSETS
Non-current assetsFixed assets
Tangible assets 7 (a) 3,739.75 3,555.25 Intangible assets 7 (b) – – Capital work-in-progress 7 (a) 132.70 544.47
Non-current investments 8 7,282.40 7,282.40 Deferred tax assets 9 667.71 640.56 Long-term loans and advances 11 6,607.41 5,383.44 Other non-current assets 12 158.36 142.86
18,588.33 17,548.98
Current assetsCurrent investments 10 9.98 9.98 Trade receivables 13 9,685.82 11,442.93 Cash and bank balances 14 50,183.44 35,109.20 Short-term loans and advances 11 668.63 2,887.35 Other current assets 12 4,122.69 4,139.71
64,670.56 53,589.17
TOTAL 83,258.89 71,138.15 Summary of significant accounting policies 2
The accompanying notes form an integral part of the financial statements.
Balance sheetas at March 31, 2013
As per our report of even date For and on behalf of the Board of Directors ofOracle Financial Services Software Limited
For S. R. Batliboi & Associates LLPChartered AccountantsICAI Firm Registration No. 101049W
S Venkatachalam Chairman
Chaitanya Kamat Managing Director & Chief Executive Officer
per Amit MajmudarPartnerMembership No. 36656
Y M Kale Director
Hoshi D Bhagwagar Company Secretary & Compliance Officer
Mumbai, IndiaMay 7, 2013
Mumbai, IndiaMay 7, 2013

85
Statement of profit and lossfor the year ended March 31, 2013
As per our report of even date For and on behalf of the Board of Directors ofOracle Financial Services Software Limited
For S. R. Batliboi & Associates LLPChartered AccountantsICAI Firm Registration No. 101049W
S Venkatachalam Chairman
Chaitanya Kamat Managing Director & Chief Executive Officer
per Amit MajmudarPartnerMembership No. 36656
Y M Kale Director
Hoshi D Bhagwagar Company Secretary & Compliance Officer
Mumbai, IndiaMay 7, 2013
Mumbai, IndiaMay 7, 2013
(Amounts in ` million, except share data)Notes Year ended
March 31, 2013 Year ended
March 31, 2012INCOME
Revenue from operations 15 29,377.01 26,058.54 Other income, net 16 4,403.20 3,750.34 Total income 33,780.21 29,808.88
EXPENSES
Employee costs 17 14,357.07 12,532.65 Travel related expenses (net of recoveries) 1,238.15 1,079.81 Professional fees 1,345.96 1,395.72 Other expenses 18 1,205.35 1,155.56 Depreciation and amortization 7 586.08 401.19
Total expenses 18,732.61 16,564.93
Profit before exceptional items and tax 15,047.60 13,243.95 Exceptional items, net 19 – 2,414.98 Profit before tax 15,047.60 15,658.93
Tax expensesCurrent tax 27 4,782.15 4,716.97 Deferred tax (27.15) 49.63
Total tax expenses 4,755.00 4,766.60
Profit for the year 10,292.60 10,892.33
Earnings per equity share of par value of ` 5(March 31, 2012 ` 5) each (in `) 20
Basic 122.52 129.78 Diluted 121.96 129.65
Summary of significant accounting policies 2
The accompanying notes form an integral part of the financial statements.

Oracle Financial Services Software – Annual Report 2012-2013
Note 1: Corporate information
Oracle Financial Services Software Limited (the “Company”) was incorporated in India with limited liability on September 27, 1989. The Company is a subsidiary of Oracle Global (Mauritius) Limited holding 80.27% (March 31, 2012 – 80.36%) ownership interest in the Company as at March 31, 2013.
The Company is principally engaged in the business of providing information technology solutions to the financial services industry worldwide. The Company has a suite of banking products, which caters to the needs of corporate, retail, investment banking, treasury operations and data warehousing.
Note 2: Summary of significant accounting policies
(a) Basis of presentation
The financial statements are prepared under the historical cost convention, on the accrual basis of accounting, in conformity with accounting principles generally accepted in India and complying in all material respects with the Accounting Standards notified by Companies (Accounting Standards) Rules, 2006 (as amended) and the relevant provisions of the Companies Act, 1956 (the ‘Act’). The accounting policies have been consistently applied by the Company and are consistent with those used in the previous years’.
The significant accounting policies adopted by the Company, in respect of the financial statements are set out as below:
(b) Use of estimates
The preparation of financial statements in conformity with generally accepted accounting principles requires management to make estimates and assumptions that affect the reported amounts of assets and liabilities and disclosure of contingent liabilities at the date of the financial statements and the results of operations during the reporting year end. Although these estimates are based upon management’s best knowledge of current events and actions, actual results could differ from these estimates.
(c) Fixed assets including intangibles and capital work-in-progress, depreciation, amortization and impairment
Fixed assets including intangibles and capital work-in-progress
Fixed assets including assets under finance lease arrangements are stated at cost less accumulated depreciation. The Company capitalizes all direct costs relating to the acquisition and installation of fixed assets. The cost of fixed assets not ready to use before balance sheet date are disclosed under ‘Capital work-in-progress’. Product Intellectual Property Rights (IPRs) acquired as part of business acquisitions are capitalized based on a fair value. The Company records the difference between considerations paid to acquire these IPRs and the fair value of assets and liabilities acquired as goodwill.
The Company purchases certain specific-use application software, which is in ready to use condition, for internal use. It is estimated that such software has a relatively short useful life, usually less than one year. The Company, therefore, charges to income the cost of acquiring such software.
Depreciation and amortization
Depreciation and amortization are computed using straight-line method, at the rates specified in Schedule XIV to the Act or based on the estimated useful life of assets, whichever is higher. Individual assets costing ` 5,000 or less are fully depreciated in the year of acquisition. The estimated useful life considered for depreciation of fixed assets is as follows:
Asset description Asset life (in years)
Tangible assetsImprovement of leasehold premises Lesser of 7 years or lease termBuildings 20Computer equipments 3Office equipments 2-7Electricals and other installations 2-7Furniture and fixtures 2-7Vehicles under finance Lease Lesser of 3 to 5 years or lease termIntangible assetsGoodwill on acquisition 3-5Product IPR 5PeopleSoft ERP 5
Notes annexed to and forming part of financial statementsfor the year ended March 31, 2013
87
Impairment
The carrying amounts of assets are reviewed at each balance sheet date if there is any indication of impairment based on internal/external factors. An impairment loss is recognized wherever the carrying amount of an asset exceeds its recoverable amount. The recoverable amount is the greater of the assets net selling price and value in use. In assessing value in use, the estimated future cash flows are discounted to their present value using a pre-tax discount rate that reflects current market assessments of the time value of money and risks specific to assets. After impairment, depreciation is provided on the revised carrying amount of the asset over its remaining useful life.
(d) Investments
Investments that are readily realizable and intended to be held for not more than a year from the date on which such investments are made are classified as current investments. All other investments are classified as long-term investments. Trade investments refer to the investments made with the aim of enhancing the Company’s business interests in providing information technology solutions to the financial services industry worldwide.
Long term investments are stated at cost less provision for diminution on account of other than temporary decline in the value of the investment.
Current investments are stated at lower of cost and fair value determined on an individual investment basis.
(e) Foreign currency transactions
Initial recognition
Foreign currency transactions are recorded in Indian Rupees, by applying to the foreign currency amount the exchange rate between the Indian Rupees and the foreign currency at the date of the transaction.
Conversion
Foreign currency denominated monetary items are translated into rupees at the closing rates of exchange prevailing at the date of the balance sheet. Non-monetary items, which are carried in terms of historical cost denominated in a foreign currency, are reported using the exchange rate at the date of the transaction.
Exchange differences
Exchange differences arising on the settlement of monetary items or on reporting Company’s monetary items at rates different from those at which they were initially recorded or reported in previous financial statements are recognized as income or expenses in the year in which they arise.
(f) Forward exchange contracts entered into to hedge foreign currency risk of an existing asset
The premium or discount arising at the inception of forward exchange contract is amortized and recognized as an expense/income over the life of the contract. Exchange differences on such contracts are recognized in the statement of profit and loss in the period in which the exchange rates change. Any profit or loss arising on cancellation or renewal of such forward exchange contract is also recognized as income or as expense for the period.
(g) Revenue recognition
Revenue is recognized as follows:
Product licenses and related revenue
- License fees are recognized, on delivery and subsequent milestone schedule as per the terms of the contract with the end user.- Implementation and customization services are recognized as services are provided, when arrangements are on a time and
material basis. Revenue for fixed price contracts is recognized using the proportionate completion method till contracts reach 90% completion. Balance revenue is recognized at the time of receipt of customer acceptance.
- Proportionate completion is measured based upon the efforts incurred to date in relation to the total estimated efforts to complete the contract. The Company monitors estimates of total contract revenue and cost on a routine basis throughout the delivery period. The cumulative impact of any change in estimates of the contract revenue or costs is reflected in the period in which the changes become known. In the event that a loss is anticipated on a particular contract, provision is made for the estimated loss.
- Product maintenance revenue is recognized, over the period of the maintenance contract on a straight line basis.IT solutions and consulting services- Revenue from IT solutions and consulting services are recognized as services are provided, when arrangements are on a time
and material basis.- Revenue from fixed price contracts is recognized using the proportionate completion method till contract reach 90% completion.
Balance revenue is recognized at the time of receipt of customer acceptance. Proportionate completion is measured based upon the efforts incurred to date in relation to the total estimated efforts to complete the contract. The Company monitors estimates of total contract revenue and cost on a routine basis throughout the delivery period. The cumulative impact of any change in estimates of the contract revenue or costs is reflected in the period in which the changes become known. In the event that a loss is anticipated on a particular contract, provision is made for the estimated loss.
The Company presents revenues net of service tax and value added taxes in its statement of profit and loss.
Cost and revenue in excess of billings is classified as unbilled revenue while billing in excess of revenue is classified as deferred revenue.

Oracle Financial Services Software – Annual Report 2012-2013
Interest income
Interest income is recognized on a time proportion basis taking into account the amount outstanding and the rate applicable.
Dividend income
Dividend income is recognized when the company’s right to receive dividend is established by the reporting date.
(h) Research and development expenses for software products
Research costs are expensed as incurred. Software product development costs are expensed as incurred unless technical feasibility of the project is established, future economic benefits are probable, the Company has an intention and ability to complete and use or sell the software and the cost can be measured reliably. Software product development costs incurred subsequent to the achievement of technical feasibility are not material and are expensed as incurred.
(i) Retirement and other employee benefits
Provident fund and superannuation fund are defined contribution schemes and the Company has no further obligation beyond the contributions made to the fund. Contributions are charged to statement of profit and loss in the year in which they accrue.
Gratuity liability is a defined benefit obligation and is recorded based on actuarial valuation on projected unit credit method made at the end of the year. Under the gratuity plan, every employee who has completed at least five years of service gets a gratuity on departure @ 15 days of last drawn salary for each completed year of service. The gratuity liability and net periodic gratuity cost is actuarially determined after considering discount rates, expected long term return on plan assets and increase in compensation levels. All actuarial gain/loss are immediately recorded to statement of profit and loss and are not deferred. The Company makes contributions to a fund administered and managed by the Life Insurance Corporation of India (LIC) to fund the gratuity liability. Under this scheme, the obligation to pay gratuity remains with the Company, although LIC administers the scheme.
Short term compensated absences are provided for based on estimates. Long term compensated absences are provided for based on actuarial valuation. The actuarial valuation is done as per projected unit credit method. All actuarial gains/losses are immediately recognized to statement of profit and loss and are not deferred. The Company presents the entire leave as a current liability in the balance sheet, since it does not have an unconditional right to defer its settlement for 12 months after the balance sheet date.
(j) Leases
Where the Company is the lessee
Lease of assets under which substantially all the risks and benefits incidental to ownership are transferred to the Company are classified as finance leases. These assets are capitalized at the lower of the fair value and present value of the minimum lease payments at the inception of the lease term and disclosed as leased assets. Lease payments are apportioned between the finance charges and reduction of the lease liability based on the implicit rate of return. Finance charges are recognized as finance cost in statement of profit and loss. Lease management fees, legal charges and other initial direct costs are capitalized.
Leases of assets under which all the risks and rewards of ownership are effectively retained by the lessor are classified as operating leases. Lease payments under operating leases are recognized as an expense in statement of profit and loss on a straight-line basis over the lease term.
(k) Income-tax
Tax expense comprises of current and deferred tax. Current income tax is measured at the amount expected to be paid to the tax authorities in accordance with the Indian Income Tax Act, 1961 (‘Indian Income Tax Act’). Deferred income taxes are recognized for the future tax consequences attributable to timing differences between the financial statement determination of income and their recognition for tax purposes. Deferred tax is measured based on the tax rates and the tax laws enacted or substantively enacted at the balance sheet date. Deferred tax assets are recognized and carried forward only to the extent that there is a reasonable certainty that sufficient future taxable income will be available against which such deferred tax assets can be realized. Unrecognized deferred tax assets of earlier years are re-assessed and recognized to the extent that it has become reasonably certain that future taxable income will be available against which deferred tax assets can be realized. The carrying value of assets is reviewed at each balance sheet date. The Company writes-down the carrying amount of deferred tax asset to the extent that it is no longer reasonably certain, that sufficient future taxable income will be available against which deferred tax asset can be realized. Minimum Alternative tax (‘MAT’) credit is recognized as an asset only when and to the extent there is convincing evidence that the Company will pay normal income tax during the specified period. In the year in which the MAT credit becomes eligible to be recognized as an asset in accordance with the recommendations contained in guidance note issued by the Institute of Chartered Accountants of India (‘ICAI’), the said asset is created by way of a credit to statement of profit and loss and shown as MAT Credit Entitlement. The Company reviews the same at each balance sheet date and writes down the carrying amount of MAT Credit Entitlement to the extent there is no longer convincing evidence to the effect that Company will pay normal income tax during the specified period.
(l) Earnings per share
The earnings considered in ascertaining the Company’s earnings per share comprise the net profit after tax. The number of shares used in computing basic earnings per share is the weighted average number of shares outstanding during the year. The number of shares used in computing diluted earnings per share comprises the weighted average number of shares considered for deriving basic earnings per share, and also the weighted average number of shares, if any which would have been issued on the conversion of all dilutive potential equity shares. The weighted average number of shares and potentially dilutive equity shares are adjusted for the bonus shares and sub-division of shares. For the purpose of calculating diluted earnings per share, the net profit or loss for the year attributable to equity shareholders and the weighted average number of shares outstanding during the year are adjusted for the effects of all dilutive potential equity shares.

89
(m) Share based compensation/payments
Measurement and disclosure of the employee share-based payment plans is done in accordance with Securities Exchange Board of India (‘SEBI’) (Employee Stock Option Scheme and Employee Stock Purchase Scheme) Guidelines, 1999 and the Guidance Note on Accounting for Employee Share-based Payments, issued by the ICAI. The Company uses the intrinsic value method of accounting for its employee share based compensation plan and other share based arrangements. Under this method compensation expense is recorded over the vesting period of the option on a straight line basis, if the fair market value of the underlying stock exceeds the exercise price at the grant date.
(n) Provisions
A provision is recognized when an enterprise has a present obligation as a result of past event and it is probable that an outflow of resources will be required to settle the obligation, in respect of which a reliable estimate can be made. Provisions are not discounted to its present value and are determined based on management estimate required to settle the obligation at the balance sheet date. These are reviewed at each balance sheet date and adjusted to reflect the current management estimates.
(o) Contingent liabilities
A contingent liability is a possible obligation that arises from past events whose existence will be confirmed by the occurrence or non-occurrence of one or more uncertain future events beyond the control of the Company or a present obligation that is not recognized because it is not probable that an outflow of resources will be required to settle the obligation. The Company does not recognize a contingent liability but discloses its existence in the financial statements.
(p) Cash and cash equivalents
Cash and cash equivalents for the purpose of cash flow statement comprise cash at bank and in hand and short-term investments with an original maturity of three months or less.
(Amounts in ` million)March 31, 2013 March 31, 2012
Note 3: Share capital
Authorized:100,000,000 (March 31, 2012 - 100,000,000) equity shares of ` 5 each 500.00 500.00
Issued, subscribed and fully paid-up:84,065,478 (March 31, 2012 - 83,973,757) equity shares of ` 5 each 420.33 419.87
(a) The Company has only one class of equity shares having a par value of ` 5 per share. Each holder of equity shares is entitled to one vote per share.
In the event of liquidation of the Company, the holders of equity shares will be entitled to receive remaining assets of the Company, after distribution of all preferential amounts. The distribution will be in proportion to the number of equity shares held by the shareholders.
(b) Details of shareholders holding more than 5% equity shares in the Company:
Name of shareholder March 31, 2013 March 31, 2012Number of
equity shares% of equity shares
Number of equity
shares
% of equity shares
Oracle Global (Mauritius) Limited, holding company. 67,481,698 80.27% 67,481,698 80.36%As per records of the Company, including its register of shareholders/members and other declarations received from shareholders regarding beneficial interest, the above shareholding represents both legal and beneficial ownerships of equity shares.
(c) Reconciliation of equity shares outstanding at the beginning and at the end of the yearMarch 31, 2013 March 31, 2012
Number of equity shares
Amounts in `
million
Number of equity
shares
Amounts in `
millionOutstanding at the beginning of the year 83,973,757 419.87 83,894,802 419.47 Issued during the year - ESOP 91,721 0.46 78,955 0.40 Outstanding at the end of the year 84,065,478 420.33 83,973,757 419.87
(d) Refer note 24 (b) for details of shares reserved for issue under the employee stock option (ESOP) plan of the Company.
(e) Share application money pending allotment for the year ended March 31, 2012 represents the money received from employees of the Company towards exercise of 500 options at the exercise price of ` 1,290.85 under Employee Stock Option Scheme 2002 (“Scheme 2002”) and 289 options at the exercise price of ` 2,050.00 under Employee Stock Option Plan 2010 Scheme (“Scheme 2010”). Each option will entitle one equity share of ` 5 each of the Company at a premium of ` 1,285.85 under the Scheme 2002 and ` 2,045.00 under the Scheme 2010.

Oracle Financial Services Software – Annual Report 2012-2013
(Amounts in ` million)March 31, 2013 March 31, 2012
Note 4: Reserves and surplus
Securities premiumBalance, beginning of the year 9,648.08 9,574.16 Received during the year on exercise of employee stock options 161.23 73.92 Balance, end of the year 9,809.31 9,648.08
General reserve 10,145.19 10,145.19
Surplus in the statement of profit and lossBalance, beginning of the year 42,256.04 31,363.71 Profit for the year 10,292.60 10,892.33 Balance, end of the year 52,548.64 42,256.04
Total reserves and surplus 72,503.14 62,049.31
March 31, 2013 March 31, 2012Non-current Current Non-current Current
Note 5: Liabilities
Trade Payables - Micro and small enterprises* – – – – - Others – 139.16 – 181.74
– 139.16 – 181.74
Amount due to subsidiaries [Refer note 26] – 2,991.58 – 2,199.67 Accrued expenses 159.99 1,862.36 122.77 1,717.09 Deferred revenues 23.13 3,576.98 10.46 3,047.60 Advances from customers – – – 8.27 Investor Education and Protection Fund to be credited by unclaimed dividends**
– 1.54 – 2.21
Forward contract payable, net – – – 24.41 Other liabilities
- Withholding and other taxes – 182.75 – 164.80 - Other statutory dues – 59.33 – 51.85
183.12 8,674.54 133.23 7,215.90
183.12 8,813.70 133.23 7,397.64
* The identification of Micro and Small Enterprises is based on Management’s knowledge of their status.
** There is no amount due and outstanding as at balance sheet date to be credited to the Investor Education and Protection Fund.
Note 6: Provisions
For employee benefitsGratuity 421.41 71.23 332.41 75.04 Compensated absence – 579.70 – 468.66
421.41 650.93 332.41 543.70 Other Provision
For Taxation, net of advance tax – 266.26 – 260.75 – 266.26 – 260.75
421.41 917.19 332.41 804.45

91
No
te 7
(a)
: Tan
gib
le a
sset
s(A
mou
nts i
n `
mill
ion)
Parti
cular
s G
ross
blo
ck D
epre
ciatio
n an
d am
ortiz
atio
n N
et b
lock
As a
t A
pril
01, 2
012
Add
ition
s S
ale/d
eletio
ns
As a
tM
arch
31,
201
3A
s at
Apr
il 01
, 201
2Fo
r the
yea
rSa
le/de
letio
nsA
s at
Mar
ch 3
1, 2
013
As a
t M
arch
31,
201
3A
s at
Mar
ch 3
1, 2
012
Free
hold
land
538
.31
–
–
538
.31
–
–
–
–
538
.31
538
.31
Impr
ovem
ent t
o l
ease
hold
pre
mise
s 2
63.0
3 1
61.0
2 8
9.97
3
34.0
8 1
28.8
7 3
7.00
8
9.83
7
6.04
2
58.0
4 1
34.1
6 Bu
ildin
gs [R
efer
not
e b
elow
] 1
,985
.92
1.1
3 –
1
,987
.05
337
.40
99.
29
–
436
.69
1,5
50.3
6 1
,648
.52
Com
pute
r equ
ipm
ents
1,2
80.0
8 3
20.2
6 1
1.09
1
,589
.25
1,0
20.6
9 2
04.0
3 1
0.50
1
,214
.22
375
.03
259
.39
Offi
ce e
quip
men
ts 1
91.2
4 7
.89
21.
32
177
.81
141
.88
18.
39
20.
56
139
.71
38.
10
49.
36
Elec
trica
ls an
d ot
her
ins
talla
tions
1,0
01.2
5 1
26.2
3 6
9.62
1
,057
.86
408
.05
125
.81
67.
45
466
.41
591
.45
593
.20
Furn
iture
and
fixt
ures
689
.79
160
.61
67.
87
782
.53
369
.90
95.
38
65.
62
399
.66
382
.87
319
.89
Veh
icles
und
er fi
nanc
e
lease
32.
40
–
6.6
8 2
5.72
1
9.98
6
.18
6.0
3 2
0.13
5
.59
12.
42
Tota
l 5
,982
.02
777
.14
266
.55
6,4
92.6
1 2
,426
.77
586
.08
259
.99
2,7
52.8
6 3
,739
.75
3,5
55.2
5 A
s at M
arch
31,
201
2 5
,575
.00
891
.47
484
.45
5,9
82.0
2 2
,485
.42
401
.19
459
.84
2,4
26.7
7 C
apita
l wor
k-in
-pro
gres
s 1
32.7
0 5
44.4
7 3
,872
.45
4,0
99.7
2
Not
e: In
clude
s 10
(Mar
ch 3
1, 2
012
- 10)
shar
es o
f ` 5
0 ea
ch in
Tak
shila
Bui
ldin
g N
o. 9
, Co-
op H
ousin
g So
ciety
Lim
ited,
Mum
bai.
No
te 7
(b
): In
tan
gib
le a
sset
s
Parti
cular
s G
ross
blo
ck A
mor
tizat
ion
Net
blo
ckA
s at
Apr
il 01
, 201
2A
dditi
ons
Sale
/dele
tions
A
s at
Mar
ch 3
1, 2
013
As a
tA
pril
01, 2
012
For t
he y
ear
Sale/
delet
ions
As a
tM
arch
31,
201
3A
s at
Mar
ch 3
1, 2
013
As a
tM
arch
31,
201
2G
oodw
ill o
n ac
quisi
tion
197
.47
–
–
197
.47
197
.47
–
–
197
.47
–
–
Prod
uct I
PR
138
.62
–
–
138
.62
138
.62
–
–
138
.62
–
–
Peop
leSof
t ERP
53.
77
–
–
53.
77
53.
77
–
–
53.
77
–
–
Tota
l 3
89.8
6 –
–
3
89.8
6 3
89.8
6 –
–
3
89.8
6 –
–
A
s at M
arch
31,
201
2 3
89.8
6 –
–
3
89.8
6 3
89.8
6 –
–
3
89.8
6

Oracle Financial Services Software – Annual Report 2012-2013
(Amounts in ` million)March 31, 2013 March 31, 2012
Note 8: Non-current investments (trade) (unquoted)(at cost, unless otherwise stated)
(i) In wholly owned subsidiaries
Oracle (OFSS) ASP Private Limited5,170,000 (March 31, 2012 - 5,170,000) equity shares of ` 10 each, fully paid-up 46.10 46.10 Less: Provision for diminution in value of investment (46.10) (46.10)
– –
Oracle Financial Services Software B.V.140,000 (March 31, 2012 - 140,000) equity shares of EUR 100 each, fully paid-up 776.31 776.31
Oracle Financial Services Software Pte. Ltd.250,000 (March 31, 2012 - 250,000) equity shares of SGD 1 each, fully paid-up 6.63 6.63
Oracle Financial Services Software America, Inc. [Refer note 33 (a)]1 (March 31, 2012 - 1) equity share of USD 0.01 each, fully paid-up 3,452.26 3,452.26 100 (March 31, 2012 - 100) Series A Convertible Participating Preference Shares of USD 0.01 each, fully paid-up 2,839.49 2,839.49
Oracle Financial Services Software (Shanghai) Limited100% (March 31, 2012 - 100%) subscription to the registered capital 45.51 45.51
Oracle Financial Services Software Chile Limitada100% (March 31, 2012 - 100%) subscription to the registered capital 70.49 70.49
ISP Internet Mauritius Company [Refer note 33 (b)]30,000 (March 31, 2012 - 30,000) equity shares of USD 1 each, fully paid-up 192.12 192.12 Less: Provision for diminution in value of investment (120.00) (120.00)
72.12 72.12 Oracle (OFSS) Processing Services Limited1,300,000 (March 31, 2012 - 1,300,000) equity shares of ` 10 each, fully paid-up 13.00 13.00
(ii) In associate
Login SA 33,000 (March 31, 2012 - 33,000) equity shares of EUR 2 each, fully paid-up 6.59 6.59
(iii) In other
Sarvatra Technologies Private Limited (formerly known as EBZ Online Private Limited)242,240 (March 31, 2012 - 242,240) equity shares of ` 10 each, fully paid-up 45.00 45.00 Less: Provision for diminution in value of investment (45.00) (45.00)
– –
Aggregate amount of unquoted investments 7,282.40 7,282.40
Aggregate amount of provision for diminution in value of unquoted trade investments 211.10 211.10
Note 9: Deferred tax assets
Difference between book and tax depreciation 60.59 94.71 Provision for compensated absence 173.25 132.59 Provision for gratuity 167.45 132.20 Provision for doubtful debts 173.82 218.03 Others 92.60 63.03
667.71 640.56
Note 10: Current investment (at cost or fair value, whichever is lower)
Non trade (quoted)9% Dhanalakshmi Bank Bonds Series VI10 (March 31, 2012 - 10) bonds of ` 1,000,000 each, fully paid-up 9.98 9.98 Aggregate market value of quoted investment 9.98 9.98

93
(Amounts in ` million)March 31, 2013 March 31, 2012
Non-current Current Non-current Current
Note 11: Loans and advances(unsecured, considered good)
Loan to subsidiaries [Refer note 26] 734.29 30.00 729.78 30.00 Amount recoverable from subsidiaries [Refer note 26] – – – 70.82 Advances recoverable in cash or in kind or for value to be received:
Deposits for premises and others 2,432.11 50.36 2,164.71 631.39 Prepaid expenses 7.99 106.49 4.57 131.00 Forward contract receivable, net – 23.48 – – Other advances 425.51 301.29 332.31 446.45
Advance tax, net of provision for taxes ` 12,729.19 million (March 31, 2012 ` 9,834.17 million) 3,007.51 157.01 2,152.07 – MAT credit entitlement – – – 1,577.69
6,607.41 668.63 5,383.44 2,887.35
Note 12: Other assets
Non current bank balances [Refer note 14] 1.06 – 2.38 –
Interest accrued on:Bank deposits 0.19 911.52 0.33 606.29 Loan to subsidiaries 157.11 – 140.15 –
Unbilled revenue – 3,007.55 – 3,393.98 Recoverable expenses - billed – 203.62 – 139.44
157.30 4,122.69 140.48 4,139.71
158.36 4,122.69 142.86 4,139.71
Note 13: Trade receivables (unsecured)
(a) Outstanding for a period exceeding six months from the date they are due for payment:
Considered good – 1,883.33 – 1,784.50 Considered doubtful 164.78 325.29 553.67 184.25
164.78 2,208.62 553.67 1,968.75 Provision for doubtful receivables (164.78) (325.29) (553.67) (184.25)
– 1,883.33 – 1,784.50
(b) Other receivables:
Considered good – 7,802.49 – 9,658.43 Considered doubtful – 2.26 – 1.44
– 7,804.75 – 9,659.87 Provision for doubtful receivables – (2.26) – (1.44)
– 7,802.49 – 9,658.43
– 9,685.82 – 11,442.93

Oracle Financial Services Software – Annual Report 2012-2013
(Amounts in ` million)March 31, 2013 March 31, 2012
Non-current Current Non-current CurrentNote 14: Cash and bank balances
(a) Cash and cash equivalents
Cash on hand – 0.38 – 0.42 Cheques on hand – – – 0.55 Balances with banks:
Current accounts – 866.68 – 1,591.81 Deposit accounts with original maturity of less than 3 months – – – 3.76 Unclaimed dividend accounts – 1.54 – 2.21
– 868.60 – 1,598.75
(b) Other bank balances
Balances with banks: Deposit accounts with original maturity of more than 3 months but less than 12 months
– 49,309.83 – 33,506.76
Margin money deposit 1.06 5.01 2.38 3.69 1.06 49,314.84 2.38 33,510.45
Amount disclosed under non-current assets (1.06) – (2.38) –
Amount disclosed under current assets – 50,183.44 – 35,109.20
Year endedMarch 31,2013
Year ended March 31, 2012
Note 15: Revenue from operations
Product licenses and related activities 22,397.34 19,121.73 IT solutions and consulting services 6,979.67 6,936.81
29,377.01 26,058.54 Note: Revenue from product licenses and related activities for the year ended March 31, 2012 includes prior year reversal of` 159.56 million.
Note 16: Other income, net
(a) Interest incomeInterest on:
Bank deposits 3,924.96 2,690.08 Bonds 0.37 0.90 Loan to subsidiaries 8.38 6.52 Income tax refund 65.15 –
3,998.86 2,697.50
(b) Other income, net
Foreign exchange gain, net 376.11 1,056.41 Profit (loss) on sale of fixed assets, net 1.10 (16.57)Miscellaneous income 27.13 13.00
404.34 1,052.84
4,403.20 3,750.34

95
(Amounts in ` million)Year ended
March 31,2013Year ended
March 31, 2012Note 17: Employee costs
Salaries and bonus [Refer note below] 13,345.47 11,678.98 Staff welfare expenses 534.22 457.33 Contribution to provident and other funds 477.38 396.34
14,357.07 12,532.65 Note: Employee costs for the year ended March 31, 2013 are net of ` 63.40 million (March 31, 2012 - ` Nil) pertaining to write
back of bonus provision of earlier years, no longer required.
Note 18: Other expenses
Application software 118.01 127.40 Communication expenses 91.44 92.61 Rent 304.84 408.53 Advertising expenses 2.05 2.65 Power 196.47 213.13 Insurance 34.25 24.76 Repairs and maintenance:
Buildings and leasehold premises 30.27 19.08 Computer equipments 33.77 40.55 Others 51.60 51.28
Rates and taxes 116.42 110.43 Finance charge on leased assets 1.46 1.92 Provision for doubtful debts, net (283.83) (150.71) Bad debts 326.90 62.78 Auditors' remuneration [Refer note 29] 9.88 7.86 Miscellaneous expenses 171.82 143.29
1,205.35 1,155.56
Note 19: Exceptional items, net
Dividend income [Refer note (a) below] – 3,108.30 Claim against the Company [Refer note (b) below] – (693.32)
– 2,414.98
(a) During the year ended March 31, 2012, the Company has received dividend of ` 1,833.30 million and ` 1,275.00 million from its wholly owned subsidiaries Oracle Financial Services Software B.V. and Oracle Financial Services Software Pte. Ltd. respectively. Considering the amount of dividend received, the same has been disclosed as an exceptional item.
(b) A customer had filed a lawsuit against the Company and one of its subsidiaries, claiming damages of upwards of ` 5,784.19 million. During the year ended March 31, 2012, the Company settled the said customer dispute for full release of all alleged claims and accordingly accounted the settlement amount, net of insurance claim and disclosed the same as an exceptional item.
Note 20: Reconciliation of basic and diluted equity shares used in computing earnings per share
Weighted average shares outstanding for basic earnings per share 84,005,687 83,929,749 Add: Effect of dilutive stock options 385,300 82,950 Weighted average shares outstanding for diluted earnings per share 84,390,987 84,012,699
(Amounts in ` million)March 31, 2013 March 31, 2012
Note 21: Capital commitmentsContracts remaining to be executed on capital account not provided for (net of advances). 193.41 470.44

Oracle Financial Services Software – Annual Report 2012-2013
Note 22: Leases
Where Company is lessee
Finance lease
The Company takes vehicles under finance lease of upto five years. None of the lease agreements have an escalation clause. Future minimum lease payments under finance lease as at March 31, 2013 and 2012 are as follows:
(Amounts in ` million)As at March 31, 2013
Principal Interest TotalNot later than one year 5.00 0.52 5.52Later than one year but not later than five years 1.73 0.08 1.81Total minimum payments 6.73 0.60 7.33
As at March 31, 2012
Principal Interest TotalNot later than one year 7.25 1.33 8.58Later than one year but not later than five years 7.14 0.64 7.78Total minimum payments 14.39 1.97 16.36
Operating lease
The Company has taken certain office premises and residential premises for employees under operating lease, which expire at various dates through year 2025. Some of the lease agreements have a price escalation clause. Gross rental expenses for the year ended March 31, 2013 aggregated to ` 297.86 million (March 31, 2012 - ` 397.92 million). The minimum rental payments to be made in future in respect of these leases are as follows:
March 31, 2013 March 31, 2012
Not later than one year 301.82 236.73Later than one year but not later than five years 840.42 408.75Later than five years 743.22 821.78
1,885.46 1,467.26
Note 23: Derivative instruments and un-hedged foreign currency exposure
The Company enters into forward foreign exchange contracts where the counter party is a bank. The Company purchases forward foreign exchange contracts to mitigate the risks of change in foreign exchange rate on receivables denominated in certain foreign currencies. The Company considers the risk of non-performance by the counter party as non-material. As at March 31, 2013 the Company has following outstanding derivative instrument:
(Amounts in US Dollar million)Particulars March 31, 2013 March 31, 2012
Forward contracts – Sell in US Dollar 66.82 30.50
As of the balance sheet date, the Company’s net foreign currency exposure that is not hedged is ` 15,285.24 million (March 31, 2012 - ` 22,415.20 million).
Note 24: Share based compensation/payments
a) Employee Stock Purchase Scheme (‘ESPS’)
The Company has adopted the ESPS administered through a Trust (“the Trust”) to provide equity based incentives to key employees of the Company. As per the scheme, the Trust can purchase shares of the Company from market using the proceeds of loans obtained from the Company. Such shares are allocated by the Trust to nominated employees at an exercise price, which approximates the fair value on the date of the grant. The shares vest in the employees over a period of five years and the employees can purchase the shares from the Trust over a period of ten years based on continued employment, until which, the Trust holds the shares for the benefit of the employees. The employees are entitled to receive dividends, bonus, etc., that may be declared by the Company from time to time for the entire portion of shares held by the Trust on behalf of the employees.

97
On the acceptance of the offer, the selected employee undertakes to purchase the shares from the Trust within ten years from the date of acceptance of the offer. In case an employee resigns from employment, the rights relating to vested shares, which are eligible for exercise, may be purchased by the employee by payment of the exercise price whereas, the balance shares are forfeited in favor of the Trust. The Trustees have the right of recourse against the employees for any amounts that may remain unpaid on the shares accepted by them. As of the balance sheet date, the Trust has repaid the entire loan obtained from the Company on receipt of payments from employees against shares exercised.
The Securities and Exchange Board of India (‘SEBI’) has issued the Employee Stock Option Scheme and Stock Purchase Guidelines, 1999 (‘SEBI guidelines’), which are applicable to stock purchase schemes for employees of all Indian listed companies. In accordance with these guidelines, the excess of market price of the underlying equity shares on the date of grant of the stock options over the exercise price of the options is to be recognized in the books of account and amortized over the vesting period. However, no compensation cost has been recorded as the scheme terms are fixed and the exercise price equals the market price of the underlying stock on the grant date.
A summary of the activity in the Company’s ESPS is as follows:
Year endedMarch 31, 2013
Year endedMarch 31, 2012
Number of shares Number of sharesOpening balance of unallocated shares 166,142 166,142Shares forfeited during the year – –Closing balance of unallocated shares 166,142 166,142
Opening balance of allocated shares 18,817 29,081Shares exercised during the year (16,067) (10,264)Shares forfeited during the year – –Closing balance of allocated shares 2,750 18,817
Shares eligible for exercise 2,750 18,817Shares not eligible for exercise – –Total allocated shares 2,750 18,817
b) Employee Stock Option Plan (‘ESOP’)
Pursuant to ESOP scheme approved by the shareholders of the Company on August 14, 2001, the Board of Directors, onMarch 4, 2002 approved the Employees Stock Option Scheme (“Scheme 2002”) for issue of 4,753,600 options to the employees and directors of the Company and its subsidiaries. According to the Scheme 2002, the Company has granted 4,548,920 options prior to the IPO and 619,000 options at various dates after IPO (including the grants of options out of options forfeited earlier).
On August 25, 2010, the Board of Directors approved the Employees Stock Option Plan 2010 Scheme (“Scheme 2010”) for issue of 618,000 options to the employees and directors of the Company and its subsidiaries. According to the Scheme 2010, the Company has granted 638,000 options (including the grants of options out of options forfeited earlier).
Pursuant to ESOP scheme approved by the shareholders of the Company in their meeting held on August 18, 2011, the Board of Directors approved the Employees Stock Option Plan 2011 Scheme (“Scheme 2011”) for issue of 5,100,000 options to the employees and directors of the Company and its subsidiaries. According to the Scheme 2011, the Company has granted 1,285,500 options till March 31, 2013.
As per the above schemes, each of 20% of the total options granted will vest to the eligible employees and directors on completion of 12, 24, 36, 48 and 60 months from the date of grant and is subject to continued employment of the employee or directorship of the director with the Company or its subsidiaries. Options have exercise period of 10 years from the date of grant. The employee pays the exercise price upon exercise of option.
A summary of the activity in the Company’s ESOP (Scheme 2002) is as follows:
Year ended March 31, 2013 Year ended March 31, 2012Shares arisingfrom options
Weighted average exercise price (`)
Shares arisingfrom options
Weighted average exercise price (`)
Outstanding at beginning of year 145,212 1,721 245,837 1,414Granted – – – –Exercised (31,932) 1,290 (78,275) 932Forfeited – – (22,350) 1,107Outstanding at end of the year 113,280 1,843 145,212 1,721
Vested options 77,280 97,212Unvested options 36,000 48,000

Oracle Financial Services Software – Annual Report 2012-2013
A summary of the activity in the Company’s ESOP (Scheme 2010) is as follows:
Year ended March 31, 2013 Year ended March 31, 2012Shares arisingfrom options
Weighted average exercise price (`)
Shares arisingfrom options
Weighted average exercise price (`)
Outstanding at beginning of year 428,344 2,064 561,865 2,050Granted – – 20,000 2,342Exercised (35,574) 2,050 (680) 2,050Forfeited (36,907) 2,050 (152,841) 2,050Outstanding at end of the year 355,863 2,066 428,344 2,064
Vested options 121,853 81,596Unvested options 234,010 346,748
A summary of the activity in the Company’s ESOP (Scheme 2011) is as follows:
Year ended March 31, 2013 Year ended March 31, 2012Shares arisingfrom options
Weighted average exercise price (`)
Shares arisingfrom options
Weighted average exercise price (`)
Outstanding at beginning of year 617,500 1,937 – –Granted 645,000 3,131 640,500 1,936Exercised (24,215) 1,964 – –Forfeited (66,950) 1,984 (23,000) 1,930Outstanding at end of the year 1,171,335 2,591 617,500 1,937
Vested options 88,935 –Unvested options 1,082,400 617,500
The weighted average share price for the year over which stock options were exercised was ` 2,859 (March 31, 2012 - ` 2,234).
The details of options unvested and options vested and exercisable as on March 31, 2013 are as follows:
Exerciseprice (`)
Number ofoptions
Weighted average exercise price (`)
Weighted average remaining
contractual life (Years)
Options unvested 1,930 408,400 1,930 8.72,032 32,000 2,032 8.72,050 218,010 2,050 7.42,333 36,000 2,333 7.62,342 16,000 2,342 8.33,127 627,000 3,127 9.93,320 15,000 3,320 9.8
Options vested and exercisable 1,291 53,280 1,291 3.11,930 88,935 1,930 8.72,050 117,853 2,050 7.42,333 24,000 2,333 7.62,342 4,000 2,342 8.3
1,640,478 2,426 8.7
The details of options unvested and options vested and exercisable as on March 31, 2012 were as follows:
Exercise price (`)
Number ofoptions
Weighted average exercise price (`)
Weighted average remaining
contractual life (Years)
Options unvested 1,930 577,500 1,930 9.72,032 40,000 2,032 9.72,050 326,748 2,050 8.42,333 48,000 2,333 8.62,342 20,000 2,342 9.3
Options vested and exercisable 515 32 515 1.31,291 85,180 1,291 4.12,050 81,596 2,050 8.42,333 12,000 2,333 8.6
1,191,056 1,956 8.8

99
Stock Options granted during the financial year ended March 31, 2013:The weighted average fair value of stock options granted during the year was ` 1,765 (March 31, 2012 - ` 1,195).
The Black Scholes valuation model has been used for computing the above weighted average fair value considering the following inputs:
Scheme 2011 Scheme 2011
Exercise Price (in `) 3,320 3,127Expected Volatility 45% 42%Historical Volatility 45% 42%Life of the options granted (Vesting and exercise period) in years 10 10Expected dividends Nil NilAverage risk-free interest rate 7.88% 7.99%Expected dividend rate Nil Nil
The expected volatility was determined based on historical volatility data; historical volatility includes early years of the Company’s life; the Company expects the volatility of its share price to reduce as it matures.The Company measures the cost of ESOP using intrinsic value method. Had compensation cost been determined in a manner consistent with the fair value approach, the Company’s net profit and earnings per share as reported would have changed to the amounts indicated below:
(Amounts in ` million, except per share data)March 31, 2013 March 31, 2012
Profit as reported 10,292.60 10,892.33Add: Employee stock compensation under intrinsic value method Nil NilLess: Employee stock compensation under fair value method (385.97) (190.48)
Proforma profit 9,906.63 10,701.85
Earnings per shareBasic
- As reported 122.52 129.78- Proforma 117.93 127.51
Diluted- As reported 121.96 129.65- Proforma 117.59 127.44
Note 25: Employee Benefit Obligation
Defined contribution plansDuring year ended March 31, 2013 and 2012, the Company contributed following amounts to defined contributions plans:
(Amounts in ` million)Particulars Year ended Year ended
March 31, 2013 March 31, 2012
Provident fund 240.30 205.96Superannuation fund 108.17 81.52
348.47 287.48
Defined benefit plan – gratuityThe amounts recognized in the statement of profit and loss for the year ended March 31, 2013 and 2012 are as follows:
Particulars Year ended March 31, 2013
Year ended March 31, 2012
Current service cost 57.20 58.95Interest cost 31.46 31.63Expected return on plan assets (0.11) (0.32)Recognized net actuarial (gain) loss 39.92 18.44Total included in employee benefit expense 128.47 108.70
Actual return on plan assets 0.55 0.61
The amounts recognized in the balance sheet are as follows:
Particulars Year ended March 31, 2013
Year ended March 31, 2012
Present value of funded obligations 496.42 408.90Fair value of plan assets (3.78) (1.45)Net liability 492.64 407.45

Oracle Financial Services Software – Annual Report 2012-2013
Changes in present value of defined benefit obligation representing reconciliation of opening and closing balances thereof are as follows:
(Amounts in ` million)Particulars Year ended
March 31, 2013Year ended
March 31, 2012
Defined benefit obligation at beginning of the year 408.90 370.11Current service cost 57.20 58.95Interest cost 31.46 31.63Benefits paid (41.50) (73.82)Actuarial (gain) loss 40.36 18.72Liabilities related to employees transferred from a subsidiary – 3.31Defined benefit obligation at end of the year 496.42 408.90
Changes in the fair value of plan assets representing reconciliation of opening and closing balances thereof are as follows:
Particulars Year ended March 31, 2013
Year ended March 31, 2012
Fair value of plan assets at beginning of the year 1.45 15.12Expected return on plan assets 0.11 0.32Actuarial gain (loss) 0.44 0.28Contribution by employer 43.28 56.24Benefits paid (41.50) (73.82)Assets related to employees transferred from a subsidiary – 3.31Fair value of plan assets at end of the year 3.78 1.45
Plan assets are administered by LIC and 100% of the plan assets are invested in lower risk assets, primarily in debt securities.
The assumptions used in accounting for the gratuity plan are set out as below:
March 31, 2013 March 31, 2012
Discount rate 8.00% 8.47%Expected return on plan assets 7.50% 7.50%Salary escalation rate 8.00% 8.00%
The estimates of future salary increase, considered in actuarial valuation, take account of inflation, seniority, promotions and other relevant factors such as supply and demand in the employment market.
The Company evaluates these assumptions annually based on its long-term plans of growth and industry standards. The discount rates are based on current market yields on government bonds consistent with the currency and estimated term of the post employment benefits obligations. Plan assets are administered by the LIC and invested in lower risk assets, primarily debt securities. The Company’s contribution to the fund for the year ending March 31, 2014 is expected to be ` 75.00 million.
The expected benefit payments from the fund as of March 31, 2013 are below:
Year ending March 31
2014 66.402015 62.142016 58.882017 55.43Next 5 years 217.03
Present value of the defined benefit obligation, fair value of the plan assets, deficit and experience adjustments in the plan assets and liabilities for the current year and previous four years are as follows:
Particulars Year March 31, 2013
Year March 31, 2012
Year March 31, 2011
Year March 31, 2010
Year March 31, 2009
Present value of funded obligations (496.42) (408.90) (370.11) (257.77) (231.67)Fair value of plan assets 3.78 1.45 15.12 2.36 1.47Deficit (492.64) (407.45) (354.99) (255.41) (230.20)
Experience adjustmentsOn plan liabilities 27.17 32.26 43.12 (13.35) (0.72)On plan assets 0.44 0.28 0.45 (2.18) 0.26

101
Note 26: Names of Related Parties and description of relationship:
Relationship Names of related parties
(i) Related parties where control exists
Ultimate Holding Company Oracle Corporation
Holding Company Oracle Global (Mauritius) Limited
Direct Subsidiaries Oracle Financial Services Software B.V.Oracle Financial Services Software Pte. Ltd.Oracle Financial Services Software Chile LimitadaOracle Financial Services Software (Shanghai) LimitedOracle Financial Services Software America, Inc.ISP Internet Mauritius CompanyOracle (OFSS) Processing Services LimitedOracle (OFSS) ASP Private Limited
Subsidiaries of Subsidiaries Subsidiary of Oracle Financial Services Software B.V.- Oracle Financial Services Software SA
Subsidiary of Oracle Financial Services Software Pte. Ltd.- Oracle Financial Services Consulting Pte. Ltd.
Subsidiaries of Oracle Financial Services Software America, Inc.- Oracle Financial Services Software, Inc.- Mantas Inc. Subsidiaries of Mantas Inc. - Mantas Singapore Pte. Ltd. (dissolved on March 01, 2012) - Mantas India Private Limited - Mantas Limited (dissolved on April 10, 2012) - Sotas Inc.
Subsidiaries of ISP Internet Mauritius Company- Oracle (OFSS) BPO Services Inc.- Oracle (OFSS) BPO Services Limited
Associate Login S. A.
(ii) Related parties with whom transactions have taken place during the year
Fellow Subsidiaries Oracle America, Inc.Oracle Hungary Kft.Oracle Egypt Ltd.Oracle Nederland B.V.Oracle Caribbean, Inc.Oracle Systems Limited - Saudi ArabiaOracle India Private Limited Oracle Software Systems Israel Limited Oracle Corporation Australia Pty. LimitedOracle Corporation Singapore Pte. Ltd.Oracle Corporation (Thailand) Company Limited Oracle do Brasil Sistemas LimitadaOracle Systems Limited - CyprusOracle Systems Limited - DubaiOracle Software (Schweiz) GmbHOracle Systems Hong Kong LimitedOracle Systems Pakistan (Private) LimitedOracle East Central Europe Services BVOracle Corporation (South Africa)(Pty) Limited Oracle Portugal - Sistemas de Informação Lda. Oracle Solution Services (India) Private Ltd. Oracle Research & Development Center, Shenzhen, Ltd.
Key Managerial Personnel ('KMP') Chaitanya Kamat - Managing Director & Chief Executive Officer

Oracle Financial Services Software – Annual Report 2012-2013
Transactions and balances outstanding with these parties are described below:(Amounts in ` million)
Transactions Amount receivable (payable)Year ended
March 31, 2013Year ended
March 31, 2012As at
March 31, 2013As at
March 31, 2012RevenueFellow Subsidiaries
Oracle America, Inc 474.30 531.58 175.99 312.52 Oracle Corporation (South Africa)(Pty) Limited 649.37 157.27 303.10 95.14 Oracle Corporation Australia Pty. Limited 7.66 21.86 1.50 8.93 Oracle India Private Limited 17.96 1.92 – 1.80 Oracle Egypt Ltd. – 14.30 11.40 17.21 Oracle Corporation (Thailand) Company Limited – – 0.02 0.33 Oracle Hungary Kft. 1.72 34.34 1.19 26.43 Oracle Systems Limited - Saudi Arabia 27.09 18.40 23.64 1.14 Oracle Portugal - Sistemas de Informação Lda. 22.63 68.64 46.65 61.37 Oracle do Brasil Sistemas Limitada – 60.18 – – Oracle Software (Schweiz) GmbH – 2.66 0.36 2.63 Oracle Systems Hong Kong Limited – 1.63 – 1.58 Oracle Systems Pakistan (Private) Limited 0.91 – – – Oracle East Central Europe Services BV 115.55 94.79 16.70 94.74
SubsidiariesOracle Financial Services Software B.V. 6,275.21 5,204.92 1,441.84 1,892.77 Oracle Financial Services Software, Inc. 7,353.46 6,839.87 2,838.99 2,496.27 Oracle Financial Services Software Pte. Ltd. 8,219.90 7,049.46 2,601.27 3,592.13 Oracle Financial Services Consulting Pte. Ltd. – – 2.12 1.99 Oracle Financial Services Software (Shanghai) Limited 641.99 606.77 1,627.06 1,084.57 Oracle Financial Services Software Chile Limitada 36.09 101.01 3.00 2.83 Oracle (OFSS) BPO Services Inc. – – 24.04 22.64 Oracle (OFSS) BPO Services Limited – – – 1.43 Oracle Financial Services Software SA 523.29 743.79 173.16 200.39 Oracle (OFSS) ASP Private Limited – – 0.41 (0.10)
Unbilled revenueFellow Subsidiaries
Oracle America, Inc – – 72.36 43.31 Oracle Corporation (South Africa)(Pty) Limited – – 38.21 29.03 Oracle Hungary Kft. – – – 7.30 Oracle India Private Limited – – 17.71 – Oracle Portugal - Sistemas de Informação Lda. – – 0.67 12.17 Oracle Systems Limited - Saudi Arabia – – – 8.08 Oracle Egypt Ltd. – – – 0.91 Oracle East Central Europe Services BV – – 2.69 13.22 Oracle Systems Pakistan (Private) Limited – – 0.91 –
SubsidiariesOracle Financial Services Software B.V. – – 325.88 573.39 Oracle Financial Services Software Inc. – – 693.10 953.18 Oracle Financial Services Software Pte. Ltd. – – 1,336.76 1,061.41 Oracle Financial Services Software (Shanghai) Limited – – 40.43 190.13 Oracle Financial Services Software Chile Limitada – – 137.11 101.01 Oracle Financial Services Software SA – – 58.25 23.74
Deferred revenueFellow Subsidiaries
Oracle America, Inc – – (0.85) (7.00)Oracle Corporation (South Africa)(Pty) Limited – – (39.32) – Oracle Corporation Australia Pty. Limited – – (14.78) (3.36)Oracle Portugal - Sistemas de Informação Lda. – – – (2.35)Oracle Hungary Kft. – – (0.45) –

103
(Amounts in ` million)Transactions Amount receivable (payable)
Year endedMarch 31, 2013
Year endedMarch 31, 2012
As atMarch 31, 2013
As atMarch 31, 2012
Subsidiaries Oracle Financial Services Software B.V. – – (1,224.28) (975.32)Oracle Financial Services Software, Inc. – – (392.00) (293.44)Oracle Financial Services Software Pte. Ltd. – – (705.40) (473.47)Oracle Financial Services Software SA – – (114.07) (100.40)Oracle Financial Services Software (Shanghai) Limited – – (145.28) (71.35)
Bad debtsSubsidiaries
Oracle Financial Services Software B.V. 107.10 – – – Oracle Financial Services Software, Inc. 74.40 – – – Oracle Financial Services Software Pte. Ltd. 66.46 – – – Oracle Financial Services Software SA 1.79 – – –
Provision for doubtful debtsFellow Subsidiaries
Oracle America, Inc 1.32 (6.55) (1.32) – Oracle Egypt Limited 5.38 – (5.38) – Oracle Portugal - Sistemas de Informação Lda. 1.33 – (1.33) – Oracle Corporation (South Africa)(Pty) Limited 0.77 – (0.77) – Oracle Corporation Australia Pty. Limited 0.27 – (0.27) – Oracle Hungary Kft. 0.18 – (0.18) – Oracle Systems Limited - Saudi Arabia 0.05 – (0.05) – Oracle Corporation (Thailand) Company Limited 0.01 – (0.01) –
Subsidiaries Oracle Financial Services Software B.V. (59.99) (10.23) (47.55) (107.54)Oracle Financial Services Software, Inc. (46.71) (9.59) (151.41) (198.12)Oracle Financial Services Software Pte. Ltd. (45.61) 1.67 (38.40) (84.01)Oracle Financial Services Software SA 2.31 (0.58) (2.31) – Oracle Financial Services Software (Shanghai) Limited 53.56 4.03 (57.59) (4.03)
Professional fee expensesFellow Subsidiary
Oracle America, Inc 20.21 – (20.21) – Oracle Corporation Australia Pty. Limited – – – (0.02)Oracle Egypt Ltd. – – – (0.18)Oracle India Private Limited 200.66 89.71 (181.11) (80.74)Oracle Portugal - Sistemas de Informação Lda. – – – (1.33)Oracle Research & Development Center, Shenzhen, Ltd. 114.61 133.23 (23.42) (81.54)Oracle Solution Services (India) Private Ltd. – 1.84 – –
Subsidiaries Oracle Financial Services Software, Inc. 27.70 25.49 (189.10) (149.79)Oracle (OFSS) ASP Private Limited 5.87 2.34 (6.14) (0.33)Oracle Financial Services Software Pte. Ltd. – – (18.62) (17.46)Oracle Financial Services Software B.V. – – (5.43) (5.34)Mantas Inc. – 0.62 (8.68) (8.18)Oracle (OFSS) Processing Services Limited 92.54 85.68 (20.58) (100.01)Oracle Financial Services Software Chile Limitada 43.36 45.62 (41.74) –
Application software expensesFellow Subsidiaries
Oracle India Private Limited 58.35 64.40 (11.33) (17.45)Oracle Systems Limited - Saudi Arabia – 0.37 – (0.74)Oracle Caribbean, Inc. 1.19 0.21 (1.73) –

Oracle Financial Services Software – Annual Report 2012-2013
(Amounts in ` million)Transactions Amount receivable (payable)
Year endedMarch 31, 2013
Year endedMarch 31, 2012
As atMarch 31, 2013
As atMarch 31, 2012
Oracle Corporation Singapore Pte. Ltd. 2.77 – – – Oracle Software Systems Israel Limited 0.42 – (0.42) –
SubsidiariesOracle Financial Services Software B.V. – 0.36 – – Oracle Financial Services Software, Inc. 7.76 – – –
Reimbursement of expensesSubsidiaries
Oracle Financial Services Software B.V. 1,073.83 794.70 (217.06) (145.63)Oracle Financial Services Software Inc. 2,706.70 2,188.68 (1,680.15) (1,335.70)Oracle Financial Services Software Pte. Ltd. 2,594.49 2,302.78 (601.69) (252.83)Oracle (OFSS) Processing Services Limited – (0.04) – 48.62 Oracle (OFSS) ASP Private Limited – 14.89 – 22.20 Oracle Financial Services Software (Shanghai) Limited 224.84 169.76 (202.39) (184.40)
Key managerial personnelRemuneration [Refer note 1 below] 27.94 29.41 – –
Rent expensesFellow Subsidiaries
Oracle Nederland B.V. 8.08 – – – Oracle Systems Limited - Cyprus – 0.43 – (0.08)Oracle Systems Limited - Dubai 12.02 – – – Oracle India Private Limited 0.47 – – –
Rent incomeFellow Subsidiary
Oracle India Private Limited 13.91 – – –
Other expensesFellow Subsidiaries
Oracle India Private Limited 2.49 – – – Oracle Corporation (South Africa)(Pty) Limited 12.40 12.39 – – Oracle Corporation Singapore Pte. Ltd. 3.93 1.48 – (0.16)
Procurement of fixed assetsFellow Subsidiaries
Oracle Corporation Singapore Pte. Ltd. 64.23 46.91 – –
Loan outstandingSubsidiaries
Oracle Financial Services Software America, Inc. [Refer note 2 below] 31.52 65.08 542.74 511.22 ISP Internet Mauritius Company [Refer note 2 below] 2.99 6.18 51.55 48.56 Oracle (OFSS) BPO Services Limited [Refer note 3 below] (30.00) (100.00) 170.00 200.00
Interest on loan givenSubsidiaries
Oracle Financial Services Software America, Inc. 6.54 4.90 142.02 127.66 ISP Internet Mauritius Company 1.84 1.62 15.09 12.50
Provision for diminution in investmentSubsidiaries
ISP Internet Mauritius Company – – (120.00) (120.00)Oracle (OFSS) ASP Private Limited – – (46.10) (46.10)

105
Notes:
1. Remuneration includes salary, bonus and perquisites. The bonus is included on payment basis. As the liabilities for gratuity and compensated absence are provided on an actuarial basis for the Company as a whole, the amounts pertaining to individual KMP are not included above. During the year 100,000 options under the Scheme 2011 (March 31, 2012 - 30,000 options under the Scheme 2011) were granted to KMP.
2. Loan given to subsidiaries represents loan to Oracle Financial Services Software America, Inc. amounting to ` 542.74 million (interest LIBOR + 50 basis points) as at March 31, 2013 (March 31, 2012 - ` 511.22 million) and ISP Internet Mauritius Company amounting to ̀ 51.55 million (interest LIBOR + 50 basis points) as at March 31, 2013 (March 31, 2012 - ̀ 48.56 million). No additional loans have been given during the year. The amount shown above is towards the revaluation impact of the outstanding loans.
3. During the year ended March 31, 2011, the Company had signed a settlement agreement with Oracle (OFSS) BPO Services Limited whereby the outstanding amount is being repaid in 10 equal annual installments.
Note 27: Tax expensesCurrent tax charge for the year ended March 31, 2013 includes prior year net reversal of ` 295.37 million.
Note 28: Segment information
Business segments are defined as a distinguishable component of an enterprise that is engaged in providing a group of related products or services and that is subject to differing risks and returns and about which separate financial information is available. This information is reviewed and evaluated regularly by the management in deciding how to allocate resources and in assessing the performance. The Company is organized by business segment and geographically. For management purposes the Company is primarily organized on a worldwide basis into two business segments: a) Product licenses and related activities (‘Products’) and b) IT solutions and consulting services (‘Services’). The business segments are the basis on which the Company reports its primary operational information to management. Product licenses and related activities segment deals with various banking software products. The related activities include enhancements, implementation and maintenance activities. IT solutions and consulting services segment offers services spanning the entire lifecycle of applications used by financial service institutions. The division’s portfolio includes Consulting, Application, Support and Technology Services that help institutions improve efficiency, optimize costs, meet risk and compliance mandates and implement IT solutions finely attuned to their business needs.
(Amounts in ` million)Year ended
March 31, 2013
Particulars Products Services TotalRevenue 22,397.34 6,979.67 29,377.01 Segment result 10,070.26 1,304.34 11,374.60 Unallocable expenses (730.20)Other income, net 4,403.20 Profit before tax 15,047.60 Tax expenses [Refer note 27] (4,755.00)Net profit 10,292.60
Year endedMarch 31, 2012
Particulars Products Services Total
Revenue 19,121.73 6,936.81 26,058.54 Segment result 8,821.00 1,688.18 10,509.18 Unallocable expenses (1,015.57)Other income, net 3,750.34 Profit before exceptional items and tax 13,243.95 Exceptional items [Refer note 19] 2,414.98 Profit before tax 15,658.93 Tax expenses (4,766.60)Net profit 10,892.33

Oracle Financial Services Software – Annual Report 2012-2013
Other information:(Amounts in ` million)
Year endedMarch 31, 2013
Particulars Products Services Unallocable TotalCapital expenditure by segment
Tangible assets 659.31 98.12 19.71 777.14 Depreciation and amortization 321.49 203.56 61.03 586.08 Other non cash expenses 44.11 (1.04) – 43.07 Segment assets 13,771.30 4,734.07 64,753.52 83,258.89 Segment liabilities 7,672.19 1,910.13 753.10 10,335.42 Shareholders' funds 72,923.47 72,923.47
Year endedMarch 31, 2012
Particulars Products Services Unallocable TotalCapital expenditure by segment
Tangible assets 469.81 361.51 60.15 891.47 Depreciation and amortization 171.49 164.88 64.82 401.19 Other non cash expenses (60.24) (27.69) – (87.93)Segment assets 14,552.26 5,172.70 51,413.19 71,138.15 Segment liabilities 6,007.01 1,580.31 1,080.41 8,667.73 Share application money pending allotment 1.24 1.24 Shareholders' funds 62,469.18 62,469.18
Segment revenue and expense:
Revenue is generated through licensing of software products as well as by providing software solutions to the customers including consulting services. The expenses which are not directly attributable to a business segment are classified as unallocable expenses.Segment assets and liabilities:
Segment assets include all operating assets used by a segment and consist principally of trade receivables net of allowances, unbilled revenues, deposits for premises and fixed assets. Segment liabilities primarily include deferred revenues, advance from customers, accrued employee costs and other current liabilities. While most of such assets and liabilities can be directly attributed to individual segments, the carrying amount of certain assets and liabilities used jointly by two segments is allocated to the segment on a reasonable basis. Assets and liabilities that cannot be allocated between the segments are shown as part of unallocable assets and liabilities.
Geographical segments:
The following table shows the distribution of the Company’s sales by geographical market:
Year ended March 31, 2013
Year ended March 31, 2012
Regions Amounts in ` million
% Amounts in ` million
%
United States of America 8,127.54 27% 8,054.19 31%Europe 5,905.09 20% 5,303.90 20%Asia Pacific 9,014.43 31% 7,798.38 30%Middle East, India and Africa 5,709.61 19% 4,387.05 17%Latin America and Caribbean 620.34 2% 515.02 2%
29,377.01 100% 26,058.54 100%
The following table shows the Company’s assets by geographical market:
Year ended March 31, 2013
Year ended March 31, 2012
Regions Amounts in ` million
% Amounts in ` million
%
United States of America 10,685.96 13% 11,145.70 16%Europe 3,398.92 4% 4,024.96 6%Asia Pacific 6,212.31 7% 6,571.63 9%Middle East, India and Africa 62,740.83 74% 49,189.69 68%Latin America and Caribbean 220.87 1% 206.17 1%
83,258.89 100% 71,138.15 100%
Total cost incurred during the year to acquire fixed assets within India is disclosed in Note 7.
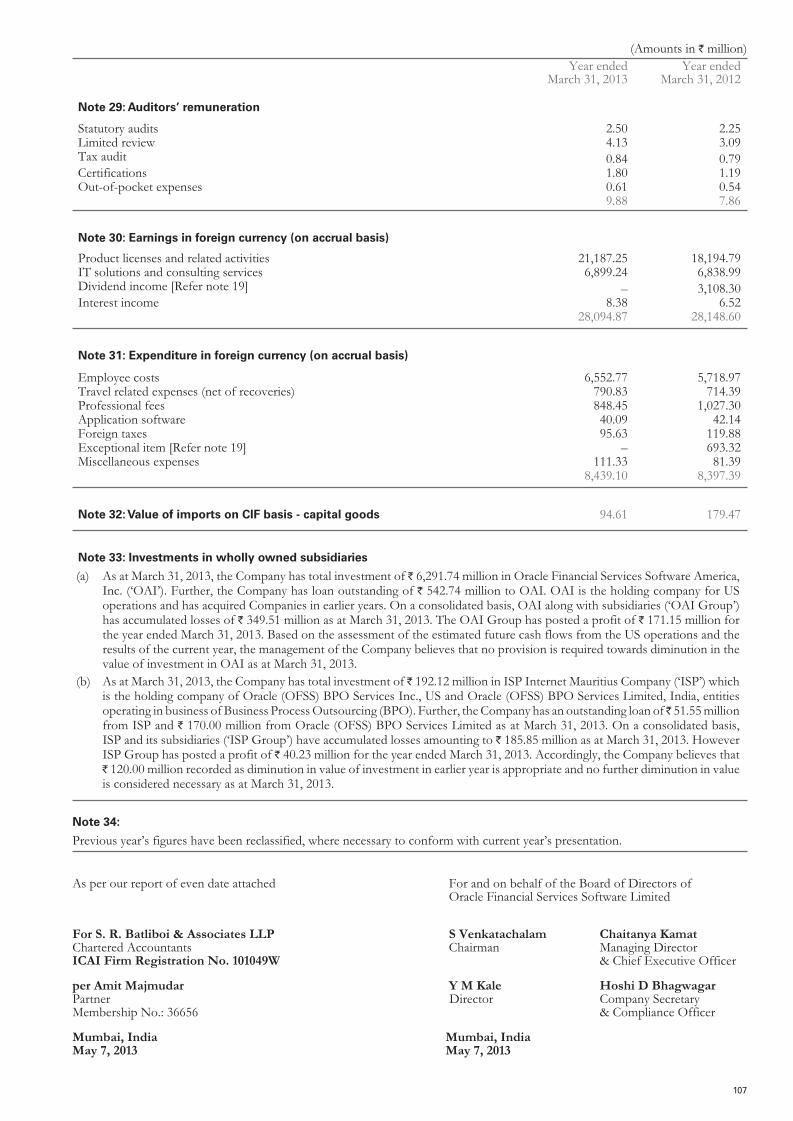
107
(Amounts in ` million) Year ended
March 31, 2013 Year ended
March 31, 2012
Note 29: Auditors’ remuneration
Statutory audits 2.50 2.25 Limited review 4.13 3.09 Tax audit 0.84 0.79 Certifications 1.80 1.19 Out-of-pocket expenses 0.61 0.54
9.88 7.86
Note 30: Earnings in foreign currency (on accrual basis)
Product licenses and related activities 21,187.25 18,194.79 IT solutions and consulting services 6,899.24 6,838.99 Dividend income [Refer note 19] – 3,108.30 Interest income 8.38 6.52
28,094.87 28,148.60
Note 31: Expenditure in foreign currency (on accrual basis)
Employee costs 6,552.77 5,718.97 Travel related expenses (net of recoveries) 790.83 714.39 Professional fees 848.45 1,027.30 Application software 40.09 42.14 Foreign taxes 95.63 119.88 Exceptional item [Refer note 19] – 693.32 Miscellaneous expenses 111.33 81.39
8,439.10 8,397.39
Note 32: Value of imports on CIF basis - capital goods 94.61 179.47
Note 33: Investments in wholly owned subsidiaries
(a) As at March 31, 2013, the Company has total investment of ` 6,291.74 million in Oracle Financial Services Software America, Inc. (‘OAI’). Further, the Company has loan outstanding of ` 542.74 million to OAI. OAI is the holding company for US operations and has acquired Companies in earlier years. On a consolidated basis, OAI along with subsidiaries (‘OAI Group’) has accumulated losses of ` 349.51 million as at March 31, 2013. The OAI Group has posted a profit of ` 171.15 million for the year ended March 31, 2013. Based on the assessment of the estimated future cash flows from the US operations and the results of the current year, the management of the Company believes that no provision is required towards diminution in the value of investment in OAI as at March 31, 2013.
(b) As at March 31, 2013, the Company has total investment of ̀ 192.12 million in ISP Internet Mauritius Company (‘ISP’) which is the holding company of Oracle (OFSS) BPO Services Inc., US and Oracle (OFSS) BPO Services Limited, India, entities operating in business of Business Process Outsourcing (BPO). Further, the Company has an outstanding loan of ̀ 51.55 million from ISP and ` 170.00 million from Oracle (OFSS) BPO Services Limited as at March 31, 2013. On a consolidated basis, ISP and its subsidiaries (‘ISP Group’) have accumulated losses amounting to ` 185.85 million as at March 31, 2013. However ISP Group has posted a profit of ` 40.23 million for the year ended March 31, 2013. Accordingly, the Company believes that` 120.00 million recorded as diminution in value of investment in earlier year is appropriate and no further diminution in value is considered necessary as at March 31, 2013.
Note 34:
Previous year’s figures have been reclassified, where necessary to conform with current year’s presentation.
As per our report of even date attached For and on behalf of the Board of Directors of Oracle Financial Services Software Limited
For S. R. Batliboi & Associates LLPChartered AccountantsICAI Firm Registration No. 101049W
S Venkatachalam Chairman
Chaitanya Kamat Managing Director & Chief Executive Officer
per Amit MajmudarPartnerMembership No.: 36656
Y M Kale Director
Hoshi D Bhagwagar Company Secretary & Compliance Officer
Mumbai, IndiaMay 7, 2013
Mumbai, IndiaMay 7, 2013

Oracle Financial Services Software – Annual Report 2012-2013
(Amounts in ` million)Year ended
March 31, 2013 Year ended
March 31, 2012
Cash flows from operating activitiesProfit before tax 15,047.60 15,658.93
Adjustments to reconcile profit before tax to cash (used in) provided by operating activities:
Depreciation and amortization 586.08 401.19 (Profit) loss on sale of fixed assets, net (1.10) 16.57 Interest income (3,998.86) (2,697.50)Dividend income [Refer note 19] – (3,108.30)Effect of exchange rate changes in cash and cash equivalent 90.05 46.26 Unrealized exchange (gain) loss, net 201.18 (387.85)Finance charge on leased assets 1.46 1.92 Deferred rent 32.29 2.53 Provision for doubtful debts, net (283.83) (150.71)Bad debts 326.90 62.78
Operating Profit before Working Capital changes 12,001.77 9,845.82 Movements in working capitalDecrease (increase) in trade receivables 1,441.80 (3,312.87)Decrease (increase) in other current assets 322.25 (468.17)Decrease in short-term loans and advances 256.36 44.22 Increase in long-term loans and advances (96.62) (33.03)(Decrease) increase in trade payables (42.59) 119.34 Increase in other current liabilities 1,497.89 1,357.20 Increase (decrease) in other long-term liabilities 49.89 (9.54)Increase (decrease) in other short-term provisions 107.22 (18.57)Increase in other long-term provisions 89.00 23.83 Cash from operating activities 15,626.97 7,548.23 Payment of domestic and foreign taxes (4,165.74) (3,172.43)Net cash provided by operating activities 11,461.23 4,375.80
Cash flows from investing activities
Additions to fixed assets including capital work-in-progress and advances (412.52) (766.20)Repayment of current loan by subsidiary company 30.00 100.00 Refund of short-term office deposits 313.62 402.07 Proceeds from sale of fixed assets 7.01 5.04 Bank fixed deposits having maturity of more than three months matured 73,101.01 52,073.00 Bank fixed deposits having maturity of more than three months booked (88,904.08) (61,283.00)Dividend received from subsidiaries [Refer note 19] – 3,108.30 Interest received 3,611.66 2,488.14 Net cash (used) in investing activities (12,253.30) (3,872.65)
Statement of cash flowfor the year ended March 31, 2013

109
Statement of cash flowfor the year ended March 31, 2013 (continued)
(Amounts in ` million)Year ended
March 31, 2013 Year ended
March 31, 2012 Cash flows from financing activitiesIssue of shares against Employee Stock Option scheme 160.44 74.78 Payment of lease obligations (8.47) (10.42)Net cash provided by financing activities 151.97 64.36
Net (decrease) increase in cash and cash equivalents (640.10) 567.51 Cash and cash equivalents at beginning of the year 1,598.75 1,077.50 Effect of exchange rate changes (90.05) (46.26)Cash and cash equivalents at end of the year 868.60 1,598.75
Component of cash and cash equivalentsCash on hand 0.38 0.42 Cheques on hand – 0.55 Balances with banks:
Current accounts 866.68 1,591.81 Deposit accounts with original maturity of less than 3 months – 3.76 Unclaimed dividend accounts 1.54 2.21
Total cash and cash equivalents [Refer note 14(a)] 868.60 1,598.75
As per our report of even date For and on behalf of the Board of Directors of Oracle Financial Services Software Limited
For S. R. Batliboi & Associates LLPChartered AccountantsICAI Firm Registration No. 101049W
S Venkatachalam Chairman
Chaitanya Kamat Managing Director & Chief Executive Officer
per Amit MajmudarPartnerMembership No.: 36656
Y M Kale Director
Hoshi D Bhagwagar Company Secretary & Compliance Officer
Mumbai, IndiaMay 7, 2013
Mumbai, IndiaMay 7, 2013

Oracle Financial Services Software – Annual Report 2012-2013
Sta
tem
ent
pu
rsu
ant
to S
ecti
on
212
of
the
Co
mp
anie
s A
ct, 1
956
rela
tin
g t
o S
ub
sid
iary
Co
mp
anie
s
(Am
ount
s in
` m
illio
n, e
xcep
t sha
re d
ata)
O
racle
Fin
ancia
l Ser
vice
s So
ftwar
e B.
V.
Ora
cle F
inan
cial S
ervi
ces
Softw
are
SAO
racle
Fin
ancia
l Ser
vice
s So
ftwar
e Pt
e. Lt
d.O
racle
Fin
ancia
l Ser
vice
s Co
nsul
ting
Pte.
Ltd.
Ora
cle F
inan
cial S
ervi
ces
Softw
are
Am
erica
, Inc
.
The
Fina
ncial
Yea
r of t
he S
ubsid
iary
Com
pany
end
ed o
n M
arch
31,
201
3 M
arch
31,
201
3 M
arch
31,
201
3 M
arch
31,
201
3 M
arch
31,
201
3
Hol
ding
Com
pany
Ora
cle F
inan
cial S
ervi
ces
Softw
are
Lim
ited
Ora
cle F
inan
cial S
ervi
ces
Softw
are
B.V
.O
racle
Fin
ancia
l Ser
vice
s So
ftwar
e Li
mite
dO
racle
Fin
ancia
l Ser
vice
s So
ftwar
e Pt
e. Lt
d.O
racle
Fin
ancia
l Ser
vice
s So
ftwar
e Li
mite
d
Hol
ding
Com
pany
's in
tere
st10
0%10
0%10
0%10
0%10
0%
Shar
es h
eld b
y th
e H
oldi
ng C
ompa
ny in
the
Sub
sidiar
y14
0,00
0 eq
uity
shar
es o
f E
UR
100
each
, fu
lly p
aid-u
p
60,0
00 sh
ares
of
EU
R 1
each
, fu
lly p
aid-u
p
250,
000
shar
es o
f SG
D 1
eac
h,
fully
paid
-up
16,1
85,1
70 sh
ares
of
SGD
1 e
ach,
fu
lly p
aid-u
p
1 E
quity
shar
e of
U
SD 0
.01
each
, fu
lly p
aid-u
p
Net
agg
rega
te o
f pro
fits/
(loss
es) o
f the
subs
idiar
y so
far a
s it c
once
rns t
he M
embe
rs o
f the
Hol
ding
Com
pany
and
is n
ot d
ealt
with
in th
e ac
coun
ts o
f the
Hol
ding
Com
pany
a. fo
r the
fina
ncial
yea
r end
ed o
n M
arch
31,
201
3 (3
8.68
) 4
4.05
1
17.3
5 (1
6.80
) (4
7.85
)
b.
for t
he p
revi
ous f
inan
cial y
ears
of t
he su
bsid
iary
sin
ce it
bec
ame
a su
bsid
iary
880
.43
352
.31
671
.40
(199
.69)
(743
.46)
Net
agg
rega
te o
f pro
fits/
(loss
es) o
f the
subs
idiar
y so
far a
s it c
once
rns t
he M
embe
rs o
f the
Hol
ding
Com
pany
and
is d
ealt
with
or p
rovi
ded
for i
n th
e ac
coun
ts o
f the
Hol
ding
Com
pany
a. fo
r the
fina
ncial
yea
r end
ed o
n M
arch
31,
201
3–
––
––
b.
for t
he p
revi
ous f
inan
cial y
ears
of t
he su
bsid
iary
sin
ce it
bec
ame
a su
bsid
iary
––
––
–

111
Sta
tem
ent
pu
rsu
ant
to S
ecti
on
212
of
the
Co
mp
anie
s A
ct, 1
956
rela
tin
g t
o S
ub
sid
iary
Co
mp
anie
s (c
on
tin
ued
)
(Am
ount
s in
` m
illio
n, e
xcep
t sha
re d
ata)
O
racle
Fin
ancia
l Ser
vice
s So
ftwar
e, In
c.M
anta
s Inc
.M
anta
s Ltd
.1So
tas I
nc.
Man
tas I
ndia
Priv
ate
Lim
ited
The
Fina
ncial
Yea
r of t
he S
ubsid
iary
Com
pany
end
ed o
n M
arch
31,
201
3 M
arch
31,
201
3 A
pril
10, 2
012
Mar
ch 3
1, 2
013
Mar
ch 3
1, 2
013
Hol
ding
Com
pany
Ora
cle F
inan
cial S
ervi
ces
Softw
are
Am
erica
, Inc
.O
racle
Fin
ancia
l Ser
vice
s So
ftwar
e A
mer
ica, I
nc.
Man
tas I
nc.
Man
tas I
nc.
Sota
s Inc
.
Hol
ding
Com
pany
's in
tere
st10
0%10
0%10
0%10
0%10
0%
Shar
es h
eld b
y th
e H
oldi
ng C
ompa
ny in
the
Sub
sidiar
yN
IL1
shar
e of
USD
0.0
1 pa
r va
lue
com
mon
stoc
k at
U
SD 1
.00
NIL
NIL
1,50
0,00
0 E
quity
Sha
res
of `
10/
- eac
h,
fully
paid
-up
Net
agg
rega
te o
f pro
fits/
(loss
es) o
f the
subs
idiar
y so
far a
s it c
once
rns t
he M
embe
rs o
f the
Hol
ding
Com
pany
and
is n
ot d
ealt
with
in th
e ac
coun
ts o
f the
Hol
ding
Com
pany
a. fo
r the
fina
ncial
yea
r end
ed o
n M
arch
31,
201
3 2
24.1
3 (4
.35)
(2.1
7) (0
.02)
0.7
1
b.
for t
he p
revi
ous f
inan
cial y
ears
of t
he su
bsid
iary
sin
ce it
bec
ame
a su
bsid
iary
243
.77
(29.
74)
2.0
1 (0
.47)
0.0
4
Net
agg
rega
te o
f pro
fits/
(loss
es) o
f the
subs
idiar
y so
far a
s it c
once
rns t
he M
embe
rs o
f the
Hol
ding
Com
pany
and
is d
ealt
with
or p
rovi
ded
for i
n th
e ac
coun
ts o
f the
Hol
ding
Com
pany
a. fo
r the
fina
ncial
yea
r end
ed o
n M
arch
31,
201
3–
––
––
b.
for t
he p
revi
ous f
inan
cial y
ears
of t
he su
bsid
iary
sinc
e it
beca
me
a su
bsid
iary
––
––
–
Not
e:1 D
issol
ved
on A
pril
10, 2
012

Oracle Financial Services Software – Annual Report 2012-2013
Sta
tem
ent
pu
rsu
ant
to S
ecti
on
212
of
the
Co
mp
anie
s A
ct, 1
956
rela
tin
g t
o S
ub
sid
iary
Co
mp
anie
s (c
on
tin
ued
)
(Am
ount
s in
` m
illio
n, e
xcep
t sha
re d
ata)
IS
P In
tern
et M
aurit
ius
Com
pany
Ora
cle (O
FSS)
BPO
Se
rvice
s Inc
.O
racle
(OFS
S) B
PO
Serv
ices L
imite
dO
racle
(OFS
S) P
roce
ssin
g Se
rvice
s Lim
ited
Ora
cle (O
FSS)
ASP
Priv
ate
Lim
ited
The
Fina
ncial
Yea
r of t
he S
ubsid
iary
Com
pany
en
ded
on M
arch
31,
201
3 M
arch
31,
201
3 M
arch
31,
201
3 M
arch
31,
201
3 M
arch
31,
201
3
Hol
ding
Com
pany
Ora
cle F
inan
cial S
ervi
ces
Softw
are
Lim
ited
ISP
Inte
rnet
Mau
ritiu
s Co
mpa
ny
ISP
Inte
rnet
Mau
ritiu
s Co
mpa
ny
Ora
cle F
inan
cial S
ervi
ces
Softw
are
Lim
ited
Ora
cle F
inan
cial S
ervi
ces
Softw
are
Lim
ited
Hol
ding
Com
pany
's in
tere
st10
0%10
0%10
0%10
0%10
0%
Shar
es h
eld b
y th
e H
oldi
ng C
ompa
ny in
the
Sub
sidiar
y25
,200
Ser
ies A
ord
inar
y sh
ares
of N
o Pa
r valu
e4,
800
Serie
s B o
rdin
ary
shar
es o
f No
Par v
alue
20,0
00 c
omm
on st
ock
of
USD
0.0
1 ea
ch5,
819,
360
equi
ty sh
ares
of
` 10
/- e
ach,
fu
lly p
aid-u
p
1,30
0,00
0 E
quity
shar
es o
f `
10/-
eac
h,
fully
paid
-up
5,17
0,00
0 E
quity
Sha
res o
f `
10/-
eac
h,
fully
paid
-up
Net
agg
rega
te o
f pro
fits/
(loss
es) o
f the
subs
idiar
y so
far a
s it c
once
rns t
he M
embe
rs o
f the
Hol
ding
Com
pany
and
is n
ot d
ealt
with
in th
e ac
coun
ts o
f the
Hol
ding
Com
pany
a. fo
r the
fina
ncial
yea
r end
ed o
n M
arch
31,
201
3 (1
.84)
(4.6
9) 6
2.74
1
17.3
2 7
.24
b.
for t
he p
revi
ous f
inan
cial y
ears
of t
he su
bsid
iary
sin
ce it
bec
ame
a su
bsid
iary
(29.
98)
(359
.51)
145
.45
256
.36
(27.
07)
Net
agg
rega
te o
f pro
fits/
(loss
es) o
f the
subs
idiar
y so
far a
s it c
once
rns t
he M
embe
rs o
f the
Hol
ding
Com
pany
and
is d
ealt
with
or p
rovi
ded
for i
n th
e ac
coun
ts o
f the
Hol
ding
Com
pany
a. fo
r the
fina
ncial
yea
r end
ed o
n M
arch
31,
201
3–
––
––
b.
for t
he p
revi
ous f
inan
cial y
ears
of t
he su
bsid
iary
sin
ce it
bec
ame
a su
bsid
iary
––
––
–

113
Sta
tem
ent
pu
rsu
ant
to S
ecti
on
212
of
the
Co
mp
anie
s A
ct, 1
956
rela
tin
g t
o s
ub
sid
iary
co
mp
anie
s (c
on
tin
ued
)
(Am
ount
s in
` m
illio
n, e
xcep
t sha
re d
ata)
O
racle
Fin
ancia
l Ser
vice
s So
ftwar
e Ch
ile L
imita
daO
racle
Fin
ancia
l Ser
vice
s So
ftwar
e (S
hang
hai)
Lim
ited
The
Fina
ncial
Yea
r of t
he S
ubsid
iary
Com
pany
end
ed o
n M
arch
31,
201
3 M
arch
31,
201
3
Hol
ding
Com
pany
Ora
cle F
inan
cial S
ervi
ces
Softw
are
Lim
ited
Ora
cle F
inan
cial S
ervi
ces
Softw
are
Lim
ited
Hol
ding
Com
pany
's in
tere
st10
0%10
0%
Shar
es h
eld b
y th
e H
oldi
ng C
ompa
ny in
the
Subs
idiar
yN
AN
A
Net
agg
rega
te o
f pro
fits/
(loss
es) o
f the
subs
idiar
y so
far a
s it c
once
rns t
he M
embe
rs o
f the
Hol
ding
Com
pany
and
is n
ot d
ealt
with
in th
e ac
coun
ts o
f the
Hol
ding
Com
pany
a. fo
r the
fina
ncial
yea
r end
ed o
n M
arch
31,
201
3 (1
9.31
) 4
0.39
b.
for t
he p
revi
ous f
inan
cial y
ears
of t
he su
bsid
iary
since
it b
ecam
e a
subs
idiar
y (8
0.75
) 1
10.4
2
Net
agg
rega
te o
f pro
fits/
(loss
es) o
f the
subs
idiar
y so
far a
s it c
once
rns t
he M
embe
rs o
f the
Hol
ding
Com
pany
and
is d
ealt
with
or p
rovi
ded
for i
n th
e ac
coun
ts o
f the
Hol
ding
Com
pany
a. fo
r the
fina
ncial
yea
r end
ed o
n M
arch
31,
201
3–
–
b.
for t
he p
revi
ous f
inan
cial y
ears
of t
he su
bsid
iary
since
it b
ecam
e a
subs
idiar
y–
–
For a
nd o
n be
half
of th
e Bo
ard
of D
irect
ors o
fO
racle
Fin
ancia
l Ser
vice
s Sof
twar
e Li
mite
d
S V
enka
tach
alam
C
hairm
an C
hai
tan
ya K
amat
M
anag
ing
Dire
ctor
&
Chi
ef E
xecu
tive
Offi
cer
Y M
Kal
e D
irect
or H
osh
i D B
hag
wag
ar
Com
pany
Sec
reta
ry
& C
ompl
iance
Offi
cer
Mu
mb
ai, I
nd
iaM
ay 7
, 201
3

Oracle Financial Services Software – Annual Report 2012-2013
Sta
tem
ent
un
der
Sec
tio
n 2
12(8
) o
f th
e C
om
pan
ies
Act
, 195
6 re
lati
ng
to
Su
bsi
dia
ry C
om
pan
ies
(Am
ount
s in
` m
illio
n)N
ame
of th
e su
bsid
iary
com
pany
Repo
rting
Cu
rren
cyE
xcha
nge
Rate
2Sh
are
Capi
tal
Rese
rves
3To
tal A
sset
sTo
tal
Liab
ilitie
sIn
vest
men
t ot
her t
han
Inve
stm
ent
in S
ubsid
iary
Turn
over
Prof
it/(L
oss)
be
fore
Ta
xatio
n
Prov
ision
fo
r Ta
xatio
n
Prof
it/(L
oss)
afte
r Ta
xatio
n
Prop
osed
D
ivid
end
Coun
try o
f In
corp
orat
ion
Ora
cle F
inan
cial S
ervi
ces
Sof
twar
e B.
V.
EU
R 6
9.25
7
76.3
1 8
41.7
5 4
,022
.86
2,4
04.8
0 –
7,
079.
85 5
2.54
(9
1.22
) (3
8.68
) –
Th
e N
ethe
rland
s
Ora
cle F
inan
cial S
ervi
ces
Sof
twar
e SA
EU
R 6
9.25
7
23.6
5 4
05.8
0 1
,470
.55
341
.10
–
656
.89
55.
12
(11.
07)
44.
05
–
Gre
ece
Ora
cle F
inan
cial S
ervi
ces
Sof
twar
e Pt
e. Lt
d.U
SD 5
4.27
6
.63
788
.79
5,5
26.6
3 4
,731
.21
–
9,69
8.98
413
.11
(295
.76)
117
.35
–
Sing
apor
e
Ora
cle F
inan
cial S
ervi
ces
Con
sulti
ng P
te. L
td.
USD
54.
27
46.
37
(216
.49)
61.
95
232
.07
–
–
(16.
80)
–
(16.
80)
–
Sing
apor
e
Ora
cle F
inan
cial S
ervi
ces
Sof
twar
e A
mer
ica, I
nc.
USD
54.
27
5,8
10.5
7 (2
51.5
4) 6
,570
.76
1,0
11.7
3 –
–
(4
8.43
) 0
.58
(47.
85)
–
USA
Ora
cle F
inan
cial S
ervi
ces
Sof
twar
e, In
c.U
SD 5
4.27
–
1
,013
.12
10,
527.
34
9,5
14.2
2 –
9,
801.
29 3
15.3
8 (9
1.25
) 2
24.1
3 –
U
SA
Man
tas I
nc.
USD
54.
27
5,6
50.1
7 (7
72.4
6) 4
,903
.96
26.
25
–
–
9.7
2 (1
4.07
) (4
.35)
–
USA
Man
tas L
td.1
GBP
81.
96
–
–
–
–
–
–
(2.1
7) –
(2
.17)
–
UK
Sota
s Inc
.U
SD 5
4.27
–
(0
.52)
–
0.5
2 –
–
(0
.02)
–
(0.0
2) –
U
SA
Man
tas I
ndia
Priv
ate
Lim
ited
INR
1.0
0 1
5.00
0
.75
16.
17
0.4
2 –
–
1
.03
(0.3
2) 0
.71
–
Indi
a
ISP
Inte
rnet
Mau
ritiu
s C
ompa
nyU
SD 5
4.27
1
39.9
8 (1
8.34
) 1
88.2
8 6
6.64
–
–
(1
.84)
–
(1.8
4) –
Re
publ
ic of
M
aurit
ius
Ora
cle (O
FSS)
BPO
Ser
vice
s I
nc.
USD
54.
27
–
(468
.59)
50.
43
519
.02
–
411
.95
(4.7
3) 0
.04
(4.6
9) –
U
SA
Ora
cle (O
FSS)
BPO
Ser
vice
s L
imite
dIN
R 1
.00
58.
19
208
.19
519
.66
253
.28
–
309
.73
78.
69
(15.
95)
62.
74
–
Indi
a
Ora
cle (O
FSS)
Pro
cess
ing
Ser
vice
s Lim
ited
INR
1.0
0 1
3.00
3
73.6
9 4
24.4
9 3
7.80
–
3
32.8
5 1
72.9
6 (5
5.64
) 1
17.3
2 –
In
dia

115
Sta
tem
ent
un
der
Sec
tio
n 2
12(8
) o
f th
e C
om
pan
ies
Act
, 195
6 re
lati
ng
to
Su
bsi
dia
ry C
om
pan
ies
(co
nti
nu
ed)
(Am
ount
s in
` m
illio
n)N
ame
of th
e su
bsid
iary
com
pany
Repo
rting
Cu
rren
cyE
xcha
nge
Rate
2Sh
are
Capi
tal
Rese
rves
3To
tal
Ass
ets
Tota
l Li
abili
ties
Inve
stm
ent
othe
r tha
n In
vest
men
t in
Subs
idiar
y
Turn
over
Prof
it/(L
oss)
be
fore
Ta
xatio
n
Prov
ision
fo
r Ta
xatio
n
Prof
it/(L
oss)
afte
r Ta
xatio
n
Prop
osed
D
ivid
end
Coun
try o
f In
corp
orat
ion
Ora
cle (O
FSS)
ASP
Priv
ate
Lim
ited
INR
1.0
0 5
1.70
(1
9.05
) 3
5.70
3
.05
–
9.7
9 7
.24
–
7.2
4 –
In
dia
Ora
cle F
inan
cial S
ervi
ces
Sof
twar
e Ch
ile L
imita
daCL
P 0
.11
70.
49
(100
.06)
439
.62
469
.19
–
255
.40
(14.
84)
(4.4
7) (1
9.31
) –
Ch
ile
Ora
cle F
inan
cial S
ervi
ces
Sof
twar
e (S
hang
hai)
Lim
ited
CNY
8.6
5 4
5.51
1
50.8
0 1
,911
.86
1,7
15.5
5 –
8
17.5
3 6
2.88
(2
2.49
) 4
0.39
–
Re
publ
ic of
Ch
ina
Not
es:
1 D
issol
ved
on A
pril
10, 2
012
2 E
xcha
nge
rate
as o
f Mar
ch 3
1, 2
013
3 T
he re
serv
e fig
ures
hav
e ch
ange
d du
e to
aud
it ad
just
men
t ent
ries p
asse
d po
st b
alanc
e sh
eet d
ate.
4 A
ccou
ntin
g po
licy
adop
ted
for f
oreig
n cu
rren
cy tr
ansa
ctio
ns a
re si
mila
r to
thos
e ad
opte
d in
con
solid
ated
fina
ncial
s.
The C
ompa
ny p
rese
nts a
udite
d co
nsol
idat
ed fi
nanc
ial st
atem
ents
und
er In
dian
GA
AP
in it
s Ann
ual R
epor
t. Th
e acc
ount
s and
relat
ed re
ports
of t
he su
bsid
iary c
ompa
nies
are n
ot at
tach
ed to
the A
nnua
l Rep
ort o
f the
Com
pany
fo
r the
yea
r end
ed M
arch
31,
201
3 in
term
s of t
he g
ener
al ex
empt
ion
prov
ided
by
the
Min
istry
of C
ompa
ny A
ffairs
vid
e G
ener
al Ci
rcul
ar N
o.: 2
/201
1 da
ted
Febr
uary
8, 2
011
and
that
the C
ompa
ny h
as fu
lfille
d th
e con
ditio
ns
stat
ed th
erein
.
The
Com
pany
will
mak
e av
ailab
le th
e ac
coun
ts a
nd r
epor
ts o
f th
e su
bsid
iary
com
pani
es u
pon
requ
est b
y an
y m
embe
r/in
vest
or o
f th
e Co
mpa
ny o
r its
sub
sidiar
y co
mpa
nies
. The
acc
ount
s an
d re
ports
of
the
subs
idiar
y co
mpa
nies
will
be
kept
ope
n fo
r ins
pect
ion
by a
ny m
embe
r at t
he re
gist
ered
offi
ce o
f the
Com
pany
and
the
regi
ster
ed o
ffice
of t
he su
bsid
iaries
dur
ing
offic
e ho
urs o
f the
Com
pany
/sub
sidiar
ies. T
he C
ompa
ny w
ill a
lso m
ake
the
sam
e av
ailab
le at
its w
ebsit
e w
ww
.ora
cle.co
m/f
inan
cialse
rvice
s
For a
nd o
n be
half
of th
e Bo
ard
of D
irect
ors o
fO
racle
Fin
ancia
l Ser
vice
s Sof
twar
e Li
mite
d
S V
enka
tach
alam
C
hairm
an C
hai
tan
ya K
amat
M
anag
ing
Dire
ctor
&
Chi
ef E
xecu
tive
Offi
cer
Y M
Kal
e D
irect
or H
osh
i D B
hag
wag
ar
Com
pany
Sec
reta
ry
& C
ompl
iance
Offi
cer
Mu
mb
ai, I
nd
iaM
ay 7
, 201
3

Oracle Financial Services Software – Annual Report 2012-2013
Reconciliation Statement of profit as per Indian GAAP unconsolidated and Indian GAAP consolidated
(Amounts in ` million) Year ended
March 31, 2013 Year ended
March 31, 2012
Net income as per Indian GAAP unconsolidated statement of profit and loss 10,292.60 10,892.33
Add:Revenue of subsidiaries, net
Oracle Financial Services Software B.V.- consolidated 7,736.46 6,966.70 Oracle Financial Services Software Pte. Ltd.- consolidated 9,698.98 8,437.52 Oracle Financial Services Software America, Inc.- consolidated 9,543.90 9,261.87 ISP Internet Mauritius Company - consolidated 410.68 318.68 Oracle (OFSS) Processing Services Limited – 3.38 Oracle (OFSS) ASP Private Limited 3.92 23.80 Oracle Financial Services Software Chile Limitada 209.40 195.29 Oracle Financial Services Software (Shanghai) Limited 809.58 746.81
28,412.92 25,954.05
Other income from subsidiaries, net 192.31 (2,654.02) 28,605 23,300.03
Less:Expenditure of subsidiaries, net
Oracle Financial Services Software B.V.- consolidated 7,787.99 6,848.44 Oracle Financial Services Software Pte. Ltd.- consolidated 9,606.43 8,252.73 Oracle Financial Services Software America, Inc.- consolidated 9,406.54 8,799.38 ISP Internet Mauritius Company - consolidated 391.41 315.00 Oracle (OFSS) Processing Services Limited (95.10) (82.32)Oracle (OFSS) ASP Private Limited (1.51) 13.18 Oracle Financial Services Software Chile Limitada 238.51 230.46 Oracle Financial Services Software (Shanghai) Limited 812.13 722.76
28,146.40 25,099.63
Net income as per Indian GAAP consolidated statement of profit and loss 10,751.43 9,092.73

117
Notice of Annual General Meeting

Oracle Financial Services Software – Annual Report 2012-2013
This page has been intentionally left blank.

119
Notice to members
NOTICE is hereby given that the Twenty Fourth Annual General Meeting of Oracle Financial Services Software Limited will be held at The Leela Kempinski, Sahar, Andheri (East), Mumbai 400059 on Wednesday, August 14, 2013 at 3.00 p.m. to transact the following business:
Ordinary Business:
1. To receive, consider and adopt the Audited Balance Sheet as on March 31, 2013, the Profi t and Loss Account for the year ended on that date and the Reports of the Board of Directors and the Auditors thereon.
2. To appoint a Director in place of Mr. Derek H Williams, who retires by rotation and, being eligible, offers himself forre-appointment.
3. To appoint a Director in place of Mr. Chaitanya Kamat, who retires by rotation and, being eligible, offers himself forre-appointment.
4. To appoint Auditors of the Company and to fi x their remuneration.
Special Business:
5. To consider and, if thought fi t, to pass, with or without modifi cation(s), as an Ordinary Resolution the following:
“RESOLVED THAT pursuant to the provisions of Section 228 and other applicable provisions, if any, of the Companies Act, 1956, the Board of Directors of the Company be and is hereby authorized to appoint Branch Auditors to conduct the audit of branch offi ce(s) of the Company, whether existing or which may be opened hereafter, in India or abroad, in consultation with the Company’s Statutory Auditors, any person(s) qualifi ed to act as Branch Auditors within the meaning of Section 228 of the Companies Act, 1956, and to fi x their remuneration.”
6. To consider and, if thought fi t, to pass, with or without modifi cation(s), as an Ordinary Resolution the following:
“RESOLVED THAT Mr. Richard Jackson, who was appointed as an Additional Director of the Company and who holds offi ce until the date of this Annual General Meeting pursuant to Section 260 of the Companies Act, 1956 and Article 109 of the Articles of Association of the Company, and in respect of whom the Company has received a notice from a Member under Section 257 of the Companies Act, 1956 proposing his candidature, be and is hereby appointed as a Director of the Company, liable to retire by rotation.”
7. To consider and, if thought fi t, to pass, with or without modifi cation(s), as an Ordinary Resolution the following:
“RESOLVED THAT Ms. Samantha Wellington, who was appointed as an Additional Director of the Company and who holds offi ce until the date of this Annual General Meeting pursuant to Section 260 of the Companies Act, 1956 and Article 109 of the Articles of Association of the Company, and in respect of whom the Company has received a notice from a Member under Section 257 of the Companies Act, 1956 proposing her candidature, be and is hereby appointed as a Director of the Company, liable to retire by rotation.”
8. To consider and, if thought fi t, to pass, with or without modifi cation(s), as an Ordinary Resolution the following:
“RESOLVED THAT Mr. Harinderjit Singh, who was appointed as an Additional Director of the Company and who holds offi ce until the date of this Annual General Meeting pursuant to Section 260 of the Companies Act, 1956 and Article 109 of the Articles of Association of the Company, and in respect of whom the Company has received a notice from a Member under Section 257 of the Companies Act, 1956 proposing his candidature, be and is hereby appointed as a Director of the Company, liable to retire by rotation.”
9. To consider and, if thought fi t, to pass, with or without modifi cation(s), as an Ordinary Resolution the following:
“RESOLVED THAT pursuant to the provisions of Sections 198, 269, 309, 310 read with Schedule XIII and other applicable provisions, if any, of the Companies Act, 1956 (including any statutory modifi cation or re-enactment thereof for the time being in force) and Articles of Association of the Company and subject to such other approvals as may be necessary in this regard, the approval of the Members of the Company be and is hereby accorded to the re-appointment and the terms of remuneration of Mr. Chaitanya Kamat, as the Managing Director & Chief Executive Offi cer of the Company, for a further period of three years with effect from October 25, 2013 to October 24, 2016, at a remuneration as set out below:
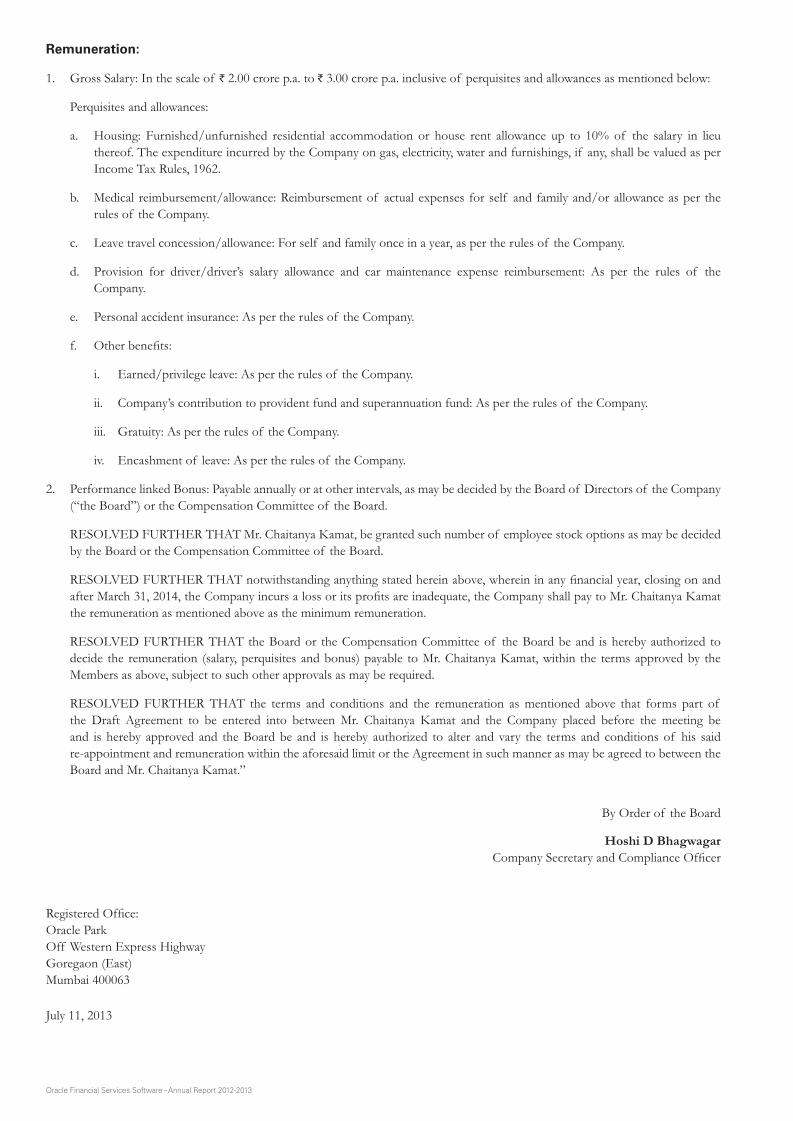
Oracle Financial Services Software – Annual Report 2012-2013
Remuneration:
1. Gross Salary: In the scale of ` 2.00 crore p.a. to ` 3.00 crore p.a. inclusive of perquisites and allowances as mentioned below:
Perquisites and allowances:
a. Housing: Furnished/unfurnished residential accommodation or house rent allowance up to 10% of the salary in lieu thereof. The expenditure incurred by the Company on gas, electricity, water and furnishings, if any, shall be valued as per Income Tax Rules, 1962.
b. Medical reimbursement/allowance: Reimbursement of actual expenses for self and family and/or allowance as per the rules of the Company.
c. Leave travel concession/allowance: For self and family once in a year, as per the rules of the Company.
d. Provision for driver/driver’s salary allowance and car maintenance expense reimbursement: As per the rules of the Company.
e. Personal accident insurance: As per the rules of the Company.
f. Other benefi ts:
i. Earned/privilege leave: As per the rules of the Company.
ii. Company’s contribution to provident fund and superannuation fund: As per the rules of the Company.
iii. Gratuity: As per the rules of the Company.
iv. Encashment of leave: As per the rules of the Company.
2. Performance linked Bonus: Payable annually or at other intervals, as may be decided by the Board of Directors of the Company (“the Board”) or the Compensation Committee of the Board.
RESOLVED FURTHER THAT Mr. Chaitanya Kamat, be granted such number of employee stock options as may be decided by the Board or the Compensation Committee of the Board.
RESOLVED FURTHER THAT notwithstanding anything stated herein above, wherein in any fi nancial year, closing on and after March 31, 2014, the Company incurs a loss or its profi ts are inadequate, the Company shall pay to Mr. Chaitanya Kamat the remuneration as mentioned above as the minimum remuneration.
RESOLVED FURTHER THAT the Board or the Compensation Committee of the Board be and is hereby authorized to decide the remuneration (salary, perquisites and bonus) payable to Mr. Chaitanya Kamat, within the terms approved by the Members as above, subject to such other approvals as may be required.
RESOLVED FURTHER THAT the terms and conditions and the remuneration as mentioned above that forms part of the Draft Agreement to be entered into between Mr. Chaitanya Kamat and the Company placed before the meeting be and is hereby approved and the Board be and is hereby authorized to alter and vary the terms and conditions of his saidre-appointment and remuneration within the aforesaid limit or the Agreement in such manner as may be agreed to between the Board and Mr. Chaitanya Kamat.”
By Order of the Board
Hoshi D BhagwagarCompany Secretary and Compliance Offi cer
Registered Offi ce:Oracle ParkOff Western Express HighwayGoregaon (East)Mumbai 400063
July 11, 2013

121
Notes:
a. The information as required pursuant to Clause 49 of the listing agreement along with an Explanatory Statement as required under Section 173 (2) of the Companies Act, 1956 in respect of item nos. 5 to 9 as mentioned in the above Notice are annexed hereto.
b. The Register of Members and the Share Transfer Books of the Company will remain closed from Thursday, August 8, 2013 to Wednesday, August 14, 2013, both days inclusive, for the purpose of Annual General Meeting.
c. Corporate Members intending to send their authorized representatives to attend the meeting are requested to either send to the Company a certifi ed copy of the Board Resolution or such other authorization, authorizing the representative to attend and vote on their behalf at the meeting or the authorized representatives shall carry such authorization along with them for attending the meeting at the venue.
d. A MEMBER ENTITLED TO ATTEND AND VOTE IS ENTITLED TO APPOINT A PROXY OR PROXIES TO ATTEND AND VOTE INSTEAD OF HIMSELF ON A POLL ONLY AND THAT A PROXY NEED NOT BE A MEMBER.
e. The instrument appointing proxy should be deposited at the Registered Offi ce of the Company not less than 48 hours before the commencement of the meeting.
f. The Members/proxies are requested to bring duly completed Attendance Slips sent herewith for attending the meeting.
g. The documents referred to in the Notice and the Explanatory Statement annexed hereto are available for inspection by the Members of the Company at the Registered Offi ce of the Company between 2.00 p.m. to 4.00 p.m. on any working day of the Company.
h. Members who hold shares in physical form are requested to notify promptly any change in their addresses and other relevant information to the Company’s Registrars and Transfer Agents (RTA), Link Intime India Private Limited, having its offi ce at C-13, Pannalal Silk Mills Compound, L.B.S. Marg, Bhandup (West), Mumbai 400078. Members holding shares in physical form are requested to consider the option of holding shares in dematerialized form.
Members holding shares in single name and physical form are advised to make nomination in respect of their shareholding in the Company. The nomination form (Form 2B) can be downloaded from the website of the RTA http://linkintime.co.in/newsite/download.jsp
Members who hold shares in demat mode are requested to notify promptly, any change in their addresses, bank particulars and other related information to their respective Depository Participants.
i. Members may please note that the RTA has set up a separate cell to address various investor queries. Accordingly, the queries can be directed to +91-22-25946970 or can be e-mailed to [email protected]
j. The Securities and Exchange Board of India (“SEBI”) has mandated the submission of Permanent Account Number (PAN) by every participant in securities market. Members holding shares in electronic form are, therefore, required to submit their PAN to their Depository Participants with whom they are maintaining their demat accounts. Members holding shares in physical form can submit their PAN details to the RTA.
k. As a part of Green Initiative in Corporate Governance, the Ministry of Corporate Affairs vide its Circular No. 17/2011 dated April 21, 2011 and Circular No. 18/2011 dated April 29, 2011 has clarifi ed that a company would have complied with Section 53 of the Companies Act, 1956, if the service of a document has been made through electronic mode, provided the company has obtained e-mail address for sending the notice/documents through e-mail by giving an advance opportunity to the Members to register their e-mail address and changes therein from time to time with the Company. The Company has since been annually sending communications to the incremental Members of the Company seeking their preference for receiving corporate documents and has issued/dispatched Annual Reports accordingly.
l. Members who wish to seek any information/clarifi cation with regard to the accounts are requested to write to the Company Secretary at the registered offi ce address at an early date to enable the Management to keep the information ready.
m. Pursuant to Sections 205A, 205C and other applicable provisions, if any, of the Companies Act, 1956, any money transferred to the unpaid dividend account which remains unpaid or unclaimed for a period of 7 years from the date they become due for payment, is required to be transferred to the “Investor Education and Protection Fund” set up by the Central Government. Accordingly, the amount of unclaimed dividend for the fi nancial year ended March 31, 2006 will be transferred to the “Investor Education and Protection Fund” in due course. Once the amount is so transferred, no claims shall lie against the aforesaid fund or the Company in respect of such dividend amount thereafter. The Members are requested to send to the Company their claims, if any, for the dividend for fi nancial year ended March 31, 2006 immediately.
n. Members may kindly note that due to security reasons, there could be certain restrictions and limitations in terms of movement of people, hand baggage and vehicles at the venue of the meeting. People and their accompanied items would be subject to inspection. We solicit your co-operation.

Oracle Financial Services Software – Annual Report 2012-2013
o. Members may please note that the Company has made arrangements of to and fro bus service for the Members to reach the venue of the Annual General Meeting. The details are:
Bus pick up:
From Andheri (East), Opp. Ackruti City Sales Offi ce - corner of Telli Galli to the Venue At 2.15 p.m.From Ghatkopar (East) Railway Station (next to Platinum Mall) to the Venue At 2.15 p.m.
Bus drop:
From the Venue to Andheri (East), Opp. Ackruti City Sales Offi ce - corner of Telli Galli On conclusion of the meetingFrom the Venue to Ghatkopar (East) Railway Station On conclusion of the meeting
ADDITIONAL INFORMATION PURSUANT TO CLAUSE 49 OF THE LISTING AGREEMENT WITH REGARD TO DIRECTORS SEEKING APPOINTMENT/RE-APPOINTMENT AT THE TWENTY FOURTH ANNUAL GENERAL MEETING:
1. Mr. Derek H Williams
Mr. Derek H Williams, born on December 30, 1944, is an Executive Vice President of Oracle Corporation. Mr. Williams was at the helm of Oracle’s Asia Pacifi c operations from 1991 to 2009, and has led Oracle Japan since 2000.
Mr. Williams is a member of Oracle’s Executive Committee and a Director for Oracle Japan. From June 1, 2011, Mr. Williams became responsible for the Sun Hardware business in Asia Pacifi c and Japan.
Mr. Williams does not hold any equity share of the Company as on date.
Mr. Williams holds directorships and committee memberships* in the following companies:
List of other Directorships held Membership in Committees of
other companies
Chairmanship in Committees of
other companiesNihon Oracle Kabushiki Kaisha – –
*Only the Audit and Shareholders’ Grievances Committees are considered.
2. Mr. Chaitanya Kamat
Mr. Chaitanya Kamat (Chet), born on September 14, 1961, was appointed as the Managing Director & CEO of the Company on October 25, 2010. He brings more than 28 years of fi nancial services, consulting and business transformation experience to his role at Oracle Financial Services Software Limited.
Prior to joining Oracle, Chet was Managing Director at STG, a leading private equity fi rm focused on investing in software and enterprise services companies. At STG, Chet was responsible for the transformation and operations of its portfolio companies with a specifi c focus on their use of global operating models.
Earlier, Chet worked as the CEO of a retail fi nancial services startup and at Accenture. Joining Accenture in 1986, Chet worked across Accenture locations in India, United States, Sweden, Hungary and the Philippines in a range of business consulting and large scale systems integration engagements. In his last role at Accenture, Chet was the Managing Partner of Accenture’s India Delivery Centre Network which he was responsible for establishing from scratch and growing to a 13,000 strong unit serving over 200 global clients.
Chet Kamat obtained his Masters in Computer Science from the University of Bombay and a Post Graduate Diploma in Management from the Indian Institute of Management, Ahmedabad. Chet has served as the Chairman of the Board of Directors at Teleca AB, and as a Director on the Boards of Netik Inc., Symphony Marketing Solutions Inc. and The Capital Markets Company NV.
Mr. Kamat is a member of the ESOP Allotment Committee of the Board. He does not hold any equity share of the Company as on date.
Mr. Kamat does not hold any other directorships.
3. Mr. Richard Jackson
Mr. Richard Jackson, born on March 2, 1956, was appointed as an Additional Director on December 12, 2012. Prior to joining the Board of Oracle Financial Services Software Limited, he was for seven years in China as the President and CEO of Ping An Group’s banking business, 21 years with Citibank in seven different countries including time as their country head in Korea and Hungary.
Mr. Richard Jackson served on the Boards of Bank Handlowy w Warsawie (Poland), Citibank (Hungary), Koram Bank (Korea), Shenzhen Commercial Bank and Shenzhen Development Bank (China).

123
Mr. Richard Jackson is a Fellow of the Chartered Insurance Institute and was awarded the National Friendship Medal by the Chinese Government in 2007.
Mr. Jackson is also the Chairman of the Compensation Committee of the Board. He does not hold any equity share of the Company as on date.
Mr. Jackson is a Director of Novoview Ltd. and he does not hold any committee membership/chairpersonship therein.
4. Ms. Samantha Wellington
Ms. Samantha Wellington, born on February 22, 1978, was appointed as an Additional Director on April 10, 2013. Ms. Wellington is Managing Counsel for Oracle Corporation. She has worked in Oracle’s Australian, Asia Pacifi c, and global businesses and brings more than 10 years of technology-industry legal experience and expertise to her role at Oracle. Prior to her position at Oracle she was a Lawyer for the Australian Communications and Media Authority, statutory authority responsible for the regulation of broadcasting, the internet, radio communications and telecommunications and for FOXTEL, Australia’s largest provider of subscription television services.
Ms. Wellington graduated from Australia’s University of New South Wales with a LLM in Media, Communications, and Information Technology Law. She earlier received her LLB from the University of Wollongong and also holds a BCA from the University of Wollongong. Ms. Wellington is admitted to practice law in both New South Wales, Australia, and California, USA.
Ms. Wellington does not hold any equity share of the Company as on date.
Ms. Wellington holds directorships in the following companies:
List of other Directorships heldAgile Software (Suzhou) Co., Ltd. Oracle Senegal SARLAmberPoint Technology India Private Limited Oracle Software (Nigeria) LimitedBEA Systems (China) Co., LTD Oracle Software d.o.o. LjubljanaFatWire Software India Private Ltd. Oracle Software Srbija i Crna Gora d.o.o.GoAhead Software India Private Limited PeopleSoft India Private Ltd.GoldenGate Technologies South Asia Private Limited Phase Forward Software Services India Private LimitedHyperion Solutions (China) ltd. Profi tLogic Software Private LimitedJ.D. Edwards Software India Pvt. Ltd. Relsys (India) Private LimitedLogical Apps Solutions Pvt. Ltd. Siebel Systems Software (India) Private LimitedOracle Hrvatska d.o.o. Sistemas Oracle de Chile, S.A.Oracle Hungary Kft. Sophoi Technologies Private LimitedOracle Polska, Sp.z.o.o. Sunday Bazar Internet Sales Private LimitedOracle Romania SRL Waban Software Private Limited
Ms. Wellington does not hold any committee memberships/chairpersonship in the above companies.
5. Mr. Harinderjit Singh
Mr. Harinderjit Singh, born on October 9, 1965, was appointed as an Additional Director on July 10, 2013. Mr. Harinderjit Singh is Senior Vice President and General Manager of Oracle’s Financial Services Global Business Unit. In this role, he is responsible for a global organization focused on Sales, Consulting, Engineering and Support, of Oracle’s products focused on Banking, Insurance and Capital Markets.
During his 23-year career at Oracle, Mr. Singh has been instrumental in leading the creation and execution of highly successful corporate, business unit, and new market strategies that produce strong top-line impact across all of Oracle’s hardware, software, and services product lines.
Prior to his current role, he was the Senior Vice President of Oracle’s Industries Business Unit, which is responsible for Oracle’s go-to-market strategy. In this role, his organization was responsible for product marketing, competitive intelligence, fi eld enablement, deal acceleration, and mergers-and-acquisition integration across Oracle’s entire product and services portfolio. In addition, his organization delivered all of Oracle’s strategic customer engagement capabilities. These include solutions and expertise for all industry vertical segments; the Oracle Insight program, which is Oracle’s branded value engineering competency; and the Oracle Solution Centers. Additionally, his organization provided the business strategy, tools, and programs for Oracle’s key accounts and midsize market segments.
Prior to leading the Oracle Industries Business Unit, Mr. Singh was Group Vice President for Oracle Consulting, where he led Oracle’s services business in North America Strategic Accounts.
Mr. Singh holds a master’s degree in industrial engineering from Stanford University and a bachelor’s degree in mechanical engineering from Punjab University, India. He is active in his local community and serves on the Board at the Children’s Discovery Museum in San Jose, California.
Mr. Singh is a Member of the Compensation Committee of the Board. He does not hold any equity share of the Company as on date.

Oracle Financial Services Software – Annual Report 2012-2013
Annexure to notice
Explanatory Statement as required by Section 173 (2) of the Companies Act, 1956.
The following Explanatory Statement sets out all the material facts relating to the special business mentioned under item nos. 5 to 9 in the accompanying Notice dated July 11, 2013.
Item no. 5:
The Company has branch offi ces in India and abroad and may also open new branches in future. It may be necessary to appoint branch auditors for conducting the audit of the books of accounts of the Company at such branches.
The Board of Directors of the Company (“the Board”) seeks approval of the Members for authorizing the Board to appoint Branch Auditors in consultation with the Statutory Auditors of the Company and to fi x their remuneration.
No Director is in any way concerned or interested in the resolution at item no. 5 of the Notice.
Your Directors recommend the resolution at item no. 5 of the Notice.
Item no. 6:
Mr. Richard Jackson was appointed as an Additional Director of the Company by the Board of Directors on December 12, 2012. Pursuant to and in accordance with the provisions of the Section 260 of the Companies Act, 1956, and Article 109 of the Articles of Association of the Company, he holds offi ce up to the date of this Annual General Meeting and is eligible for appointment as a Director of the Company.
The Company has received a notice from a Member, along with the requisite deposit under Section 257 of the Companies Act, 1956, proposing his candidature for appointment as a Director of the Company. A brief write up on Mr. Jackson is provided under additional information forming part of the Notice.
Mr. Richard Jackson’s immense knowledge and experience will add great value to the Company.
Except Mr. Richard Jackson, none of the Directors of the Company is concerned or interested in the resolution at item no. 6 of the Notice.
Your Directors recommend the resolution at item no. 6 of the Notice.
Item no. 7:
Ms. Samantha Wellington was appointed as an Additional Director of the Company by the Board of Directors on April 10, 2013. Pursuant to and in accordance with the provisions of the Section 260 of the Companies Act, 1956, and Article 109 of the Articles of Association of the Company, she holds offi ce up to the date of this Annual General Meeting and is eligible for appointment as a Director of the Company.
The Company has received a notice from a Member, along with the requisite deposit under Section 257 of the Companies Act, 1956, proposing her candidature for appointment as a Director of the Company. A brief write up on Ms. Wellington is provided under additional information forming part of the Notice.
Ms. Samantha Wellington’s immense knowledge and experience will add great value to the Company.
Except Ms. Samantha Wellington, none of the Directors of the Company is concerned or interested in the resolution at item no. 7 of the Notice.
Your Directors recommend the resolution at item no. 7 of the Notice.
Item no. 8:
Mr. Harinderjit Singh was appointed as an Additional Director of the Company by the Board of Directors on July 10, 2013. Pursuant to and in accordance with the provisions of the Section 260 of the Companies Act, 1956, and Article 109 of the Articles of Association of the Company, he holds offi ce up to the date of this Annual General Meeting and is eligible for appointment as a Director of the Company.
The Company has received a notice from a Member, along with the requisite deposit under Section 257 of the Companies Act, 1956, proposing his candidature for appointment as a Director of the Company. A brief write up on Mr. Singh is provided under additional information forming part of the Notice.
Mr. Harinderjit Singh’s immense knowledge and experience will add great value to the Company.
Except Mr. Harinderjit Singh, none of the Directors of the Company is concerned or interested in the resolution at item no. 8 of the Notice.
Your Directors recommend the resolution at item no. 8 of the Notice.

125
Item no. 9:
Mr. Chaitanya Kamat was appointed as the Managing Director & Chief Executive Offi cer of the Company for a period of three years with effect from October 25, 2010. The term of Mr. Chaitanya Kamat as the Managing Director & Chief Executive Offi cer completes on October 24, 2013. The Board of Directors of the Company on July 11, 2013 re-appointed Mr. Chaitanya Kamat as the Managing Director & Chief Executive Offi cer with effect from October 25, 2013, subject to the approval of the Members and such other approvals as may be required, for a further period of three years, on the following terms and conditions:Remuneration:1. Gross Salary: In the scale of ` 2.00 crore p.a. to ` 3.00 crore p.a. inclusive of perquisites and allowances as mentioned below: Perquisites and allowances:
a. Housing: Furnished/unfurnished residential accommodation or house rent allowance up to 10% of the salary in lieu thereof. The expenditure incurred by the Company on gas, electricity, water and furnishings, if any, shall be valued as per Income Tax Rules, 1962.
b. Medical reimbursement/allowance: Reimbursement of actual expenses for self and family and/or allowance as per the rules of the Company.
c. Leave travel concession/allowance: For self and family once in a year, as per the rules of the Company.d. Provision for driver/driver’s salary allowance and car maintenance expense reimbursement: As per the rules of the
Company.e. Personal accident insurance: As per the rules of the Company.f. Other benefi ts:
i. Earned/privilege leave: As per the rules of the Company.ii. Company’s contribution to provident fund and superannuation fund: As per the rules of the Company.iii. Gratuity: As per the rules of the Company.iv. Encashment of leave: As per the rules of the Company.
2. Performance linked Bonus: Payable annually or at other intervals, as may be decided by the Board of Directors of the Company (“the Board”) or the Compensation Committee of the Board.
Mr. Chaitanya Kamat, be granted such number of employee stock options as may be decided by the Board or the Compensation Committee of the Board.
Further, notwithstanding anything stated herein above, wherein in any fi nancial year closing on and after March 31, 2014, the Company incurs a loss or its profi ts are inadequate, the Company shall pay to Mr. Chaitanya Kamat the remuneration as mentioned above as the minimum remuneration.
The above is to be treated as an abstract of the terms and conditions of re-appointment and remuneration payable to Mr. Chaitanya Kamat, as required under Section 302 of the Companies Act, 1956.
The remuneration payable to Mr. Chaitanya Kamat as set out in resolution no. 9 of the Notice is within the limits permitted under Schedule XIII and other applicable provisions of the Companies Act, 1956.
The Draft Agreement to be entered into between Mr. Chaitanya Kamat and the Company is available for inspection by the Members of the Company at its Registered Offi ce between 2.00 p.m. to 4.00 p.m. on any working day of the Company and is also placed before the meeting.
Except Mr. Chaitanya Kamat, no other Director of the Company is concerned or interested in the resolution at item no. 9 of the Notice.
Your Directors recommend the resolution at item no. 9 of the Notice.By Order of the Board
Hoshi D BhagwagarCompany Secretary and Compliance Offi cer
Registered Offi ce:Oracle ParkOff Western Express HighwayGoregaon (East)Mumbai 400063
July 11, 2013

Oracle Financial Services Software – Annual Report 2012-2013
This page has been intentionally left blank.

127
I/We ............................................................................................................................ of ................................................................................... in the
district of .......................................................................................................................................... being a member/members of the above
named Company, hereby appoint ..........................................................................................................................................................................
of ............................................................................................... in the district of ........................................................................................................
or failing him/her .................................................................................................................. of .................................................................... in the
district of ................................................................... as my/our proxy to attend and vote for me/us and on my/our behalf at
the Twenty Fourth Annual General Meeting of the Company to be held on Wednesday, August 14, 2013 at 3.00 p.m. at The Leela
Kempinski, Sahar, Andheri (East), Mumbai 400059, and at any adjournment thereof.
Signed this ................................................. day of ................................................. 2013.
Ledger Folio No. ........................................ DP ID ......................................... Client ID ........................................
No. of Shares held ............................................................
Notes: 1. The proxy need not be a member. 2. The proxy form duly signed across ` 1/- revenue stamp should reach the Registered Office of the Company not
less than 48 hours before the time fixed for the meeting.
PROXY FORM
Oracle Financial Services Software LimitedRegistered Office: Oracle Park, Off Western Express Highway
Goregaon (East), Mumbai 400063
ATTENDANCE SLIP
I hereby record my presence at the Twenty Fourth Annual General Meeting of the Company held on Wednesday, August 14, 2013 at 3.00 p.m. at The Leela Kempinski, Sahar, Andheri (East), Mumbai 400059.
Full name of the Shareholder ................................................................................................................................................................................(in block letters)
Ledger Folio No. ............................................... DP ID ................................................ Client ID ........................................................................
Number of Shares held ..............................................................................................................................................................................................
Full name of Proxy ..............................................................................................................................................................................................(in block letters)
Signature of Shareholder or Proxy attending ...................................................................................................................................................
Please provide full name of the 1st Joint Holder.
........................................................................................................................................................................................................................................
Note: Please fill in the attendance slip and hand it over at the ENTRANCE OF THE HALL.
Oracle Financial Services Software LimitedRegistered Office: Oracle Park, Off Western Express Highway
Goregaon (East), Mumbai 400063
Please affix ` 1/-
revenue stamp and sign across


Oracle Financial Services Software Limited
Registered Office
Oracle Park
Off Western Express Highway
Goregaon (East)
Mumbai, 400063, Maharashtra
India
Investor Enquiries
Phone: + 91.22.6718.3000
Fax: + 91.22.6718.4604
oracle.com/financialservices
Oracle is committed to developing practices and products that help protect the environment
Copyright © 2013, Oracle Financial Services Software Limited and/or its affiliates. All rights reserved.
Oracle is a registered trademark of Oracle Corporation and/or its affiliates. Other names may be trademarks of their respective owners.

1
Business ResponsibilityReport for the Financial Year 2012-2013
Section A: General Information about the Company
1. Corporate Identity Number (CIN) of the Company L72200MH1989PLC053666
2. Name of the Company Oracle Financial Services Software Limited
3. Registered address Oracle Park, Off Western Express Highway Goregaon (East), Mumbai 400 063
4. Website www.oracle.com/financialservices
5. E-mail id [email protected]
6. Financial Year reported April 1, 2012 to March 31, 2013
7. Sector(s) that the Company is engaged in (industrial activity code-wise) As per the National Industrial Classification codes of 2008
Group: 620
Class: 6201
Sub-class: 62011, 62013
8. List three key products/services that the Company manufactures/provides (as in balance sheet)
Products BusinessConsulting ServicesBPO Services
9. Total number of locations where business activity is undertaken by the Company
i. Number of International Locations (Provide details of major 5)
USA, Singapore, Netherlands, Greece, Chile6 offices in India
ii. Number of National Locations
10. Markets served by the Company – Local/State/National/International/
Global Banking and Financial Services Sector
Section B: Financial Details of the Company
1. Paid up Capital Rs. 420 million
2. Total Turnover Rs. 33,780.2 million
3. Total profit after taxes Rs. 10,292.6 million
4. Total Spending on Corporate Social Responsibility (CSR) as percentage of profit after tax
No separate spend on CSR in the reporting period.
5. List of activities in which expenditure in 4 above has been incurred
Not Applicable.
Section C: Other Details
1. Does the Company have any subsidiary company / companies?
The Company has subsidiary companies in Greece, India, Republic of Chile, Republic of China, Republic of Mauritius, Singapore, The Netherlands and USA to handle international operations, sales & marketing efforts, and post-sales support.
2. Do the subsidiary company / companies participate in the BR initiatives of the parent Company? If yes, then indicate the number of such subsidiary company(s).
The Company’s Business Responsibility & Sustainability Policy (BR policy), which includes ethical conduct, anti-corruption, workplace and community, are applicable to its subsidiaries.
3. Do any other entity / entities that the Company does business with participate in the BR initiatives of the Company? If yes, then indicate the percentage of such entity/entities? [Less than 30%, 30-60%, More than 60%]
No. Other business partners of the Company do not directly participate in the Company’s BR initiatives.

Oracle Financial Services Software – Annual Report 2012-2013
Section D: Business Responsibility Information1. Details of Director and BR Head responsible for BR:
DIN Number 00969094Name Chaitanya KamatDesignation Managing Director & Chief Executive OfficerTelephone number +91 22 6718 3000Email ID [email protected]
2. Principle-wise (as per NVGs) BR Policy / Policies: Principles as per the SEBI Business Responsibility Report Framework
Reference Principles DescriptionP1 Principle 1 Businesses should conduct and govern themselves with Ethics, Transparency and AccountabilityP2 Principle 2 Businesses should provide goods and services that are safe and contribute to
sustainability throughout their life cycleP3 Principle 3 Businesses should promote the wellbeing of all employeesP4 Principle 4 Businesses should respect the interests of, and be responsive towards all stakeholders,
especially those who are disadvantaged, vulnerable and marginalized.P5 Principle 5 Businesses should respect and promote human rightsP6 Principle 6 Business should respect, protect, and make efforts to restore the environmentP7 Principle 7 Businesses, when engaged in influencing public and regulatory policy, should do so in a
responsible mannerP8 Principle 8 Businesses should support inclusive growth and equitable developmentP9 Principle 9 Businesses should engage with and provide value to their customers and consumers in a
responsible manner
Sl. No
Questions P1 P2 P3 P4 P5 P6 P7 P8 P9
1 Do you have a policy/policies for.... Y Y Y Y Y Y Y Y Y2 Has the policy been formulated in consultation with the
relevant stakeholders? † Y Y Y Y Y Y Y Y Y
3 Does the policy conform to any national /international standards? If yes, specify? *
Y Y Y Y Y Y Y Y Y
4 Has the policy being approved by the Board? If yes, has it been signed by MD/ owner/ CEO/ appropriate Board Director? §
Y Y Y Y Y Y Y Y Y
5 Does the company have a specified committee of the Board/ Director/Official to oversee the implementation of the policy?
Y Y Y Y Y Y Y Y Y
6 Indicate link for the policy to be viewed online (1), (5)
(2) (1), (4)
N N (1) (1) N (3)
7 Has the policy been formally communicated to all relevant internal and external stakeholders?**
Y Y Y Y Y Y Y Y Y
8 Does the company have in-house structure to implement the policy/policies.
Y Y Y Y Y Y Y Y Y
9 Does the Company have a grievance redressal mechanism related to the policy/policies to address stakeholders’ grievances related to the policy/policies?
Yes, the Company maintains an “open door” policy with regard to the questions from customers, suppliers, partners and others, including any questions related to business conduct, ethics, anti-trust, unfair competition, employee relations concerns, environmental, health and safety concerns. Incidents can be reported to the regional legal counsel or logged using the Compliance and Ethics Helpline or reported through the Incident Reporting Website (https://www.compliance-helpline.com/oracle.jsp).
10 Has the company carried out independent audit/evaluation of the working of this policy by an internal or external agency? ††
Y N N N Y N N N N
† The consultations are conducted as required and where relevant.
* The BR policy of the Company is formulated on the basis of the National Voluntary Guidelines on Social, Environmental and Economic Responsibilities of Business.
§ Oracle Global policies are applicable to the Company in terms of the Board approval and do not require any signature.
** The policies are accessible to employees of the Company. The policies are available to other stakeholders on the internet or intranet as relevant and required.
†† The policies and practices at the Company are subject to internal audit and/or review from time to time.
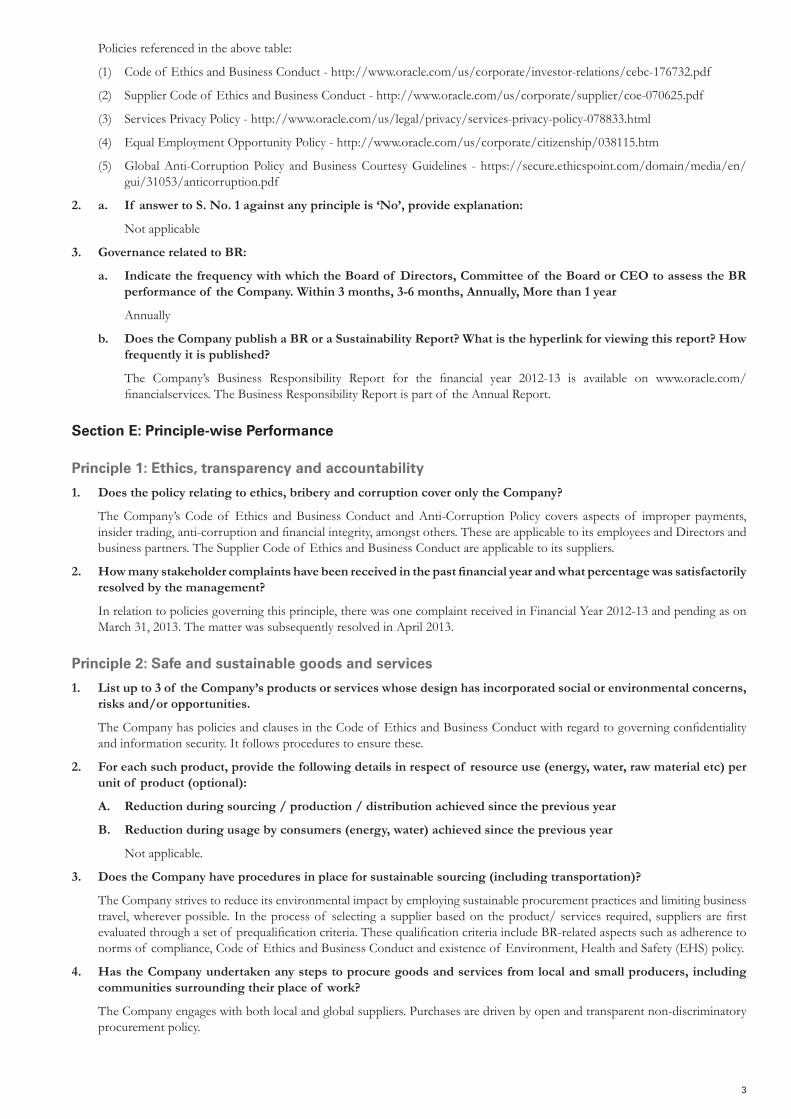
3
Policies referenced in the above table:
(1) Code of Ethics and Business Conduct - http://www.oracle.com/us/corporate/investor-relations/cebc-176732.pdf
(2) Supplier Code of Ethics and Business Conduct - http://www.oracle.com/us/corporate/supplier/coe-070625.pdf
(3) Services Privacy Policy - http://www.oracle.com/us/legal/privacy/services-privacy-policy-078833.html
(4) Equal Employment Opportunity Policy - http://www.oracle.com/us/corporate/citizenship/038115.htm
(5) Global Anti-Corruption Policy and Business Courtesy Guidelines - https://secure.ethicspoint.com/domain/media/en/gui/31053/anticorruption.pdf
2. a. If answer to S. No. 1 against any principle is ‘No’, provide explanation:
Not applicable
3. Governance related to BR:
a. Indicate the frequency with which the Board of Directors, Committee of the Board or CEO to assess the BR performance of the Company. Within 3 months, 3-6 months, Annually, More than 1 year
Annually
b. Does the Company publish a BR or a Sustainability Report? What is the hyperlink for viewing this report? How frequently it is published?
The Company’s Business Responsibility Report for the financial year 2012-13 is available on www.oracle.com/financialservices.TheBusinessResponsibilityReportispartof theAnnualReport.
Section E: Principle-wise Performance
Principle 1: Ethics, transparency and accountability
1. Does the policy relating to ethics, bribery and corruption cover only the Company?
The Company’s Code of Ethics and Business Conduct and Anti-Corruption Policy covers aspects of improper payments, insidertrading,anti-corruptionandfinancialintegrity,amongstothers.TheseareapplicabletoitsemployeesandDirectorsandbusiness partners. The Supplier Code of Ethics and Business Conduct are applicable to its suppliers.
2. Howmanystakeholdercomplaintshavebeenreceivedinthepastfinancialyearandwhatpercentagewassatisfactorilyresolved by the management?
In relation to policies governing this principle, there was one complaint received in Financial Year 2012-13 and pending as on March 31, 2013. The matter was subsequently resolved in April 2013.
Principle 2: Safe and sustainable goods and services
1. List up to 3 of the Company’s products or services whose design has incorporated social or environmental concerns, risks and/or opportunities.
TheCompanyhaspoliciesandclausesintheCodeof EthicsandBusinessConductwithregardtogoverningconfidentialityand information security. It follows procedures to ensure these.
2. For each such product, provide the following details in respect of resource use (energy, water, raw material etc) per unit of product (optional):
A. Reduction during sourcing / production / distribution achieved since the previous year
B. Reduction during usage by consumers (energy, water) achieved since the previous year
Not applicable.
3. Does the Company have procedures in place for sustainable sourcing (including transportation)?
The Company strives to reduce its environmental impact by employing sustainable procurement practices and limiting business travel,whereverpossible.Intheprocessof selectingasupplierbasedontheproduct/servicesrequired,suppliersarefirstevaluatedthroughasetof prequalificationcriteria.ThesequalificationcriteriaincludeBR-relatedaspectssuchasadherencetonorms of compliance, Code of Ethics and Business Conduct and existence of Environment, Health and Safety (EHS) policy.
4. Has the Company undertaken any steps to procure goods and services from local and small producers, including communities surrounding their place of work?
The Company engages with both local and global suppliers. Purchases are driven by open and transparent non-discriminatory procurement policy.

Oracle Financial Services Software – Annual Report 2012-2013
5. Does the company have a mechanism to recycle products and waste? If yes, what is the percentage of recycling of products and waste? Also provide details.
The Company strives to recover, reuse, or recycle its workplace tools such as copiers, computers and paper. The policy for Asset Sale, Donation, and Disposal outlines what employees should do with technology assets that are not being fully utilized or have reached their end of useful life. Computers, monitors, computer accessories, printers, fax machines, projectors, and more are collected and managed by the Technology Recovery and E-Waste Recycling program. Surplus equipment from one department is given to another for immediate use, and assets that must be retired are mined for their useful parts before being donated or recycled.
Principle 3: Well-being of employees
1,2,3,4: Please indicate the Total number of employees, total number of employees hired on temporary/contractual/casual basis, Number of permanent women employees and number of permanent employees with disabilities
Manpower As on March 31, 2013 (in numbers)
Total number of employees 10,374Permanent employees 9,969Temporary/ contractual/ casual basis- employees 405Permanent women employees 2,638Employees with disabilities Not available*
* in keeping with the policy of non-discrimination
5. Does the Company have an employee association that is recognized by management?
Considering the nature of the Company’s business, this is not applicable.
6. What percentage of the Company’s permanent employees is members of this recognized employee association?
Not applicable
7. Please indicate the Number of complaints relating to child labour, forced labour, involuntary labour, sexual harassmentinthelastfinancialyearandpending,asontheendof thefinancialyear.
There were no complaints relating to child labour, forced labour, involuntary labour, sexual harassment that the Company receivedinthefinancialyear2012-13andpendingasonMarch31,2013.
8. What percentage of Company’s under mentioned employees were given safety & skill up-gradation training in the last year?
a. Permanent Employees: Over 80% of permanent employees, including women employees, have received training in the lastyear.EmployeesbasedinIndiaundergofiredrillandfiresafetytrainingeveryyear.
b. Permanent Women Employees: Most permanent women employees have received training in the last year.
c. Casual/Temporary/Contractual Employees: Over 75% of casual/ temporary/ contractual employees have received training in the last year.
d. Employees with Disabilities: This information is not available, in keeping with the Company’s policy of non-discrimination.
Principle 4: Responsiveness to all stakeholders
1. Has the company mapped its internal and external stakeholders?
Yes.TheCompany has identified its stakeholders in theBRpolicy.These include, but are not restricted to, shareholders,employees, clients, suppliers, business partners, and the wider community.
2. Outof theabove,hasthecompanyidentifiedthedisadvantaged,vulnerable&marginalizedstakeholders.
The Company is committed to equal opportunity in its employment practices. As a practice within the organization, preference is placed for disadvantaged, vulnerable or marginalized candidates, given that they possess equal merit.
For employees, the Company has instituted policies such as i-respect (against unlawful discrimination and sexual harassment), Ergonomics&RSI(RepetitiveStressInjury)ConsultationPolicy,provisionsof flexible-workhoursandaccesstocounsellortopromote a healthy, safe and productive workplace.
3. Are there any special initiatives taken by the company to engage with the disadvantaged, vulnerable and marginalized stakeholders.
The Company engages with each of its stakeholders through a variety of forums, including employee engagement initiatives, training programs, feedback process, customer satisfaction surveys and investor meets.

5
Principle 5: Promoting human rights
1. Does the policy of the company on human rights cover only the company or extend to the Group/ Joint Ventures/ Suppliers/ Contractors/ NGOs/ Others?
TheCompanypolicyexpresslyforbidsemployingchildlabour.TheCodeof EthicsandBusinessConductstatesspecificallythat the stakeholders must observe the laws of the land, and where the clauses of the Code are stricter, must comply with theCode.TheCodefurtheraffirmsequalemploymentopportunitypoliciesandintolerancetoanyformof harassmentof employees.
2. Howmanystakeholdercomplaintshavebeenreceivedinthepastfinancialyearandwhatpercentwassatisfactorilyresolved by the management?
EightcomplaintshavebeenreceivedbytheCompanyinthefinancialyear2012-13.87.5%of thesehavebeenresolvedasonMarch 31, 2013.
Principle 6: Protecting the environment
1. Does the policy related to Principle 6 cover only the Company or extends to the Group/Joint Ventures/Suppliers/Contractors/NGOs/others.
The Company has adopted the Oracle Global Environment, Health and Safety Policy which is applicable to its employees. As per the Code of Ethics and Business Conduct, the Company expects its suppliers and partners to be compliant with the Code and with applicable laws and regulations to an entity, including environmental laws and regulations.
2. Does the Company have strategies/ initiatives to address global environmental issues such as climate change, global warming, etc? Y/N. If yes, please give hyperlink for webpage etc.
The Company is committed to conducting its business in a manner that minimizes pollution and other adverse environmental impacts. It has adopted the Real Estate & Facilities Global Sustainability Program, which seeks to drive environmental stewardship byreductionof globalenergyandwaterconsumption,reducingwasteanddivertingwastefromlandfill.TheCompanyalsosupports Ministry of Corporate Affairs’ Go Green initiative, which makes provision for electronic communication of the Annual Reports and other documents to shareholders.
3. Does the Company identify and assess potential environmental risks?
By virtue of nature of its operations, employees are required to work at their workstations for majority of the time. Therefore, the office environment for employees is of utmost importance. In cognizance of this, the Company has formulated anErgonomics & RSI Consultation Policy, which allows the provision of consultation with a professional to evaluate issues of discomfort at the workplace experienced by the employees. The Company then implements the recommendations made based on the professional’s assessment of seating area, lighting, seating and other environmental factors.
4. Does the Company have any project related to Clean Development Mechanism?
Given the nature of the Company’s business, Clean Development Mechanism projects are not relevant to the business.
5. HastheCompanyundertakenanyotherinitiativeson–cleantechnology,energyefficiency,renewableenergy,etc.
During the year, The Company undertook several initiatives to reduce energy requirements from the data centres. These are:
A. Consolidation of data centres – three data centres in India and several international data centres have been consolidated this past year,
B. Refresh of servers – Several old servers were decommissioned and tech-refreshed to the latest environment-friendly equipment, or retired in the past year.
These initiatives have led to savings in energy required for running the equipment, air conditioning and maintenance of data centresinadditiontothesavingsinspace.TheCompanyintendstocontinuetoimplementenergyefficientmeasuresinitsoperations.
6. Are the Emissions/Waste generated by the Company within the permissible limits given by CPCB/SPCB for the financialyearbeingreported?
Yes, the emissions and waste generated by the Company are within the permissible limits of Pollution Control Board.
7. Number of show cause/ legal notices received from CPCB/SPCB which are pending (i.e. not resolved to satisfaction) as on end of Financial Year.
Nil
Principle 7: Responsible policy advocacy
1. Is the Company a member of any trade and chamber or association? If Yes, Name only those major ones that your business deals with:
• BombayChamberof CommerceandIndustry

Oracle Financial Services Software – Annual Report 2012-2013
• Confederationof IndianIndustry(CII).
2. Has the Company advocated/lobbied through above associations for the advancement or improvement of public good?
TheCompanydoesnotengageininfluencingregulatorypolicy.
Principle 8: Supporting inclusive development
1. DoestheCompanyhavespecifiedprogrammes/initiatives/projectsinpursuitof thepolicyrelatedtoPrinciple8?
The Company encourages its employees to be responsible members of the community. The Company has previously supported aprogramforchildrencalled“i-flexforchildren”.Ithadalsoundertakeninitiativessuchasconstructionof additionalfacilitiesat schools and hospitals, athletic event for children, scholarships for children with special needs and making transportation arrangements for special need schools.
2. Are the programmes/projects undertaken through in-house team/own foundation/external NGO/government structures/any other organization?
Theinitiativeslistedaboveweremanagedbyacommitteeof seniorofficialsandvolunteersfromvariousdivisionsandlocationsin India.
3. Have the Company done any impact assessment of Company’s initiative?
Not applicable
4. What is the company’s direct contribution to community development projects-Amount in INR and the details of the projects undertaken
Nodirectcontributioninthefinancialyear2012-13.
5. Have the Company taken steps to ensure that this community development initiative is successfully adopted by the community?
Not applicable
Principle 9: Providing value to customer
1. Whatpercentageof customercomplaints/consumercasesispendingasontheendof financialyear?
ThereisonecasefiledbyaninvestorattheconsumerforumthatispendingbeforetheStateCommissionasonMarch31,2013.
2. Does the Company display product information on the product label, over and above what is mandated as per local laws? Yes/No/N.A. /Remarks(additional information)
The products are provided with a user manual. There are no legal mandatory requirements regarding the product information for the Company’s products.
3. Is there any case filed by any stakeholder against the Company regarding unfair trade practices, irresponsibleadvertisingand/oranti-competitivebehaviourduringthelastfiveyearsandpendingasonendof financialyear.
TherewerenocomplaintsfiledorpendingagainsttheCompanyregardingunfairtradepractice,irresponsibleadvertisingand/or anti-competitive behaviour in the last 5 years.
4. Did the Company carry out any consumer survey/ consumer satisfaction trends?
Yes, The Company conducts external customer satisfaction trends once every year. This is a measure of the health of customer relationships and is also the basis of identifying customer requirements and expectations in the long run. An internal customer satisfaction measure is tracked every quarter based on feedback from employees in customer-facing roles, primarily for immediate remedial actions.