oracleョ hyperion planning, fusion edition user's 䜊甀椀 … · synchronizing supporting...
TRANSCRIPT

O R A C L E ® H Y P E R I O N P L A N N I N G , F U S I O N E D I T I O N
R E L E A S E 1 1 . 1 . 1 . 3
U S E R ’ S G U I D E

Planning User’s Guide, 11.1.1.3
Copyright © 2000, 2009, Oracle and/or its affiliates. All rights reserved.
Authors: EPM Information Development Team
This software and related documentation are provided under a license agreement containing restrictions on use anddisclosure and are protected by intellectual property laws. Except as expressly permitted in your license agreement orallowed by law, you may not use, copy, reproduce, translate, broadcast, modify, license, transmit, distribute, exhibit,perform, publish or display any part, in any form, or by any means. Reverse engineering, disassembly, or decompilationof this software, unless required by law for interoperability, is prohibited.
The information contained herein is subject to change without notice and is not warranted to be error-free. If you findany errors, please report them to us in writing.
If this software or related documentation is delivered to the U.S. Government or anyone licensing it on behalf of the U.S.Government, the following notice is applicable: U.S. GOVERNMENT RIGHTS: Programs, software, databases, and relateddocumentation and technical data delivered to U.S. Government customers are "commercial computer software" or"commercial technical data" pursuant to the applicable Federal Acquisition Regulation and agency-specific supplementalregulations. As such, the use, duplication, disclosure, modification, and adaptation shall be subject to the restrictions andlicense terms set forth in the applicable Government contract, and, to the extent applicable by the terms of the Governmentcontract, the additional rights set forth in FAR 52.227-19, Commercial Computer Software License (December 2007).Oracle USA, Inc., 500 Oracle Parkway, Redwood City, CA 94065.
This software is developed for general use in a variety of information management applications. It is not developed orintended for use in any inherently dangerous applications, including applications which may create a risk of personalinjury. If you use this software in dangerous applications, then you shall be responsible to take all appropriate fail-safe,backup, redundancy and other measures to ensure the safe use of this software. Oracle Corporation and its affiliates disclaimany liability for any damages caused by use of this software in dangerous applications.
This software and documentation may provide access to or information on content, products and services from thirdparties. Oracle Corporation and its affiliates are not responsible for and expressly disclaim all warranties of any kind withrespect to third party content, products and services. Oracle Corporation and its affiliates will not be responsible for anyloss, costs, or damages incurred due to your access to or use of third party content, products or services.

Contents
Documentation Accessibility . . . . . . . . . . . . . . . . . . . . . . . . . . . . . . . . . . . . . . . . . . . . . . . 7
Chapter 1. About Planning . . . . . . . . . . . . . . . . . . . . . . . . . . . . . . . . . . . . . . . . . . . . . . . . . . . . . . . . . . . . 9
Overview of Planning . . . . . . . . . . . . . . . . . . . . . . . . . . . . . . . . . . . . . . . . . . . . . . . . . . . 9
Logging on to EPM Workspace . . . . . . . . . . . . . . . . . . . . . . . . . . . . . . . . . . . . . . . . . . . 10
Working With Multiple Applications . . . . . . . . . . . . . . . . . . . . . . . . . . . . . . . . . . . . . . . 10
Navigating in Planning . . . . . . . . . . . . . . . . . . . . . . . . . . . . . . . . . . . . . . . . . . . . . . . . . 11
Switching Between Advanced Mode and Basic Mode . . . . . . . . . . . . . . . . . . . . . . . . . . . . 12
Searching for Data Forms . . . . . . . . . . . . . . . . . . . . . . . . . . . . . . . . . . . . . . . . . . . . 12
Using Online Help . . . . . . . . . . . . . . . . . . . . . . . . . . . . . . . . . . . . . . . . . . . . . . . . . 13
About Task Lists . . . . . . . . . . . . . . . . . . . . . . . . . . . . . . . . . . . . . . . . . . . . . . . . . . . 13
Logging Off . . . . . . . . . . . . . . . . . . . . . . . . . . . . . . . . . . . . . . . . . . . . . . . . . . . . . . . . . 13
Chapter 2. Working with Task Lists . . . . . . . . . . . . . . . . . . . . . . . . . . . . . . . . . . . . . . . . . . . . . . . . . . . . . . 15
Working with Task Lists . . . . . . . . . . . . . . . . . . . . . . . . . . . . . . . . . . . . . . . . . . . . . . . . 15
Viewing Task Lists in Basic Mode . . . . . . . . . . . . . . . . . . . . . . . . . . . . . . . . . . . . . . . . . . 15
Viewing Task Lists in Advanced Mode . . . . . . . . . . . . . . . . . . . . . . . . . . . . . . . . . . . . . . 16
Viewing Selected Task Lists in Advanced Mode . . . . . . . . . . . . . . . . . . . . . . . . . . . . . . . . 16
Viewing Tasks . . . . . . . . . . . . . . . . . . . . . . . . . . . . . . . . . . . . . . . . . . . . . . . . . . . . . . . 16
Viewing Tasks in Basic Mode . . . . . . . . . . . . . . . . . . . . . . . . . . . . . . . . . . . . . . . . . . 16
Viewing Tasks in Advanced Mode . . . . . . . . . . . . . . . . . . . . . . . . . . . . . . . . . . . . . . 17
Viewing Task Instructions in Basic Mode . . . . . . . . . . . . . . . . . . . . . . . . . . . . . . . . . . . . 17
Viewing Task Instructions in Advanced Mode . . . . . . . . . . . . . . . . . . . . . . . . . . . . . . . . 17
Viewing Task List Instructions in Basic Mode . . . . . . . . . . . . . . . . . . . . . . . . . . . . . . . . . 17
Viewing Task List Instructions in Advanced Mode . . . . . . . . . . . . . . . . . . . . . . . . . . . . . 18
Completing Tasks . . . . . . . . . . . . . . . . . . . . . . . . . . . . . . . . . . . . . . . . . . . . . . . . . . . . . 18
Viewing Task Status in Basic Mode . . . . . . . . . . . . . . . . . . . . . . . . . . . . . . . . . . . . . . . . 19
Viewing Task Status in Advanced Mode . . . . . . . . . . . . . . . . . . . . . . . . . . . . . . . . . . . . . 19
Viewing E-Mail Alerts . . . . . . . . . . . . . . . . . . . . . . . . . . . . . . . . . . . . . . . . . . . . . . . . . . 20
Reporting on Task List Status . . . . . . . . . . . . . . . . . . . . . . . . . . . . . . . . . . . . . . . . . . . . 20
Chapter 3. Working with Data Forms . . . . . . . . . . . . . . . . . . . . . . . . . . . . . . . . . . . . . . . . . . . . . . . . . . . . . 23
Selecting and Opening Data Forms . . . . . . . . . . . . . . . . . . . . . . . . . . . . . . . . . . . . . . . . 23
Contents iii

Opening Data Forms in Advanced Mode . . . . . . . . . . . . . . . . . . . . . . . . . . . . . . . . . 23
Opening Data Forms in Basic Mode . . . . . . . . . . . . . . . . . . . . . . . . . . . . . . . . . . . . . 24
Searching for Data Forms . . . . . . . . . . . . . . . . . . . . . . . . . . . . . . . . . . . . . . . . . . . . 24
Expanding Data Forms and the Data Entry Area . . . . . . . . . . . . . . . . . . . . . . . . . . . . . . 24
Adding Rows . . . . . . . . . . . . . . . . . . . . . . . . . . . . . . . . . . . . . . . . . . . . . . . . . . . . . . . . 25
Setting Column Width . . . . . . . . . . . . . . . . . . . . . . . . . . . . . . . . . . . . . . . . . . . . . . . . . 25
Hiding Rows or Columns Having No Data or Zeros . . . . . . . . . . . . . . . . . . . . . . . . . . . . 26
Searching in Data Forms . . . . . . . . . . . . . . . . . . . . . . . . . . . . . . . . . . . . . . . . . . . . . . . . 26
Viewing Instructions for Data Forms . . . . . . . . . . . . . . . . . . . . . . . . . . . . . . . . . . . . . . . 27
Copying Versions . . . . . . . . . . . . . . . . . . . . . . . . . . . . . . . . . . . . . . . . . . . . . . . . . . . . . 27
Launching Smart View from Planning . . . . . . . . . . . . . . . . . . . . . . . . . . . . . . . . . . . . . . 28
Chapter 4. Entering Data . . . . . . . . . . . . . . . . . . . . . . . . . . . . . . . . . . . . . . . . . . . . . . . . . . . . . . . . . . . . 29
About Entering Data . . . . . . . . . . . . . . . . . . . . . . . . . . . . . . . . . . . . . . . . . . . . . . . . . . . 29
Entering Data with Smart Lists . . . . . . . . . . . . . . . . . . . . . . . . . . . . . . . . . . . . . . . . . 30
Entering Data with Menus . . . . . . . . . . . . . . . . . . . . . . . . . . . . . . . . . . . . . . . . . . . . 31
Entering Percentage Values . . . . . . . . . . . . . . . . . . . . . . . . . . . . . . . . . . . . . . . . . . . 31
Entering Date Values . . . . . . . . . . . . . . . . . . . . . . . . . . . . . . . . . . . . . . . . . . . . . . . . 32
Entering Text Values . . . . . . . . . . . . . . . . . . . . . . . . . . . . . . . . . . . . . . . . . . . . . . . . 32
Dynamically Setting User Variables . . . . . . . . . . . . . . . . . . . . . . . . . . . . . . . . . . . . . 32
Navigating in Data Forms . . . . . . . . . . . . . . . . . . . . . . . . . . . . . . . . . . . . . . . . . . . . . . . 33
Selecting Data . . . . . . . . . . . . . . . . . . . . . . . . . . . . . . . . . . . . . . . . . . . . . . . . . . . . . . . . 33
Searching for Members . . . . . . . . . . . . . . . . . . . . . . . . . . . . . . . . . . . . . . . . . . . . . . . . . 34
Viewing Member Formulas . . . . . . . . . . . . . . . . . . . . . . . . . . . . . . . . . . . . . . . . . . . . . 34
Selecting Cell Ranges . . . . . . . . . . . . . . . . . . . . . . . . . . . . . . . . . . . . . . . . . . . . . . . . . . . 34
Copying and Pasting Cells . . . . . . . . . . . . . . . . . . . . . . . . . . . . . . . . . . . . . . . . . . . . . . . 35
Adding, Viewing, and Editing Cell Text . . . . . . . . . . . . . . . . . . . . . . . . . . . . . . . . . . . . . 36
Printing Cell Text . . . . . . . . . . . . . . . . . . . . . . . . . . . . . . . . . . . . . . . . . . . . . . . . . . . . . 36
Using Account Annotations and URL Links . . . . . . . . . . . . . . . . . . . . . . . . . . . . . . . . . . 37
Adding, Replacing, and Viewing Cell-Level Documents . . . . . . . . . . . . . . . . . . . . . . . . . 37
Writing #MISSING Values . . . . . . . . . . . . . . . . . . . . . . . . . . . . . . . . . . . . . . . . . . . . . . 38
Subtotaling Values . . . . . . . . . . . . . . . . . . . . . . . . . . . . . . . . . . . . . . . . . . . . . . . . . . . . 38
Getting the Latest Data . . . . . . . . . . . . . . . . . . . . . . . . . . . . . . . . . . . . . . . . . . . . . . . . . 39
Exporting Data to Microsoft Excel . . . . . . . . . . . . . . . . . . . . . . . . . . . . . . . . . . . . . . . . . 39
Drilling Through to Source Data . . . . . . . . . . . . . . . . . . . . . . . . . . . . . . . . . . . . . . . . . . 40
Saving Data . . . . . . . . . . . . . . . . . . . . . . . . . . . . . . . . . . . . . . . . . . . . . . . . . . . . . . . . . 40
Printing Data . . . . . . . . . . . . . . . . . . . . . . . . . . . . . . . . . . . . . . . . . . . . . . . . . . . . . . . . 41
Chapter 5. Working With Business Rules . . . . . . . . . . . . . . . . . . . . . . . . . . . . . . . . . . . . . . . . . . . . . . . . . 43
About Launching Business Rules . . . . . . . . . . . . . . . . . . . . . . . . . . . . . . . . . . . . . . . . . . 43
iv Contents

Launching Business Rules in Classic Applications . . . . . . . . . . . . . . . . . . . . . . . . . . . . . . 44
Launching Business Rules in Performance Management Architect Applications . . . . . . . . 44
Entering Runtime Prompts . . . . . . . . . . . . . . . . . . . . . . . . . . . . . . . . . . . . . . . . . . . . . . 45
Using Business Rules in Basic Mode . . . . . . . . . . . . . . . . . . . . . . . . . . . . . . . . . . . . . . . . 46
Checking Job Status . . . . . . . . . . . . . . . . . . . . . . . . . . . . . . . . . . . . . . . . . . . . . . . . . . . 47
Chapter 6. Adjusting and Spreading Data . . . . . . . . . . . . . . . . . . . . . . . . . . . . . . . . . . . . . . . . . . . . . . . . . 49
Adjusting Cell Values . . . . . . . . . . . . . . . . . . . . . . . . . . . . . . . . . . . . . . . . . . . . . . . . . . 49
Adjusting Values . . . . . . . . . . . . . . . . . . . . . . . . . . . . . . . . . . . . . . . . . . . . . . . . . . 49
Performing Ad Hoc Analysis . . . . . . . . . . . . . . . . . . . . . . . . . . . . . . . . . . . . . . . . . . 50
Spreading Data for Time Periods . . . . . . . . . . . . . . . . . . . . . . . . . . . . . . . . . . . . . . . . . . 50
How Spreading Data Works . . . . . . . . . . . . . . . . . . . . . . . . . . . . . . . . . . . . . . . . . . 51
Spreading with Multiple Currencies . . . . . . . . . . . . . . . . . . . . . . . . . . . . . . . . . . . . . 55
Locking Cells . . . . . . . . . . . . . . . . . . . . . . . . . . . . . . . . . . . . . . . . . . . . . . . . . . . . . 56
Examples of Spreading Data with Cell Locking . . . . . . . . . . . . . . . . . . . . . . . . . . . . . 56
Spreading Values Using Grid Spread . . . . . . . . . . . . . . . . . . . . . . . . . . . . . . . . . . . . . . . 57
Spreading Values Using Mass Allocations . . . . . . . . . . . . . . . . . . . . . . . . . . . . . . . . . . . . 58
Chapter 7. Working with Supporting Detail . . . . . . . . . . . . . . . . . . . . . . . . . . . . . . . . . . . . . . . . . . . . . . . . 61
Working with Supporting Detail . . . . . . . . . . . . . . . . . . . . . . . . . . . . . . . . . . . . . . . . . . 61
Adding Supporting Detail . . . . . . . . . . . . . . . . . . . . . . . . . . . . . . . . . . . . . . . . . . . . . . . 62
Example of Supporting Detail . . . . . . . . . . . . . . . . . . . . . . . . . . . . . . . . . . . . . . . . . 62
Totaling When Supporting Detail Cells are Blank . . . . . . . . . . . . . . . . . . . . . . . . . . . 63
Working with the Supporting Detail Hierarchy . . . . . . . . . . . . . . . . . . . . . . . . . . . . . 64
Viewing or Changing Supporting Detail . . . . . . . . . . . . . . . . . . . . . . . . . . . . . . . . . . . . . 65
Synchronizing Supporting Detail with Essbase . . . . . . . . . . . . . . . . . . . . . . . . . . . . . . . . 65
Pasting Multiple Cells into the Supporting Detail Window . . . . . . . . . . . . . . . . . . . . . . . 66
Chapter 8. Working with Currencies . . . . . . . . . . . . . . . . . . . . . . . . . . . . . . . . . . . . . . . . . . . . . . . . . . . . . 67
Working with Multiple Currencies . . . . . . . . . . . . . . . . . . . . . . . . . . . . . . . . . . . . . . . . . 67
Changing the Currency for a Data Cell . . . . . . . . . . . . . . . . . . . . . . . . . . . . . . . . . . . . . . 68
Reporting on Data in Multiple Currencies . . . . . . . . . . . . . . . . . . . . . . . . . . . . . . . . . . . 68
Chapter 9. Managing Planning Units . . . . . . . . . . . . . . . . . . . . . . . . . . . . . . . . . . . . . . . . . . . . . . . . . . . . 69
Overview of the Review Process . . . . . . . . . . . . . . . . . . . . . . . . . . . . . . . . . . . . . . . . . . . 69
Viewing a Planning Unit's Status . . . . . . . . . . . . . . . . . . . . . . . . . . . . . . . . . . . . . . . . . . 70
Changing a Planning Unit's Status . . . . . . . . . . . . . . . . . . . . . . . . . . . . . . . . . . . . . . . . . 71
Adding or Viewing Planning Unit Annotations . . . . . . . . . . . . . . . . . . . . . . . . . . . . . . . . 72
Printing Planning Unit Annotations . . . . . . . . . . . . . . . . . . . . . . . . . . . . . . . . . . . . . . . . 73
Viewing a Planning Unit's History . . . . . . . . . . . . . . . . . . . . . . . . . . . . . . . . . . . . . . . . . 73
Contents v

Chapter 10. Setting User Preferences . . . . . . . . . . . . . . . . . . . . . . . . . . . . . . . . . . . . . . . . . . . . . . . . . . . . 75
Setting Preferences for Application Settings . . . . . . . . . . . . . . . . . . . . . . . . . . . . . . . . . . 75
Setting Up E-mail . . . . . . . . . . . . . . . . . . . . . . . . . . . . . . . . . . . . . . . . . . . . . . . . . . 75
Selecting the Alias Setting . . . . . . . . . . . . . . . . . . . . . . . . . . . . . . . . . . . . . . . . . . . . 76
Setting Member Selection Options . . . . . . . . . . . . . . . . . . . . . . . . . . . . . . . . . . . . . . 76
Setting Workflow Options . . . . . . . . . . . . . . . . . . . . . . . . . . . . . . . . . . . . . . . . . . . . 77
Setting Preferences for Display Options . . . . . . . . . . . . . . . . . . . . . . . . . . . . . . . . . . . . . 77
Changing the Formatting of Numbers . . . . . . . . . . . . . . . . . . . . . . . . . . . . . . . . . . . 78
Remembering the Last Page Selected . . . . . . . . . . . . . . . . . . . . . . . . . . . . . . . . . . . . 79
Indenting Members on the Page Drop-Down List . . . . . . . . . . . . . . . . . . . . . . . . . . . 79
Enabling Search with a Large Number of Pages . . . . . . . . . . . . . . . . . . . . . . . . . . . . . 80
Remembering the Most Recent Page Visited . . . . . . . . . . . . . . . . . . . . . . . . . . . . . . . 80
Enabling Warnings for Large Data Forms . . . . . . . . . . . . . . . . . . . . . . . . . . . . . . . . . 80
Showing Records on the Dimensions and Assign Access Pages . . . . . . . . . . . . . . . . . . 81
Viewing the Interface in Higher Contrast . . . . . . . . . . . . . . . . . . . . . . . . . . . . . . . . . 81
Setting Text Size . . . . . . . . . . . . . . . . . . . . . . . . . . . . . . . . . . . . . . . . . . . . . . . . . . . 81
Setting the Date Format . . . . . . . . . . . . . . . . . . . . . . . . . . . . . . . . . . . . . . . . . . . . . 82
Setting Preferences for Printing Options . . . . . . . . . . . . . . . . . . . . . . . . . . . . . . . . . . . . . 82
Setting Preferences for User Variables . . . . . . . . . . . . . . . . . . . . . . . . . . . . . . . . . . . . . . 83
Chapter 11. Frequently Asked Questions . . . . . . . . . . . . . . . . . . . . . . . . . . . . . . . . . . . . . . . . . . . . . . . . . . 85
Glossary . . . . . . . . . . . . . . . . . . . . . . . . . . . . . . . . . . . . . . . . . . . . . . . . . . . . . . . . . . . . 89
Index . . . . . . . . . . . . . . . . . . . . . . . . . . . . . . . . . . . . . . . . . . . . . . . . . . . . . . . . . . . . . 113
vi Contents

Documentation Accessibility
Our goal is to make Oracle products, services, and supporting documentation accessible, withgood usability, to the disabled community. To that end, our documentation includes featuresthat make information available to users of assistive technology. This documentation is availablein HTML format, and contains markup to facilitate access by the disabled community.Accessibility standards will continue to evolve over time, and Oracle is actively engaged withother market-leading technology vendors to address technical obstacles so that ourdocumentation can be accessible to all of our customers. For more information, visit the OracleAccessibility Program Web site at http://www.oracle.com/accessibility/.
Accessibility of Code Examples in DocumentationScreen readers may not always correctly read the code examples in this document. Theconventions for writing code require that closing braces should appear on an otherwise emptyline; however, some screen readers may not always read a line of text that consists solely of abracket or brace.
Accessibility of Links to External Web Sites in DocumentationThis documentation may contain links to Web sites of other companies or organizations thatOracle does not own or control. Oracle neither evaluates nor makes any representationsregarding the accessibility of these Web sites.
TTY Access to Oracle Support ServicesOracle provides dedicated Text Telephone (TTY) access to Oracle Support Services within theUnited States of America 24 hours a day, seven days a week. For TTY support, call 800.446.2398.
7

8 Documentation Accessibility

1About Planning
In This Chapter
Overview of Planning... . . . . . . . . . . . . . . . . . . . . . . . . . . . . . . . . . . . . . . . . . . . . . . . . . . . . . . . . . . . . . . . . . . . . . . . . . . . . . . . . . . . . . . . . . . . . . . . . . . . . . . . . . . . . . 9
Logging on to EPM Workspace... . . . . . . . . . . . . . . . . . . . . . . . . . . . . . . . . . . . . . . . . . . . . . . . . . . . . . . . . . . . . . . . . . . . . . . . . . . . . . . . . . . . . . . . . . . . . . . . . .10
Working With Multiple Applications ... . . . . . . . . . . . . . . . . . . . . . . . . . . . . . . . . . . . . . . . . . . . . . . . . . . . . . . . . . . . . . . . . . . . . . . . . . . . . . . . . . . . . . . . . . . .10
Navigating in Planning .. . . . . . . . . . . . . . . . . . . . . . . . . . . . . . . . . . . . . . . . . . . . . . . . . . . . . . . . . . . . . . . . . . . . . . . . . . . . . . . . . . . . . . . . . . . . . . . . . . . . . . . . . . .11
Switching Between Advanced Mode and Basic Mode... . . . . . . . . . . . . . . . . . . . . . . . . . . . . . . . . . . . . . . . . . . . . . . . . . . . . . . . . . . . . . . . . . . . . . . .12
Logging Off . . . . . . . . . . . . . . . . . . . . . . . . . . . . . . . . . . . . . . . . . . . . . . . . . . . . . . . . . . . . . . . . . . . . . . . . . . . . . . . . . . . . . . . . . . . . . . . . . . . . . . . . . . . . . . . . . . . . . . . . .13
Overview of PlanningOracle Hyperion Planning, Fusion Edition is a Web-based budgeting and planning solution,driving collaborative, event-based operational planning processes throughout the organizationfor a wide range of financial and operational needs. It gives Web users the ability to enter, analyze,and report on data, manage the planning process, and personalize data entry forms.
Planning is a comprehensive approach for the complete and closed-loop planning process thatdrives continuous business improvement. With Planning, all decision makers and front-linemanagers can communicate which course of action to take and get budget holders to collaborateso that the planning process is optimized and efficient. When a material event occurs that causesa change in direction, planners have the flexibility to adapt rapidly, ensuring that plans arerelevant and useful.
Planning's benefits:
l Facilitates collaboration, communication, and control across multi-divisional globalenterprises
l Provides a framework for perpetual planning, with attention to managing volatility andfrequent planning cycles
l Provides ease of use and deployment through the Web or Oracle Hyperion Smart View forOffice, Fusion Edition
l Lowers the total cost of ownership through a shorter roll out and implementation phase,and easier applications maintenance
l Enhances decision-making with reporting, analysis, and planning
l Promotes modeling by including complex business rules and allocations
Overview of Planning 9

l Integrates with Smart View so you can design worksheets in Microsoft Excel to enter, format,analyze, and report on data in a Planning application. Using Smart Slices—subsets of dataforms—in Smart View, you can also perform ad hoc analysis. See the Oracle Hyperion SmartView for Office User's Guide for information on all Smart View functionality.
l Enables you to enter and analyze data using Offline Planning when you are disconnectedfrom the Internet—for example, on airplanes or in hotel rooms—and later save the databack to the Planning server. (The administrator must enable this feature for the application.)
l Integrates with other systems to load data
Logging on to EPM WorkspaceYou work with Planning in Oracle Enterprise Performance Management Workspace, FusionEdition environment. You can access EPM Workspace through a URL that your administratorprovides or through an Oracle application link.
Note: Access through Oracle product links requires that single sign-on be enabled.
ä To start a EPM Workspace session:
1 In your Web browser, go to the EPM Workspace Web page.
2 Enter your user name and password, which are case-sensitive.
3 Click Log On.
4 To work with a Planning application, in EPM Workspace, select Navigate, then Applications, then Planningand select your Planning application.
Note: You can select multiple Planning applications and navigate among them by clicking theapplication name on the tab at the bottom of the EPM Workspace window.
If you logged on previously, you return to the mode you were in when you last logged off. Forexample, if you were working in Basic mode when you logged off, the next time you log on, youare returned to Basic mode. See “Switching Between Advanced Mode and Basic Mode” on page12.
Working With Multiple ApplicationsYou can simultaneously open several Planning applications—or the same application multipletimes—and navigate among them by clicking their names on the tabs at the bottom of the EPMWorkspace window.
10 About Planning

Navigating in Planning After you select a Planning application, use the view pane on the page's left side to view foldersand data forms. To open a data form, double-click a folder name, and click a data form's name.The data form opens in the content area on the page's right side.
ä To make more room for your work:
l To hide or show the view pane at the page's left side, select View, then View Pane.
l Click the View Pane or Content Area Adjuster (see the EPM Workspace online help).
l Drag the view pane to resize it.
l Click on the upper-right corner to maximize or minimize the content area.
You can work in Advanced mode or Basic mode. See “Switching Between Advanced Mode andBasic Mode” on page 12.
The following table lists getting started tasks and their corresponding procedures.
Task Action
Work with data formsand enter data
In the view pane's Folders area:
1. Click next to Forms to expand the folders.
2. Click a folder name.
3. In the content area, click the name of the data form you want to work with.
See “Working with Data Forms” on page 23 and “About Entering Data” on page 29.
Search for data forms inthe view pane
Click in the view pane and enter search criteria in the text box in the lower-right corner.
Click or to search up or down.
Launch business rulesl To launch a business rule associated with a data form, open the data form and select
Edit, then Launch Rules, or click a rule in the Business Rules area.
l To launch a business rule associated with a plan, select Tools, then Business Rules.See “Launching Business Rules in Classic Applications” on page 44 or “LaunchingBusiness Rules in Performance Management Architect Applications” on page 44.
Annotate planningunits, add cell text, drillthrough to view detailsof the data source, oradd or copy supportingdetail
Open a data form, and select a command from the Edit menu. See:
l “Using Account Annotations and URL Links” on page 37
l “Adding, Viewing, and Editing Cell Text” on page 36
l “Drilling Through to Source Data” on page 40
l “Adding Supporting Detail” on page 62
Manage workflowl To check a plan's status, select File, then Workflow, then Manage Process. See
“Managing Planning Units” on page 69.
l To copy data from one version of a selected scenario to another version in the samescenario, select File, then Workflow, then Copy Version. See “Copying Versions” onpage 27.
Navigating in Planning 11

Task Action
Select menucommands
Select commands from these menus: File, Edit, View, Tools, and Help.
Use shortcut buttons Click shortcut buttons to perform these tasks:
l Toggle the view pane to make more room for your work.
l Save, refresh, and print information in data forms
l Adjust, cut, copy, or paste data
l Lock or unlock cells, and spread values
l Add cell text, work with supporting detail, or use cell-level documents. If task lists areassigned to you, open a task list or check a task list's status
l Export data to a spreadsheet
l Log off
l Open online help
Click in the screen's upper-right corner to toggle between hiding and showing the viewpane.
Use URL links If your administrator sets up links to other resources, you can access commonly-used toolsor Web sites for analyzing, tracking, and reporting on planning data. To open a URL link,select Tools, then Links, then Planning Links, and select a link.
Set preferences forPlanning
Select File, then Preferences. See “Setting User Preferences” on page 75.
Perform administrativetasks
If you log on as an administrator, the Administration menu is enabled, from which you cancreate data forms, tasks lists and so on. See the Oracle Hyperion Planning Administrator’sOnline Help.
Switching Between Advanced Mode and Basic ModeIf tasks are set up and assigned to you, you can switch from Advanced mode to Basic mode. UseAdvanced mode when you want to work primarily with data forms. Use Basic mode when youwant to work with task lists. When you switch between modes, you return to the activity youwere performing before you switched. For example, if you are working in a data form when youswitch to Basic mode, you are returned to the same data form when you return to Basic mode.
ä To switch between Advanced mode and Basic mode, select either one from the View menu. Youcan switch to Basic mode only if at least one task is assigned to you.
Searching for Data FormsIn Advanced mode, you can search for data forms.
ä To search for data forms:
1 In Advanced mode, enter part or all of the search criteria in the text box on the page's lower-right corner.
12 About Planning

See “Switching Between Advanced Mode and Basic Mode” on page 12.
2 Click or to search up or down.
Using Online Help
ä To get context-sensitive help, select Help, then Help on This Topic, or click the Help button indialog boxes.
ä To browse the help system, select Help, then Contents.
About Task ListsAdministrators and interactive users can set up task lists that guide you through the steps—including their due dates—to complete a budget cycle. For example, a task might help you enterdata, run a business rule, and submit numbers for approval. Your administrator can also includetasks that link to other applications. See Chapter 2, “Working with Task Lists.”
Logging Off You can quit the current session or exit Planning entirely.
ä To log off the current session:
1 Select File, then Log Off.
2 In Log Off, click Yes.
The Log On screen is displayed for your next session.
Note: If you log on and do not use the application for awhile, you are automatically logged offat the interval your administrator set.
ä To close Planning, select File, then Exit.
Logging Off 13

14 About Planning

2Working with Task Lists
In This Chapter
Working with Task Lists .. . . . . . . . . . . . . . . . . . . . . . . . . . . . . . . . . . . . . . . . . . . . . . . . . . . . . . . . . . . . . . . . . . . . . . . . . . . . . . . . . . . . . . . . . . . . . . . . . . . . . . . . . . .15
Viewing Task Lists in Basic Mode... . . . . . . . . . . . . . . . . . . . . . . . . . . . . . . . . . . . . . . . . . . . . . . . . . . . . . . . . . . . . . . . . . . . . . . . . . . . . . . . . . . . . . . . . . . . . . .15
Viewing Task Lists in Advanced Mode ... . . . . . . . . . . . . . . . . . . . . . . . . . . . . . . . . . . . . . . . . . . . . . . . . . . . . . . . . . . . . . . . . . . . . . . . . . . . . . . . . . . . . . . . .16
Viewing Selected Task Lists in Advanced Mode... . . . . . . . . . . . . . . . . . . . . . . . . . . . . . . . . . . . . . . . . . . . . . . . . . . . . . . . . . . . . . . . . . . . . . . . . . . . . . .16
Viewing Tasks... . . . . . . . . . . . . . . . . . . . . . . . . . . . . . . . . . . . . . . . . . . . . . . . . . . . . . . . . . . . . . . . . . . . . . . . . . . . . . . . . . . . . . . . . . . . . . . . . . . . . . . . . . . . . . . . . . . . .16
Viewing Task Instructions in Basic Mode ... . . . . . . . . . . . . . . . . . . . . . . . . . . . . . . . . . . . . . . . . . . . . . . . . . . . . . . . . . . . . . . . . . . . . . . . . . . . . . . . . . . . . .17
Viewing Task Instructions in Advanced Mode ... . . . . . . . . . . . . . . . . . . . . . . . . . . . . . . . . . . . . . . . . . . . . . . . . . . . . . . . . . . . . . . . . . . . . . . . . . . . . . . . .17
Viewing Task List Instructions in Basic Mode... . . . . . . . . . . . . . . . . . . . . . . . . . . . . . . . . . . . . . . . . . . . . . . . . . . . . . . . . . . . . . . . . . . . . . . . . . . . . . . . . .17
Viewing Task List Instructions in Advanced Mode... . . . . . . . . . . . . . . . . . . . . . . . . . . . . . . . . . . . . . . . . . . . . . . . . . . . . . . . . . . . . . . . . . . . . . . . . . . . .18
Completing Tasks ... . . . . . . . . . . . . . . . . . . . . . . . . . . . . . . . . . . . . . . . . . . . . . . . . . . . . . . . . . . . . . . . . . . . . . . . . . . . . . . . . . . . . . . . . . . . . . . . . . . . . . . . . . . . . . . .18
Viewing Task Status in Basic Mode ... . . . . . . . . . . . . . . . . . . . . . . . . . . . . . . . . . . . . . . . . . . . . . . . . . . . . . . . . . . . . . . . . . . . . . . . . . . . . . . . . . . . . . . . . . . .19
Viewing Task Status in Advanced Mode ... . . . . . . . . . . . . . . . . . . . . . . . . . . . . . . . . . . . . . . . . . . . . . . . . . . . . . . . . . . . . . . . . . . . . . . . . . . . . . . . . . . . . . .19
Viewing E-Mail Alerts .. . . . . . . . . . . . . . . . . . . . . . . . . . . . . . . . . . . . . . . . . . . . . . . . . . . . . . . . . . . . . . . . . . . . . . . . . . . . . . . . . . . . . . . . . . . . . . . . . . . . . . . . . . . . .20
Reporting on Task List Status .. . . . . . . . . . . . . . . . . . . . . . . . . . . . . . . . . . . . . . . . . . . . . . . . . . . . . . . . . . . . . . . . . . . . . . . . . . . . . . . . . . . . . . . . . . . . . . . . . . .20
Working with Task ListsAdministrators can set up task lists to help with budget cycles. For example, a task might helpyou complete data forms, launch business rules, or promote planning units. Tasks can displayinstructions, due dates, completed dates, and alerts.
Viewing Task Lists in Basic Mode
ä To view task lists in Basic mode:
1 If you are not already in Basic mode, select View, then Basic Mode.
2 Optional: If more than one task list is assigned to you, select the task list.
3 Click View Task List.
4 The task list displays the task list's name and status, instructions, if instructions are provided, and taskcompletion dates, if tasks are complete and you select Display All Completed Dates.
Working with Task Lists 15

Viewing Task Lists in Advanced Mode
ä To view task lists in Advanced mode:
1 Select View, then Task Lists, then Task List.
2 Select a task list folder.
To expand folders, click .
3 View task lists in the folder.
4 Click Close.
Viewing Selected Task Lists in Advanced ModeIn Advanced mode, you can view a selected task list to see task list status, due dates, completeddates, and any instructions included for the task list.
ä To view selected task lists in Advanced mode:
1 Select View, then Task Lists, then Task List.
2 In Available Task Lists, select a task list folder. Then select a task list.
3 In the Task Lists tab, view information about the selected task list.
Viewing TasksIf your administrator assigns tasks to you, you can view them in Basic mode or Advanced mode.Tasks can include URLs, data forms, workflow, business rules, and descriptions. You can view:
l Due date—When tasks must be completed
l Alerts—Visual cues about your progress, and the completion date and time:
m Green: On schedule
m Yellow: Approaching the due date
m Red: Overdue; the due date has passed and the task is incomplete
l Instructions—Assistance with completing tasks
l E-mail messages—Reminders of approaching and past-due tasks (see “Viewing E-MailAlerts” on page 20)
Viewing Tasks in Basic ModeIn Basic mode, a progress bar and navigation buttons help you view tasks.
16 Working with Task Lists

ä To view a task in Basic mode:
1 Select a task from the quick-launch list at the page's top.
2 Select View, then Task Lists, then Status. Click Next or Previous (or Next Incomplete or PreviousIncomplete).
3 To return to the Status page, select View, then Task Lists, then Status.
Viewing Tasks in Advanced ModeIn Advanced mode, you can use Planning features while viewing tasks.
ä To view task lists in Advanced mode:
1 Select View, then Task Lists, then Task List.
2 In Available Task Lists, make a selection.
3 Select a task to view status, due dates, completed dates, and instructions if provided.
Viewing Task Instructions in Basic ModeIf task instructions are included, you can view them in Basic mode.
ä To view task instructions in Basic mode:
1 Open a task list containing tasks with instructions.
See “Viewing Task Lists in Basic Mode” on page 15.
2 Click View for a task.
3 View instructions, and click Close.
Viewing Task Instructions in Advanced ModeIf task instructions are included, you can view them in Advanced mode.
ä To view task instructions in Advanced mode:
1 Open a task containing instructions.
See “Viewing Task Lists in Advanced Mode” on page 16.
2 Click the View Instructions link.
3 View instructions, and click Close.
Viewing Task List Instructions in Basic ModeIf task list instructions are included, you can view them in Basic mode.
Viewing Task Instructions in Basic Mode 17

ä To view task list instructions in Basic mode:
1 Open a task list containing instructions.
See “Viewing Task Lists in Basic Mode” on page 15.
2 Click the View Instructions link.
3 View task list instructions, and click Close.
Viewing Task List Instructions in Advanced ModeIf task list instructions are included, you can view them in Advanced mode.
ä To view task list instructions in Advanced mode:
1 Open a task list containing instructions.
See “Viewing Task Lists in Advanced Mode” on page 16.
2 In the Available Task Lists tab, click the View link. (Or, in the Task List tab, click the click the ViewInstructions link.)
3 View instructions, and click Close.
Completing TasksThe way you complete tasks depends on the task type. Tasks can include URLs, data forms,workflow, business rules, or descriptive tasks. For example, a task can require your entering dataor launching a business rule. Tasks can also display read-only information, such as remindersor instructions.
After completing task requirements, mark the task as complete. The alert changes to a date stampshowing the completion date and time. If a task has dependent tasks, you must complete thosetasks before completing the primary task.
ä To complete tasks:
1 From the quick-launch list at the page's top, select a task list.
2 To view a task, click View Task List.
The task displays a Web page, data form, workflow, business rule, or description.
3 View instructions for the task by clicking View.
4 Complete the task activity.
For example, depending on the task, you can view a Web page, enter data, complete a workflowtask, launch a business rule, or read a description. See “Entering Data” on page 29, “ManagingPlanning Units” on page 69, and “About Launching Business Rules” on page 43.
5 Complete associated dependent tasks.
Click to view subordinate tasks, also called child tasks.
18 Working with Task Lists

6 After completing the activities for the task, select Complete.
If the check box is not selectable, you must complete dependent tasks before completing thistask.
After you select Complete, the task is marked as complete and is displayed next to the taskin the view pane.
After tasks are complete, alerts change to date stamps.
Viewing Task Status in Basic ModeIn Basic mode, use the Status page to view tasks that are complete, overdue, and approachingdue dates.
ä To view task status in Basic mode:
1 Take an action:
l Select a task list in the quick-launch list.
l Select View, then Task Lists, then Status.
The Status page shows the percentage and number of tasks completed, overdue tasks, tasksapproaching their due date, and the earliest due date. If you select Complete, the task is
marked as completed and is displayed by the task in the view pane. If a task has dependent
tasks, these tasks must be completed before is displayed for primary tasks.
2 When you finish viewing the status, perform an action:
l View Task List.
l Next Incomplete or Previous Incomplete.
Viewing Task Status in Advanced ModeIn Advanced mode, use the Task List dialog box to view tasks that are complete, incomplete,overdue, or due soon.
ä To view task status in Advanced mode:
1 Select View, then Task Lists, then Task List.
Task lists assigned to you display in the Task List Folders area.
2 In Available Task Lists, select a task list in the Task Lists folder.
To display task lists in folders, click .
3 In the Task Lists folder, click the task list name.
4 In the Task List column, click the task list name.
5 Select Status.
Viewing Task Status in Basic Mode 19

Status includes tasks that are complete, incomplete, overdue, or due soon.
6 Click Close.
Viewing E-Mail AlertsIf your administrator sets e-mail alerts, you can receive e-mail reminders about tasks that areapproaching or are past their due date. The timing and frequency of alerts depends on how youradministrator sets up this feature.
ä To view an e-mail alert, open and read the received e-mail message.
Reporting on Task List Status To review the status of the planning process, use the Task List Report page to view task list reportsas PDF files or Excel worksheets.
The status report displays the task lists, task list owners, due dates, completion dates, and statusof the task. You must be in Basic mode to view task list reports.
ä To view status reports:
1 Select View, then Task Lists, then Report.
Task lists assigned to you display.
2 From Available Task Lists, select task lists:
l To select, click .
l To select all, click .
l To remove, click .
l To remove all, click .
3 Click Next.
4 From the users having access to the task lists, select those whose status to view.
5 Click Next.
6 Set task list options described in the following table:
ReportOption
Description
GroupResults By
l Task List—to report by task list
l Users—to report by users
DisplayOptions of
Select your preferences:
20 Working with Task Lists

ReportOption
Description
Task ListColumns inReport
l Overall Completion %
l # of Incomplete Tasks
l # of Tasks Due Soon
l Completed Date
l # of Tasks Overdue
l Next Due Date
l Show Detailed Task Columns in Report (selecting this also selects the next five options, but youcan individually clear them)
l Due Date
l Alert Date
l Instructions
l Completed Date
l Dependency
Report Typel PDF Format
l Export To Excel
7 Click Create Report.
8 If you selected:
l PDF Format—Page through the report and use the Acrobat toolbar for viewing and savingoptions.
l Export To Excel—Name and save the report to your computer. Open the .xls file to viewthe report.
Reporting on Task List Status 21

22 Working with Task Lists

3Working with Data Forms
In This Chapter
Selecting and Opening Data Forms ... . . . . . . . . . . . . . . . . . . . . . . . . . . . . . . . . . . . . . . . . . . . . . . . . . . . . . . . . . . . . . . . . . . . . . . . . . . . . . . . . . . . . . . . . . . .23
Expanding Data Forms and the Data Entry Area .. . . . . . . . . . . . . . . . . . . . . . . . . . . . . . . . . . . . . . . . . . . . . . . . . . . . . . . . . . . . . . . . . . . . . . . . . . . . . .24
Adding Rows... . . . . . . . . . . . . . . . . . . . . . . . . . . . . . . . . . . . . . . . . . . . . . . . . . . . . . . . . . . . . . . . . . . . . . . . . . . . . . . . . . . . . . . . . . . . . . . . . . . . . . . . . . . . . . . . . . . . . .25
Setting Column Width ... . . . . . . . . . . . . . . . . . . . . . . . . . . . . . . . . . . . . . . . . . . . . . . . . . . . . . . . . . . . . . . . . . . . . . . . . . . . . . . . . . . . . . . . . . . . . . . . . . . . . . . . . . .25
Hiding Rows or Columns Having No Data or Zeros ... . . . . . . . . . . . . . . . . . . . . . . . . . . . . . . . . . . . . . . . . . . . . . . . . . . . . . . . . . . . . . . . . . . . . . . . . . .26
Searching in Data Forms ... . . . . . . . . . . . . . . . . . . . . . . . . . . . . . . . . . . . . . . . . . . . . . . . . . . . . . . . . . . . . . . . . . . . . . . . . . . . . . . . . . . . . . . . . . . . . . . . . . . . . . . .26
Viewing Instructions for Data Forms... . . . . . . . . . . . . . . . . . . . . . . . . . . . . . . . . . . . . . . . . . . . . . . . . . . . . . . . . . . . . . . . . . . . . . . . . . . . . . . . . . . . . . . . . . . .27
Copying Versions... . . . . . . . . . . . . . . . . . . . . . . . . . . . . . . . . . . . . . . . . . . . . . . . . . . . . . . . . . . . . . . . . . . . . . . . . . . . . . . . . . . . . . . . . . . . . . . . . . . . . . . . . . . . . . . . .27
Launching Smart View from Planning ... . . . . . . . . . . . . . . . . . . . . . . . . . . . . . . . . . . . . . . . . . . . . . . . . . . . . . . . . . . . . . . . . . . . . . . . . . . . . . . . . . . . . . . . . .28
Selecting and Opening Data FormsUse data forms to enter, update, analyze, print, and report on data. If you close a data formwithout saving changes, a message displays. To proceed, respond to the message and save orrefresh the data.
Note: If the members in the data form you open have no data, this message (or one that youradministrator has created) displays: There are no valid rows for this dataform.
Opening Data Forms in Advanced Mode In Advanced mode, you can select data forms on the page's left side.
ä To open data forms in Advanced mode:
1 If you are working in Basic mode, select View, then Advanced Mode.
2 In the view pane's Folders area, display folders by clicking next to Forms.
The folders available to you display in the view pane. If a folder contains additional folders, displays to the left of the folder name.
3 Under Forms, click a folder name to display the data form to open in the Data Forms in Folders list.
4 Click the data form.
Selecting and Opening Data Forms 23

The data form is displayed in the content area.
Opening Data Forms in Basic ModeIn Basic mode, you work primarily with task lists that your administrator sets up. You can opendata forms in this mode only if your administrator sets up a task with a data form.
ä To open data forms in Basic mode:
1 Open a task list in Basic mode.
See “Viewing Tasks” on page 16.
2 In the Task List area, click a task that uses a data form.
The data form opens in the content area.
Searching for Data FormsIf you know the data form's name, you can search for it in the view pane.
ä To search for data forms:
1 In a data form, click in the view pane.
See “Selecting and Opening Data Forms” on page 23.
2 In the lower-right corner, enter search criteria in the text box.
3 Click or to search up or down.
Data forms that match your search criteria display in the content area.
Expanding Data Forms and the Data Entry Area You can expand data forms and the data entry area—including the view pane—in several ways.
ä To expand data forms and the data entry area:
1 Open a data form.
2 Take an action:
l Expand: Double-click the thick black line between the row heading and the data cells. Therow heading expands to accommodate the row heading.
l Resize: Click the view pane's right border, and drag to resize it.
l Expand or collapse the view pane: Select View, then the View Pane, click the Toggle ViewPane button in the toolbar, or drag the view pane to resize it.
l Hide or show the view pane: Click in the screen's upper-right corner.
24 Working with Data Forms

l View the data form: Use the scroll bars.
Adding RowsYou can add rows to data forms if you have write access, and the administrator sets up the dataform appropriately. For example, you can budget for items by adding rows for members thatwere previously omitted on the data form.
ä To add rows:
1 In a data form, select Edit, then Add Row.
2 In the dialog box that displays, enter the row's member name.
3 Click Save.
This submits the change and refreshes the data form’s definition. Members that you can accessare displayed.
Ask your Planning administrator to delete rows that you no longer need.
Setting Column WidthAdministrators can set column width using settings on the Row/Column Layout tab for dataform properties. Column width settings apply to each data form page:
l Small: Displays columns 50 pixels wide, enough for approximately seven decimal places.
l Medium: Displays columns 75 pixels wide, enough for approximately ten decimal places.
l Large: Displays columns 100 pixels wide, enough for approximately thirteen decimal places.
l Size-to-Fit: Automatically sizes the column width to fit the widest content in a heading ordata cell.
l Custom: You can enter a pixel width value of up to 999.
If a column width is selected that is less than the width of the column contents, the excess datais hidden until the column is widened. While the data is hidden, it is stored and calculated inthe same way as displayed data.
You can adjust column width while viewing a data form, regardless of the column width settingin the data form properties. To save the adjusted column width for the remainder of your session,save or refresh the data form.
When you print from the data entry page, the columns print at the width defined in preferences.See “Setting Preferences for Printing Options” on page 82.
In data forms, you can perform the tasks in the following table:
Task Action
Resize column width Drag the column heading to the desired width.
Adding Rows 25

Task Action
Minimize column width Right-click a column heading and select Minimize, or double-click a columnheading.
Restore a minimized column Right-click a minimized column heading and select Restore, or double-clicka column heading.
Restore all minimized columns Right-click a column heading and select Restore All.
Reset column width to the defaultsetting
Right-click a column heading and select Reset All to Default.
Hiding Rows or Columns Having No Data or Zeros
ä To hide rows having no data or containing zeros:
1 Put the cursor on a row member name and right-click.
2 Select:
l Hide rows with no data: to toggle between hiding and showing rows having no data(displayed as #MISSING or blank, depending on how your administrator set this data formproperty). This option does not display if your administrator has set the data form's propertyto Suppress Missing Data.
l Hide rows with zeros and no data: to toggle between hiding and showing rows having eitherno data or zeros, or both.
3 To switch between showing and hiding rows, select the option again.
ä To hide columns having no data or containing zeros:
1 Put the cursor on a column member name and right-click.
2 Select:
l Hide columns with no data: to toggle between hiding and showing columns having no data(displayed as #MISSING or blank, depending on how your administrator set this data formproperty). This option does not display if your administrator has set the data form's propertyto Suppress Missing Data.
l Hide columns with zeros and no data: to toggle between hiding and showing columns havingeither no data or zeros, or both.
3 To switch between showing and hiding columns, select the option again.
Searching in Data FormsTo navigate to a data cell or member name on a data form, use the browser’s Find feature. Finddoes not search minimized columns. For example, if Qtr 1 is minimized, it does not find Feb.
26 Working with Data Forms

Find highlights values that exactly match, but does not select the cell where the value is found.If you have difficulty with Find, try clicking off the data form before searching.
ä To find and select a data value or member in data forms:
1 Open a data form.
2 From the browser, select Edit, then Find (on This Page), or press Ctrl+F.
3 In Find What, enter the value or part of the value to find.
Use the browser’s Find feature to set the direction of the search, whole word match, orcapitalization match.
Viewing Instructions for Data FormsThe administrator can include instructions to guide you in preparing budget data. If instructionsare available, a View link displays in the data form's Instructions column.
ä To view the instructions for data forms:
1 Open a data form.
2 In the Instructions column, click View.
View links are available only if instructions exist.
3 Click Close.
Copying VersionsUse the Copy Version page to copy data from one bottom-up or target version of a selectedscenario to another bottom-up or target version within the same scenario. For example, you cancreate a Best Case version, and copy some or all the data in that version to a Worst Case versionto quickly create a starting point for the new version.
You can copy between bottom-up and target versions. Consider:
l When you copy to a bottom-up version, only the selected level 0 members are copied.
l When you copy to a target version, all selected members are copied.
l To protect data in approved planning units, copying a version does not copy to approvedplanning units.
Note: To successfully copy data, when specifying the copy data criteria, you must select atleast one member for the Scenario, Account, Entity, Period, and Version dimensions.
ä To copy a version:
1 In a data form, select File, then Workflow, then Copy Version.
Viewing Instructions for Data Forms 27

2 In the Scenario list, select the scenario to copy.
3 In the Copy From list, select the version from which to copy data.
4 In the Copy To list, select the version to which to copy data.
5 Click Go.
The entities for the selected version display in Available Entities.
6 In Available Entities, select the entities to which to copy data.
Available Entities displays the entities (planning units) to which you have write access and thatbelong to you. You can copy entities with a Process Status of Not Started or First Pass.
7 Click to add the entity to Selected Entities, or click to add all entities in Available Entities. Click
or to move entities from Selected Entities.
8 Optional: To copy comments or annotations that are associated with accounts, select Copy AccountAnnotations.
Only annotations for selected entities are copied. If you are copying to a bottom-up version,only level 0 entities (and their annotations) are copied.
9 Optional: To copy associated cell text, select Copy Cell Text.
10 Optional: To copy associated supporting detail, select Copy Supporting Details.
11 Click Copy Data.
Note: Wait for the Copy Version completion message before loading another Web page.
Launching Smart View from Planning
ä To launch Smart View from a data form in Planning, select File, then Open in Smart View.
Excel is launched, you are automatically logged into Smart View in Excel, and the data formdisplays in the Data Source Manager. Right-click on the data form in the Data Source Manager.You can then open it as an ad hoc grid or perform any other Smart View operations on that dataform. See the Oracle Hyperion Smart View for Office User's Guide.
28 Working with Data Forms

4Entering Data
In This Chapter
About Entering Data ... . . . . . . . . . . . . . . . . . . . . . . . . . . . . . . . . . . . . . . . . . . . . . . . . . . . . . . . . . . . . . . . . . . . . . . . . . . . . . . . . . . . . . . . . . . . . . . . . . . . . . . . . . . . .29
Navigating in Data Forms ... . . . . . . . . . . . . . . . . . . . . . . . . . . . . . . . . . . . . . . . . . . . . . . . . . . . . . . . . . . . . . . . . . . . . . . . . . . . . . . . . . . . . . . . . . . . . . . . . . . . . . .33
Selecting Data... . . . . . . . . . . . . . . . . . . . . . . . . . . . . . . . . . . . . . . . . . . . . . . . . . . . . . . . . . . . . . . . . . . . . . . . . . . . . . . . . . . . . . . . . . . . . . . . . . . . . . . . . . . . . . . . . . . .33
Searching for Members... . . . . . . . . . . . . . . . . . . . . . . . . . . . . . . . . . . . . . . . . . . . . . . . . . . . . . . . . . . . . . . . . . . . . . . . . . . . . . . . . . . . . . . . . . . . . . . . . . . . . . . . . .34
Viewing Member Formulas .. . . . . . . . . . . . . . . . . . . . . . . . . . . . . . . . . . . . . . . . . . . . . . . . . . . . . . . . . . . . . . . . . . . . . . . . . . . . . . . . . . . . . . . . . . . . . . . . . . . . . .34
Selecting Cell Ranges ... . . . . . . . . . . . . . . . . . . . . . . . . . . . . . . . . . . . . . . . . . . . . . . . . . . . . . . . . . . . . . . . . . . . . . . . . . . . . . . . . . . . . . . . . . . . . . . . . . . . . . . . . . .34
Copying and Pasting Cells .. . . . . . . . . . . . . . . . . . . . . . . . . . . . . . . . . . . . . . . . . . . . . . . . . . . . . . . . . . . . . . . . . . . . . . . . . . . . . . . . . . . . . . . . . . . . . . . . . . . . . . .35
Adding, Viewing, and Editing Cell Text . . . . . . . . . . . . . . . . . . . . . . . . . . . . . . . . . . . . . . . . . . . . . . . . . . . . . . . . . . . . . . . . . . . . . . . . . . . . . . . . . . . . . . . . . . .36
Printing Cell Text. . . . . . . . . . . . . . . . . . . . . . . . . . . . . . . . . . . . . . . . . . . . . . . . . . . . . . . . . . . . . . . . . . . . . . . . . . . . . . . . . . . . . . . . . . . . . . . . . . . . . . . . . . . . . . . . . . . .36
Using Account Annotations and URL Links ... . . . . . . . . . . . . . . . . . . . . . . . . . . . . . . . . . . . . . . . . . . . . . . . . . . . . . . . . . . . . . . . . . . . . . . . . . . . . . . . . . . .37
Adding, Replacing, and Viewing Cell-Level Documents .. . . . . . . . . . . . . . . . . . . . . . . . . . . . . . . . . . . . . . . . . . . . . . . . . . . . . . . . . . . . . . . . . . . . . .37
Writing #MISSING Values ... . . . . . . . . . . . . . . . . . . . . . . . . . . . . . . . . . . . . . . . . . . . . . . . . . . . . . . . . . . . . . . . . . . . . . . . . . . . . . . . . . . . . . . . . . . . . . . . . . . . . . .38
Subtotaling Values ... . . . . . . . . . . . . . . . . . . . . . . . . . . . . . . . . . . . . . . . . . . . . . . . . . . . . . . . . . . . . . . . . . . . . . . . . . . . . . . . . . . . . . . . . . . . . . . . . . . . . . . . . . . . . . .38
Getting the Latest Data... . . . . . . . . . . . . . . . . . . . . . . . . . . . . . . . . . . . . . . . . . . . . . . . . . . . . . . . . . . . . . . . . . . . . . . . . . . . . . . . . . . . . . . . . . . . . . . . . . . . . . . . . .39
Exporting Data to Microsoft Excel .. . . . . . . . . . . . . . . . . . . . . . . . . . . . . . . . . . . . . . . . . . . . . . . . . . . . . . . . . . . . . . . . . . . . . . . . . . . . . . . . . . . . . . . . . . . . . . .39
Drilling Through to Source Data ... . . . . . . . . . . . . . . . . . . . . . . . . . . . . . . . . . . . . . . . . . . . . . . . . . . . . . . . . . . . . . . . . . . . . . . . . . . . . . . . . . . . . . . . . . . . . . . .40
Saving Data ... . . . . . . . . . . . . . . . . . . . . . . . . . . . . . . . . . . . . . . . . . . . . . . . . . . . . . . . . . . . . . . . . . . . . . . . . . . . . . . . . . . . . . . . . . . . . . . . . . . . . . . . . . . . . . . . . . . . . .40
Printing Data... . . . . . . . . . . . . . . . . . . . . . . . . . . . . . . . . . . . . . . . . . . . . . . . . . . . . . . . . . . . . . . . . . . . . . . . . . . . . . . . . . . . . . . . . . . . . . . . . . . . . . . . . . . . . . . . . . . . . .41
About Entering DataEnter data in Advanced mode by selecting data forms in the view pane. You can enter data inBasic mode if your administrator sets up tasks that include data forms.
Your administrator sets up data forms to show certain dimensions and members, reflected bythe row and column headings. Cells display the data for the selected members. Backgroundcolors indicate:
l White: default
l Yellow: ”dirty” cells, whose values changed but are not yet saved
l Light blue: read-only cells
l Tan: locked cells (see “Locking Cells” on page 56)
l Teal: cells having supporting detail
About Entering Data 29

Data forms can include:
l Point of View (POV): Shows information about other members that are valid for the definedrow and column members. POVs identify the database members that populate a data form,and define data intersections. Members on the rows, columns, and POV axes are constant(except when they have dynamic user variables).
l Page lists: Display different views (pages) of selected member combinations that can spandimensions, enabling you to work with various member combinations.
l Segments: Can include read-only or hidden areas and borders on rows and columns. Thehierarchy can be suppressed for rows or columns, so that rows are not indented and columnsexclude line breaks.
l Smart Lists: Lists from which you can select text options, such as locations or descriptions.See “Entering Data with Smart Lists” on page 30.
l Menus: Shortcut menus accessed by right-clicking that can open URLs, data forms,workflow, or business rules. See “Entering Data with Menus” on page 31.
l User variables: Selectable members on the row, column, page, or POV. Before you can opena data form having a user variable, you must select a value in preferences. After that, youcan change the variable on the data form or in preferences. See “Dynamically Setting UserVariables” on page 32.
l Composite data forms: Display members from several data forms simultaneously so youcan, for example, enter data into one grid and see the results—such as Total Revenue—aggregated in another.
After you enter data, annotate your assumptions, and are satisfied with your plan’s data, youcan promote your numbers (as a planning unit) to another user, typically for review or approval.To do this, go to the Manage Process page, and start or promote the planning unit. After youpromote a planning unit, its new owner can write to it (assuming the owner has write access),but you can no longer write to the planning unit. See “Managing Planning Units” on page69.
Entering Data with Smart ListsYour administrator can set up data forms with Smart Lists that help you enter data in cells. If a
cell contains a dimension that is linked to a Smart List, is displayed when you click in the cell.
ä To enter data with Smart Lists:
1 Open a data form containing Smart Lists.
2 Click in a cell.
The displayed list of text values depends on how your administrator sets up the list. For example,the list could include expense justifications.
3 Select a value from the list.
30 Entering Data

Note: You can skip to a value by typing its first one or two letters. For example, in a list of months,skip to June by typing ju.
After you select a value, the information in the cell is updated. Your administrator determineswhat is displayed when the cell contains no data: no value, #MISSING, None, or another value.
Entering Data with MenusYour administrator can set up data forms that include menus. With menus, you right-click amember and select a menu item to open a URL, data form, workflow, or business rule. Forexample, a menu item can open another data form to get more information about the data, goto another scenario and version in the planning unit, or launch a calculation.
ä To enter data with menus:
1 Open a data form containing a menu.
2 Right-click a row or column member, and select a menu option from the list.
The values in the list depend on how your administrator sets up this feature. If the menu includessubmenus, you can select a value from the submenu.
Depending on the action that was performed by the menu item, you can continue your workon the Web page, data form, or workflow.
If a business rule was launched that includes a runtime prompt, enter the required information.See “Entering Runtime Prompts” on page 45.
Entering Percentage ValuesIf your administrator sets up members as percentages, those members display with a percentsign (%) in the cell. You can enter a percentage value as a decimal, such as .6, or as a percentage,such as 60%.
The following table shows examples of entered values and their displayed result.
Entry Result
.25 25% is displayed. Planning multiplies .25 by 100, adds a percent sign, and saves .25.
25% 25% is displayed. Planning divides the number by 100 and saves .25.
25 2500% is displayed. Planning multiples 25 by 100, adds a percent sign, and saves 25.
.25% .25% is displayed. Planning divides the number by 100 and saves .0025.
About Entering Data 31

Entering Date ValuesYour administrator may set up certain cells to contain date values. When you click into such acell, a month calendar displays, from which you select a date. The date value then displays in theformat set in preferences. For example, if the date format is MM/DD/YYYY and you selectFebruary 7 (in the year 2008), the date is processed as 02/07/2008. See “Setting the Date Format”on page 82.
Entering Text ValuesYou can enter text directly into cells whose data type is set to text by your administrator. Youcan view the text in the data form rather than from a pop-up. For example, you could enter aproject code name. Text values entered in this way are data values.
Dynamically Setting User VariablesIf the administrator defined a data form with at least one user variable and enabled dynamicuser variables, you can dynamically select and change user variable values directly in the dataform. For example, for a variable called Department, you can select Sales members to plan salesexpenses and then select Marketing members to plan marketing expenses. You can also set valuesfor user variables in user preferences (see “Setting Preferences for User Variables” on page83).
Note: You must select a value for user variables before working in the data form.
ä To dynamically change values for user variables in data forms:
1 Open a data form containing a user variable and for which dynamic user variables are enabled.
2 Click the text that displays the user variable.
The variable and its currently-selected value display under the POV.
3 Select members:
l To select, click .
l To remove, click .
l To remove all, click .
l To move a member in the list, click or .
4 Click Submit.
The data form displays the selected members.
32 Entering Data

Navigating in Data FormsHow you navigate depends on whether you have just clicked in a cell or are editing cell data. Forexample, when you click in a cell, you can press the Right Arrow to move to the next cell in therow. When you are editing data in a cell, you must press Tab to move to the next cell.
When clicking in a cell and not entering or editing cell data, to move:
l Forward, backward, up, or down, press the Right Arrow, Left Arrow, Up Arrow, or DownArrow key.
l To the next cell in the column, press Enter.
l To the previous cell in the column, press Shift + Enter.
When entering or editing data in cells, to move:
l Forward or backward within the cell data, press the Left Arrow key or the Right Arrow key.
l To the next cell in the row, press Tab or click in the next cell.
l To the previous cell in the row, press Shift + Tab.
l To the next cell in the column, press Enter.
l To the previous cell in the column, press Shift + Enter.
Selecting DataIf the budget administrator sets up multiple page axes, you can select from among pages tochange the data with which you work. The data form's designer can create up to 18 page drop-down lists.
Use the page axis to work with different views (pages) of selected member combinations thatcan span dimensions. The members defined on the rows, columns, and POV axes are constant(except when they have dynamic user variables). You see only the members to which you areassigned access.
With some data forms, you can also select a user variable to determine which data is displayed.See “Dynamically Setting User Variables” on page 32.
ä To work with another page axis:
1 Open a data form containing multiple page axes.
2 From the Page drop-down list, select a page.
indicates that the search facility is available. See “Enabling Search with a Large Number ofPages” on page 80.
3 Click Go.
Tip: From the Preferences page, select the Display Options tab to select Remember Selected PageMembers. When you select this, Planning remembers the last page or POV memberselection, so the information is available when you return to the current data form.
Navigating in Data Forms 33

Searching for Members
ä To search for a member in the dimension hierarchy:
1 Open a data form, and click at the top of the data form.
2 In Search, enter part or all of the member name.
You can search by member name or alias. If the selected member in the drop-down list is thefirst member of the hierarchy and you search up, the search starts from the last member of thehierarchy. Similarly, if the selected member is the last member in the hierarchy, the search startswith the first member.
3 Click or to search up or down the hierarchy.
4 When the member name displays in the drop-down list, click Go.
Viewing Member Formulas If a member has a formula, and if the administrator selected Display Member Formula (for rows,columns, page, or POV) for the data form, you can view the formula.
ä To view a member's formula:
1 In the data form, click the formula icon to the right of the member name.
2 View the read-only member formula and click Close.
You are returned to the data form.
Selecting Cell RangesYou can select and work with multiple cells if the selection is rectangular and contiguous.
ä To select a cell range, a row, or a column:
1 Open a data form.
2 Take an action:
l To select a cell range, click in the range's upper-left cell, press Shift, and click in the range'slower-right cell.
l To select a row or column, click in its heading.
After you select a group of cells, you can copy and paste them or adjust the data values. See:
l “Copying and Pasting Cells” on page 35
l “Adjusting Cell Values” on page 49
34 Entering Data

Copying and Pasting CellsYou can copy data values within a data form, from one data form to another, or from anotherapplication, such as Microsoft Excel. In one copy and paste operation, you can copy from onecell to another cell, from one cell to many cells, or from many cells to many cells.
Note: Because Planning applies spreading logic to pasted values, understand how data valuesare spread before you paste values into time periods. See “How Spreading Data Works”on page 51.
ä To copy and paste data:
1 Select the cells that contain the data to copy.
See “Selecting Cell Ranges” on page 34.
2 Select Edit, then Copy.
3 Select the cells to which to paste the data.
4 Select Edit, then Paste.
Paste inserts the Clipboard contents at the insertion point, replacing any selection.
About copying and pasting data:
l If the destination selected area is an exact multiple of the size and shape of the copied selectedarea, the data is repeatedly pasted into the destination area. For example, if you copy thecontents of two rows, and select six rows to paste the data into, Planning copies the contentsof the two rows three times, to fill the six destination rows.
l Planning does not paste data into read-only cells.
l When you copy within or among data forms, Planning copies and pastes the cells' storedvalues, not the values that are displayed based on the precision setting.
l Data that is copied and pasted from Microsoft Excel to Planning reflects the formatting thatis set up in Microsoft Excel. For example, if the number of decimal places in Microsoft Excelis set to zero, when you enter the value 459.123 in Microsoft Excel, the value is displayed as459. If you copy this value into a Planning form, the value 459 is pasted.
l When pasting data to time periods, Planning applies the spreading rules for each cell insuccession, starting from left to right and top to bottom. The resulting data from a pasteoperation may not match the original copied data. For information on how pasting datamay affect cells' values, see “How Spreading Data Works” on page 51.
l When you copy data, a message might display if you disabled Internet Explorer’s setting forAllow Paste Operations via Script.
l Copying and pasting data from a text editor (for example, TextPad, Notepad, or WordPad)fails if the data is space delimited. Use Tab-delimited values instead.
Copying and Pasting Cells 35

Adding, Viewing, and Editing Cell TextIf you have read access to a cell, you can add annotations called cell text to the cell at any level.You can add cell text at the summary time period level and across multiple dimensions at anylevel. You can also add cell text for non-level 0 members (bottom-up versions), calculated cells(dynamic calc), and read-only cells. For example, you can add explanations for data analysis ofvariances and rolling forecasts.
You can also:
l Use supporting detail to build and communicate bottom-up values such as travel, where youcalculate aggregate values. See “Working with Supporting Detail” on page 61.
l Add account annotations to comment on account data. You can annotate differentcombinations of scenarios, versions, and entities. See “Using Account Annotations and URLLinks” on page 37.
l Enter text directly into cells whose data type is set to text (see “Entering Text Values” onpage 32).
Tip: You can also view cell text in a PDF file or a printed report. See “Printing Cell Text” on page36.
ä To add, view, or edit cell text:
1 Open the data form to which you want to add, view, or edit cell text.
2 Click in a cell or select a range of contiguous cells.
A triangle in the cell's upper-right corner indicates that it contains cell text (or drill-throughdata or cell-level documents).
3 Select Edit, then Cell Text.
4 In Cell Text, add, view or edit cell text.
You can enter up to 1,500 characters. If you selected a cell range, you can enter cell text for eachcell.
5 Click Submit.
Applicable messages display in the content area at the top of the data form.
Printing Cell TextYou can print cell text—notes that are associated with individual or groups of cells—to a PDFfile. When you print data forms with the Show Cell Text option selected in the Printing Optionspage, cell text is displayed to the dimension's right, on the same row as the dimension. See“Printing Data” on page 41.
ä To print cell text:
1 Open a data form containing cell text.
36 Entering Data

2 Select File, then Print.
Planning displays the printing options that are used to generate the PDF file.
3 Select the Show cell text option, and click Print Preview.
4 In the PDF file, select File, then Print.
5 In Print, select a printer and click OK.
Using Account Annotations and URL LinksIf your administrator has enabled this feature, you can add annotations—or comments—toaccounts. Annotations can be plain text, or can include URL links to, for example, a project Website, a spreadsheet, or PDF file on a server.
ä To add account annotations:
1 In a data form, select View, then Edit Account Annotations.
2 In account rows, in the column to the right of account member names, enter a comment or URL of up to1,500 characters.
You can include URL links to these file types on a server or FTP site: .TXT, .DOC, .XLS (MicrosoftOffice Suite), and .PDF. For example, to create a link to a spreadsheet on a shared server, youmight enter: file://C:/BudgetDocs/Timeline.xls where C represents the server drive.
3 When you are finished, click View Account Annotations.
To view account comments or to access associated URLs on the page, read the comments orclick the URL to the right of the account member's name. If you click a URL, your Web browserdisplays the source information in a new window.
Adding, Replacing, and Viewing Cell-Level Documents If your administrator selects the Enable Cell-Level Document property for the data form, fromdata form cells, you can add, replace, and view EPM Workspace documents. These documentscan be a Web site or any file type (for example, an .XLS or .PDF file). For example, you couldassociate a cell with a document that explains your assumptions behind the cell's sales data. The icon in a cell indicates that it is associated with a document.
Note: Before you add a cell-level document, the document must be added to the Workspacerepository. See Oracle Enterprise Performance Management Workspace User's OnlineHelp.
ä To add or replace a cell-level document:
1 Click once in the cell. Click one more time.
2 Select Edit, then Add/Edit Document.
Using Account Annotations and URL Links 37

3 Either:
l In the text box, enter the URL to the document (for example, http://mymachine:19000/workspace/browse/get/Sales.doc) and click Submit.
l From EPM Workspace, click to browse to the file's location.
The Select dialog box in EPM Workspace prompts you for the Name, Type, and Version ofthe EPM Workspace document. See Oracle Enterprise Performance Management WorkspaceUser's Help for specifics.
ä To view a document associated with a cell:
1 Click once in the cell. Click one more time.
2 Select Edit, then Open Document.
The Web site or file is launched.
Writing #MISSING Values#MISSING in a cell indicates the cell contains no data, whereas zero in a cell is a data value.#MISSING decreases the database size and improves performance.
You can replace #MISSING by selecting the cell and typing a value. You can also replace irrelevantdata in a cell and save the cell as #MISSING, which writes #MISSING to the database.
ä To write #MISSING to cells:
1 Select the cells to change.
You can select a range of contiguous cells by clicking in the upper-left cell in the range, andpressing Shift + click to select the lower-right cell in the range. You can select rows and columnsby clicking row and column headings. Select a range of rows or columns by using Shift + click.
If the designer sets a data form to suppress missing data, and an entire row contains #MISSING(no data), that row does not display on the data form.
2 Take an action:
l Press Delete.
l Enter #missing.
You can also enter #MISSING using Smart Lists. See “Entering Data with Smart Lists” on page30.
3 Click Save.
The cells are set to #MISSING when you save the data form.
Subtotaling ValuesHow values are subtotaled and totalled in data forms:
38 Entering Data

l Member subtotals are calculated based on factors set by your administrator, such as thehierarchies and logic of the outline, and member properties.
l To recalculate subtotals on the page, click Save. If the Calculate Data Form calc script isselected to launch during Save, all subtotals in the data form are recalculated based on theirmembers’ aggregation properties and the data form’s design and layout.
l Saving data automatically calculates members that are set to dynamically calculate, excludinglevel 0 members. The data form does not require a calc script to calculate these members.
l Calculations are based on the stored (not the displayed) values. Displayed values might bebased on scaling or precision settings.
l Only displayed members are calculated. If you have read but not write access to somemembers, subtotals correctly include their values even if they are read-only.
See also “Adjusting Cell Values” on page 49 and “How Spreading Data Works” on page51.
Getting the Latest DataTo ensure that you are working with the latest data, especially if other people are working onthe same budget, refresh data.
ä To retrieve the latest values from the database:
1 Open a data form.
2 To save your current work, click Save before refreshing the data.
3 Select View, then Refresh.
Exporting Data to Microsoft ExcelExporting data from the data form to Microsoft Excel lets you explore “what-if” scenarios inExcel before copying and pasting values back to Planning. It also provides an alternative to PDFprinting.
About exporting data:
l Planning does not export to Excel: numerical formatting, the application name, user, formfolder, attributes, currency tags, or percentages.
l Member names are indented based on their level in the hierarchy. They are also indented ifyou print the data form to a PDF file.
l Supporting detail is printed.
l Account annotations are printed if your administrator selected the Enable AccountAnnotations setting on the data form's Display Options tab.
l Aliases are displayed on the rows, columns, page, and POV if they are present for a member,if your administrator selected the Display Alias option.
Getting the Latest Data 39

l Values pasted back to Planning from Excel must be non-formatted data.
ä To export data from data forms to Microsoft Excel:
1 Open a data form.
2 Select File, then Spreadsheet Export.
3 Depending on how you want to export the data, take an action:
l Select Save, and save the file.
l Select Open, and work with the data in the browser instance of Microsoft Excel that displays.Use standard Excel procedures to make and save your changes.
Drilling Through to Source DataData is loaded from a source using Oracle Hyperion Financial Data Quality Management, FusionEdition or Oracle Hyperion Financial Data Quality Management ERP Integration Adapter forOracle Applications. You can drill through to view details of the data source.
When working with data forms that contain drill-through information, keep in mind that formulticurrency applications, all currencies or an entity in the source system can be loaded.Exchange rate conversions are done within Planning.
ä To drill through to source data:
1 Open a data form containing source data loaded using FDM or ERP Integrator.
A triangle in the cell's upper-right corner indicates that it contains drillable data (or cell text orcell-level documents).
2 Click once in a cell that contains drill-through data. Click one more time.
A drill-through icon is displayed above and to the right of the cell.
3 Click the icon.
The source information displays on a tab in EPM Workspace for Oracle Hyperion FinancialData Quality Management ERP Integration Adapter for Oracle Applications, or in a new browserwindow for Oracle Hyperion Financial Data Quality Management, Fusion Edition.
4 When you finish viewing the source, you can return to the data form by closing the EPM Workspace tab orbrowser window.
Saving DataIn a data form, you can save data values you entered, changed, or calculated. Saving also runsbusiness rules that are designed to launch when the data form is saved.
ä To save data:
1 Open a data form.
40 Entering Data

2 In the data form, make your changes.
3 Select File, then Save.
If you close a data form without saving changes, a message prompts you to save or refresh thedata.
Printing DataYou can print data in data forms as PDF files (including supporting detail, cell text, and accountannotations) if Adobe Acrobat Reader 5.0 or later is installed on your computer. Youradministrator can also set up reports with custom shading, page size, orientation, font, font size,headers, percentage of page used for headers, number of data columns per page, andprecision.
See “Printing Cell Text” on page 36 and “Printing Planning Unit Annotations” on page 73.
ä To print data to a PDF file:
1 With a data form open, select File, then Print.
2 Optional: To reset the printing options to the settings that were assigned to the data form when it was created,click Restore Data Form Settings.
3 Optional: Set your preferences, as described in the following table.
Option Action
Format data Apply number format settings from the data form.
Apply precision Apply the data form’s precision settings to the displayed data. If the data form displayshigh precision numbers (numbers with many digits to the right of the decimal point),consider limiting precision in the PDF file.
Include supportingdetail
Include supporting detail in extra rows. Select either:
l Normal Order: inserts the supporting detail in the same order in which it displays in theSupporting Detail page, after the member that it is associated with.
l Reverse Order: inserts the supporting detail before the member it is associated with,and the supporting detail entries are reversed. Supporting detail for children displaysabove their parents, and the order of siblings is preserved.
Show accountannotations
If the data form designer enables account annotations, show annotations that are assignedto the data form.
Show cell text Show text that is associated with cells.
Show attributemembers
Show attribute members assigned to the data form.
Show currency codes Show currency codes if the data form supports multiple currencies per entity.
4 Optional: To save your settings for subsequent PDF files, select Remember my changes. Your settings overridethe default options assigned to all data forms.
Printing Data 41

5 Optional: To display the PDF file onscreen, click Print Preview.
6 Select File, then Print.
7 Set print options and click OK.
42 Entering Data

5Working With Business Rules
In This Chapter
About Launching Business Rules... . . . . . . . . . . . . . . . . . . . . . . . . . . . . . . . . . . . . . . . . . . . . . . . . . . . . . . . . . . . . . . . . . . . . . . . . . . . . . . . . . . . . . . . . . . . . . .43
Launching Business Rules in Classic Applications... . . . . . . . . . . . . . . . . . . . . . . . . . . . . . . . . . . . . . . . . . . . . . . . . . . . . . . . . . . . . . . . . . . . . . . . . . . .44
Launching Business Rules in Performance Management Architect Applications ... . . . . . . . . . . . . . . . . . . . . . . . . . . . . . . . . . . . . . . . . .44
Entering Runtime Prompts ... . . . . . . . . . . . . . . . . . . . . . . . . . . . . . . . . . . . . . . . . . . . . . . . . . . . . . . . . . . . . . . . . . . . . . . . . . . . . . . . . . . . . . . . . . . . . . . . . . . . . .45
Using Business Rules in Basic Mode ... . . . . . . . . . . . . . . . . . . . . . . . . . . . . . . . . . . . . . . . . . . . . . . . . . . . . . . . . . . . . . . . . . . . . . . . . . . . . . . . . . . . . . . . . .46
Checking Job Status ... . . . . . . . . . . . . . . . . . . . . . . . . . . . . . . . . . . . . . . . . . . . . . . . . . . . . . . . . . . . . . . . . . . . . . . . . . . . . . . . . . . . . . . . . . . . . . . . . . . . . . . . . . . . .47
About Launching Business RulesYou can use business rules to calculate data. Some business rules prompt you to enterinformation, called a runtime prompt. After you enter required information and launch abusiness rule, the data is updated.
Your administrator can set up data forms to automatically launch business rules when you openor save data forms. You can also launch business rules from several contexts.
ä To launch a business rule:
1 Depending on where you are working:
l When a data form is open, its associated business rules are listed in the left bottom pane.Double-click any business rule.
l With a data form open, from the top menu, select Edit, then Launch Rules. Select thebusiness rules to launch and click Launch.
l If menus are set up in a data form, right-click a row or column member in the data form,and select a business rule from the right-click menu. See “Entering Data with Menus” onpage 31.
l From a task list, see Chapter 2, “Working with Task Lists”.
l From the menu, select Tools, then Business Rules.
See “Launching Business Rules in Classic Applications” on page 44 and “LaunchingBusiness Rules in Performance Management Architect Applications” on page 44.
2 If the business rule includes runtime prompts, enter the required information, launch the business rule, andclick Close (see “Entering Runtime Prompts” on page 45).
If the calculation is successful, the values in the database reflect the calculation results.
About Launching Business Rules 43

3 Click Refresh to see the updated values in the data form.
Launching Business Rules in Classic ApplicationsIf you are working with a Classic Planning application, you use business rules created withOracle's Hyperion® Business Rules. You can launch them as described in “About LaunchingBusiness Rules” on page 43.
ä To launch business rules created with Business Rules from the Tools menu:
1 Select Tools, then Business Rules.
2 On the Business Rules page, select the plan types associated with the business rules you want to display.
3 Select the business rules to launch.
4 Click Launch.
Launching Business Rules in Performance ManagementArchitect Applications
If you are working with a Oracle Hyperion EPM Architect, Fusion Edition application, you usebusiness rules created with Hyperion Calculation Manager. You can launch them as describedin “About Launching Business Rules” on page 43.
ä To launch business rules created with Calculation Manager from the Tools menu:
1 Select Tools, then Business Rules.
2 On the Business Rules page, select the plan types for which you want to display the associated businessrules.
3 From Rule Type, select whether to display rules, rulesets, calc scripts, or all calculation types.
To view the business rules in rulesets, expand the hierarchy. Business rules are displayed in thisformat:
rule_name application_name plan_type
where application_name plan_type indicate the application and the plan type to which thebusiness rule is deployed and will be launched against.
Red Flags indicate an error in loading children members of the ruleset. One possible cause forthe error is that the ruleset calculates across applications, and the child members reside onanother server that is not running.
4 Optional: By default, only calculations to which you have access are displayed. To display all calculationsassociated with the selected plan type, clear the option Display only launchable rules, rulesets, and calcscripts.
5 Click the Launch link for the business rule, ruleset, or calculation script you want to launch.
None indicates that you do not have access to a business rule.
44 Working With Business Rules

The launched calculation may include runtime prompts. See “Entering Runtime Prompts” onpage 45.
Entering Runtime PromptsWhen launched, a business rule can prompt you to enter variable information, called a runtimeprompt. The business rule designer sets up runtime prompts. To learn how the display and valuesof runtime prompts are affected by certain settings and conditions, see “Understanding RuntimePrompts” in the Oracle Hyperion Planning Administrator's Online Help.
Notes:
l If a business rule has a runtime prompt and Use Members on Forms is selected, the defaultmember on the runtime prompt window matches the current member in the page or POVaxes of the open data form.
l Members and substitution variables on the Member Selection page are filtered by your accesspermissions and limitations set for the runtime prompt (for example, only Descendants ofQ1). You cannot select a shared member in a runtime prompt.
l If multiple business rules having runtime prompts are launched when saving the data form,enter values for each one successively, using the Next button.
ä To enter a runtime prompt:
1 Launch a business rule having a runtime prompt.
See “About Launching Business Rules” on page 43.
2 Enter or select the input type specified by the runtime prompt, summarized in the following table:
Icon Expected Input Type
One member selection
Multiple member selections
Numeric value
Smart List value—select an item from the list
Text value—use only with enhanced calc scripts, not with graphical scripts
Dimension from the database—use only with enhanced calc scripts, not with graphical scripts
For Calculation Manager business rules only: Cross Dimension—a member combination that includes onlyone member from each dimension the designer has set for this runtime prompt (for example: Sales -> Actual-> Jan refers to the member intersection of Sales, Actual, and January)
Entering Runtime Prompts 45

Icon Expected Input Type
For Calculation Manager business rules only: Member range—a range of members, selectable from eachdimension the designer has set for this runtime prompt (for example: IDescendants(“Marketing”),FY08)
Note: Icons display only in classic view, not in streamlined view. Your administrator determinesyour view.
3 If any runtime prompt values are not valid, correct them.
Symbols indicate whether the values in runtime prompts are valid:
—the runtime prompt values are valid.
—the runtime prompt values are not valid (for example, the entry does not exist in thedimension hierarchy). You cannot launch a business rule until all runtime prompt values arevalid.
4 Optional, for Calculation Manager business rules: To generate a file containing the runtime prompt values,select Create runtime prompt values file.
The file is saved as rule_name.XML, in the HYPERION_HOME/products/planning/RTP/user_name folder. Administrators specify this generated file when launching business rules withthe CalcMgrCmdLineLauncher.cmd utility (see the Oracle Hyperion Planning Administrator'sOnline Help).
5 Click Launch.
If the calculation is successful, the values in the database reflect the calculation results. See also“Checking Job Status” on page 47.
If you are using an Oracle Essbase substitution variable as the runtime prompt value and thevalue of that substitution variable is outside of the variable limits, the limits are ignored, and therule launches successfully.
Using Business Rules in Basic ModeIn Basic mode, you can work with business rules if your task includes them.
ä To launch a business rule in Basic mode when tasks include data forms:
1 In a task that includes a data form, open the data form.
See Chapter 2, “Working with Task Lists”.
2 Select Edit, then Launch Rules.
3 In Launch Business Rules, select a business rule, and click Launch.
If the calculation is successful, the database values reflect the calculation results. See also“Checking Job Status” on page 47.
4 After a confirmation message displays in Launch Business Rules, click Close.
46 Working With Business Rules

ä To launch a business rule in Basic mode when tasks include business rules:
1 Open a task list that includes a business rule.
If more than one task list is assigned to you, you can select the task list from the quick-launchlist. If the task includes a business rule, the business rule page opens in a browser window.
2 In the Business Rules area, select a business rule, and click Launch.
If the calculation is successful, the values in the database reflect the calculation results.
3 After a message confirms that the rule launched successfully, close the browser window.
Checking Job StatusOn the Job Console page, you can check the status (processing, completed, or error) of thesejob types: Business Rules, Clear Cell Details, and Copy Data.
Notes:
l You can be notified by e-mail when a launched job is completed or generates an error (see“Setting Up E-mail” on page 75).
l You cannot cancel or start a job from the Job Console page.
l Administrators can view all jobs and their status. All other users can view only their ownjobs and their status.
ä To check the execution status of jobs:
1 Select Tools, then Job Console.
By default, all jobs are displayed.
For each job, this information is displayed:
l Job ID: The sequential number that the database generates for each started job.
l Job Type: Business Rule, Ruleset (for Calculation Manager), Sequence (for Business Rules),Clear Cell Details, or Copy Data.
l Job Name: The business rule, sequence, or ruleset's name. To expand rulesets to see thebusiness rules and rulesets they include, click . Planning automatically assigns a name toClear Cell Details and Copy Data operations.
l User Name: The name of the user who launched the job.
l Start Time: When the job was started.
l End Time: If the job was completed or ended in an error, the time the job ended.
l Run Status: Processing, Completed, or Error.
2 To filter which jobs are displayed, from Filter Criteria, select which jobs to view. To display jobs:
l Executed by a specified user: Select User and enter the user's name in the User Name textbox.
Checking Job Status 47
l By their type: Select Job Type. Then from Select Job Type, select Business Rule, Clear CellDetails, or Copy Data.
l By their status: Select Run Status. Then from Select Run Status, select Processing,Completed, or Error.
l Executed since a specified day and time: Select Start Time. Then click and, from thecalendar, select the job's start time.
l That completed executing before or by a specified day and time: Select End Time. Then click
and, from the calendar, select the job's end time.
l By their name: Select Job Name and in the Job Name text box, enter its name.
To again display all jobs, select None, the default.
3 Click Go.
The Job Console displays the jobs matching your selection criteria.
4 Optional: Use the navigation aids at the page bottom to move around a long list of jobs.
5 To view this job information, under Run Status, click the links to the log files:
l For Clear Cell Details: the dimensional intersection of the cleared details
l For Copy Data: the dimensional intersection for the copied data
l Cell-level Document: the dimensional intersection for the cleared documents
l For business rules, sequences (for Business Rules), and rulesets (for Calculation Manager):the application, plan type, and runtime values. If the rule generated an error, a text boxdisplays the error.
Note: Information on rulesets in Hyperion Calculation Manager display as expandablehierarchies, and status is displayed individually for each embedded rule and rulesetas they are processed. However, sequences in Business Rules are not expandable, andstatus reflects the status of the entire sequence.
Tip: For administrators only: Because checking for runtime values for many users consumessystem resources, to improve performance, you can turn off this function by selectingAdministration, then Manage Properties, then the Application Properties tab, and thenadding the property CAPTURE_RTP_ON_JOB_CONSOLE and setting its value to FALSE.See the Oracle Hyperion Planning Administrator's Online Help.
6 Optional. For administrators only: To remove selected jobs from the list and to remove their job records fromthe database, click Delete.
You cannot delete jobs that are processing, only jobs that are completed or have errors.
To remove all jobs from the list and remove their job records from the database, select the checkbox left of the header Job ID.
48 Working With Business Rules

6Adjusting and Spreading Data
In This Chapter
Adjusting Cell Values ... . . . . . . . . . . . . . . . . . . . . . . . . . . . . . . . . . . . . . . . . . . . . . . . . . . . . . . . . . . . . . . . . . . . . . . . . . . . . . . . . . . . . . . . . . . . . . . . . . . . . . . . . . . .49
Spreading Data for Time Periods ... . . . . . . . . . . . . . . . . . . . . . . . . . . . . . . . . . . . . . . . . . . . . . . . . . . . . . . . . . . . . . . . . . . . . . . . . . . . . . . . . . . . . . . . . . . . . . .50
Spreading Values Using Grid Spread ... . . . . . . . . . . . . . . . . . . . . . . . . . . . . . . . . . . . . . . . . . . . . . . . . . . . . . . . . . . . . . . . . . . . . . . . . . . . . . . . . . . . . . . . . .57
Spreading Values Using Mass Allocations... . . . . . . . . . . . . . . . . . . . . . . . . . . . . . . . . . . . . . . . . . . . . . . . . . . . . . . . . . . . . . . . . . . . . . . . . . . . . . . . . . . . .58
Adjusting Cell ValuesYou can increase or decrease values by a specific amount or by a percentage. You can also enteroperators in a cell (see “Adjusting Values ” on page 49 and “Performing Ad Hoc Analysis” onpage 50).
Adjusting Values
ä To increase or decrease data values:
1 Select the cells to adjust.
You can adjust data for multiple cells simultaneously, if the writable cells are at the same level.For example, you can adjust the data for February and March simultaneously, but not for Marchand Q1. See “Selecting Cell Ranges” on page 34.
2 Select Edit, then Adjust.
3 Perform an action:
l To increase or decrease values by a specified amount, from Adjust Data, select By Value,select Increase by or Decrease by, and enter the value to spread.
l To increase or decrease values by a percentage, from Adjust Data, select By Percentage,select Increase by or Decrease by, and enter the percent value.
You must enter a numeric value.
4 Click Adjust Data.
The values are displayed, with the number of decimal places that was set for the data form.
5 Click Save.
You cannot adjust a data value if a member is read-only or null, that is, it is missing information.
Adjusting Cell Values 49

Tip: For information on how adjusting data may affect other cells, see “How Spreading DataWorks” on page 51.
Performing Ad Hoc AnalysisBefore you commit data by saving it, you can perform various “what if” calculations and visuallyreview the changes. Experimenting with data enables you to see the impact of various scenariosbefore saving the data—useful for manipulating values to produce desired results.
You can manipulate data values by:
l Typing values (see “About Entering Data” on page 29)
l Locking a value during spreading (see “Locking Cells” on page 56)
l Changing values by typing an operator, followed by a number, described here
l Using the ad hoc analysis functionality in Oracle Hyperion Smart View for Office, FusionEdition.
ä To perform ad hoc calculations on a value:
1 Select the cell on which to perform a calculation.
2 Enter an operator ( +, +–, *, /, or %), and enter a value.
The following table provides examples of using operators and values to produce results:
Operation Initial Value Input Text Result
Add + 100 +50 150
Subtract + - 100 +-50 50
Multiply * 100 *5 500
Divide / 100 /5 20
Percentage % 100 %25 25
3 Move the cursor from the cell.
A change in color indicates the modified cell.
Spreading Data for Time PeriodsWhile working in the Enter Data page, you can spread, or distribute, values by:
l Spreading the value in a summary time period back to its base time periods, or to the firstparent or first child of its parent time period.
l Spreading values among children and parents proportionally, based on existing distribution.
l Spreading values based on a calendar’s weekly distribution in a quarter, which could be4-4-5, 5-4-4, 4-5-4, or None (as set up by the administrator).
50 Adjusting and Spreading Data

l Filling the parent's value to all its descendants
l Temporarily locking certain cell values while spreading data over time periods. (See “LockingCells” on page 56).
You can select, copy, paste, or adjust multiple values. If you paste data to time periods, Planningapplies the spreading rules for each cell in succession, starting from left to right and top tobottom. The data resulting from a paste operation may not match the original copied data. See“How Spreading Data Works” on page 51.
Note: You cannot spread data in a summary time period that includes members with mixedcurrencies.
Note: Values for summary time periods are automatically spread, even if the data form uses analternate hierarchy for Period, so make sure the spread results are correct. Oraclerecommends against entering data into alternate hierarchy members, because the valuescould spread incorrectly.
ä To spread data for time periods:
1 In a data form, put the cursor in the cell with the value to spread.
2 Enter the value.
The value is distributed according to the rules described in “How Spreading Data Works” onpage 51.
3 Click Save.
See also “Spreading Values Using Grid Spread” on page 57 and “Spreading Values Using MassAllocations” on page 58.
How Spreading Data WorksFactors such as account type, the Time Balance property, existing distribution, memberhierarchies, and data type affect how values are distributed, assuming that no data cells are locked(see “Locking Cells” on page 56).
Note: Date and text values are excluded when spreading data.
The following table shows examples of the effect on data of entering or changing a currency ornon-currency value:
Time Balance Property of the Account New Value Distribution Examples
FLOW To all its children and its parentsproportionally, based on the existingdistribution. The value affects the entireSummary Period Rollups hierarchy so that
Example 1
You change Qtr 1 from 250 to 500, withthese current values for its months:
Spreading Data for Time Periods 51

Time Balance Property of the Account New Value Distribution Examples
Revenue, Expense, Saved Assumption(where the Time Balance property is set toFlow)
the parent time period is the sum of itschildren.
If no distribution exists (that is, the valuesfor all the children are zeros or are missing),and the changed value is a Quarter, thevalue spreads down proportionally, basedon the weekly distribution (which can be4-4-5, 4-5-4, 5-4-4, or evenly distributed ifthe account's spreading is set to None).
If the changed parent is a Year Total or someother kind of summary time period, the valueis spread evenly.
Jan = 100
Feb = 50
Mar = 100
Result: 500 is distributed to its childrenproportionally, replacing their previousvalues with:
Jan = 200
Feb = 100
Mar = 200
The increment of 250 is aggregated to theparents of Qtr 1. If Year Total was 1000, itsnew value is 1250.
Example 2
You change March from 100 to 200.
Result: March, Qtr 1, and Year Total allincrement by 100. Jan and Feb remainunchanged.
FIRST
All types of Accounts
Upward to its first parent and downward toits child only if the changed cell is the firstchild of its parent time period.
The summary time period equals the first ofits child time periods.
If no distribution exists (that is, values for allchildren are zeros or are missing), the valueis copied to each of the children.
Example 1
You change Qtr 1 from 20 to 40, with thesecurrent values for its months:
Jan = 20
Feb =15
Mar = 05
Q1 = 20
Result: 40 is distributed to its children,replacing their previous values with:
Jan = 40
Feb = 15
Mar = 05
Q1 = 40
BALANCE
Asset, Liability, Equity, Saved Assumption(where the Time Balance property is set toBalance)
Downward to its last child and upward to itsparent only if the changed cell is the lastchild of its parent time period.
The summary time period equals the last ofits child time periods.
If no distribution exists (that is, the valuesfor all children are zeros or are missing), thevalue is spread across its children.
Example 1
You change Qtr 1 from 30 to 50.
Result: March also changes to 50. Jan andFeb don't change. Year Total does notchange because Qtr 1 is not its last child.
Example 2
You change Qtr 4 from 100 to 50.
Result: Dec changes to 50 because it is Qtr4’s last child. Oct and Nov remainunchanged, as do Qtrs 1, 2, and 3. Year Totalchanges to 50 because Qtr 4 is its last child.
Example 3
52 Adjusting and Spreading Data

Time Balance Property of the Account New Value Distribution Examples
You change Qtr 2 to 100 with these currentvalues:
Apr = 0
May = 0
June = 0
Result:
Apr = 100
May = 100
June = 100
Year Total is unchanged.
AVERAGE
Revenue, Expense, Saved Assumption,(where the Time Balance property is set toAverage)
To all its children and its parentsproportionally, based on the existingdistribution. The value affects the entireSummary Time Period Rollups hierarchy sothat the parent is the average of its children.
Assumes an equal number of days in eachperiod, such as 30 days for each month.
Example 1
You change Qtr 1 from 5 to 10 with thesecurrent values:
Jan = 05
Feb = 10
Mar = 00
Q1 = 05
Result:
Jan = 10
Feb = 20
Mar = 00
Q1 = 10
FILL
All types of Accounts
The value set at the parent is filled into allits descendants.
Example 1
You change YearTotal from 100 to 200.
Result:
Values for Q1, Q2, Q3, Q4 and allmonths are changed to 200
Note: Consolidation operators andmember formulas overwrite FILL values whenthe members are recalculated.
Weighted Average - Actual_365
Revenue, Expense, Saved Assumption,(where the Time Balance property is set toAverage)
Weighted daily average based on 365 daysin a year, assuming that February has 28days. This does not account for leap years.
About Weighted Average - Actual_365:
l You cannot customize month labels,although you can use aliases.
l Years must have twelve months, andquarters must be the sum of three basemonths.
l You cannot change the fiscal start monthafter the application is set up.
Example 1
You enter values for Jan, Feb, and Mar. Forany year, including leap years, February isassumed to have 28 days, and Q1 isassumed to have 90 days.
Value Entered and Number of Days
Jan = 9,000 31 days
Feb = 8,000 28 days
Mar = 8,000 31 days
Spreading Data for Time Periods 53

Time Balance Property of the Account New Value Distribution Examples
l All months are included in thecalculation. #MISSING is treated as 0 inthe numerator, and all the days areincluded in missing months in thedenominator. This means, for example,that QTR means three months, not QTD,and Total Year means all twelve months,not YTD.
Q1 = 90 days (the total days for Jan,Feb, and Mar)
Result:
Q1 = 8,344
The average for Q1 is calculated thus: (1)Multiply the value for each month in Q1 bythe number of days in that month, (2) Sumthese values, and (3) Divide the total by thenumber of days in Q1. Using 28 for thenumber of days in Feb, and 90 for thenumber of days in Q1, the result is: (9,000times 31 plus 8,000 times 28 plus 8,000times 31) divided by 90 = 8,344
Weighted Average - Actual_Actual
Revenue, Expense, Saved Assumption,(where the Time Balance property is set toAverage)
Weighted daily average based on the actualnumber of days in a year. This accounts forleap years, in which February has 29 days.
About Weighted Average - Actual_Actual:
l You cannot customize month labels,although you can use aliases.
l Years must have twelve months, andquarters must be the sum of three basemonths.
l You cannot change the fiscal start monthafter the application is set up.
l All months are included in thecalculation. #MISSING is treated as 0 inthe numerator, and all the days areincluded in missing months in thedenominator. This means, for example,that QTR means three months, not QTD,and Total Year means all twelve months,not YTD.
Example 1
For a leap year, you enter values for Jan, Feb,and Mar. February is assumed to have 29days, and Q1 is assumed to have 91 days.
Value Entered and Number of Days
Jan = 9,000 31 days
Feb = 8,000 29 days
Mar = 8,000 31 days
Q1 = 91 days (the total days for Jan,Feb, and Mar)
Result:
Q1 = 8,341
The average for Q1 is calculated thus: (1)Multiply the value for each month in Q1 bythe number of days in that month, (2) Sumthese values, and (3) Divide the total by thenumber of days in Q1. Using 29 for thenumber of days in Feb, and 91 for thenumber of days in Q1, the result is: (9,000times 31 plus 8,000 times 29 plus 8,000times 31) divided by 91 = 8,341
Example 2
For a non-leap year, you enter values for Jan,Feb, and Mar. February is assumed to have28 days, and Q1 is assumed to have 90days.
Value Entered and Number of Days
Jan = 9,000 31 days
Feb = 8,000 28 days
Mar = 8,300 31 days
Q1 = 90 days (the total days for Jan,Feb, and Mar)
54 Adjusting and Spreading Data

Time Balance Property of the Account New Value Distribution Examples
Result:
Q1 = 8,344
Using 28 for the number of days in Feb, and90 for the number of days in Q1, the resultis: (9,000 times 31 plus 8,000 times 28plus 8,000 times 31) divided by 90 = 8,344
Note: The Skip option does not apply to data spreading but affects only the calculation of themember hierarchy.
If you change a percentage:
Regardless of account type, existing distribution, or 4-4-5 setting, the value is spread evenlyacross its children. If the changed cell is the last child of its parent time period, the value is copiedupwards to its parent.
Example 1
You change Qtr 1 from 10 to 20.
Result: Jan, Feb, and Mar also change to 20. However, Year Total does not change because Qtr1 is not its last child.
Example 2
You change Feb from 10 to 20.
Result: Jan and Mar do not change because neither one is a child or parent of Feb. Qtr 1 (andtherefore Year Total) does not change because Feb is not its last child.
Example 3
You change Qtr 4 from 30 to 20.
Result: Oct, Nov, and Dec also change to 20 because the value is copied to Qtr 4’s children. YearTotal also changes to 20 because Qtr 4 is its last child.
Note: See “Adjusting Cell Values” on page 49 and “Spreading with Multiple Currencies” onpage 55.
Spreading with Multiple CurrenciesWhen data is spread from a parent member to children of mixed currencies, the children assumethe currency type of the parent time period, and data is spread as described in “How SpreadingData Works” on page 51.
When currencies are mixed and a child time period is changed, the currency of the parent timeperiod assumes the currency type of the child only if that time period does not have childrenwith multiple currencies.
Spreading Data for Time Periods 55

Locking CellsWhen spreading or manipulating data, you can temporarily lock cells while Planning calculatesand fills in other values. You can visually review the changes before saving them. See “Examplesof Spreading Data with Cell Locking” on page 56.
ä To temporarily lock values:
1 Select the cells to lock.
2 Either:
l Select Edit, then Lock/Unlock Cells.
l Enter an exclamation point: ! (press Shift + 1).
A tan background indicates that a cell is locked. If you lock multiple cells, some of which arealready locked, all the unlocked cells become locked.
You can now spread or manipulate the other data. (See “Spreading Data for Time Periods” onpage 50 and “How Spreading Data Works” on page 51.)
3 To unlock cells, select Edit, then Lock/Unlock Cells or enter !.
Typing ! or selecting Lock/Unlock Cells unlocks all cells in a group only if they are all locked (orwere read-only for another reason). When you save the data, locked cells become unlocked.
Examples of Spreading Data with Cell LockingExample 1
Before locking and spreading, Account A has the values described in the following table:
Jan Feb Mar Q1
Account A 100 100 100 300
You then lock the Feb and Mar values at 100 and change Q1 from 300 to 600. Because Jan, Feb,and Mar must now total 600, and Feb and Mar are locked at 100 each, Planning calculates Janto be 400 and fills in that value.
After locking and spreading, the data displays as shown in the following table:
Jan Feb Mar Q1
Account A 400 100 100 600
Example 2
Before locking and spreading, Account B has the values described in the following table:
56 Adjusting and Spreading Data
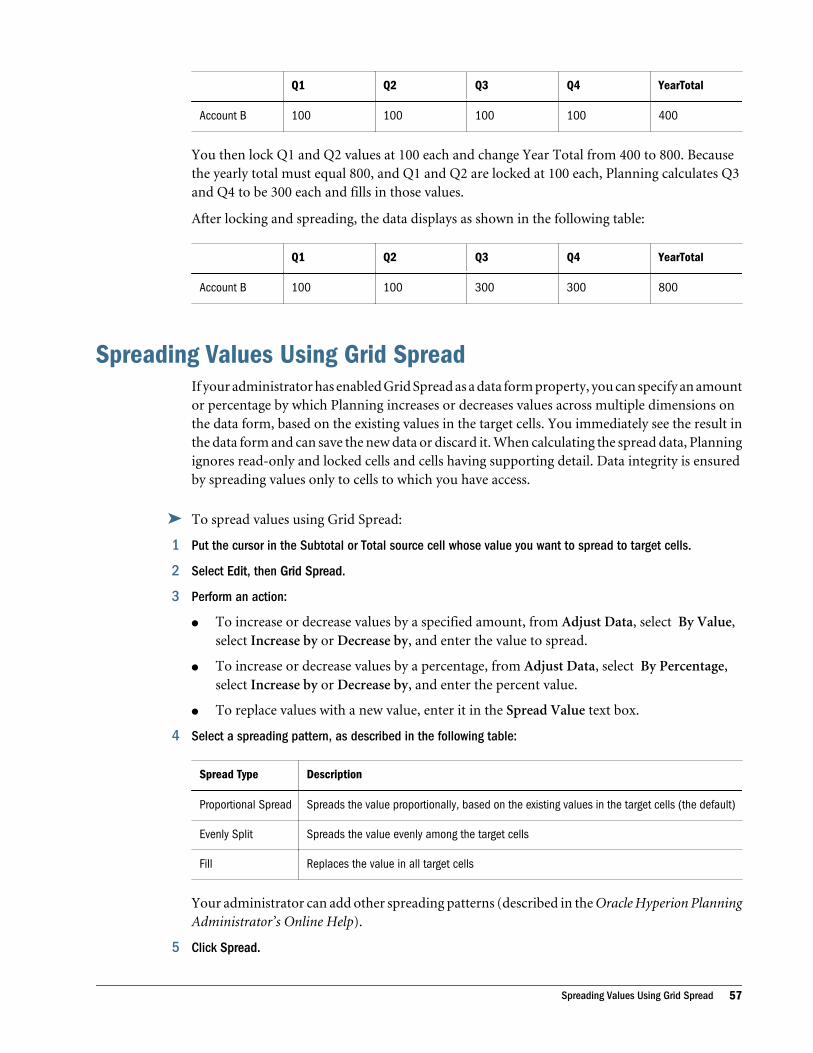
Q1 Q2 Q3 Q4 YearTotal
Account B 100 100 100 100 400
You then lock Q1 and Q2 values at 100 each and change Year Total from 400 to 800. Becausethe yearly total must equal 800, and Q1 and Q2 are locked at 100 each, Planning calculates Q3and Q4 to be 300 each and fills in those values.
After locking and spreading, the data displays as shown in the following table:
Q1 Q2 Q3 Q4 YearTotal
Account B 100 100 300 300 800
Spreading Values Using Grid SpreadIf your administrator has enabled Grid Spread as a data form property, you can specify an amountor percentage by which Planning increases or decreases values across multiple dimensions onthe data form, based on the existing values in the target cells. You immediately see the result inthe data form and can save the new data or discard it. When calculating the spread data, Planningignores read-only and locked cells and cells having supporting detail. Data integrity is ensuredby spreading values only to cells to which you have access.
ä To spread values using Grid Spread:
1 Put the cursor in the Subtotal or Total source cell whose value you want to spread to target cells.
2 Select Edit, then Grid Spread.
3 Perform an action:
l To increase or decrease values by a specified amount, from Adjust Data, select By Value,select Increase by or Decrease by, and enter the value to spread.
l To increase or decrease values by a percentage, from Adjust Data, select By Percentage,select Increase by or Decrease by, and enter the percent value.
l To replace values with a new value, enter it in the Spread Value text box.
4 Select a spreading pattern, as described in the following table:
Spread Type Description
Proportional Spread Spreads the value proportionally, based on the existing values in the target cells (the default)
Evenly Split Spreads the value evenly among the target cells
Fill Replaces the value in all target cells
Your administrator can add other spreading patterns (described in the Oracle Hyperion PlanningAdministrator’s Online Help).
5 Click Spread.
Spreading Values Using Grid Spread 57

The specified value or percentage is spread across the target cells, replacing former values withnew ones.
6 To save the new values, click Save.
Spreading Values Using Mass AllocationsIf you have the Mass Allocate role (assigned in Oracle's Hyperion® Shared Services) and anadministrator has enabled Mass Allocate as the data form property, you can spread data usingthe powerful feature, Mass Allocate, which:
l Allocates data to all the source cell's descendants
l Allocates across multiple dimensions
l Spreads data even to cells not displayed on the data form
l Does not require that you have access to the target cells
l Cannot be undone after you mass allocate values
l Is processed with dynamically-created calc scripts
l Executes the calc scripts against the Essbase server, against all dimension combinations
l Can use customized spreading patterns, created by an administrator (see the Oracle HyperionPlanning Administrator’s Online Help).
ä To spread values using Mass Allocate:
1 Put the cursor in the Subtotal or Total cell whose value you want to spread.
2 Select Edit, then Mass Allocate.
3 Perform an action:
l To increase or decrease values by a specified amount, from the Adjust Data drop-down list,select By Value, select Increase by or Decrease by, and enter the value to spread.
l To increase or decrease values by a percentage, from the Adjust Data drop-down list, selectBy Percentage, select Increase by or Decrease by, and enter the percent value.
l To replace values with a new value, enter it in the Spread Value text box.
4 Select the Spread Type for allocating the specified value or percentage across the target cells:
Proportional spread: Spreads based on the existing values in the target cells.
Relational spread: Spreads into the selected cells, based on values that exist in a different sourcelocation. Selecting this option displays the currently selected members for each dimension inthe Selected column.
Under Relative, select the members you select that identify the base values to be spread, creating
a pattern based on the existing values in the relative cells. To select members, click , and, onthe Member Selection page, select members for the dimension, either directly or based onrelationships (see the Oracle Hyperion Planning Administrator’s Online Help).
58 Adjusting and Spreading Data

Your administrator can add other spreading patterns, described in the Oracle Hyperion PlanningAdministrator’s Online Help.
5 Click Spread.
The new values are automatically saved in Essbase.
Spreading Values Using Mass Allocations 59

60 Adjusting and Spreading Data

7Working with Supporting Detail
In This Chapter
Working with Supporting Detail . . . . . . . . . . . . . . . . . . . . . . . . . . . . . . . . . . . . . . . . . . . . . . . . . . . . . . . . . . . . . . . . . . . . . . . . . . . . . . . . . . . . . . . . . . . . . . . . . . .61
Adding Supporting Detail. . . . . . . . . . . . . . . . . . . . . . . . . . . . . . . . . . . . . . . . . . . . . . . . . . . . . . . . . . . . . . . . . . . . . . . . . . . . . . . . . . . . . . . . . . . . . . . . . . . . . . . . . .62
Viewing or Changing Supporting Detail . . . . . . . . . . . . . . . . . . . . . . . . . . . . . . . . . . . . . . . . . . . . . . . . . . . . . . . . . . . . . . . . . . . . . . . . . . . . . . . . . . . . . . . . . .65
Synchronizing Supporting Detail with Essbase ... . . . . . . . . . . . . . . . . . . . . . . . . . . . . . . . . . . . . . . . . . . . . . . . . . . . . . . . . . . . . . . . . . . . . . . . . . . . . . . .65
Pasting Multiple Cells into the Supporting Detail Window ... . . . . . . . . . . . . . . . . . . . . . . . . . . . . . . . . . . . . . . . . . . . . . . . . . . . . . . . . . . . . . . . . .66
Working with Supporting DetailSupporting detail serves as a built-in calculator for developing data that is not in the memberoutline. It also provides a way to better understand the basis of the data. For example, if thebottom-level member in your outline is pens, you can add line items in supporting detail forballpoint, fountain, marker, and so on. Then you can aggregate their values to the pen member.
Supporting detail helps you build and communicate bottom-up values when planning suchcorporate expenses as travel and projects, where you must calculate aggregate values. Supportingdetail can include text, values, and operators that define how data aggregates.
About supporting detail:
l Supporting detail does not change members in the outline.
l To create, change, or delete supporting detail, you must have write access to cells. You musthave read access to view supporting detail.
l To protect values, you cannot enter, adjust, spread, and save data into aggregate values thathave supporting detail. The aggregate values are read-only.
l You can add supporting detail to target and bottom-up versions.
l You cannot add supporting detail to Summary Time Periods—such as Quarters—but onlyto base time periods (level 0 members).
l Number and precision formatting is not reflected in the Supporting Detail window.
l The sequence of operators follows the same logic as is used to process multiple operators ina complex calculation.
l You can print supporting detail.
l When using Copy Versions, you can copy supporting detail from one version to another.
Working with Supporting Detail 61

l Your administrator can copy data, including supporting detail, from one dimensionalintersection to another. For example, administrators can copy Budget, FY08, Final toForecast, FY09, First Draft. They can also copy data from one business unit to another, orfrom FY08 to FY09 to prepare a budget.
See “Adding Supporting Detail” on page 62.
Adding Supporting DetailUse the Supporting Detail window to set how detail items aggregate to cell values in a data form.
ä To add supporting detail that calculates values in a data form:
1 Open a data form, and select the cells.
You can select one cell or a range of contiguous cells in a row or column. The section cannotinclude a combination of rows and columns. Select cells that are in the local currency so thatyou can write to them.
2 Select Edit, then Supporting Detail.
The Supporting Detail window reflects your cell selection.
3 Enter a description over the initial “untitled” text.
The text and its associated operator—up to 1,500 characters—must be unique among childrenof the same parent.
4 Use the buttons to create or change the indented hierarchy to reflect the desired structure and calculations.
For example, click Add Child to add a line item directly below the selected item. See “Workingwith the Supporting Detail Hierarchy” on page 64.
5 Set the mathematical relationships among the line items by selecting an operator for each of them.
Select from these operators: + (add), - (subtract), * (multiply), / (divide), and ~ (ignore).
6 Enter data to set or calculate.
Enter numbers using the same scaling that was set up for the data form.
7 Click Save.
Values are dynamically calculated and aggregated before the data is saved. Data on the data formis also saved.
Example of Supporting DetailThis example shows how the first quarter’s travel budget for a department is calculated usingsupporting detail. These supporting detail Total values aggregate to the Q1 Travel cell in the dataform.
62 Working with Supporting Detail

Totaling When Supporting Detail Cells are BlankIf a data cell in supporting detail is blank, Planning ignores it when aggregating values (insteadof assuming that a blank cell means zero).
For example, you might define supporting detail to calculate the daily rate of hiring an instructor($250) times the number of days per month for which you plan to retain an instructor (4 inJanuary, but none in February). The Instructor total for Feb is 250, even though you do notintend to hire an instructor in Feb, as shown in the following table:
Jan Feb
Instructor 1000 250
Rate + 250 250
Days 4
To correctly total values that are aggregated by the * multiplier when some cells are blank, youcan leave the Rate cell blank, or enter a zero in the Days data cell, instead of leaving it blank, asshown in the following table:
Jan Feb
Instructor 1000 0
Rate + 250 250
Days 4 0
This causes the rate (250) to be multiplied by 0 (zero), resulting in a value of zero.
Order of Supporting DetailThe supporting detail order affects the resulting value that is saved to Essbase. Understandingthe calculation order helps you correctly enter supporting detail. Supporting detail leverages thecalculation order of + (addition), - (subtraction), * (multiplication), and / (division). A simpleUnit times Rates example demonstrates how to correctly enter supporting detail.
Adding Supporting Detail 63

Incorrectly Entering Supporting Detail
Because Rate in this following table is set to the unary operator +, the calculation order first addsthe Rate and then multiplies by the Unit, resulting in incorrect data being saved.
Jan Feb Mar
Rate + 250 250 250
Unit * 10
Total: 2500 250 250
Correctly Entering Supporting Detail
This following table demonstrates the correct order of the Units times Rates calculation, withcorrect values saved.
Jan Feb Mar
Unit + 10.0
Rate * 250.0 250.0 250.0
Total: 2500
Verify the supporting detail order, ensuring that correct values are calculated and saved.
Working with the Supporting Detail HierarchyThe supporting detail hierarchy should reflect the type of information that supports the cellvalues and the mathematical operators that create the relationships.
ä To create or change the supporting detail hierarchy:
1 In a data form, select the cells with supporting detail.
2 Select Edit, then Supporting Detail.
3 Create or change the rows in the hierarchy that provide the detail for the data values by putting the cursoron an item and clicking the options in this table:
Option Result
Add Child Adds an item one level below the selected cell. You can add an unlimited number of children, butconsider its potential performance impact.
Add Sibling Adds an item at the same level as the selected cell. You can add an unlimited number of siblings,but consider its potential performance impact.
Delete Removes the selected item
64 Working with Supporting Detail

Option Result
Delete All Simultaneously removes all supporting detail
Promote Moves the selected item to the next-higher level
Demote Moves the selected item to the next-lower level
Move Up Moves the selected item before its sibling predecessor
Move Down Moves the selected item after its sibling successor
Duplicate Row Adds a row below the selected item, duplicating its structure (text, operator, and values)
Fill For rows, copies the data from the current cell to the cells to its right
Refresh Gets the latest stored database values, restoring the previously-saved values, and possiblyoverwriting changes you just made.
4 Click Save.
The save operation stores the detail text, values, and aggregate values.
Viewing or Changing Supporting DetailIn data forms, cells with supporting detail have a light green background.
ä To view or change calculations or supporting data:
1 Open a data form, and select the cells for which to view or add detail.
You can select one cell or a range of contiguous cells in a row or column. The section cannotinclude a combination of rows and columns. Select cells that are in the local currency so thatyou can write to them.
2 Select Edit, then Supporting Detail.
3 View or change the line items or calculations that aggregate the data in the selected cells.
Synchronizing Supporting Detail with EssbaseWhen you delete supporting detail, you can specify how to handle the value for the supportingdetail total that is stored in Essbase. You can set the value in Essbase to #MISSING or leave it asit was before the supporting detail was deleted—in effect, using supporting detail as a scratchpad or calculator.
ä To synchronize supporting detail with Essbase:
1 Click in the cell with supporting detail.
2 Select Edit, then Supporting Detail.
3 In Supporting Detail, delete the information and click Save.
Viewing or Changing Supporting Detail 65

4 In the displayed message, specify how Essbase handles the changes:
l To delete the supporting detail in Essbase, click Yes, set the value(s) to #MISSING.
l To leave the data in Essbase as it was before you deleted the supporting detail, click No, leavethe value(s) as is.
Pasting Multiple Cells into the Supporting Detail Window You can copy supporting detail from multiple cells in Microsoft Excel or another applicationand paste it into the Supporting Detail window. For example, you can export data forms to Excelspreadsheets, work on supporting detail in spreadsheets, and copy it back to Planning.
About copying and pasting supporting detail:
l The cell range of the data that you paste must exist in the Supporting Detail window.
l You can copy and paste cell labels and cell data.
l The pasted data does not retain the original formatting.
ä To copy supporting detail from Microsoft Excel spreadsheets:
1 Open a Planning data form.
2 In Planning, select a cell or range of cells, and click Supporting Detail.
3 In Supporting Detail, note the range of cells with supporting detail, or add cells with supporting detail, andclick OK.
4 In the data form, click Spreadsheet Export.
A browser instance of Microsoft Excel is displayed with the exported information, and you canmodify the supporting detail.
5 In Excel, select the range of cells containing supporting detail, and press Ctrl+C to copy the data.
6 In Planning, open the data form to which to add supporting detail.
7 Select the cell with the details to modify, and click Supporting Detail.
8 In Supporting Detail, click in the range's upper-left cell for which to paste supporting detail, and press Ctrl+V.
9 Click Save.
66 Working with Supporting Detail

8Working with Currencies
In This Chapter
Working with Multiple Currencies ... . . . . . . . . . . . . . . . . . . . . . . . . . . . . . . . . . . . . . . . . . . . . . . . . . . . . . . . . . . . . . . . . . . . . . . . . . . . . . . . . . . . . . . . . . . . . . .67
Changing the Currency for a Data Cell . . . . . . . . . . . . . . . . . . . . . . . . . . . . . . . . . . . . . . . . . . . . . . . . . . . . . . . . . . . . . . . . . . . . . . . . . . . . . . . . . . . . . . . . . . .68
Reporting on Data in Multiple Currencies... . . . . . . . . . . . . . . . . . . . . . . . . . . . . . . . . . . . . . . . . . . . . . . . . . . . . . . . . . . . . . . . . . . . . . . . . . . . . . . . . . . . . .68
Working with Multiple CurrenciesYou can plan and analyze your financial information in one currency or in multiple currencies,if certain conditions are met.
If multiple currencies are enabled, cells show the currency code. You can:
l Enter data in local currencies
l View or report on data in reporting currencies
On data forms where the Multiple currencies per entity option is enabled, no currency codesare displayed for parent entities, even if they have single- or multiple-currency children.
When you run a currency conversion calc script, all currencies on the page are converted. Forexample, you can select local, USD, and EUR currency members on the page axis and enter datain the local currency. The currency conversion calc script dynamically calculates the entereddata for all currencies selected for that page. In this example, the script converts local currencyto USD and to EUR.
Currency conversion converts all levels except the Time Period dimension, where it convertsonly level 0 time periods and then aggregates the summary displayed time periods.
See:
l The Oracle Hyperion Planning Administrator’s Online Help to set up currencies.
l “Changing the Currency for a Data Cell” on page 68.
l “Reporting on Data in Multiple Currencies” on page 68.
l “Spreading with Multiple Currencies” on page 55.
Working with Multiple Currencies 67

Changing the Currency for a Data CellIf an administrator has enabled the functionality, you can enter data into cells in a currencyother than the base currency of the cells. Currencies listed in the Available Currencies list canbe used for input as a local currency.
Note: To override the base currency for an entity, the cell must be displayed in the local currency,and its version must be bottom-up.
ä To enter data in a local currency other than the cell's base currency:
1 In a data form, select a local currency member for the cell.
2 Optional: To look up the currency's code, select View, then Currency.
Available Currencies shows the application's currencies. Note the Currency Code for thecurrency you want to work with, and close the window. If you cannot select View, then Currency,multiple currencies are not enabled for this application or data form.
3 In the right part of a data cell, enter the Currency Code for the cell's currency.
Doing this overrides the entity's base currency. The left part of the cell is for the value itself.
4 Enter or view the data in the left part of the cell.
5 Select File, then Save to calculate and save the value.
If the Calculate Currencies calc script is set to run when the data form is saved, and the dataform is enabled for multiple currencies, the data value is displayed in the currency you selected.
Reporting on Data in Multiple CurrenciesIf an administrator has enabled the functionality, you can view data in a reporting currency.
ä To see data values in a reporting currency other than the base currency, in a data form, selectanother reporting currency.
You can look up the currency code for a currency by selecting View, then Currency.
The Available Currencies list shows which currencies are set up for the application. Note theCurrency Code for the currency you want to work with, and close the window. (If you cannotselect View, then Currency, multiple currencies are not enabled for this application or form.)
Note: You cannot enter data into a reporting currency. You can enter data only into a localcurrency.
68 Working with Currencies

9Managing Planning Units
In This Chapter
Overview of the Review Process ... . . . . . . . . . . . . . . . . . . . . . . . . . . . . . . . . . . . . . . . . . . . . . . . . . . . . . . . . . . . . . . . . . . . . . . . . . . . . . . . . . . . . . . . . . . . . . . .69
Viewing a Planning Unit's Status ... . . . . . . . . . . . . . . . . . . . . . . . . . . . . . . . . . . . . . . . . . . . . . . . . . . . . . . . . . . . . . . . . . . . . . . . . . . . . . . . . . . . . . . . . . . . . . .70
Changing a Planning Unit's Status ... . . . . . . . . . . . . . . . . . . . . . . . . . . . . . . . . . . . . . . . . . . . . . . . . . . . . . . . . . . . . . . . . . . . . . . . . . . . . . . . . . . . . . . . . . . . .71
Adding or Viewing Planning Unit Annotations ... . . . . . . . . . . . . . . . . . . . . . . . . . . . . . . . . . . . . . . . . . . . . . . . . . . . . . . . . . . . . . . . . . . . . . . . . . . . . . . . .72
Printing Planning Unit Annotations ... . . . . . . . . . . . . . . . . . . . . . . . . . . . . . . . . . . . . . . . . . . . . . . . . . . . . . . . . . . . . . . . . . . . . . . . . . . . . . . . . . . . . . . . . . . . .73
Viewing a Planning Unit's History.. . . . . . . . . . . . . . . . . . . . . . . . . . . . . . . . . . . . . . . . . . . . . . . . . . . . . . . . . . . . . . . . . . . . . . . . . . . . . . . . . . . . . . . . . . . . . . . .73
Overview of the Review ProcessPlanning tracks budgets by planning units—a slice of data at the intersection of a scenario, aversion, and an entity. It is the basic unit for preparing, annotating, reviewing, and approvingplan data.
Planning units are in one of six states:
l Not Started: the initial state of all planning units. An administrator begins the review processby starting a planning unit using the Start action, which changes a planning unit's state toFirst Pass.
l First Pass: the beginning state of planning units selected for the budgeting process. Planningunits have no owners during First Pass. Users having access can enter data and promoteplanning units during the First Pass state. During this state, administrators may excludesome or all entities from planning units.
When a planning unit is ready for review, users can promote it from First Pass to UnderReview, and assign its owner. To be notified by e-mail if you become the owner of a planningunit, see “Setting Up E-mail” on page 75.
l Under Review: occurs when a Promote action is taken on a planning unit, signifying thatsomeone is reviewing it. Only the current owner or administrators can modify data orperform an action on planning units whose state is Under Review. While Under Review,planning units may undergo iterations of promotions, signoffs, and rejections until they arefinally approved.
l Signed Off: occurs when a Sign Off action is taken on a planning unit. Only the currentowner or administrator can modify data or perform an action on planning units whose stateis Signed Off. Ownership does not change when a planning unit is signed off.
Overview of the Review Process 69

l Not Signed Off: occurs when a Reject action is taken on a planning unit. Only the currentowner or administrator can modify data or perform an action on a planning unit whosestate is Not Signed Off.
l Approved: occurs when an Approve action is taken on a planning unit, whereby theadministrator becomes its owner. Only the administrator can modify data or perform anaction on approved planning units. After all planning units are approved, the budgetingcycle is complete.
Notes:
l In all states except the Not Started state, users with read access can view data, view the processstate, view the history, and read and enter annotations.
l A planning unit may skip process states. For example, an administrator may approve astarted planning unit from any state.
l The review process can be managed at a higher level with parent entities.
Viewing a Planning Unit's Status
ä To view a planning unit's status:
1 Select File, then Workflow, then Manage Process.
2 From Scenario, select a scenario.
3 From Version, select a version.
4 Optional for budget administrators: The Entities list can be displayed as a tree or flat view. If the display isa tree view, expand the hierarchy until you see the entity or entities you want to work with. In a flat view,click a column header to sort the list.
5 Click Go.
You see a list of planning units to which you have access. The Entities list displays columns for:
l Entity
l Plan Cycle (administrators only)
l Process Status
l Current Owner
l Action
6 View information for a planning unit by clicking the Details link in the Action column.
Historic information is displayed for process status, owner, actions taken, and the date and timesthe status changed.
When an administrator excludes a planning unit, all annotations and history associated with theplanning unit are discarded. The planning unit’s status is returned to Not Started and the owneris set to No Owner. However, the data values are retained.
70 Managing Planning Units

Changing a Planning Unit's Status
ä To change the status of a planning unit:
1 Select File, then Workflow, then Manage Process.
2 From Scenario, select a scenario.
3 From Version, select a version.
4 Click Go.
5 Optional for budget administrators: The Entities list can be displayed as a tree or flat view. If the display isa tree view, expand the hierarchy until you see the entity or entities you want to work with. In a flat view,click a column header to sort the list.
Note: If you change the status of a parent entity, all its children change too, unless they wereexcluded during the First Pass state or were approved.
6 Click Change Status.
7 From Select Action, select:
l Promote: when you are ready for another user to review the planning unit. This actionassigns ownership of a planning unit the first time, and thereafter transfers ownership of aplanning unit from one reviewer to another. Promote causes an implicit sign-off by thecurrent owner and changes the state of the planning unit to Under Review.
l Sign Off: when you are signing off on a planning unit. Sign Off does not transfer ownershipof the planning unit, but changes its state to Signed Off.
l Reject: when you are not satisfied with the planning unit. Reject typically requires theprevious owner to create another iteration. By default, Reject returns the planning unit'sownership to the previous owner, but you may select the next owner. A Reject action changesthe planning unit's state to Not Signed Off.
l Approve: when you approve the planning unit, changing its state to Approved. A planningunit can be approved from any state except Not Started. Only an administrator can approvefrom a Not Signed Off or First Pass state. Approving a planning unit causes an implicit sign-off by the reviewer. Typically, a planning unit is approved only once. An administrator canreject a previously-approved planning unit.
8 From Select Next Owner, select the next owner of the planning unit.
9 Optional: In Enter Annotation, enter comments.
See “Adding or Viewing Planning Unit Annotations” on page 72.
10 Click Submit.
Changing a Planning Unit's Status 71

Adding or Viewing Planning Unit AnnotationsAnnotations let you add or view comments about the data in a planning unit that is started. Youmust have at least read access to the planning unit to view or add an annotation. Annotationscan vary by combinations of scenario, version, and entity members.
ä To add an annotation for a planning unit:
1 Select File, then Workflow, then Manage Process.
2 From Scenario, select a scenario.
3 From Version, select a version.
4 Click Go.
5 Click Details for the entity to which to add an annotation.
6 Optional for administrators: The Entities list can be displayed as a tree or flat view. If the display is a treeview, expand the hierarchy until you see the entity or entities you want. In a flat view, click a column headerto sort the list.
7 Click Add Annotation.
8 In Enter Title, enter an annotation title.
9 In Enter Annotation, enter your comments (up to 1500 characters).
On multibyte systems, Oracle recommends not typing planning unit annotations of more than750 characters.
10 Click Submit.
Note: You can also add annotations to planning units from the Enter Data page by clickingAnnotations for the planning unit of the currently selected cell. (To enter annotations foranother planning unit, enter the version, scenario, and entity for the planning unit, andclick Go.)
ä To view annotations for a planning unit:
1 Select File, then Workflow, then Manage Process.
2 From Scenario, select a scenario.
3 From Version, select a version.
4 Click Go.
5 Click the Details link for the entity for which to view a planning unit.
6 Optional for administrators: The Entities list can be displayed as a tree or flat view. If the display is a treeview, expand the hierarchy until you see the entity or entities you want. In a flat view, click a column headerto sort the list.
7 Under Existing Annotations, read the planning unit's comments.
8 Optional: To add a comment, click Add Annotation.
a. In Enter Title, enter an annotation title.
72 Managing Planning Units

b. In Enter Text, enter your comments (up to 1500 characters).
c. Click Submit.
Printing Planning Unit AnnotationsAdministrators can print reports on planning unit annotations (see the Oracle Hyperion PlanningAdministrator’s Online Help).
Viewing a Planning Unit's HistoryIf you have at least read access to a planning unit, you can view its history.
ä To view the history of a planning unit:
1 Select File, then Workflow, then Manage Process.
2 From Scenario, select a scenario.
3 From Version, select a version.
4 Click Go.
5 Click Details for the entity for which to view a planning unit.
You see historic information for Process Status, Owner (of the last action), Last Action (taken),and Status Changed (date and time).
6 Optional for budget administrators: The Entities list can be displayed as a tree or flat view. If the display isa tree view, expand the hierarchy until you see the entity or entities you want. In a flat view, click a columnheader to sort the list.
7 Use the scroll bar in Existing Annotations to view all annotations.
Printing Planning Unit Annotations 73

74 Managing Planning Units

10Setting User Preferences
In This Chapter
Setting Preferences for Application Settings ... . . . . . . . . . . . . . . . . . . . . . . . . . . . . . . . . . . . . . . . . . . . . . . . . . . . . . . . . . . . . . . . . . . . . . . . . . . . . . . . . .75
Setting Preferences for Display Options ... . . . . . . . . . . . . . . . . . . . . . . . . . . . . . . . . . . . . . . . . . . . . . . . . . . . . . . . . . . . . . . . . . . . . . . . . . . . . . . . . . . . . . .77
Setting Preferences for Printing Options ... . . . . . . . . . . . . . . . . . . . . . . . . . . . . . . . . . . . . . . . . . . . . . . . . . . . . . . . . . . . . . . . . . . . . . . . . . . . . . . . . . . . . . .82
Setting Preferences for User Variables ... . . . . . . . . . . . . . . . . . . . . . . . . . . . . . . . . . . . . . . . . . . . . . . . . . . . . . . . . . . . . . . . . . . . . . . . . . . . . . . . . . . . . . . . .83
Setting Preferences for Application SettingsIn the Preferences page, use the Application Settings tab to set preferences:
l Set up e-mail for workflow and job notifications. See “Setting Up E-mail” on page 75.
l Select a set of alias names for displaying dimension and member names. See “Selecting theAlias Setting” on page 76.
l Set options for member selection. See “Setting Member Selection Options” on page 76.
l Enable Offline Planning. See the Oracle Hyperion Planning Administrator’s Online Help andOracle Hyperion Smart View for Office User's Guide.
l Set workflow options. See “Setting Workflow Options” on page 77.
Note: To reset an option to the value set by an administrator, select Use Application Default.
Set other preferences on these tabs:
l Display Options: See “Setting Preferences for Display Options” on page 77
l Printing Options: See “Setting Preferences for Printing Options” on page 82
l User Variable Options: See “Setting Preferences for User Variables” on page 83
Setting Up E-mailWhen e-mail is set up and notification is enabled, Planning notifies users when they become theplanning unit's owner. The Application Settings tab displays differently for the application ownerthan for others because the application owner must set up the application’s e-mail server beforeothers can enable e-mail notification.
Setting Preferences for Application Settings 75

ä To set up and enable e-mail notification for yourself:
1 Select File, then Preferences.
2 Click the Planning icon and select Application Settings.
3 In E-mail Address, enter your e-mail address.
4 From Enable E-mail Notification, select Yes or No.
5 Optional: For the owner of the application to receive a copy of your e-mail notifications, from Copy theApplication Owner, select Yes.
6 From Job Console Notification, select Yes if you want to be notified by e-mail when a job that you launch(for example, a business rule) is completed or generates an error.
7 Click Save.
You now receive e-mail notifications when you become a planning unit's owner. The Subjectline is formatted as: NEW OWNER: Abc Plan (Scenario, Version, Entity).
8 Repeat these steps for each application for which you want e-mail notification enabled.
Selecting the Alias SettingAdministrators can assign alternate names, or aliases, to Account, Entity, and user-defineddimensions and members. If they do, you can select which set of aliases to use for displayingdimension and member names. For example, one alias table could display members in French,and another could display members in German.
ä To select the alias table for displaying names:
1 Select File, then Preferences.
2 Click the Planning icon and select Application Settings.
3 From Alias Table in the Alias Setting area, select an alias table.
4 Click Save.
Setting Member Selection OptionsYou can use Member Selection Options to set whether aliases and descriptions display in theMember Selection dialog box.
ä To set member selection options:
1 Select File, then Preferences.
2 Click the Planning icon and select Application Settings.
3 In Show Alias in Member Selection, select Yes or No.
4 In Show Description in Member Selection, select Yes or No.
5 Click Save.
76 Setting User Preferences

Setting Workflow OptionsIn Workflow Options, you control the display of:
l Whether to display members’ names (which may be cryptic) or their aliases, if they havethem
l Whether planning units that are not started are displayed with those that are started
ä To set display options in workflow tasks:
1 Select File, then Preferences.
2 Click the Planning icon and select Application Settings.
3 Under Workflow Options, select Yes to set display preferences:
l Show Planning Units As Aliases: Displays members’ aliases instead of their names onManage Process pages
l Show Planning Units That Are Not Started: Displays planning units that are started and notstarted. (This option affects only the flat list view, not the tree list view.)
4 Click Save.
Setting Preferences for Display OptionsIn the Preferences page, use the Display Options tab to:
l Change how numbers display in data forms. See “Changing the Formatting of Numbers”on page 78.
l Set aspects of page display. See “Remembering the Last Page Selected” on page 79,“Enabling Search with a Large Number of Pages” on page 80, and “Indenting Memberson the Page Drop-Down List” on page 79.
l Remember the most recent page visited. See “Remembering the Most Recent Page Visited”on page 80.
l Enable warning for large data forms. See “Enabling Warnings for Large Data Forms” onpage 80.
l For administrators only: Set how many members to display on each page of the Dimensionspage. See “Showing Records on the Dimensions and Assign Access Pages” on page 81.
l For administrators only: Set how many users and groups display on each Assign Accesspage.
l Increase the Planning interface contrast. See “Viewing the Interface in Higher Contrast” onpage 81.
l For administrators only: Select a style for the UI.
l Enlarge the screen text size. See “Setting Text Size” on page 81.
l Set the display of dates. See “Setting the Date Format” on page 82.
Setting Preferences for Display Options 77

Note: To reset an option to the value set by an administrator, select Use Application Default.
Changing the Formatting of NumbersOn the Preferences page, you can change the formatting of numbers in the Display Options tab.Your selections apply to all currencies, in all data forms you have access to in the currentapplication. These choices override the settings for individual currencies set by youradministrator.
If you select Currency Setting, the currency values in the data form are displayed using theformatting initially set for individual currencies. If you select another option, your selectionapplies to all currencies, in all data forms to which you have access in the current application.
You can control the display of:
l The thousands separator (none, comma, dot, or space)
l The decimal separator (dot or comma)
l The display of negative numbers (a minus sign before or after the number, or the numbersurrounded by parentheses)
l The displayed color for negative numbers (black or red)
ä To change the formatting of displayed numbers:
1 Select File, then Preferences.
2 Click the Planning icon and select Display Options.
3 Under Number Formatting, select options, as summarized in this table:
Option Example
Thousands Separator None: 1000
Comma: 1,000
Dot: 1.000
Space: 1 000
You can enter values with or without a thousands separator.
Decimal Separator Dot: 1000.00
Comma: 1000,00
You can enter values with or without a decimal separator.
Negative Sign Prefixed Minus: -1000
Suffixed Minus: 1000-
Parentheses: (1000)
Negative Color Black: Negative numbers are black
Red: Negative numbers are red
4 Click Save.
78 Setting User Preferences

Note: Formatting selections take effect when you click outside the cell. If you select a settingother than Use Application Default for the thousands separator or the decimal separator,you must change both separators with the Use Application Default option. You cannotselect the same option for the thousands and decimal separators. See also “EnteringPercentage Values” on page 31.
Remembering the Last Page SelectedThis option sets members from the page of one data form to that of other data forms. The mostrecently used members of the last data form you use are compared to that of the next data formyou select. Where members match, their names display in the next selected data form.
ä To remember the last page selected:
1 Select File, then Preferences.
2 Click the Planning icon and select Display Options.
3 Under Page Options, select an option:
l Yes: Remember selected page members
l No: Disable this option
l Use Application Default: Use the application’s default setting
4 Click Save.
This setting also applies to future sessions for the current application.
If a business rule has runtime prompts and Use Members on Forms is selected, the defaultmember on the runtime prompt window matches the current member in the page and the POVaxes of the open data form. Use Members on Forms does not work unless Remember selectedpage members is checked. See “About Launching Business Rules” on page 43.
Indenting Members on the Page Drop-Down List
ä To set how displayed members are indented on the Page drop-down list:
1 Select File, then Preferences.
2 Click the Planning icon and select Display Options.
3 Under Page Options, for Indentation of Members on Page, select an option listed in this table:
Option Description
Indent level 0 members only Indent only the bottom-most members (the default)
Indent based on hierarchy Indent members based on their hierarchy level
Do no indent Display members as a flat, sequential list
4 Click Save.
Setting Preferences for Display Options 79

Enabling Search with a Large Number of PagesWhen working with multiple pages, you can select among them easily with Search. Planningadds a drop-down list to the data form when the number of pages exceeds a specified value.
ä To set the number of members that activate a search list on the data form:
1 Select File, then Preferences.
2 Click the Planning icon and select Display Options.
3 Under Page Options, enter a value in Allow Search When Number of Pages Exceeds.
When the number of pages reaches the specified value, a drop-down list and displays in thedata form, indicating that you can search. See “Navigating in Data Forms” on page 33.
4 Click Save.
Remembering the Most Recent Page VisitedYou can have Planning remember the last page you viewed before logging out. The next timeyou log in, you go to that page.
ä To remember the most recent page visited:
1 Select File, then Preferences.
2 Click the Planning icon and select Display Options.
3 In Other Options, select Yes for Remember most recent page visited.
Enabling Warnings for Large Data FormsBecause unusually large data forms may require significant time to open, you can choose todisplay a warning when opening data forms that are larger than a specified number of cells.
When you try to open a data form that is beyond the specified size limit, Planning displays awarning about the time needed to open the data form. You can choose whether to open it.
ä To specify the number of cells at which the warning displays:
1 Select File, then Preferences.
2 Click the Planning icon and select Display Options.
3 In Other Options, enter a number in Warn If Data Form Larger Than Cells Specified.
4 Click Save.
If the administrator has assigned a value, this value displays in the text box.
80 Setting User Preferences

Showing Records on the Dimensions and Assign AccessPagesAdministrators can set how many records display on each page of the Dimensions and AssignAccess pages.
ä To set the number of records displayed:
1 Select File, then Preferences.
2 Click the Planning icon and select Display Options.
3 In Other Options:
l To set the number of members displayed on the Dimensions page: Enter a number in Showthe Specified Members on Each Dimensions Page.
l To set the number of users or groups displayed on the Assign Access page: Enter a numberin Show the Specified Records on Each Assign Access Page.
4 Click Save.
Viewing the Interface in Higher ContrastFor better accessibility, you can view the Planning interface in higher contrast. The highercontrast lasts only for the current session.
ä To set higher contrast for the interface:
1 Select File, then Preferences.
2 Click the Planning icon and select Display Options.
3 For UI Theme, select High Contrast.
4 Click Save.
Setting Text SizeThe Text Size option lets you enlarge the screen text size for the current session. When you logoff, the font size returns to Normal.
ä To set text size:
1 Select File, then Preferences.
2 Click the Planning icon and select Display Options.
3 For Text Size, select Normal, Large, Larger, or Largest.
4 Click Save.
Setting Preferences for Display Options 81

Setting the Date FormatDate format sets how dates display in Planning. Administrators can set the date format, andusers can change the setting to determine how dates display when they work in data forms andtask lists.
ä To set the date format:
1 Select File, then Preferences.
2 Click the Planning icon and select Display Options.
3 For Date Format, select MM-DD-YYYY, DD-MM-YYYY, YYYY-MM-DD, or Automatically Detect (to use yoursystem’s locale settings).
4 Click Save.
Setting Preferences for Printing OptionsThe data form designer sets data forms' printing options. You can accept the default settings orset your own options for creating PDF files. To print to a PDF file, you must have Adobe AcrobatReader installed on your computer.
You set printing options directly from the data form when you are ready to print. Or, you canuse Preferences to set printing options, which apply to all data forms to which you have accesspermissions.
Note: To reset an option to the value your administrator set, select Use Application Default.
ä To apply print options for printing a data form to a PDF file:
1 Select File, then Preferences.
2 Click the Planning icon and select Printing Options.
See “Printing Data” on page 41.
3 Set PDF options, summarized in this table:
Option Action
Format data Applies number format settings from the data form.
Apply precision Applies the data form’s precision settings to the displayed data. If the data form displayshigh precision numbers (numbers with many digits to the right of the decimal point),consider limiting precision in the PDF file.
Include supportingdetail
Includes supporting detail in extra rows:
l Normal Order: inserts the Supporting Detail in the same order in which it displays inthe Supporting Detail page, after the member that it is associated with.
82 Setting User Preferences

Option Action
l Reverse Order: inserts the Supporting Detail before the member it is associated with,and the Supporting Detail entries are reversed. Supporting Detail for children isdisplayed above their parents, and the order of siblings is preserved.
Show accountannotations
Shows the data form annotations. If the data form designer enables account annotations,this option displays the annotations.
Show cell text Shows associated text notes.
Show attribute members Shows attribute members that are assigned to the data form.
Show currency codes If the data form supports multiple currencies per entity, shows currency codes.
4 Click Save.
The settings are saved and applied to all data forms that you can access.
Setting Preferences for User VariablesAdministrators can set up user variables, which help you navigate large data forms. User variablesfilter the members displayed on data forms, letting you focus on those members you areinterested in, such as your own department's expenses.
For example, your administrator can create a data form with entities on the rows and a uservariable called Department. You can limit the number of rows displayed on the data form byselecting a member for the Department user variable, such as Sales. Later, you can select anothervalue for Department, such as Marketing.
You can set variables in preferences or directly in data forms. See “Dynamically Setting UserVariables” on page 32.
ä To set preferences for user variables:
1 Select File, then Preferences.
2 Click the Planning icon and select User Variable Options.
If a user variable is set, an entry displays in Selected Member.
3 To select members, click .
4 Select members from the left.
If you cannot access an entity, the check box does not display.
Click or to expand or collapse the list. To select all members, select the check box in frontof Members In.
5 In Member Selection, select a member:
l To select, click .
l To remove, click .
Setting Preferences for User Variables 83

l To remove all members, click .
6 Click Submit.
7 In User Variable Options, click Save.
84 Setting User Preferences

11Frequently Asked Questions
This topic provides answers to common questions about using Planning.
How can I change from one application to another?
Simply select another application. See “Logging on to EPM Workspace” on page 10.
What audit capabilities does the system provide?
When you change the state of a planning unit, add an annotation that explains what you changedand why. You can use annotations to create a written history or audit trail of a plan’s evolution.Administrators can also set up audit trails for certain application changes.
How can I design a data form?
Administrators or data form designers can design a variety of data forms that let users work withtheir planning data. Users see only the data forms and the data to which they have access.
Can I change how my data form displays?
Yes. Select File, then Preferences, click the Planning icon, and select Display Options to setoptions for number formatting, page selection, printing, and other options.
In a large hierarchy, how can I find specific members?
You can set the number of members that enable a search and find feature, and search up or downthe hierarchy by member name or alias to find members. See “Enabling Search with a LargeNumber of Pages” on page 80 and “Navigating in Data Forms” on page 33.
Can I cut, paste, and move data when I'm entering data?
Yes, you can use the Copy and Paste shortcuts or select a command from the Edit menu: Adjust,Cut, Copy, or Paste. You can work with multiple cells simultaneously.
How can I easily enter values across multiple cells?
Planning can allocate values across cells. For example, select multiple cells and select Adjust Datato increase or decrease their values by a certain percentage. See Chapter 6, “Adjusting andSpreading Data.”
85

How can I add a text note or URL link to data?
You can add comments or a URL link to accounts if the feature is enabled and you have writeaccess to the members (account, entity, scenario, and version). For example, to create a link toa spreadsheet file on a shared server, you might enter: file://C:/BudgetDocs/Timeline.xls where C represents the server's drive. See “Using Account Annotations and URLLinks” on page 37.
If your administrator selected the Enable Cell Level Document property for the data form, youcan also link a cell to an Oracle Enterprise Performance Management Workspace, Fusion Editiondocument. See “Adding, Replacing, and Viewing Cell-Level Documents ” on page 37.
How can I set up calculations for cells?
Select cells and click Supporting Detail to add text, values, and operators that define how dataaggregates.
See “Working with Supporting Detail” on page 61.
Can I select the language or terminology in which the members display?
Yes, if an administrator sets up multiple alias tables, you can select from among them. Theselected alias table determines how members are displayed in the data form. For example, eachalias table might display members in another language.
The display of aliases in a data form must be enabled as a property.
Select the alias table to use by selecting File, then Preferences. Click the Planning icon, select theApplication Settings tab, and select the alias table under Alias Setting. Planning retains this settingfor subsequent sessions.
How can I replace irrelevant data with no data value?
In a data form, select the cell or range of cells you want to change. Enter #missing, and savethe data form. The cells are saved to the database at the next Refresh.
How can I associate a business rule to a data form?
Only administrators and interactive users can associate business rules to data forms. This enablesothers to launch those business rules.
When should I launch business rules?
Your administrator can set up data forms to automatically launch business rules when you openthe data form. If so, you can skip steps 1 and 2.
ä Before you begin entering data:
1 Select View, then Refresh so you get the latest values from Oracle Essbase.
2 Select Edit, then Launch Rules to start a prepared calculation script.
3 Enter your data into the data form.
86 Frequently Asked Questions

4 Select Edit, then Launch Rules again before you promote the planning unit (in case the database valueswere updated in the meantime).
Why can’t I see the business rule containing a runtime prompt listed on the Select Rule page?
A connection has not been established between Planning and Oracle's Hyperion® Business Rules.Notify your administrator.
How can I see the business rules associated with my page?
Select Edit, then Launch Rules with your data form open to ensure that you are in a data formthat is associated with your business rules.
What is a planning unit?
A planning unit is a slice of data at the intersection of a scenario, a version, and an entity.
How do I promote a planning unit so it can be reviewed?
Change the status of a planning unit to Promote and assign it to the next reviewer by selectingFile, then Workflow, then Manage Process. See “Changing a Planning Unit's Status” on page71.
How can I automatically get notified by e-mail when I become the owner of a planning unit?
Set up Planning to notify you by e-mail when you become the owner of a planning unit. See“Setting Up E-mail” on page 75.
How can I track the approval process of my planning units?
From the Check Status and Manage Process page, you can view the status of a planning unit,including its history, the last action taken, and the dates and times the status changed. See“Viewing a Planning Unit's History” on page 73.
Can I promote an entire area (region, business unit, and so on)?
Areas of an organization—divisions, regions, business units, and products—are represented asentities in Planning. You can promote an entire entity or portions of it.
Can I change my plan after I have promoted it to a reviewer?
After you promote a planning unit, you are no longer its owner, and only the current owner orthe budget administrator can change a plan. To make more changes, get the current owner orbudget administrator to reject or promote the planning unit back to you.
Can I create a copy of my plan for myself so I can compare it to the approved version?
To create a copy of the plan, ask the administrator to set up a “personal” bottom-up version foryou. Before you promote your data, copy it (using Copy Versions) to your personal version,giving you a record of the data before you promote it.
87

Can I read all reviewers’ comments?
You can read all annotations for planning units to which you have access.
Who can review my plan?
Others having access to the planning unit can view and change your plan.
When should I use the Copy Versions option?
Use Copy Versions to:
l Create a copy of the data for your own records. For example, use the copy as a baseline tocompare against future versions of data.
l Create a starting point for subsequent bottom-up versions. For example, copy your FirstPass version to a Second Pass version, and make your changes to it.
What should I do when I can’t run a currency conversion calc script because the error messagetells me the FIX statement cannot contain a dynamic calc member?
Contact your Oracle Hyperion Planning, Fusion Edition administrator if you get this errormessage. It means that the calc script you are trying to run contains a scenario, version, orcurrency that is a dynamic calc member, or that all account members are dynamic for this view.
88 Frequently Asked Questions
Glossary
! See bang character (!).
#MISSING See missing data (#MISSING).
access permissions A set of operations that a user can
perform on a resource.
accessor Input and output data specifications for data
mining algorithms.
account blocking The process by which accounts accept input
data in the consolidated file. Blocked accounts do not
receive their value through the additive consolidation
process.
account eliminations Accounts which have their values set to
zero in the consolidated file during consolidation.
account type How an account's value flows over time, and its
sign behavior. Account type options can include expense,
income, asset, liability, and equity.
accountability map A visual, hierarchical representation of
the responsibility, reporting, and dependency structure of
the accountability teams (also known as critical business
areas) in an organization.
accounts dimension A dimension type that makes accounting
intelligence available. Only one dimension can be defined
as Accounts.
active service A service whose Run Type is set to Start rather
than Hold.
activity-level authorization Defines user access to applications
and the types of activities they can perform on applications,
independent of the data that will be operated on.
ad hoc report An online analytical query created on-the-fly
by an end user.
adapter Software that enables a program to integrate with
data and metadata from target and source systems.
adaptive states Interactive Reporting Web Client level of
permission.
adjustment See journal entry (JE).
Advanced Relational Access The integration of a relational
database with an Essbase multidimensional database so that
all data remains in the relational database and is mapped to
summary-level data residing in the Essbase database.
agent An Essbase server process that starts and stops
applications and databases, manages connections from
users, and handles user-access security. The agent is referred
to as ESSBASE.EXE.
aggregate cell A cell comprising several cells. For example, a
data cell that uses Children(Year) expands to four cells
containing Quarter 1, Quarter 2, Quarter 3, and Quarter 4
data.
aggregate function A type of function, such as sum or
calculation of an average, that summarizes or performs
analysis on data.
aggregate limit A limit placed on an aggregated request line
item or aggregated metatopic item.
aggregate storage database The database storage model
designed to support large-scale, sparsely distributed data
which is categorized into many, potentially large
dimensions. Upper level members and formulas are
dynamically calculated, and selected data values are
aggregated and stored, typically with improvements in
overall aggregation time.
aggregate view A collection of aggregate cells based on the
levels of the members within each dimension. To reduce
calculation time, values are pre-aggregated and stored as
aggregate views. Retrievals start from aggregate view totals
and add up from there.
Glossary 89

aggregation The process of rolling up and storing values in
an aggregate storage database; the stored result of the
aggregation process.
aggregation script In aggregate storage databases only, a file
that defines a selection of aggregate views to be built into an
aggregation.
alias An alternative name. For example, for a more easily
identifiable column descriptor you can display the alias
instead of the member name.
alias table A table that contains alternate names for
members.
alternate hierarchy A hierarchy of shared members. An
alternate hierarchy is based upon an existing hierarchy in a
database outline, but has alternate levels in the dimension.
An alternate hierarchy allows the same data to be seen from
different points of view.
ancestor A branch member that has members below it. For
example, the members Qtr2 and 2006 are ancestors of the
member April.
appender A Log4j term for destination.
application (1) A software program designed to run a specific
task or group of tasks such as a spreadsheet program or
database management system. (2) A related set of
dimensions and dimension members that are used to meet
a specific set of analytical and/or reporting requirements.
application currency The default reporting currency for the
application.
area A predefined set of members and values that makes up
a partition.
arithmetic data load A data load that performs operations on
values in the database, such as adding 10 to each value.
artifact An individual application or repository item; for
example, scripts, forms, rules files, Interactive Reporting
documents, and financial reports. Also known as an object.
assemblies Installation files for EPM System products or
components.
asset account An account type that stores values that
represent a company's assets.
assignment The association of a source and destination in
the allocation model that controls the direction of allocated
costs or revenue flow within Profitability and Cost
Management.
attribute Characteristic of a dimension member. For
example, Employee dimension members may have
attributes of Name, Age, or Address. Product dimension
members can have several attributes, such as a size and
flavor.
attribute association A relationship in a database outline
whereby a member in an attribute dimension describes a
characteristic of a member of its base dimension. For
example, if product 100-10 has a grape flavor, the product
100-10 has the Flavor attribute association of grape. Thus,
the 100-10 member of the Product dimension is associated
with the Grape member of the Flavor attribute dimension.
Attribute Calculations dimension A system-defined dimension
that performs these calculation operations on groups of
members: Sum, Count, Avg, Min, and Max. This dimension
is calculated dynamically and is not visible in the database
outline. For example, using the Avg member, you can
calculate the average sales value for Red products in New
York in January.
attribute dimension A type of dimension that enables analysis
based on the attributes or qualities of dimension members.
attribute reporting A reporting process based on the attributes
of the base dimension members. See also base dimension.
attribute type A text, numeric, Boolean, date, or linked-
attribute type that enables different functions for grouping,
selecting, or calculating data. For example, because the
Ounces attribute dimension has the type numeric, the
number of ounces specified as the attribute of each product
can be used to calculate the profit per ounce for that
product.
authentication Verification of identity as a security measure.
Authentication is typically based on a user name and
password. Passwords and digital signatures are forms of
authentication.
authentication service A core service that manages one
authentication system.
auto-reversing journal A journal for entering adjustments that
you want to reverse in the next period.
90 Glossary

automated stage A stage that does not require human
intervention, for example, a data load.
axis (1) A straight line that passes through a graphic used
for measurement and categorization. (2) A report aspect
used to arrange and relate multidimensional data, such as
filters, pages, rows, and columns. For example, for a data
query in Simple Basic, an axis can define columns for values
for Qtr1, Qtr2, Qtr3, and Qtr4. Row data would be retrieved
with totals in the following hierarchy: Market, Product.
backup A duplicate copy of an application instance.
balance account An account type that stores unsigned values
that relate to a particular point in time.
balanced journal A journal in which the total debits equal the
total credits.
bang character (!) A character that terminates a series of
report commands and requests information from the
database. A report script must be terminated with a bang
character; several bang characters can be used within a
report script.
bar chart A chart that can consist of one to 50 data sets, with
any number of values assigned to each data set. Data sets are
displayed as groups of corresponding bars, stacked bars, or
individual bars in separate rows.
base currency The currency in which daily business
transactions are performed.
base dimension A standard dimension that is associated with
one or more attribute dimensions. For example, assuming
products have flavors, the Product dimension is the base
dimension for the Flavors attribute dimension.
base entity An entity at the bottom of the organization
structure that does not own other entities.
batch calculation Any calculation on a database that is done
in batch; for example, a calculation script or a full database
calculation. Dynamic calculations are not considered to be
batch calculations.
batch file An operating system file that can call multiple
ESSCMD scripts and run multiple sessions of ESSCMD. On
Windows-based systems, batch files have BAT file
extensions. On UNIX, batch files are written as a shell script.
batch loader An FDM component that enables the
processing of multiple files.
batch POV A collection of all dimensions on the user POV of
every report and book in the batch. While scheduling the
batch, you can set the members selected on the batch POV.
batch processing mode A method of using ESSCMD to write
a batch or script file that can be used to automate routine
server maintenance and diagnostic tasks. ESSCMD script
files can execute multiple commands and can be run from
the operating system command line or from within
operating system batch files. Batch files can be used to call
multiple ESSCMD scripts or run multiple instances of
ESSCMD.
block The primary storage unit which is a multidimensional
array representing the cells of all dense dimensions.
block storage database The Essbase database storage model
categorizing and storing data based on the sparsity of data
values defined in sparse dimensions. Data values are stored
in blocks, which exist only for sparse dimension members
for which there are values.
Blocked Account An account that you do not want calculated
in the consolidated file because you want to enter it
manually.
book A container that holds a group of similar Financial
Reporting documents. Books may specify dimension
sections or dimension changes.
book POV The dimension members for which a book is run.
bookmark A link to a reporting document or a Web site,
displayed on a personal page of a user. The two types of
bookmarks are My Bookmarks and image bookmarks.
bounding rectangle The required perimeter that encapsulates
the Interactive Reporting document content when
embedding Interactive Reporting document sections in a
personal page, specified in pixels for height and width or
row per page.
broadcast message A simple text message sent by an
administrator to a user who is logged on to a Planning
application. The message displays information to the user
such as system availability, notification of application
refresh, or application backups.
budget administrator A person responsible for setting up,
configuring, maintaining, and controlling an application.
Has all application privileges and data access permissions.
Glossary 91

build method A method used to modify database outlines.
Choice of a build method is based on the format of data in
data source files.
business process A set of activities that collectively
accomplish a business objective.
business rules Logical expressions or formulas that are
created within an application to produce a desired set of
resulting values.
cache A buffer in memory that holds data temporarily.
calc script A set of commands that define how a database is
consolidated or aggregated. A calculation script may also
contain commands that specify allocation and other
calculation rules separate from the consolidation process.
calculated member in MaxL DML A member designed for
analytical purposes and defined in the optional WITH
section of a MaxL DML query.
calculated member in MaxL DML A member designed for
analytical purposes and defined in the optional WITH
section of a MaxL DML query.
calculation The process of aggregating data, or of running a
calculation script on a database.
Calculation Manager A calculation module with which
Planning, Financial Management, and Essbase users can
design, validate, and administer business rules in a graphical
environment.
calculation status A consolidation status that indicates that
some values or formula calculations have changed. You
must reconsolidate to get the correct values for the affected
entity.
calendar User-defined time periods and their relationship
to each other. Q1, Q2, Q3, and Q4 comprise a calendar or
fiscal year.
cascade The process of creating multiple reports for a subset
of member values.
Catalog pane Displays a list of elements available to the active
section. If Query is the active section, a list of database tables
is displayed. If Pivot is the active section, a list of results
columns is displayed. If Dashboard is the active section, a
list of embeddable sections, graphic tools, and control tools
are displayed.
categories Groupings by which data is organized. For
example, Month.
cause and effect map Depicts how the elements that form
your corporate strategy relate and how they work together
to meet your organization's strategic goals. A Cause and
Effect map tab is automatically created for each Strategy
map.
CDF See custom-defined function (CDF).
CDM See custom-defined macro (CDM).
cell (1) The data value at the intersection of dimensions in
a multidimensional database; the intersection of a row and
a column in a worksheet. (2) A logical group of nodes
belonging to one administrative domain.
cell note A text annotation for a cell in an Essbase database.
Cell notes are a type of LRO.
CHANGED status Consolidation status that indicates data for
an entity has changed.
chart A graphical representation of spreadsheet data. The
visual nature expedites analysis, color-coding, and visual
cues that aid comparisons.
chart template A template that defines the metrics to display
in Workspace charts.
child A member with a parent above it in the database
outline.
choice list A list of members that a report designer can
specify for each dimension when defining the report's point
of view. A user who wants to change the point of view for a
dimension that uses a choice list can select only the members
specified in that defined member list or those members that
meet the criteria defined in the function for the dynamic list.
clean block A data block that where the database is fully
calculated, if a calculation script calculates all dimensions at
once, or if the SET CLEARUPDATESTATUS command is
used in a calculation script.
cluster An array of servers or databases that behave as a
single resource which share task loads and provide failover
support; eliminates one server or database as a single point
of failure in a system.
clustered bar charts Charts in which categories are viewed
side-by-side; useful for side-by-side category analysis; used
only with vertical bar charts.
92 Glossary

code page A mapping of bit combinations to a set of text
characters. Different code pages support different sets of
characters. Each computer contains a code page setting for
the character set requirements of the language of the
computer user. In the context of this document, code pages
map characters to bit combinations for non-Unicode
encodings. See also encoding.
column A vertical display of information in a grid or table.
A column can contain data from one field, derived data from
a calculation, or textual information.
committed access An Essbase Kernel Isolation Level setting
that affects how Essbase handles transactions. Under
committed access, concurrent transactions hold long-term
write locks and yield predictable results.
computed item A virtual column (as opposed to a column
that is physically stored in the database or cube) that can be
calculated by the database during a query, or by Interactive
Reporting Studio in the Results section. Computed items
are calculations of data based on functions, data items, and
operators provided in the dialog box and can be included in
reports or reused to calculate other data.
configuration file The security platform relies on XML
documents to be configured by the product administrator
or software installer. The XML document must be modified
to indicate meaningful values for properties, specifying
locations and attributes pertaining to the corporate
authentication scenario.
connection file See Interactive Reporting connection file
(.oce).
consolidated file (Parent) A file into which all of the business
unit files are consolidated; contains the definition of the
consolidation.
consolidation The process of aggregating data from
dependent entities to parent entities. For example, if the
dimension Year consists of the members Qtr1, Qtr2, Qtr3,
and Qtr4, its consolidation is Year.
consolidation file (*.cns) The consolidation file is a graphical
interface that enables you to add, delete or move Strategic
Finance files in the consolidation process using either a
Chart or Tree view. It also enables you to define and modify
the consolidation.
consolidation rule Identifies the rule that is executed during
the consolidation of the node of the hierarchy. This rule can
contain customer specific formulas appropriate for the
correct consolidation of parent balances. Elimination
processing can be controlled within these rules.
content Information stored in the repository for any type of
file.
content browser A Component that allows users to Browse
and select content to be placed in a Workspace Page .
context variable A variable that is defined for a particular task
flow to identify the context of the taskflow instance.
contribution The value added to a parent from a child entity.
Each child has a contribution to its parent.
controls group Used in FDM to maintain and organize
certification and assessment information, especially helpful
for meeting Sarbanes-Oxley requirements.
conversion rate See exchange rate.
cookie A segment of data placed on your computer by a Web
site.
correlated subqueries Subqueries that are evaluated once for
every row in the parent query; created by joining a topic item
in the subquery with a topic in the parent query.
critical business area (CBA) An individual or a group
organized into a division, region, plant, cost center, profit
center, project team, or process; also called accountability
team or business area.
critical success factor (CSF) A capability that must be
established and sustained to achieve a strategic objective;
owned by a strategic objective or a critical process and is a
parent to one or more actions.
crosstab reporting Categorizes and summarizes data in table
format. The table cells contain summaries of the data that
fit within the intersecting categories. For example, a crosstab
report of product sales information could show size
attributes, such as Small and Large, as column headings and
color attributes, such as Blue and Yellow, as row headings.
The cell in the table where Large and Blue intersect could
contain the total sales of all Blue products that are sized
Large.
cube A block of data that contains three or more
dimensions. An Essbase database is a cube.
Glossary 93

cube deployment In Essbase Studio, the process of setting load
options for a model to build an outline and load data into
an Essbase application and database.
cube schema In Essbase Studio, the metadata elements, such
as measures and hierarchies, representing the logical model
of a cube.
currency conversion A process that converts currency values
in a database from one currency into another. For example,
to convert one U. S. dollar into the European euro, the
exchange rate (for example, 0.923702) is multiplied with the
dollar (1* 0.923702). After conversion, the European euro
amount is .92.
Currency Overrides In any input period, the selected input
method can be overridden to enable input of that period's
value as Default Currency/Items. To override the input
method, enter a pound sign (#) either before or after the
number.
currency partition A dimension type that separates local
currency members from a base currency, as defined in an
application. Identifies currency types, such as Actual,
Budget, and Forecast.
custom calendar Any calendar created by an administrator.
custom dimension A dimension created and defined by users.
Channel, product, department, project, or region could be
custom dimensions.
custom property A property of a dimension or dimension
member that is created by a user.
custom report A complex report from the Design Report
module, composed of any combination of components.
custom-defined function (CDF) Essbase calculation functions
developed in Java and added to the standard Essbase
calculation scripting language using MaxL. See also custom-
defined macro (CDM).
custom-defined macro (CDM) Essbase macros written with
Essbase calculator functions and special macro functions.
Custom-defined macros use an internal Essbase macro
language that enables the combination of calculation
functions and they operate on multiple input parameters.
See also custom-defined function (CDF).
cycle through To perform multiple passes through a database
while calculating it.
dashboard A collection of metrics and indicators that
provide an interactive summary of your business.
Dashboards enable you to build and deploy analytic
applications.
data cache A buffer in memory that holds uncompressed
data blocks.
data cell See cell.
data file cache A buffer in memory that holds compressed
data (PAG) files.
data form A grid display that enables users to enter data into
the database from an interface such as a Web browser, and
to view and analyze data or related text. Certain dimension
member values are fixed, giving users a specific view into
the data.
data function That computes aggregate values, including
averages, maximums, counts, and other statistics, that
summarize groupings of data.
data load location In FDM, a reporting unit responsible for
submitting source data into the target system. Typically,
there is one FDM data load location for each source file
loaded to the target system.
data load rules A set of criteria that determines how to load
data from a text-based file, a spreadsheet, or a relational data
set into a database.
data lock Prevents changes to data according to specified
criteria, such as period or scenario.
data mining The process of searching through an Essbase
database for hidden relationships and patterns in a large
amount of data.
data model A representation of a subset of database tables.
data value See cell.
database connection File that stores definitions and
properties used to connect to data sources and enables
database references to be portable and widely used.
94 Glossary

date measure In Essbase, a member tagged as “Date” in the
dimension where measures are represented. The cell values
are displayed as formatted dates. Dates as measures can be
useful for types of analysis that are difficult to represent
using the Time dimension. For example, an application may
need to track acquisition dates for a series of capital assets,
but the acquisition dates span too large a period to allow for
feasible Time dimension modeling. See also typed measure.
Default Currency Units Define the unit scale of data. For
example, if you select to define your analysis in Thousands,
and enter “10”, this is interpreted as “10,000”.
dense dimension In block storage databases, a dimension
likely to contain data for every combination of dimension
members. For example, time dimensions are often dense
because they can contain all combinations of all members.
Contrast with sparse dimension.
dependent entity An entity that is owned by another entity in
the organization.
derived text measure In Essbase Studio, a text measure whose
values are governed by a predefined rule expressed as a
range. For example, a derived text measure, called "Sales
Performance Index," based on a measure Sales, could
consist of the values "High," "Medium," and "Low." This
derived text measure is defined to display "High,"
"Medium," and "Low" depending on the range in which the
corresponding sales values fall. See also text measure.
descendant Any member below a parent in the database
outline. In a dimension that includes years, quarters, and
months, the members Qtr2 and April are descendants of the
member Year.
Design Report An interface in Web Analysis Studio for
designing custom reports, from a library of components.
destination (1) For Business Rules and Calculation Manager,
an intersection within the database where allocated values
are stored. (2) Within a Profitability and Cost Management
assignment, the receiving point for allocated values.
destination currency The currency to which balances are
converted. You enter exchange rates and convert from the
source currency to the destination currency. For example,
when you convert from EUR to USD, the destination
currency is USD.
detail chart A chart that provides the detailed information
that you see in a Summary chart. Detail charts appear in the
Investigate Section in columns below the Summary charts.
If the Summary chart shows a Pie chart, then the Detail
charts below represent each piece of the pie.
dimension A data category used to organize business data for
retrieval and preservation of values. Dimensions usually
contain hierarchies of related members grouped within
them. For example, a Year dimension often includes
members for each time period, such as quarters and months.
dimension build The process of adding dimensions and
members to an Essbase outline.
dimension build rules Specifications, similar to data load rules,
that Essbase uses to modify an outline. The modification is
based on data in an external data source file.
dimension tab In the Pivot section, the tab that enables you
to pivot data between rows and columns.
dimension table (1) A table that includes numerous attributes
about a specific business process. (2) In Essbase Integration
Services, a container in the OLAP model for one or more
relational tables that define a potential dimension in
Essbase.
dimension type A dimension property that enables the use of
predefined functionality. Dimensions tagged as time have a
predefined calendar functionality.
dimensionality In MaxL DML, the represented dimensions
(and the order in which they are represented) in a set. For
example, the following set consists of two tuples of the same
dimensionality because they both reflect the dimensions
(Region, Year): { (West, Feb), (East, Mar) }
direct rate A currency rate that you enter in the exchange
rate table. The direct rate is used for currency conversion.
For example, to convert balances from JPY to USD, In the
exchange rate table, enter a rate for the period/scenario
where the source currency is JPY and the destination
currency is USD.
dirty block A data block containing cells that have been
changed since the last calculation. Upper level blocks are
marked as dirty if their child blocks are dirty (that is, they
have been updated).
display type One of three Web Analysis formats saved to the
repository: spreadsheet, chart, and pinboard.
Glossary 95

dog-ear The flipped page corner in the upper right corner of
the chart header area.
domain In data mining, a variable representing a range of
navigation within data.
drill-down Navigation through the query result set using the
dimensional hierarchy. Drilling down moves the user
perspective from aggregated data to detail. For example,
drilling down can reveal hierarchical relationships between
years and quarters or quarters and months.
drill-through The navigation from a value in one data source
to corresponding data in another source.
driver A driver is an allocation method that describes the
mathematical relationship between the sources that utilize
the driver, and the destinations to which those sources
allocate cost or revenue.
duplicate alias name A name that occurs more than once in
an alias table and that can be associated with more than one
member in a database outline. Duplicate alias names can be
used with duplicate member outlines only.
duplicate member name The multiple occurrence of a member
name in a database, with each occurrence representing a
different member. For example, a database has two
members named “New York.” One member represents New
York state and the other member represents New York city.
duplicate member outline A database outline containing
duplicate member names.
Dynamic Calc and Store members A member in a block storage
outline that Essbase calculates only upon the first retrieval
of the value. Essbase then stores the calculated value in the
database. Subsequent retrievals do not require calculating.
Dynamic Calc members A member in a block storage outline
that Essbase calculates only at retrieval time. Essbase
discards calculated values after completing the retrieval
request.
dynamic calculation In Essbase, a calculation that occurs only
when you retrieve data on a member that is tagged as
Dynamic Calc or Dynamic Calc and Store. The member's
values are calculated at retrieval time instead of being
precalculated during batch calculation.
dynamic hierarchy In aggregate storage database outlines
only, a hierarchy in which members are calculated at
retrieval time.
dynamic member list A system-created named member set
that is based on user-defined criteria. The list is refreshed
automatically whenever it is referenced in the application.
As dimension members are added and deleted, the list
automatically reapplies the criteria to reflect the changes.
dynamic reference A pointer in the rules file to header records
in a data source.
dynamic report A report containing data that is updated when
you run the report.
Dynamic Time Series A process that performs period-to-date
reporting in block storage databases.
dynamic view account An account type indicating that
account values are calculated dynamically from the data that
is displayed.
Eliminated Account An account that does not appear in the
consolidated file.
elimination The process of zeroing out (eliminating)
transactions between entities within an organization.
employee A user responsible for, or associated with, specific
business objects. Employees need not work for an
organization; for example, they can be consultants.
Employees must be associated with user accounts for
authorization purposes.
encoding A method for mapping bit combinations to
characters for creating, storing, and displaying text. Each
encoding has a name; for example, UTF-8. Within an
encoding, each character maps to a specific bit combination;
for example, in UTF-8, uppercase A maps to HEX41. See
also code page and locale.
ending period A period enabling you to adjust the date range
in a chart. For example, an ending period of “month”,
produces a chart showing information through the end of
the current month.
Enterprise View An Administration Services feature that
enables management of the Essbase environment from a
graphical tree view. From Enterprise View, you can operate
directly on Essbase artifacts.
entity A dimension representing organizational units.
Examples: divisions, subsidiaries, plants, regions, products,
or other financial reporting units.
96 Glossary

Equity Beta The riskiness of a stock, measured by the
variance between its return and the market return, indicated
by an index called “beta”. For example, if a stock's return
normally moves up or down 1.2% when the market moves
up or down 1%, the stock has a beta of 1.2.
essbase.cfg An optional configuration file for Essbase.
Administrators may edit this file to customize Essbase
Server functionality. Some configuration settings may also
be used with Essbase clients to override Essbase Server
settings.
EssCell A function entered into a cell in Essbase Spreadsheet
Add-in to retrieve a value representing an intersection of
specific Essbase database members.
ESSCMD A command-line interface for performing Essbase
operations interactively or through batch script files.
ESSLANG The Essbase environment variable that defines the
encoding used to interpret text characters. See also
encoding.
ESSMSH See MaxL Shell.
exceptions Values that satisfy predefined conditions. You
can define formatting indicators or notify subscribing users
when exceptions are generated.
exchange rate A numeric value for converting one currency
to another. For example, to convert 1 USD into EUR, the
exchange rate of 0.8936 is multiplied with the U.S. dollar.
The European euro equivalent of $1 is 0.8936.
exchange rate type An identifier for an exchange rate.
Different rate types are used because there may be multiple
rates for a period and year. Users traditionally define rates
at period end for the average rate of the period and for the
end of the period. Additional rate types are historical rates,
budget rates, forecast rates, and so on. A rate type applies to
one point in time.
expense account An account that stores periodic and year-
to-date values that decrease net worth if they are positive.
Extensible Markup Language (XML) A language comprising a set
of tags used to assign attributes to data that can be
interpreted between applications according to a schema.
external authentication Logging on to Oracle's Hyperion
applications with user information stored outside the
applications, typically in a corporate directory such as
MSAD or NTLM.
externally triggered events Non-time-based events for
scheduling job runs.
Extract, Transform, and Load (ETL) Data source-specific
programs for extracting data and migrating it to
applications.
extraction command An Essbase reporting command that
handles the selection, orientation, grouping, and ordering
of raw data extracted from a database; begins with the less
than (<) character.
fact table The central table in a star join schema,
characterized by a foreign key and elements drawn from a
dimension table. This table typically contains numeric data
that can be related to all other tables in the schema.
Favorites gadget Contains links to Reporting and Analysis
documents and URLs.
field An item in a data source file to be loaded into an
Essbase database.
file delimiter Characters, such as commas or tabs, that
separate fields in a data source.
filter A constraint on data sets that restricts values to specific
criteria; for example, to exclude certain tables, metadata, or
values, or to control access.
flow account An unsigned account that stores periodic and
year-to-date values.
folder A file containing other files for the purpose of
structuring a hierarchy.
footer Text or images at the bottom of report pages,
containing dynamic functions or static text such as page
numbers, dates, logos, titles or file names, and author
names.
format Visual characteristics of documents or report
objects.
format string In Essbase, a method for transforming the way
cell values are displayed.
formula A combination of operators, functions, dimension
and member names, and numeric constants calculating
database members.
frame An area on the desktop. There are two main areas: the
navigation and Workspace frames.
Glossary 97

free-form grid An object for presenting, entering, and
integrating data from different sources for dynamic
calculations.
free-form reporting Creating reports by entering dimension
members or report script commands in worksheets.
function A routine that returns values or database members.
gadget Simple, specialized, lightweight applications that
provide easy viewing of EPM content and enable access to
core Reporting and Analysis functionality.
genealogy data Additional data that is optionally generated
after allocation calculations. This data enables reporting on
all cost or revenue flows from start to finish through all
allocation steps.
generation A layer in a hierarchical tree structure that defines
member relationships in a database. Generations are
ordered incrementally from the top member of the
dimension (generation 1) down to the child members. Use
the unique generation name to identify a layer in the
hierarchical tree structure.
generic jobs Non-SQR Production Reporting or non-
Interactive Reporting jobs.
global report command A command in a running report script
that is effective until replaced by another global command
or the file ends.
grid POV A means for specifying dimension members on a
grid without placing dimensions in rows, columns, or page
intersections. A report designer can set POV values at the
grid level, preventing user POVs from affecting the grid. If
a dimension has one grid value, you put the dimension into
the grid POV instead of the row, column, or page.
group A container for assigning similar access permissions
to multiple users.
GUI Graphical user interface
head up display A mode that shows your loaded Smart Space
desktop including the background image above your
Windows desktop.
highlighting Depending on your configuration, chart cells or
ZoomChart details may be highlighted, indicating value
status: red (bad), yellow (warning), or green (good).
Historical Average An average for an account over a number
of historical periods.
holding company An entity that is part of a legal entity group,
with direct or indirect investments in all entities in the
group.
host A server on which applications and services are
installed.
host properties Properties pertaining to a host, or if the host
has multiple Install_Homes, to an Install_Home. The host
properties are configured from the CMC.
Hybrid Analysis An analysis mapping low-level data stored in
a relational database to summary-level data stored in
Essbase, combining the mass scalability of relational systems
with multidimensional data.
hyperlink A link to a file, Web page, or an intranet HTML
page.
Hypertext Markup Language (HTML) A programming language
specifying how Web browsers display data.
identity A unique identification for a user or group in
external authentication.
image bookmarks Graphic links to Web pages or repository
items.
IMPACTED status Indicates changes in child entities
consolidating into parent entities.
implied share A member with one or more children, but only
one is consolidated, so the parent and child share a value.
import format In FDM, defines the structure of the source file
which enables the loading of a source data file to an FDM
data load location.
inactive group A group for which an administrator has
deactivated system access.
inactive service A service suspended from operating.
INACTIVE status Indicates entities deactivated from
consolidation for the current period.
inactive user A user whose account has been deactivated by
an administrator.
income account An account storing periodic and year-to-
date values that, if positive, increase net worth.
index (1) A method where Essbase uses sparse-data
combinations to retrieve data in block storage databases. (2)
The index file.
98 Glossary

index cache A buffer containing index pages.
index entry A pointer to an intersection of sparse dimensions.
Index entries point to data blocks on disk and use offsets to
locate cells.
index file An Essbase file storing block storage data retrieval
information, residing on disk, and containing index pages.
index page A subdivision in an index file. Contains pointers
to data blocks.
input data Data loaded from a source rather than calculated.
Install_Home A variable for the directory where EPM System
products are installed. Refers to one instance of an EPM
System product when multiple applications are installed on
the same computer.
integration Process that is run to move data between EPM
System products using Shared Services. Data integration
definitions specify the data moving between a source
application and a destination application, and enable the
data movements to be grouped, ordered, and scheduled.
intelligent calculation A calculation method tracking updated
data blocks since the last calculation.
Interactive Reporting connection file (.oce) Files encapsulating
database connection information, including: the database
API (ODBC, SQL*Net, etc.), database software, the
database server network address, and database user name.
Administrators create and publish Interactive Reporting
connection files (.oce).
intercompany elimination See elimination.
intercompany matching The process of comparing balances
for pairs of intercompany accounts within an application.
Intercompany receivables are compared to intercompany
payables for matches. Matching accounts are used to
eliminate intercompany transactions from an
organization's consolidated totals.
intercompany matching report A report that compares
intercompany account balances and indicates if the
accounts are in, or out, of balance.
interdimensional irrelevance A situation in which a dimension
does not intersect with other dimensions. Because the data
in the dimension cannot be accessed from the non-
intersecting dimensions, the non-intersecting dimensions
are not relevant to that dimension.
intersection A unit of data representing the intersection of
dimensions in a multidimensional database; also, a
worksheet cell.
intrastage assignment Assignments in the financial flow that
are assigned to objects within the same stage.
introspection A deep inspection of a data source to discover
hierarchies based on the inherent relationships in the
database. Contrast with scraping.
Investigation See drill-through.
isolation level An Essbase Kernel setting that determines the
lock and commit behavior of database operations. Choices
are: committed access and uncommitted access.
iteration A “pass” of the budget or planning cycle in which
the same version of data is revised and promoted.
Java Database Connectivity (JDBC) A client-server
communication protocol used by Java based clients and
relational databases. The JDBC interface provides a call-
level API for SQL-based database access.
job output Files or reports produced from running a job.
jobs Documents with special properties that can be
launched to generate output. A job can contain Interactive
Reporting, SQR Production Reporting, or generic
documents.
join A link between two relational database tables or topics
based on common content in a column or row. A join
typically occurs between identical or similar items within
different tables or topics. For example, a record in the
Customer table is joined to a record in the Orders table
because the Customer ID value is the same in each table.
journal entry (JE) A set of debit/credit adjustments to account
balances for a scenario and period.
JSP Java Server Pages.
KeyContacts gadget Contains a group of Smart Space users
and provides access to Smart Space Collaborator. For
example, you can have a KeyContacts gadget for your
marketing team and another for your development team.
latest A Spreadsheet key word used to extract data values
from the member defined as the latest time period.
Glossary 99

layer (1) The horizontal location of members in a
hierarchical structure, specified by generation (top down)
or level (bottom up). (2) Position of objects relative to other
objects. For example, in the Sample Basic database, Qtr1 and
Qtr4 are in the same layer, so they are also in the same
generation, but in a database with a ragged hierarchy, Qtr1
and Qtr4 might not be in same layer, though they are in the
same generation.
layout area Used to designate an area on a Workspace Page
where content can be placed.
legend box A box containing labels that identify the data
categories of a dimension.
level A layer in a hierarchical tree structure that defines
database member relationships. Levels are ordered from the
bottom dimension member (level 0) up to the parent
members.
level 0 block A data block for combinations of sparse, level 0
members.
level 0 member A member that has no children.
liability account An account type that stores “point in time”
balances of a company's liabilities. Examples of liability
accounts include accrued expenses, accounts payable, and
long term debt.
life cycle management The process of managing application
information from inception to retirement.
Lifecycle Management Utility A command-line utility for
migrating applications and artifacts.
line chart A chart that displays one to 50 data sets, each
represented by a line. A line chart can display each line
stacked on the preceding ones, as represented by an absolute
value or a percent.
line item detail The lowest level of detail in an account.
lineage The relationship between different metadata
elements showing how one metadata element is derived
from one or more other metadata elements, ultimately
tracing the metadata element to its physical source. In
Essbase Studio, a lineage viewer displays the relationships
graphically. See also traceability.
link (1) A reference to a repository object. Links can
reference folders, files, shortcuts, and other links. (2) In a
task flow, the point where the activity in one stage ends and
another begins.
link condition A logical expression evaluated by the taskflow
engine to determine the sequence of launching taskflow
stages.
linked data model Documents that are linked to a master copy
in a repository.
linked partition A shared partition that enables you to use a
data cell to link two databases. When a user clicks a linked
cell in a worksheet, Essbase opens a new sheet displaying the
dimensions in the linked database. The user can then drill
down those dimensions.
linked reporting object (LRO) A cell-based link to an external
file such as cell notes, URLs, or files with text, audio, video,
or pictures. (Only cell notes are supported for Essbase LROs
in Financial Reporting.) Contrast with local report object.
local currency An input currency type. When an input
currency type is not specified, the local currency matches
the entity's base currency.
local report object A report object that is not linked to a
Financial Reporting report object in Explorer. Contrast with
linked reporting object (LRO).
local results A data model's query results. Results can be used
in local joins by dragging them into the data model. Local
results are displayed in the catalog when requested.
locale A computer setting that specifies a location's
language, currency and date formatting, data sort order, and
the character set encoding used on the computer. Essbase
uses only the encoding portion. See also encoding and
ESSLANG.
locale header record A text record at the beginning of some
non-Unicode-encoded text files, such as scripts, that
identifies the encoding locale.
location alias A descriptor that identifies a data source. The
location alias specifies a server, application, database, user
name, and password. Location aliases are set by DBAs at the
database level using Administration Services Console,
ESSCMD, or the API.
locked A user-invoked process that prevents users and
processes from modifying data.
100 Glossary

locked data model Data models that cannot be modified by a
user.
LOCKED status A consolidation status indicating that an
entity contains data that cannot be modified.
Log Analyzer An Administration Services feature that enables
filtering, searching, and analysis of Essbase logs.
logic group In FDM, contains one or more logic accounts
that are generated after a source file is loaded into FDM.
Logic accounts are calculated accounts that are derived from
the source data.
LRO See linked reporting object (LRO).
managed server An application server process running in its
own Java Virtual Machine (JVM).
manual stage A stage that requires human intervention to
complete.
Map File Used to store the definition for sending data to or
retrieving data from an external database. Map files have
different extensions (.mps to send data; .mpr to retrieve
data).
Map Navigator A feature that displays your current position
on a Strategy, Accountability, or Cause and Effect map,
indicated by a red outline.
Marginal Tax Rate Used to calculate the after-tax cost of debt.
Represents the tax rate applied to the last earned income
dollar (the rate from the highest tax bracket into which
income falls) and includes federal, state and local taxes.
Based on current level of taxable income and tax bracket,
you can predict marginal tax rate.
Market Risk Premium The additional rate of return paid over
the risk-free rate to persuade investors to hold “riskier”
investments than government securities. Calculated by
subtracting the risk-free rate from the expected market
return. These figures should closely model future market
conditions.
master data model An independent data model that is
referenced as a source by multiple queries. When used,
“Locked Data Model” is displayed in the Query section's
Content pane; the data model is linked to the master data
model displayed in the Data Model section, which an
administrator may hide.
mathematical operator A symbol that defines how data is
calculated in formulas and outlines. Can be any of the
standard mathematical or Boolean operators; for example,
+, -, *, /, and %.
MaxL The multidimensional database access language for
Essbase, consisting of a data definition language (MaxL
DDL) and a data manipulation language (MaxL DML). See
also MaxL DDL, MaxL DML, and MaxL Shell.
MaxL DDL Data definition language used by Essbase for batch
or interactive system-administration tasks.
MaxL DML Data manipulation language used in Essbase for
data query and extraction.
MaxL Perl Module A Perl module (essbase.pm) that is part of
Essbase MaxL DDL. This module can be added to the Perl
package to provide access to Essbase databases from Perl
programs.
MaxL Script Editor A script-development environment in
Administration Services Console. MaxL Script Editor is an
alternative to using a text editor and the MaxL Shell for
administering Essbase with MaxL scripts.
MaxL Shell An interface for passing MaxL statements to
Essbase Server. The MaxL Shell executable file is located in
the Essbase bin directory (UNIX: essmsh, Windows:
essmsh.exe).
MDX (multidimensional expression) The language that give
instructions to OLE DB for OLAP- compliant databases, as
SQL is used for relational databases. When you build the
OLAPQuery section's Outliner, Interactive Reporting
Clients translate requests into MDX instructions. When you
process the query, MDX is sent to the database server, which
returns records that answer your query. See also SQL
spreadsheet.
measures Numeric values in an OLAP database cube that are
available for analysis. Measures are margin, cost of goods
sold, unit sales, budget amount, and so on. See also fact
table.
member A discrete component within a dimension. A
member identifies and differentiates the organization of
similar units. For example, a time dimension might include
such members as Jan, Feb, and Qtr1.
Glossary 101

member list A named group, system- or user-defined, that
references members, functions, or member lists within a
dimension.
member load In Integration Services, the process of adding
dimensions and members (without data) to Essbase
outlines.
member selection report command A type of Report Writer
command that selects member ranges based on outline
relationships, such as sibling, generation, and level.
member-specific report command A type of Report Writer
formatting command that is executed as it is encountered
in a report script. The command affects only its associated
member and executes the format command before
processing the member.
merge A data load option that clears values only from the
accounts specified in the data load file and replaces them
with values in the data load file.
metadata A set of data that defines and describes the
properties and attributes of the data stored in a database or
used by an application. Examples of metadata are
dimension names, member names, properties, time
periods, and security.
metadata elements Metadata derived from data sources and
other metadata that is stored and cataloged for Essbase
Studio use.
metadata sampling The process of retrieving a sample of
members in a dimension in a drill-down operation.
metadata security Security set at the member level to restrict
users from accessing certain outline members.
metaoutline In Integration Services, a template containing
the structure and rules for creating an Essbase outline from
an OLAP model.
metric A numeric measurement computed from business
data to help assess business performance and analyze
company trends.
migration The process of copying applications, artifacts, or
users from one environment or computer to another; for
example, from a testing environment to a production
environment.
migration audit report A report generated from the migration
log that provides tracking information for an application
migration.
migration definition file (.mdf) A file that contains migration
parameters for an application migration, enabling batch
script processing.
migration log A log file that captures all application migration
actions and messages.
migration snapshot A snapshot of an application migration
that is captured in the migration log.
MIME Type (Multipurpose Internet Mail Extension) An
attribute that describes the data format of an item, so that
the system knows which application should open the object.
A file's mime type is determined by the file extension or
HTTP header. Plug-ins tell browsers what mime types they
support and what file extensions correspond to each mime
type.
mining attribute In data mining, a class of values used as a
factor in analysis of a set of data.
minireport A report component that includes layout,
content, hyperlinks, and the query or queries to load the
report. Each report can include one or more minireports.
minischema A graphical representation of a subset of tables
from a data source that represents a data modeling context.
missing data (#MISSING) A marker indicating that data in the
labeled location does not exist, contains no value, or was
never entered or loaded. For example, missing data exists
when an account contains data for a previous or future
period but not for the current period.
model (1) In data mining, a collection of an algorithm's
findings about examined data. A model can be applied
against a wider data set to generate useful information about
that data. (2) A file or content string containing an
application-specific representation of data. Models are the
basic data managed by Shared Services, of two major types:
dimensional and non-dimensional application objects. (3)
In Business Modeling, a network of boxes connected to
represent and calculate the operational and financial flow
through the area being examined.
monetary A money-related value.
102 Glossary

multidimensional database A method of organizing, storing,
and referencing data through three or more dimensions. An
individual value is the intersection point for a set of
dimensions. Contrast with relational database.
multiload An FDM feature that allows the simultaneous
loading of multiple periods, categories, and locations.
My Workspace Page A page created with content from
multiple sources including documents, URL, and other
content types. Enables a user to aggregate content from
Oracle and non-Oracle sources.
named set In MaxL DML, a set with its logic defined in the
optional WITH section of a MaxL DML query. The named
set can be referenced multiple times in the query.
native authentication The process of authenticating a user
name and password from within the server or application.
nested column headings A report column heading format that
displays data from multiple dimensions. For example, a
column heading that contains Year and Scenario members
is a nested column. The nested column heading shows Q1
(from the Year dimension) in the top line of the heading,
qualified by Actual and Budget (from the Scenario
dimension) in the bottom line of the heading.
NO DATA status A consolidation status indicating that this
entity contains no data for the specified period and account.
non-dimensional model A Shared Services model type that
includes application objects such as security files, member
lists, calculation scripts, and Web forms.
non-unique member name See duplicate member name.
note Additional information associated with a box,
measure, scorecard or map element.
Notifications gadget Shows notification message history
received from other users or systems.
null value A value that is absent of data. Null values are not
equal to zero.
numeric attribute range A feature used to associate a base
dimension member that has a discrete numeric value with
an attribute that represents a value range. For example, to
classify customers by age, an Age Group attribute dimension
can contain members for the following age ranges: 0-20,
21-40, 41-60, and 61-80. Each Customer dimension
member can be associated with an Age Group range. Data
can be retrieved based on the age ranges rather than on
individual age values.
ODBC Open Database Connectivity. A database access
method used from any application regardless of how the
database management system (DBMS) processes the
information.
OK status A consolidation status indicating that an entity has
already been consolidated, and that data has not changed
below it in the organization structure.
OLAP Metadata Catalog In Integration Services, a relational
database containing metadata describing the nature, source,
location, and type of data that is pulled from the relational
data source.
OLAP model In Integration Services, a logical model (star
schema) that is created from tables and columns in a
relational database. The OLAP model is then used to
generate the structure of a multidimensional database.
online analytical processing (OLAP) A multidimensional,
multiuser, client-server computing environment for users
who analyze consolidated enterprise data in real time. OLAP
systems feature drill-down, data pivoting, complex
calculations, trend analysis, and modeling.
Open Database Connectivity (ODBC) Standardized application
programming interface (API) technology that allows
applications to access multiple third-party databases.
organization An entity hierarchy that defines each entity and
their relationship to others in the hierarchy.
origin The intersection of two axes.
outline The database structure of a multidimensional
database, including all dimensions, members, tags, types,
consolidations, and mathematical relationships. Data is
stored in the database according to the structure defined in
the outline.
Glossary 103

outline synchronization For partitioned databases, the process
of propagating outline changes from one database to
another database.
P&L accounts (P&L) Profit and loss accounts. Refers to a
typical grouping of expense and income accounts that
comprise a company's income statement.
page A display of information in a grid or table often
represented by the Z-axis. A page can contain data from one
field, derived data from a calculation, or text.
page file Essbase data file.
page heading A report heading type that lists members
represented on the current page of the report. All data values
on the page have the members in the page heading as a
common attribute.
page member A member that determines the page axis.
palette A JASC compliant file with a .PAL extension. Each
palette contains 16 colors that complement each other and
can be used to set the dashboard color elements.
parallel calculation A calculation option. Essbase divides a
calculation into tasks and calculates some tasks
simultaneously.
parallel data load In Essbase, the concurrent execution of
data load stages by multiple process threads.
parallel export The ability to export Essbase data to multiple
files. This may be faster than exporting to a single file, and
it may resolve problems caused by a single data file
becoming too large for the operating system to handle.
parent adjustments The journal entries that are posted to a
child in relation to its parent.
parents The entities that contain one or more dependent
entities that report directly to them. Because parents are
both entities and associated with at least one node, they have
entity, node, and parent information associated with them.
partition area A sub cube within a database. A partition is
composed of one or more areas of cells from a portion of
the database. For replicated and transparent partitions, the
number of cells within an area must be the same for the data
source and target to ensure that the two partitions have the
same shape. If the data source area contains 18 cells, the data
target area must also contain 18 cells to accommodate the
number of values.
partitioning The process of defining areas of data that are
shared or linked between data models. Partitioning can
affect the performance and scalability of Essbase
applications.
pattern matching The ability to match a value with any or all
characters of an item entered as a criterion. Missing
characters may be represented by wild card values such as a
question mark (?) or an asterisk (*). For example, “Find all
instances of apple” returns apple, but “Find all instances of
apple*” returns apple, applesauce, applecranberry, and so
on.
percent consolidation The portion of a child's values that is
consolidated to its parent.
percent control Identifies the extent to which an entity is
controlled within the context of its group.
percent ownership Identifies the extent to which an entity is
owned by its parent.
performance indicator An image file used to represent
measure and scorecard performance based on a range you
specify; also called a status symbol. You can use the default
performance indicators or create an unlimited number of
your own.
periodic value method (PVA) A process of currency conversion
that applies the periodic exchange rate values over time to
derive converted results.
permission A level of access granted to users and groups for
managing data or other users and groups.
persistence The continuance or longevity of effect for any
Essbase operation or setting. For example, an Essbase
administrator may limit the persistence of user name and
password validity.
personal pages A personal window to repository
information. You select what information to display and its
layout and colors.
personal recurring time events Reusable time events that are
accessible only to the user who created them.
personal variable A named selection statement of complex
member selections.
104 Glossary

perspective A category used to group measures on a
scorecard or strategic objectives within an application. A
perspective can represent a key stakeholder (such as a
customer, employee, or shareholder/financial) or a key
competency area (such as time, cost, or quality).
pie chart A chart that shows one data set segmented in a pie
formation.
pinboard One of the three data object display types.
Pinboards are graphics, composed of backgrounds and
interactive icons called pins. Pinboards require traffic
lighting definitions.
pins Interactive icons placed on graphic reports called
pinboards. Pins are dynamic. They can change images and
traffic lighting color based on the underlying data values and
analysis tools criteria.
pivot The ability to alter the perspective of retrieved data.
When Essbase first retrieves a dimension, it expands data
into rows. You can then pivot or rearrange the data to obtain
a different viewpoint.
planner Planners, who comprise the majority of users, can
input and submit data, use reports that others create,
execute business rules, use task lists, enable e-mail
notification for themselves, and use Smart View.
planning unit A data slice at the intersection of a scenario,
version, and entity; the basic unit for preparing, reviewing,
annotating, and approving plan data.
plot area The area bounded by X, Y, and Z axes; for pie
charts, the rectangular area surrounding the pie.
plug account An account in which the system stores any out
of balance differences between intercompany account pairs
during the elimination process.
post stage assignment Assignments in the allocation model
that are assigned to locations in a subsequent model stage.
POV (point of view) A feature for setting data focus by selecting
members that are not already assigned to row, column, or
page axes. For example, selectable POVs in FDM could
include location, period, category, and target category. In
another example, using POV as a filter in Smart View, you
could assign the Currency dimension to the POV and select
the Euro member. Selecting this POV in data forms displays
data in Euro values.
precalculation Calculating the database prior to user
retrieval.
precision Number of decimal places displayed in numbers.
predefined drill paths Paths used to drill to the next level of
detail, as defined in the data model.
presentation A playlist of Web Analysis documents, enabling
reports to be grouped, organized, ordered, distributed, and
reviewed. Includes pointers referencing reports in the
repository.
preserve formulas User-created formulas kept within a
worksheet while retrieving data.
primary measure A high-priority measure important to your
company and business needs. Displayed in the Contents
frame.
process monitor report Displays a list of locations and their
positions within the FDM data conversion process. You can
use the process monitor report to monitor the status of the
closing process. The report is time-stamped. Therefore, it
can be used to determine to which locations at which time
data was loaded.
product In Shared Services, an application type, such as
Planning or Performance Scorecard.
Production Reporting See SQR Production Reporting.
project An instance of EPM System products grouped
together in an implementation. For example, a Planning
project may consist of a Planning application, an Essbase
cube, and a Financial Reporting server instance.
property A characteristic of an artifact, such as size, type, or
processing instructions.
provisioning The process of granting users and groups
specific access permissions to resources.
proxy server A server acting as an intermediary between
workstation users and the Internet to ensure security.
public job parameters Reusable, named job parameters
created by administrators and accessible to users with
requisite access privileges.
public recurring time events Reusable time events created by
administrators and accessible through the access control
system.
PVA See periodic value method (PVA).
Glossary 105

qualified name A member name in a qualified format that
differentiates duplicate member names in a duplicate
member outline. For example, [Market].[East].[State].
[New York] or [Market].[East].[City].[New York]
query Information requests from data providers. For
example, used to access relational data sources.
query governor An Essbase Integration server parameter or
Essbase server configuration setting that controls the
duration and size of queries made to data sources.
range A set of values including upper and lower limits, and
values falling between limits. Can contain numbers,
amounts, or dates.
reciprocal assignment An assignment in the financial flow
that also has the source as one of its destinations.
reconfigure URL URL used to reload servlet configuration
settings dynamically when users are already logged on to the
Workspace.
record In a database, a group of fields making up one
complete entry. For example, a customer record may
contain fields for name, address, telephone number, and
sales data.
recurring template A journal template for making identical
adjustments in every period.
recurring time event An event specifying a starting point and
the frequency for running a job.
redundant data Duplicate data blocks that Essbase retains
during transactions until Essbase commits updated blocks.
regular journal A feature for entering one-time adjustments
for a period. Can be balanced, balanced by entity, or
unbalanced.
Related Accounts The account structure groups all main and
related accounts under the same main account number. The
main account is distinguished from related accounts by the
first suffix of the account number.
relational database A type of database that stores data in
related two-dimensional tables. Contrast with
multidimensional database.
replace A data load option that clears existing values from
all accounts for periods specified in the data load file, and
loads values from the data load file. If an account is not
specified in the load file, its values for the specified periods
are cleared.
replicated partition A portion of a database, defined through
Partition Manager, used to propagate an update to data
mastered at one site to a copy of data stored at another site.
Users can access the data as though it were part of their local
database.
Report Extractor An Essbase component that retrieves report
data from the Essbase database when report scripts are run.
report object In report designs, a basic element with
properties defining behavior or appearance, such as text
boxes, grids, images, and charts.
report script A text file containing Essbase Report Writer
commands that generate one or more production reports.
Report Viewer An Essbase component that displays complete
reports after report scripts are run.
reporting currency The currency used to prepare financial
statements, and converted from local currencies to
reporting currencies.
repository Stores metadata, formatting, and annotation
information for views and queries.
resources Objects or services managed by the system, such
as roles, users, groups, files, and jobs.
restore An operation to reload data and structural
information after a database has been damaged or
destroyed, typically performed after shutting down and
restarting the database.
restructure An operation to regenerate or rebuild the
database index and, in some cases, data files.
result frequency The algorithm used to create a set of dates to
collect and display results.
review level A Process Management review status indicator
representing the process unit level, such as Not Started, First
Pass, Submitted, Approved, and Published.
Risk Free Rate The rate of return expected from “safer”
investments such as long-term U.S. government securities.
106 Glossary

role The means by which access permissions are granted to
users and groups for resources.
roll-up See consolidation.
root member The highest member in a dimension branch.
RSC services Services that are configured with Remote
Service Configurator, including Repository Service, Service
Broker, Name Service, Event Service, and Job Service.
runtime prompt A variable that users enter or select before a
business rule is run.
sampling The process of selecting a representative portion
of an entity to determine the entity's characteristics. See also
metadata sampling.
saved assumptions User-defined Planning assumptions that
drive key business calculations (for example, the cost per
square foot of office floor space).
scaling Scaling determines the display of values in whole
numbers, tens, hundreds, thousands, millions, and so on.
scenario A dimension for classifying data (for example,
Actuals, Budget, Forecast1, and Forecast2).
scope The area of data encompassed by any Essbase
operation or setting; for example, the area of data affected
by a security setting. Most commonly, scope refers to three
levels of granularity, where higher levels encompass lower
levels. From highest to lowest, these levels are as follows: the
entire system (Essbase Server), applications on Essbase
servers, or databases within Essbase server applications. See
also persistence.
score The level at which targets are achieved, usually
expressed as a percentage of the target.
scorecard Business object that represents the progress of an
employee, strategy element, or accountability element
toward goals. Scorecards ascertain this progress based on
data collected for each measure and child scorecard added
to the scorecard.
scraping An inspection of a data source to derive the most
basic metadata elements from it. Contrast with
introspection.
Search gadget Searches the Reporting and Analysis
repository. The Search gadget looks for a match in the
document keywords and description, which are set when
you import a document.
secondary measure A low-priority measure, less important
than primary measures. Secondary measures do not have
Performance reports but can be used on scorecards and to
create dimension measure templates.
security agent A Web access management provider (for
example, Netegrity SiteMinder) that protects corporate
Web resources.
security platform A framework enabling EPM System
products to use external authentication and single sign-on.
serial calculation The default calculation setting. Divides a
calculation pass into tasks and calculates one task at a time.
services Resources that enable business items to be
retrieved, changed, added, or deleted. Examples:
Authorization and Authentication.
servlet A piece of compiled code executable by a Web server.
shared member A member that shares storage space with
another member of the same name, preventing duplicate
calculation of members that occur multiple times in an
Essbase outline.
Shared Services Registry Part of the Shared Services database,
the Shared Services Registry stores and re-uses information
for most installed EPM System products, including
installation directories, database settings, deployment
settings, computer names, ports, servers, URLs, and
dependent service data.
Shared Workspace Page Workspace Pages shared across an
organization which are stored in a special System folder and
can be accessed by authorized users from the Shared
Workspace Pages Navigate menu.
sibling A child member at the same generation as another
child member and having the same immediate parent. For
example, the members Florida and New York are children
of East and each other's siblings.
single sign-on Ability to access multiple EPM System
products after a single login using external credentials.
smart slice In Smart View, a reusable perspective of a data
source that contains a restricted set of dimensions or
dimension members.
Glossary 107

Smart Space client software Runs on the client's computer and
provides gadgets, instant collaboration and access to the
Reporting and Analysis repository. It is composed of the
Smart Space framework and gadgets.
Smart Space Collaborator A service that enables users or
systems to send messages and share Reporting and Analysis
repository content. The message can take many forms,
including instant message style discussions, meetings, and
toast messages.
smart tags Keywords in Microsoft Office applications that
are associated with predefined actions available from the
Smart Tag menu. In EPM System products, smart tags can
also be used to import Reporting and Analysis content, and
access Financial Management and Essbase functions.
SmartBook gadget Contains documents from the Reporting
and Analysis repository or URLs. All documents are loaded
when the SmartBook is opened so you can access all content
immediately.
SmartCut A link to a repository item, in URL form.
snapshot Read-only data from a specific time.
source currency The currency from which values originate
and are converted through exchange rates to the destination
currency.
sparse dimension In block storage databases, a dimension
unlikely to contain data for all member combinations when
compared to other dimensions. For example, not all
customers have data for all products. Contrast with dense
dimension.
SPF files Printer-independent files created by an SQR
Production Reporting server, containing a representation
of the actual formatted report output, including fonts,
spacing, headers, footers, and so on.
Spotlighter A tool that enables color coding based on selected
conditions.
SQL spreadsheet A data object that displays the result set of
a SQL query.
SQR Production Reporting A specialized programming
language for data access, data manipulation, and creating
SQR Production Reporting documents.
stage A task description that forms one logical step within
a taskflow, usually performed by an individual. A stage can
be manual or automated.
stage action For automated stages, the invoked action that
executes the stage.
staging area A database that you create to meet the needs of
a specific application. A staging area is a snapshot or
restructured version of one or more RDBMSs.
standard dimension A dimension that is not an attribute
dimension.
standard journal template A journal function used to post
adjustments that have common adjustment information for
each period. For example, you can create a standard
template that contains the common account IDs, entity IDs,
or amounts, then use the template as the basis for many
regular journals.
Status bar The status bar at the bottom of the screen displays
helpful information about commands, accounts, and the
current status of your data file.
stored hierarchy In aggregate storage databases outlines only.
A hierarchy in which the members are aggregated according
to the outline structure. Stored hierarchy members have
certain restrictions, for example, they cannot contain
formulas.
strategic objective (SO) A long-term goal defined by
measurable results. Each strategic objective is associated
with one perspective in the application, has one parent, the
entity, and is a parent to critical success factors or other
strategic objectives.
Strategy map Represents how the organization implements
high-level mission and vision statements into lower-level,
constituent strategic goals and objectives.
structure view Displays a topic as a simple list of component
data items.
Structured Query Language A language used to process
instructions to relational databases.
Subaccount Numbering A system for numbering subaccounts
using non-sequential, whole numbers.
subscribe Flags an item or folder to receive automatic
notification whenever the item or folder is updated.
108 Glossary

Summary chart In the Investigates Section, rolls up detail
charts shown below in the same column, plotting metrics at
the summary level at the top of each chart column.
super service A special service used by the
startCommonServices script to start the RSC services.
supervisor A user with full access to all applications,
databases, related files, and security mechanisms for a
server.
supporting detail Calculations and assumptions from which
the values of cells are derived.
suppress rows Excludes rows containing missing values, and
underscores characters from spreadsheet reports.
symmetric multiprocessing (SMP) A server architecture that
enables multiprocessing and multithreading. Performance
is not significantly degraded when a large number of users
connect to an single instance simultaneously.
sync Synchronizes Shared Services and application models.
synchronized The condition that exists when the latest
version of a model resides in both the application and in
Shared Services. See also model.
system extract Transfers data from an application's metadata
into an ASCII file.
tabs Navigable views of accounts and reports in Strategic
Finance.
target Expected results of a measure for a specified period
of time (day, quarter, and so on).
task list A detailed status list of tasks for a particular user.
taskflow The automation of a business process in which
tasks are passed from one taskflow participant to another
according to procedural rules.
taskflow definition Represents business processes in the
taskflow management system. Consists of a network of
stages and their relationships; criteria indicating the start
and end of the taskflow; and information about individual
stages, such as participants, associated applications,
associated activities, and so on.
taskflow instance Represents a single instance of a taskflow
including its state and associated data.
taskflow management system Defines, creates, and manages
the execution of a taskflow including: definitions, user or
application interactions, and application executables.
taskflow participant The resource who performs the task
associated with the taskflow stage instance for both manual
and automated stages.
Taxes - Initial Balances Strategic Finance assumes that the
Initial Loss Balance, Initial Gain Balance and the Initial
Balance of Taxes Paid entries have taken place in the period
before the first Strategic Finance time period.
TCP/IP See Transmission Control Protocol/Internet Protocol
(TCP/IP).
template A predefined format designed to retrieve particular
data consistently.
text list In Essbase, an object that stores text values mapped
to numeric identifiers. Text Lists enable the use of text
measures.
text measure A data type that allows measure values to be
expressed as text. In Essbase, a member tagged as “Text” in
the dimension where measures are represented. The cell
values are displayed as predefined text. For example, the text
measure "Satisfaction Index" may have the values Low,
Medium, and High. See also typed measure, text list, derived
text measure.
time dimension Defines the time period that the data
represents, such as fiscal or calendar periods.
time events Triggers for execution of jobs.
time line viewer An FDM feature that allows a user to view
dates and times of completed process flow steps for specific
locations.
time scale Displays metrics by a specific period in time, such
as monthly or quarterly.
time series reporting A process for reporting data based on a
calendar date (for example, year, quarter, month, or week).
Title bar Displays the Strategic Finance name, the file name,
and the scenario name Version box.
toast message Messages that appear in the lower right corner
of the screen and fade in and out.
token An encrypted identification of one valid user or group
on an external authentication system.
Glossary 109
top and side labels Column and row headings on the top and
sides of a Pivot report.
top-level member A dimension member at the top of the tree
in a dimension outline hierarchy, or the first member of the
dimension in sort order if there is no hierarchical
relationship among dimension members. The top-level
member name is generally the same as the dimension name
if a hierarchical relationship exists.
trace allocations A feature of Profitability and Cost
Management that enables you to visually follow the flow of
financial data, either forwards or backwards, from a single
intersection throughout the model.
trace level Defines the level of detail captured in the log file.
traceability The ability to track a metadata element to its
physical source. For example, in Essbase Studio, a cube
schema can be traced from its hierarchies and measure
hierarchies, to its dimension elements, date/time elements,
and measures, and ultimately, to its physical source
elements.
traffic lighting Color-coding of report cells, or pins based on
a comparison of two dimension members, or on fixed limits.
transformation (1) Transforms artifacts so that they function
properly in the destination environment after application
migration. (2) In data mining, modifies data
(bidirectionally) flowing between the cells in the cube and
the algorithm.
translation See currency conversion.
Transmission Control Protocol/Internet Protocol (TCP/IP) A
standard set of communication protocols linking
computers with different operating systems and internal
architectures. TCP/IP utilities are used to exchange files,
send mail, and store data to various computers that are
connected to local and wide area networks.
transparent login Logs in authenticated users without
launching the login screen.
transparent partition A shared partition that enables users to
access and change data in a remote database as though it is
part of a local database
triangulation A means of converting balances from one
currency to another via a third common currency. In
Europe, this is the euro for member countries. For example,
to convert from French franc to Italian lira, the common
currency is defined as European euro. Therefore, in order
to convert balances from French franc to Italian lira,
balances are converted from French franc to European euro
and from European euro to Italian lira.
triggers An Essbase feature whereby data is monitored
according to user-specified criteria which when met cause
Essbase to alert the user or system administrator.
trusted password A password that enables users
authenticated for one product to access other products
without reentering their passwords.
trusted user Authenticated user.
tuple MDX syntax element that references a cell as an
intersection of a member from each dimension. If a
dimension is omitted, its top member is implied. Examples:
(Jan); (Jan, Sales); ( [Jan], [Sales], [Cola], [Texas], [Actual] )
two-pass An Essbase property that is used to recalculate
members that are dependent on the calculated values of
other members. Two-pass members are calculated during a
second pass through the outline.
typed measure In Essbase, a member tagged as “Text” or
“Date” in the dimension where measures are represented.
The cell values are displayed as predefined text or dates.
unary operator A mathematical indicator (+, -, *, /, %)
associated with an outline member. The unary operator
defines how the member is calculated during a database roll-
up.
Unicode-mode application An Essbase application wherein
character text is encoded in UTF-8, enabling users with
computers set up for different languages to share
application data.
Uniform Resource Locator The address of a resource on the
Internet or an intranet.
unique member name A non-shared member name that exists
only once in a database outline.
unique member outline A database outline that is not enabled
for duplicate member names.
110 Glossary

upgrade The process of replacing an earlier software release
with a current release or replacing one product with
another.
upper-level block A type of data block wherein at least one of
the sparse members is a parent-level member.
user directory A centralized location for user and group
information. Also known as a repository or provider.
user variable Dynamically renders data forms based on a
user's member selection, displaying only the specified
entity. For example, user variable named Department
displays specific departments and employees.
user-defined attribute (UDA) User-defined attribute,
associated with members of an outline to describe a
characteristic of the members. Users can use UDAs to return
lists of members that have the specified UDA associated with
them.
user-defined member list A named, static set of members
within a dimension defined by the user.
validation A process of checking a business rule, report
script, or partition definition against the outline to make
sure that the object being checked is valid. For example, in
FDM, validation rules ensure that certain conditions are
met after data is loaded from FDM to the target application.
value dimension Used to define input value, translated value,
and consolidation detail.
variance Difference between two values (for example,
planned and actual value).
varying attribute An attribute association that changes over
one or more dimensions. It can be used to track a value in
relation to these dimensions; for example, the varying
attribute Sales Representative, associated with the Product
dimension, can be used to track the value Customer Sales
of several different sales representatives in relation to the
Time dimension. Varying attributes can also be used for
member selection, such as finding the Products that a Sales
Representative was responsible for in May.
version Possible outcome used within the context of a
scenario of data. For example, Budget - Best Case and
Budget - Worst Case where Budget is scenario and Best Case
and Worst Case are versions.
view Representation of either a year-to-date or periodic
display of data.
visual cue A formatted style, such as a font or a color, that
highlights specific types of data values. Data values may be
dimension members; parent, child, or shared members;
dynamic calculations; members containing a formula; read
only data cells; read and write data cells; or linked objects.
Web server Software or hardware hosting intranet or
Internet Web pages or Web applications.
weight Value assigned to an item on a scorecard that
indicates the relative importance of that item in the
calculation of the overall scorecard score. The weighting of
all items on a scorecard accumulates to 100%. For example,
to recognize the importance of developing new features for
a product, the measure for New Features Coded on a
developer's scorecard would be assigned a higher weighting
than a measure for Number of Minor Defect Fixes.
wild card Character that represents any single character or
group of characters (*) in a search string.
WITH section In MaxL DML, an optional section of the query
used for creating re-usable logic to define sets or members.
Sets or custom members can be defined once in the WITH
section, and then referenced multiple times during a query.
work flow The steps required to process data from start to
finish in FDM. The workflow consists of Import (loading
data from the GL file), Validate (ensures all members are
mapped to a valid account), Export (loads the mapped
members to the target application), and Check (verifies
accuracy of data by processing data with user-defined
validation rules).
workbook An entire spreadsheet file with many worksheets.
Workspace Page A page created with content from multiple
sources including documents, URL, and other content
types. Enables a user to aggregate content from Oracle and
non-Oracle sources.
write-back The ability for a retrieval client, such as a
spreadsheet, to update a database value.
ws.conf A configuration file for Windows platforms.
wsconf_platform A configuration file for UNIX platforms.
XML See Extensible Markup Language (XML).
Glossary 111

XOLAP An Essbase multidimensional database that stores
only the outline metadata and retrieves all data from a
relational database at query time. XOLAP supports
aggregate storage databases and applications that contain
duplicate member names.
Y axis scale Range of values on Y axis of charts displayed in
Investigate Section. For example, use a unique Y axis scale
for each chart, the same Y axis scale for all Detail charts, or
the same Y axis scale for all charts in the column. Often,
using a common Y axis improves your ability to compare
charts at a glance.
Zero Administration Software tool that identifies version
number of the most up-to-date plug-in on the server.
zoom Sets the magnification of a report. For example,
magnify a report to fit whole page, page width, or percentage
of magnification based on 100%.
ZoomChart Used to view detailed information by enlarging
a chart. Enables you to see detailed numeric information on
the metric that is displayed in the chart.
112 Glossary

Index
Symbols#MISSING
and hiding rows or columns, 26and Smart Lists, 31in entire rows, 38setting when deleting supporting detail, 65suppressing, 38versus zero value, 38writing values, 38
.XLS files, links to in accounts, 37
Aaccessibility
contrast, 81text size, 81
accessing Planning, 10accounts
adding comments to, 37printing annotations, preference, 83spreading data with, 51
Actual_365 property, 53Actual_Actual, weighted average, 54ad hoc analysis, 10ad hoc calculations, 50adding rows, 25addresses, setting up e-mail, 75Adjust button, 49adjusting data values, 49administrative tasks, performing, 12Adobe Acrobat Reader, 41Advanced mode
described, 12entering data, 29launching business rules in, 44opening data forms in, 23switching to, 12tasks in, 17
working with, 12alerts. See task listsalias tables, selecting, 76aliases
displaying, 77searching for, 12, 34setting for process management, 77showing for member selection, 76
Allow Search When Number of Pages Exceeds option,80
Analytic Services. See Essbaseannotations
accounts, 37adding to accounts, 37planning units, 72setting preferences for printing, 83
application owner, sending e-mail to, 76Application Settings tab, 75applications
selecting, 10working with multiple applications, 10
Apply Precision option, 82approval process, tracking for planning units, 87Approve action, 71Approved process state, 70Assign Access page, setting display of records, 81attribute members
printing, 41setting printing preferences, 83
Average property, 53
BBalance property, 52base currency, overriding, 68Basic mode
described, 12entering data, 29
A B C D E F G H I J L M N O P R S T U V W Y Z
Index 113

launching business rules in, 46opening data forms in, 24switching to, 12tasks in, 17working with, 12
blue cells, 29bottom-up versions, copying to, 27business rules
associating with data forms, 86checking execution status, 47completing tasks, 18e-mail notification, 75launching in Basic mode, 46launching in Classic applications, 44launching in Performance Management Architect
applications, 44launching, overview, 43runtime prompts, 45troubleshooting, 87ways to launch, 43when to launch, 86
CCalculate Data Form calc script, 39Calculation Manager business rules
checking execution status, 47entering runtime prompts, 45generating a runtime prompt values file, 45launching from Tools menu, 44
calculations, 62. See also supporting detail andbusiness rules
ad hoc, 50launching from tasks, 46launching overview, 43logic, 38relationship to member properties, 39
calendareffect on spreading data, 51selecting date values, 32
CAPTURE_RTP_ON_JOB_CONSOLE property, 48cell text
and copying versions, 28entering, 36printing, 36, 41, 83
cell-level documents, 37cells, 68. See also data
copying and pasting, 35
currency code, location of, 68currency, changing, 68decreasing and increasing values, 49linking to a document, 37locking, 56locking, examples, 56navigating, 33selecting in Excel, 34selecting ranges, 34Smart Lists, 30tips for adjusting, cutting, copying, or pasting, 85unlocking, 56
Change Status page, 71Clear Cell Details, checking execution status, 47collapsing and expanding view pane, 24color
of cells, 29setting for negative numbers, 78
columnshiding with no data or zeros, 26line breaks, 30moving in, 33setting width of, 25, 26
commas in numbers, 78comments, adding to
account data, 37planning units, 72
completing tasks, 18composite data forms, 30content pane, maximizing, 11, 24contrast, setting, 81Copy Cell Text, 28Copy Data, checking execution status, 47Copy option, 85Copy Supporting Details, 28Copy The Application Owner option, 76Copy Versions option, when to use, 88copying
data, 35plans, 87read-only cells, 35scenarios and versions, 27
Cross Dimension runtime prompt, 45currency
changing for a data cell, 68multiple, 67multiple, reporting on, 68
A B C D E F G H I J L M N O P R S T U V W Y Z
114 Index

preferences for, 78currency codes
location of, 68printing, 41, 83
currency valuesformatting, 78spreading, 55
Cut option, 85
Ddaily average, weighted, 54data
ad hoc calculations, 50adjusting, 49choosing different views of, 33copying and pasting, 35copying into read-only cells, 35cutting, copying, or pasting, 85displayed versus stored values, 39drilling through to source, 40entering in data forms, 29exporting, 39formatting, 78getting the latest, 39number formatting, 78PDF files, formatting, 82precision displayed, 35precision when printing, 41printing, 41recalculating, 43replacing with no data, 86saving, 40selecting, 33setting display of, 78spreading for time periods, 50spreading using Grid Spread, 57spreading using Mass Allocate, 58spreading, with cell locking, 56spreading, with cell locking, examples, 56subtotaling logic, 38writing #MISSING values, 38
Data Display tab, 78data forms
#MISSING in entire rows, 38adding rows, 25adjusting, cutting, copying, or pasting data, 85composite, 30
currency, changing, 68enable size warning, 80enabling search with multiple pages, 80entering data into, 29expanding, 24having no valid members, 23instructions, viewing, 27language, selecting, 86locking values temporarily, 56navigating in, 33opening in Advanced mode, 23opening in Basic mode, 24precision for, 82printing cell text, 36printing to PDF files, 41searching for, 12segments in, 30selecting, 23Smart Lists, 30subtotaling values, 38viewing, 11
data typeand spreading, 51date, 32text, 32
datesetting format, 82values, 32
decimal separator, 78decreasing cell values, 49dependent tasks, 18descriptive tasks, completing, 18detail. See supporting detailDimensions page, setting member display, 81dirty cells, 29disconnected usage, 10Display Only Launchable Rules, Rulesets, and Calc
Scripts option, 44Display Options tab, 77displayed versus stored values, 39distributing data, 50documentation. See online helpdrilling through to source data, 40drop-down lists. See Smart Listsdue dates
e-mail alerts for tasks, 20for task lists, 16
A B C D E F G H I J L M N O P R S T U V W Y Z
Index 115

for tasks, 16status reports, 20
dynamic calc members, with currency conversions,88
dynamic user variables, 32
Ee-mail
alerts for tasks, 20notifications for planning units, 87notifications on launched jobs, 76notifications, setting up and receiving, 76sending to the application owner, 76setting up for workflow notifications, 75
E-mail Address option, 76Edit menu, 85ending a session, 13Entities list, displaying as a tree, 70ERP Integrator, drilling through to source data, 40error messages for currency conversion, 88Essbase, setting values to #MISSING, 65Evenly Split spread type, 57Excel. See Microsoft Excelexecution status of jobs, 47expanding and collapsing
data entry display, 24view pane, 24
exporting data, 39to Microsoft Excel, 39to spreadsheets, shortcut, 12
FFDM, drilling through to source data, 40February, accounting for leap years, 54file types, for URL links, 37Fill spread type, 57Fill time balance property, 53First Pass process state, 69First time balance property, 52FIX statement, in error messages, 88Flow time balance property, 51folders, viewing, 11foreign language, displaying names in, 76Format Data option, 82formatting numbers, 78forms. See data forms
formulas on members, viewing, 34FTP site, links to in accounts, 37
Ggreen lights, in tasks, 16Grid Spread, 57
Hhelp. See online helphiding and showing
rows and columns, 26view pane, 24
hierarchy of supporting detail, 64history, viewing for planning units, 73
IInclude Supporting Detail option, 82increasing cell values, 49Indentation of Members on Page option, 79indentation, in rows, 30indenting members on the Page, 79instructions for data forms, viewing, 27interface
described, 11setting contrast, 81
international date standard, setting format, 82Internet Explorer, 35
Jjob console, 47
Llanguage, selecting, 86launching business rules
in Classic applications, 44in Performance Management Architect
applications, 44overview, 43when to launch, 86
launching Smart View from Planning, 28leap years, accounting for, 54line breaks, in columns, 30linking
to documents or Web sites from cells, 37to files from account annotations, 37
A B C D E F G H I J L M N O P R S T U V W Y Z
116 Index

to other products or Web sites, 12Links menu item, 12local currency
changing, 68entering data in, 67
locking values, temporarily, 56logging off, 13
shortcut button, 12logging on, 10
to multiple applications, 10
MManage Process page, 71Mass Allocations, 58maximizing content area, shortcut for, 11, 24member formulas, viewing, 34member properties
effect of time balance property on spreading, 51effect on calculations, 39
Member Range runtime prompt, 46member selection
for runtime prompts, 45preferences for, 76show description option, 76showing aliases, 76
membersindenting on the Page drop-down, 79message about no valid members, 23null, 49on data forms, 29searching for, 34viewing formulas, 34
menu commands, described, 12menus. See shortcut menusMicrosoft Excel
copying from, 35exporting data to, 39pasting supporting detail, 66selecting cells, 34viewing task list status report, 21
minimizing column width, 26minus sign in numbers, 78modes
Advanced, 12Basic, 12
Move Down option, 65Move Up option, 65
moving around in data forms and cells, 33multiple
alias tables, selecting, 86applications, working with, 10cells, entering values in, 85cells, selecting, 34currencies, working with, 67
Multiple Currencies per Entity option, 67
Nnavigating
data forms and cells, 33Planning, 11
negative numbers, displaying, 78Normal Order setting, 82Not Signed Off process state, 70Not Started
planning units, 77process state, 69
null value, 49numbers. See data
OOffline Planning, 10online help, 13opening a data form having no valid members, 23overriding the base currency, 68overview of Planning, 9
Ppage axis, described, 33Page drop-downs
about, 30creating, 80indenting members on, 79
page members, remembering, 79pages
display of, 79returning to the most recently-used page, 80searching for a large number, 80selecting, 33
password, 10Paste option, 85pasting
cells, 35data to time periods, 35
A B C D E F G H I J L M N O P R S T U V W Y Z
Index 117

into Supporting Detail window, 66shortcut, 12
PDF fileslinks to in accounts, 37options for, 82print preview, 42printing to, 41Remember My Changes setting, 41setting precision, 82supporting detail, 82viewing task list status report, 21
percentage valuesentering, 31spreading, 55
periods in numbers, 78planning process, managing, 69planning units
annotations, 72changing the status of, 71checking the status of, 70described, 69displaying, 77e-mail notifications, 87managing, 69not started, 77overview, 30reading review comments, 88tracking approval process, 87viewing history, 73
planschanging after promoting, 87copying, 87reading review comments, 88reviewers for, 88
Point of View. See POV axisPOV axis
and dynamic user variables, 32described, 30, 33
precisionfor PDFs, 82of data, 35when printing, 41
preferencesalias setting, 76contrast, 81date format, 82display options, 77
e-mail, 75enabling search among pages, 80formatting numbers, 78last page selected, 79member selection, displaying aliases and
descriptions, 76number of members displayed on Dimensions page,
81number of users and groups displayed per page,
81printing options, 82remembering the most recently-used page, 80setting currency settings, 78text size, 81warnings for large data forms, 80workflow, 77
Print Preview option, 37, 42printing
account annotations, 41account annotations, preference, 83attribute members, 41cell text, 36cell text, PDF option, 83cell text, print option, 41currency codes, 41data, 41data, options, 82preferences for, 82Remember My Changes setting, 41shortcut, 12supporting detail, 41, 82
Printing Options tab, 82process management. See workflowprocess states, for planning units, 69Promote action, 71promoting planning units, 87Proportional spread using Grid Spread, 57proportional spreading for time periods, 50
Rranges of cells, selecting, 34read-only cells
copying data into, 35in data form segments, 30
red lights, in tasks, 16refreshing data, 12, 39Reject action, 71
A B C D E F G H I J L M N O P R S T U V W Y Z
118 Index

Relational spread option, 58Relative Member option, 58Remember Most Recent Page Visited option, 80Remember my changes setting, 41Remember selected page members, 79reporting currencies
described, 68viewing data in, 67
reporting on task list status, 20resizing view pane, 24Restore Data Form Settings option, 41restoring column width, 26Reverse Order setting, 83review comments on planning units, reading, 88review process, overview of, 69reviewers for plans, 88right-click menus. See shortcut menusrows
adding, 25deleting, 25hiding with no data or zeros, 26indentation, 30moving in, 33with #MISSING in all cells, 38
rules. See business rulesrulesets. See business rulesruntime prompts
and substitution variables, 46entering, 45generating a values file, 46types, 45validation of values, 46viewing, 87
Ssaving data, 12, 40scaling settings, 39searching
for a large number of pages, 80for aliases, 12, 34for data forms in Advanced mode, 12for data forms in the view pane, 11for forms, 12for members, 34in data forms, 26shortcut, 12
segments, described, 30
selectingcells, 34data, in data forms, 33data, in Excel, 34members, preferences for, 76pages, 33ranges of cells, 34
sequences. See business rulesshortcut buttons, using, 12shortcut menus, 31Show Account Annotations option, 83Show Alias in Member Selection option, 76Show Attribute Members option, 83Show Cell Text option, 37Show Currency Codes option, 83Show Description in Member Selection option, 76Show Planning Units as Aliases option, 77Show Planning Units That Are Not Started option,
77Show the Specified Members on Each Dimensions
Page option, 81Show the Specified Records on Each Assign Access
Page option, 81showing and hiding. See hiding and showingSign Off action, 71Signed Off process state, 69Size-to-Fit option, 25Smart Lists
described, 30entering data with, 30values in runtime prompts, 45
Smart Viewlaunching from Planning, 28overview, 10working offline, 10
space in numbers, 78spreading data
creating custom patterns, 58for time periods, 50logic of, 51spread types, 57using Grid Spread, 57using Mass Allocations, 58with cell locking, 56with mixed currencies, 55
Spreadsheet Add-in. See Smart Viewspreadsheets, 40. See also Microsoft Excel
A B C D E F G H I J L M N O P R S T U V W Y Z
Index 119

exporting to, 40pasting supporting detail, 66
starting point, creating for subsequent plans, 88states, for planning units, 69status
changing for planning units, 71indicator for tasks, 19viewing for executing jobs, 47
stored values versus displayed values, 39submitting a planning unit, 71substitution variables
on the Member Selection page, 45when runtime prompt value is outside variable
limit, 46subtotals, calculation logic, 38supporting detail
adding, 62and copying versions, 28changing, 65examples, 62hierarchy of, 64overview, 61pasting multiple cells, 66printing, 41, 82viewing, 65
Supporting Detail windowpasting cells into, 66using, 62
suppressing missing data, 38switching between Advanced mode and Basic mode,
12
Ttan-colored cell background, significance, 56target versions, copying to, 27task lists
alert message, 20dependent tasks, 18due dates, described, 16status indicator , 19status of, 19working with, 13, 15
tasksalert messages, 20alerts, described, 16Basic mode, 17completing, 18
due dates, 16e-mail alerts for, 20status indicator , 19status of, 19status reports, 20working with, 13, 15
teal-colored cells, 29terminology, selecting in data forms, 86text size, setting, 81text, in cells
as actual values, 32printing, 36viewing and entering, 36
thousands separator, 78time balance properties, 51time periods
alternate hierarchies, 51pasting data, 35spreading data, 50
Toggle View Pane button, 11, 12, 24Tools menu, 12totaling values, logic on data forms, 38traffic lights, in tasks, 16triangle in a cell, significance, 36
UUI, overview of, 11Under Review process state, 69unlocking values, 56URL links
accessing from Tools menu, 12from data cells, 37general tips, 86in account annotations, 37
URL tasks, completing, 18Use Application Default check box, 75, 78, 82Use Members on Forms option
described, 79with runtime prompts, 45
user interface, overview of, 11user name, 10user preferences, 75user variables
described, 30, 83dynamically setting, 32setting preferences, 83
A B C D E F G H I J L M N O P R S T U V W Y Z
120 Index

Vvalid members, opening a data form, 23values. See datavariables. See user variables and substitution variablesversions, copying, 27View link, described, 27view pane
described, 11maximizing, 11, 24resizing, 24searching for data forms, 11showing and hiding, 23
viewingbusiness rules, 87data in multiple currencies, 68history of planning units, 73instructions for data forms, 27status reports, 20supporting detail, 65
WWarn If Data Form Larger Than Cells Specified option,
80Web sites
accessing from Tools menu, 12links from account annotations, 37links from cell-level documents, 37
weekly distribution, 50Weighted Average - Actual_365 property, 53Weighted Average - Actual_Actual property, 54weighted daily average, 54white cells, significance, 29width, setting for columns, 25, 26workflow
displaying aliases, 77displaying planning units, 77setting options, 77setting preferences, 77setting up e-mail notifications, 75
worksheets. See spreadsheetsWorkspace
adding a document to a cell, 37logging on, 10
Yyellow cells, significance, 29
yellow lights, in tasks, 16
Zzero values
and hiding rows or columns, 26versus #MISSING, 38
A B C D E F G H I J L M N O P R S T U V W Y Z
Index 121

A B C D E F G H I J L M N O P R S T U V W Y Z
122 Index