oracle · oracle scm cloud creating and administering analytics and reports contents preface i 1...
TRANSCRIPT
OracleSCM CloudCreating and Administering Analyticsand Reports
Release 12 This guide also applies to on-premisesimplementations

Oracle® SCM Cloud Creating and Administering Analytics and Reports
Part Number E82088-02
Copyright © 2011-2017, Oracle and/or its affiliates. All rights reserved.
Author: Raminder Taunque
This software and related documentation are provided under a license agreement containing restrictions on use and disclosure and are protected byintellectual property laws. Except as expressly permitted in your license agreement or allowed by law, you may not use, copy, reproduce, translate, broadcast,modify, license, transmit, distribute, exhibit, perform, publish, or display any part, in any form, or by any means. Reverse engineering, disassembly, ordecompilation of this software, unless required by law for interoperability, is prohibited.
The information contained herein is subject to change without notice and is not warranted to be error-free. If you find any errors, please report them tous in writing.
If this is software or related documentation that is delivered to the U.S. Government or anyone licensing it on behalf of the U.S. Government, then thefollowing notice is applicable:
U.S. GOVERNMENT END USERS: Oracle programs, including any operating system, integrated software, any programs installed on the hardware, and/or documentation, delivered to U.S. Government end users are "commercial computer software" pursuant to the applicable Federal Acquisition Regulationand agency-specific supplemental regulations. As such, use, duplication, disclosure, modification, and adaptation of the programs, including any operatingsystem, integrated software, any programs installed on the hardware, and/or documentation, shall be subject to license terms and license restrictionsapplicable to the programs. No other rights are granted to the U.S. Government.
This software or hardware is developed for general use in a variety of information management applications. It is not developed or intended for use inany inherently dangerous applications, including applications that may create a risk of personal injury. If you use this software or hardware in dangerousapplications, then you shall be responsible to take all appropriate fail-safe, backup, redundancy, and other measures to ensure its safe use. OracleCorporation and its affiliates disclaim any liability for any damages caused by use of this software or hardware in dangerous applications.
Oracle and Java are registered trademarks of Oracle and/or its affiliates. Other names may be trademarks of their respective owners.
Intel and Intel Xeon are trademarks or registered trademarks of Intel Corporation. All SPARC trademarks are used under license and are trademarks orregistered trademarks of SPARC International, Inc. AMD, Opteron, the AMD logo, and the AMD Opteron logo are trademarks or registered trademarks ofAdvanced Micro Devices. UNIX is a registered trademark of The Open Group.
This software or hardware and documentation may provide access to or information about content, products and services from third parties. OracleCorporation and its affiliates are not responsible for and expressly disclaim all warranties of any kind with respect to third-party content, products, andservices unless otherwise set forth in an applicable agreement between you and Oracle. Oracle Corporation and its affiliates will not be responsible for anyloss, costs, or damages incurred due to your access to or use of third-party content, products, or services, except as set forth in an applicable agreementbetween you and Oracle.
The business names used in this documentation are fictitious, and are not intended to identify any real companies currently or previously in existence.
For information about Oracle's commitment to accessibility, visit the Oracle Accessibility Program website at http://www.oracle.com/pls/topic/lookup?ctx=acc&id=docacc.
Oracle customers that have purchased support have access to electronic support through My Oracle Support. For information, visit http://www.oracle.com/pls/topic/lookup?ctx=acc&id=info or visit http://www.oracle.com/pls/topic/lookup?ctx=acc&id=trs if you are hearing impaired.
Oracle SCM CloudCreating and Administering Analytics and Reports
Contents
Preface i
1 Overview 1About This Guide ...................................................................................................................................................... 1
Creating and Administering SCM Analytics and Reports: Overview ........................................................................... 1
Securing SCM Analytics and Reports: Overview ....................................................................................................... 2
How can I find analytics and reports? ...................................................................................................................... 2
Reports and Analytics Pane: Explained ..................................................................................................................... 3
Business Intelligence Catalog: Explained ................................................................................................................... 3
Saving Analytics and Reports: Points to Consider .................................................................................................... 4
What happens to customized analytics and reports when a patch is applied? .......................................................... 5
Setup and Administration Overview .......................................................................................................................... 6
2 Setup and Configuration 9Mapping to Work Areas ............................................................................................................................................ 9
Setting Up Currency ............................................................................................................................................... 10
Configuring Business Intelligence Publisher ............................................................................................................. 10
3 Subject Areas 15Data Structure for Analytics: Explained ................................................................................................................... 15
SCM Subject Areas in Oracle Transactional Business Intelligence: Explained .......................................................... 16
4 Flexfields 19Configuring Flexfields for Use in Analyses: Overview ............................................................................................... 19
Configuring Key Flexfields for Transactional Business Intelligence ........................................................................... 19
Configuring Descriptive Flexfields for Transactional Business Intelligence ................................................................. 24
Configuring Extensible Flexfields for Transactional Business Intelligence .................................................................. 26
Importing Changes to Flexfields Automatically ........................................................................................................ 27
Disabling Flexfields as BI-Enabled ........................................................................................................................... 29
Dimensions Supported by Descriptive Flexfields ...................................................................................................... 30
Oracle SCM CloudCreating and Administering Analytics and Reports
5 Analytics Customization 35Creating and Editing Analytics: Highlights ............................................................................................................... 35
Analyses .................................................................................................................................................................. 35
Dashboards ............................................................................................................................................................ 39
6 Reports Customization 41Creating and Editing Reports: Explained ................................................................................................................. 41
Accessing Report Components to Customize: Points to Consider .......................................................................... 41
Using the Customize Option for Predefined Reports: Points to Consider ................................................................. 42
Links Between Original and Custom Reports: Points to Consider ........................................................................... 43
Layouts ................................................................................................................................................................... 45
Data Models ........................................................................................................................................................... 50
New Reports ........................................................................................................................................................... 52
Inventory Reports .................................................................................................................................................... 53
Shipping Reports .................................................................................................................................................... 68
Receiving Reports ................................................................................................................................................... 75
Supply Chain Localizations Reports ........................................................................................................................ 77
Cost Accounting Reports ........................................................................................................................................ 83
Receipt Accounting Reports ................................................................................................................................... 93
Change Order Listing Report: Explained ................................................................................................................. 98
Catalog Details Report: Explained ......................................................................................................................... 100
Reports for Concepts ........................................................................................................................................... 102
Analyses for Portfolios ........................................................................................................................................... 105
Analyses for Comparing Scenarios ....................................................................................................................... 115
Overview Page ...................................................................................................................................................... 129
Manage Fulfillment Line Exceptions Page ............................................................................................................. 136
Manage Orchestration Process Exceptions Page .................................................................................................. 146
Reports & Analytics Work Area ............................................................................................................................. 149
Reports for Global Order Promising ...................................................................................................................... 150
Manage Fulfillment Lines ....................................................................................................................................... 152
Schedule Performance .......................................................................................................................................... 157
Number of Demand Lines Scheduled Late ........................................................................................................... 164
Value of Demand Lines Scheduled Late ............................................................................................................... 170
Financial Performance ........................................................................................................................................... 176
Manufacturing Reports .......................................................................................................................................... 179
Oracle SCM CloudCreating and Administering Analytics and Reports
7 Analytics and Reports Management 187Managing Folders ................................................................................................................................................. 187
Using Briefing Books ............................................................................................................................................ 188
Scheduling Analytics and Reports ......................................................................................................................... 189
Adding Analyses to Application Pages .................................................................................................................. 192
8 Maintenance and Migration 195Performance Tuning for Analytics and Reports: Points to Consider ....................................................................... 195
Reviewing SQL Statements Used in Analyses: Procedure ..................................................................................... 195
Moving Analyses and Reports: Procedure ............................................................................................................ 195

Oracle SCM CloudCreating and Administering Analytics and Reports
Oracle SCM CloudCreating and Administering Analytics and Reports
Preface
i
PrefaceThis preface introduces information sources that can help you use the application.
Oracle Applications HelpUse the help icon to access Oracle Applications Help in the application. If you don't see any help icons on your page,
click the Show Help icon in the global header. Not all pages have help icons. You can also access Oracle ApplicationsHelp at https://fusionhelp.oracle.com.
Using Applications Help
Watch: This video tutorial shows you how to find help and use help features.
Additional Resources• Community: Use Oracle Applications Customer Connect to get information from experts at Oracle, the
partner community, and other users.
• Guides and Videos: Go to the Oracle Help Center to find guides and videos.
• Training: Take courses on Oracle Cloud from Oracle University .
Documentation AccessibilityFor information about Oracle's commitment to accessibility, see the Oracle Accessibility Program .
Comments and SuggestionsPlease give us feedback about Oracle Applications Help and guides! You can send e-mail to:[email protected].

Oracle SCM CloudCreating and Administering Analytics and Reports
Preface
ii
Oracle SCM CloudCreating and Administering Analytics and Reports
Chapter 1Overview
1
1 Overview
About This GuideThis guide is intended for advanced users and administrators who want to modify and create custom analytics and reports,as well as perform setup and maintenance tasks for business intelligence. The guide contains both conceptual andprocedural information intended to help you build and manage analyses, reports, and dashboards that are tailored to thecontent needs of your line of business or company. You can also use the information in this guide to help you set up businessintelligence.
Creating and Administering SCM Analytics and Reports:OverviewBusiness intelligence enables you to analyze data to gain insight that you can act on, gathering information to meet specificrequirements. You can use different types of predefined analytics and reports, or create and edit them, to support yourbusiness needs.
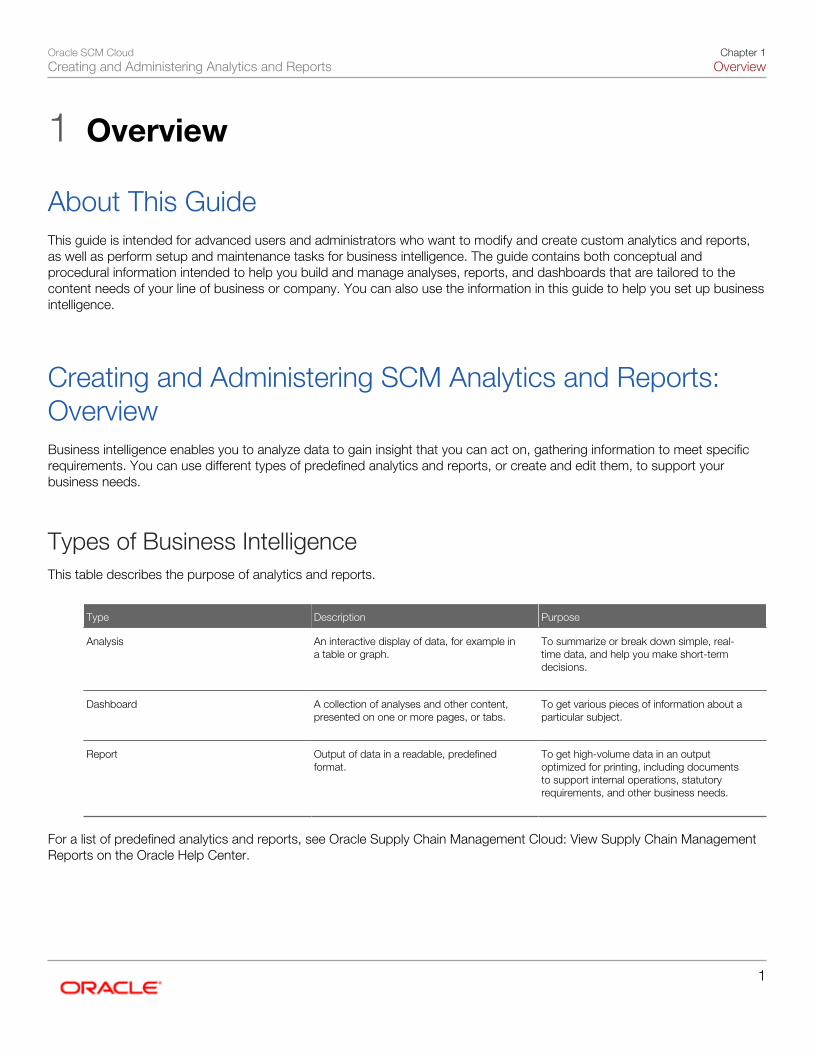
Types of Business IntelligenceThis table describes the purpose of analytics and reports.
Type Description Purpose
Analysis
An interactive display of data, for example ina table or graph.
To summarize or break down simple, real-time data, and help you make short-termdecisions.
Dashboard
A collection of analyses and other content,presented on one or more pages, or tabs.
To get various pieces of information about aparticular subject.
Report
Output of data in a readable, predefinedformat.
To get high-volume data in an outputoptimized for printing, including documentsto support internal operations, statutoryrequirements, and other business needs.
For a list of predefined analytics and reports, see Oracle Supply Chain Management Cloud: View Supply Chain ManagementReports on the Oracle Help Center.
Oracle SCM CloudCreating and Administering Analytics and Reports
Chapter 1Overview
2
Customization of Analytics and ReportsYou can create and edit analytics and reports for your own use. Or, if you have the appropriate roles, you can customize forothers. For example, you can:
• Add or remove columns from an analysis.
• Change the branding logo on report output.
• Create a dashboard to include your most commonly viewed analyses.
Setup and AdministrationAdministrators perform setup and administration tasks to manage how you or how other users use and customize analyticsand reports. For example, you can:
• Configure Oracle Business Intelligence Publisher, the tool used for generating and customizing reports.
• Define flexfields to provide custom attributes that can be used in analyses.
• Archive analytics and reports and move them from one environment to another.
Related Topics
• Oracle Supply Chain Management Cloud: View Supply Chain Management Reports and Analyses
• Oracle Supply Chain Management Cloud: View Setup Reports and Analyses
Securing SCM Analytics and Reports: OverviewAll users with appropriate roles can create and access analyses and reports based on role access to subject areas andcatalog folders.
Analyses and reports are secured by applying job roles with associated duty roles to users. Duty role assignments determineaccess to subject areas for analyses as well as catalog folders. For information about the job and duty roles provided withSCM and how to customize your security model by creating custom job roles and assigning duty roles to them, see theOracle SCM Cloud: Securing Oracle SCM Cloud guide.
In addition to folder and object access, duty roles also determine data security. Each of the duty roles that provides access tosubject areas and catalog folders is granted one or more data security policies that allow access to the data.
How can I find analytics and reports?See if the analysis or dashboard already appears on your page, maybe on a separate tab. Or there might be, for example, alink to the report you want to use. Also look for the Reports and Analytics pane, which may appear on your work area as apanel tab or in the regional area. In the pane, you find analytics and reports specific to the work area you're on.
Oracle SCM CloudCreating and Administering Analytics and Reports
Chapter 1Overview
3
To see all the analytics and reports that you have access to, use the Reports and Analytics work area (Navigator - Tools -Reports and Analytics).
Reports and Analytics Pane: ExplainedThe Reports and Analytics pane is a central place for you to quickly view or run analytics and reports that are related toyour work. If you have the permission, you can create and edit analytics and reports here, or add them from the businessintelligence (BI) catalog to the pane. You may find this pane in a panel tab or in the regional area on some work areas. In theReports and Analytics work area (Navigator - Tools - Reports and Analytics), the pane appears as the Contents pane.
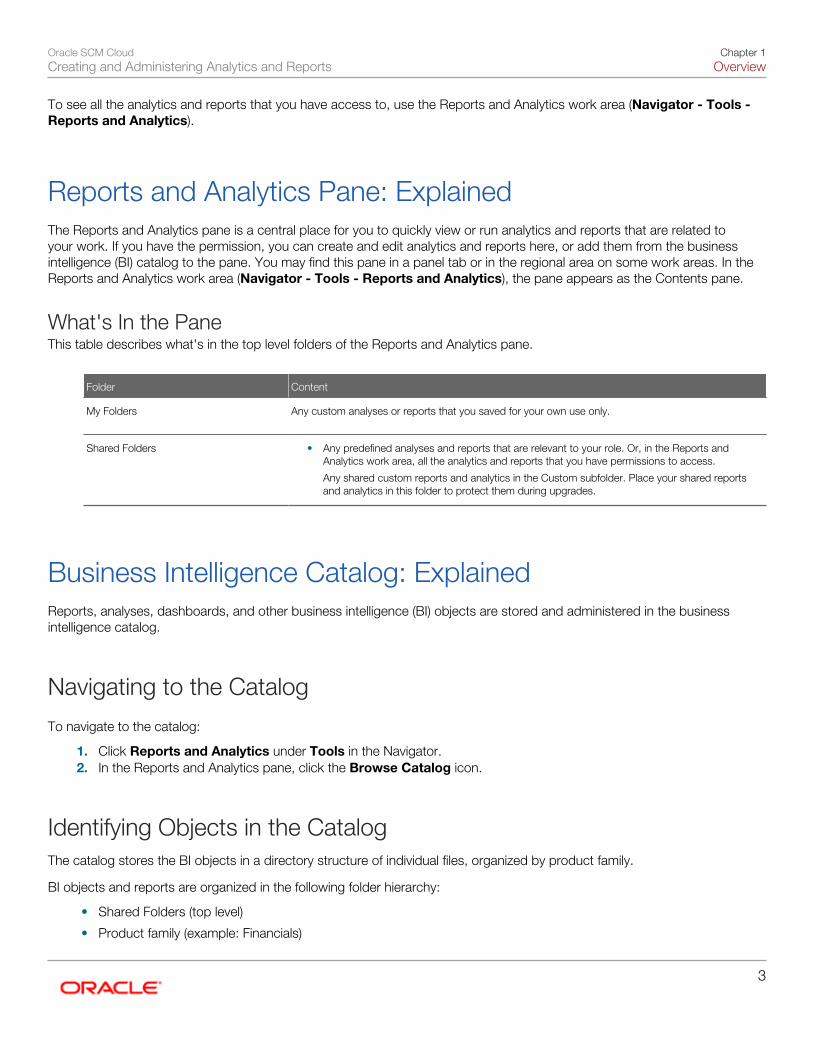
What's In the PaneThis table describes what's in the top level folders of the Reports and Analytics pane.
Folder Content
My Folders
Any custom analyses or reports that you saved for your own use only.
Shared Folders
• Any predefined analyses and reports that are relevant to your role. Or, in the Reports andAnalytics work area, all the analytics and reports that you have permissions to access.
Any shared custom reports and analytics in the Custom subfolder. Place your shared reportsand analytics in this folder to protect them during upgrades.
Business Intelligence Catalog: ExplainedReports, analyses, dashboards, and other business intelligence (BI) objects are stored and administered in the businessintelligence catalog.
Navigating to the Catalog
To navigate to the catalog:
1. Click Reports and Analytics under Tools in the Navigator.2. In the Reports and Analytics pane, click the Browse Catalog icon.
Identifying Objects in the CatalogThe catalog stores the BI objects in a directory structure of individual files, organized by product family.
BI objects and reports are organized in the following folder hierarchy:
• Shared Folders (top level)
• Product family (example: Financials)
Oracle SCM CloudCreating and Administering Analytics and Reports
Chapter 1Overview
4
• Product (example: Payables)
• Report groups (example: Invoices)
• Dashboard reports
• Data Models
• Report Components
• BI Publisher reports
• Prompts
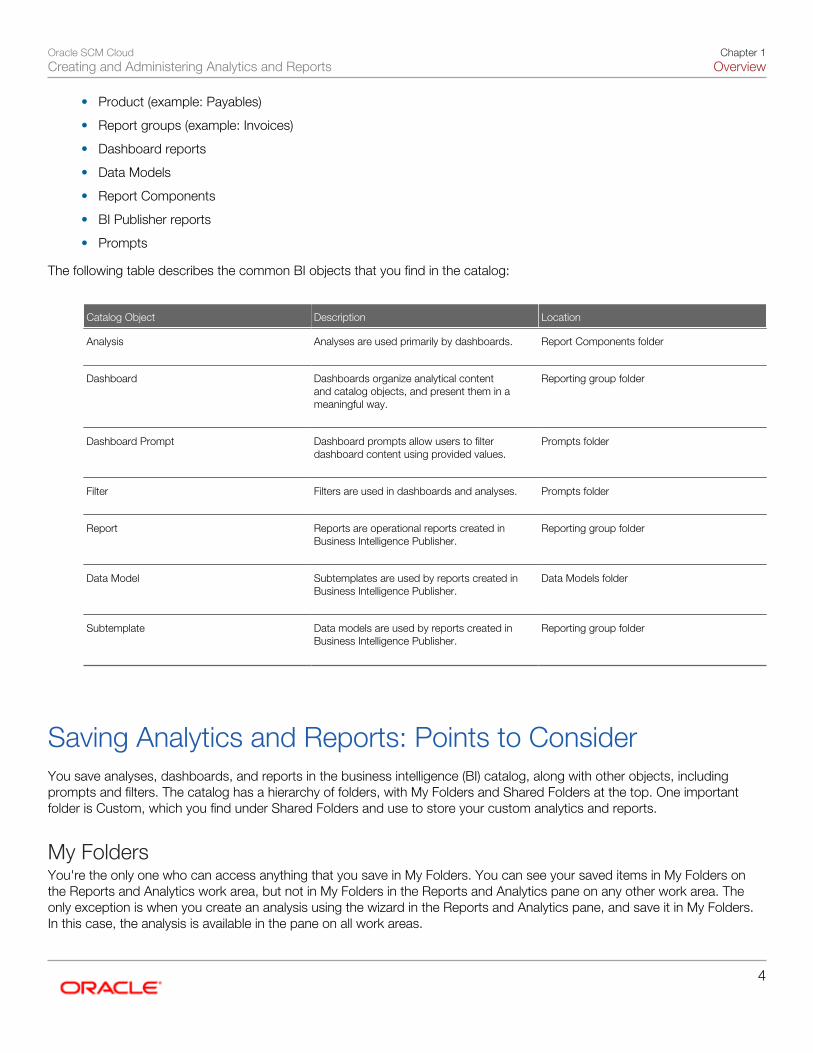
The following table describes the common BI objects that you find in the catalog:
Catalog Object Description Location
Analysis
Analyses are used primarily by dashboards.
Report Components folder
Dashboard
Dashboards organize analytical contentand catalog objects, and present them in ameaningful way.
Reporting group folder
Dashboard Prompt
Dashboard prompts allow users to filterdashboard content using provided values.
Prompts folder
Filter
Filters are used in dashboards and analyses.
Prompts folder
Report
Reports are operational reports created inBusiness Intelligence Publisher.
Reporting group folder
Data Model
Subtemplates are used by reports created inBusiness Intelligence Publisher.
Data Models folder
Subtemplate
Data models are used by reports created inBusiness Intelligence Publisher.
Reporting group folder
Saving Analytics and Reports: Points to ConsiderYou save analyses, dashboards, and reports in the business intelligence (BI) catalog, along with other objects, includingprompts and filters. The catalog has a hierarchy of folders, with My Folders and Shared Folders at the top. One importantfolder is Custom, which you find under Shared Folders and use to store your custom analytics and reports.
My FoldersYou're the only one who can access anything that you save in My Folders. You can see your saved items in My Folders onthe Reports and Analytics work area, but not in My Folders in the Reports and Analytics pane on any other work area. Theonly exception is when you create an analysis using the wizard in the Reports and Analytics pane, and save it in My Folders.In this case, the analysis is available in the pane on all work areas.
Oracle SCM CloudCreating and Administering Analytics and Reports
Chapter 1Overview
5
Shared FoldersIf you have the appropriate roles, you can also save in Shared Folders so that your custom analytics or reports are availableto anyone with the right access. You should save objects under the Custom subfolder, which has subfolders organized byproduct family.
Regarding predefined analytics and reports in Shared Folders:
• You should save a copy of the predefined analysis or dashboard in the corresponding product family subfolder underthe Custom folder, and edit only the copy. Directly edit predefined analytics only when necessary, to make sure thatany references to the analysis or dashboard still work properly.
• For predefined reports only, you can use a special Customize option to copy the report and also the folder structureand permissions. The copy is linked to the original, so editing the copy is like directly editing the original.
Custom FolderKeep all custom analytics and reports in the Custom folder so that:
• You ensure that customized copies of those objects are not affected during upgrades, which can change predefinedanalytics and reports outside the Custom folder. You might lose customizations saved outside the Custom folderduring upgrades.
• You can easily find customized objects.
• You can edit objects in the Custom folder without compromising security on the original objects.
When you copy an object into the Custom folder, the copied object inherits the permission settings of the Custom folder. Anadministrator can reset the permissions on the object and the folder that it's in.
Related Topics
• Creating and Editing Reports: Explained
• Creating and Editing Analytics: Highlights
• Using the Customize Option for Predefined Reports: Points to Consider
What happens to customized analytics and reports when apatch is applied?All custom analytics and reports are preserved if you save them in the Custom subfolder within Shared Folders, or in MyFolders in the business intelligence (BI) catalog. Changes to predefined analytics and reports outside the Custom folder arepreserved only if the patch doesn't include a new version of those BI objects. If the patch does include a new version of apredefined object that you edited outside the Custom folder, then:
• The new version overwrites the existing predefined object.
• A copy of the existing object (with your edits) is automatically created in the same folder, with a new name thatindicates it's a custom version.
Oracle SCM CloudCreating and Administering Analytics and Reports
Chapter 1Overview
6
If the patch includes a new version of both the predefined object and a folder in its file path, then:
• The new folder, along with the new version of the object, overwrites the existing predefined folder and object.
• A copy of the existing folder (along with your edited object) is automatically created. The folder is renamed to indicatethat it's a custom version, but your edited object is not renamed.
Note: Future patches won't affect renamed custom objects or anything within a renamed custom folder.
Setup and Administration Overview
Tools for Administering Analyses and Reports: ExplainedYou can use several different tools to manage and administer analyses and reports.
These components support modification and administration of your analyses and reports:
• Use the Business Intelligence catalog to interact directly with your reports and analyses. Use this interface to managepermissions, properties, and the organization of your analyses and reports.
• Use the Oracle Business Intelligence Publisher administration pages to configure settings specific to the runningand scheduling of operational reports, such as setting up your delivery servers, managing scheduler work load, andsetting run-time properties for reports.
• Use the Oracle BI Administration Tool to edit the Oracle BI repository (RPD), which contains the metadata uponwhich reports and analyses are built. The Administration Tool is a Windows application that you use to edit the RPDbased on your requirements.You can use the Administration Tool to perform data modeling tasks such as addingnew fact or dimension tables, reorganizing Presentation layer metadata, and creating BI view objects for tables. Thistool isn't available in Oracle Cloud implementations.
• Use the Catalog Manager to perform online and offline management of the catalog. Tasks that you can performwith the tool include managing folders, shortcuts, global variables, and Oracle BI objects such as analyses, filter,prompts, and dashboards; viewing and editing catalog objects in XML, and searching for and replacing catalog text.This tool isn't available in Oracle Cloud implementations.
• Use the Oracle Enterprise Manager Cloud Control to monitor your IT environment unattended. It's delivered with apredefined set of performance and health metrics that enable you to monitor key environment components, accessreal-time performance charts, and perform strategic tasks such as trend analysis and reporting. This tool isn'tavailable in Oracle Cloud implementations.
Define Transactional Business Intelligence Configuration: OverviewUse the Define Transactional Business Intelligence task list in the Setup and Maintenance work area to complete configurationof business intelligence in your application. Some tasks in this task list are performed during Oracle Applications Cloudprovisioning and require no further action from you. The Define Transactional Business Intelligence Configuration task listincludes the following tasks:
• Optimize Transactional Business Intelligence Repository
Oracle SCM CloudCreating and Administering Analytics and Reports
Chapter 1Overview
7
Trim unused projects from the business intelligence repository based on configured Oracle Applications Cloudofferings. This optimization is automated during the provisioning process and requires no further action from you.
• Manage Transactional Business Intelligence Connections
Review data source connections in the physical layer of the business intelligence repository. Connections are set upand reviewed during the provisioning process, and this task requires no further action from you.
• Manage Security for Transactional Business Intelligence
Review security for business intelligence users. The default security configuration can be modified. Refer to thesecurity documentation for your cloud services to review or change the default user security model.
• Configure Key Flexfields for Transactional Business Intelligence
Define the key flexfield segments and validation for use as classification keys. You must define these key flexfields forOracle Fusion Transactional Business Intelligence to operate correctly.
• Configure Descriptive Flexfields for Transactional Business Intelligence
Define validation and display properties of descriptive flexfields, which are used to add custom attributes to entities.You enable and import flexfields for use in analyses.
• Import Essbase Cubes into Transactional Business Intelligence Repository for Financials General Ledger
Import Essbase cubes into the business intelligence repository. You must perform this task if you're using OracleFusion General Ledger.
• Manage User Currency Preferences in Transactional Business Intelligence
Manage user currency preferences, which control regional currency settings, currency used in reports, andcorporate currency.
Related Topics
• Essbase Rule File and Cubes: Overview
• Configuring Flexfields for Use in Analyses: Overview
• Configuring Descriptive Flexfields for Transactional Business Intelligence: Overview
• Importing Flexfield Changes: Overview
• Setting Currency Preferences for Analytics

Oracle SCM CloudCreating and Administering Analytics and Reports
Chapter 1Overview
8
Oracle SCM CloudCreating and Administering Analytics and Reports
Chapter 2Setup and Configuration
9
2 Setup and Configuration
Mapping to Work Areas
Setting Up the Reports and Analytics Pane: ProcedureYou can find the Reports and Analytics pane in many work areas, and the analytics and reports you see in the pane dependson the work area. You can define what's available for a specific work area, by mapping reports from the business intelligence(BI) catalog to that work area. In this mapping context, reports refer to both analytics and reports. Your changes apply to allusers who have access to the work area you're mapping.
Mapping Reports from Your Work AreaTo map reports to the work area that you're in:
1. Click the Edit Settings icon in the Reports and Analytics pane.
You see all the reports that are currently mapped to your work area.2. Click Select and Add.3. Find the report in the catalog and select it.4. Click OK.5. To remove any mapping, select the report and click Remove.6. Save your work.
Mapping Reports to Any Work AreaTo map reports to any work area that you have access to:
1. Go to the Setup and Maintenance work area and open the Map Reports to Work Areas task.2. Select the application of the work area you want to map to.3. Select the work area.4. Click Search and see all the reports that are currently mapped to that work area.5. Click Select and Add.6. Find the report in the catalog and select it.7. Click OK.8. To remove any mapping, select the report and click Remove.
Tip: Click Synchronize to remove all mappings to any reports that are no longer in the catalog. Yousynchronize all work areas, not just the one you're mapping.
9. Save your work.
Related Topics
• Setting Reports Up for Scheduling in the Reports and Analytics Pane: Procedure
• Reports and Analytics Pane: Explained
Oracle SCM CloudCreating and Administering Analytics and Reports
Chapter 2Setup and Configuration
10
Why can't I see reports when mapping reports to work areas for theReports and Analytics pane?Either no reports are currently mapped to the work area you select on the Map Reports to Work Areas page, or you don'thave access to the reports that are mapped.
Similarly, when you're selecting a report to map, you can see only the reports that you have access to. Ask your administratorto either:
• Assign you roles that have access to the reports you want to map to work areas.
• Grant the Reports and Analytics Region Administration Duty to someone who already has access to those reports.
Why can't I see reports when I edit settings for the Reports andAnalytics pane?In the Edit Settings window, you might not see a currently mapped report because you don't have access to it.
Similarly, when you're selecting a report to map, you can see only the reports that you have access to. Ask your administratorto either:
• Assign you roles that have access to the reports you want to map to work areas.
• Grant the Reports and Analytics Region Administration Duty to someone who already has access to those reports.
Setting Up Currency
Why do I see amounts of zero in analyses?The currency exchange rates might not be set up correctly. For example, you choose EUR as your preferred currency ingeneral preferences, and your corporate currency is USD. Amounts in analyses are displayed in EUR after conversion fromUSD, based on the current exchange rate. But if the exchange rate between EUR and USD isn't set up, or if the conversionfails for any reason, then the amounts show as zero. If this happens, contact your help desk.
Configuring Business Intelligence Publisher
Managing Report Delivery Servers: OverviewOracle Business Intelligence Publisher, the report generation and delivery engine, requires configuration and tuning to deliverreports to users.
Report requests are received by Publisher from:
• Oracle Enterprise Scheduler
Oracle SCM CloudCreating and Administering Analytics and Reports
Chapter 2Setup and Configuration
11
• The Reports and Analytics pane
• Application pages
Requests submitted through Oracle Enterprise Scheduler are processed by the Oracle BI Publisher scheduler. Requestssubmitted through the Reports and Analytics pane can be either real-time online requests or scheduled requests. Requestssubmitted through an application may invoke Oracle Enterprise Scheduler or may return report request results directly back tothe application page.
Oracle BI Publisher is configured to accept requests from Oracle Applications Cloud. However, before you can deliver reportdocuments to their destinations, you must define the delivery servers in Oracle BI Publisher. Use the Oracle BI PublisherAdministration page to define your delivery servers.
Once delivery servers are defined, you can further configure the number of report processor and delivery threads to besthandle your processing and delivery requirements. In addition, you can configure report properties for the system or atthe report level to tune performance of your reports. To diagnose report processing issues, BI Publisher provides a set ofscheduler diagnostics.
Navigating to the Oracle BI Publisher Administration Page: ProcedureYou use the Oracle BI Publisher Administration Page to perform most tasks related to report delivery and performance.
Use the Oracle BI Publisher Administration page to:
• Configure delivery servers
• Manage report and delivery processors
• View scheduler diagnostics
• Set system properties and report runtime configuration properties
Request the Oracle Applications Cloud security administrator to assign the BI Platform Administrator duty role (BI stripe) tothe person responsible for administering BI analyses, dashboards, and BI Publisher reports. Administration tasks includesecurity permissions for objects, organizing objects into folders, accessing log files, and several other tasks.
Navigating to the Administration PageTo navigate to the Oracle BI Publisher Administration page:
1. Under Tools, click Reports and Analytics.2. In the Reports and Analytics pane, click Catalog.3. In the Catalog page, click Administration, then click Manage BI Publisher.
Configuring Report Delivery Servers: ProcedureSet up the report delivery servers to support printing.
Configuring ServersTo configure delivery servers:
1. From the BI Publisher Administration page, click Delivery Configuration.2. Enter values in the Delivery Configuration Options tab to set general properties for email deliveries and notifications.3. To configure a delivery server, click the appropriate tab.
Oracle SCM CloudCreating and Administering Analytics and Reports
Chapter 2Setup and Configuration
12
Understanding the Report and Delivery Processors: OverviewWhen Oracle Enterprise Scheduler initiates a job, it is picked up by the BI Publisher scheduler queue.
• Job Processor: Listens for requests from the scheduler queue. When the job information is received, the jobprocessor executes the data model (and splits the data for bursting jobs), stores the data in the shared temporaryfolder, and sends the report metadata to the report queue.
• Report Processor: Listens for requests from the report queue. When the report information is received, the reportprocessor generates the report documents, stores it in the shared temporary folder and puts the delivery informationin the delivery queue.
• Delivery Processor: Listens to the delivery queue and handles the delivery of reports for its channel. The deliveryprocessors are:
◦ Email Processor
◦ File Processor
◦ FTP Processor
◦ Print Processor
◦ WebDAV Processor
◦ Fax Processor
Managing Report Processing and Delivery Server Load: ProcedureManage the processors in the BI Publisher Scheduler Configuration page.
Managing Processing and Server LoadBy default, each processor is enabled and the thread count for each is set to five. For each managed server that is runningin the BI cluster, a table for that instance's processors is displayed. Use the table to enable or disable processors for theinstance and configure the thread counts.
To configure processor threads:
1. From the BI Publisher Administration page, click Scheduler Configuration.2. In the the Cluster Instances region of the Scheduler Configuration page, enter the Number Threads value in the
processor configuration table.3. All processors are automatically set to use the number of threads defined in the Threads Per JMS Processor value of
the JMS Configuration region of the page. Enter a value in the Number Threads column to change the value from thisdefault.
After performing the scale-out procedure, configure the processor threads for each cluster instance using the steps above.
Diagnosing Report Processing Issues: ProcedureThe Scheduler Diagnostics page provides the runtime status of the scheduler. It provides status of its JMS configuration, JMSqueues, cluster instances, scheduler Database, Top link, and Oracle Enterprise Scheduler.
Oracle SCM CloudCreating and Administering Analytics and Reports
Chapter 2Setup and Configuration
13
Diagnosing IssuesTo access the Scheduler Diagnostics page:
1. Navigate to the Oracle Business Intelligence Publisher Administration page.2. In the System Maintenance group, click Scheduler Diagnostics.
Configuring System Properties for Reports: ProcedureUse the Oracle BI Publisher Runtime Configuration page to set the system-level runtime properties for reports.
Configuring Reporting PropertiesTo access the Runtime Configuration page:
1. Navigate to the Oracle Business Intelligence Publisher Administration page.2. In the Runtime Configuration group, click Properties.
Uploading PGP Public Key Files to GPG Keystore: ProcedureTo support encrypted communication channel from the BI Publisher Server to an FTP site, you upload a PGP public key file toa GPG keystore on the cloud and then provide it to a registered FTP location.
Uploading PGP KeysYou upload, test, and delete PGP keys in the BI Publisher Administration page.
To upload PGP keys:
1. Navigate to the BI Publisher Administration page.2. In the Security Center section, click the PGP Keys link to open the PGP Keys page.3. In the PGP Keys section, click Browse and select the PGP key file in the Open dialog box.4. Click OK.5. Click Upload. After the file is uploaded, it is imported into the keystore and its details are visible in the PGP Keys
table. If a key with the same ID is imported again, the file is overwritten.6. Click the Download icon of the key in the Encrypted Test Output column of the PGP Keys table to download
and decrypt a test output file using the secret key of the imported public key. Successful decryption confirms theencryption is working for your keys.
Deleting a PGP KeyTo delete an imported public key, click the Delete icon.
Configuring an FTP Delivery Channel Using PGP KeysTo create an FTP channel:
1. Navigate to the BI Publisher Administration page.2. In the Delivery section, click the FTP link to open the FTP page.3. Add a new FTP Server and click Test Connection to test it. The Filter Command field is read-only and is updated
automatically when you select a PGP key.
Oracle SCM CloudCreating and Administering Analytics and Reports
Chapter 2Setup and Configuration
14
4. Select the PGP Key ID of the key you uploaded from the drop-down.5. Select the true check box for Sign Output to sign the encrypted document. If you select this check box, a -s
parameter is added to the existing filter command.6. Test the connection again to confirm that an encrypted test file is sent to the remote directory. The FTP delivery
channel can now be used in a scheduled job.
Oracle SCM CloudCreating and Administering Analytics and Reports
Chapter 3Subject Areas
15
3 Subject Areas
Data Structure for Analytics: ExplainedThe business intelligence (BI) repository contains the metadata that defines which columns you can include in analyses, andthe source of that data. The repository is organized into subject areas, which contain folders with the columns.
Note: You can also use the BI repository as a data source for reports.
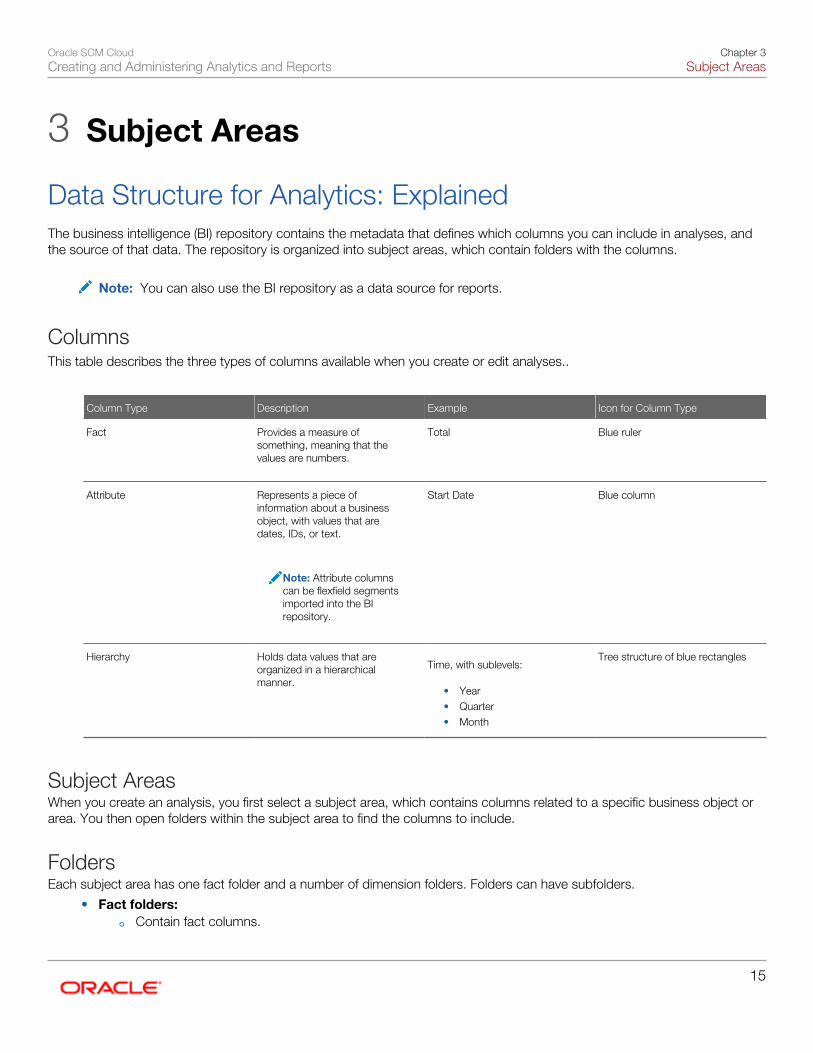
ColumnsThis table describes the three types of columns available when you create or edit analyses..
Column Type Description Example Icon for Column Type
Fact
Provides a measure ofsomething, meaning that thevalues are numbers.
Total
Blue ruler
Attribute
Represents a piece ofinformation about a businessobject, with values that aredates, IDs, or text.
Note: Attribute columnscan be flexfield segmentsimported into the BIrepository.
Start Date
Blue column
Hierarchy
Holds data values that areorganized in a hierarchicalmanner.
Time, with sublevels:
• Year• Quarter• Month
Tree structure of blue rectangles
Subject AreasWhen you create an analysis, you first select a subject area, which contains columns related to a specific business object orarea. You then open folders within the subject area to find the columns to include.
FoldersEach subject area has one fact folder and a number of dimension folders. Folders can have subfolders.
• Fact folders:
◦ Contain fact columns.
Oracle SCM CloudCreating and Administering Analytics and Reports
Chapter 3Subject Areas
16
◦ Are usually at the bottom of the list of folders and are usually named after the subject area.
• Dimension folders:
◦ Contain attribute and hierarchical columns.
◦ Are joined to the fact folder within a subject area.
For example, if your analysis has the Currency attribute from a dimension folder, you see currencies in theresults. If you also add the Total fact, then your analysis includes only records with both a currency and a totalamount. The more columns you add, the smaller the query set for your analysis.
◦ Can be common folders, or common dimensions, that appear in more than one subject area.
If your analysis has columns from multiple subject areas, then you:
• Should include columns only from dimension folders that are common to all of those subject areas. Atleast one such column is required.
• Must include one column from the fact folder in each of those subject areas.
Related Topics
• Creating and Editing Analytics: Highlights
• Creating and Editing Analyses with Advanced Features: Procedure
• Creating and Editing Analyses Using a Wizard: Procedure
• Customizing Data Models: Procedure
SCM Subject Areas in Oracle Transactional BusinessIntelligence: ExplainedTo create a real-time analysis using Oracle Transactional Business Intelligence, select the subject area from which informationis to be included in the analysis. For example, to create an analysis of item information, select a Product Management subjectarea. Subject areas are based around a business object or fact.
Oracle Transactional Business Intelligence is available for several functional areas in SCM including:
• Product Management
• Costing
• Inventory
• Receiving
• Shipping
• Order Management
Some sample predefined subject areas for SCM are:
• Product Management - Change Order Real Time
Oracle SCM CloudCreating and Administering Analytics and Reports
Chapter 3Subject Areas
17
• Product Management - Trading Partner Item Real Time
• Costing - COGS And Gross Margin Real Time
• Costing - Inventory Valuation Real Time
• Inventory - Inventory Balance Real Time
• Inventory - Inventory Transactions Real Time
• Receiving - Interorganization Receipts Real Time
• Receiving - In Transit Shipments Real Time
• Distributed Order Orchestration - Fulfillment Lines Real Time
• Distributed Order Orchestration - Price Adjustments Real Time
Subject areas for Transactional Business Intelligence always include the suffix, Real Time. To view the complete list ofpredefined subject areas, click Create and select Analysis in the Reports and Analytics pane.
Fact Folders and Dimension FoldersEach subject area has one fact folder and a number of dimension folders. Fact folders contain attributes that can bemeasured, meaning that they are numeric values like past due fulfillment lines and item number. A special folder, calleda degenerate dimension, is also associated with the fact folder. Each dimension folder is joined to the fact folder within asubject area. Fact folders are usually at the bottom of the list of folders and are usually named after the subject area.
Oracle SCM CloudCreating and Administering Analytics and Reports
Chapter 3Subject Areas
18
Oracle SCM CloudCreating and Administering Analytics and Reports
Chapter 4Flexfields
19
4 Flexfields
Configuring Flexfields for Use in Analyses: OverviewFlexfields are extensible sets of placeholder fields associated with business objects which can be placed on applicationpages. You can use flexfields to extend business objects and meet your data management requirements without changingthe data model or performing any database programming. To include flexfields you have used for extension or customizationfor use in analyses, you must enable them for business intelligence.
Extension of analyses using flexfields is available for Oracle Enterprise Resource Planning Cloud and Oracle Human CapitalManagement Cloud. For Oracle Sales Cloud, the Extensibility Framework supports extension.
Flexfield TypesThe following types of flexfields are available and provide a means to customize application features without programming:
• Descriptive
• Extensible
• Key
Depending on the flexfield type, business intelligence enablement is performed differently and has different requirements.Once they are enabled for business intelligence, you can import any changes made to flexfields automatically using an importscheduled process.
Related Topics
• Configuring Extensible Flexfields: Procedure
Configuring Key Flexfields for Transactional BusinessIntelligence
Enabling Key Flexfields for Business Intelligence Reporting: ProcedureTo include flexfields in your Transactional Business Intelligence reporting, you must enable them for Business Intelligence.Extensibility of analysis using flexfields is used for Enterprise Resource Planning and Human Capital Management. ForCustomer Relationship Management, the Extensibility Framework supports this.
To designate key flexfields as BI-enabled:
1. Navigate to Manage Key Flexfields in Oracle Applications Cloud.2. Enter your search value in Key Flexfield Code.3. Click Manage Structure Instances.
Oracle SCM CloudCreating and Administering Analytics and Reports
Chapter 4Flexfields
20
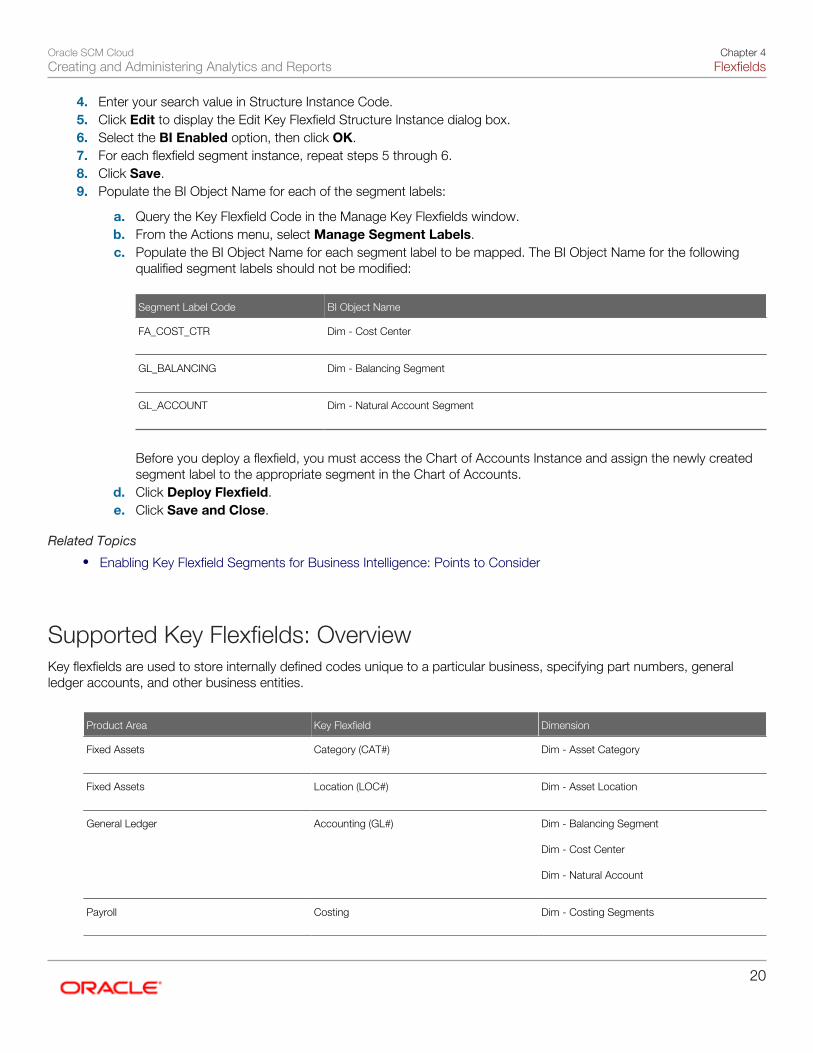
4. Enter your search value in Structure Instance Code.5. Click Edit to display the Edit Key Flexfield Structure Instance dialog box.6. Select the BI Enabled option, then click OK.7. For each flexfield segment instance, repeat steps 5 through 6.8. Click Save.9. Populate the BI Object Name for each of the segment labels:
a. Query the Key Flexfield Code in the Manage Key Flexfields window.b. From the Actions menu, select Manage Segment Labels.c. Populate the BI Object Name for each segment label to be mapped. The BI Object Name for the following
qualified segment labels should not be modified:
Segment Label Code BI Object Name
FA_COST_CTR
Dim - Cost Center
GL_BALANCING
Dim - Balancing Segment
GL_ACCOUNT
Dim - Natural Account Segment
Before you deploy a flexfield, you must access the Chart of Accounts Instance and assign the newly createdsegment label to the appropriate segment in the Chart of Accounts.
d. Click Deploy Flexfield.e. Click Save and Close.
Related Topics
• Enabling Key Flexfield Segments for Business Intelligence: Points to Consider
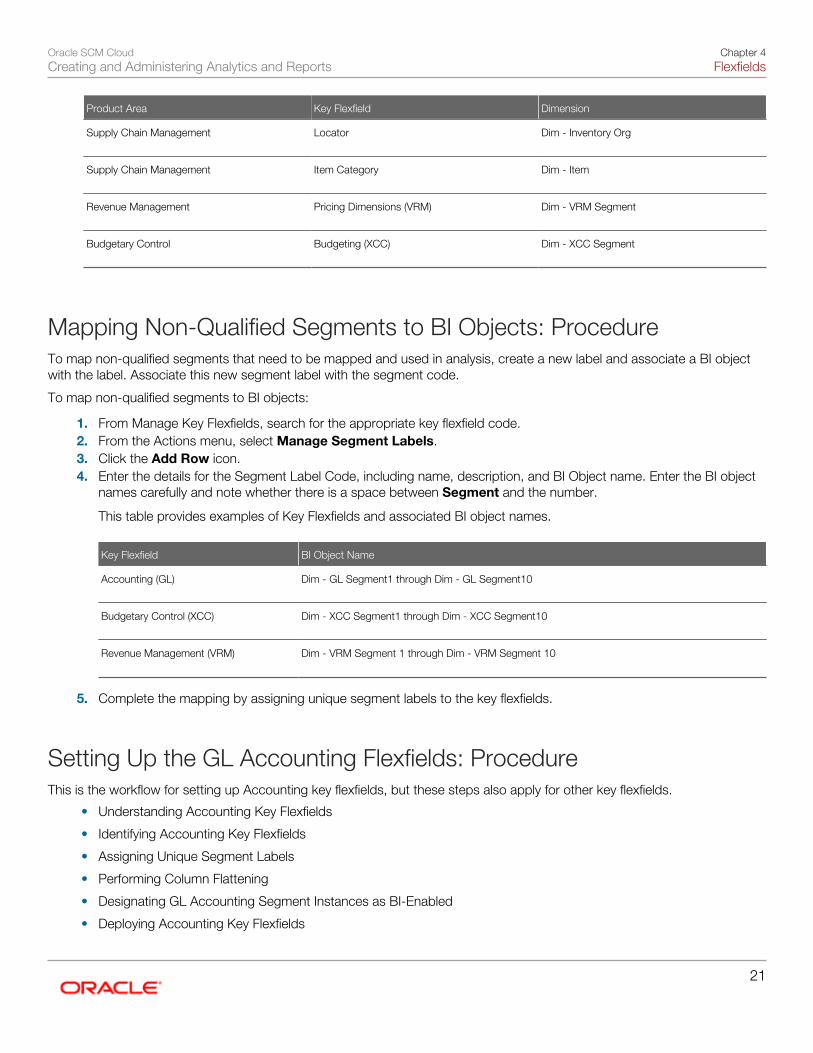
Supported Key Flexfields: OverviewKey flexfields are used to store internally defined codes unique to a particular business, specifying part numbers, generalledger accounts, and other business entities.
Product Area Key Flexfield Dimension
Fixed Assets
Category (CAT#)
Dim - Asset Category
Fixed Assets
Location (LOC#)
Dim - Asset Location
General Ledger
Accounting (GL#)
Dim - Balancing Segment Dim - Cost Center Dim - Natural Account
Payroll
Costing
Dim - Costing Segments
Oracle SCM CloudCreating and Administering Analytics and Reports
Chapter 4Flexfields
21
Product Area Key Flexfield Dimension
Supply Chain Management
Locator
Dim - Inventory Org
Supply Chain Management
Item Category
Dim - Item
Revenue Management
Pricing Dimensions (VRM)
Dim - VRM Segment
Budgetary Control
Budgeting (XCC)
Dim - XCC Segment
Mapping Non-Qualified Segments to BI Objects: ProcedureTo map non-qualified segments that need to be mapped and used in analysis, create a new label and associate a BI objectwith the label. Associate this new segment label with the segment code.
To map non-qualified segments to BI objects:
1. From Manage Key Flexfields, search for the appropriate key flexfield code.2. From the Actions menu, select Manage Segment Labels.3. Click the Add Row icon.4. Enter the details for the Segment Label Code, including name, description, and BI Object name. Enter the BI object
names carefully and note whether there is a space between Segment and the number.
This table provides examples of Key Flexfields and associated BI object names.
Key Flexfield BI Object Name
Accounting (GL)
Dim - GL Segment1 through Dim - GL Segment10
Budgetary Control (XCC)
Dim - XCC Segment1 through Dim - XCC Segment10
Revenue Management (VRM)
Dim - VRM Segment 1 through Dim - VRM Segment 10
5. Complete the mapping by assigning unique segment labels to the key flexfields.
Setting Up the GL Accounting Flexfields: ProcedureThis is the workflow for setting up Accounting key flexfields, but these steps also apply for other key flexfields.
• Understanding Accounting Key Flexfields
• Identifying Accounting Key Flexfields
• Assigning Unique Segment Labels
• Performing Column Flattening
• Designating GL Accounting Segment Instances as BI-Enabled
• Deploying Accounting Key Flexfields
Oracle SCM CloudCreating and Administering Analytics and Reports
Chapter 4Flexfields
22
Understanding Accounting Key FlexfieldsThe Accounting Key Flexfield is used to identify GL accounts.
A chart of accounts segment is a component of the accounting key flexfield. Each segment has a value set attached to itto provide formatting and validation of the set of values used with that segment. The combination of segments creates theaccount combination used for recording and analyzing financial transactions. You must set up your Chart of Accounts (COA)as part of implementing Oracle Applications Cloud.
Examples of segments that may be found in a chart of accounts structure include Company, Cost Center, Department,Division, Region, Account, Product, Program, and Location.
The Natural Account segment of the General Ledger Accounting Key Flexfield defines the account used in the accountcombination to record transactions.
The logical segment dimensions in the Oracle BI metadata are Dim - Cost Center, Dim - Balancing Segment, Dim - NaturalAccount Segment and all Dim - GL Segmentndimensions. These dimension tables are populated from a Tree value object orfrom a Value Set value object depending on whether a tree was associated with the segment in the Oracle Applications Cloudsetup:
• For each segment associated with trees, two value objects are generated (Tree and TreeCode) with the followingnaming structure:FscmTopModelAM.AccountBIAM.FLEX_TREE_VS_segmentlabel_VI &
FscmTopModelAM.AccountBIAM.FLEX_TREECODE_VS_segmentlabel_VI
• For each segment without trees, one view object are generated with the following naming structure:FscmTopModelAM.AccountBIAM.FLEX_VS_ XXX_VI
In addition to the segment dimension tables, the BI Extension process also extends Flex BI Flattened VO;FscmTopModelAM.AccountBIAM.FLEX_BI_Account_VI. This view object has a pair of columns for each segment; segmentlabel_and segmentlabel_c.
For example, for your Cost Center segment which has the segment label FA_COST_CTR, there are two columns in this viewobject, named FA_COST_CTR_ and FA_COST_CTR_c.
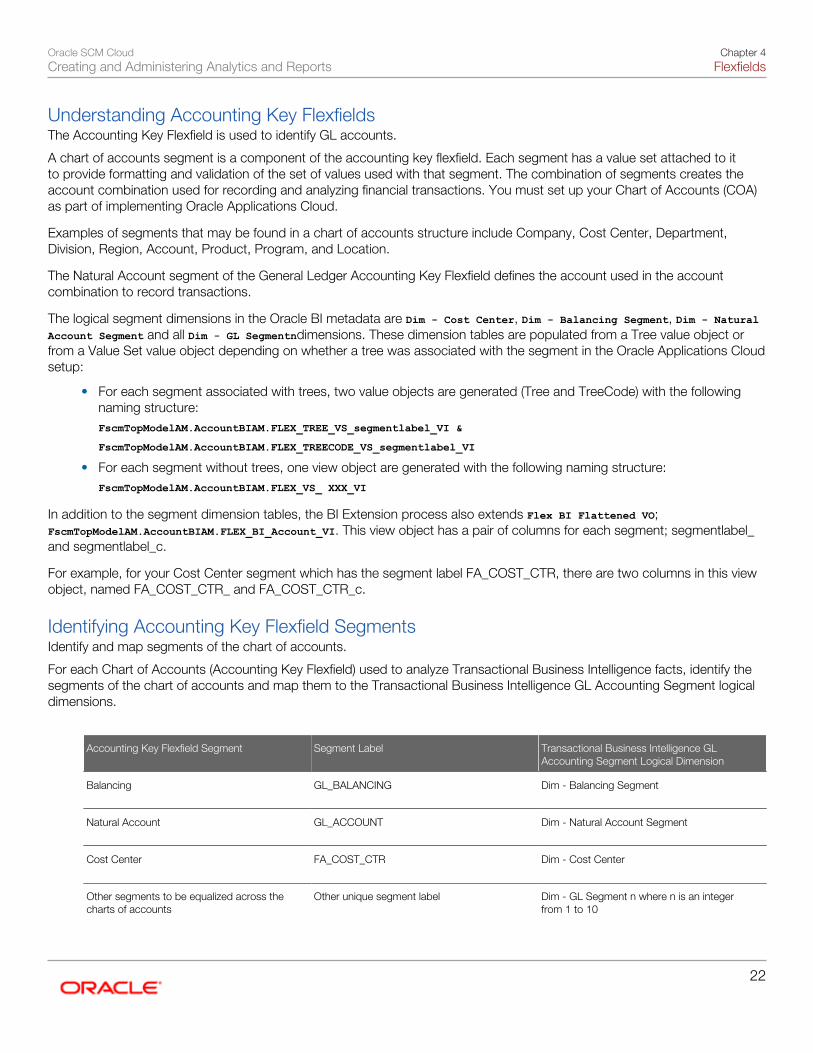
Identifying Accounting Key Flexfield SegmentsIdentify and map segments of the chart of accounts.
For each Chart of Accounts (Accounting Key Flexfield) used to analyze Transactional Business Intelligence facts, identify thesegments of the chart of accounts and map them to the Transactional Business Intelligence GL Accounting Segment logicaldimensions.
Accounting Key Flexfield Segment Segment Label Transactional Business Intelligence GLAccounting Segment Logical Dimension
Balancing
GL_BALANCING
Dim - Balancing Segment
Natural Account
GL_ACCOUNT
Dim - Natural Account Segment
Cost Center
FA_COST_CTR
Dim - Cost Center
Other segments to be equalized across thecharts of accounts
Other unique segment label
Dim - GL Segment n where n is an integerfrom 1 to 10
Oracle SCM CloudCreating and Administering Analytics and Reports
Chapter 4Flexfields
23
Accounting Key Flexfield Segment Segment Label Transactional Business Intelligence GLAccounting Segment Logical Dimension
Assigning Unique Segment LabelsYou must assign a unique segment label to the charts of accounts segments that are the balancing segments or the naturalaccount segments, and that are used for specific purposes.
For example, assign the Primary Balancing segment label to the segment used for your company or legal entities in order toprovide a correct recording of intercompany transactions and company analysis. You can assign other segment labels whenrequired.
To assign unique segment labels to charts of accounts segments:
1. Launch the Manage Charts of Accounts task and then navigate to the Manage Chart of Accounts page.2. In the Search section, enter the GL# for the Key Flexfield Code and click the Search button.3. In the Search Results section, select Accounting Flexfield and click the Manage Structures button to navigate to
Manage Key Flexfield Structures.4. In the Search section, enter the chart of accounts code or the name for Structure Code or Name and click the
Search button.5. In the Search Results section, select the chart of accounts and click Edit to navigate to the Edit Key Flexfield
Structure window6. Select the Enabled check box to code-enable the Structure code.7. In the Segments section, select the applicable segments and click Edit to navigate to the Edit Key Flexfield Segment
window.8. Select the Enabled check box to enable the segments.9. In the Segment Labels section, select the unique segment labels to equalize the segments across the charts of
accounts, and click the right arrow to move the segments to the selected list.10. Click Save and Close to return to the Edit Key Flexfield Structure window.11. Click Done to return to the Manage Key Flexfields window.
Performing Column FlatteningColumn flattening of trees is required in order for OTBI hierarchy analyses to be populated with correct data.
To flatten columns for account hierarchies:
1. Launch Manage Trees and Tree Versions and navigate to the Manage Trees and Tree Versions window.2. In the Search section, enter GL_ACCT_FLEX for the Tree Structure Code and the involved tree code or name, and
click Search.3. In the Search Results section, select the tree version you want to flatten. If the status of the Tree Version is Draft, to
make the Tree Version active, select Actions, then Status, and then Active.4. (Optional): After the tree version is specified, perform an audit on the Tree Version to ensure its integrity before
launching the flattening job. Select Actions and then Audit. See the section on working with Trees in theDeveloper's Guide.
5. Choose Column Flattening from the Actions drop-down menu.6. Click the Online Flattening button to launch the flattening job immediately, or click the Schedule Flattening
button to schedule the flattening job according to your requirements.
Designating GL Accounting Segment Instances as BI-EnabledSpecify the applicable chart of accounts segment instances that are BI-enabled to make them available for use inTransactional Business Intelligence.
Oracle SCM CloudCreating and Administering Analytics and Reports
Chapter 4Flexfields
24
To specify the chart of accounts segment instances as BI-enabled:
1. In the Search Results section of the Manage Key Flexfields window, select Accounting Flexfield and click theManage Structure Instances button to navigate to the Manage Key Flexfield Structure Instances window.
2. In the Search section, select the chart of accounts for Structure Name and click the Search button.3. In the Search Results section, select the structure instance and click Edit to navigate to the Edit Key Flexfield
Structure Instance window.4. Check the Enabled check box to code-enable the structure instance.5. In the Segment Instances section, select the segment instances and click Edit to update. Each of the segment
instances must be selected individually.6. Select the Business Intelligence enabled check box in the Edit Key Flexfield Segment pop-up window and click
OK to return to Edit Key Flexfield Structure Instance window.7. After you have enabled all applicable segment instances for Business Intelligence, click Save and Close to save the
changes and return to the Edit Key Flexfield Structure Instance window.8. Repeat steps 2 - 6 for each chart of accounts to enable all the applicable segment instances for Business
Intelligence.9. Click Done to return to the Manage Key Flexfields window.
10. After you have configured all the charts of accounts, click the Deploy Flexfield button to deploy the AccountingFlexfield and make the latest definition available for use.
Deploying Accounting Key FlexfieldsAfter you have set up accounting key flexfields, you must deploy them.
Accounting key flexfields have one of the following deployment statuses:
• Edited: The flexfield definition has not been deployed or changes have been made to the structure, the structureinstances, or the value sets.
• Patched: The flexfield definition has been modified through an update, but the flexfield has not yet been deployed sothe updated definition is not reflected.
• Deployed to Sandbox: The flexfield is deployed and available in a flexfield-enabled sandbox.
• Deployed: The flexfield definition is deployed and available to end users.
• Error: The deployment attempt failed.
To deploy accounting key flexfields:
1. Access Manage Chart of Accounts from Setup and Maintenance work area.2. Click Search.3. Locate the Deployment Status column.4. Click the icon under the heading.5. Select Edited.6. Click Deploy Flexfield.7. Monitor the Deployment Status and when it reaches 100% click OK.8. Verify that a green check mark displays in the Deployment Status column.9. Click Done.
Related Topics
• Specifying Performance Options for a Tree Structure: Points to Consider
• Deploying Flexfields Using the Command Line: Explained
Oracle SCM CloudCreating and Administering Analytics and Reports
Chapter 4Flexfields
25
Configuring Descriptive Flexfields for TransactionalBusiness Intelligence
Configuring Descriptive Flexfields for Transactional BusinessIntelligence: OverviewConfigure descriptive flexfields to track unique information not typically found on business forms.
Descriptive flexfields can store several important details on a form without cluttering it. For example, several details may makean asset form heavy and unmanageable. However, the user still needs to access those details and therefore, they must bepresent on the form. In such cases, descriptive flexfields are convenient to use and are easy to manage.
Descriptive flexfields provide a way for you to add custom attributes to entities and to define validation and display propertiesfor them. A descriptive flexfield is a logical grouping of attributes (segments) that are mapped to a set of extension columnswhich are shipped as part of Oracle Applications Cloud tables.
Configuring Descriptive Flexfield Segments: ProcedureIf a descriptive flexfield is enabled for Oracle Business Intelligence, you can enable global and context segments for OracleBusiness Intelligence, and you can select segment labels. Not all descriptive flexfields are supported for Business Intelligence.
Configuring a Descriptive Flexfield SegmentIf a descriptive flexfield is enabled for Oracle Business Intelligence, you can enable global and context segments for OracleBusiness Intelligence, and you can select segment labels. Not all descriptive flexfields are supported for Business Intelligence.
To configure available descriptive flexfield segments:
1. Navigate to the Setup and Maintenance window.2. Navigate to the Manage Descriptive Flexfields window.3. If the BI Enabled option is cleared, select it.4. Select the options for deployment of the descriptive flexfields.
Setting Descriptive Flexfields as BI-Enabled: ProcedureIf a descriptive flexfield is already defined, you can enable it for use in Business Intelligence reports. Not all descriptiveflexfields are supported for Business Intelligence.
Setting a Flexfield as BI-Enabled1. Navigate to Setup and Maintenance work area.2. Navigate to the Edit Descriptive Flexfields window.3. Enter the descriptive flexfield name.4. Check the BI Enabled option on the desired descriptive flexfields. If the option is unavailable, the flexfield is a non-
supported entity.
Oracle SCM CloudCreating and Administering Analytics and Reports
Chapter 4Flexfields
26
5. Click OK.6. Click Save.
Configuring Extensible Flexfields for Transactional BusinessIntelligence
Configuring Extensible Flexfields in SCM: ProcedureYou can use extensible flexfields to configure more segments.
An extensible flexfield is similar to a descriptive flexfield in that it provides a customizable expansion space that you can useto configure additional attributes (segments) without additional programming. As with descriptive flexfields, each segment isrepresented in the database as a single column. However, with extensible flexfields, the context values and context-sensitivesegments are stored in an extension table.
Note: To be able to view the Oracle Innovation Management Cloud custom attributes in subject areas and usethem, you must ensure that they are BI enabled.
Categories and ContextsYou can combine and arrange the segments into attribute groups that are tailored to your specific needs. For example, youcan group related segments so that they appear together on the page. The attribute groups are referred to as contexts. Youcan optionally set up an extensible flexfield to enable categorization of contexts.
You can add contexts and segments to extensible flexfields just like the descriptive flexfields. To see the extensible flexfieldsin analyses, you need to deploy them and then run the BI Extender Essbase scheduled process.
Configuring Extensible FlexfieldsTo configure extensible flexfields:
1. Open the Manage Extensible Flexfield task in the Setup and Maintenance work area.2. Search for the EFF you want to configure, then select it and click the Edit icon.3. In the Edit Extensible Flexfield dialog, highlight the category Display Name, then select Manage Contexts.4. In the Manage Context dialog, search for the context that contains the segment you want to configure, highlight it,
then click the Edit icon.5. In the Edit Context dialog, click the Edit icon.6. Edit the segment, as required, then click Save.
Related Topics
• Flexfield Usages: Explained
Oracle SCM CloudCreating and Administering Analytics and Reports
Chapter 4Flexfields
27
Setting Extensible Flexfields as BI-Enabled: ProcedureExtensible flexfields are BI enabled if at least one segment in a context is BI enabled.
Setting Extensible Flexfields as BI-EnabledTo set extensible flexfields as BI-enabled:
1. Navigate to Setup and Maintenance.2. Navigate to Manage Extensible Flexfields.3. Enter the extensible flexfield name; for example, Organization Information EFF.4. Select the applicable extensible flexfield, and then click Edit.5. Select the applicable Category. The category contexts are populated automatically.6. Click Manage Contexts7. In the Edit Context page, select the applicable Context, and then click Edit.8. Select the applicable Segment, and then click Edit.9. In the Edit Segment page, select the BI Enabled check box at the bottom of the screen.
10. Click Save.
Related Topics• Configuring Extensible Flexfields: Procedure
Essbase Rule File and Cubes: OverviewGenerate the Essbase rule file by running the Create Rules XML File for BI Extender Automation scheduled process.
The Essbase rule file must be generated for all Oracle Essbase cubes mapped in the repository file (RPD).
Job Status ConditionsThe process status displays one of these conditions.
• INIT: The process has just begun and is waiting for the extender command line JAR to update the status with moredetails.
• COMPLETED_NO_EXTENSION_NEEDED: No new Flex changes were detected in any of the Oracle ApplicationsCloud sources; because the RPD is already synchronized with all Flex changes, no changes were made in the RPD.
• COMPLETED: The RPD was successfully updated with Flex changes and uploaded into the Oracle BusinessIntelligence server.
• FAILED: Error conditions exist which require manual intervention.
Related Topics• Submitting Scheduled Processes and Process Sets: Procedure
Importing Changes to Flexfields Automatically
Oracle SCM CloudCreating and Administering Analytics and Reports
Chapter 4Flexfields
28
Importing Flexfield Changes: OverviewYou can use the Import Oracle Fusion Data Extensions for Transactional Business Intelligence scheduled process to importyour flexfield changes.
Use the Import Oracle Fusion Data Extensions for Transactional Business Intelligence scheduled process to automaticallyimport the following types of changes:
• Key Flexfield changes
• Descriptive Flexfield changes
• Extensible Flexfield changes
The Import Oracle Fusion Data Extensions for Transactional Business Intelligence scheduled process imports extensible data,including data in descriptive flexfield segments, key flexfield segments, and General Ledger balances in Essbase cubes.
If you have changes to key flexfields and descriptive flexfields, you can import all the changes in the same scheduled process.
This is an Oracle Applications Cloud scheduled process; it is not related to BI Applications. Detailed information on thisprocess can be found in Oracle Applications Cloud documentation.
Note: We strongly recommend that you backup the Oracle Business Intelligence Enterprise Edition prior toimporting any flexfield changes. Running the process disconnects all users from the server. You should not runthis process when maintenance operations or system updates are being performed on the server.
Running the Import Scheduled Process: ProcedureTo import changes, run the Import Oracle Fusion Data Extensions for Transactional Business Intelligence scheduled process.
Running the JobTo run the process:
1. In the Scheduled Processes window, select Search and Select: Name.2. Select Search and Select: Name.3. Highlight Import Oracle Fusion Data Extensions for Transactional Business Intelligence.4. Click OK.5. Schedule the process.
Process Status ConditionsWhen the process is finished, the biExtenderCMDUtility.jar writes the status of the process into the JNDI fileess_biExtenderEssJob_jobStatus, which can be viewed in Oracle WebLogic Server.
The process status displays one of the following conditions:
• INIT: The process has just begun and is waiting for the extender command line JAR to update the status with moredetails.
• COMPLETED_NO_EXTENSION_NEEDED: No new Flex changes were detected in any of the Oracle ApplicationsCloud sources; because the Oracle Business Intelligence is already synchronized with all Flex changes, no changeswere made in the Oracle Business Intelligence.
Oracle SCM CloudCreating and Administering Analytics and Reports
Chapter 4Flexfields
29
• COMPLETED: Oracle Business Intelligence was successfully updated with Flex changes and uploaded into theOracle Business Intelligence Server.
• COMPLETED: PROCESS_ERRORS: Oracle Business Intelligence was updated with the Flex changes but with somewarnings that require manual intervention.
• FAILED: Error conditions exist that require manual intervention.
Successful Import ProcessIf the import process is successful, you can perform the following actions:
• Query subject areas by segment dimensions such as Balancing Segment and Cost Center.
• Access DFF attributes for analyses.
• Use the General Ledger - Balances Real Time subject area to query Oracle Essbase cubes.
Disabling Flexfields as BI-Enabled
OverviewIf you created a flexfield that you no longer want to use or report against, you can disable the flexfield as BI-enabled.
There may be times, such as during development phases, when you try using a flexfield and later determine it is no longerneeded.
Note: If you are considering disabling flexfields, keep in mind that any flexfields created in Oracle ApplicationsCloud must be designated as BI-enabled to be exposed in Transactional Business Intelligence. If you disablea flexfield, it cannot be deployed. Also, error conditions may occur if you disable a descriptive flexfield thathas been implemented in BI Applications. If error conditions arise from disabling flexfields as BI-enabled,troubleshooting the errors can be difficult and time-consuming.
Disabling Key Flexfields as BI-Enabled: ProcedureIf you created a flexfield that you no longer want to use or report against, you can disable the flexfield as BI-enabled.
If you are considering disabling key flexfields, keep in mind that any flexfields created in Oracle Applications Cloud must bedesignated as BI-enabled to be exposed in Transactional Business Intelligence.
Disabling Key FlexfieldsTo disable key flexfields as BI-enabled:
1. Navigate to Manage Key Flexfields .2. Enter your search value in Key Flexfield Code.3. Click Manage Structure Instances.4. Enter your search value in Structure Instance Code.5. Click Edit. The Edit Key Flexfield Structure Instance dialog box displays.6. In Edit Key Flexfield Segment Instance, deselect the BI Enabled option.
Oracle SCM CloudCreating and Administering Analytics and Reports
Chapter 4Flexfields
30
7. Click OK, then Save.
Disabling Descriptive Flexfields as BI-Enabled: ProcedureIf you created a flexfield that you no longer want to use or report against, you can disable the flexfield as BI-enabled.
If you are considering disabling descriptive flexfields, keep in mind that any flexfields created in Oracle Applications Cloudmust be designated as BI-enabled to be exposed in Transactional Business Intelligence.
Disabling Descriptive FlexfieldsTo disable descriptive flexfields as BI-enabled:
1. Navigate to Setup and Maintenance.2. Navigate to the Edit Descriptive Flexfields window.3. Enter the Descriptive Flexfield Name.4. Deselect the BI Enabled option on the desired descriptive flexfields.5. Click OK, then Save.
Disabling Extensible Flexfields as BI-Enabled: ProcedureIf you created a flexfield that you no longer want to use or report against, you can disable the flexfield as BI-enabled.
If you are considering disabling extensible flexfields, keep in mind that any flexfields created in Oracle Applications Cloud mustbe designated as BI-enabled to be exposed in Oracle Transactional Business Intelligence.
Disabling Extensible FlexfieldsTo disable extensible flexfields as BI-enabled:
1. Navigate to Setup and Maintenance, then Manage Extensible Flexfields.2. Enter the extensible flexfield Name; for example, "Organization Information EFF."3. Select the applicable extensible flexfield and click Edit to navigate to Edit Extensible Flexfield.4. Select the applicable Category. The category contexts are populated automatically.5. Click Manage Contexts to navigate to Manage Contexts.6. Select the applicable Context and click Edit to navigate to Edit Context.7. Select the applicable Segment and click Edit to navigate to Edit Segment.8. Deselect the BI Enabled option displayed at the bottom of the screen.9. Click Save.
Dimensions Supported by Descriptive Flexfields
Oracle SCM CloudCreating and Administering Analytics and Reports
Chapter 4Flexfields
31
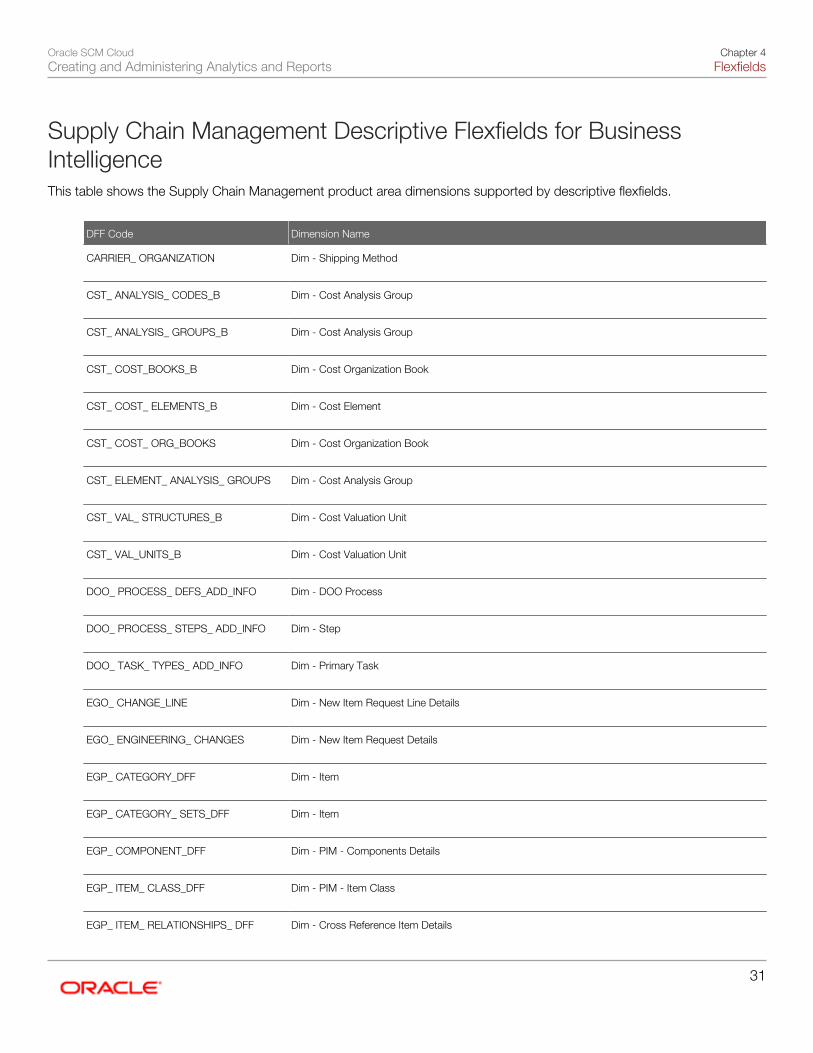
Supply Chain Management Descriptive Flexfields for BusinessIntelligenceThis table shows the Supply Chain Management product area dimensions supported by descriptive flexfields.
DFF Code Dimension Name
CARRIER_ ORGANIZATION
Dim - Shipping Method
CST_ ANALYSIS_ CODES_B
Dim - Cost Analysis Group
CST_ ANALYSIS_ GROUPS_B
Dim - Cost Analysis Group
CST_ COST_BOOKS_B
Dim - Cost Organization Book
CST_ COST_ ELEMENTS_B
Dim - Cost Element
CST_ COST_ ORG_BOOKS
Dim - Cost Organization Book
CST_ ELEMENT_ ANALYSIS_ GROUPS
Dim - Cost Analysis Group
CST_ VAL_ STRUCTURES_B
Dim - Cost Valuation Unit
CST_ VAL_UNITS_B
Dim - Cost Valuation Unit
DOO_ PROCESS_ DEFS_ADD_INFO
Dim - DOO Process
DOO_ PROCESS_ STEPS_ ADD_INFO
Dim - Step
DOO_ TASK_ TYPES_ ADD_INFO
Dim - Primary Task
EGO_ CHANGE_LINE
Dim - New Item Request Line Details
EGO_ ENGINEERING_ CHANGES
Dim - New Item Request Details
EGP_ CATEGORY_DFF
Dim - Item
EGP_ CATEGORY_ SETS_DFF
Dim - Item
EGP_ COMPONENT_DFF
Dim - PIM - Components Details
EGP_ ITEM_ CLASS_DFF
Dim - PIM - Item Class
EGP_ ITEM_ RELATIONSHIPS_ DFF Dim - Cross Reference Item Details
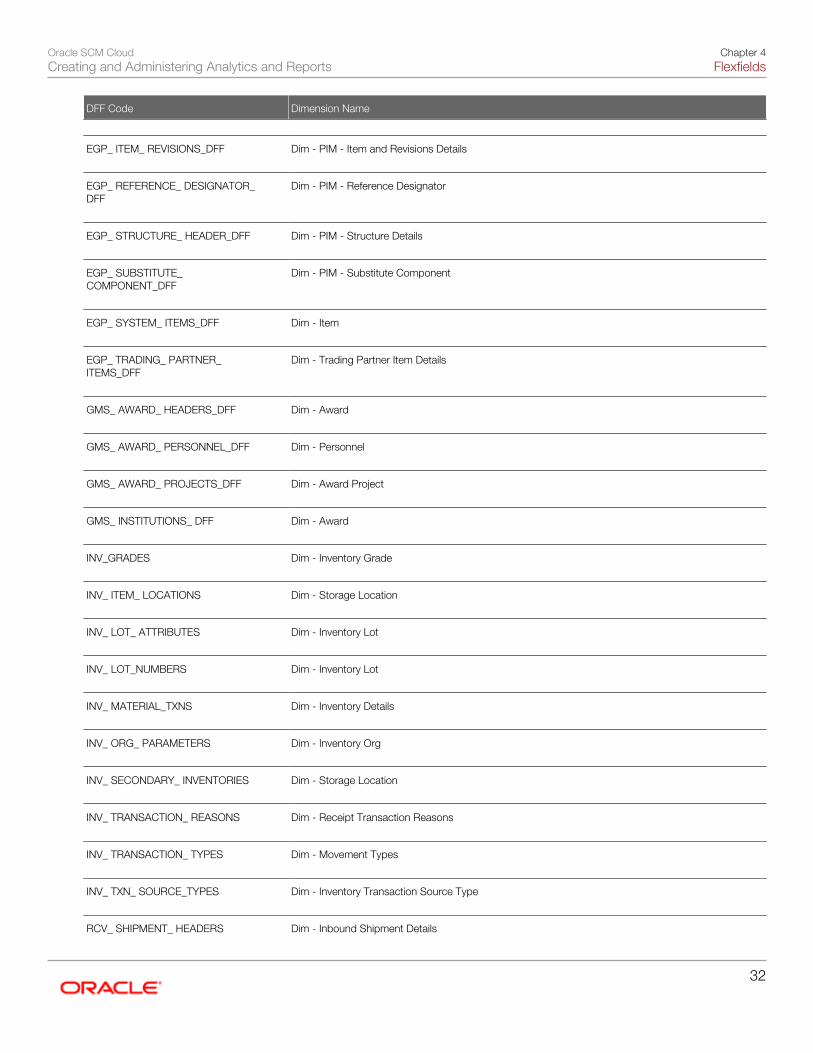
Oracle SCM CloudCreating and Administering Analytics and Reports
Chapter 4Flexfields
32
DFF Code Dimension Name
EGP_ ITEM_ REVISIONS_DFF
Dim - PIM - Item and Revisions Details
EGP_ REFERENCE_ DESIGNATOR_DFF
Dim - PIM - Reference Designator
EGP_ STRUCTURE_ HEADER_DFF
Dim - PIM - Structure Details
EGP_ SUBSTITUTE_COMPONENT_DFF
Dim - PIM - Substitute Component
EGP_ SYSTEM_ ITEMS_DFF
Dim - Item
EGP_ TRADING_ PARTNER_ITEMS_DFF
Dim - Trading Partner Item Details
GMS_ AWARD_ HEADERS_DFF
Dim - Award
GMS_ AWARD_ PERSONNEL_DFF
Dim - Personnel
GMS_ AWARD_ PROJECTS_DFF
Dim - Award Project
GMS_ INSTITUTIONS_ DFF
Dim - Award
INV_GRADES
Dim - Inventory Grade
INV_ ITEM_ LOCATIONS
Dim - Storage Location
INV_ LOT_ ATTRIBUTES
Dim - Inventory Lot
INV_ LOT_NUMBERS
Dim - Inventory Lot
INV_ MATERIAL_TXNS
Dim - Inventory Details
INV_ ORG_ PARAMETERS
Dim - Inventory Org
INV_ SECONDARY_ INVENTORIES
Dim - Storage Location
INV_ TRANSACTION_ REASONS
Dim - Receipt Transaction Reasons
INV_ TRANSACTION_ TYPES
Dim - Movement Types
INV_ TXN_ SOURCE_TYPES
Dim - Inventory Transaction Source Type
RCV_ SHIPMENT_ HEADERS Dim - Inbound Shipment Details
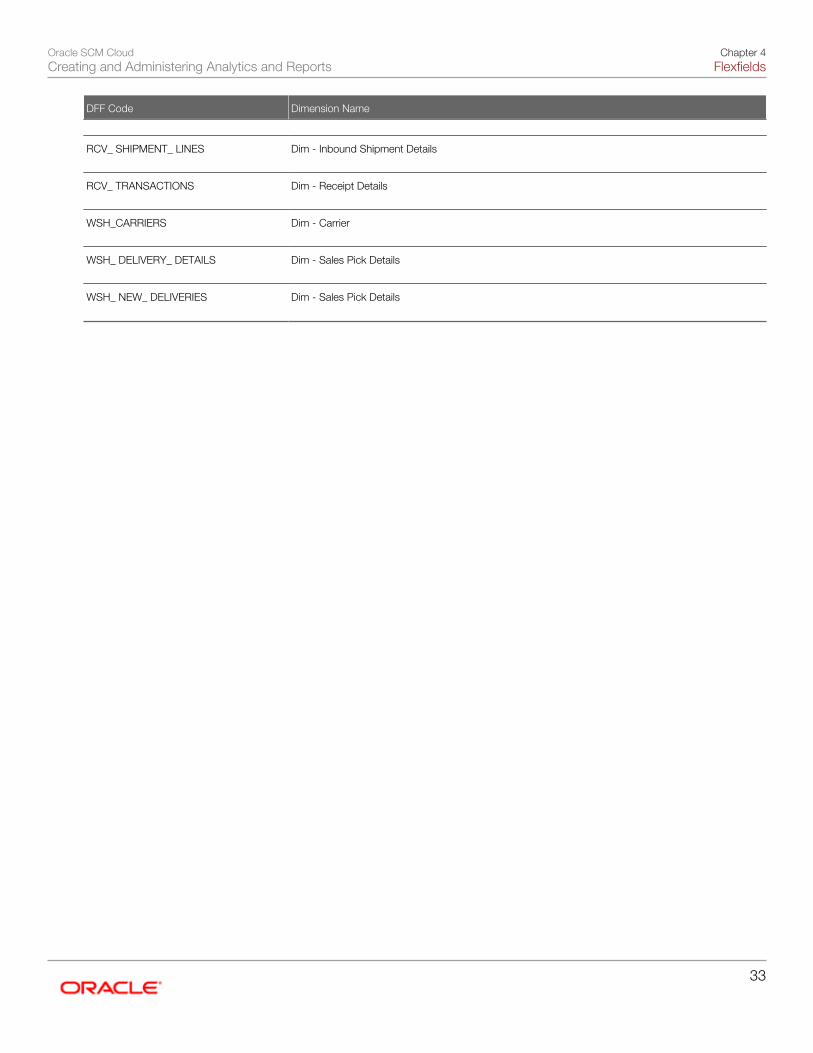
Oracle SCM CloudCreating and Administering Analytics and Reports
Chapter 4Flexfields
33
DFF Code Dimension Name
RCV_ SHIPMENT_ LINES
Dim - Inbound Shipment Details
RCV_ TRANSACTIONS
Dim - Receipt Details
WSH_CARRIERS
Dim - Carrier
WSH_ DELIVERY_ DETAILS
Dim - Sales Pick Details
WSH_ NEW_ DELIVERIES
Dim - Sales Pick Details
Oracle SCM CloudCreating and Administering Analytics and Reports
Chapter 4Flexfields
34
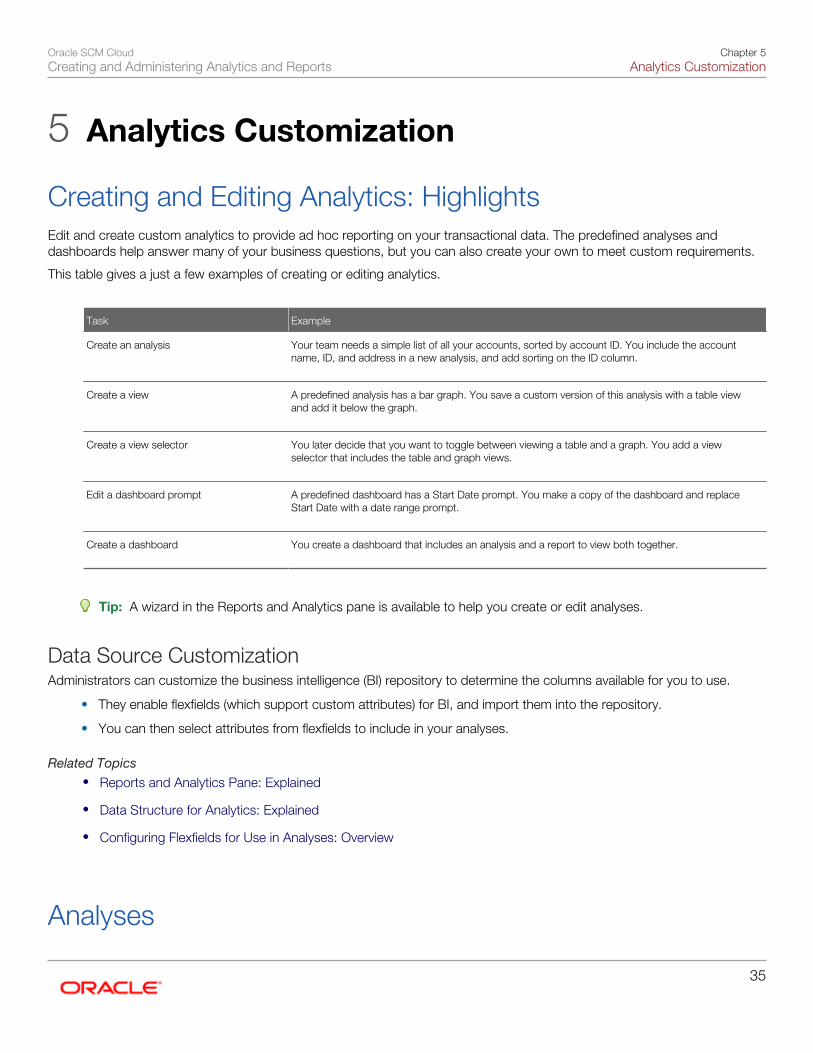
Oracle SCM CloudCreating and Administering Analytics and Reports
Chapter 5Analytics Customization
35
5 Analytics Customization
Creating and Editing Analytics: HighlightsEdit and create custom analytics to provide ad hoc reporting on your transactional data. The predefined analyses anddashboards help answer many of your business questions, but you can also create your own to meet custom requirements.
This table gives a just a few examples of creating or editing analytics.
Task Example
Create an analysis
Your team needs a simple list of all your accounts, sorted by account ID. You include the accountname, ID, and address in a new analysis, and add sorting on the ID column.
Create a view
A predefined analysis has a bar graph. You save a custom version of this analysis with a table viewand add it below the graph.
Create a view selector
You later decide that you want to toggle between viewing a table and a graph. You add a viewselector that includes the table and graph views.
Edit a dashboard prompt
A predefined dashboard has a Start Date prompt. You make a copy of the dashboard and replaceStart Date with a date range prompt.
Create a dashboard
You create a dashboard that includes an analysis and a report to view both together.
Tip: A wizard in the Reports and Analytics pane is available to help you create or edit analyses.
Data Source CustomizationAdministrators can customize the business intelligence (BI) repository to determine the columns available for you to use.
• They enable flexfields (which support custom attributes) for BI, and import them into the repository.
• You can then select attributes from flexfields to include in your analyses.
Related Topics• Reports and Analytics Pane: Explained
• Data Structure for Analytics: Explained
• Configuring Flexfields for Use in Analyses: Overview
Analyses
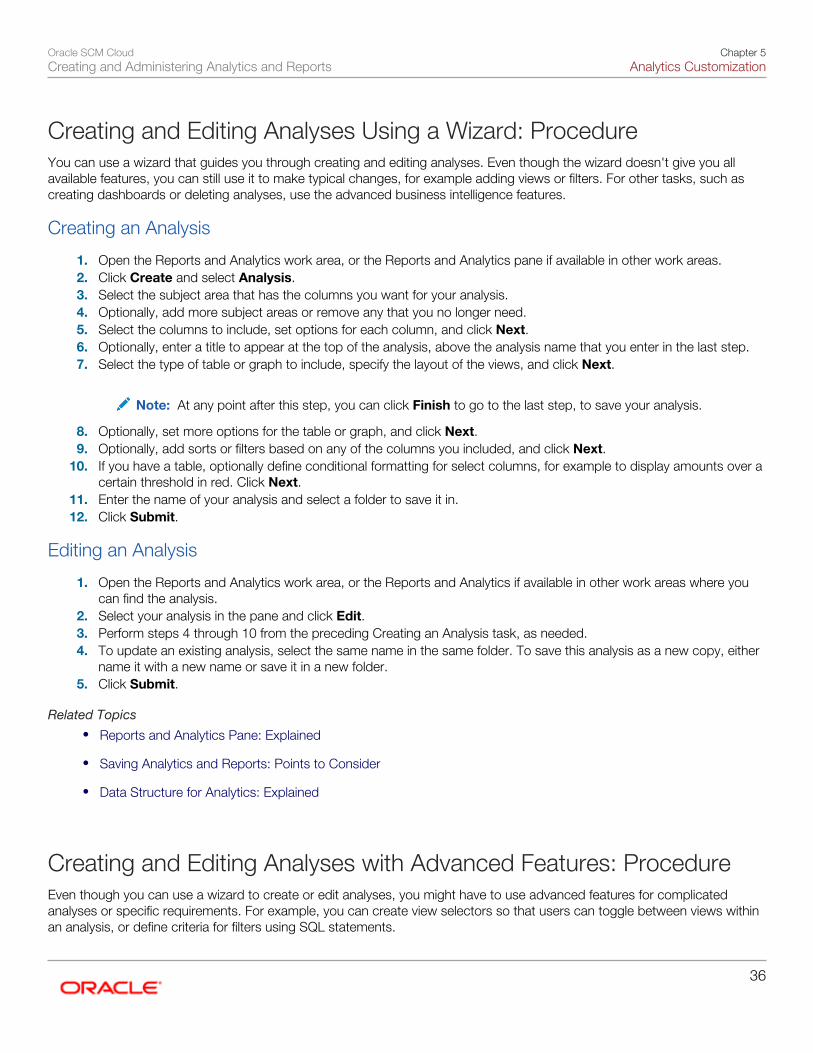
Oracle SCM CloudCreating and Administering Analytics and Reports
Chapter 5Analytics Customization
36
Creating and Editing Analyses Using a Wizard: ProcedureYou can use a wizard that guides you through creating and editing analyses. Even though the wizard doesn't give you allavailable features, you can still use it to make typical changes, for example adding views or filters. For other tasks, such ascreating dashboards or deleting analyses, use the advanced business intelligence features.
Creating an Analysis
1. Open the Reports and Analytics work area, or the Reports and Analytics pane if available in other work areas.2. Click Create and select Analysis.3. Select the subject area that has the columns you want for your analysis.4. Optionally, add more subject areas or remove any that you no longer need.5. Select the columns to include, set options for each column, and click Next.6. Optionally, enter a title to appear at the top of the analysis, above the analysis name that you enter in the last step.7. Select the type of table or graph to include, specify the layout of the views, and click Next.
Note: At any point after this step, you can click Finish to go to the last step, to save your analysis.
8. Optionally, set more options for the table or graph, and click Next.9. Optionally, add sorts or filters based on any of the columns you included, and click Next.
10. If you have a table, optionally define conditional formatting for select columns, for example to display amounts over acertain threshold in red. Click Next.
11. Enter the name of your analysis and select a folder to save it in.12. Click Submit.
Editing an Analysis
1. Open the Reports and Analytics work area, or the Reports and Analytics if available in other work areas where youcan find the analysis.
2. Select your analysis in the pane and click Edit.3. Perform steps 4 through 10 from the preceding Creating an Analysis task, as needed.4. To update an existing analysis, select the same name in the same folder. To save this analysis as a new copy, either
name it with a new name or save it in a new folder.5. Click Submit.
Related Topics
• Reports and Analytics Pane: Explained
• Saving Analytics and Reports: Points to Consider
• Data Structure for Analytics: Explained
Creating and Editing Analyses with Advanced Features: ProcedureEven though you can use a wizard to create or edit analyses, you might have to use advanced features for complicatedanalyses or specific requirements. For example, you can create view selectors so that users can toggle between views withinan analysis, or define criteria for filters using SQL statements.
Oracle SCM CloudCreating and Administering Analytics and Reports
Chapter 5Analytics Customization
37
You can also perform other actions on analyses, for example delete them or copy and paste them within the businessintelligence catalog.
Creating or Editing an Analysis
1. Open the Reports and Analytics work area, or the Reports and Analytics pane if available in other work areas.2. Click the Browse Catalog button.3. Click the New button, select Analysis under Analysis and Interactive Reporting, and select a subject area.
Or, select your analysis in the Folders pane and click Edit.4. Use the tabs as described in this table.
Tab Task
Criteria
Select and define the columns to include. Add filters.
Results
Add views and set options for results.
Prompts
Define prompts to filter all views in the analysis.
Advanced
View or update the XML code and logical SQL statement that the analysis generates. Set options related to query performance.
5. Save your analysis.
Performing Other Actions on an Analysis
1. Open the Reports and Analytics work area, or the Reports and Analytics pane if available in other work areas whereyou can find the analysis.
2. Select your analysis in the pane and click More.3. Click More for your analysis and select the desired action, for example Delete or Copy.
Related Topics
• Reports and Analytics Pane: Explained
• Data Structure for Analytics: Explained
• Saving Analytics and Reports: Points to Consider
Creating a Change Order Approval Cycle Time by Reason Analysis:Worked ExampleYou are a product manager and you want to create an analysis to help you review change order approval cycle times. Theapproval times are to be analyzed by change reasons.
Oracle SCM CloudCreating and Administering Analytics and Reports
Chapter 5Analytics Customization
38
The following table summarizes key decisions for creating the analysis.
Decisions to Consider In This Example
What information to include?
• Change Order Approval Cycle Time• Reason
What type of layout is required?
Table with a bar below it
Do the table columns require any special formatting?
Yes, for the purpose of easier scanning. For the table, associatecolors with thresholds so that line items with approval cycle time often or more days are highlighted in red, and of five or fewer days arehighlighted in green.
Is this analysis available for others to use?
No. Save it to My Folders.
To create an analysis of Change Order Approval Cycle time by Reason, complete these tasks:
1. Select columns2. Define the layout3. Add column formatting4. Save the analysis
Selecting Columns1. Navigate to Reports and Analytics work area.2. Click Create.3. Select Analysis.4. In the Select Subject Area Window, select the Product Management - Change Order Real Time subject area.5. On the Create Analysis: Select Columns page, expand the Product Management - Change Order Real Time
folder.6. Expand the Change Order folder.7. Select Approval Cycle Time and click the Add icon button to move the column to the Selected Columns area.8. Expand the Change Order Reason folder.9. Select Change Order Reason and click the Add icon button to move the column to the Selected Columns area.
10. Click Next.
Defining the Layout1. On the Create Analysis: Select Views page, enter Change Order Approval Cycle Time in the Name field.2. Next to the Table field, click None to open the Table menu.3. Select Table (recommended).4. Next to the Graph field, click None to open the Graph menu.5. Select Bar (recommended).6. Use the default layout value of Table above Graph.7. Click Next.8. On the Create Analysis: Edit Table page, select Change Order Reason and click the Move selected item to top of
list icon.9. Click Next.
10. On the Create Analysis: Edit Graph page, click Next.11. On the Create Analysis: Sort and Filter Page, click Next.
Oracle SCM CloudCreating and Administering Analytics and Reports
Chapter 5Analytics Customization
39
Adding Column Formatting1. On the Create Analysis: Highlight page, click Add Column Format in the Formatting region.2. Select Approval Cycle Time.3. In the first Threshold field, enter 5, and click the down arrow in the first Color field. Select the color Green.
Tip: If you hover over the colors, hover text will show the name of the color.4. In the second Threshold field, enter 10, and click the down arrow in the third Color field. Select the color Red (leave
the second color yellow).5. Click Next.
Saving the Analysis1. On the Create Analysis: Save page, enter Change Order Approval Cycle Time by Reason in the Analysis Name
field, enter a description and then select My folders in the Save In region.2. Click Submit.3. Click OK.
Dashboards
Creating and Editing Dashboards: ProcedureYou can create and edit dashboards to determine their content and layout. In addition to objects in the business intelligence(BI) catalog, such as analyses, reports, and prompts, you can add text, sections, and more to a dashboard.
Creating a Dashboard
1. Open the Reports and Analytics work area, or the Reports and Analytics pane if available in other work areas.2. Click Browse Catalog.3. Click New and select Dashboard under Analysis and Interactive Reporting.4. Enter the dashboard's name and description, and select a folder to save in.5. With the Add content now option selected, click OK.6. Optionally, add more pages, or tabs, within the dashboard.7. Drag and drop items from the Dashboard Objects or Catalog pane to add content to a page.8. Click Save.
Note: The first dashboard page is saved with the page 1 name by default. To rename this page:1. Click the Catalog link.2. In the Folders pane, select your dashboard.3. For page 1, click More and select Rename.4. Enter the new name and click OK.
Editing a Dashboard
1. Open the Reports and Analytics work area, or the Reports and Analytics pane if available in other work areas whereyou can find the dashboard.
Oracle SCM CloudCreating and Administering Analytics and Reports
Chapter 5Analytics Customization
40
2. Select your dashboard in the pane and click More.3. Click Edit.4. Perform steps 5 and 6 from the preceding Creating Dashboards task, and make other changes as needed, for
example:
◦ Remove content from the dashboard.
◦ Drag and drop within a page to move content around.
◦ Change the layout of a page.
Related Topics
• Saving Analytics and Reports: Points to Consider
• Reports and Analytics Pane: Explained
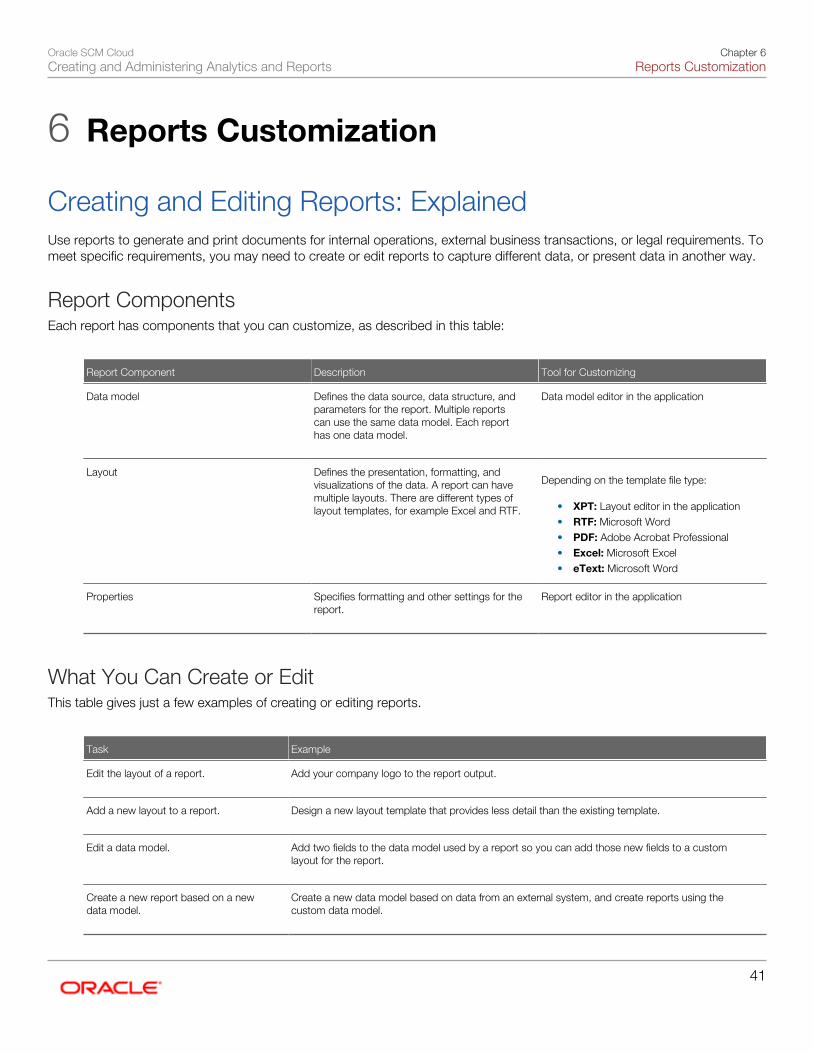
Oracle SCM CloudCreating and Administering Analytics and Reports
Chapter 6Reports Customization
41
6 Reports Customization
Creating and Editing Reports: ExplainedUse reports to generate and print documents for internal operations, external business transactions, or legal requirements. Tomeet specific requirements, you may need to create or edit reports to capture different data, or present data in another way.
Report ComponentsEach report has components that you can customize, as described in this table:
Report Component Description Tool for Customizing
Data model
Defines the data source, data structure, andparameters for the report. Multiple reportscan use the same data model. Each reporthas one data model.
Data model editor in the application
Layout
Defines the presentation, formatting, andvisualizations of the data. A report can havemultiple layouts. There are different types oflayout templates, for example Excel and RTF.
Depending on the template file type:
• XPT: Layout editor in the application• RTF: Microsoft Word• PDF: Adobe Acrobat Professional• Excel: Microsoft Excel• eText: Microsoft Word
Properties
Specifies formatting and other settings for thereport.
Report editor in the application
What You Can Create or EditThis table gives just a few examples of creating or editing reports.
Task Example
Edit the layout of a report.
Add your company logo to the report output.
Add a new layout to a report.
Design a new layout template that provides less detail than the existing template.
Edit a data model.
Add two fields to the data model used by a report so you can add those new fields to a customlayout for the report.
Create a new report based on a newdata model.
Create a new data model based on data from an external system, and create reports using thecustom data model.
Oracle SCM CloudCreating and Administering Analytics and Reports
Chapter 6Reports Customization
42
Accessing Report Components to Customize: Points toConsiderTo create or edit reports, you must access the business intelligence (BI) catalog. In the catalog, objects of type Reportrepresent the report definition, which includes report properties and layouts. Data models are separate objects in the catalog,usually stored in subfolders called Data Models.
Accessing the BI CatalogYou can access the BI catalog in any of the following ways:
• In the Reports and Analytics pane, click Browse Catalog to open the BI catalog, and find your report or data modelin the Folders pane.
• In the Reports and Analytics pane, find your report and select More to go to the report directly in the catalog. Thedata model associated with the report should be in the Data Models subfolder within the same folder as the report.
• Sign in to the application directly (for example: http://host:port/analytics/saw.dll) to open the catalog.
• Sign in to the BI server directly (for example: http://hostname.com:7001/xmlpserver) to open the catalog.
◦ Alternatively, once you are in the catalog using another method, for example, through the Reports andAnalytics pane, change the final node of the URL. For example, change (http://host:port/analytics/saw.dll) to xmlpserver. So the URL you use would be: http://host:port/xmlpserver.
Predefined ReportsA special Customize option is available only:
• For predefined reports, not data models.
• Through direct access to the BI server using the /xmlpserver URL. When you find your report in the BI catalog,select Customize from the More menu.
The Customize option automatically creates a custom copy of a predefined report and stores it in the Shared Folders -Custom folder within the catalog. The new report is linked to the original, so that when users open or schedule the original,they are actually using the custom version.
If you don't have access to the Customize option or don't want the original version linked to the new report, then make acopy of the predefined report and save it in the Custom folder.
Predefined Data ModelsDon't edit predefined data models. Instead, copy the data model into the Custom folder and edit the copy.
Related Topics
• Saving Analytics and Reports: Points to Consider
• What happens to customized analytics and reports when a patch is applied?
Oracle SCM CloudCreating and Administering Analytics and Reports
Chapter 6Reports Customization
43
Using the Customize Option for Predefined Reports: Pointsto ConsiderThe Customize option automatically creates a custom copy of a predefined report and stores it in the Shared Folders -Custom within the business intelligence (BI) catalog. The custom copy includes the report definition, folder structure, andoriginal report permissions, and is linked internally to the original report. You can edit the custom copy of the report, leavingthe original report intact. When users open or schedule the original report, they are actually using the custom version.
Benefits of the Customize OptionIn addition to conveniently copying a predefined report to the Custom folder, the Customize option:
• Makes it unnecessary to update processes or applications that invoke the report. For example, if the original report isset up to run as a scheduled process, you don't need to change the setup. When users submit the same scheduledprocess, the custom report runs instead of the original.
• Automatically copies the security settings of the original report.
• Removes the risk of patches overwriting your edits. If a patch updates the original report, the custom report is notupdated in any way.
Note: The custom report still references the original data model. The data model is not copied. A patchthat updates the data structure of the data model might affect your custom report.
Accessing the Customize OptionTo access the Customize option:
1. Sign in to the BI server (for example, http://hostname.com:7001/xmlpserver).2. In the Folders pane, select the predefined report.3. Select Customize from the More menu for the report.4. The copied report in the Custom folder opens, so proceed to edit this report.
To edit the custom report again later, you don't need to be in the BI server. Just go to the BI catalog and either:
• Select the Customize or Edit option for the original report.
• Find your custom report in the Custom folder and select Edit.
Related Topics
• Saving Analytics and Reports: Points to Consider
• What happens to customized analytics and reports when a patch is applied?
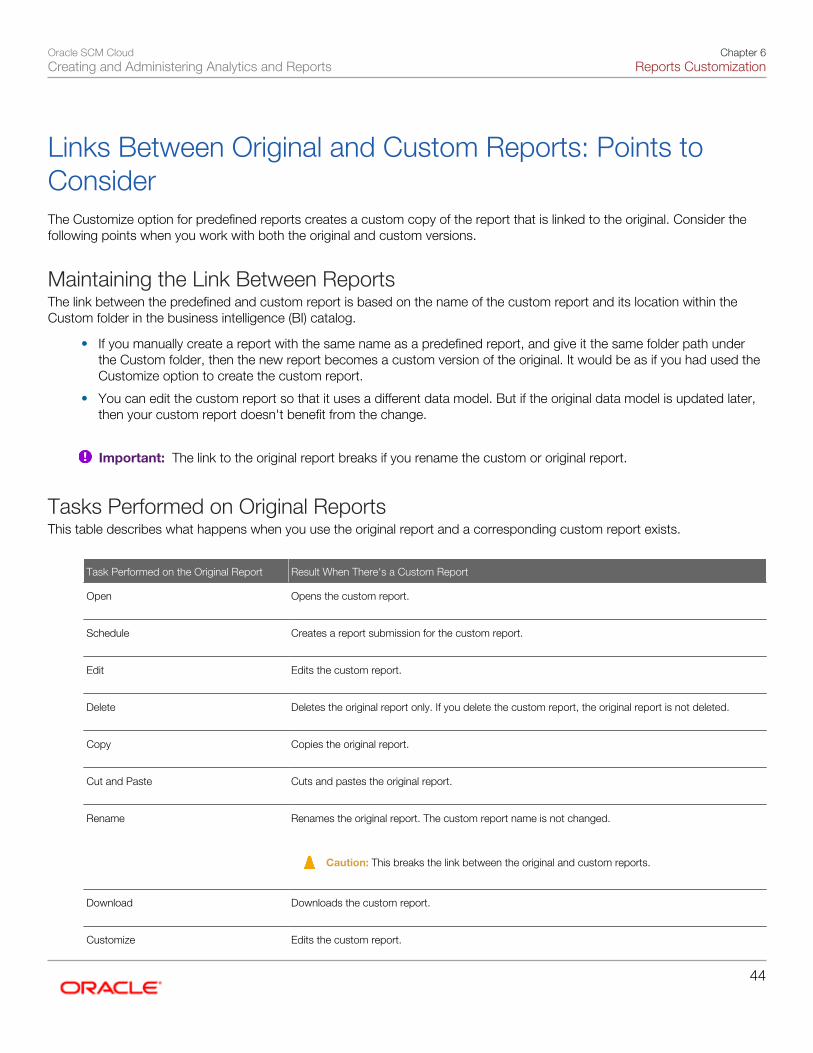
Oracle SCM CloudCreating and Administering Analytics and Reports
Chapter 6Reports Customization
44
Links Between Original and Custom Reports: Points toConsiderThe Customize option for predefined reports creates a custom copy of the report that is linked to the original. Consider thefollowing points when you work with both the original and custom versions.
Maintaining the Link Between ReportsThe link between the predefined and custom report is based on the name of the custom report and its location within theCustom folder in the business intelligence (BI) catalog.
• If you manually create a report with the same name as a predefined report, and give it the same folder path underthe Custom folder, then the new report becomes a custom version of the original. It would be as if you had used theCustomize option to create the custom report.
• You can edit the custom report so that it uses a different data model. But if the original data model is updated later,then your custom report doesn't benefit from the change.
Important: The link to the original report breaks if you rename the custom or original report.
Tasks Performed on Original ReportsThis table describes what happens when you use the original report and a corresponding custom report exists.
Task Performed on the Original Report Result When There's a Custom Report
Open
Opens the custom report.
Schedule
Creates a report submission for the custom report.
Edit
Edits the custom report.
Delete
Deletes the original report only. If you delete the custom report, the original report is not deleted.
Copy
Copies the original report.
Cut and Paste
Cuts and pastes the original report.
Rename
Renames the original report. The custom report name is not changed.
Caution: This breaks the link between the original and custom reports.
Download
Downloads the custom report.
Customize Edits the custom report.
Oracle SCM CloudCreating and Administering Analytics and Reports
Chapter 6Reports Customization
45
Task Performed on the Original Report Result When There's a Custom Report
History
Opens the job history of the custom report.
Related Topics
• Saving Analytics and Reports: Points to Consider
• What happens to customized analytics and reports when a patch is applied?
Layouts
Creating and Editing Report Layouts: OverviewThe layout determines what and how data is displayed on report output. Each report has at least one layout template. Thistopic describes the following aspects of report templates:
• Layout templates
• Layout template types
• Overall process of managing layouts
• Deleting layout templates
Layout TemplatesTo customize a layout, you edit the layout template, which:
• Defines the presentation components, such as tables and labeled fields.
• Maps columns from the data model to these components so that the data is displayed in the right place.
• Defines font sizes, styles, borders, shading, and other formatting, including images such as a company logo.
Layout Template TypesThere are a few types of template files to support different report layout requirements.
• RTF: Rich text format (RTF) templates created using Microsoft Word.
• XPT: Created using the application's layout editor, these templates are for interactive and more visually appealinglayouts.
• eText: These templates are specifically for Electronic Data Interchange (EDI) and electronic funds transfer (EFT)information.
You can also create and edit other types of templates using Adobe PDF, Microsoft Excel, Adobe Flash, and XSL-FO.
Oracle SCM CloudCreating and Administering Analytics and Reports
Chapter 6Reports Customization
46
Overall Process to Create or Edit LayoutsEditing or creating report layout, for example using Microsoft Word or the layout editor, involves making the actual changes tothe template file. But that task is just one part of the entire process for customizing layouts.
1. Copy the original report and save the custom version in Shared Folders - Custom in the business intelligence (BI)catalog. You create or edit templates for the custom copy of the report.
Tip: You can use the Customize option if the original is a predefined report.
2. Review report settings for online viewing.3. Generate sample data for the report.4. Edit or create the layout template file.5. Upload the template file to the report definition. Skip this step if you're using the layout editor.6. Configure the layout settings.
Deleting Layout TemplatesTo remove a layout template for a report:
1. Select your report in the BI catalog and click Edit.2. In the report editor, click View a list.3. Select the layout template and click Delete.
Making Reports Available for Online Viewing: ProcedureSome reports are set up so that you can only view them through another application or submit them as scheduled processes.To view your report online while you're editing it, you must define a few settings. When you're done editing your report, makesure that you reset these settings as needed.
Updating Report Properties
1. Select your report in the business intelligence catalog and click Edit.2. In the report editor, click Properties at the top of the page.3. In the Report Properties dialog box, select Run Report Online and deselect Report is Controlled by External
Application.
Updating Layout Settings
1. Back in the report editor, click View a list.2. Make sure that the View Online check box is selected.
Generating Sample Report Data: ProcedureDepending on the type of report layout changes you're making, sample data can be required or optional. You generatesample data, and then load it for use with your layout so that you can map data fields to layout components. For example, forthe Start Date table column in your layout, you can set it so that the data displayed in that column comes from the Start Datefield in the sample data.
Oracle SCM CloudCreating and Administering Analytics and Reports
Chapter 6Reports Customization
47
You can generate sample data from the:
• Report data model
• Report viewer
• Scheduler
Generating Sample Data from the Data ModelFollow these steps:
1. Select your data model in the business intelligence (BI) catalog and click Edit.
Tip: If you're not sure which data model is the source for your report, find the report in the catalog andclick Edit. The data model is displayed in the upper left corner of the report editor.
2. In the data model editor, click View Data.3. Enter values for any required parameters, select the number of rows to return, and click View.4. To save the sample data to the data model, click Save As Sample Data.
If you're designing an RTF template, click Export to save the file locally.5. Save the data model.
Saving Sample Data from the Report ViewerFor reports that are enabled for online viewing, you can save sample data from the report viewer:
1. Select the report in the BI catalog.2. Click Open to run the report in the report viewer with the default parameters.3. On the Actions menu, click Export, then click Data.4. Save the data file.
Saving Sample Data from the SchedulerFor reports that are enabled for scheduling (not necessarily as a scheduled process), you can save sample data from thescheduler:
1. Select the report in the BI catalog.2. Click Schedule.3. On the General tab, enter values for any report parameters.4. On the Output tab, ensure that Save Data for Republishing is selected.5. Click Submit.6. Open the Report Job History page.7. On the global header, click Open, then click Report Job History.8. Select your report job name in the Job Histories table.9. On the details page, under Output and Delivery, click the XML Data Download icon button.
Layout Templates
Creating and Editing Report Layout Templates Using the Layout Editor: ProcedureThe layout editor in the application provides an intuitive, drag-and-drop interface for creating pixel-perfect reports with PDF,RTF, Excel, PowerPoint, and HTML output. The layout template files you create with this tool have an .xpt extension. The
Oracle SCM CloudCreating and Administering Analytics and Reports
Chapter 6Reports Customization
48
layout editor tool is the only editing tool that provides dynamic HTML output. Users can interact with this output in a browser,for example by sorting, applying filters, and so on.
PrerequisiteMake sure that sample data is generated from the data model that your report is using.
Using the Layout EditorTo customize XPT templates:
1. Select the report in the business intelligence (BI) catalog and click Edit.2. In the report editor, click Edit to update a template.
Or, click Add New Layout and select a template type under the Create Layout section.3. Create or edit the layout.4. Click Save to save the layout to the report definition.
Setting Up for RTF and Excel Report Layout Templates: ProcedureYou can use Microsoft Word or Microsoft Excel to create or edit RTF and Excel layout templates, in addition to the layouteditor in the application. If you use Word or Excel directly, you must download and install the appropriate add-in so that theMicrosoft application has the features you need to design report layouts.
Note: If you're designing a new layout for your report, consider using the layout editor instead unless you are anexperienced layout designer.
Installing the Add-In
1. Open the Reports and Analytics work area, or the Reports and Analytics pane if available in other work areas.2. Click the Browse Catalog button.3. Click Home.4. Under the Get Started pane, click Download BI Desktop Tools.5. Select the add-in for the type of template you're working with.
◦ Template Builder for Word: RTF templates
◦ Analyzer for Excel: Excel templates
6. Save and then run the installer.
Creating and Editing RTF Report Layout Templates: ProcedureAn RTF template is a rich text format file that contains the layout instructions to use when generating the report output. UseMicrosoft Word with the Template Builder for Word add-in to design RTF templates.
PrerequisitesInstall the Template Builder for Word add-in, and generate sample data.
Using Template Builder for WordTo customize an RTF template:
1. If you are editing an existing layout:
a. Select your report in the business intelligence catalog and click Edit.b. In the report editor, click the Edit link of the layout to download the RTF file.
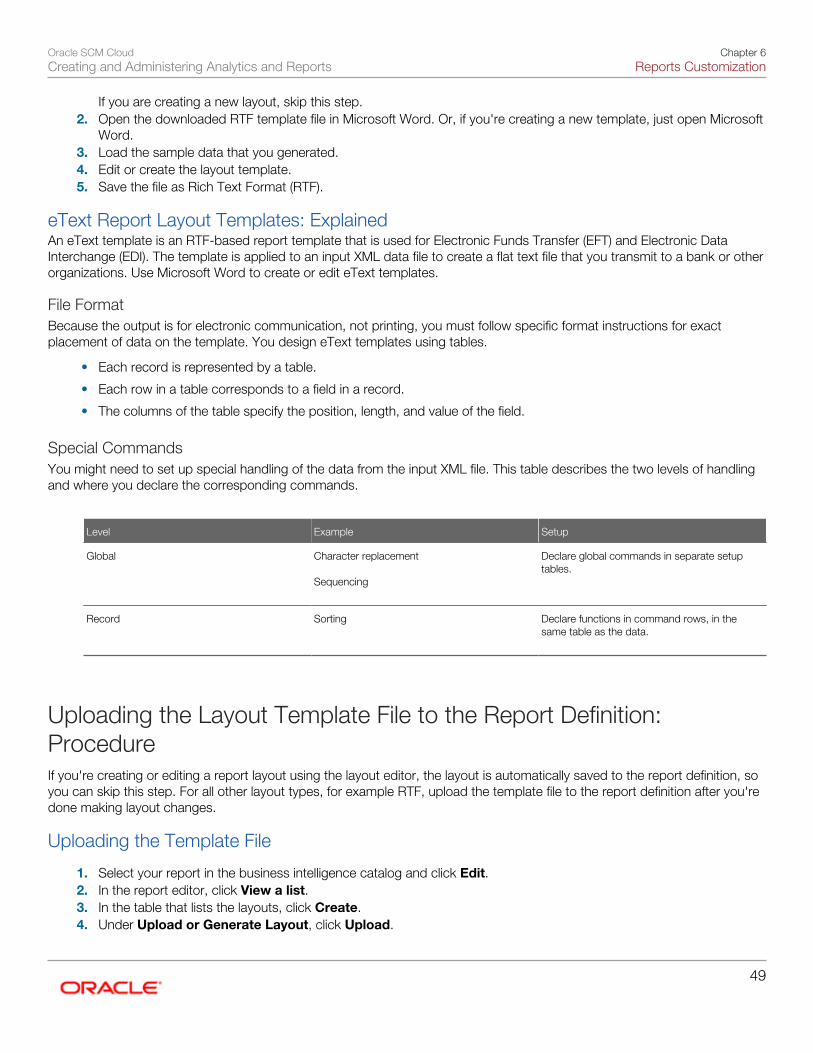
Oracle SCM CloudCreating and Administering Analytics and Reports
Chapter 6Reports Customization
49
If you are creating a new layout, skip this step.2. Open the downloaded RTF template file in Microsoft Word. Or, if you're creating a new template, just open Microsoft
Word.3. Load the sample data that you generated.4. Edit or create the layout template.5. Save the file as Rich Text Format (RTF).
eText Report Layout Templates: ExplainedAn eText template is an RTF-based report template that is used for Electronic Funds Transfer (EFT) and Electronic DataInterchange (EDI). The template is applied to an input XML data file to create a flat text file that you transmit to a bank or otherorganizations. Use Microsoft Word to create or edit eText templates.
File FormatBecause the output is for electronic communication, not printing, you must follow specific format instructions for exactplacement of data on the template. You design eText templates using tables.
• Each record is represented by a table.
• Each row in a table corresponds to a field in a record.
• The columns of the table specify the position, length, and value of the field.
Special CommandsYou might need to set up special handling of the data from the input XML file. This table describes the two levels of handlingand where you declare the corresponding commands.
Level Example Setup
Global
Character replacement Sequencing
Declare global commands in separate setuptables.
Record
Sorting
Declare functions in command rows, in thesame table as the data.
Uploading the Layout Template File to the Report Definition:ProcedureIf you're creating or editing a report layout using the layout editor, the layout is automatically saved to the report definition, soyou can skip this step. For all other layout types, for example RTF, upload the template file to the report definition after you'redone making layout changes.
Uploading the Template File
1. Select your report in the business intelligence catalog and click Edit.2. In the report editor, click View a list.3. In the table that lists the layouts, click Create.4. Under Upload or Generate Layout, click Upload.
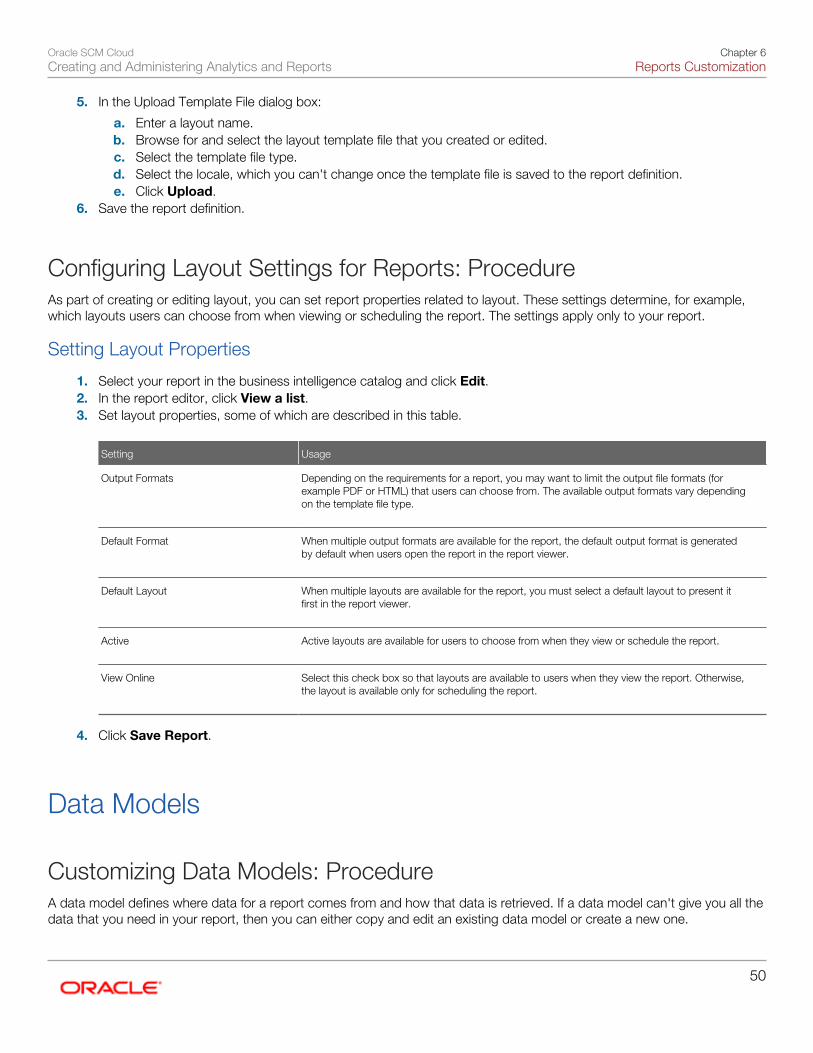
Oracle SCM CloudCreating and Administering Analytics and Reports
Chapter 6Reports Customization
50
5. In the Upload Template File dialog box:
a. Enter a layout name.b. Browse for and select the layout template file that you created or edited.c. Select the template file type.d. Select the locale, which you can't change once the template file is saved to the report definition.e. Click Upload.
6. Save the report definition.
Configuring Layout Settings for Reports: ProcedureAs part of creating or editing layout, you can set report properties related to layout. These settings determine, for example,which layouts users can choose from when viewing or scheduling the report. The settings apply only to your report.
Setting Layout Properties
1. Select your report in the business intelligence catalog and click Edit.2. In the report editor, click View a list.3. Set layout properties, some of which are described in this table.
Setting Usage
Output Formats
Depending on the requirements for a report, you may want to limit the output file formats (forexample PDF or HTML) that users can choose from. The available output formats vary dependingon the template file type.
Default Format
When multiple output formats are available for the report, the default output format is generatedby default when users open the report in the report viewer.
Default Layout
When multiple layouts are available for the report, you must select a default layout to present itfirst in the report viewer.
Active
Active layouts are available for users to choose from when they view or schedule the report.
View Online
Select this check box so that layouts are available to users when they view the report. Otherwise,the layout is available only for scheduling the report.
4. Click Save Report.
Data Models
Customizing Data Models: ProcedureA data model defines where data for a report comes from and how that data is retrieved. If a data model can't give you all thedata that you need in your report, then you can either copy and edit an existing data model or create a new one.
Oracle SCM CloudCreating and Administering Analytics and Reports
Chapter 6Reports Customization
51
Creating a Data Model
1. In the business intelligence (BI) catalog, click the New button and select Data Model under Published Reporting.2. Optionally click the Data Model node in the Data Model pane to set properties for the data model.3. Click the Data Set node in the Data Model pane to create or edit data sets, which determine where and how to
retrieve data.4. Click the New Data Set button and select a data set type. It's best practice to use the BI repository as a data
source, so you should select either:
◦ Oracle BI Analysis: To use columns from a selected analysis.
◦ SQL Query: To use a Query Builder tool to define what to use from the repository. Select Oracle BI EE asthe data source.
5. Optionally, to limit the data included in the report output, click the Parameters node in the Data Model pane todefine variables that users can set when they use the report.
Note: The order of parameters is important if there are job definitions defined for reports that use yourdata model. If you change the order in the data model, you must also update the job definitions.
6. Optionally, define other components of the data model.7. Save your data model.
Editing a Data Model
1. To edit a predefined data model:
a. Find the data model in the BI catalog and click Copy.b. Paste within Shared Folders - Custom in a subfolder that has a folder path similar to the folder that stores
the original data model.c. For the data model you pasted, click More, and select Edit.
2. Optionally click the Data Model node in the Data Model pane to set properties for the data model.3. Click the Data Set node in the Data Model pane to create or edit data sets.
Most predefined data models are of type SQL Query, and are set up to get application data from the followingtables:
◦ ApplicationDB_FSCM: Financials, Supply Chain Management, Project Management, Procurement, andIncentive Compensation
◦ ApplicationDB_CRM: Sales
◦ ApplicationDB_HCM: Human Capital Management
4. Perform steps 5 through 7 from the preceding Creating a Data Model task, as needed.
Related Topics
• Setting Reports Up to Run as Scheduled Processes: Points to Consider
• Data Structure for Analytics: Explained
Oracle SCM CloudCreating and Administering Analytics and Reports
Chapter 6Reports Customization
52
Creating a New Data Model for an SCM Report: Worked ExampleThis example shows how to create a data model for an Oracle Business Intelligence Publisher report. In this example, youcreate a data model using an SQL query to retrieve a list of items.
Creating a Data Model1. Navigate to the Reports and Analytics work area and click Browse Catalog to open the Oracle Business
Intelligence Catalog.2. On the OBI EE home page under Create, Published Reporting, click More and select Data Model.3. On the Diagram tab, click New Data Set and select SQL Query.4. In the New Data Set - SQL Query window, enter a name for your data model.5. In the SQL Query field, enter the appropriate query. For example, you can use the following query:
select item.item_number "Item Num",item.inventory_item_id "Item ID",org.organization_code "Organization",to_char(item.creation_date, 'DD-MON-RRRR HH24:MI:SS') "Created", ic.item_class_code "Item Class", item.item_type "Item Type", item.current_phase_code "Lifecycle Phase Code", item.INVENTORY_ITEM_STATUS_CODE "Item Status", uom.unit_of_measure "Primary UOM", Decode(item.approval_status, 'A','Approved', 'D','Draft','N','Not submitted for approval','R','Rejected','S','Submitted for approval','SCH','Scheduled') "Approval Status"from egp_system_items_b item, inv_org_parameters org, egp_item_classes_b ic, inv_units_of_measure uom where item.item_number like 'AS%' and item.template_item_flag = 'N' and item.organization_id = org.organization_id and item.item_catalog_group_id = ic.item_class_id and item.primary_uom_code = uom.uom_code order by item.creation_date desc, item.item_number
6. Click OK.7. Click the Structure tab.8. In the XML Tag Name field for the Item Number, replace the default value with ITEM_NUM, and replace the default
value in the Display Name field with Item Number.9. Repeat the above step for other XML Tag names and Display Names as appropriate.
10. Click the Data tab.11. On the Data tab, click View.12. View the report structure and click Save As Sample Data.13. Click OK.14. In the upper-right corner, click Save.15. In the Save As window, select My Folders, and enter SQL Query for Item List Data Model.
New Reports
Creating Custom Reports: ProcedureCreate a custom report when the predefined reports don't provide the data you need. Or, if you want to use a predefineddata model, and also want to change other aspects of the report other than layout. Save your custom report to SharedFolders - Custom in the business intelligence catalog.
Oracle SCM CloudCreating and Administering Analytics and Reports
Chapter 6Reports Customization
53
Creating a Report
1. Open the Reports and Analytics work area, or the Reports and Analytics pane if available in other work areas.2. Click Create and select Report.3. Select the data model to use as the data source for your report.4. Continue with the wizard to create the report layout, or choose to use the layout editor and close the wizard.5. Define the layout for the report.6. Click the Properties button in the report editor to set specific formatting, caching, and processing options for your
report.
Setting Up AccessYou or your administrator can:
• Create a job definition so that users can run your custom report as a scheduled process.
• Set up the report for scheduling in the Reports and Analytics pane.
• Secure general access to your report and its job definition, if any.
Related Topics
• Setting Reports Up to Run as Scheduled Processes: Points to Consider
• Setting Reports Up for Scheduling in the Reports and Analytics Pane: Procedure
Inventory Reports
Min-Max Planning Report: ExplainedThe Min-Max Planning Report shows demand, supply, and on-hand information for all items compared with plannedstocking levels. When you print the Min-Max Planning report, the inventory level for an item, on-hand quantities plus on-orderquantities, is considered. You can replenish low quantities by generating requisitions or by initiating movement requests foritems below the minimum. You can perform min-max planning at the inventory organization level or at the subinventory level.
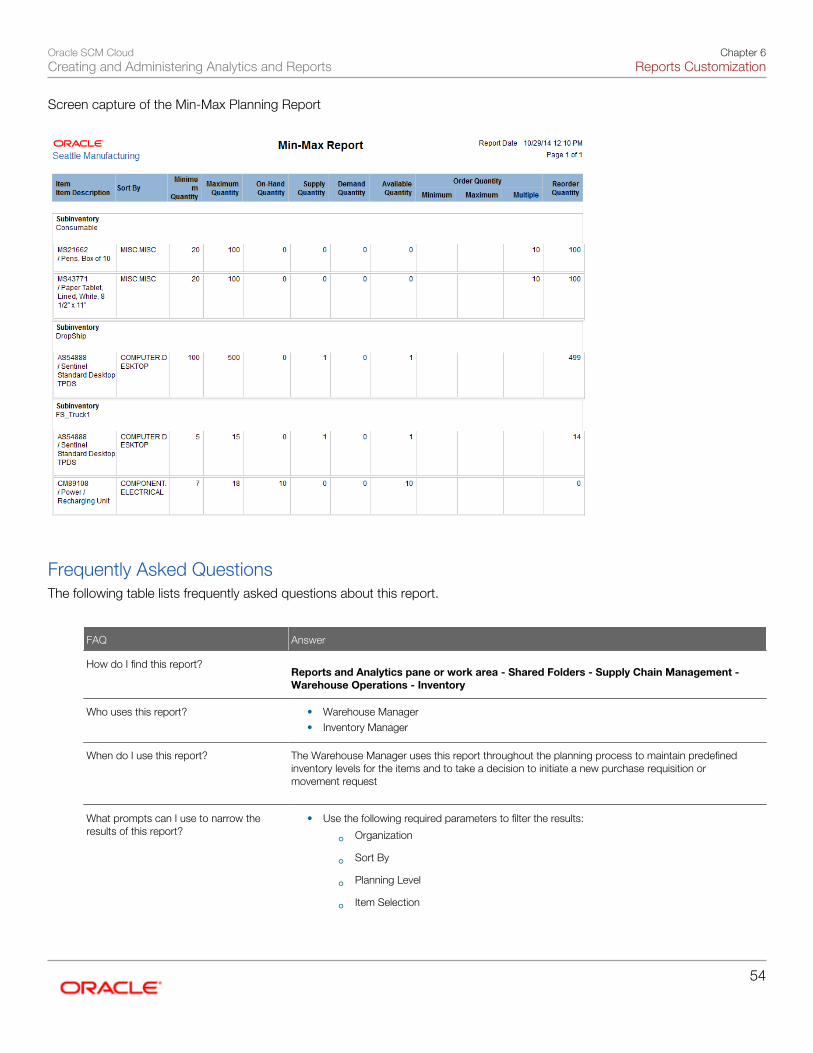
Oracle SCM CloudCreating and Administering Analytics and Reports
Chapter 6Reports Customization
54
Screen capture of the Min-Max Planning Report
Frequently Asked QuestionsThe following table lists frequently asked questions about this report.
FAQ Answer
How do I find this report? Reports and Analytics pane or work area - Shared Folders - Supply Chain Management -
Warehouse Operations - Inventory
Who uses this report?
• Warehouse Manager• Inventory Manager
When do I use this report?
The Warehouse Manager uses this report throughout the planning process to maintain predefinedinventory levels for the items and to take a decision to initiate a new purchase requisition ormovement request
What prompts can I use to narrow theresults of this report?
• Use the following required parameters to filter the results:
◦ Organization
◦ Sort By
◦ Planning Level
◦ Item Selection
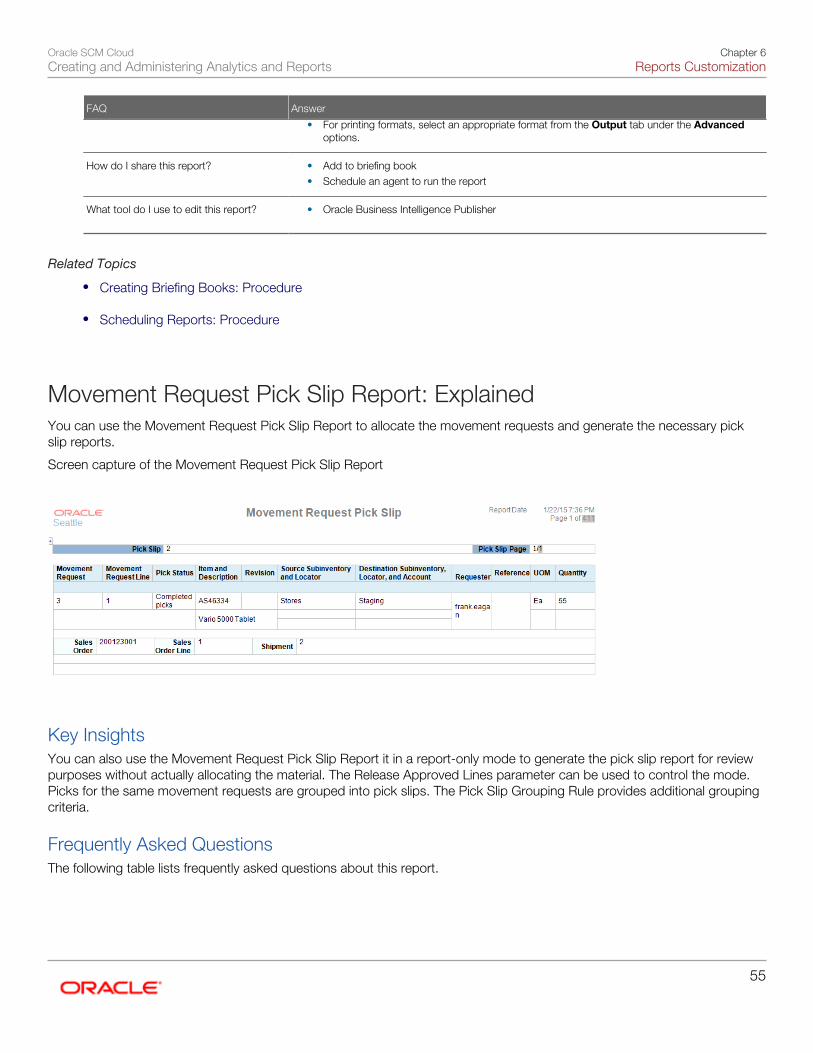
Oracle SCM CloudCreating and Administering Analytics and Reports
Chapter 6Reports Customization
55
FAQ Answer
• For printing formats, select an appropriate format from the Output tab under the Advancedoptions.
How do I share this report?
• Add to briefing book• Schedule an agent to run the report
What tool do I use to edit this report?
• Oracle Business Intelligence Publisher
Related Topics
• Creating Briefing Books: Procedure
• Scheduling Reports: Procedure
Movement Request Pick Slip Report: ExplainedYou can use the Movement Request Pick Slip Report to allocate the movement requests and generate the necessary pickslip reports.
Screen capture of the Movement Request Pick Slip Report
Key InsightsYou can also use the Movement Request Pick Slip Report it in a report-only mode to generate the pick slip report for reviewpurposes without actually allocating the material. The Release Approved Lines parameter can be used to control the mode.Picks for the same movement requests are grouped into pick slips. The Pick Slip Grouping Rule provides additional groupingcriteria.
Frequently Asked QuestionsThe following table lists frequently asked questions about this report.
Oracle SCM CloudCreating and Administering Analytics and Reports
Chapter 6Reports Customization
56
FAQ Answer
How do I find this report? Reports and Analytics pane - Shared Folders - Supply Chain Management - Warehouse
Operations - Inventory
Who uses this report?
• Warehouse Manager• Inventory Manager
When do I use this report?
The Warehouse Manager generates this report after he has manually created a requisitionmovement request on the Manage Movement Requests page. This report is used to physicallymove the material based on the specifications provided in the report.
What prompts can I use to narrow theresults of this report?
• Use the following parameters to filter the results
◦ Organization (Required)
◦ From /To Movement Request
◦ From/ To Pick Slip
◦ Source subinventory
◦ Source Locator
◦ Destination subinventory
◦ Destination locator
◦ From/To Required Date
◦ Line Status to Print
◦ Movement Request Type
◦ From/To Sales Order
◦ Carrier
◦ Customer
◦ Release Approved Lines
◦ Pick Slip Grouping Rule
• For printing formats, select an appropriate format from the Output tab under the Advancedoptions
How do I share this report?
• Add to briefing book• Schedule an agent to run the report
What tool do I use to edit this report?
• Oracle Business Intelligence Publisher
Related Topics
• Creating Briefing Books: Procedure
• Scheduling Reports: Procedure
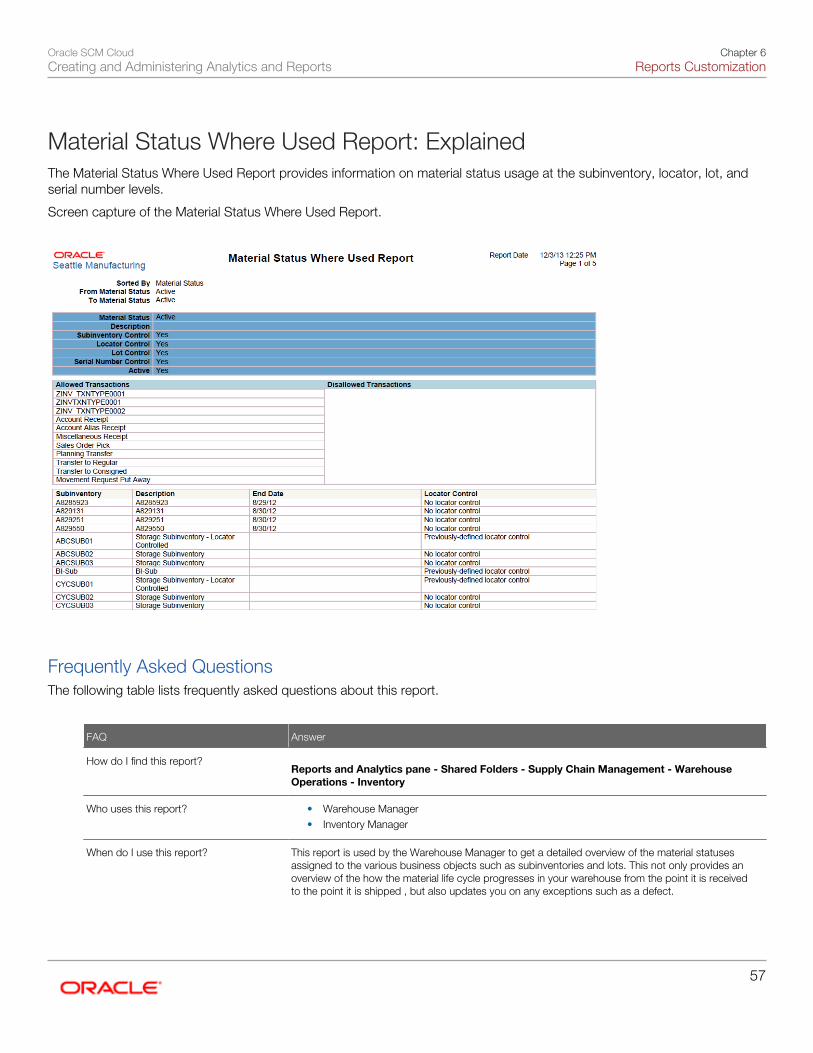
Oracle SCM CloudCreating and Administering Analytics and Reports
Chapter 6Reports Customization
57
Material Status Where Used Report: ExplainedThe Material Status Where Used Report provides information on material status usage at the subinventory, locator, lot, andserial number levels.
Screen capture of the Material Status Where Used Report.
Frequently Asked QuestionsThe following table lists frequently asked questions about this report.
FAQ Answer
How do I find this report? Reports and Analytics pane - Shared Folders - Supply Chain Management - Warehouse
Operations - Inventory
Who uses this report?
• Warehouse Manager• Inventory Manager
When do I use this report?
This report is used by the Warehouse Manager to get a detailed overview of the material statusesassigned to the various business objects such as subinventories and lots. This not only provides anoverview of the how the material life cycle progresses in your warehouse from the point it is receivedto the point it is shipped , but also updates you on any exceptions such as a defect.
Oracle SCM CloudCreating and Administering Analytics and Reports
Chapter 6Reports Customization
58
FAQ Answer
What prompts can I use to narrow theresults of this report?
• Use the following parameters to filter the results:
◦ Organization (Required)
◦ From Material Status (Required)
◦ To Material Status (Required)
◦ Search in Subinventories
◦ Search in Locators
◦ Search in Lots
◦ Search in Serial Numbers
• For printing formats, select an appropriate format from the Output tab under the Advancedoptions.
How do I share this report?
• Add to briefing book• Schedule an agent to run the report
What tool do I use to edit this report?
• Oracle Business Intelligence Publisher
Related Topics
• Creating Briefing Books: Procedure
• Scheduling Reports: Procedure
Cycle Count Listing Report: ExplainedThe Cycle Count Listing Report provides information for specific items to cycle count. It displays all the scheduled requestsfor a specified time period. This report includes both manually and automatically scheduled items.
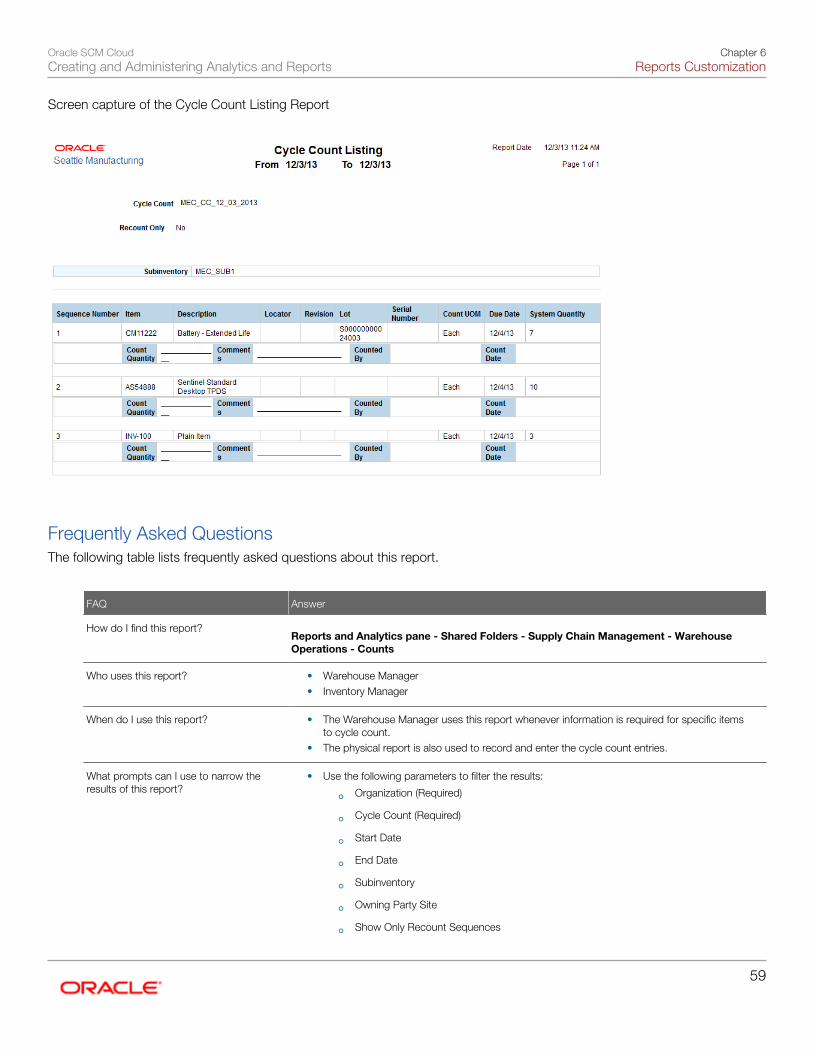
Oracle SCM CloudCreating and Administering Analytics and Reports
Chapter 6Reports Customization
59
Screen capture of the Cycle Count Listing Report
Frequently Asked QuestionsThe following table lists frequently asked questions about this report.
FAQ Answer
How do I find this report? Reports and Analytics pane - Shared Folders - Supply Chain Management - Warehouse
Operations - Counts
Who uses this report?
• Warehouse Manager• Inventory Manager
When do I use this report?
• The Warehouse Manager uses this report whenever information is required for specific itemsto cycle count.
• The physical report is also used to record and enter the cycle count entries.
What prompts can I use to narrow theresults of this report?
• Use the following parameters to filter the results:
◦ Organization (Required)
◦ Cycle Count (Required)
◦ Start Date
◦ End Date
◦ Subinventory
◦ Owning Party Site
◦ Show Only Recount Sequences
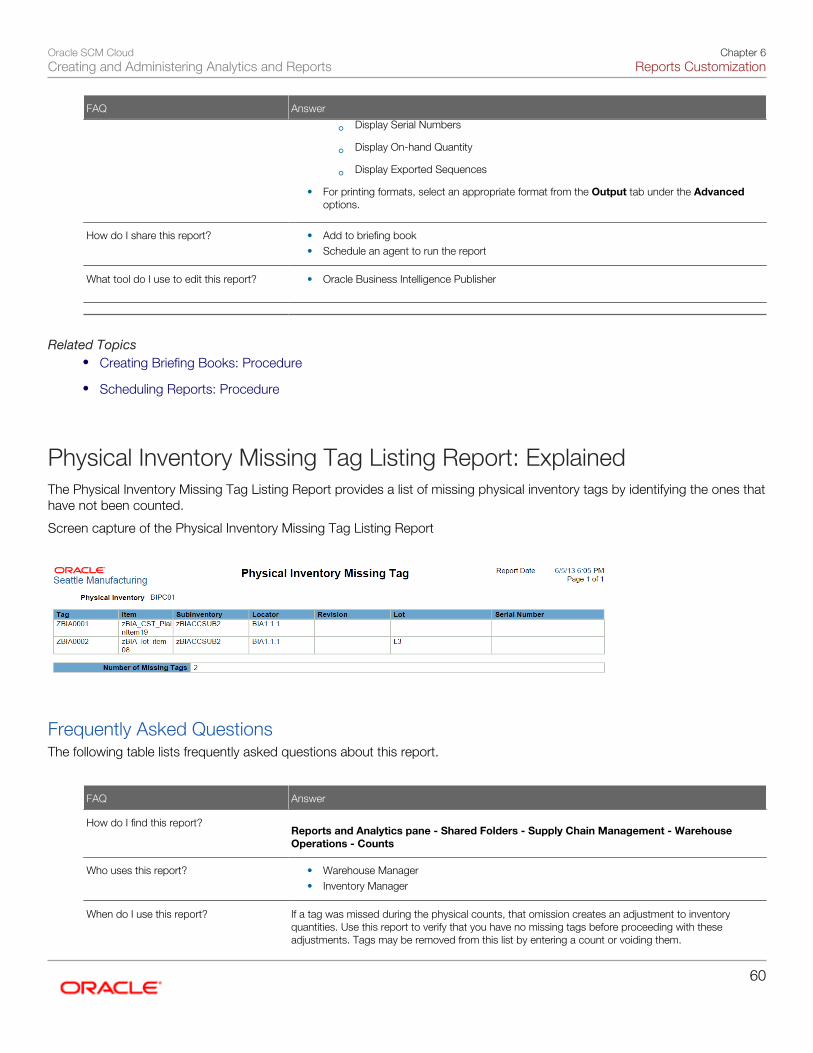
Oracle SCM CloudCreating and Administering Analytics and Reports
Chapter 6Reports Customization
60
FAQ Answer
◦ Display Serial Numbers
◦ Display On-hand Quantity
◦ Display Exported Sequences
• For printing formats, select an appropriate format from the Output tab under the Advancedoptions.
How do I share this report?
• Add to briefing book• Schedule an agent to run the report
What tool do I use to edit this report?
• Oracle Business Intelligence Publisher
Related Topics• Creating Briefing Books: Procedure
• Scheduling Reports: Procedure
Physical Inventory Missing Tag Listing Report: ExplainedThe Physical Inventory Missing Tag Listing Report provides a list of missing physical inventory tags by identifying the ones thathave not been counted.
Screen capture of the Physical Inventory Missing Tag Listing Report
Frequently Asked QuestionsThe following table lists frequently asked questions about this report.
FAQ Answer
How do I find this report? Reports and Analytics pane - Shared Folders - Supply Chain Management - Warehouse
Operations - Counts
Who uses this report?
• Warehouse Manager• Inventory Manager
When do I use this report?
If a tag was missed during the physical counts, that omission creates an adjustment to inventoryquantities. Use this report to verify that you have no missing tags before proceeding with theseadjustments. Tags may be removed from this list by entering a count or voiding them.
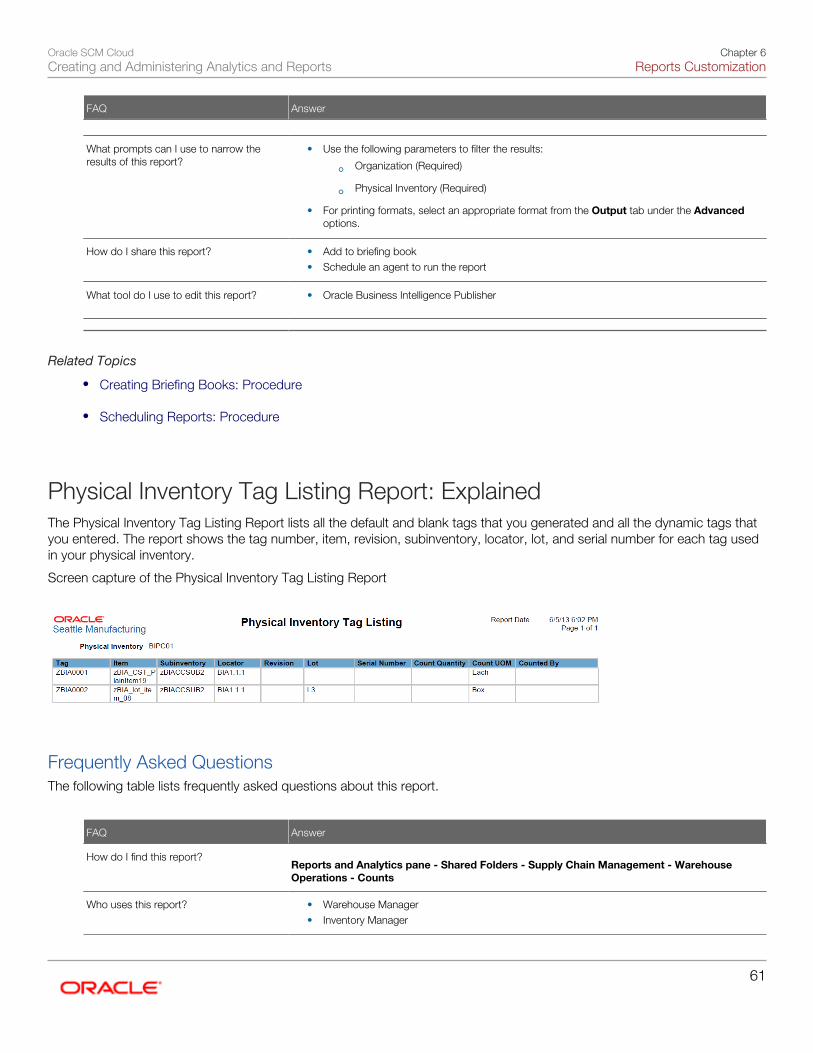
Oracle SCM CloudCreating and Administering Analytics and Reports
Chapter 6Reports Customization
61
FAQ Answer
What prompts can I use to narrow theresults of this report?
• Use the following parameters to filter the results:
◦ Organization (Required)
◦ Physical Inventory (Required)
• For printing formats, select an appropriate format from the Output tab under the Advancedoptions.
How do I share this report?
• Add to briefing book• Schedule an agent to run the report
What tool do I use to edit this report?
• Oracle Business Intelligence Publisher
Related Topics
• Creating Briefing Books: Procedure
• Scheduling Reports: Procedure
Physical Inventory Tag Listing Report: ExplainedThe Physical Inventory Tag Listing Report lists all the default and blank tags that you generated and all the dynamic tags thatyou entered. The report shows the tag number, item, revision, subinventory, locator, lot, and serial number for each tag usedin your physical inventory.
Screen capture of the Physical Inventory Tag Listing Report
Frequently Asked QuestionsThe following table lists frequently asked questions about this report.
FAQ Answer
How do I find this report? Reports and Analytics pane - Shared Folders - Supply Chain Management - Warehouse
Operations - Counts
Who uses this report?
• Warehouse Manager• Inventory Manager
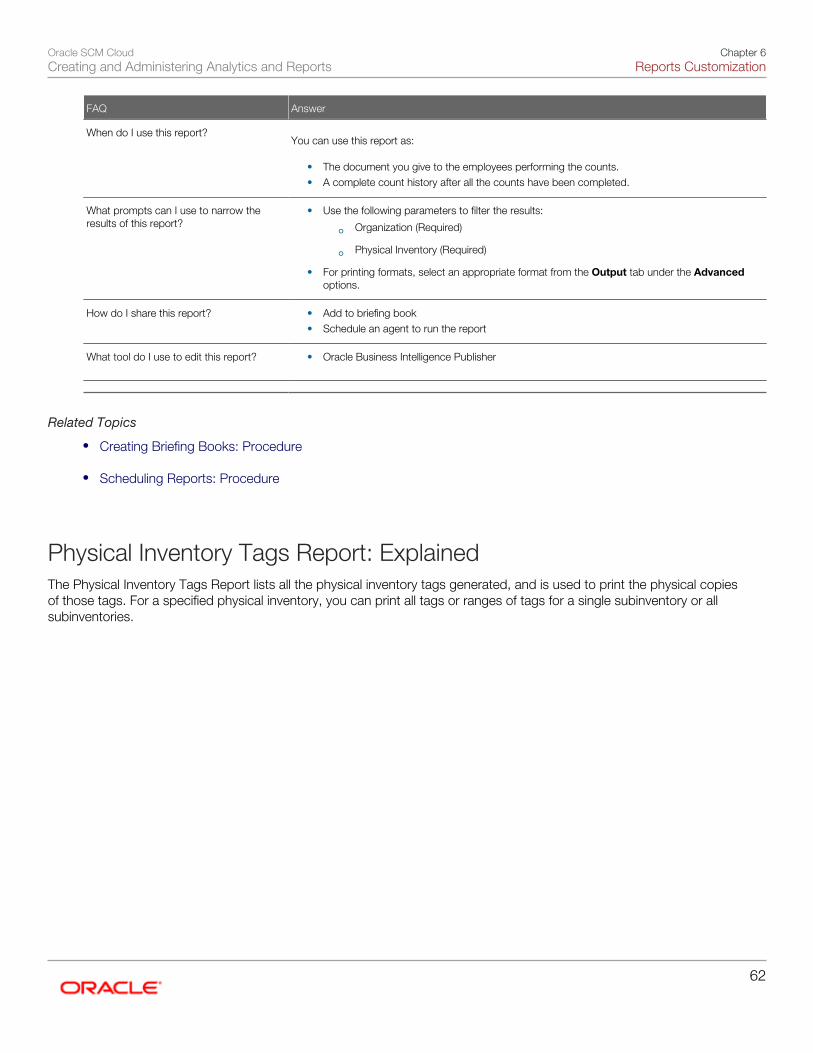
Oracle SCM CloudCreating and Administering Analytics and Reports
Chapter 6Reports Customization
62
FAQ Answer
When do I use this report? You can use this report as:
• The document you give to the employees performing the counts.• A complete count history after all the counts have been completed.
What prompts can I use to narrow theresults of this report?
• Use the following parameters to filter the results:
◦ Organization (Required)
◦ Physical Inventory (Required)
• For printing formats, select an appropriate format from the Output tab under the Advancedoptions.
How do I share this report?
• Add to briefing book• Schedule an agent to run the report
What tool do I use to edit this report?
• Oracle Business Intelligence Publisher
Related Topics
• Creating Briefing Books: Procedure
• Scheduling Reports: Procedure
Physical Inventory Tags Report: ExplainedThe Physical Inventory Tags Report lists all the physical inventory tags generated, and is used to print the physical copiesof those tags. For a specified physical inventory, you can print all tags or ranges of tags for a single subinventory or allsubinventories.
Oracle SCM CloudCreating and Administering Analytics and Reports
Chapter 6Reports Customization
63
Screen capture of the Physical Inventory Tags Report
Frequently Asked QuestionsThe following table lists frequently asked questions about this report.
FAQ Answer
How do I find this report? Reports and Analytics pane - Shared Folders - Supply Chain Management - Warehouse
Operations - Counts
Who uses this report?
• Warehouse Manager• Inventory Manager
When do I use this report?
You can use the Physical Inventory Tags report to print physical inventory tags.
What prompts can I use to narrow theresults of this report?
• Use the following parameters to filter the results:
◦ Organization (Required)
◦ Physical Inventory (Required)
◦ Subinventory
◦ Sort By (Required)
• Tag Number
Oracle SCM CloudCreating and Administering Analytics and Reports
Chapter 6Reports Customization
64
FAQ Answer
• Subinventory, locator• Subinventory, item• Item, subinventory, locator
◦ Range (Required)
• Full list• Partial list
◦ From Tag
◦ To Tag
◦ From Item
◦ To Item
• For printing formats, select an appropriate format from the Output tab under the Advancedoptions.
How do I share this report?
• Add to briefing book• Schedule an agent to run the report
What tool do I use to edit this report?
• Oracle Business Intelligence Publisher
Related Topics
• Creating Briefing Books: Procedure
• Scheduling Reports: Procedure
Pick Slip Report: ExplainedThe Pick Slip Report provides information for picks and the corresponding details for pick slips. This report prints all pickingline details in a picking batch.
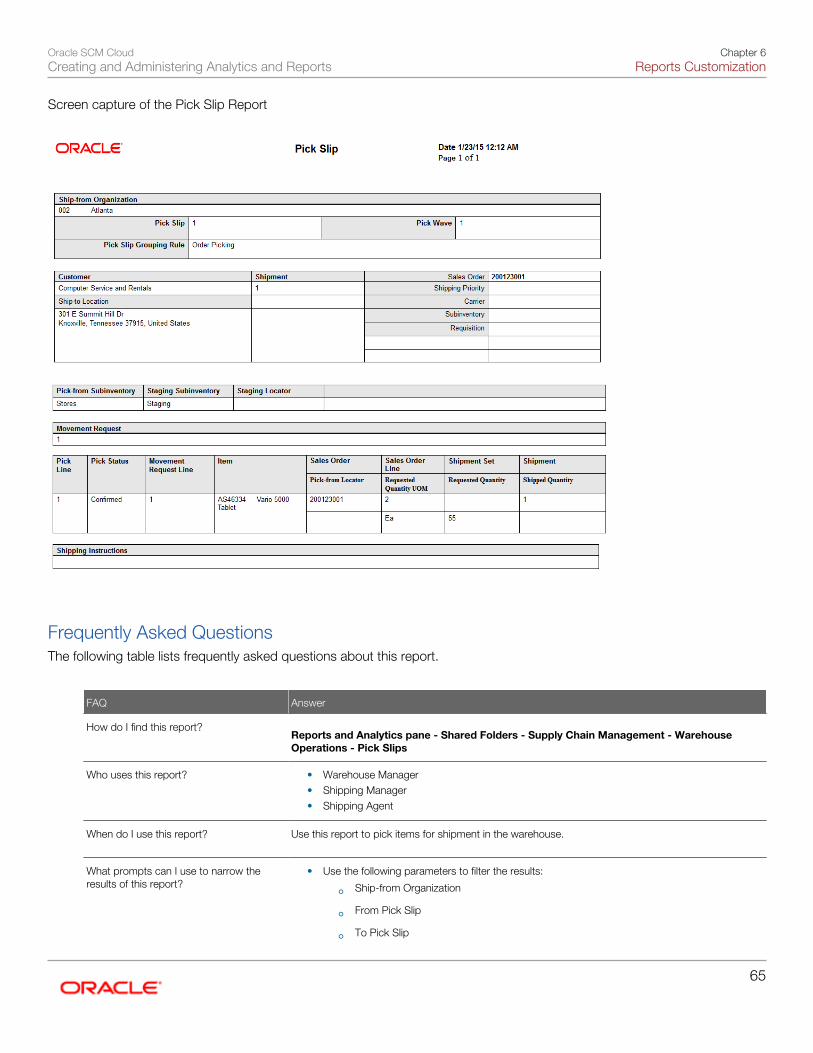
Oracle SCM CloudCreating and Administering Analytics and Reports
Chapter 6Reports Customization
65
Screen capture of the Pick Slip Report
Frequently Asked QuestionsThe following table lists frequently asked questions about this report.
FAQ Answer
How do I find this report? Reports and Analytics pane - Shared Folders - Supply Chain Management - Warehouse
Operations - Pick Slips
Who uses this report?
• Warehouse Manager• Shipping Manager• Shipping Agent
When do I use this report?
Use this report to pick items for shipment in the warehouse.
What prompts can I use to narrow theresults of this report?
• Use the following parameters to filter the results:
◦ Ship-from Organization
◦ From Pick Slip
◦ To Pick Slip
Oracle SCM CloudCreating and Administering Analytics and Reports
Chapter 6Reports Customization
66
FAQ Answer
◦ Shipping Method
◦ From Sales Order
◦ To Sales Order
◦ From Movement Request
◦ To Movement Request
◦ Customer
◦ Line Status to Print (Required)
• All• Released to warehouse• Staged
◦ Item Display (Required)
• Both• Description• Item
• For printing formats, select an appropriate format from the Output tab under the Advancedoptions.
How do I share this report?
• Add to briefing book• Schedule an agent to run the report
What tool do I use to edit this report?
• Oracle Business Intelligence Publisher
Related Topics
• Creating Briefing Books: Procedure
• Scheduling Reports: Procedure
Consumption Advice Report: ExplainedThe Consumption Advice Report is used to communicate to the supplier-consigned inventory consumption transactionsthat occurred within a given period of time. The Consumption Advice Report can be generated on a daily, weekly or monthlyfrequency. The Consumption Advice Report also serves as the document initiates financial settlement for the consumedinventory.
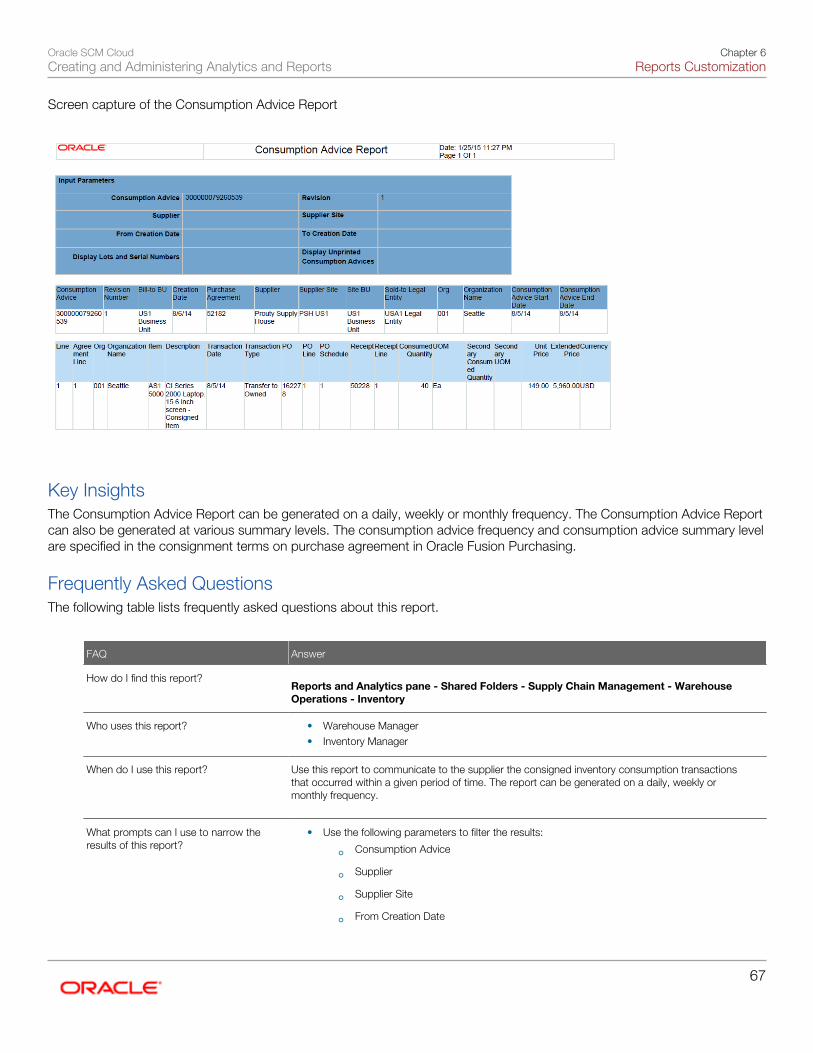
Oracle SCM CloudCreating and Administering Analytics and Reports
Chapter 6Reports Customization
67
Screen capture of the Consumption Advice Report
Key InsightsThe Consumption Advice Report can be generated on a daily, weekly or monthly frequency. The Consumption Advice Reportcan also be generated at various summary levels. The consumption advice frequency and consumption advice summary levelare specified in the consignment terms on purchase agreement in Oracle Fusion Purchasing.
Frequently Asked QuestionsThe following table lists frequently asked questions about this report.
FAQ Answer
How do I find this report? Reports and Analytics pane - Shared Folders - Supply Chain Management - Warehouse
Operations - Inventory
Who uses this report?
• Warehouse Manager• Inventory Manager
When do I use this report?
Use this report to communicate to the supplier the consigned inventory consumption transactionsthat occurred within a given period of time. The report can be generated on a daily, weekly ormonthly frequency.
What prompts can I use to narrow theresults of this report?
• Use the following parameters to filter the results:
◦ Consumption Advice
◦ Supplier
◦ Supplier Site
◦ From Creation Date
Oracle SCM CloudCreating and Administering Analytics and Reports
Chapter 6Reports Customization
68
FAQ Answer
◦ To Creation Date
◦ Display Lots and Serial Numbers
◦ Revision
◦ Display Unprinted Consumption Advices
• For printing formats, select an appropriate format from the Output tab under the Advancedoptions.
How do I share this report?
• Add to briefing book• Schedule an agent to run the report
What tool do I use to edit this report?
• Oracle Business Intelligence Publisher
Related Topics
• Creating Briefing Books: Procedure
• Scheduling Reports: Procedure
Shipping Reports
Bill of Lading Report: ExplainedThe Bill of Lading Report prints all sales orders that have been confirmed from a selected delivery. It provides a list of all salesorders shipped on shipments including transportation details.
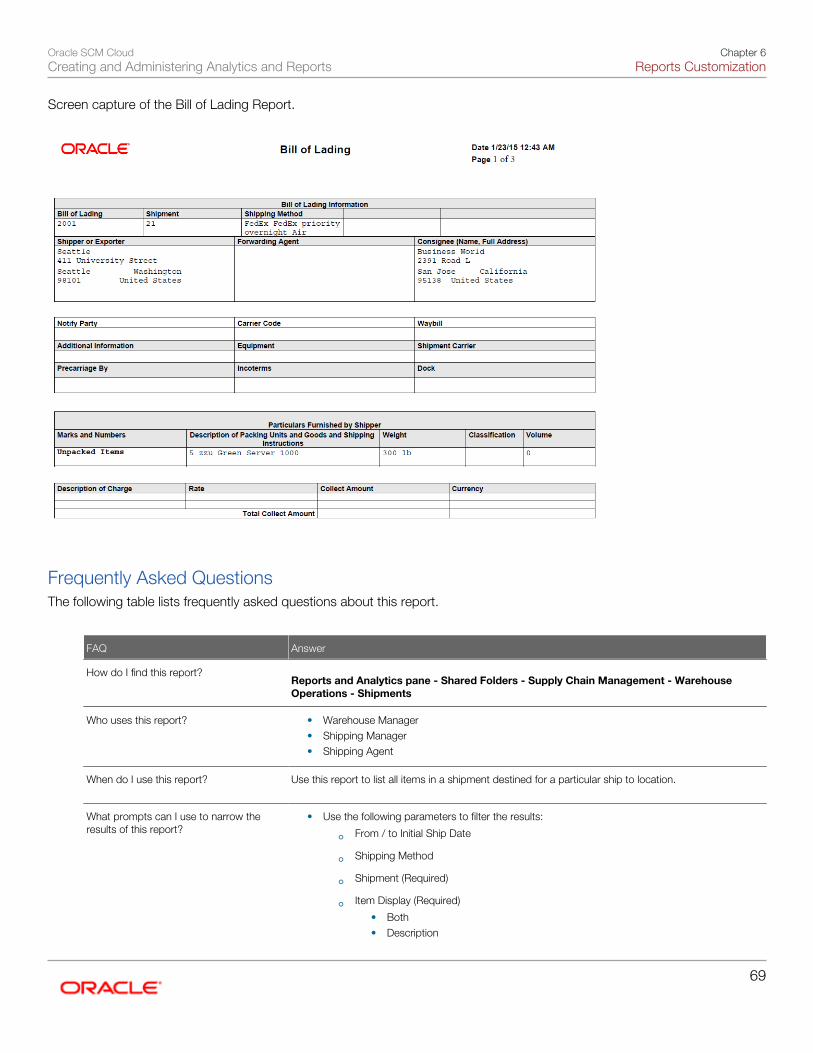
Oracle SCM CloudCreating and Administering Analytics and Reports
Chapter 6Reports Customization
69
Screen capture of the Bill of Lading Report.
Frequently Asked QuestionsThe following table lists frequently asked questions about this report.
FAQ Answer
How do I find this report? Reports and Analytics pane - Shared Folders - Supply Chain Management - Warehouse
Operations - Shipments
Who uses this report?
• Warehouse Manager• Shipping Manager• Shipping Agent
When do I use this report?
Use this report to list all items in a shipment destined for a particular ship to location.
What prompts can I use to narrow theresults of this report?
• Use the following parameters to filter the results:
◦ From / to Initial Ship Date
◦ Shipping Method
◦ Shipment (Required)
◦ Item Display (Required)
• Both• Description
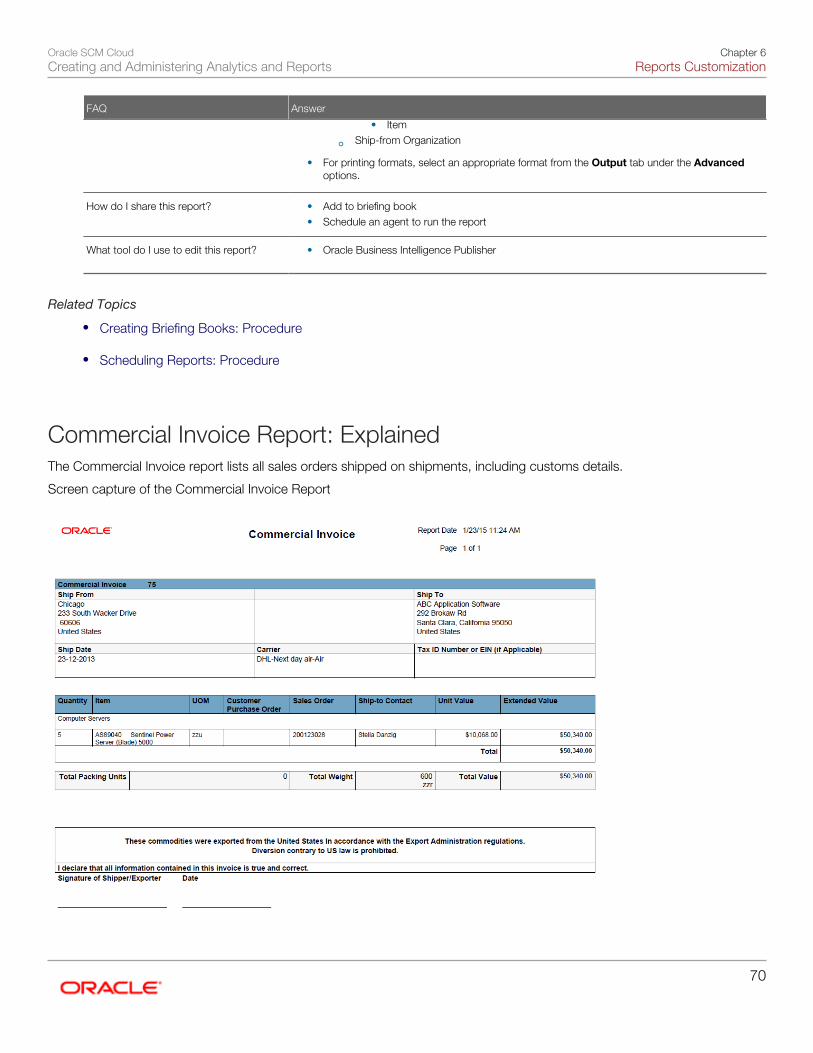
Oracle SCM CloudCreating and Administering Analytics and Reports
Chapter 6Reports Customization
70
FAQ Answer
• Item
◦ Ship-from Organization
• For printing formats, select an appropriate format from the Output tab under the Advancedoptions.
How do I share this report?
• Add to briefing book• Schedule an agent to run the report
What tool do I use to edit this report?
• Oracle Business Intelligence Publisher
Related Topics
• Creating Briefing Books: Procedure
• Scheduling Reports: Procedure
Commercial Invoice Report: ExplainedThe Commercial Invoice report lists all sales orders shipped on shipments, including customs details.
Screen capture of the Commercial Invoice Report
Oracle SCM CloudCreating and Administering Analytics and Reports
Chapter 6Reports Customization
71
Frequently Asked QuestionsThe following table lists frequently asked questions about this report.
FAQ Answer
How do I find this report? Reports and Analytics pane - Shared Folders - Supply Chain Management - Warehouse
Operations - Shipments
Who uses this report?
• Warehouse Manager• Shipping Manager• Shipping Agent
When do I use this report?
Use this report to accompany cross-border shipments.
What prompts can I use to narrow theresults of this report?
• Use the following parameters to filter the results:
◦ Ship-from Organization (Required)
◦ Shipping Method
◦ Item Display (Required)
• Both• Description• Item
◦ Currency
◦ Shipment
◦ Print Customer Item
◦ From / To Initial Ship Date
• For printing formats, select an appropriate format from the Output tab under the Advancedoptions.
How do I share this report?
• Add to briefing book• Schedule an agent to run the report
What tool do I use to edit this report?
• Oracle Business Intelligence Publisher
Related Topics
• Creating Briefing Books: Procedure
• Scheduling Reports: Procedure
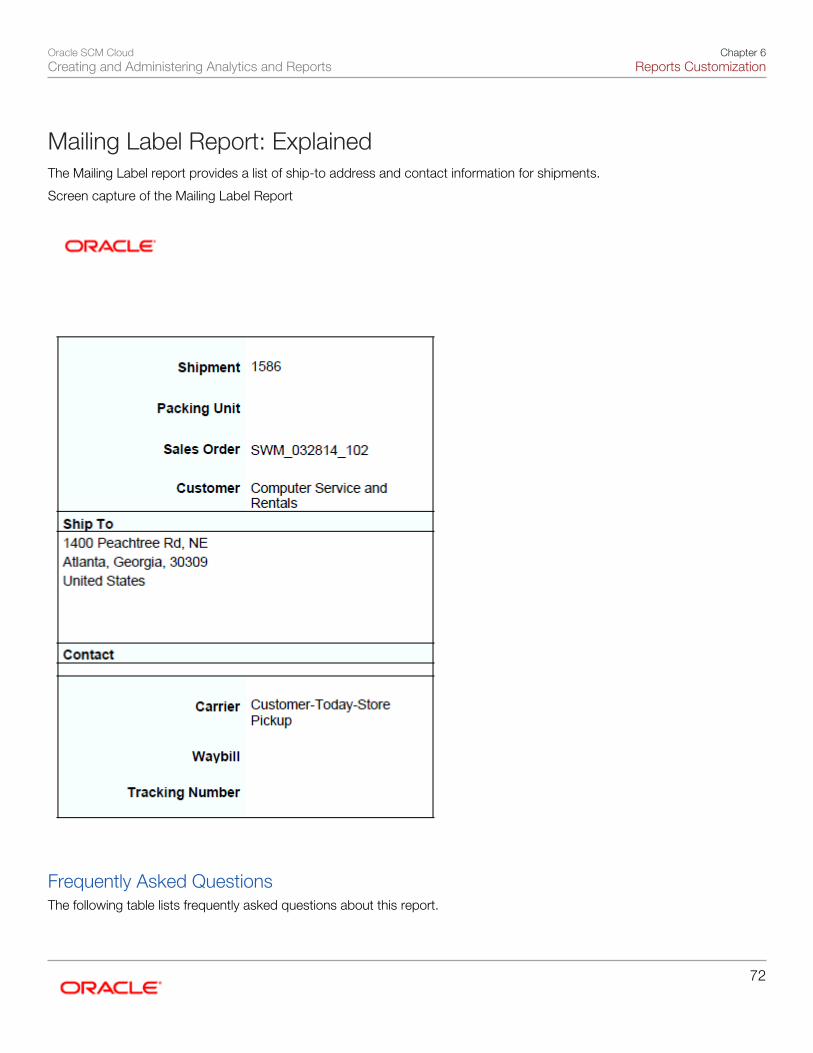
Oracle SCM CloudCreating and Administering Analytics and Reports
Chapter 6Reports Customization
72
Mailing Label Report: ExplainedThe Mailing Label report provides a list of ship-to address and contact information for shipments.
Screen capture of the Mailing Label Report
Frequently Asked QuestionsThe following table lists frequently asked questions about this report.
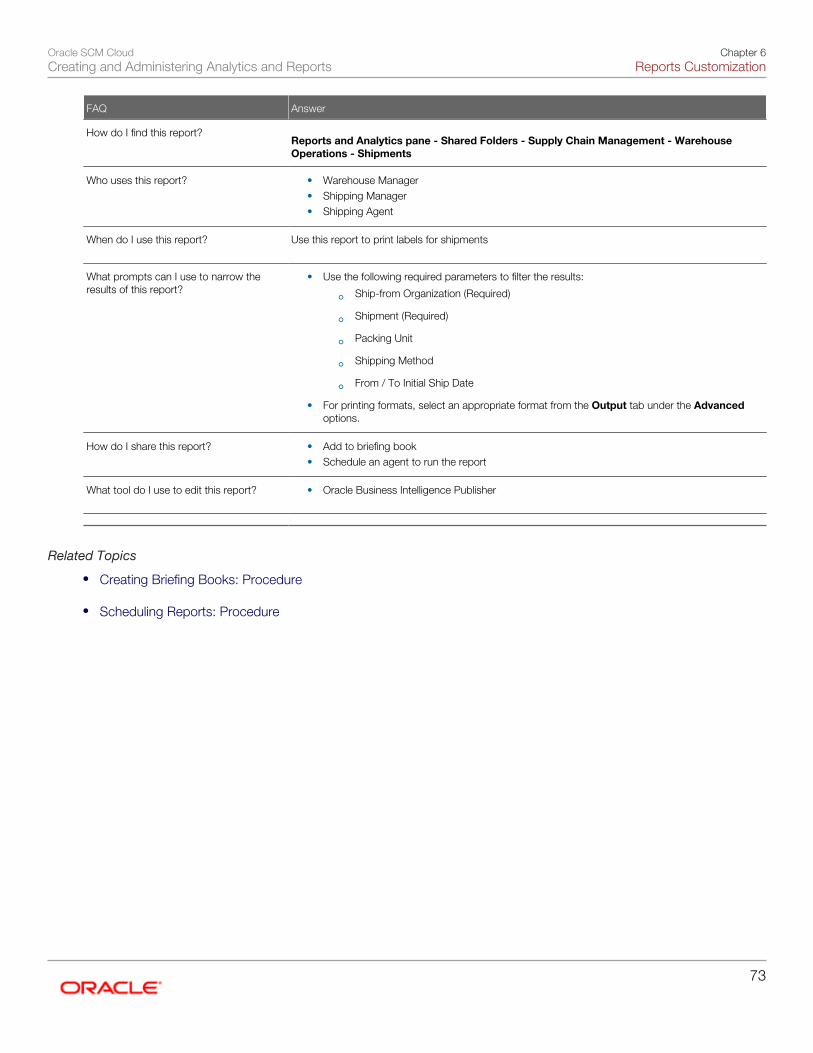
Oracle SCM CloudCreating and Administering Analytics and Reports
Chapter 6Reports Customization
73
FAQ Answer
How do I find this report? Reports and Analytics pane - Shared Folders - Supply Chain Management - Warehouse
Operations - Shipments
Who uses this report?
• Warehouse Manager• Shipping Manager• Shipping Agent
When do I use this report?
Use this report to print labels for shipments
What prompts can I use to narrow theresults of this report?
• Use the following required parameters to filter the results:
◦ Ship-from Organization (Required)
◦ Shipment (Required)
◦ Packing Unit
◦ Shipping Method
◦ From / To Initial Ship Date
• For printing formats, select an appropriate format from the Output tab under the Advancedoptions.
How do I share this report?
• Add to briefing book• Schedule an agent to run the report
What tool do I use to edit this report?
• Oracle Business Intelligence Publisher
Related Topics
• Creating Briefing Books: Procedure
• Scheduling Reports: Procedure
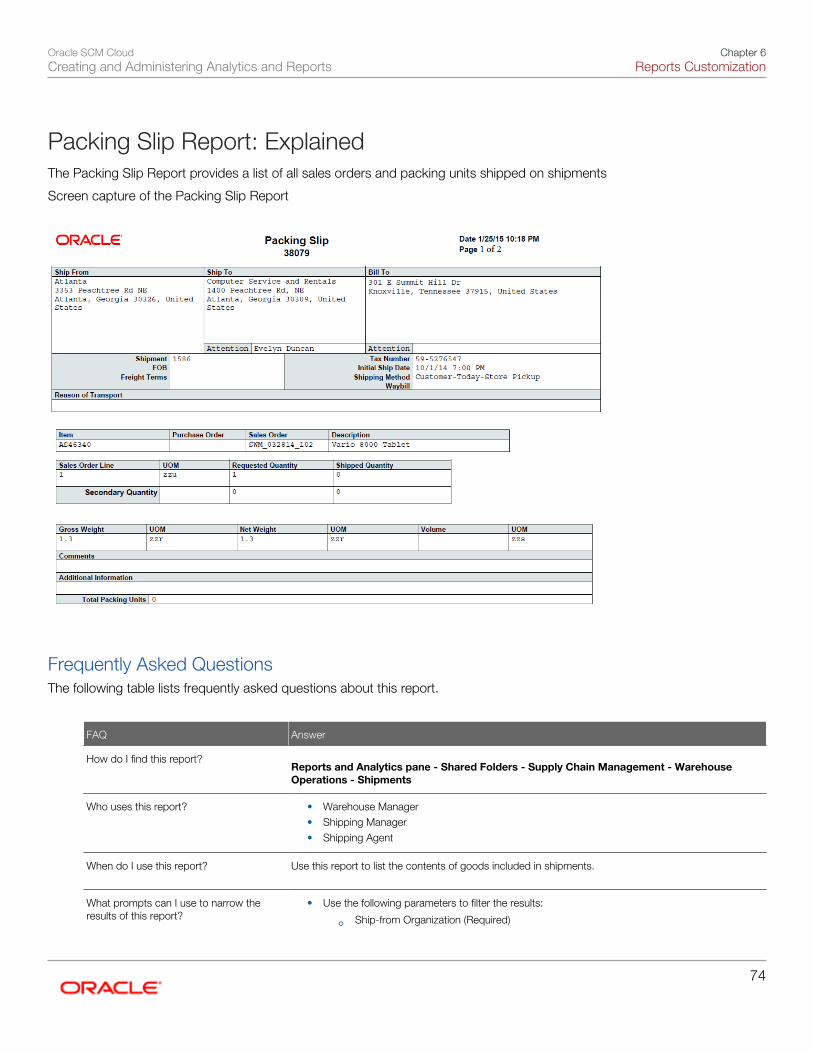
Oracle SCM CloudCreating and Administering Analytics and Reports
Chapter 6Reports Customization
74
Packing Slip Report: ExplainedThe Packing Slip Report provides a list of all sales orders and packing units shipped on shipments
Screen capture of the Packing Slip Report
Frequently Asked QuestionsThe following table lists frequently asked questions about this report.
FAQ Answer
How do I find this report? Reports and Analytics pane - Shared Folders - Supply Chain Management - Warehouse
Operations - Shipments
Who uses this report?
• Warehouse Manager• Shipping Manager• Shipping Agent
When do I use this report?
Use this report to list the contents of goods included in shipments.
What prompts can I use to narrow theresults of this report?
• Use the following parameters to filter the results:
◦ Ship-from Organization (Required)
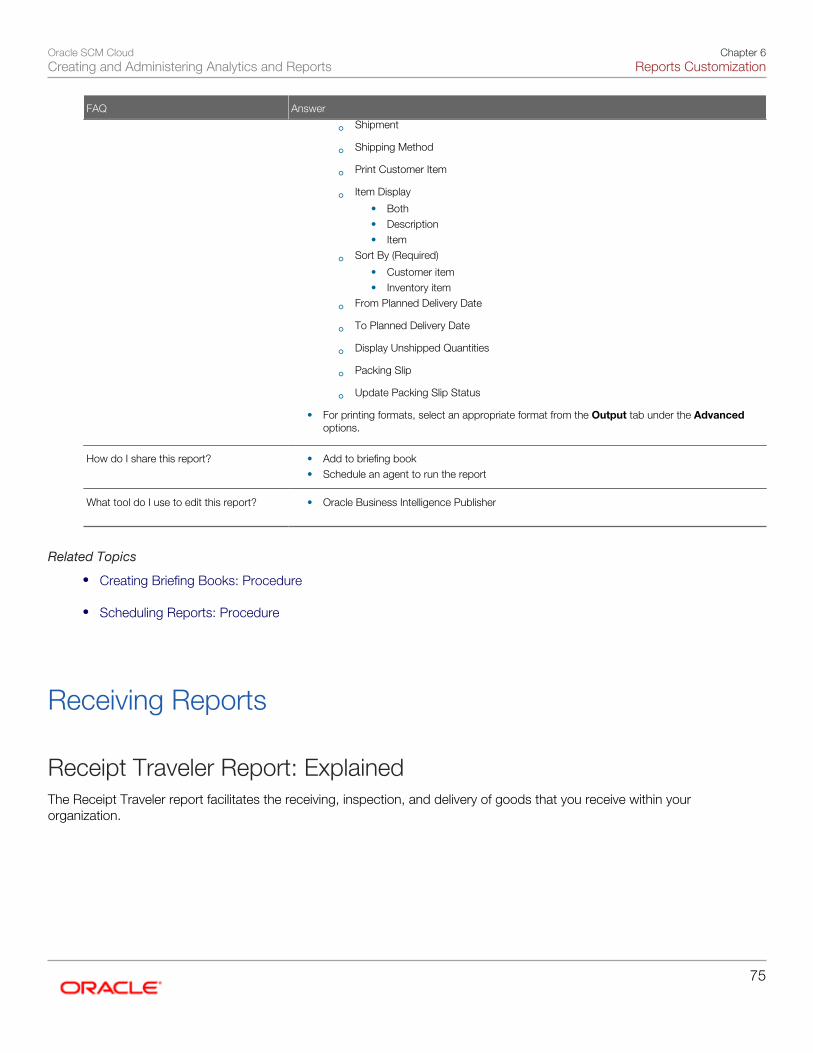
Oracle SCM CloudCreating and Administering Analytics and Reports
Chapter 6Reports Customization
75
FAQ Answer
◦ Shipment
◦ Shipping Method
◦ Print Customer Item
◦ Item Display
• Both• Description• Item
◦ Sort By (Required)
• Customer item• Inventory item
◦ From Planned Delivery Date
◦ To Planned Delivery Date
◦ Display Unshipped Quantities
◦ Packing Slip
◦ Update Packing Slip Status
• For printing formats, select an appropriate format from the Output tab under the Advancedoptions.
How do I share this report?
• Add to briefing book• Schedule an agent to run the report
What tool do I use to edit this report?
• Oracle Business Intelligence Publisher
Related Topics
• Creating Briefing Books: Procedure
• Scheduling Reports: Procedure
Receiving Reports
Receipt Traveler Report: ExplainedThe Receipt Traveler report facilitates the receiving, inspection, and delivery of goods that you receive within yourorganization.
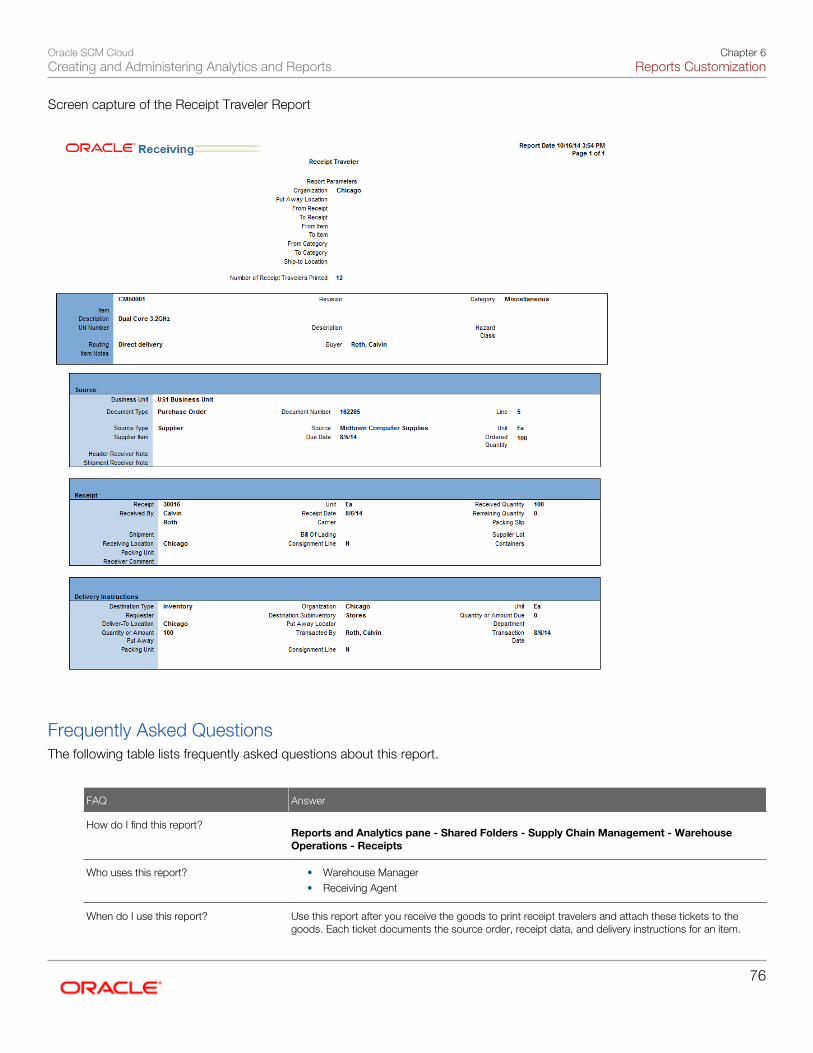
Oracle SCM CloudCreating and Administering Analytics and Reports
Chapter 6Reports Customization
76
Screen capture of the Receipt Traveler Report
Frequently Asked QuestionsThe following table lists frequently asked questions about this report.
FAQ Answer
How do I find this report? Reports and Analytics pane - Shared Folders - Supply Chain Management - Warehouse
Operations - Receipts
Who uses this report?
• Warehouse Manager• Receiving Agent
When do I use this report?
Use this report after you receive the goods to print receipt travelers and attach these tickets to thegoods. Each ticket documents the source order, receipt data, and delivery instructions for an item.
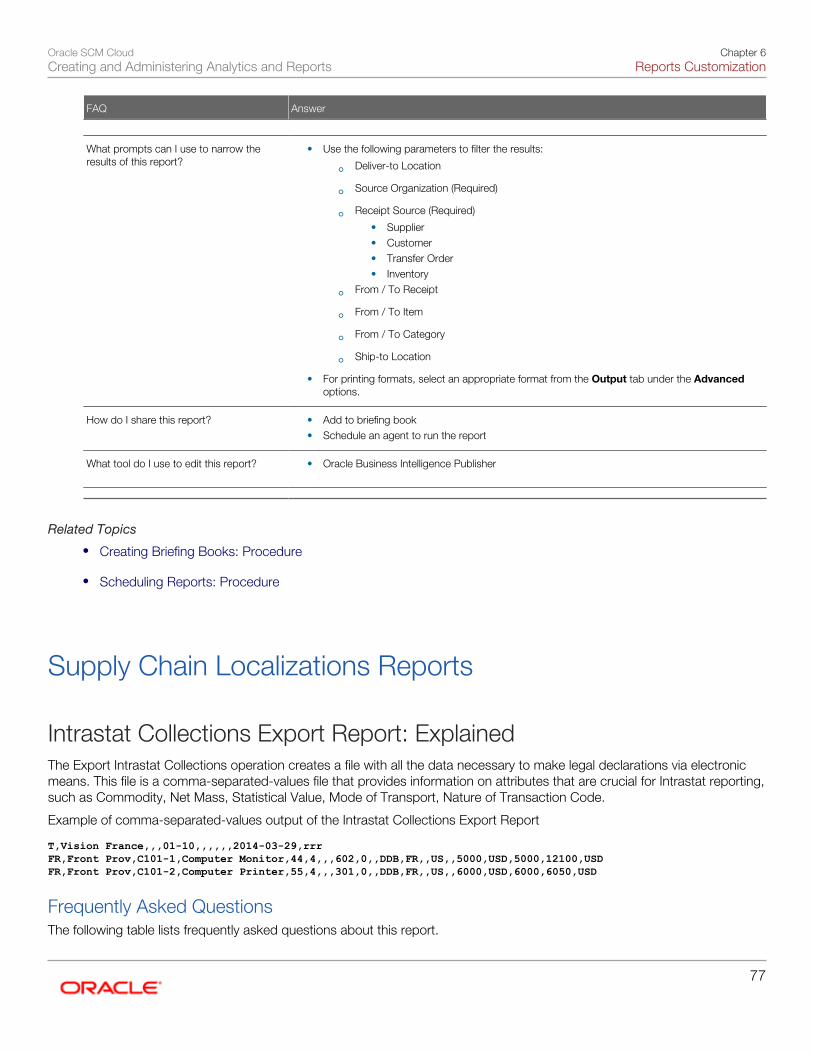
Oracle SCM CloudCreating and Administering Analytics and Reports
Chapter 6Reports Customization
77
FAQ Answer
What prompts can I use to narrow theresults of this report?
• Use the following parameters to filter the results:
◦ Deliver-to Location
◦ Source Organization (Required)
◦ Receipt Source (Required)
• Supplier• Customer• Transfer Order• Inventory
◦ From / To Receipt
◦ From / To Item
◦ From / To Category
◦ Ship-to Location
• For printing formats, select an appropriate format from the Output tab under the Advancedoptions.
How do I share this report?
• Add to briefing book• Schedule an agent to run the report
What tool do I use to edit this report?
• Oracle Business Intelligence Publisher
Related Topics
• Creating Briefing Books: Procedure
• Scheduling Reports: Procedure
Supply Chain Localizations Reports
Intrastat Collections Export Report: ExplainedThe Export Intrastat Collections operation creates a file with all the data necessary to make legal declarations via electronicmeans. This file is a comma-separated-values file that provides information on attributes that are crucial for Intrastat reporting,such as Commodity, Net Mass, Statistical Value, Mode of Transport, Nature of Transaction Code.
Example of comma-separated-values output of the Intrastat Collections Export Report
T,Vision France,,,01-10,,,,,,2014-03-29,rrrFR,Front Prov,C101-1,Computer Monitor,44,4,,,602,0,,DDB,FR,,US,,5000,USD,5000,12100,USDFR,Front Prov,C101-2,Computer Printer,55,4,,,301,0,,DDB,FR,,US,,6000,USD,6000,6050,USD
Frequently Asked QuestionsThe following table lists frequently asked questions about this report.
Oracle SCM CloudCreating and Administering Analytics and Reports
Chapter 6Reports Customization
78
FAQ Answer
How do I find this report? Reports and Analytics pane - Shared Folders - Supply Chain Management - Intrastat
Reporting
Who uses this report?
• Tax Accountant• Tax Administrator• Tax Manager• Tax Specialist
When do I use this report?
Use this report to make legal declaration with respect to the Intrastat transactions for reportingto legal authorities. You can use any prescribed third party software to generate the report in therequired format or you can directly submit the CSV output to the authorities.
What prompts can I use to narrow theresults of this report?
• Use the following parameters to filter the results:
◦ Legal Entity (Required)
◦ Legal Reporting Unit (Required)
◦ Period (Required)
◦ Flow Type
• For printing formats, select an appropriate format from the Output tab under the Advancedoptions.
How do I share this report?
• Add to briefing book• Schedule an agent to run the report
What tool do I use to edit this report?
• Oracle Business Intelligence Publisher
Related Topics
• Creating Briefing Books: Procedure
• Scheduling Reports: Procedure
Intrastat Collections Details Report: ExplainedThe Print Intrastat Collections Details operation provides comprehensive information for each Intrastat transaction record.Intrastat records are printed for each item along with transaction date for given legal entity, legal reporting unit and period.This report provides information on attributes that are crucial for detailed reporting, such as Item, Transaction Date, Net Mass,Statistical Value, Mode of Transport, and Nature of Transaction Code.
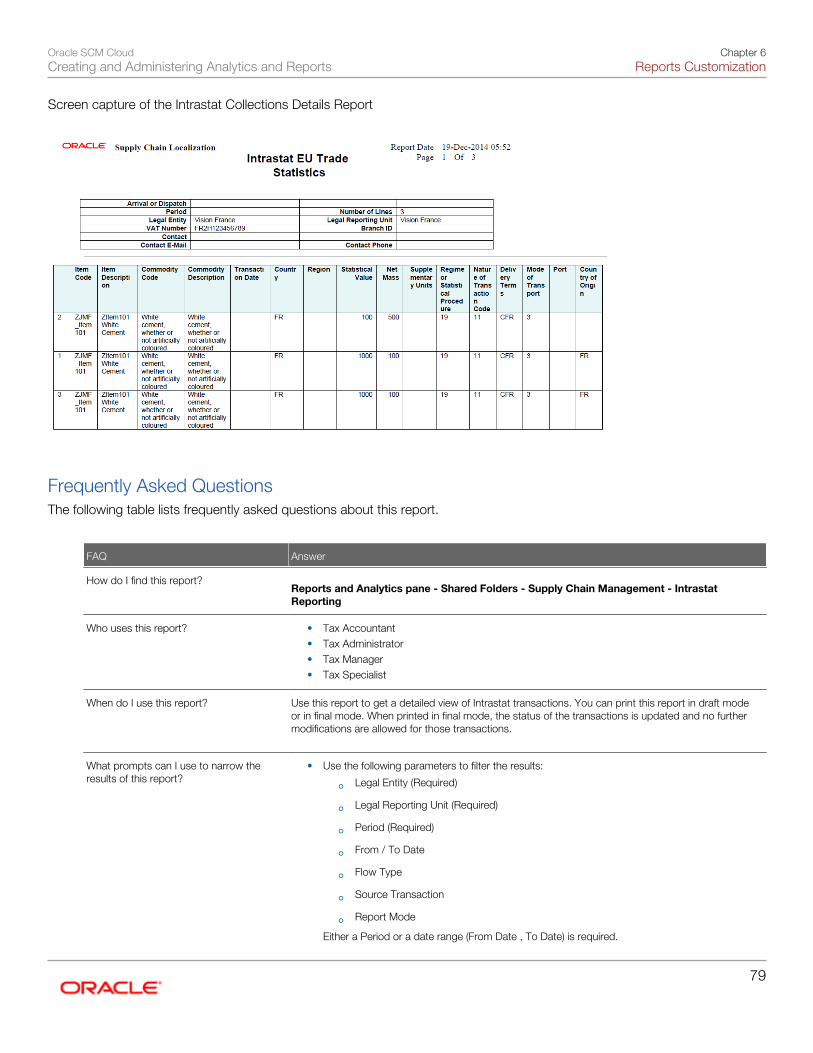
Oracle SCM CloudCreating and Administering Analytics and Reports
Chapter 6Reports Customization
79
Screen capture of the Intrastat Collections Details Report
Frequently Asked QuestionsThe following table lists frequently asked questions about this report.
FAQ Answer
How do I find this report? Reports and Analytics pane - Shared Folders - Supply Chain Management - Intrastat
Reporting
Who uses this report?
• Tax Accountant• Tax Administrator• Tax Manager• Tax Specialist
When do I use this report?
Use this report to get a detailed view of Intrastat transactions. You can print this report in draft modeor in final mode. When printed in final mode, the status of the transactions is updated and no furthermodifications are allowed for those transactions.
What prompts can I use to narrow theresults of this report?
• Use the following parameters to filter the results:
◦ Legal Entity (Required)
◦ Legal Reporting Unit (Required)
◦ Period (Required)
◦ From / To Date
◦ Flow Type
◦ Source Transaction
◦ Report Mode
Either a Period or a date range (From Date , To Date) is required.
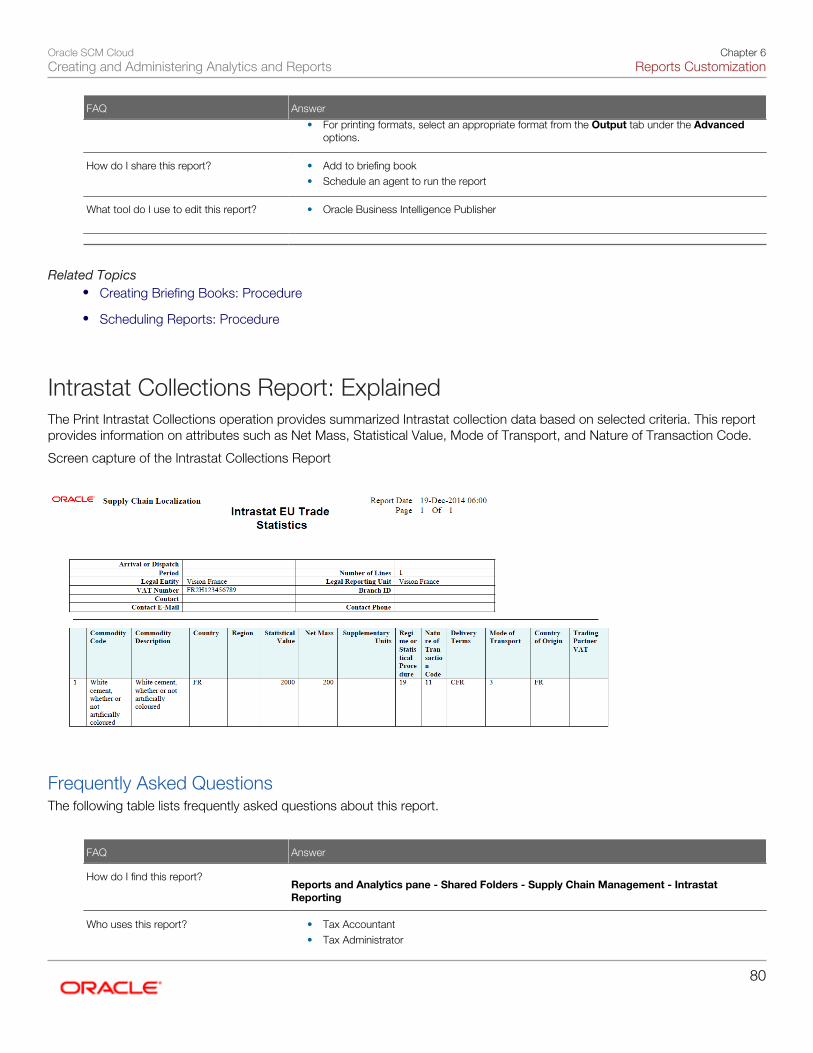
Oracle SCM CloudCreating and Administering Analytics and Reports
Chapter 6Reports Customization
80
FAQ Answer
• For printing formats, select an appropriate format from the Output tab under the Advancedoptions.
How do I share this report?
• Add to briefing book• Schedule an agent to run the report
What tool do I use to edit this report?
• Oracle Business Intelligence Publisher
Related Topics• Creating Briefing Books: Procedure
• Scheduling Reports: Procedure
Intrastat Collections Report: ExplainedThe Print Intrastat Collections operation provides summarized Intrastat collection data based on selected criteria. This reportprovides information on attributes such as Net Mass, Statistical Value, Mode of Transport, and Nature of Transaction Code.
Screen capture of the Intrastat Collections Report
Frequently Asked QuestionsThe following table lists frequently asked questions about this report.
FAQ Answer
How do I find this report? Reports and Analytics pane - Shared Folders - Supply Chain Management - Intrastat
Reporting
Who uses this report?
• Tax Accountant• Tax Administrator
Oracle SCM CloudCreating and Administering Analytics and Reports
Chapter 6Reports Customization
81
FAQ Answer
• Tax Manager• Tax Specialist
When do I use this report?
Use this report to get a summary of Intrastat transactions. You can print this report in draft modeor in final mode. When printed in final mode the status of the transactions is updated and no furthermodifications are allowed for those transactions.
What prompts can I use to narrow theresults of this report?
• Use the following parameters to filter the results:
◦ Legal Entity (Required)
◦ Legal Reporting Unit (Required)
◦ Period
◦ From / To Date
◦ Flow Type
• Arrival• Arrival adjustment• Dispatch• Dispatch Adjustment
◦ Source Transaction
◦ Report Mode
Either a Period or a date range (From Date , To Date) is required.• For printing formats, select an appropriate format from the Output tab under the Advanced
options.
How do I share this report?
• Add to briefing book• Schedule an agent to run the report
What tool do I use to edit this report?
• Oracle Business Intelligence Publisher
Related Topics
• Creating Briefing Books: Procedure
• Scheduling Reports: Procedure
Intrastat Collection Validation Report: ExplainedThe Intrastat Collection Validation Report provides a list of all validation errors in Intrastat transactions.
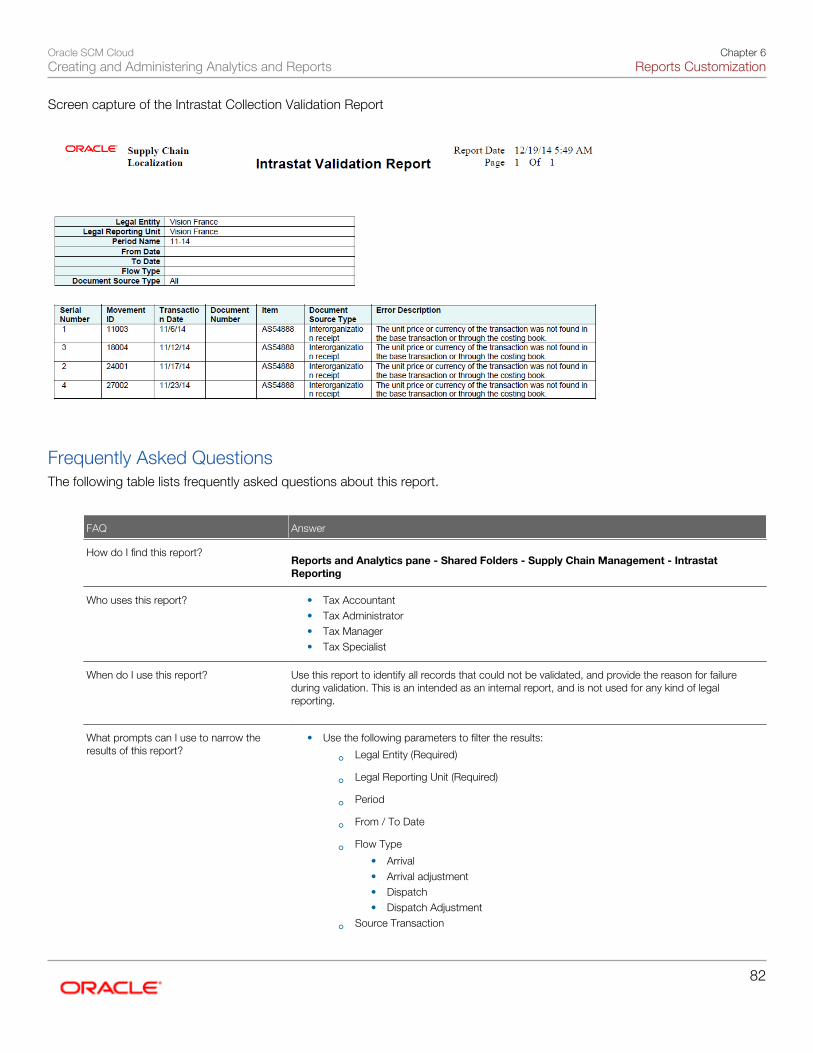
Oracle SCM CloudCreating and Administering Analytics and Reports
Chapter 6Reports Customization
82
Screen capture of the Intrastat Collection Validation Report
Frequently Asked QuestionsThe following table lists frequently asked questions about this report.
FAQ Answer
How do I find this report? Reports and Analytics pane - Shared Folders - Supply Chain Management - Intrastat
Reporting
Who uses this report?
• Tax Accountant• Tax Administrator• Tax Manager• Tax Specialist
When do I use this report?
Use this report to identify all records that could not be validated, and provide the reason for failureduring validation. This is an intended as an internal report, and is not used for any kind of legalreporting.
What prompts can I use to narrow theresults of this report?
• Use the following parameters to filter the results:
◦ Legal Entity (Required)
◦ Legal Reporting Unit (Required)
◦ Period
◦ From / To Date
◦ Flow Type
• Arrival• Arrival adjustment• Dispatch• Dispatch Adjustment
◦ Source Transaction
Oracle SCM CloudCreating and Administering Analytics and Reports
Chapter 6Reports Customization
83
FAQ Answer
◦ Report Mode
Either a Period or a date range (From Date , To Date) is required.• For printing formats, select an appropriate format from the Output tab under the Advanced
options.
How do I share this report?
• Add to briefing book• Schedule an agent to run the report
What tool do I use to edit this report?
• Oracle Business Intelligence Publisher
Related Topics
• Creating Briefing Books: Procedure
• Scheduling Reports: Procedure
Cost Accounting Reports
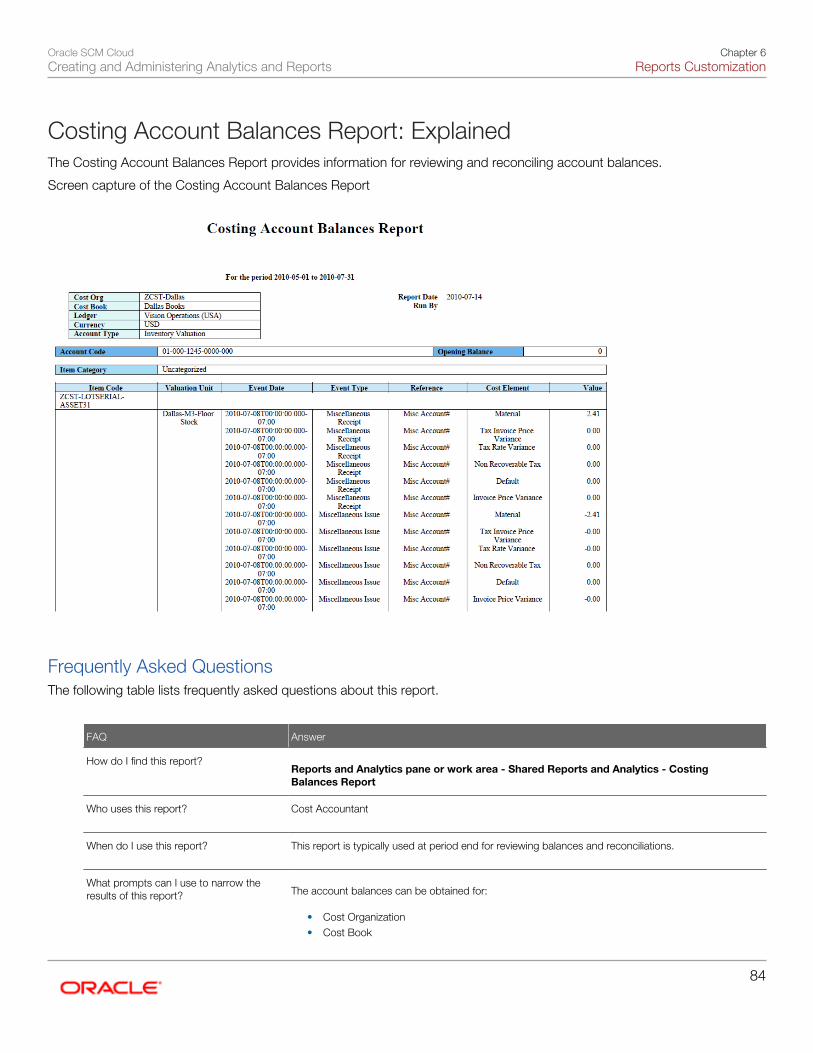
Oracle SCM CloudCreating and Administering Analytics and Reports
Chapter 6Reports Customization
84
Costing Account Balances Report: ExplainedThe Costing Account Balances Report provides information for reviewing and reconciling account balances.
Screen capture of the Costing Account Balances Report
Frequently Asked QuestionsThe following table lists frequently asked questions about this report.
FAQ Answer
How do I find this report? Reports and Analytics pane or work area - Shared Reports and Analytics - Costing
Balances Report
Who uses this report?
Cost Accountant
When do I use this report?
This report is typically used at period end for reviewing balances and reconciliations.
What prompts can I use to narrow theresults of this report?
The account balances can be obtained for:
• Cost Organization• Cost Book
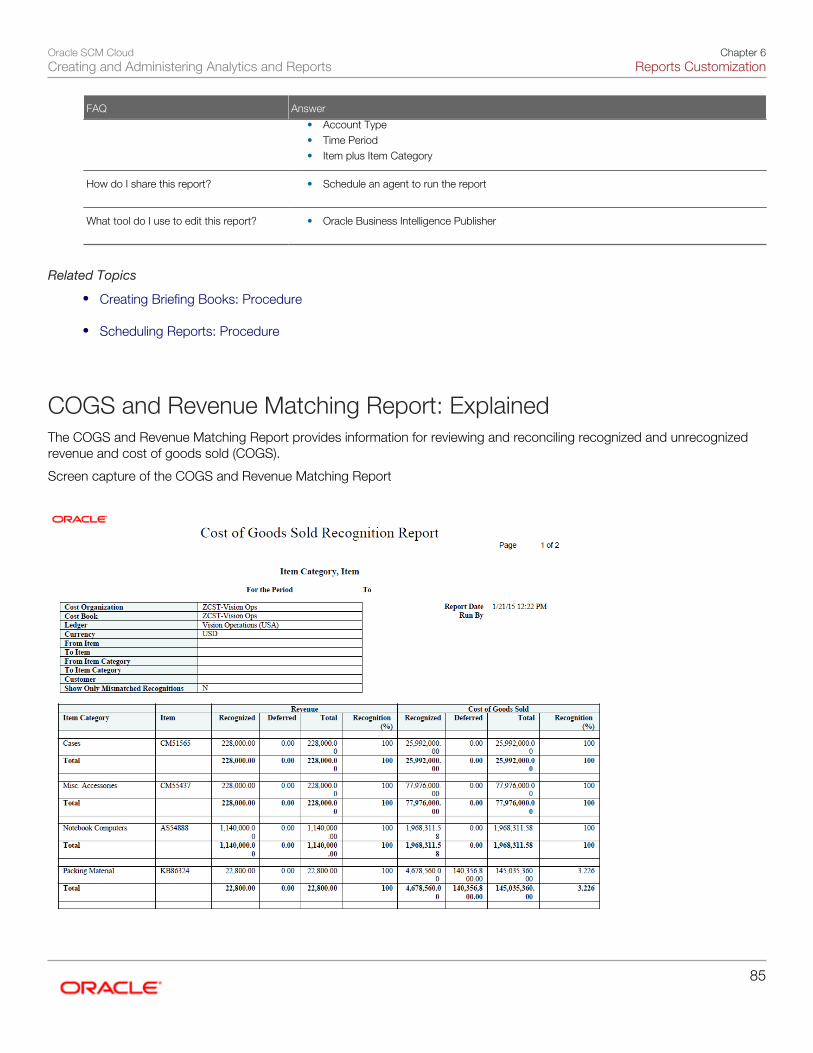
Oracle SCM CloudCreating and Administering Analytics and Reports
Chapter 6Reports Customization
85
FAQ Answer
• Account Type• Time Period• Item plus Item Category
How do I share this report?
• Schedule an agent to run the report
What tool do I use to edit this report?
• Oracle Business Intelligence Publisher
Related Topics
• Creating Briefing Books: Procedure
• Scheduling Reports: Procedure
COGS and Revenue Matching Report: ExplainedThe COGS and Revenue Matching Report provides information for reviewing and reconciling recognized and unrecognizedrevenue and cost of goods sold (COGS).
Screen capture of the COGS and Revenue Matching Report
Oracle SCM CloudCreating and Administering Analytics and Reports
Chapter 6Reports Customization
86
Key InsightsThis report can be used to view just unmatched revenue, or Cost of Goods Sold, to help with period-end reconciliation.
Frequently Asked QuestionsThe following table lists frequently asked questions about this report.
FAQ Answer
How do I find this report? Reports and Analytics pane or work area - Shared Reports and Analytics - COGS and
Revenue Matching
Who uses this report?
Cost Accountant
When do I use this report?
Use this report to ensure that the value of cost of goods sold is synchronized to the amount ofrecognized revenue in accounts receivable.
What prompts can I use to narrow theresults of this report?
The unmatched COGS and Revenue information can be seen for a Cost Organization-Bookcombination for Costed or Accounted records. Other options available include date range, Items& Item Category, Customer, Sales Order number. By using different layouts, the data can also besummarized (by Item Category, Item) or can be shown for individual sales orders.
How do I share this report?
• Schedule an agent to run the report
What tool do I use to edit this report?
• Oracle Business Intelligence Publisher
Related Topics
• Creating Briefing Books: Procedure
• Scheduling Reports: Procedure
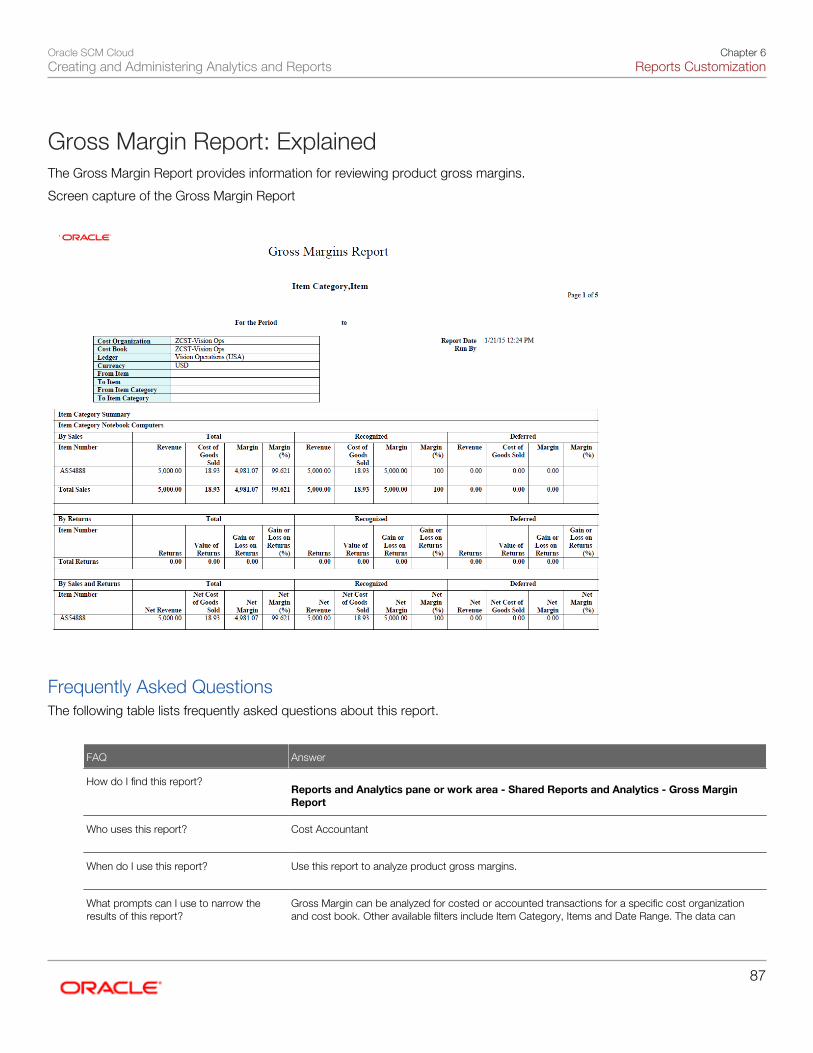
Oracle SCM CloudCreating and Administering Analytics and Reports
Chapter 6Reports Customization
87
Gross Margin Report: ExplainedThe Gross Margin Report provides information for reviewing product gross margins.
Screen capture of the Gross Margin Report
Frequently Asked QuestionsThe following table lists frequently asked questions about this report.
FAQ Answer
How do I find this report? Reports and Analytics pane or work area - Shared Reports and Analytics - Gross Margin
Report
Who uses this report?
Cost Accountant
When do I use this report?
Use this report to analyze product gross margins.
What prompts can I use to narrow theresults of this report?
Gross Margin can be analyzed for costed or accounted transactions for a specific cost organizationand cost book. Other available filters include Item Category, Items and Date Range. The data can
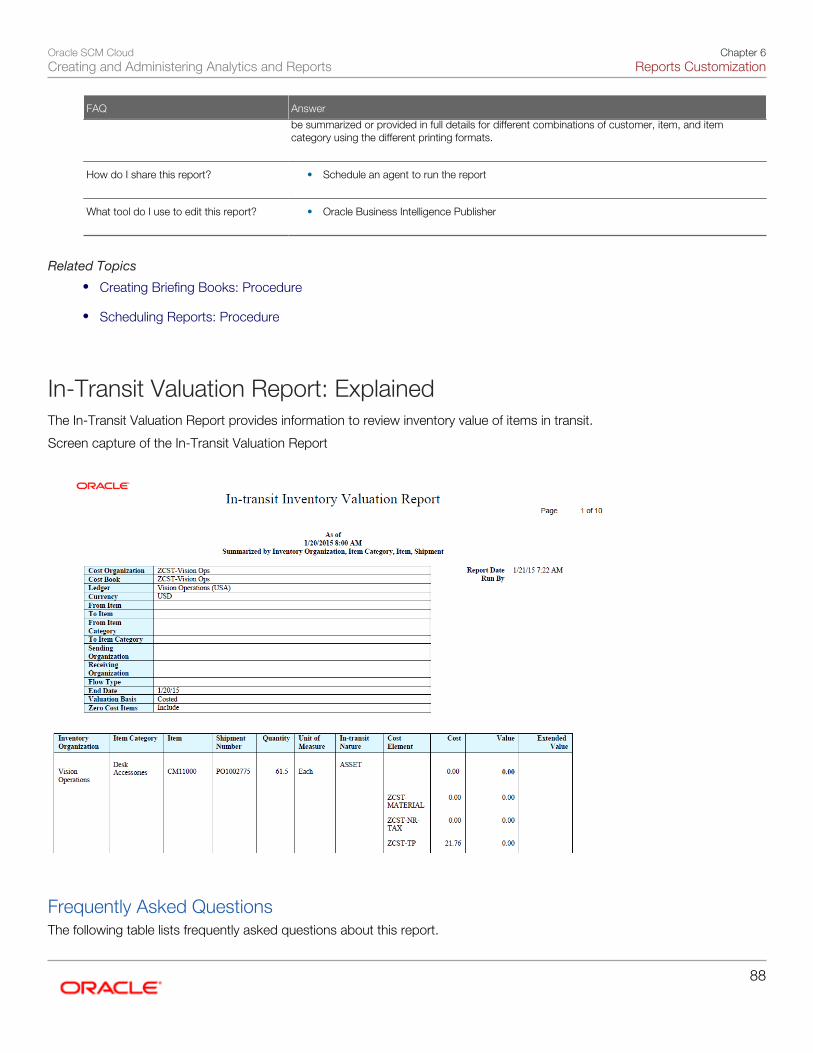
Oracle SCM CloudCreating and Administering Analytics and Reports
Chapter 6Reports Customization
88
FAQ Answer
be summarized or provided in full details for different combinations of customer, item, and itemcategory using the different printing formats.
How do I share this report?
• Schedule an agent to run the report
What tool do I use to edit this report?
• Oracle Business Intelligence Publisher
Related Topics
• Creating Briefing Books: Procedure
• Scheduling Reports: Procedure
In-Transit Valuation Report: ExplainedThe In-Transit Valuation Report provides information to review inventory value of items in transit.
Screen capture of the In-Transit Valuation Report
Frequently Asked QuestionsThe following table lists frequently asked questions about this report.
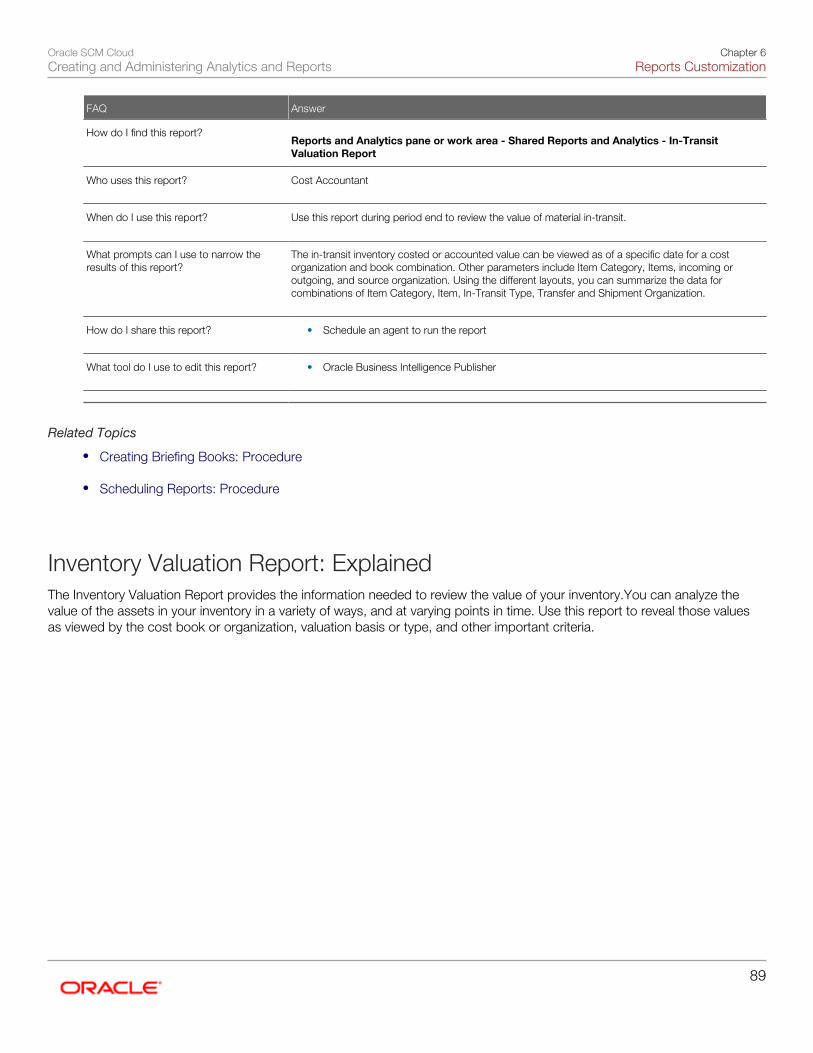
Oracle SCM CloudCreating and Administering Analytics and Reports
Chapter 6Reports Customization
89
FAQ Answer
How do I find this report? Reports and Analytics pane or work area - Shared Reports and Analytics - In-Transit
Valuation Report
Who uses this report?
Cost Accountant
When do I use this report?
Use this report during period end to review the value of material in-transit.
What prompts can I use to narrow theresults of this report?
The in-transit inventory costed or accounted value can be viewed as of a specific date for a costorganization and book combination. Other parameters include Item Category, Items, incoming oroutgoing, and source organization. Using the different layouts, you can summarize the data forcombinations of Item Category, Item, In-Transit Type, Transfer and Shipment Organization.
How do I share this report?
• Schedule an agent to run the report
What tool do I use to edit this report?
• Oracle Business Intelligence Publisher
Related Topics
• Creating Briefing Books: Procedure
• Scheduling Reports: Procedure
Inventory Valuation Report: ExplainedThe Inventory Valuation Report provides the information needed to review the value of your inventory.You can analyze thevalue of the assets in your inventory in a variety of ways, and at varying points in time. Use this report to reveal those valuesas viewed by the cost book or organization, valuation basis or type, and other important criteria.
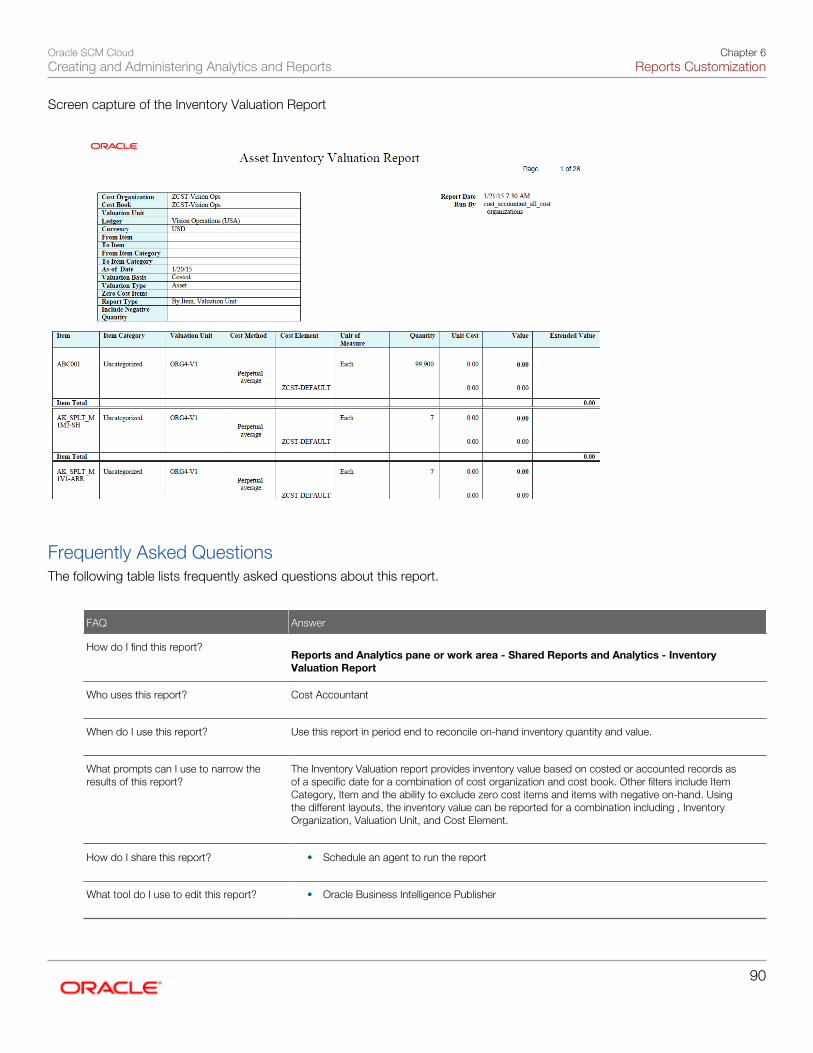
Oracle SCM CloudCreating and Administering Analytics and Reports
Chapter 6Reports Customization
90
Screen capture of the Inventory Valuation Report
Frequently Asked QuestionsThe following table lists frequently asked questions about this report.
FAQ Answer
How do I find this report? Reports and Analytics pane or work area - Shared Reports and Analytics - Inventory
Valuation Report
Who uses this report?
Cost Accountant
When do I use this report?
Use this report in period end to reconcile on-hand inventory quantity and value.
What prompts can I use to narrow theresults of this report?
The Inventory Valuation report provides inventory value based on costed or accounted records asof a specific date for a combination of cost organization and cost book. Other filters include ItemCategory, Item and the ability to exclude zero cost items and items with negative on-hand. Usingthe different layouts, the inventory value can be reported for a combination including , InventoryOrganization, Valuation Unit, and Cost Element.
How do I share this report?
• Schedule an agent to run the report
What tool do I use to edit this report?
• Oracle Business Intelligence Publisher
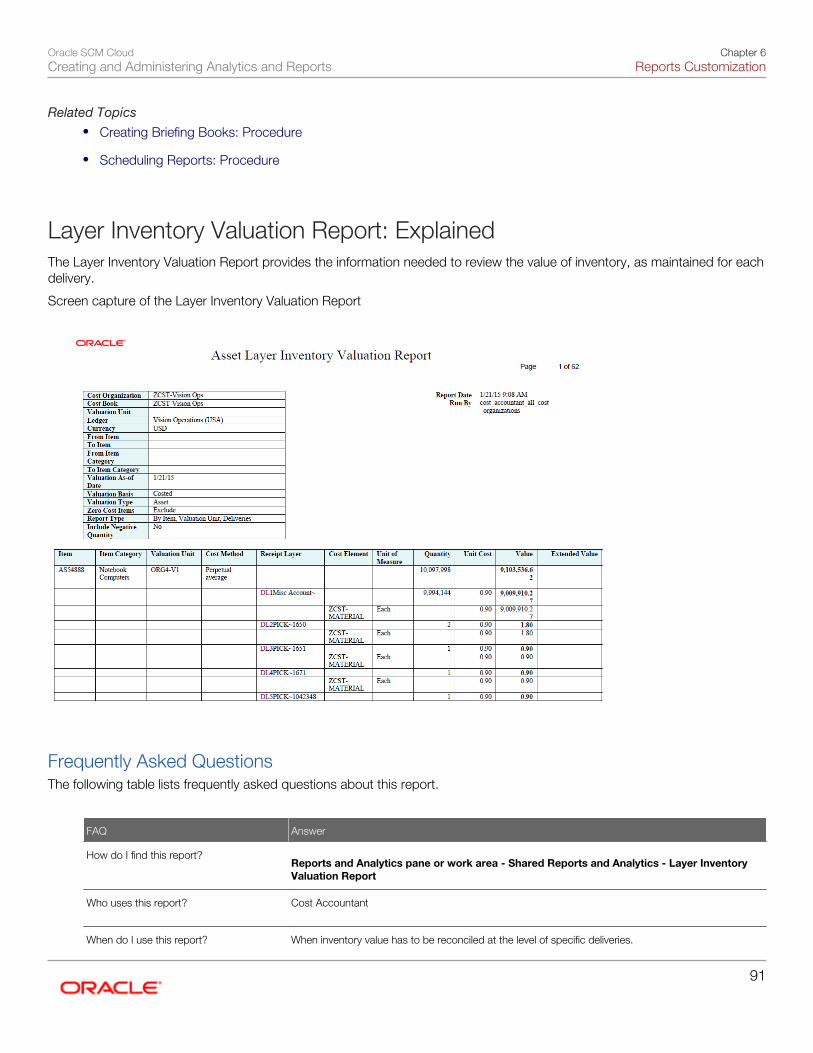
Oracle SCM CloudCreating and Administering Analytics and Reports
Chapter 6Reports Customization
91
Related Topics• Creating Briefing Books: Procedure
• Scheduling Reports: Procedure
Layer Inventory Valuation Report: ExplainedThe Layer Inventory Valuation Report provides the information needed to review the value of inventory, as maintained for eachdelivery.
Screen capture of the Layer Inventory Valuation Report
Frequently Asked QuestionsThe following table lists frequently asked questions about this report.
FAQ Answer
How do I find this report? Reports and Analytics pane or work area - Shared Reports and Analytics - Layer Inventory
Valuation Report
Who uses this report?
Cost Accountant
When do I use this report? When inventory value has to be reconciled at the level of specific deliveries.
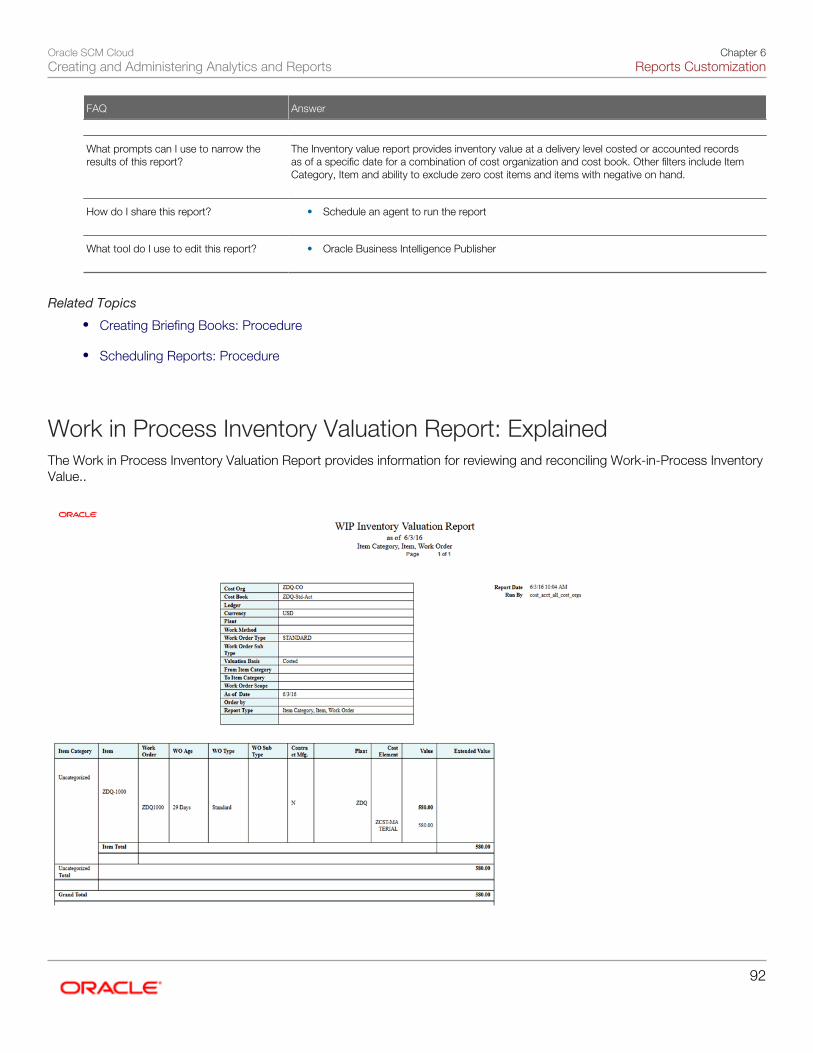
Oracle SCM CloudCreating and Administering Analytics and Reports
Chapter 6Reports Customization
92
FAQ Answer
What prompts can I use to narrow theresults of this report?
The Inventory value report provides inventory value at a delivery level costed or accounted recordsas of a specific date for a combination of cost organization and cost book. Other filters include ItemCategory, Item and ability to exclude zero cost items and items with negative on hand.
How do I share this report?
• Schedule an agent to run the report
What tool do I use to edit this report?
• Oracle Business Intelligence Publisher
Related Topics
• Creating Briefing Books: Procedure
• Scheduling Reports: Procedure
Work in Process Inventory Valuation Report: ExplainedThe Work in Process Inventory Valuation Report provides information for reviewing and reconciling Work-in-Process InventoryValue..
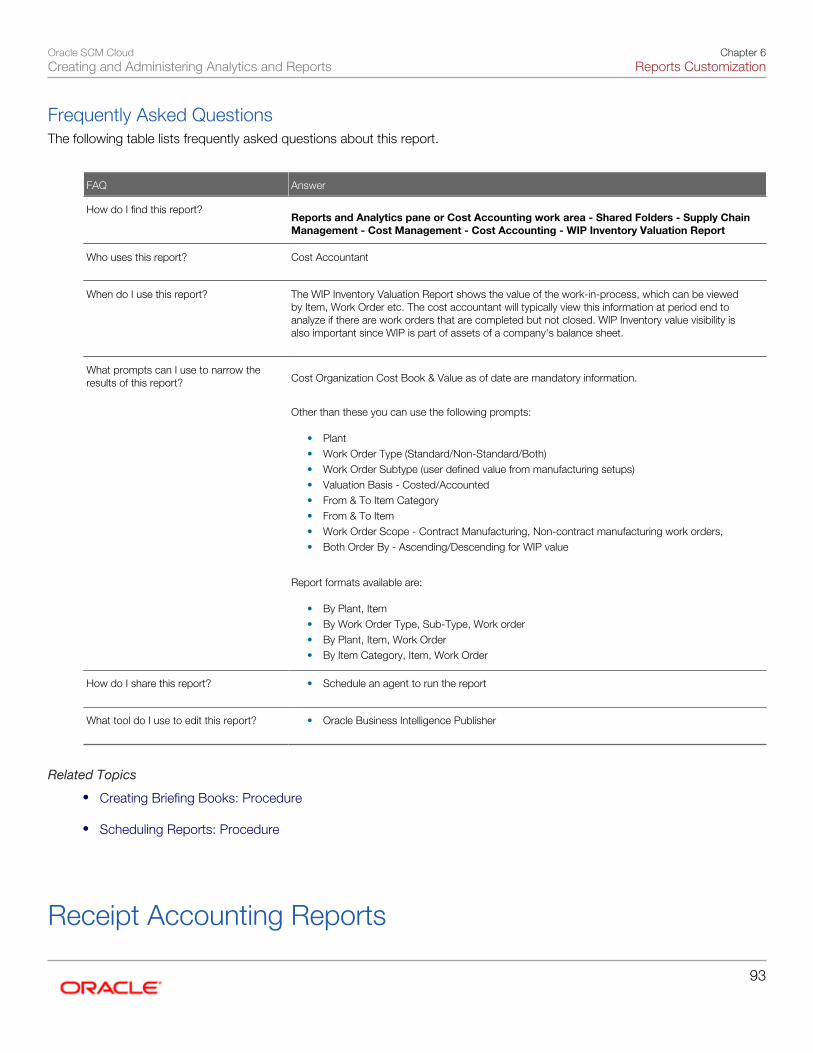
Oracle SCM CloudCreating and Administering Analytics and Reports
Chapter 6Reports Customization
93
Frequently Asked QuestionsThe following table lists frequently asked questions about this report.
FAQ Answer
How do I find this report? Reports and Analytics pane or Cost Accounting work area - Shared Folders - Supply Chain
Management - Cost Management - Cost Accounting - WIP Inventory Valuation Report
Who uses this report?
Cost Accountant
When do I use this report?
The WIP Inventory Valuation Report shows the value of the work-in-process, which can be viewedby Item, Work Order etc. The cost accountant will typically view this information at period end toanalyze if there are work orders that are completed but not closed. WIP Inventory value visibility isalso important since WIP is part of assets of a company's balance sheet.
What prompts can I use to narrow theresults of this report?
Cost Organization Cost Book & Value as of date are mandatory information.
Other than these you can use the following prompts:
• Plant• Work Order Type (Standard/Non-Standard/Both)• Work Order Subtype (user defined value from manufacturing setups)• Valuation Basis - Costed/Accounted• From & To Item Category• From & To Item• Work Order Scope - Contract Manufacturing, Non-contract manufacturing work orders,• Both Order By - Ascending/Descending for WIP value
Report formats available are:
• By Plant, Item• By Work Order Type, Sub-Type, Work order• By Plant, Item, Work Order• By Item Category, Item, Work Order
How do I share this report?
• Schedule an agent to run the report
What tool do I use to edit this report?
• Oracle Business Intelligence Publisher
Related Topics
• Creating Briefing Books: Procedure
• Scheduling Reports: Procedure
Receipt Accounting Reports
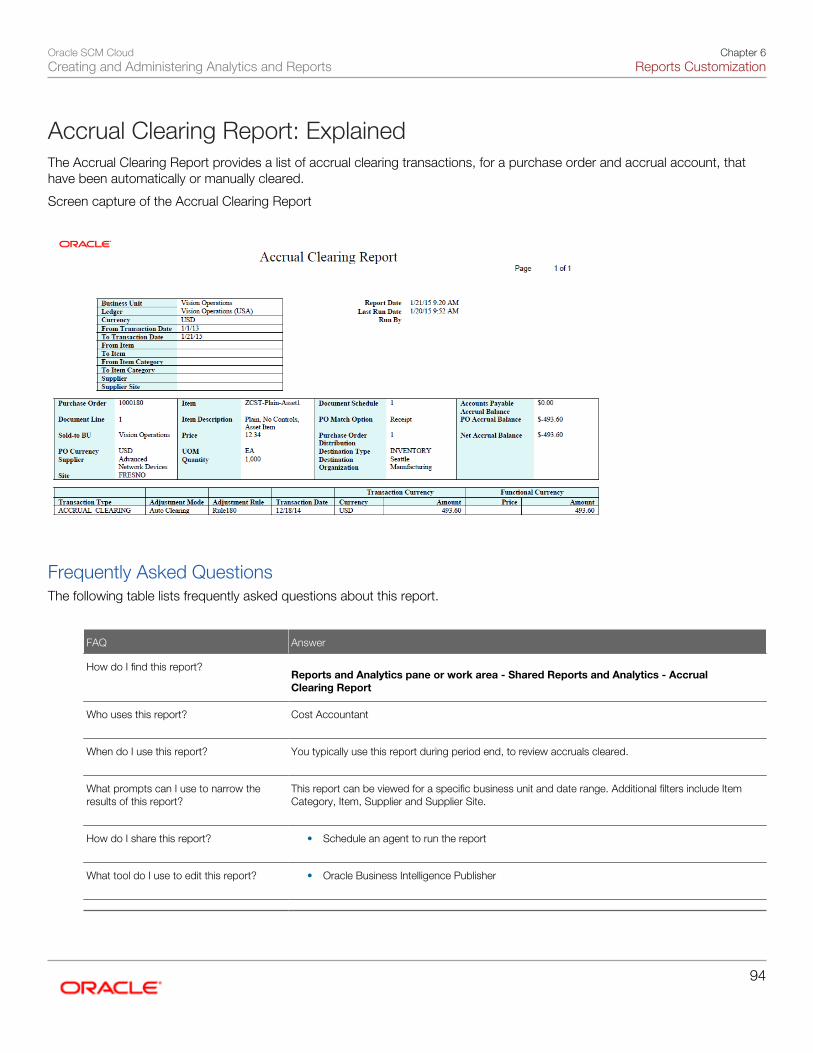
Oracle SCM CloudCreating and Administering Analytics and Reports
Chapter 6Reports Customization
94
Accrual Clearing Report: ExplainedThe Accrual Clearing Report provides a list of accrual clearing transactions, for a purchase order and accrual account, thathave been automatically or manually cleared.
Screen capture of the Accrual Clearing Report
Frequently Asked QuestionsThe following table lists frequently asked questions about this report.
FAQ Answer
How do I find this report? Reports and Analytics pane or work area - Shared Reports and Analytics - Accrual
Clearing Report
Who uses this report?
Cost Accountant
When do I use this report?
You typically use this report during period end, to review accruals cleared.
What prompts can I use to narrow theresults of this report?
This report can be viewed for a specific business unit and date range. Additional filters include ItemCategory, Item, Supplier and Supplier Site.
How do I share this report?
• Schedule an agent to run the report
What tool do I use to edit this report?
• Oracle Business Intelligence Publisher
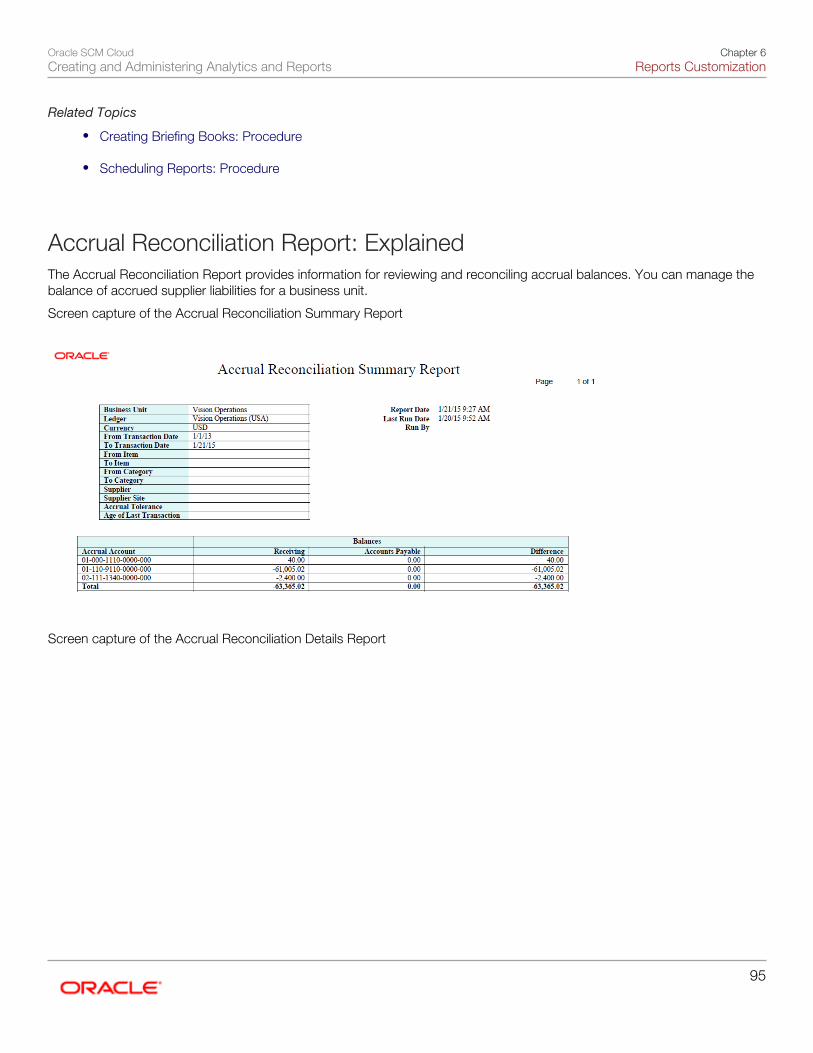
Oracle SCM CloudCreating and Administering Analytics and Reports
Chapter 6Reports Customization
95
Related Topics
• Creating Briefing Books: Procedure
• Scheduling Reports: Procedure
Accrual Reconciliation Report: ExplainedThe Accrual Reconciliation Report provides information for reviewing and reconciling accrual balances. You can manage thebalance of accrued supplier liabilities for a business unit.
Screen capture of the Accrual Reconciliation Summary Report
Screen capture of the Accrual Reconciliation Details Report
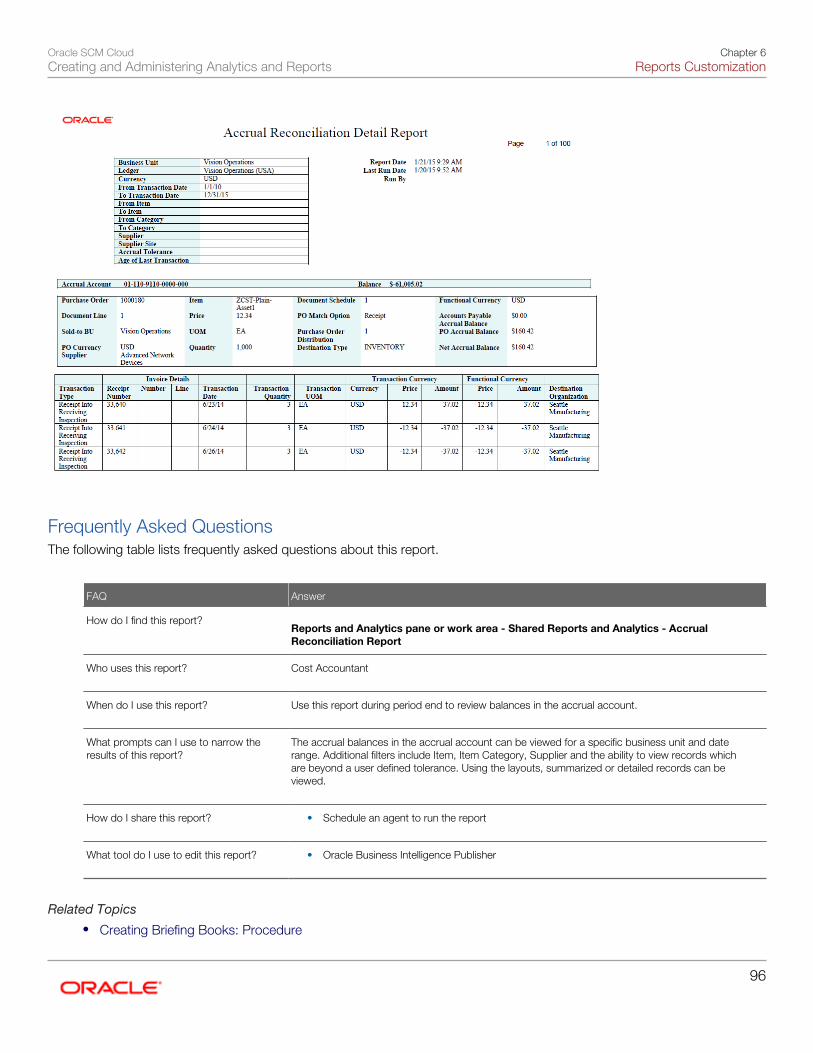
Oracle SCM CloudCreating and Administering Analytics and Reports
Chapter 6Reports Customization
96
Frequently Asked QuestionsThe following table lists frequently asked questions about this report.
FAQ Answer
How do I find this report? Reports and Analytics pane or work area - Shared Reports and Analytics - Accrual
Reconciliation Report
Who uses this report?
Cost Accountant
When do I use this report?
Use this report during period end to review balances in the accrual account.
What prompts can I use to narrow theresults of this report?
The accrual balances in the accrual account can be viewed for a specific business unit and daterange. Additional filters include Item, Item Category, Supplier and the ability to view records whichare beyond a user defined tolerance. Using the layouts, summarized or detailed records can beviewed.
How do I share this report?
• Schedule an agent to run the report
What tool do I use to edit this report?
• Oracle Business Intelligence Publisher
Related Topics
• Creating Briefing Books: Procedure
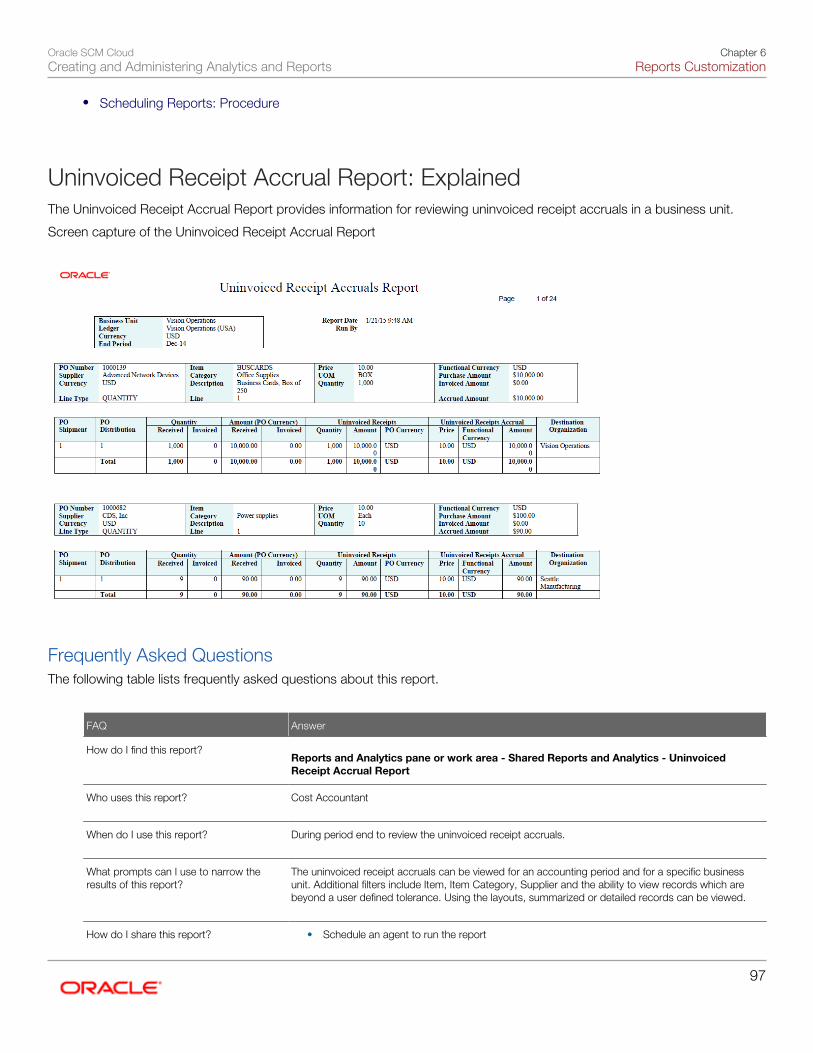
Oracle SCM CloudCreating and Administering Analytics and Reports
Chapter 6Reports Customization
97
• Scheduling Reports: Procedure
Uninvoiced Receipt Accrual Report: ExplainedThe Uninvoiced Receipt Accrual Report provides information for reviewing uninvoiced receipt accruals in a business unit.
Screen capture of the Uninvoiced Receipt Accrual Report
Frequently Asked QuestionsThe following table lists frequently asked questions about this report.
FAQ Answer
How do I find this report? Reports and Analytics pane or work area - Shared Reports and Analytics - Uninvoiced
Receipt Accrual Report
Who uses this report?
Cost Accountant
When do I use this report?
During period end to review the uninvoiced receipt accruals.
What prompts can I use to narrow theresults of this report?
The uninvoiced receipt accruals can be viewed for an accounting period and for a specific businessunit. Additional filters include Item, Item Category, Supplier and the ability to view records which arebeyond a user defined tolerance. Using the layouts, summarized or detailed records can be viewed.
How do I share this report? • Schedule an agent to run the report
Oracle SCM CloudCreating and Administering Analytics and Reports
Chapter 6Reports Customization
98
FAQ Answer
What tool do I use to edit this report?
• Oracle Business Intelligence Publisher
Related Topics
• Creating Briefing Books: Procedure
• Scheduling Reports: Procedure
Change Order Listing Report: ExplainedThe Change Order Listing Report displays the details for a range of items for one or more change orders. The details includethe change order header and line attributes. Changes made for items can also included in the report.
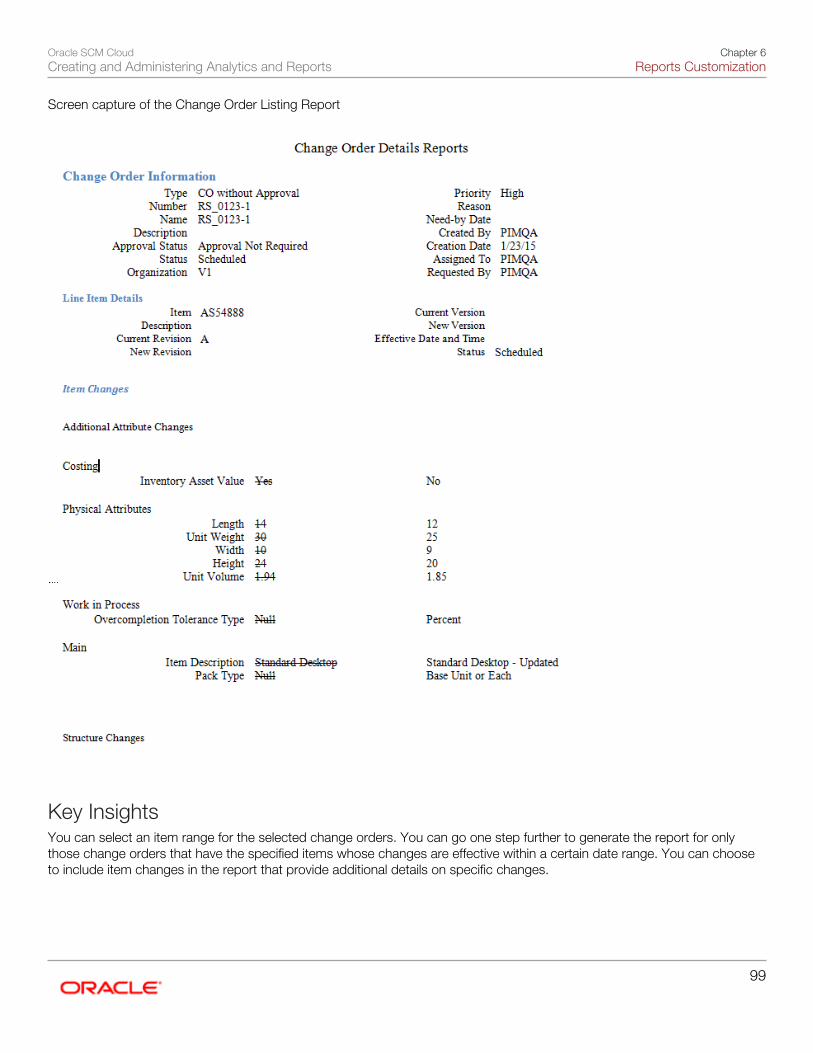
Oracle SCM CloudCreating and Administering Analytics and Reports
Chapter 6Reports Customization
99
Screen capture of the Change Order Listing Report
Key InsightsYou can select an item range for the selected change orders. You can go one step further to generate the report for onlythose change orders that have the specified items whose changes are effective within a certain date range. You can chooseto include item changes in the report that provide additional details on specific changes.

Oracle SCM CloudCreating and Administering Analytics and Reports
Chapter 6Reports Customization
100
Frequently Asked QuestionsThe following table lists frequently asked questions about this report.
FAQ Answer
How do I find this report? To generate a report on multiple change orders:
Manage Change Orders - Search and select change orders - Actions - Generate Report -Submit scheduled process
To generate a report on a single change order:
Manage Change Orders - Search and select a change order - View or edit the changeorder - Actions - Generate Report - Select Output format - Go
Restriction: This report can only be run from the Manage Change Orders page,since it depends on the selection of data there.
Who uses this report?
• Product Data Steward• Product Manager
When do I use this report?
When the product data steward must evaluate change orders based on certain criteria.
What prompts can I use to narrow theresults of this report?
• Item Range• Effective Dates• Include Item Changes
How do I share this report?
This is an ad hoc report that is generally not shared. To share the output, choose an Output Formatthat can be downloaded, such as PDF, and shared as an attachment.
What tool do I use to edit this report?
• Oracle Business Intelligence Publisher
Related Topics
• Creating Briefing Books: Procedure
• Scheduling Reports: Procedure
Catalog Details Report: ExplainedThe Catalog Details Report displays details about a catalog that include the catalog configuration, category hierarchy,category details and assigned items for each category.
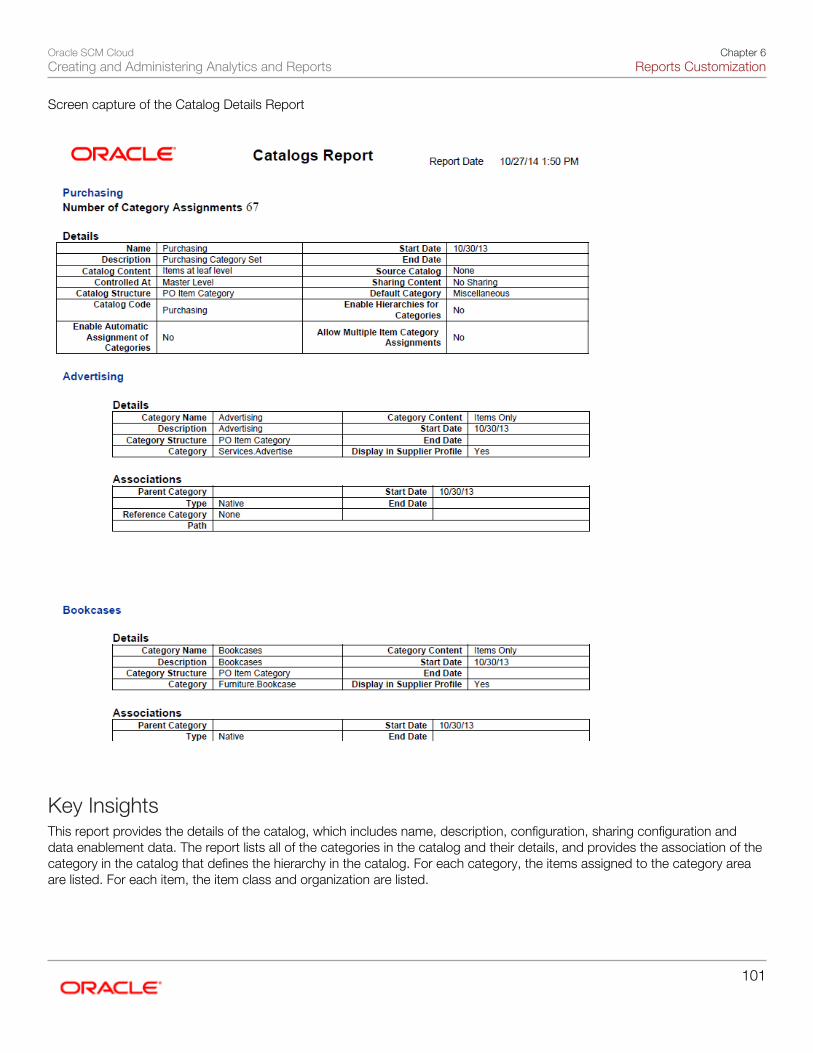
Oracle SCM CloudCreating and Administering Analytics and Reports
Chapter 6Reports Customization
101
Screen capture of the Catalog Details Report
Key InsightsThis report provides the details of the catalog, which includes name, description, configuration, sharing configuration anddata enablement data. The report lists all of the categories in the catalog and their details, and provides the association of thecategory in the catalog that defines the hierarchy in the catalog. For each category, the items assigned to the category areaare listed. For each item, the item class and organization are listed.
Oracle SCM CloudCreating and Administering Analytics and Reports
Chapter 6Reports Customization
102
Frequently Asked QuestionsThe following table lists frequently asked questions about this report.
FAQ Answer
How do I find this report? Manage Catalogs - Search and select catalog - Actions - Publish - Output Format - Go
Restriction: This report can only be run from the Manage Catalogs page, since itdepends on the selection of data there.
Who uses this report?
• Product Data Steward• Product Manager
When do I use this report?
Use this report to publish details of a catalog that can be used to provide data to print catalogs orweb catalogs.
What prompts can I use to narrow theresults of this report?
You can select an output template, format, and locale for the report.
• Template: Catalog Listing (predefined default). A template is a report layout created withOracle Business Intelligence Publisher.
• Output Format: HTML (default), PDF, RTF, Excel, PowerPoint, and Data (XML).• Locale: based on the server installation.
How do I share this report?
This is an ad hoc report that is generally not shared. To share the output, choose an Output Formatthat can be downloaded, such as PDF, and shared as an attachment.
What tool do I use to edit this report?
• Oracle Business Intelligence Publisher
Related Topics
• Creating Briefing Books: Procedure
• Scheduling Reports: Procedure
Reports for Concepts
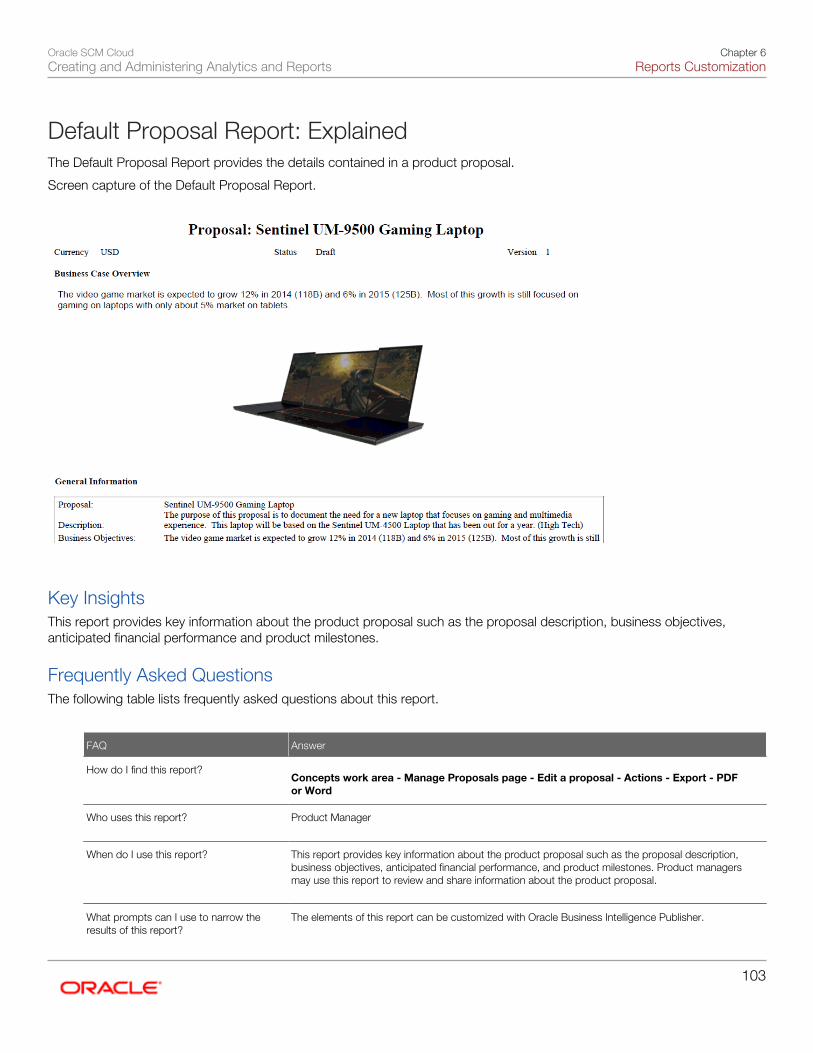
Oracle SCM CloudCreating and Administering Analytics and Reports
Chapter 6Reports Customization
103
Default Proposal Report: ExplainedThe Default Proposal Report provides the details contained in a product proposal.
Screen capture of the Default Proposal Report.
Key InsightsThis report provides key information about the product proposal such as the proposal description, business objectives,anticipated financial performance and product milestones.
Frequently Asked QuestionsThe following table lists frequently asked questions about this report.
FAQ Answer
How do I find this report? Concepts work area - Manage Proposals page - Edit a proposal - Actions - Export - PDF
or Word
Who uses this report?
Product Manager
When do I use this report?
This report provides key information about the product proposal such as the proposal description,business objectives, anticipated financial performance, and product milestones. Product managersmay use this report to review and share information about the product proposal.
What prompts can I use to narrow theresults of this report?
The elements of this report can be customized with Oracle Business Intelligence Publisher.
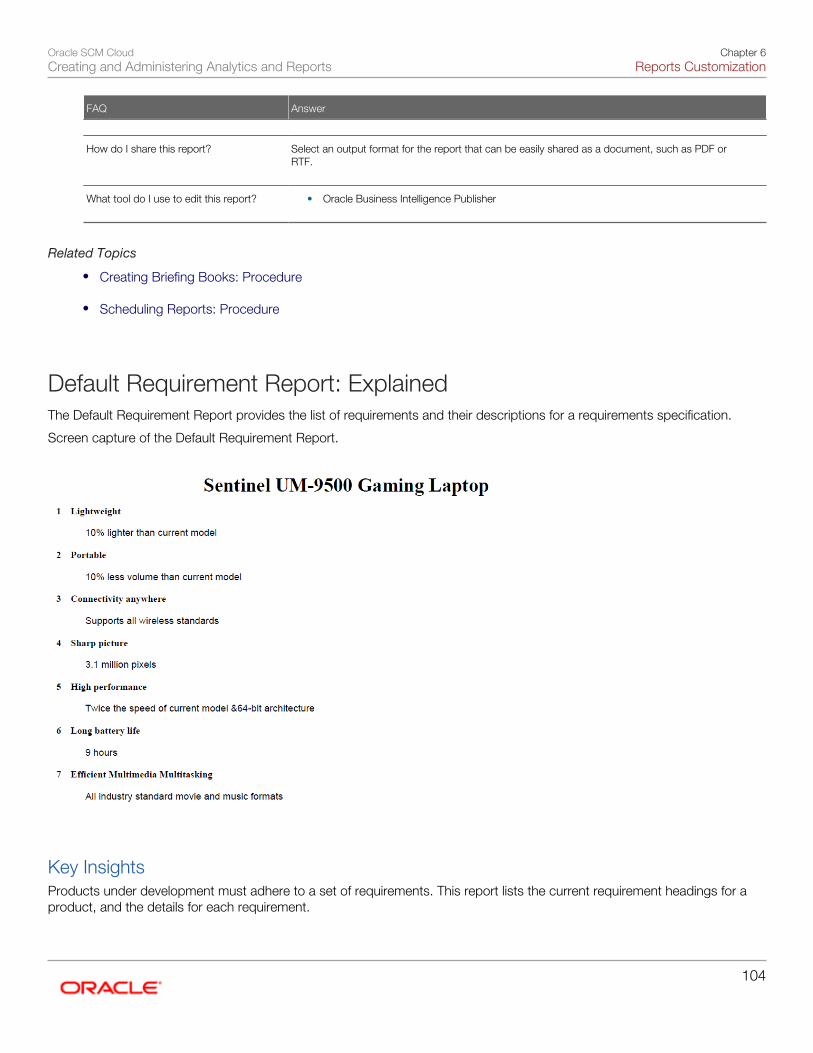
Oracle SCM CloudCreating and Administering Analytics and Reports
Chapter 6Reports Customization
104
FAQ Answer
How do I share this report?
Select an output format for the report that can be easily shared as a document, such as PDF orRTF.
What tool do I use to edit this report?
• Oracle Business Intelligence Publisher
Related Topics
• Creating Briefing Books: Procedure
• Scheduling Reports: Procedure
Default Requirement Report: ExplainedThe Default Requirement Report provides the list of requirements and their descriptions for a requirements specification.
Screen capture of the Default Requirement Report.
Key InsightsProducts under development must adhere to a set of requirements. This report lists the current requirement headings for aproduct, and the details for each requirement.
Oracle SCM CloudCreating and Administering Analytics and Reports
Chapter 6Reports Customization
105
Frequently Asked QuestionsThe following table lists frequently asked questions about this report.
FAQ Answer
How do I find this report? Concepts work area - Manage Requirements Specifications page - Edit a requirements
specification - Actions - Export - HTML, PDF, Word, or XML
Who uses this report?
Product Manager
When do I use this report?
This report is used by Product Managers to review and share information about requirements withina specific requirements specification.
What prompts can I use to narrow theresults of this report?
The elements of this report can be customized with Oracle Business Intelligence Publisher.
How do I share this report?
Select an output format for the report that can be easily shared as a document, such as PDF orRTF.
What tool do I use to edit this report?
• Oracle Business Intelligence Publisher
Related Topics
• Creating Briefing Books: Procedure
• Scheduling Reports: Procedure
Analyses for Portfolios
Value and Consumption Analysis: ExplainedThe Value and Consumption Analysis provides two charts that help users to understand the value vs cost of various productproposals in a selected scenario
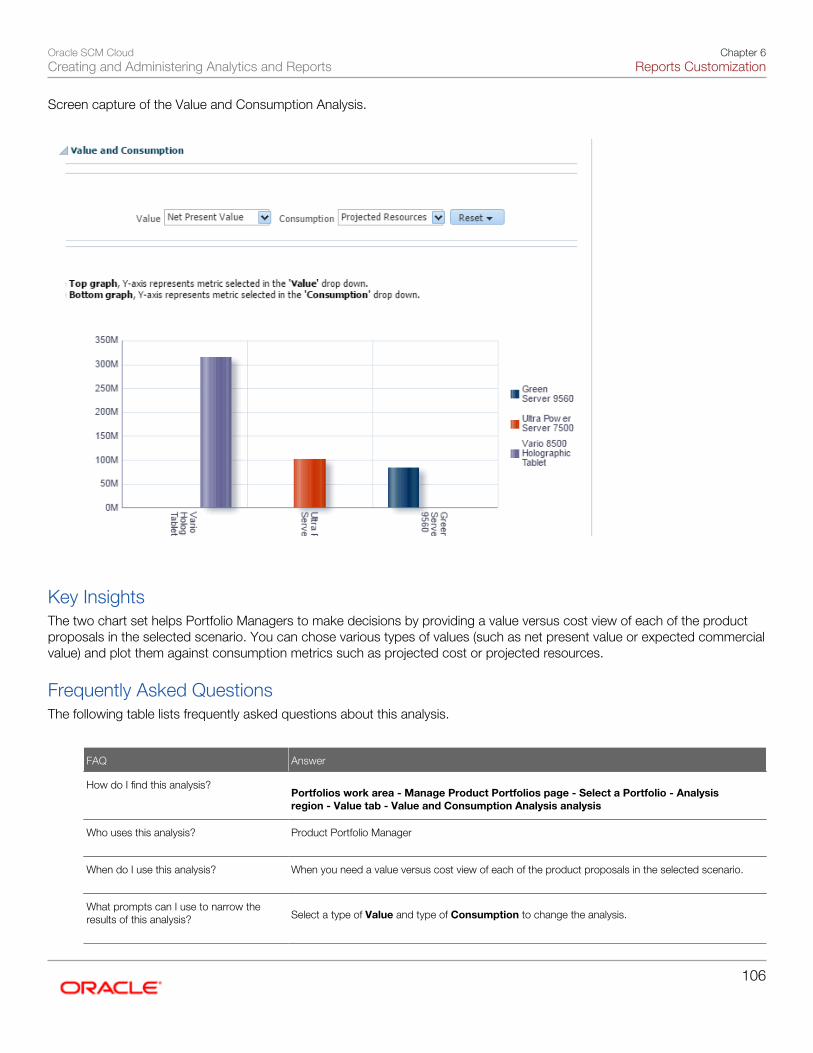
Oracle SCM CloudCreating and Administering Analytics and Reports
Chapter 6Reports Customization
106
Screen capture of the Value and Consumption Analysis.
Key InsightsThe two chart set helps Portfolio Managers to make decisions by providing a value versus cost view of each of the productproposals in the selected scenario. You can chose various types of values (such as net present value or expected commercialvalue) and plot them against consumption metrics such as projected cost or projected resources.
Frequently Asked QuestionsThe following table lists frequently asked questions about this analysis.
FAQ Answer
How do I find this analysis? Portfolios work area - Manage Product Portfolios page - Select a Portfolio - Analysis
region - Value tab - Value and Consumption Analysis analysis
Who uses this analysis?
Product Portfolio Manager
When do I use this analysis?
When you need a value versus cost view of each of the product proposals in the selected scenario.
What prompts can I use to narrow theresults of this analysis?
Select a type of Value and type of Consumption to change the analysis.
Oracle SCM CloudCreating and Administering Analytics and Reports
Chapter 6Reports Customization
107
FAQ Answer
How do I share this analysis?
Not applicable for this analysis, since its content depends on the data derived from its context,which is not available elsewhere.
What tool do I use to edit this analysis?
Not applicable for this analysis, since it's not necessary to modify it.
Related Subject AreaThis report uses the Innovation Management - Product Portfolio Real Time subject area. For more information, refer toSubject Area documentation on the Oracle Help Center.
Related Topics
• Creating Briefing Books: Procedure
• Scheduling Analytics and Briefing Books: Procedure
Revenue, Cost, and Margin Analysis: ExplainedThe Value: Revenue, Cost, and Margin analysis displays a revenue cost and margin chart for the selected proposals in ascenario
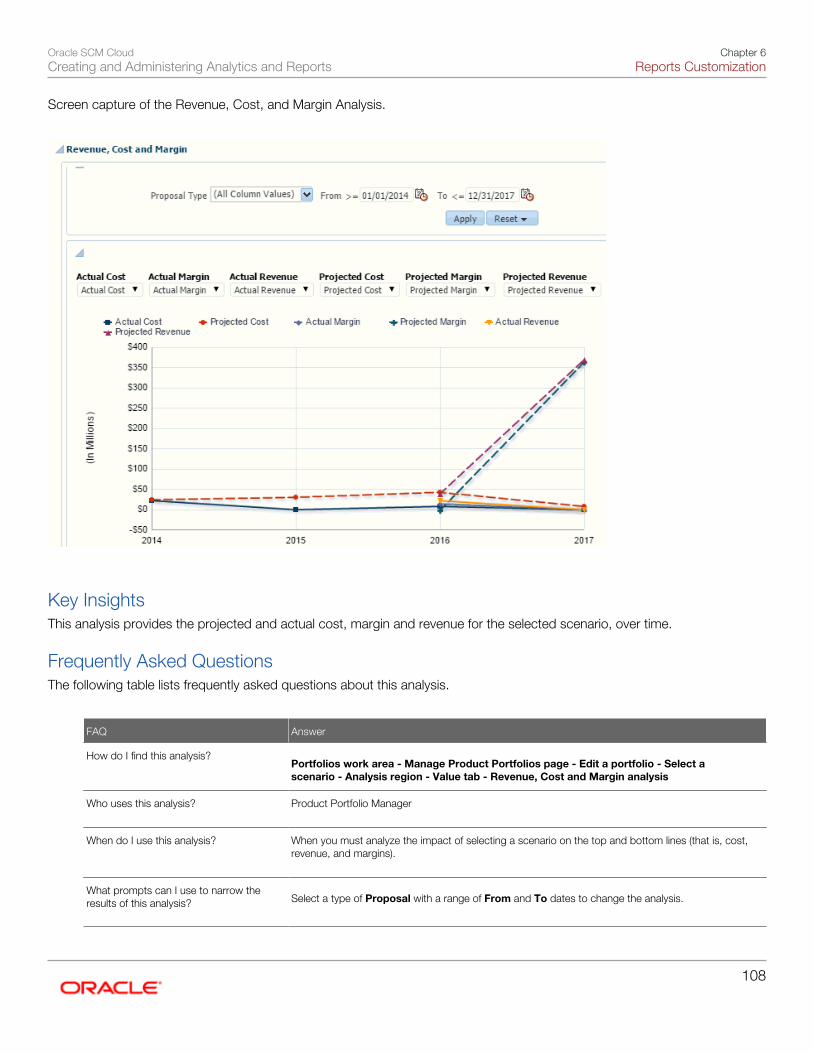
Oracle SCM CloudCreating and Administering Analytics and Reports
Chapter 6Reports Customization
108
Screen capture of the Revenue, Cost, and Margin Analysis.
Key InsightsThis analysis provides the projected and actual cost, margin and revenue for the selected scenario, over time.
Frequently Asked QuestionsThe following table lists frequently asked questions about this analysis.
FAQ Answer
How do I find this analysis? Portfolios work area - Manage Product Portfolios page - Edit a portfolio - Select a
scenario - Analysis region - Value tab - Revenue, Cost and Margin analysis
Who uses this analysis?
Product Portfolio Manager
When do I use this analysis?
When you must analyze the impact of selecting a scenario on the top and bottom lines (that is, cost,revenue, and margins).
What prompts can I use to narrow theresults of this analysis?
Select a type of Proposal with a range of From and To dates to change the analysis.
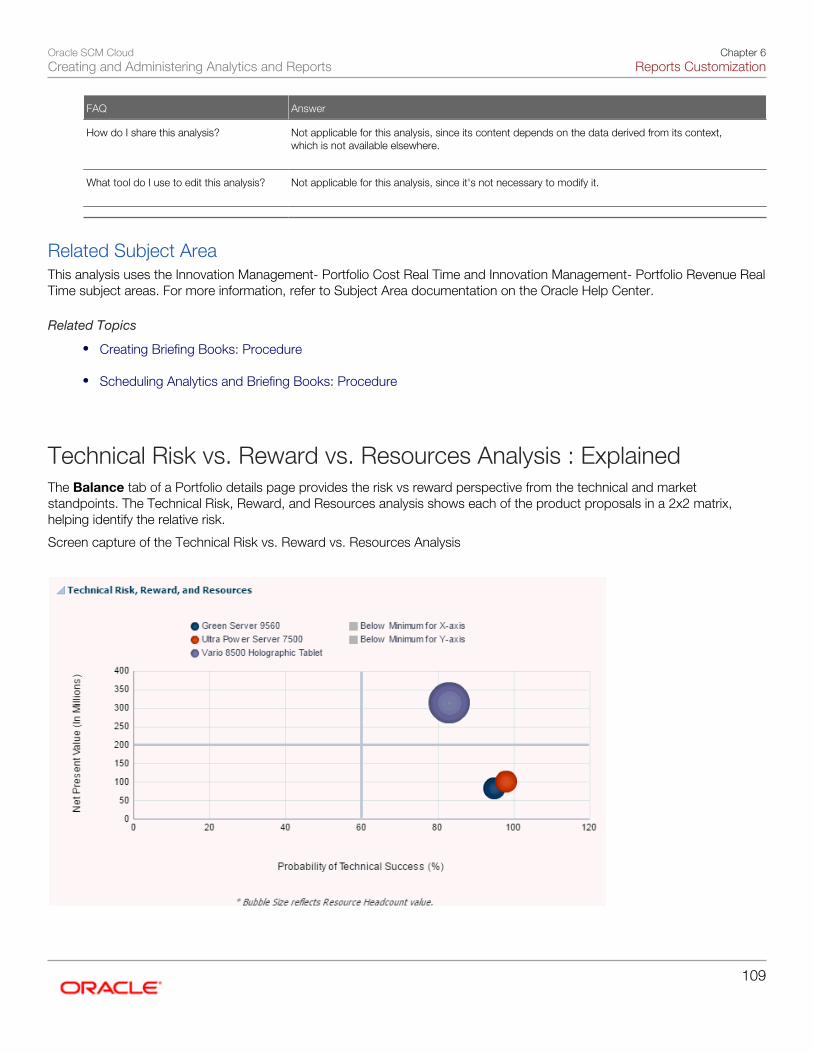
Oracle SCM CloudCreating and Administering Analytics and Reports
Chapter 6Reports Customization
109
FAQ Answer
How do I share this analysis?
Not applicable for this analysis, since its content depends on the data derived from its context,which is not available elsewhere.
What tool do I use to edit this analysis?
Not applicable for this analysis, since it's not necessary to modify it.
Related Subject AreaThis analysis uses the Innovation Management- Portfolio Cost Real Time and Innovation Management- Portfolio Revenue RealTime subject areas. For more information, refer to Subject Area documentation on the Oracle Help Center.
Related Topics
• Creating Briefing Books: Procedure
• Scheduling Analytics and Briefing Books: Procedure
Technical Risk vs. Reward vs. Resources Analysis : ExplainedThe Balance tab of a Portfolio details page provides the risk vs reward perspective from the technical and marketstandpoints. The Technical Risk, Reward, and Resources analysis shows each of the product proposals in a 2x2 matrix,helping identify the relative risk.
Screen capture of the Technical Risk vs. Reward vs. Resources Analysis
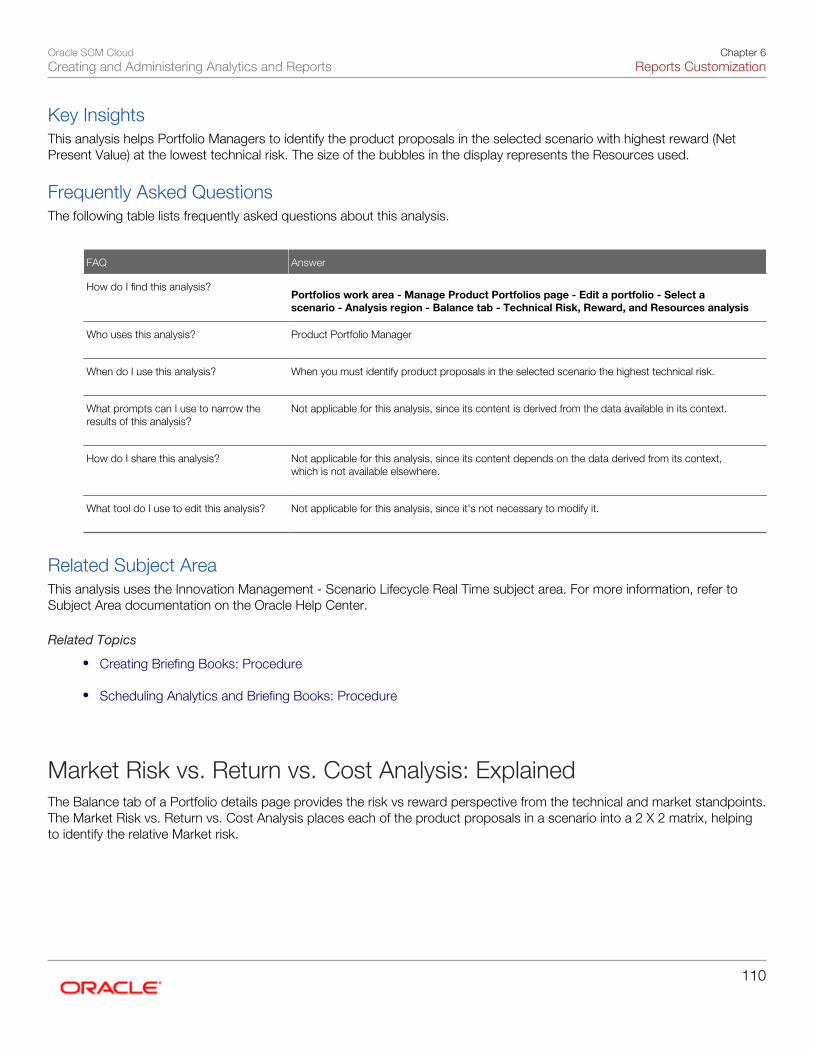
Oracle SCM CloudCreating and Administering Analytics and Reports
Chapter 6Reports Customization
110
Key InsightsThis analysis helps Portfolio Managers to identify the product proposals in the selected scenario with highest reward (NetPresent Value) at the lowest technical risk. The size of the bubbles in the display represents the Resources used.
Frequently Asked QuestionsThe following table lists frequently asked questions about this analysis.
FAQ Answer
How do I find this analysis? Portfolios work area - Manage Product Portfolios page - Edit a portfolio - Select a
scenario - Analysis region - Balance tab - Technical Risk, Reward, and Resources analysis
Who uses this analysis?
Product Portfolio Manager
When do I use this analysis?
When you must identify product proposals in the selected scenario the highest technical risk.
What prompts can I use to narrow theresults of this analysis?
Not applicable for this analysis, since its content is derived from the data available in its context.
How do I share this analysis?
Not applicable for this analysis, since its content depends on the data derived from its context,which is not available elsewhere.
What tool do I use to edit this analysis?
Not applicable for this analysis, since it's not necessary to modify it.
Related Subject AreaThis analysis uses the Innovation Management - Scenario Lifecycle Real Time subject area. For more information, refer toSubject Area documentation on the Oracle Help Center.
Related Topics
• Creating Briefing Books: Procedure
• Scheduling Analytics and Briefing Books: Procedure
Market Risk vs. Return vs. Cost Analysis: ExplainedThe Balance tab of a Portfolio details page provides the risk vs reward perspective from the technical and market standpoints.The Market Risk vs. Return vs. Cost Analysis places each of the product proposals in a scenario into a 2 X 2 matrix, helpingto identify the relative Market risk.
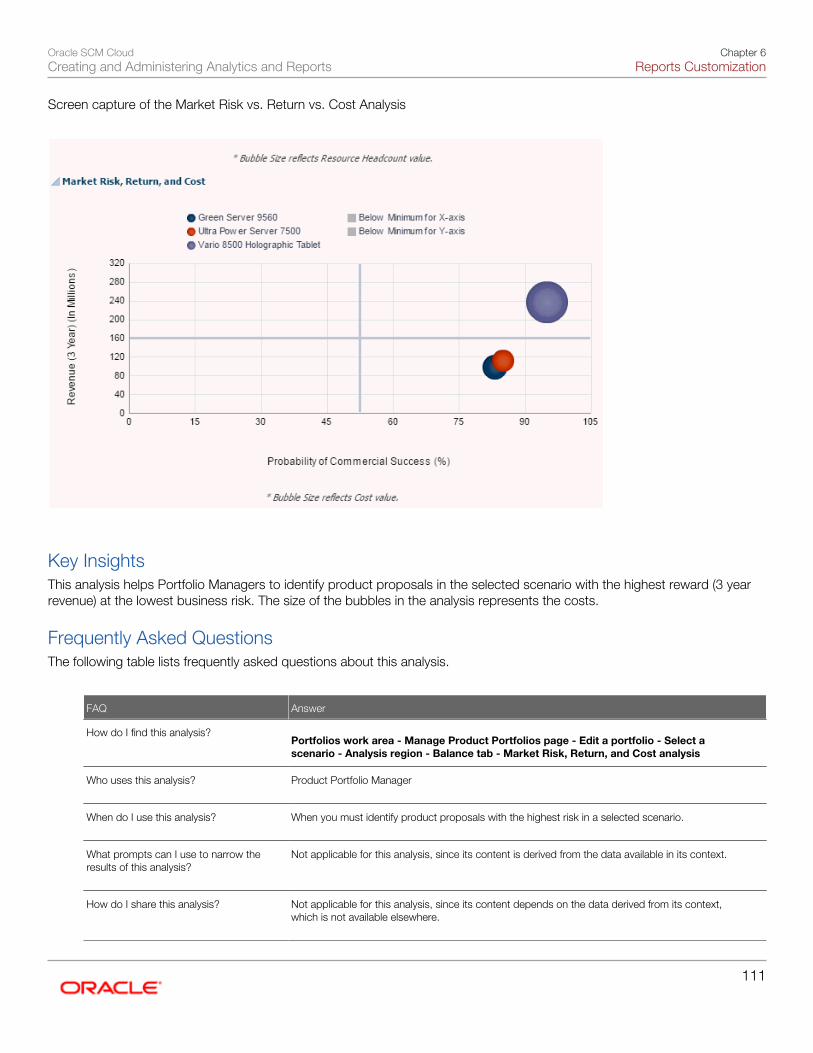
Oracle SCM CloudCreating and Administering Analytics and Reports
Chapter 6Reports Customization
111
Screen capture of the Market Risk vs. Return vs. Cost Analysis
Key InsightsThis analysis helps Portfolio Managers to identify product proposals in the selected scenario with the highest reward (3 yearrevenue) at the lowest business risk. The size of the bubbles in the analysis represents the costs.
Frequently Asked QuestionsThe following table lists frequently asked questions about this analysis.
FAQ Answer
How do I find this analysis? Portfolios work area - Manage Product Portfolios page - Edit a portfolio - Select a
scenario - Analysis region - Balance tab - Market Risk, Return, and Cost analysis
Who uses this analysis?
Product Portfolio Manager
When do I use this analysis?
When you must identify product proposals with the highest risk in a selected scenario.
What prompts can I use to narrow theresults of this analysis?
Not applicable for this analysis, since its content is derived from the data available in its context.
How do I share this analysis?
Not applicable for this analysis, since its content depends on the data derived from its context,which is not available elsewhere.
Oracle SCM CloudCreating and Administering Analytics and Reports
Chapter 6Reports Customization
112
FAQ Answer
What tool do I use to edit this analysis?
Not applicable for this analysis, since it's not necessary to modify it.
Related Subject AreaThis analysis uses the Innovation Management - Scenario Lifecycle Real Time subject area. For more information, refer toSubject Area documentation on the Oracle Help Center.
Related Topics
• Creating Briefing Books: Procedure
• Scheduling Analytics and Briefing Books: Procedure
Strategic Fit Analysis: ExplainedThe Strategic Fit Analysis displays the strategic fit for the selected proposals in a scenario.
Screen capture of the Strategic Fit Analysis.
Key InsightsThis analysis helps identify the best-fit product proposals in the scenario, based on strategic objectives such as alignment,impact, supply chain fit, R&D know-how and competitive advantage.
Oracle SCM CloudCreating and Administering Analytics and Reports
Chapter 6Reports Customization
113
Frequently Asked QuestionsThe following table lists frequently asked questions about this analysis.
FAQ Answer
How do I find this analysis? Portfolios work area - Manage Product Portfolios page - Edit a portfolio - Select a
scenario - Analysis region - Strategy tab - Strategic Fit analysis
Who uses this analysis?
Product Portfolio Manager
When do I use this analysis?
When you must identify the best-fit product proposals in a scenario.
What prompts can I use to narrow theresults of this analysis?
Not applicable for this analysis, since its content is derived from the data available in its context.
How do I share this analysis?
Not applicable for this analysis, since its content depends on the data derived from its context,which is not available elsewhere.
What tool do I use to edit this analysis?
Not applicable for this analysis, since it's not necessary to modify it.
Related Subject AreaThis analysis uses the Innovation Management- Scenario Lifecycle Real Time subject area. For more information, refer toSubject Area documentation on the Oracle Help Center.
Related Topics
• Creating Briefing Books: Procedure
• Scheduling Analytics and Briefing Books: Procedure
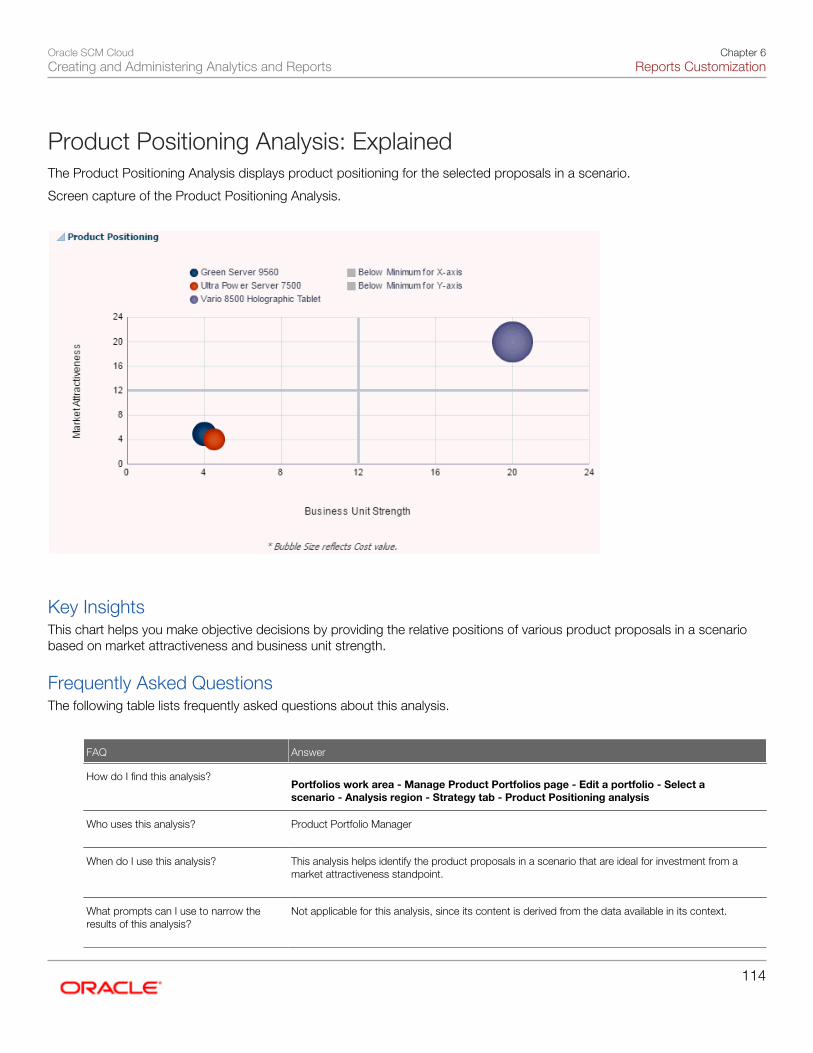
Oracle SCM CloudCreating and Administering Analytics and Reports
Chapter 6Reports Customization
114
Product Positioning Analysis: ExplainedThe Product Positioning Analysis displays product positioning for the selected proposals in a scenario.
Screen capture of the Product Positioning Analysis.
Key InsightsThis chart helps you make objective decisions by providing the relative positions of various product proposals in a scenariobased on market attractiveness and business unit strength.
Frequently Asked QuestionsThe following table lists frequently asked questions about this analysis.
FAQ Answer
How do I find this analysis? Portfolios work area - Manage Product Portfolios page - Edit a portfolio - Select a
scenario - Analysis region - Strategy tab - Product Positioning analysis
Who uses this analysis?
Product Portfolio Manager
When do I use this analysis?
This analysis helps identify the product proposals in a scenario that are ideal for investment from amarket attractiveness standpoint.
What prompts can I use to narrow theresults of this analysis?
Not applicable for this analysis, since its content is derived from the data available in its context.
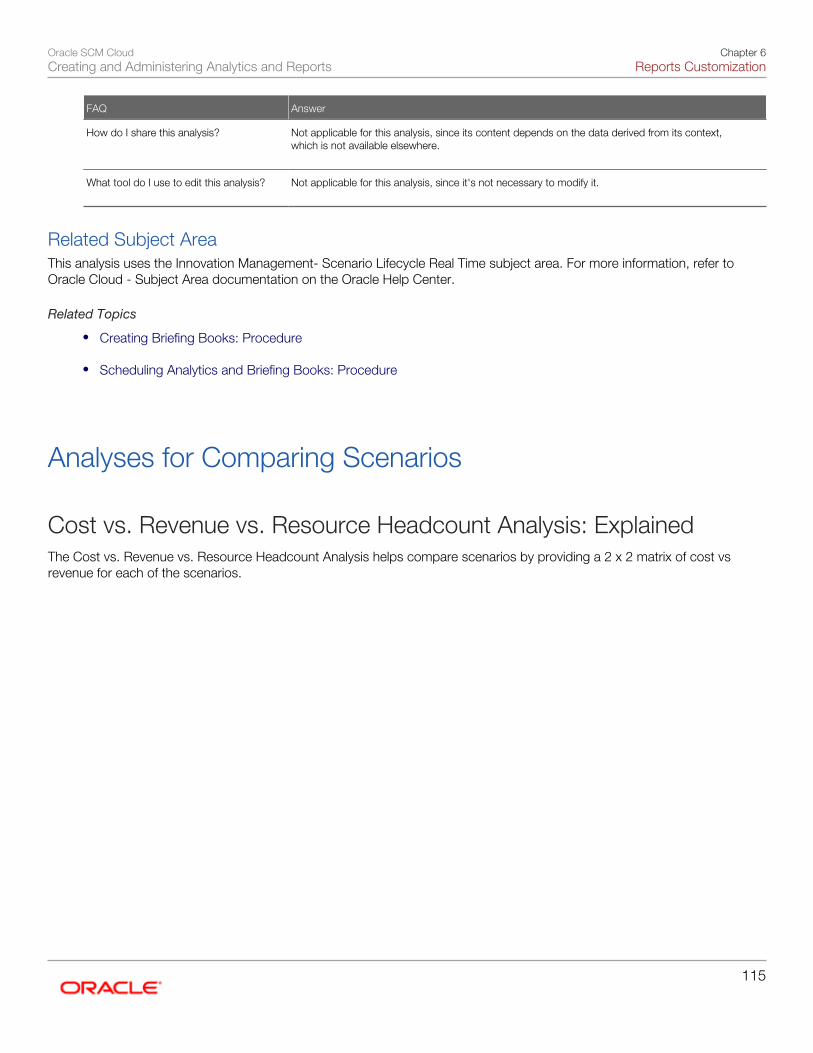
Oracle SCM CloudCreating and Administering Analytics and Reports
Chapter 6Reports Customization
115
FAQ Answer
How do I share this analysis?
Not applicable for this analysis, since its content depends on the data derived from its context,which is not available elsewhere.
What tool do I use to edit this analysis?
Not applicable for this analysis, since it's not necessary to modify it.
Related Subject AreaThis analysis uses the Innovation Management- Scenario Lifecycle Real Time subject area. For more information, refer toOracle Cloud - Subject Area documentation on the Oracle Help Center.
Related Topics
• Creating Briefing Books: Procedure
• Scheduling Analytics and Briefing Books: Procedure
Analyses for Comparing Scenarios
Cost vs. Revenue vs. Resource Headcount Analysis: ExplainedThe Cost vs. Revenue vs. Resource Headcount Analysis helps compare scenarios by providing a 2 x 2 matrix of cost vsrevenue for each of the scenarios.
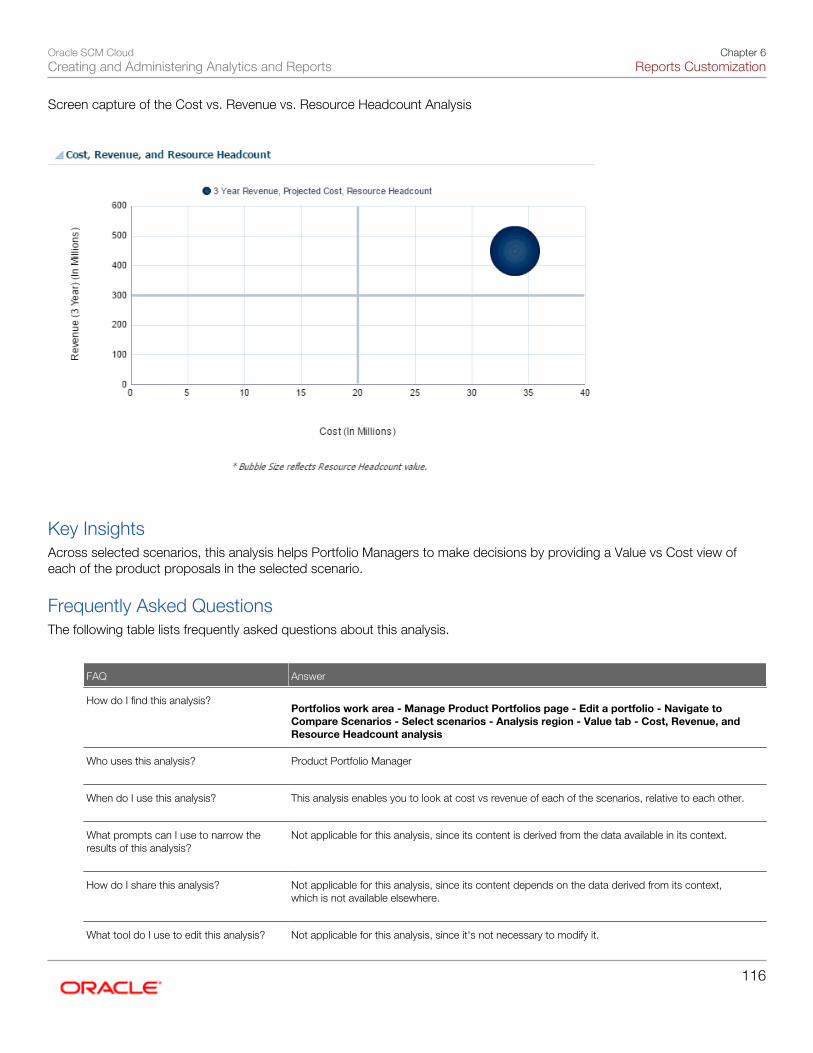
Oracle SCM CloudCreating and Administering Analytics and Reports
Chapter 6Reports Customization
116
Screen capture of the Cost vs. Revenue vs. Resource Headcount Analysis
Key InsightsAcross selected scenarios, this analysis helps Portfolio Managers to make decisions by providing a Value vs Cost view ofeach of the product proposals in the selected scenario.
Frequently Asked QuestionsThe following table lists frequently asked questions about this analysis.
FAQ Answer
How do I find this analysis? Portfolios work area - Manage Product Portfolios page - Edit a portfolio - Navigate to
Compare Scenarios - Select scenarios - Analysis region - Value tab - Cost, Revenue, andResource Headcount analysis
Who uses this analysis?
Product Portfolio Manager
When do I use this analysis?
This analysis enables you to look at cost vs revenue of each of the scenarios, relative to each other.
What prompts can I use to narrow theresults of this analysis?
Not applicable for this analysis, since its content is derived from the data available in its context.
How do I share this analysis?
Not applicable for this analysis, since its content depends on the data derived from its context,which is not available elsewhere.
What tool do I use to edit this analysis? Not applicable for this analysis, since it's not necessary to modify it.
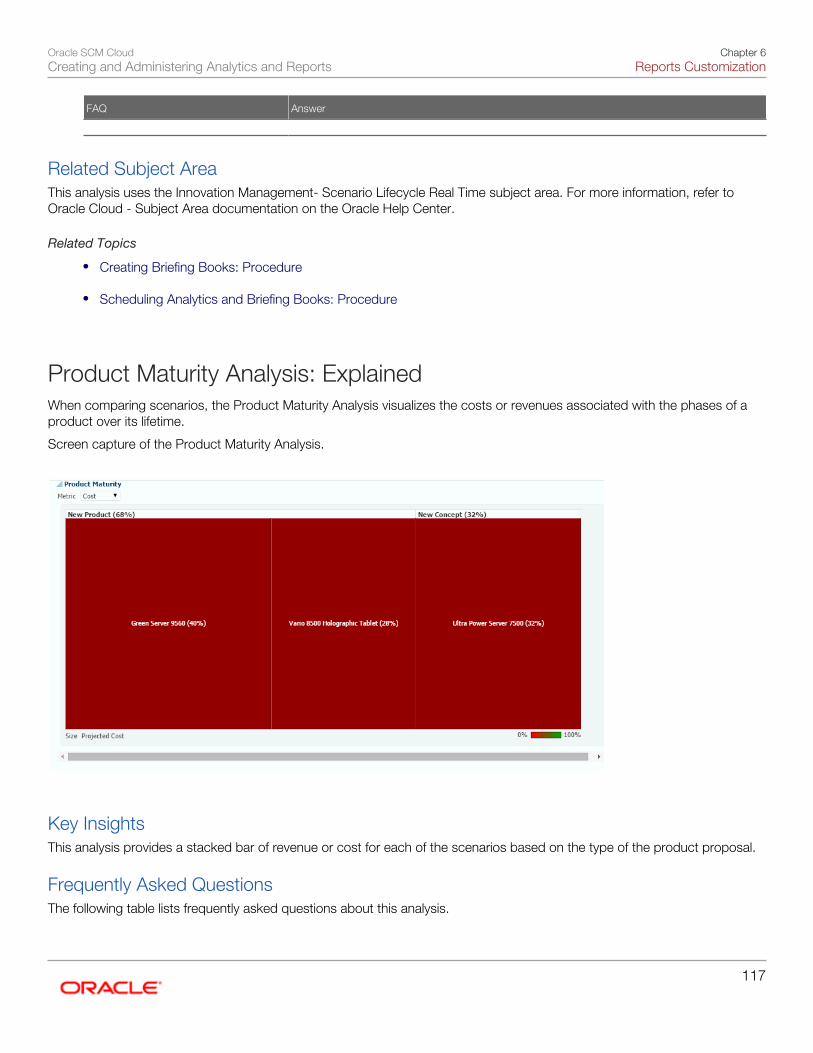
Oracle SCM CloudCreating and Administering Analytics and Reports
Chapter 6Reports Customization
117
FAQ Answer
Related Subject AreaThis analysis uses the Innovation Management- Scenario Lifecycle Real Time subject area. For more information, refer toOracle Cloud - Subject Area documentation on the Oracle Help Center.
Related Topics
• Creating Briefing Books: Procedure
• Scheduling Analytics and Briefing Books: Procedure
Product Maturity Analysis: ExplainedWhen comparing scenarios, the Product Maturity Analysis visualizes the costs or revenues associated with the phases of aproduct over its lifetime.
Screen capture of the Product Maturity Analysis.
Key InsightsThis analysis provides a stacked bar of revenue or cost for each of the scenarios based on the type of the product proposal.
Frequently Asked QuestionsThe following table lists frequently asked questions about this analysis.
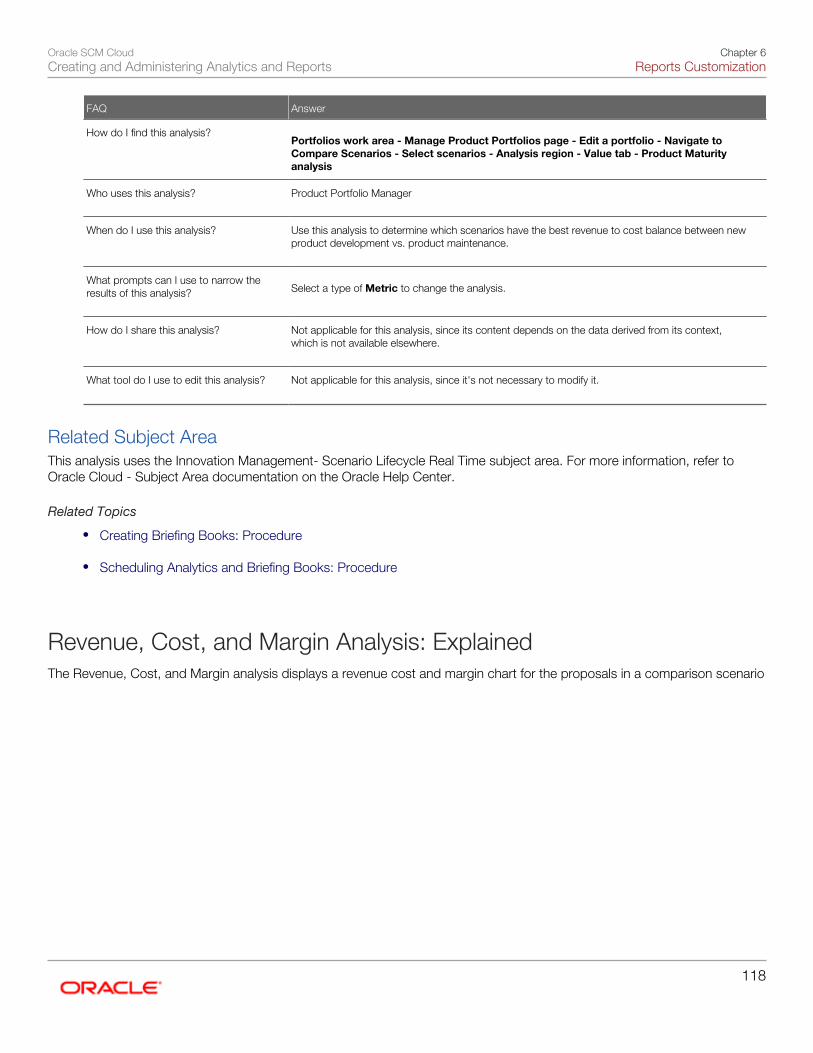
Oracle SCM CloudCreating and Administering Analytics and Reports
Chapter 6Reports Customization
118
FAQ Answer
How do I find this analysis? Portfolios work area - Manage Product Portfolios page - Edit a portfolio - Navigate to
Compare Scenarios - Select scenarios - Analysis region - Value tab - Product Maturityanalysis
Who uses this analysis?
Product Portfolio Manager
When do I use this analysis?
Use this analysis to determine which scenarios have the best revenue to cost balance between newproduct development vs. product maintenance.
What prompts can I use to narrow theresults of this analysis?
Select a type of Metric to change the analysis.
How do I share this analysis?
Not applicable for this analysis, since its content depends on the data derived from its context,which is not available elsewhere.
What tool do I use to edit this analysis?
Not applicable for this analysis, since it's not necessary to modify it.
Related Subject AreaThis analysis uses the Innovation Management- Scenario Lifecycle Real Time subject area. For more information, refer toOracle Cloud - Subject Area documentation on the Oracle Help Center.
Related Topics
• Creating Briefing Books: Procedure
• Scheduling Analytics and Briefing Books: Procedure
Revenue, Cost, and Margin Analysis: ExplainedThe Revenue, Cost, and Margin analysis displays a revenue cost and margin chart for the proposals in a comparison scenario
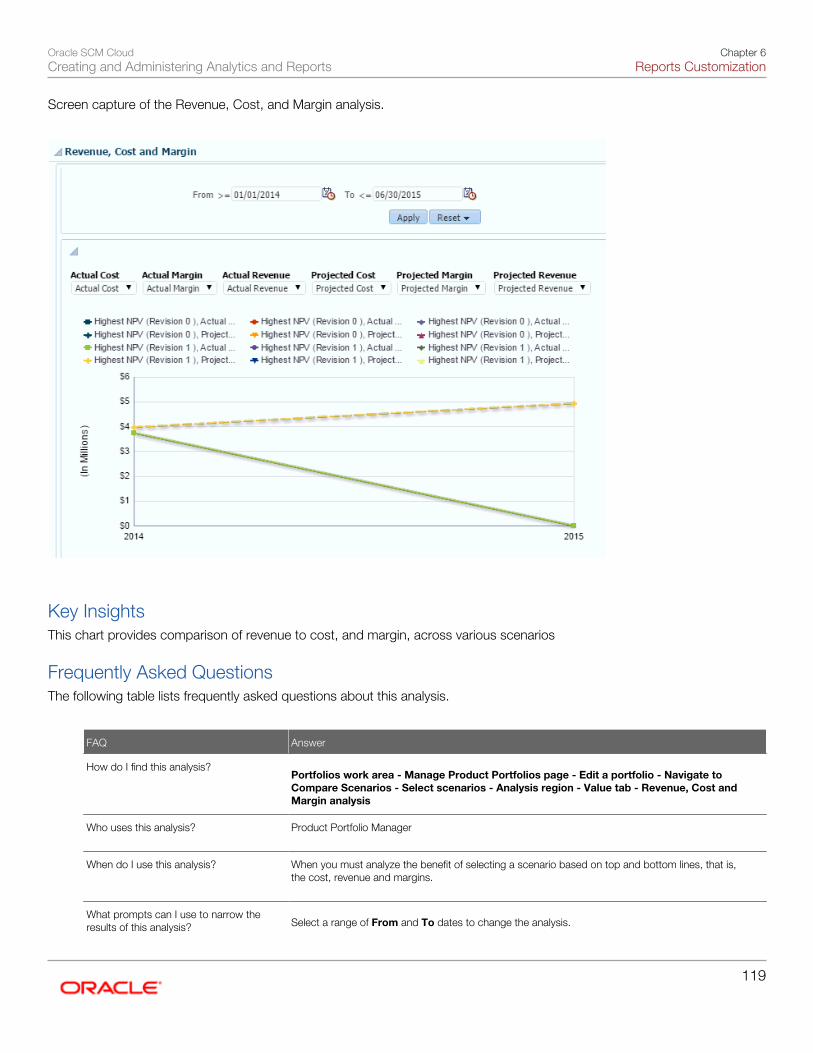
Oracle SCM CloudCreating and Administering Analytics and Reports
Chapter 6Reports Customization
119
Screen capture of the Revenue, Cost, and Margin analysis.
Key InsightsThis chart provides comparison of revenue to cost, and margin, across various scenarios
Frequently Asked QuestionsThe following table lists frequently asked questions about this analysis.
FAQ Answer
How do I find this analysis? Portfolios work area - Manage Product Portfolios page - Edit a portfolio - Navigate to
Compare Scenarios - Select scenarios - Analysis region - Value tab - Revenue, Cost andMargin analysis
Who uses this analysis?
Product Portfolio Manager
When do I use this analysis?
When you must analyze the benefit of selecting a scenario based on top and bottom lines, that is,the cost, revenue and margins.
What prompts can I use to narrow theresults of this analysis? Select a range of From and To dates to change the analysis.
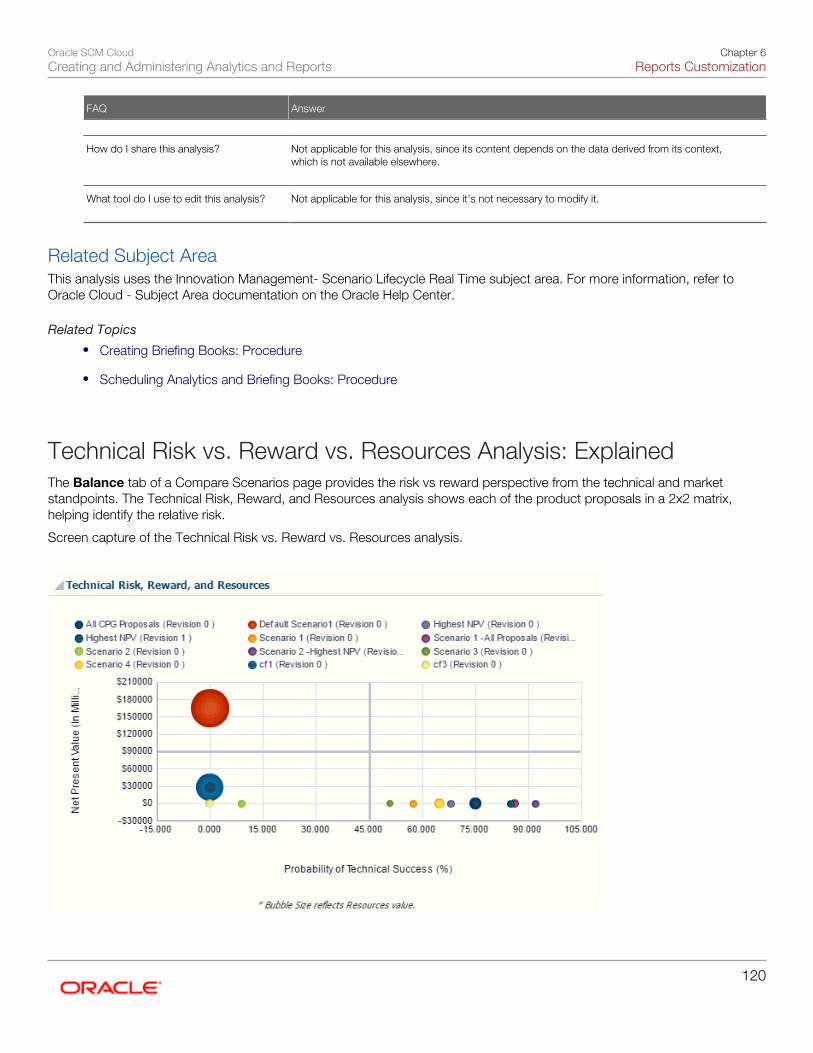
Oracle SCM CloudCreating and Administering Analytics and Reports
Chapter 6Reports Customization
120
FAQ Answer
How do I share this analysis?
Not applicable for this analysis, since its content depends on the data derived from its context,which is not available elsewhere.
What tool do I use to edit this analysis?
Not applicable for this analysis, since it's not necessary to modify it.
Related Subject AreaThis analysis uses the Innovation Management- Scenario Lifecycle Real Time subject area. For more information, refer toOracle Cloud - Subject Area documentation on the Oracle Help Center.
Related Topics
• Creating Briefing Books: Procedure
• Scheduling Analytics and Briefing Books: Procedure
Technical Risk vs. Reward vs. Resources Analysis: ExplainedThe Balance tab of a Compare Scenarios page provides the risk vs reward perspective from the technical and marketstandpoints. The Technical Risk, Reward, and Resources analysis shows each of the product proposals in a 2x2 matrix,helping identify the relative risk.
Screen capture of the Technical Risk vs. Reward vs. Resources analysis.
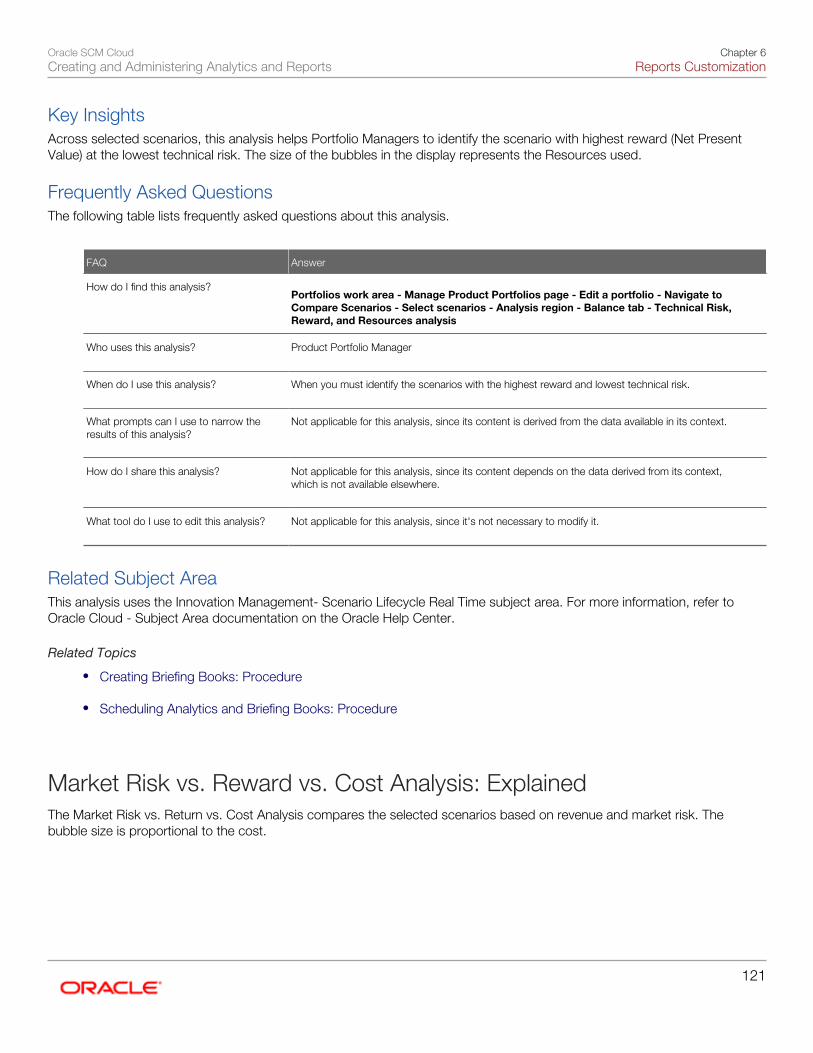
Oracle SCM CloudCreating and Administering Analytics and Reports
Chapter 6Reports Customization
121
Key InsightsAcross selected scenarios, this analysis helps Portfolio Managers to identify the scenario with highest reward (Net PresentValue) at the lowest technical risk. The size of the bubbles in the display represents the Resources used.
Frequently Asked QuestionsThe following table lists frequently asked questions about this analysis.
FAQ Answer
How do I find this analysis? Portfolios work area - Manage Product Portfolios page - Edit a portfolio - Navigate to
Compare Scenarios - Select scenarios - Analysis region - Balance tab - Technical Risk,Reward, and Resources analysis
Who uses this analysis?
Product Portfolio Manager
When do I use this analysis?
When you must identify the scenarios with the highest reward and lowest technical risk.
What prompts can I use to narrow theresults of this analysis?
Not applicable for this analysis, since its content is derived from the data available in its context.
How do I share this analysis?
Not applicable for this analysis, since its content depends on the data derived from its context,which is not available elsewhere.
What tool do I use to edit this analysis?
Not applicable for this analysis, since it's not necessary to modify it.
Related Subject AreaThis analysis uses the Innovation Management- Scenario Lifecycle Real Time subject area. For more information, refer toOracle Cloud - Subject Area documentation on the Oracle Help Center.
Related Topics
• Creating Briefing Books: Procedure
• Scheduling Analytics and Briefing Books: Procedure
Market Risk vs. Reward vs. Cost Analysis: ExplainedThe Market Risk vs. Return vs. Cost Analysis compares the selected scenarios based on revenue and market risk. Thebubble size is proportional to the cost.
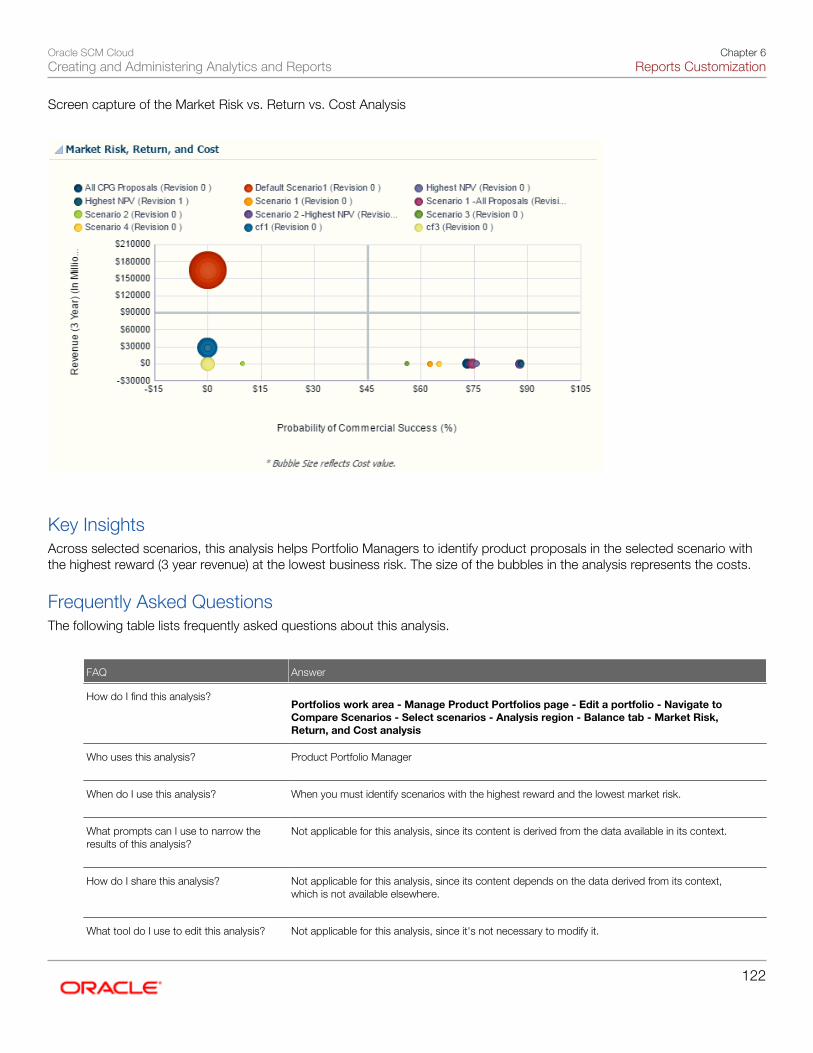
Oracle SCM CloudCreating and Administering Analytics and Reports
Chapter 6Reports Customization
122
Screen capture of the Market Risk vs. Return vs. Cost Analysis
Key InsightsAcross selected scenarios, this analysis helps Portfolio Managers to identify product proposals in the selected scenario withthe highest reward (3 year revenue) at the lowest business risk. The size of the bubbles in the analysis represents the costs.
Frequently Asked QuestionsThe following table lists frequently asked questions about this analysis.
FAQ Answer
How do I find this analysis? Portfolios work area - Manage Product Portfolios page - Edit a portfolio - Navigate to
Compare Scenarios - Select scenarios - Analysis region - Balance tab - Market Risk,Return, and Cost analysis
Who uses this analysis?
Product Portfolio Manager
When do I use this analysis?
When you must identify scenarios with the highest reward and the lowest market risk.
What prompts can I use to narrow theresults of this analysis?
Not applicable for this analysis, since its content is derived from the data available in its context.
How do I share this analysis?
Not applicable for this analysis, since its content depends on the data derived from its context,which is not available elsewhere.
What tool do I use to edit this analysis? Not applicable for this analysis, since it's not necessary to modify it.
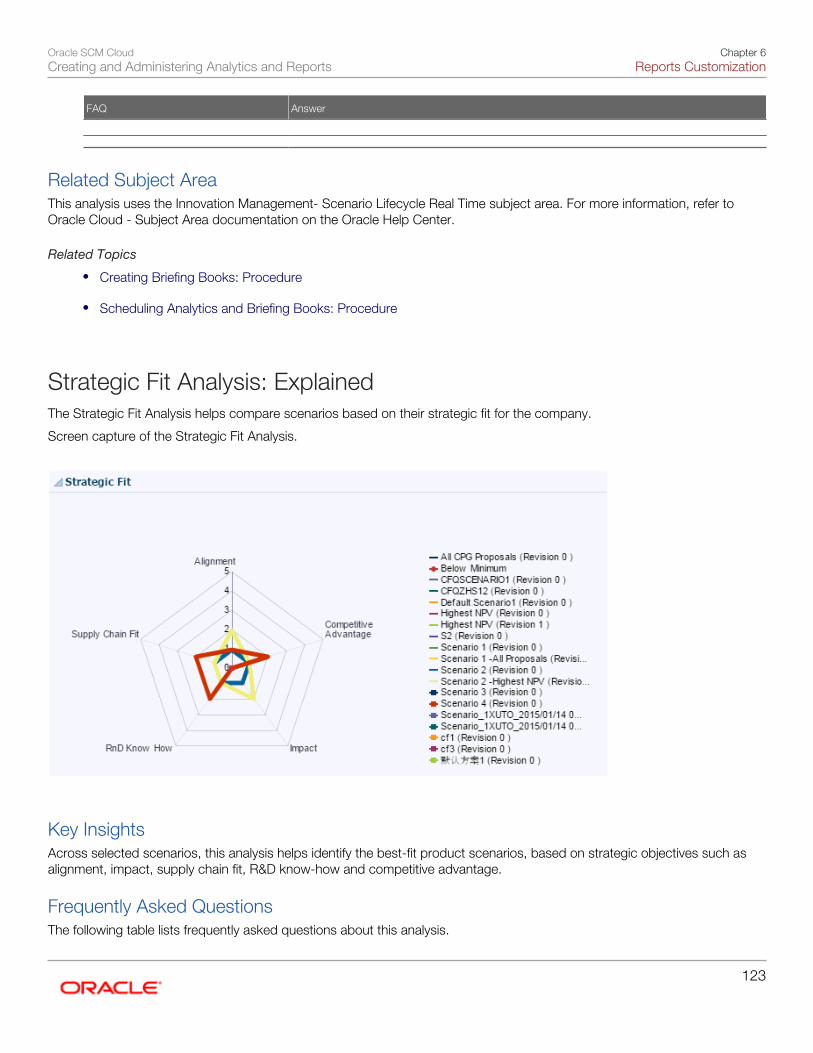
Oracle SCM CloudCreating and Administering Analytics and Reports
Chapter 6Reports Customization
123
FAQ Answer
Related Subject AreaThis analysis uses the Innovation Management- Scenario Lifecycle Real Time subject area. For more information, refer toOracle Cloud - Subject Area documentation on the Oracle Help Center.
Related Topics
• Creating Briefing Books: Procedure
• Scheduling Analytics and Briefing Books: Procedure
Strategic Fit Analysis: ExplainedThe Strategic Fit Analysis helps compare scenarios based on their strategic fit for the company.
Screen capture of the Strategic Fit Analysis.
Key InsightsAcross selected scenarios, this analysis helps identify the best-fit product scenarios, based on strategic objectives such asalignment, impact, supply chain fit, R&D know-how and competitive advantage.
Frequently Asked QuestionsThe following table lists frequently asked questions about this analysis.
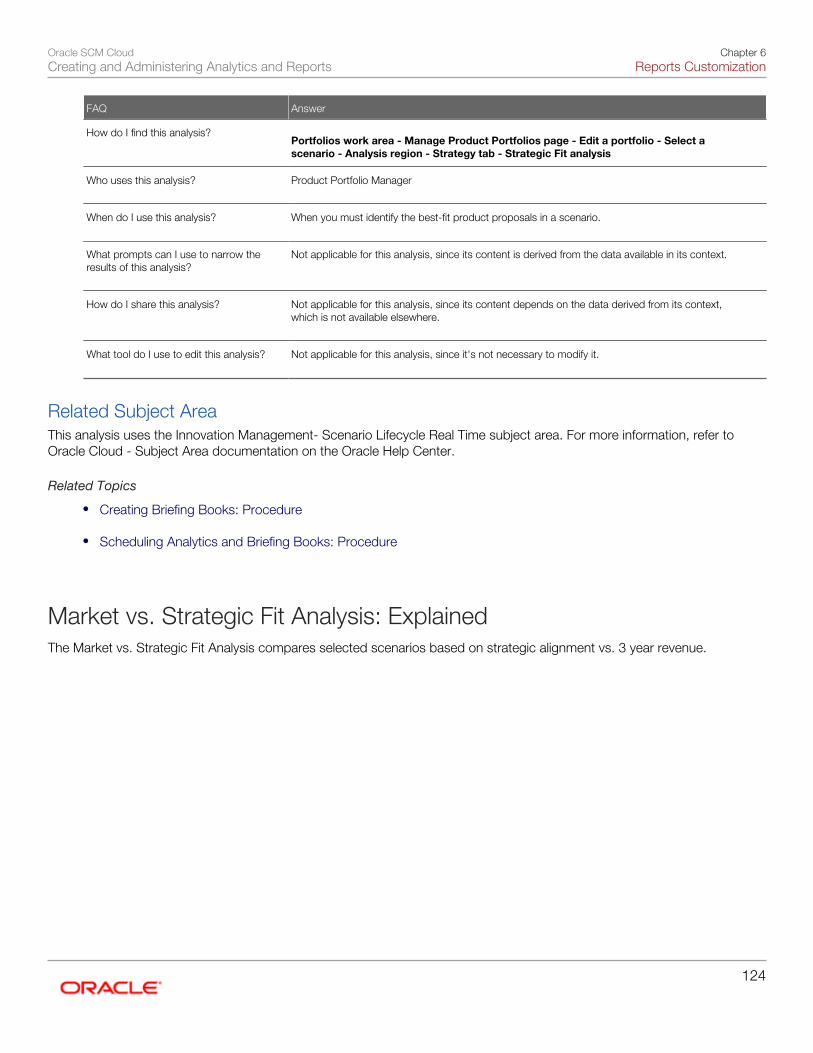
Oracle SCM CloudCreating and Administering Analytics and Reports
Chapter 6Reports Customization
124
FAQ Answer
How do I find this analysis? Portfolios work area - Manage Product Portfolios page - Edit a portfolio - Select a
scenario - Analysis region - Strategy tab - Strategic Fit analysis
Who uses this analysis?
Product Portfolio Manager
When do I use this analysis?
When you must identify the best-fit product proposals in a scenario.
What prompts can I use to narrow theresults of this analysis?
Not applicable for this analysis, since its content is derived from the data available in its context.
How do I share this analysis?
Not applicable for this analysis, since its content depends on the data derived from its context,which is not available elsewhere.
What tool do I use to edit this analysis?
Not applicable for this analysis, since it's not necessary to modify it.
Related Subject AreaThis analysis uses the Innovation Management- Scenario Lifecycle Real Time subject area. For more information, refer toOracle Cloud - Subject Area documentation on the Oracle Help Center.
Related Topics
• Creating Briefing Books: Procedure
• Scheduling Analytics and Briefing Books: Procedure
Market vs. Strategic Fit Analysis: ExplainedThe Market vs. Strategic Fit Analysis compares selected scenarios based on strategic alignment vs. 3 year revenue.
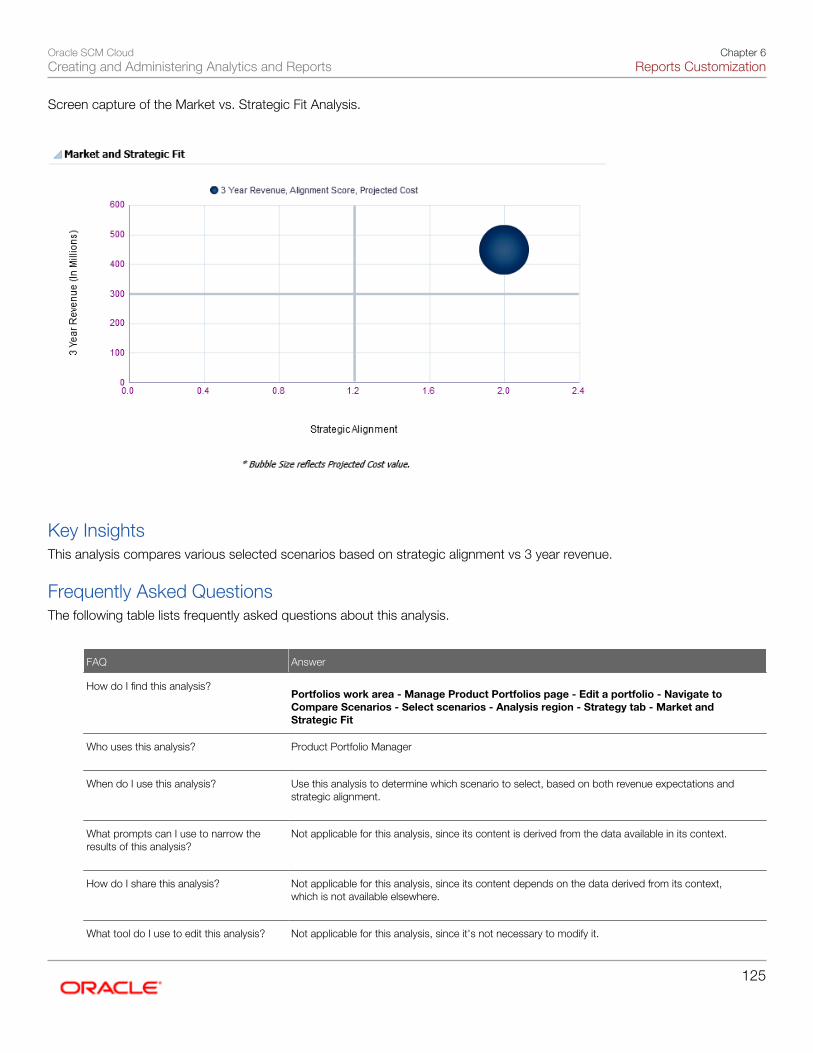
Oracle SCM CloudCreating and Administering Analytics and Reports
Chapter 6Reports Customization
125
Screen capture of the Market vs. Strategic Fit Analysis.
Key InsightsThis analysis compares various selected scenarios based on strategic alignment vs 3 year revenue.
Frequently Asked QuestionsThe following table lists frequently asked questions about this analysis.
FAQ Answer
How do I find this analysis? Portfolios work area - Manage Product Portfolios page - Edit a portfolio - Navigate to
Compare Scenarios - Select scenarios - Analysis region - Strategy tab - Market andStrategic Fit
Who uses this analysis?
Product Portfolio Manager
When do I use this analysis?
Use this analysis to determine which scenario to select, based on both revenue expectations andstrategic alignment.
What prompts can I use to narrow theresults of this analysis?
Not applicable for this analysis, since its content is derived from the data available in its context.
How do I share this analysis?
Not applicable for this analysis, since its content depends on the data derived from its context,which is not available elsewhere.
What tool do I use to edit this analysis? Not applicable for this analysis, since it's not necessary to modify it.
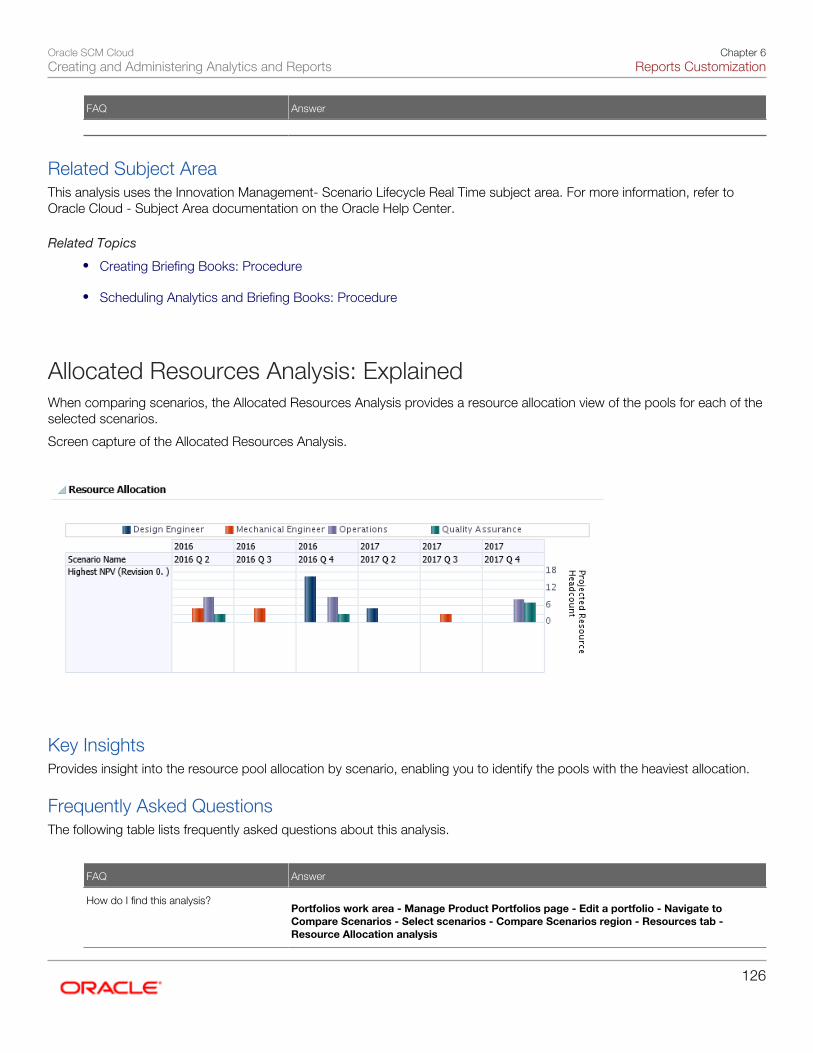
Oracle SCM CloudCreating and Administering Analytics and Reports
Chapter 6Reports Customization
126
FAQ Answer
Related Subject AreaThis analysis uses the Innovation Management- Scenario Lifecycle Real Time subject area. For more information, refer toOracle Cloud - Subject Area documentation on the Oracle Help Center.
Related Topics
• Creating Briefing Books: Procedure
• Scheduling Analytics and Briefing Books: Procedure
Allocated Resources Analysis: ExplainedWhen comparing scenarios, the Allocated Resources Analysis provides a resource allocation view of the pools for each of theselected scenarios.
Screen capture of the Allocated Resources Analysis.
Key InsightsProvides insight into the resource pool allocation by scenario, enabling you to identify the pools with the heaviest allocation.
Frequently Asked QuestionsThe following table lists frequently asked questions about this analysis.
FAQ Answer
How do I find this analysis? Portfolios work area - Manage Product Portfolios page - Edit a portfolio - Navigate to
Compare Scenarios - Select scenarios - Compare Scenarios region - Resources tab -Resource Allocation analysis
Oracle SCM CloudCreating and Administering Analytics and Reports
Chapter 6Reports Customization
127
FAQ Answer
Who uses this analysis?
Product Portfolio Manager
When do I use this analysis?
When you must determine the scenarios that are the best fit, based on their resource pool needs
What prompts can I use to narrow theresults of this analysis?
Not applicable for this analysis, since its content is derived from the data available in its context.
How do I share this analysis?
Not applicable for this analysis, since its content depends on the data derived from its context,which is not available elsewhere.
What tool do I use to edit this analysis?
Not applicable for this analysis, since it's not necessary to modify it.
Related Subject AreaThis analysis uses the Innovation Management- Scenario Lifecycle Real Time subject area. For more information, refer toOracle Cloud - Subject Area documentation on the Oracle Help Center.
Related Topics
• Creating Briefing Books: Procedure
• Scheduling Analytics and Briefing Books: Procedure
Projected Consumption Analysis: ExplainedWhen comparing scenarios, the Projected Consumption Analysis provides for each resource pool, the resource requirementsfor each scenario
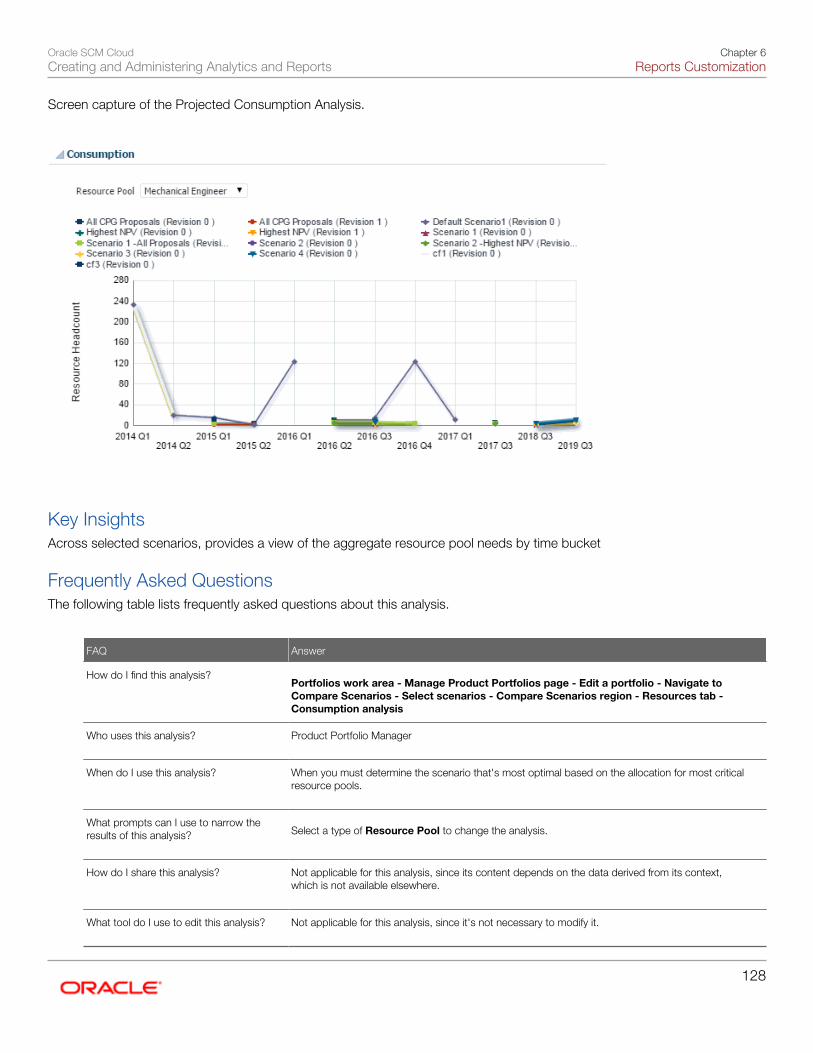
Oracle SCM CloudCreating and Administering Analytics and Reports
Chapter 6Reports Customization
128
Screen capture of the Projected Consumption Analysis.
Key InsightsAcross selected scenarios, provides a view of the aggregate resource pool needs by time bucket
Frequently Asked QuestionsThe following table lists frequently asked questions about this analysis.
FAQ Answer
How do I find this analysis? Portfolios work area - Manage Product Portfolios page - Edit a portfolio - Navigate to
Compare Scenarios - Select scenarios - Compare Scenarios region - Resources tab -Consumption analysis
Who uses this analysis?
Product Portfolio Manager
When do I use this analysis?
When you must determine the scenario that's most optimal based on the allocation for most criticalresource pools.
What prompts can I use to narrow theresults of this analysis?
Select a type of Resource Pool to change the analysis.
How do I share this analysis?
Not applicable for this analysis, since its content depends on the data derived from its context,which is not available elsewhere.
What tool do I use to edit this analysis?
Not applicable for this analysis, since it's not necessary to modify it.
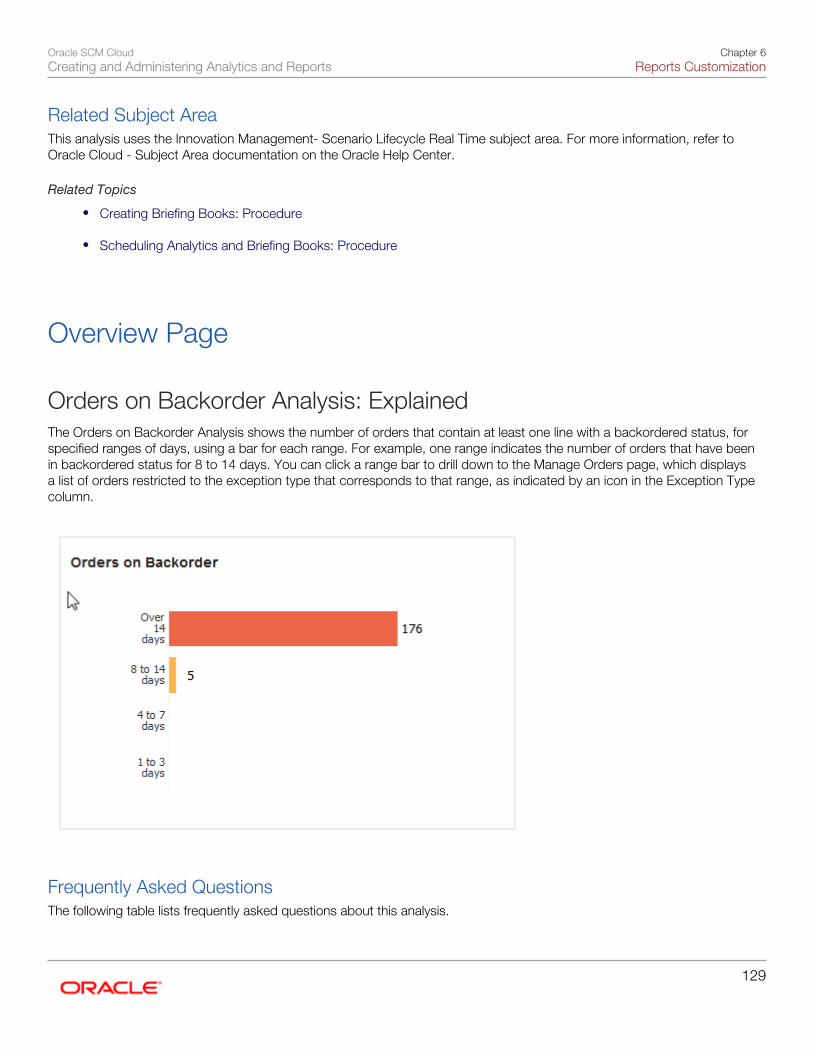
Oracle SCM CloudCreating and Administering Analytics and Reports
Chapter 6Reports Customization
129
Related Subject AreaThis analysis uses the Innovation Management- Scenario Lifecycle Real Time subject area. For more information, refer toOracle Cloud - Subject Area documentation on the Oracle Help Center.
Related Topics
• Creating Briefing Books: Procedure
• Scheduling Analytics and Briefing Books: Procedure
Overview Page
Orders on Backorder Analysis: ExplainedThe Orders on Backorder Analysis shows the number of orders that contain at least one line with a backordered status, forspecified ranges of days, using a bar for each range. For example, one range indicates the number of orders that have beenin backordered status for 8 to 14 days. You can click a range bar to drill down to the Manage Orders page, which displaysa list of orders restricted to the exception type that corresponds to that range, as indicated by an icon in the Exception Typecolumn.
Frequently Asked QuestionsThe following table lists frequently asked questions about this analysis.
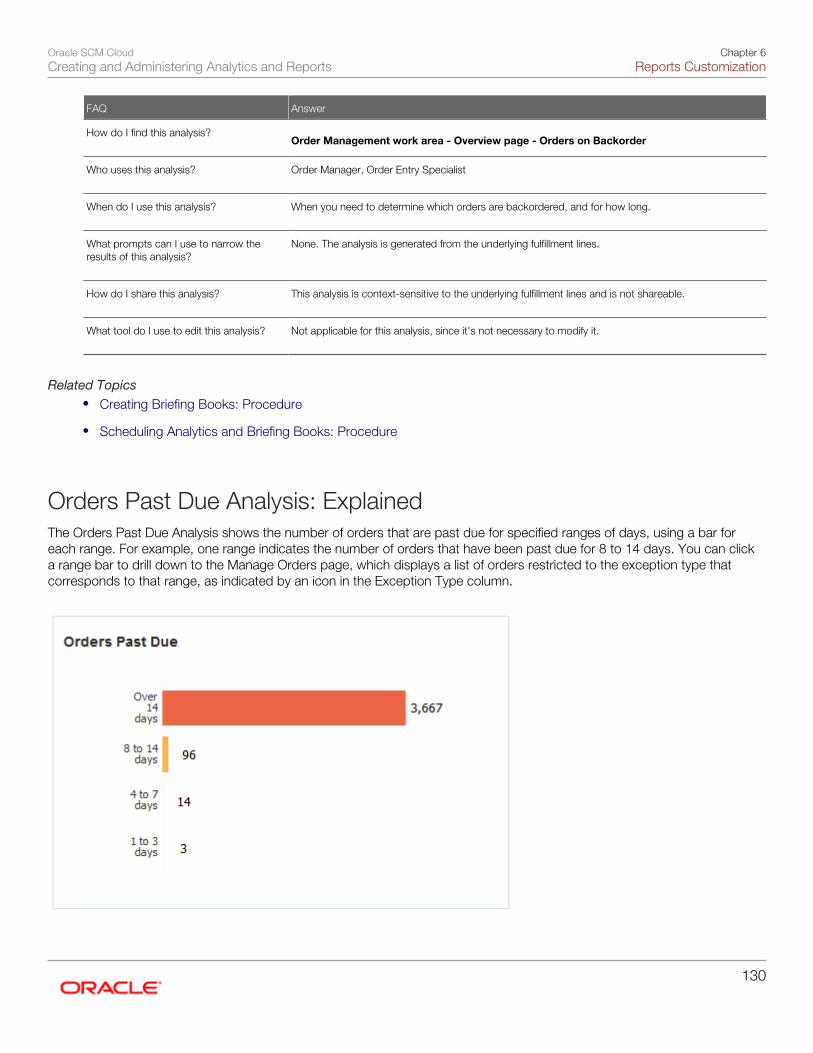
Oracle SCM CloudCreating and Administering Analytics and Reports
Chapter 6Reports Customization
130
FAQ Answer
How do I find this analysis? Order Management work area - Overview page - Orders on Backorder
Who uses this analysis?
Order Manager, Order Entry Specialist
When do I use this analysis?
When you need to determine which orders are backordered, and for how long.
What prompts can I use to narrow theresults of this analysis?
None. The analysis is generated from the underlying fulfillment lines.
How do I share this analysis?
This analysis is context-sensitive to the underlying fulfillment lines and is not shareable.
What tool do I use to edit this analysis?
Not applicable for this analysis, since it's not necessary to modify it.
Related Topics• Creating Briefing Books: Procedure
• Scheduling Analytics and Briefing Books: Procedure
Orders Past Due Analysis: ExplainedThe Orders Past Due Analysis shows the number of orders that are past due for specified ranges of days, using a bar foreach range. For example, one range indicates the number of orders that have been past due for 8 to 14 days. You can clicka range bar to drill down to the Manage Orders page, which displays a list of orders restricted to the exception type thatcorresponds to that range, as indicated by an icon in the Exception Type column.
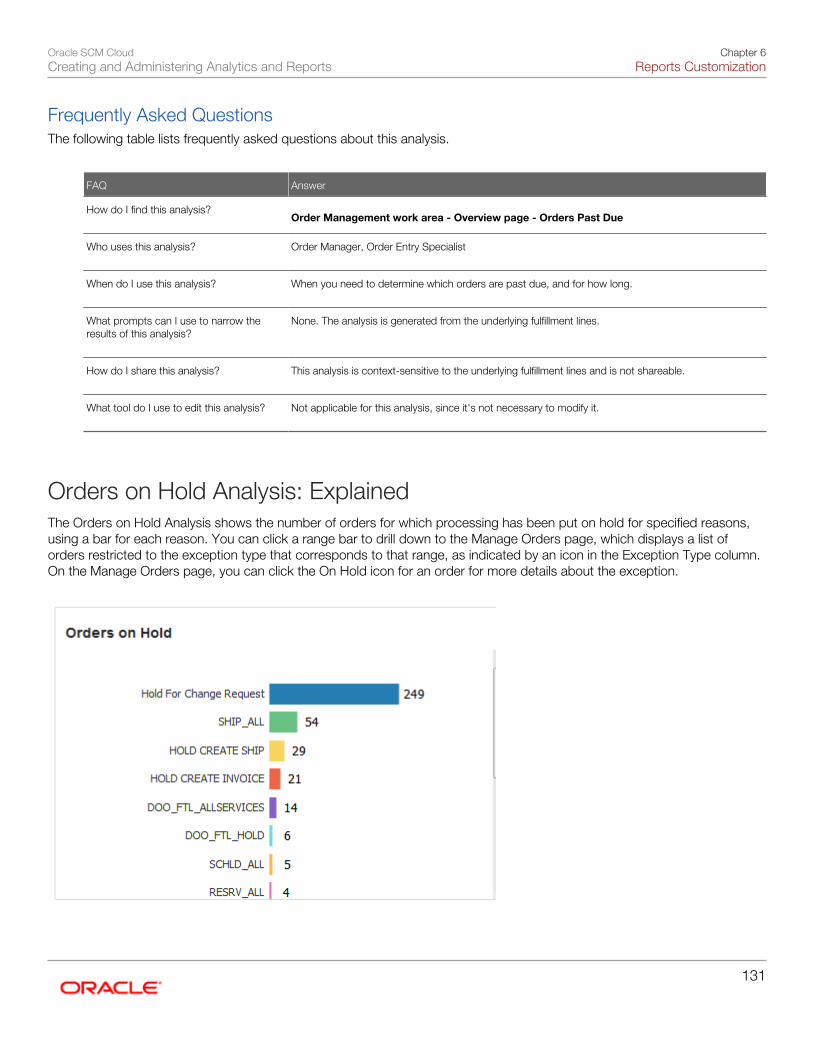
Oracle SCM CloudCreating and Administering Analytics and Reports
Chapter 6Reports Customization
131
Frequently Asked QuestionsThe following table lists frequently asked questions about this analysis.
FAQ Answer
How do I find this analysis? Order Management work area - Overview page - Orders Past Due
Who uses this analysis?
Order Manager, Order Entry Specialist
When do I use this analysis?
When you need to determine which orders are past due, and for how long.
What prompts can I use to narrow theresults of this analysis?
None. The analysis is generated from the underlying fulfillment lines.
How do I share this analysis?
This analysis is context-sensitive to the underlying fulfillment lines and is not shareable.
What tool do I use to edit this analysis?
Not applicable for this analysis, since it's not necessary to modify it.
Orders on Hold Analysis: ExplainedThe Orders on Hold Analysis shows the number of orders for which processing has been put on hold for specified reasons,using a bar for each reason. You can click a range bar to drill down to the Manage Orders page, which displays a list oforders restricted to the exception type that corresponds to that range, as indicated by an icon in the Exception Type column.On the Manage Orders page, you can click the On Hold icon for an order for more details about the exception.
Oracle SCM CloudCreating and Administering Analytics and Reports
Chapter 6Reports Customization
132
Frequently Asked QuestionsThe following table lists frequently asked questions about this analysis.
FAQ Answer
How do I find this analysis? Order Management work area - Overview page - Orders on Hold
Who uses this analysis?
Order Manager, Order Entry Specialist
When do I use this analysis?
When you need to determine which orders are on hold, and the reasons for the hold.
What prompts can I use to narrow theresults of this analysis?
None. The analysis is generated from the underlying fulfillment lines.
How do I share this analysis?
This analysis is context-sensitive to the underlying fulfillment lines and is not shareable.
What tool do I use to edit this analysis?
Not applicable for this analysis, since it's not necessary to modify it.
Related Topics
• Using Holds to Temporarily Stop Processing: Procedure
Orders in Jeopardy Analysis: ExplainedThe Orders in Jeopardy Analysis shows the number of orders that are in jeopardy, using a bar for each jeopardy prioritythat you have previously defined. For example, a range can indicate high, medium, or low jeopardy priorities. You can clicka range bar to drill down to the Manage Orders page, which displays a list of orders restricted to the exception type that
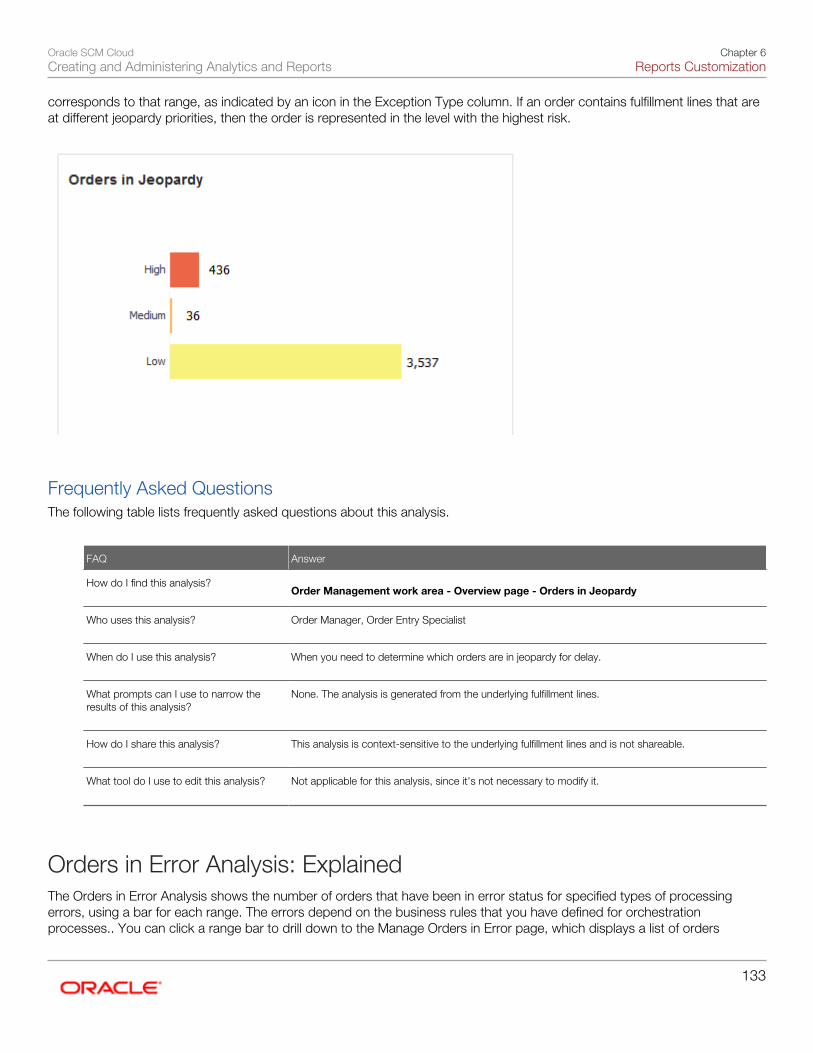
Oracle SCM CloudCreating and Administering Analytics and Reports
Chapter 6Reports Customization
133
corresponds to that range, as indicated by an icon in the Exception Type column. If an order contains fulfillment lines that areat different jeopardy priorities, then the order is represented in the level with the highest risk.
Frequently Asked QuestionsThe following table lists frequently asked questions about this analysis.
FAQ Answer
How do I find this analysis? Order Management work area - Overview page - Orders in Jeopardy
Who uses this analysis?
Order Manager, Order Entry Specialist
When do I use this analysis?
When you need to determine which orders are in jeopardy for delay.
What prompts can I use to narrow theresults of this analysis?
None. The analysis is generated from the underlying fulfillment lines.
How do I share this analysis?
This analysis is context-sensitive to the underlying fulfillment lines and is not shareable.
What tool do I use to edit this analysis?
Not applicable for this analysis, since it's not necessary to modify it.
Orders in Error Analysis: ExplainedThe Orders in Error Analysis shows the number of orders that have been in error status for specified types of processingerrors, using a bar for each range. The errors depend on the business rules that you have defined for orchestrationprocesses.. You can click a range bar to drill down to the Manage Orders in Error page, which displays a list of orders
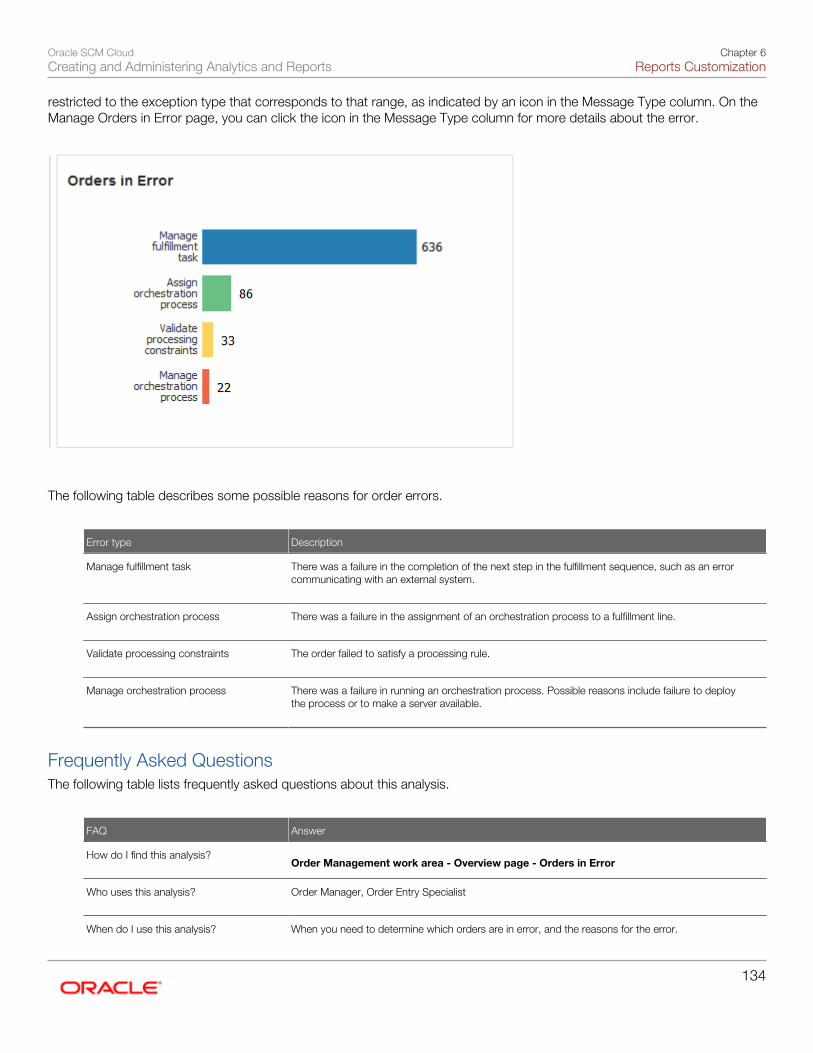
Oracle SCM CloudCreating and Administering Analytics and Reports
Chapter 6Reports Customization
134
restricted to the exception type that corresponds to that range, as indicated by an icon in the Message Type column. On theManage Orders in Error page, you can click the icon in the Message Type column for more details about the error.
The following table describes some possible reasons for order errors.
Error type Description
Manage fulfillment task
There was a failure in the completion of the next step in the fulfillment sequence, such as an errorcommunicating with an external system.
Assign orchestration process
There was a failure in the assignment of an orchestration process to a fulfillment line.
Validate processing constraints
The order failed to satisfy a processing rule.
Manage orchestration process
There was a failure in running an orchestration process. Possible reasons include failure to deploythe process or to make a server available.
Frequently Asked QuestionsThe following table lists frequently asked questions about this analysis.
FAQ Answer
How do I find this analysis? Order Management work area - Overview page - Orders in Error
Who uses this analysis?
Order Manager, Order Entry Specialist
When do I use this analysis? When you need to determine which orders are in error, and the reasons for the error.

Oracle SCM CloudCreating and Administering Analytics and Reports
Chapter 6Reports Customization
135
FAQ Answer
What prompts can I use to narrow theresults of this analysis?
None. The analysis is generated from the underlying fulfillment lines.
How do I share this analysis?
This analysis is context-sensitive to the underlying fulfillment lines and is not shareable.
What tool do I use to edit this analysis?
Not applicable for this analysis, since it's not necessary to modify it.
Fulfillment Lines in Jeopardy Analysis: ExplainedThe Fulfillment Lines in Jeopardy Analysis shows the number of fulfillment lines that are in jeopardy, using a bar for eachjeopardy priority that you have defined. For example, a range can indicate high, medium, or low jeopardy priorities. You canclick a range bar to drill down to the Manage Fulfillment Lines page, which displays a list of fulfillment lines restricted to theexception type that corresponds to that range, as indicated by an icon in the Exception Type column.
Frequently Asked QuestionsThe following table lists frequently asked questions about this analysis.
FAQ Answer
How do I find this analysis? Order Management work area - Overview page - Fulfillment Lines in Jeopardy
Who uses this analysis?
Order Manager, Order Entry Specialist
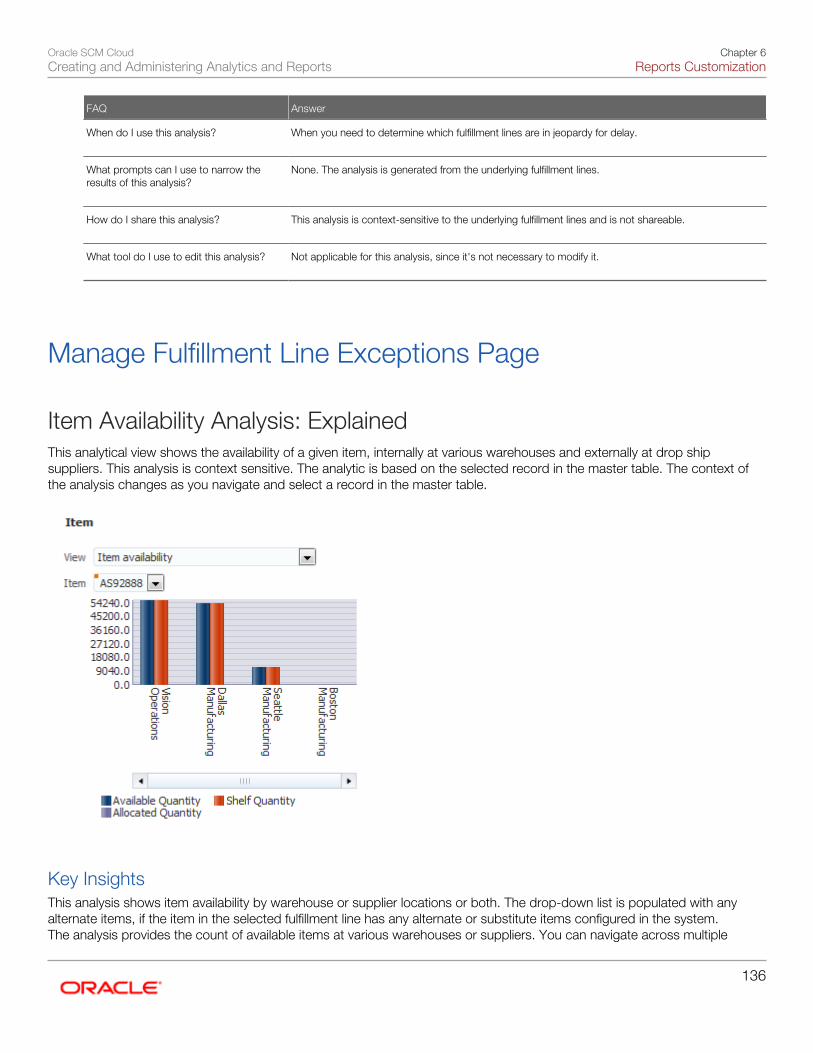
Oracle SCM CloudCreating and Administering Analytics and Reports
Chapter 6Reports Customization
136
FAQ Answer
When do I use this analysis?
When you need to determine which fulfillment lines are in jeopardy for delay.
What prompts can I use to narrow theresults of this analysis?
None. The analysis is generated from the underlying fulfillment lines.
How do I share this analysis?
This analysis is context-sensitive to the underlying fulfillment lines and is not shareable.
What tool do I use to edit this analysis?
Not applicable for this analysis, since it's not necessary to modify it.
Manage Fulfillment Line Exceptions Page
Item Availability Analysis: ExplainedThis analytical view shows the availability of a given item, internally at various warehouses and externally at drop shipsuppliers. This analysis is context sensitive. The analytic is based on the selected record in the master table. The context ofthe analysis changes as you navigate and select a record in the master table.
Key InsightsThis analysis shows item availability by warehouse or supplier locations or both. The drop-down list is populated with anyalternate items, if the item in the selected fulfillment line has any alternate or substitute items configured in the system.The analysis provides the count of available items at various warehouses or suppliers. You can navigate across multiple
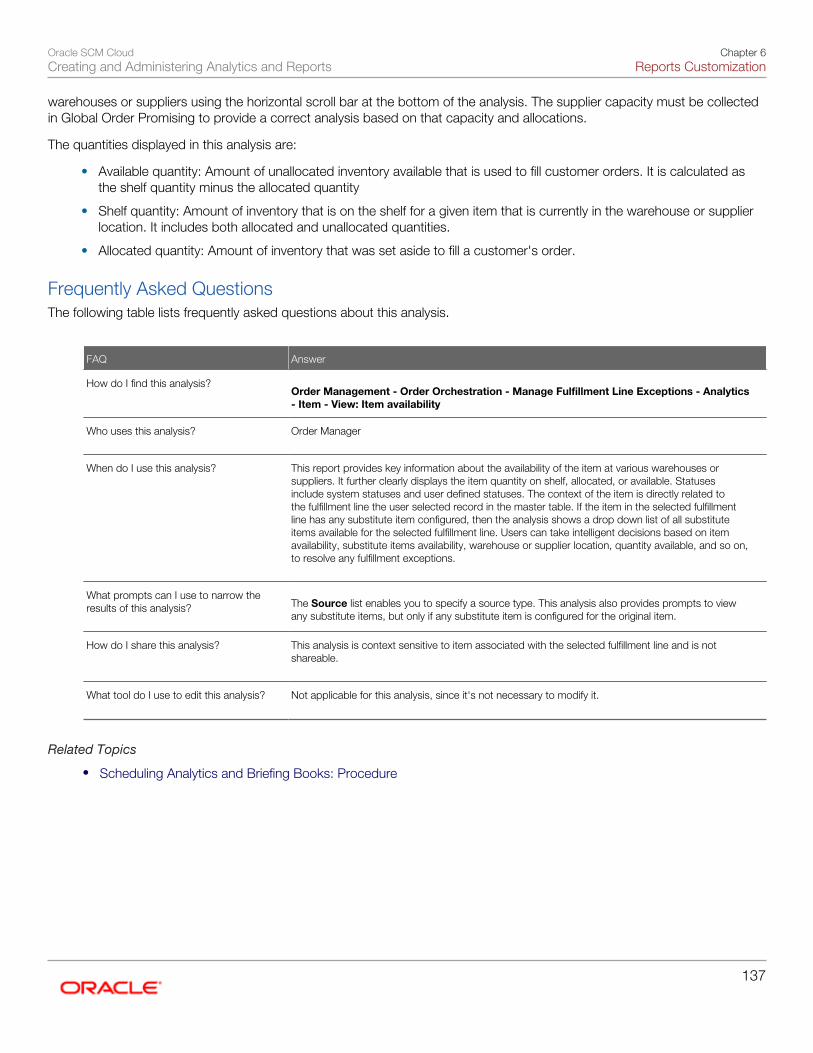
Oracle SCM CloudCreating and Administering Analytics and Reports
Chapter 6Reports Customization
137
warehouses or suppliers using the horizontal scroll bar at the bottom of the analysis. The supplier capacity must be collectedin Global Order Promising to provide a correct analysis based on that capacity and allocations.
The quantities displayed in this analysis are:
• Available quantity: Amount of unallocated inventory available that is used to fill customer orders. It is calculated asthe shelf quantity minus the allocated quantity
• Shelf quantity: Amount of inventory that is on the shelf for a given item that is currently in the warehouse or supplierlocation. It includes both allocated and unallocated quantities.
• Allocated quantity: Amount of inventory that was set aside to fill a customer's order.
Frequently Asked QuestionsThe following table lists frequently asked questions about this analysis.
FAQ Answer
How do I find this analysis? Order Management - Order Orchestration - Manage Fulfillment Line Exceptions - Analytics
- Item - View: Item availability
Who uses this analysis?
Order Manager
When do I use this analysis?
This report provides key information about the availability of the item at various warehouses orsuppliers. It further clearly displays the item quantity on shelf, allocated, or available. Statusesinclude system statuses and user defined statuses. The context of the item is directly related tothe fulfillment line the user selected record in the master table. If the item in the selected fulfillmentline has any substitute item configured, then the analysis shows a drop down list of all substituteitems available for the selected fulfillment line. Users can take intelligent decisions based on itemavailability, substitute items availability, warehouse or supplier location, quantity available, and so on,to resolve any fulfillment exceptions.
What prompts can I use to narrow theresults of this analysis?
The Source list enables you to specify a source type. This analysis also provides prompts to viewany substitute items, but only if any substitute item is configured for the original item.
How do I share this analysis?
This analysis is context sensitive to item associated with the selected fulfillment line and is notshareable.
What tool do I use to edit this analysis?
Not applicable for this analysis, since it's not necessary to modify it.
Related Topics
• Scheduling Analytics and Briefing Books: Procedure
Oracle SCM CloudCreating and Administering Analytics and Reports
Chapter 6Reports Customization
138
Count Of Holds For This Item By Hold Name Analysis: ExplainedThis analytical view shows different hold applied to a given item. This analysis is context-sensitive. The analysis is based onthe selected record in the master table. The context of the analysis changes as you navigate and select records in the mastertable.
Key InsightsThis analysis shows holds applied, across all fulfillment lines, to the selected item. The analysis provides the count of variousholds sorted by hold name for the selected item from selected fulfillment line. This analysis counts holds applied to theorchestration order, the orchestration order line, and associated fulfillment lines. A specific fulfillment line may have multipledifferent holds. The output of this analysis is cached, so the data is not displayed in real time. The data is refreshed inaccordance with the caching configuration.
Frequently Asked QuestionsThe following table lists frequently asked questions about this analysis.
FAQ Answer
How do I find this analysis? Order Management - Order Orchestration - Manage Fulfillment Line Exceptions - Analytics
- Item - View: Count of holds for this item by hold name
Who uses this analysis?
Order Manager
When do I use this analysis?
When you need information about various holds applied to all orders for a selected item. The contextof the item is directly related to the fulfillment line for the selected record in the master table. If the
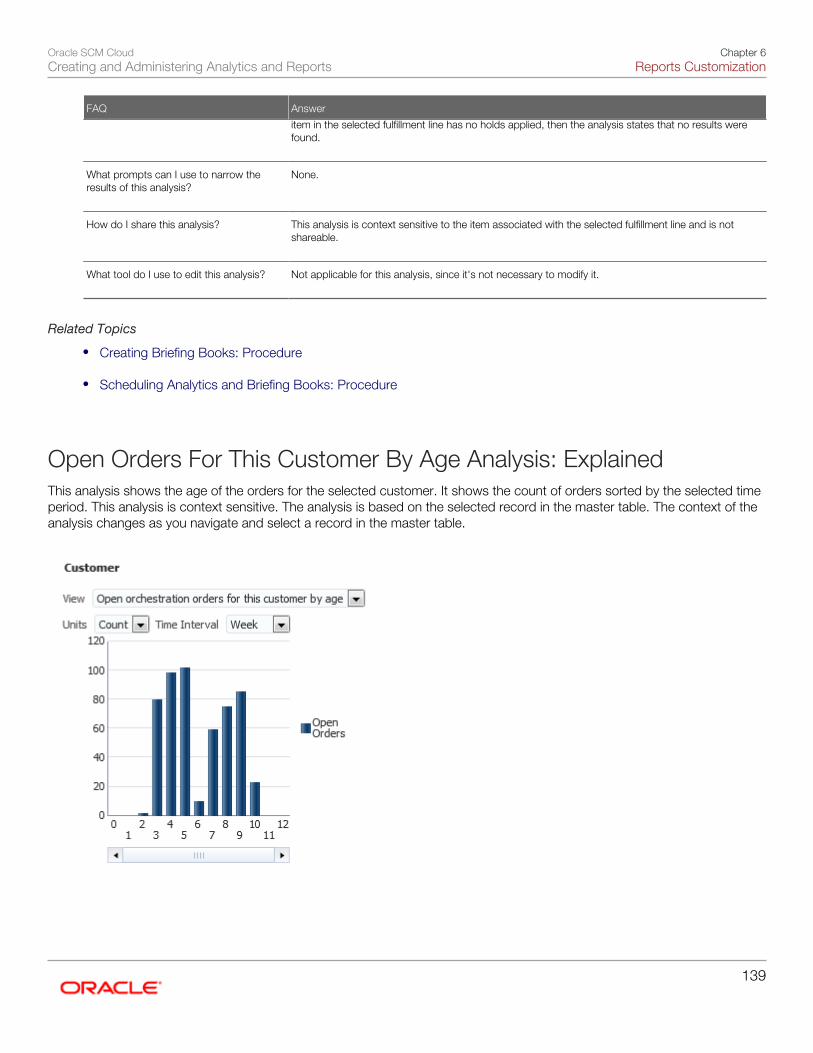
Oracle SCM CloudCreating and Administering Analytics and Reports
Chapter 6Reports Customization
139
FAQ Answer
item in the selected fulfillment line has no holds applied, then the analysis states that no results werefound.
What prompts can I use to narrow theresults of this analysis?
None.
How do I share this analysis?
This analysis is context sensitive to the item associated with the selected fulfillment line and is notshareable.
What tool do I use to edit this analysis?
Not applicable for this analysis, since it's not necessary to modify it.
Related Topics
• Creating Briefing Books: Procedure
• Scheduling Analytics and Briefing Books: Procedure
Open Orders For This Customer By Age Analysis: ExplainedThis analysis shows the age of the orders for the selected customer. It shows the count of orders sorted by the selected timeperiod. This analysis is context sensitive. The analysis is based on the selected record in the master table. The context of theanalysis changes as you navigate and select a record in the master table.
Oracle SCM CloudCreating and Administering Analytics and Reports
Chapter 6Reports Customization
140
Key InsightsThis analysis shows the age of orders for the selected customer.
The age of orchestration orders for a customer is calculated as follows:
• For open orders, age is how long the order has been open, calculated as: (age) = (system date) - (ordered date)
• For closed orders, age is the difference in how long it took to close the order, calculated as: (age) = (last updateddate) - (ordered date)
The last updated date serves as a proxy for closed date.If an order is future dated, then it is possible to get a negativevalue. The time axis of the analysis is based on ordered date, meaning, for example, that an order placed in May but closedin June appears on the May graph bar. Negative values are possible
Frequently Asked QuestionsThe following table lists frequently asked questions about this analysis.
FAQ Answer
How do I find this analysis? Order Management - Order Orchestration - Manage Fulfillment Line Exceptions - Analytics
- Customer - View: Open orders for this customer by age analysis
Who uses this analysis?
Order Manager
When do I use this analysis?
This report provides a count of orders, sorted by a selected time period for a selected customer.The context of the customer is directly related to the fulfillment line for the selected record in themaster table.
What prompts can I use to narrow theresults of this analysis?
Users can view the analysis as a count of orders or value of orders in currency. Further filtering ispossible by selecting the time period in days, weeks, months, quarter or years. The numerals on thex-axis refer to the time period selected.
How do I share this analysis?
This analysis is context sensitive to the selected fulfillment line and is not shareable.
What tool do I use to edit this analysis?
Not applicable for this analysis, since it's not necessary to modify it.
Related Topics
• Scheduling Analytics and Briefing Books: Procedure
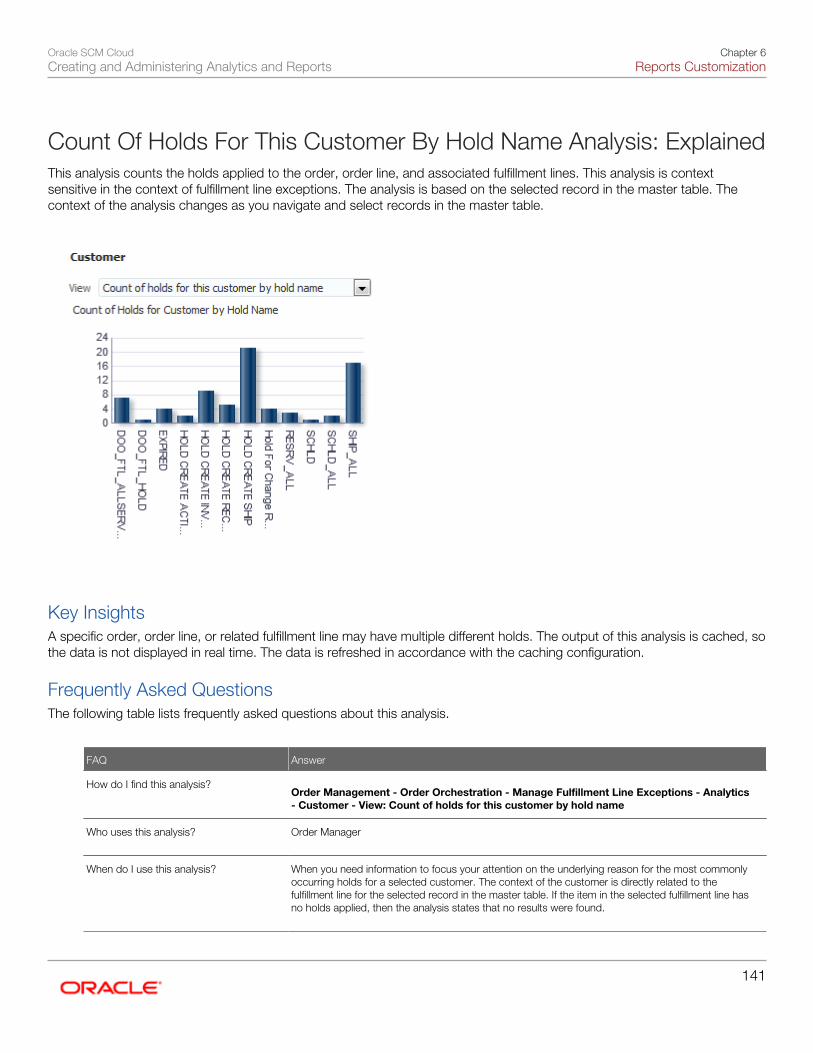
Oracle SCM CloudCreating and Administering Analytics and Reports
Chapter 6Reports Customization
141
Count Of Holds For This Customer By Hold Name Analysis: ExplainedThis analysis counts the holds applied to the order, order line, and associated fulfillment lines. This analysis is contextsensitive in the context of fulfillment line exceptions. The analysis is based on the selected record in the master table. Thecontext of the analysis changes as you navigate and select records in the master table.
Key InsightsA specific order, order line, or related fulfillment line may have multiple different holds. The output of this analysis is cached, sothe data is not displayed in real time. The data is refreshed in accordance with the caching configuration.
Frequently Asked QuestionsThe following table lists frequently asked questions about this analysis.
FAQ Answer
How do I find this analysis? Order Management - Order Orchestration - Manage Fulfillment Line Exceptions - Analytics
- Customer - View: Count of holds for this customer by hold name
Who uses this analysis?
Order Manager
When do I use this analysis?
When you need information to focus your attention on the underlying reason for the most commonlyoccurring holds for a selected customer. The context of the customer is directly related to thefulfillment line for the selected record in the master table. If the item in the selected fulfillment line hasno holds applied, then the analysis states that no results were found.
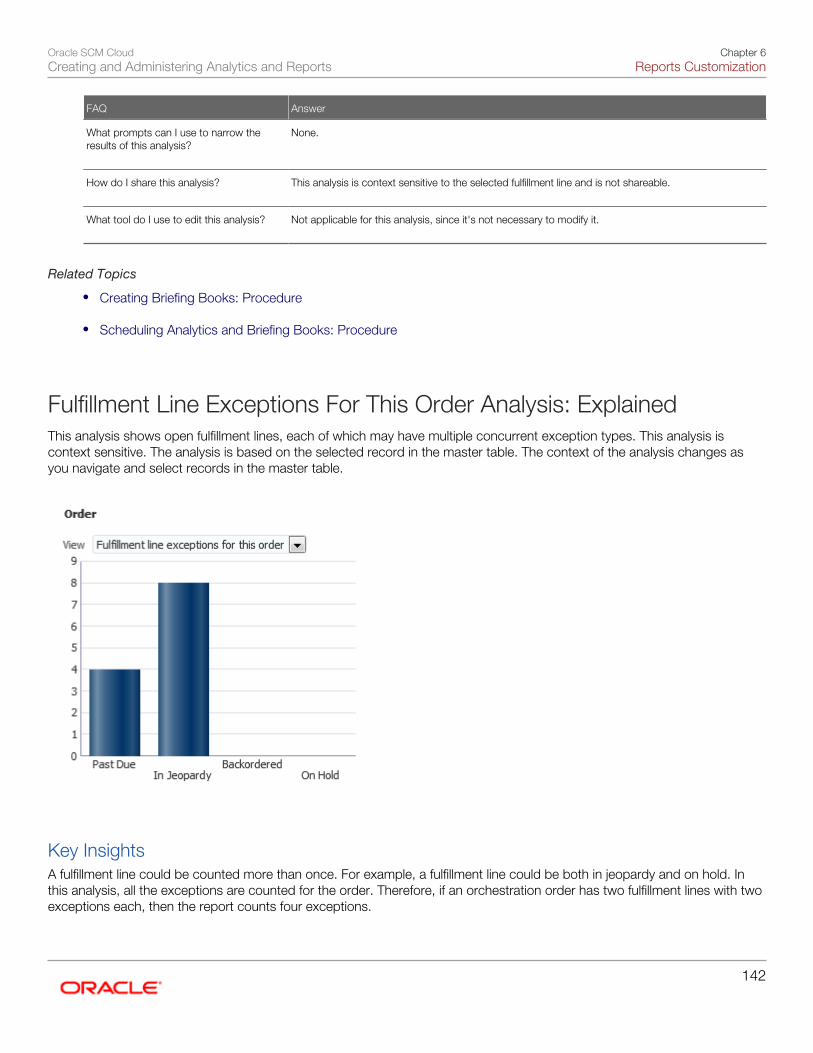
Oracle SCM CloudCreating and Administering Analytics and Reports
Chapter 6Reports Customization
142
FAQ Answer
What prompts can I use to narrow theresults of this analysis?
None.
How do I share this analysis?
This analysis is context sensitive to the selected fulfillment line and is not shareable.
What tool do I use to edit this analysis?
Not applicable for this analysis, since it's not necessary to modify it.
Related Topics
• Creating Briefing Books: Procedure
• Scheduling Analytics and Briefing Books: Procedure
Fulfillment Line Exceptions For This Order Analysis: ExplainedThis analysis shows open fulfillment lines, each of which may have multiple concurrent exception types. This analysis iscontext sensitive. The analysis is based on the selected record in the master table. The context of the analysis changes asyou navigate and select records in the master table.
Key InsightsA fulfillment line could be counted more than once. For example, a fulfillment line could be both in jeopardy and on hold. Inthis analysis, all the exceptions are counted for the order. Therefore, if an orchestration order has two fulfillment lines with twoexceptions each, then the report counts four exceptions.
Oracle SCM CloudCreating and Administering Analytics and Reports
Chapter 6Reports Customization
143
Frequently Asked QuestionsThe following table lists frequently asked questions about this analysis.
FAQ Answer
How do I find this analysis? Order Management - Order Orchestration - Manage Fulfillment Line Exceptions - Analytics
- Order - View: Fulfillment line exceptions for this order
Who uses this analysis?
Order Manager
When do I use this analysis?
This analysis shows open fulfillment lines, each of which may have multiple concurrent exceptiontypes. The context of the customer is directly related to the fulfillment line the user selected record inthe master table.
What prompts can I use to narrow theresults of this analysis?
None.
How do I share this analysis?
This analysis is context sensitive to the selected fulfillment line and is not shareable.
What tool do I use to edit this analysis?
Not applicable for this analysis, since it's not necessary to modify it.
Related Topics
• Scheduling Analytics and Briefing Books: Procedure
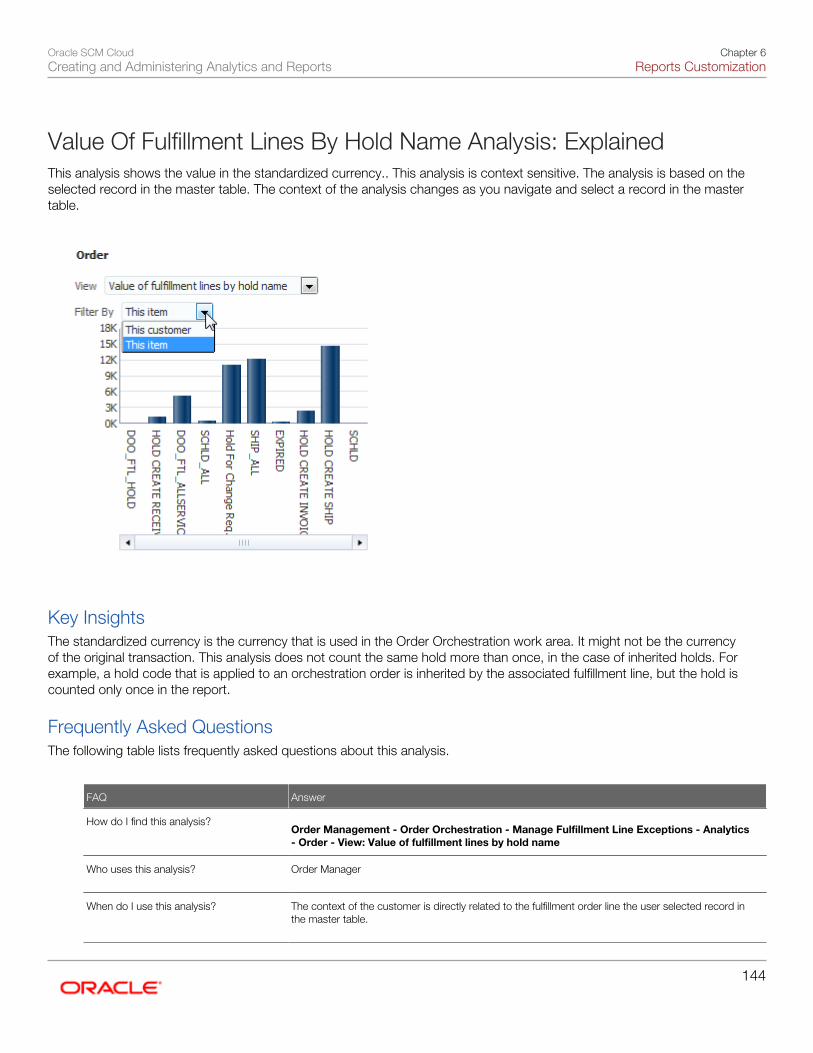
Oracle SCM CloudCreating and Administering Analytics and Reports
Chapter 6Reports Customization
144
Value Of Fulfillment Lines By Hold Name Analysis: ExplainedThis analysis shows the value in the standardized currency.. This analysis is context sensitive. The analysis is based on theselected record in the master table. The context of the analysis changes as you navigate and select a record in the mastertable.
Key InsightsThe standardized currency is the currency that is used in the Order Orchestration work area. It might not be the currencyof the original transaction. This analysis does not count the same hold more than once, in the case of inherited holds. Forexample, a hold code that is applied to an orchestration order is inherited by the associated fulfillment line, but the hold iscounted only once in the report.
Frequently Asked QuestionsThe following table lists frequently asked questions about this analysis.
FAQ Answer
How do I find this analysis? Order Management - Order Orchestration - Manage Fulfillment Line Exceptions - Analytics
- Order - View: Value of fulfillment lines by hold name
Who uses this analysis?
Order Manager
When do I use this analysis?
The context of the customer is directly related to the fulfillment order line the user selected record inthe master table.
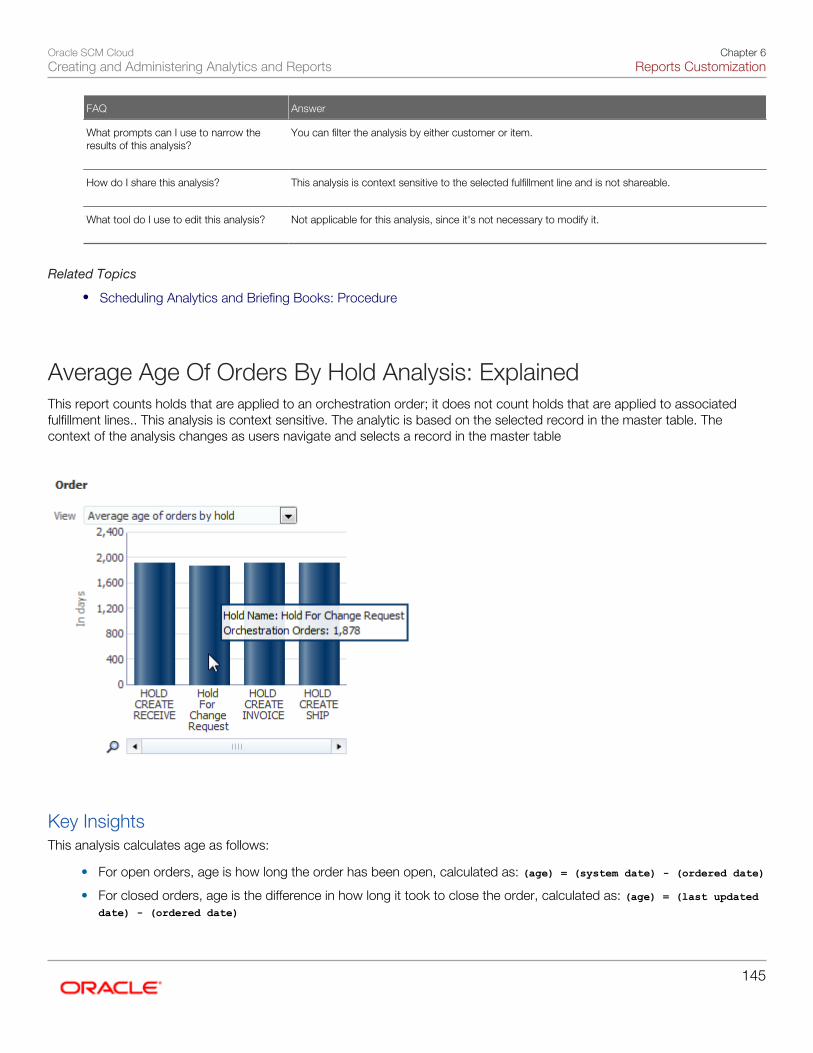
Oracle SCM CloudCreating and Administering Analytics and Reports
Chapter 6Reports Customization
145
FAQ Answer
What prompts can I use to narrow theresults of this analysis?
You can filter the analysis by either customer or item.
How do I share this analysis?
This analysis is context sensitive to the selected fulfillment line and is not shareable.
What tool do I use to edit this analysis?
Not applicable for this analysis, since it's not necessary to modify it.
Related Topics
• Scheduling Analytics and Briefing Books: Procedure
Average Age Of Orders By Hold Analysis: ExplainedThis report counts holds that are applied to an orchestration order; it does not count holds that are applied to associatedfulfillment lines.. This analysis is context sensitive. The analytic is based on the selected record in the master table. Thecontext of the analysis changes as users navigate and selects a record in the master table
Key InsightsThis analysis calculates age as follows:
• For open orders, age is how long the order has been open, calculated as: (age) = (system date) - (ordered date)
• For closed orders, age is the difference in how long it took to close the order, calculated as: (age) = (last updateddate) - (ordered date)
Oracle SCM CloudCreating and Administering Analytics and Reports
Chapter 6Reports Customization
146
The last updated date serves as a proxy for closed date. If an order is future dated, then it is possible to get a negativevalue. The time axis is based on ordered date, meaning an order placed in May but closed in June appears on the May graphbar.
Frequently Asked QuestionsThe following table lists frequently asked questions about this analysis.
FAQ Answer
How do I find this analysis? Order Management - Order Orchestration - Manage Fulfillment Line Exceptions - Analytics
- Order - View: Average age of orders by hold
Who uses this analysis?
Order Manager
When do I use this analysis?
When considering the relative sense of the holds that are causing the most significant delays, so thatyou can resolve the most time-consuming holds.The context of the customer is directly related tothe fulfillment line the user selected record in the master table.
What prompts can I use to narrow theresults of this analysis?
None
How do I share this analysis?
This analysis is context sensitive to the selected fulfillment line and is not shareable.
What tool do I use to edit this analysis?
Not applicable for this analysis, since it's not necessary to modify it.
Related Topics
• Scheduling Analytics and Briefing Books: Procedure
Manage Orchestration Process Exceptions Page
Orchestration Process Exceptions By Type Analysis: ExplainedThe analyses for orchestration process exceptions provide current information about orchestration processes. Anorchestration process can have more than one exception. In this analysis, each orchestration process instance is counted
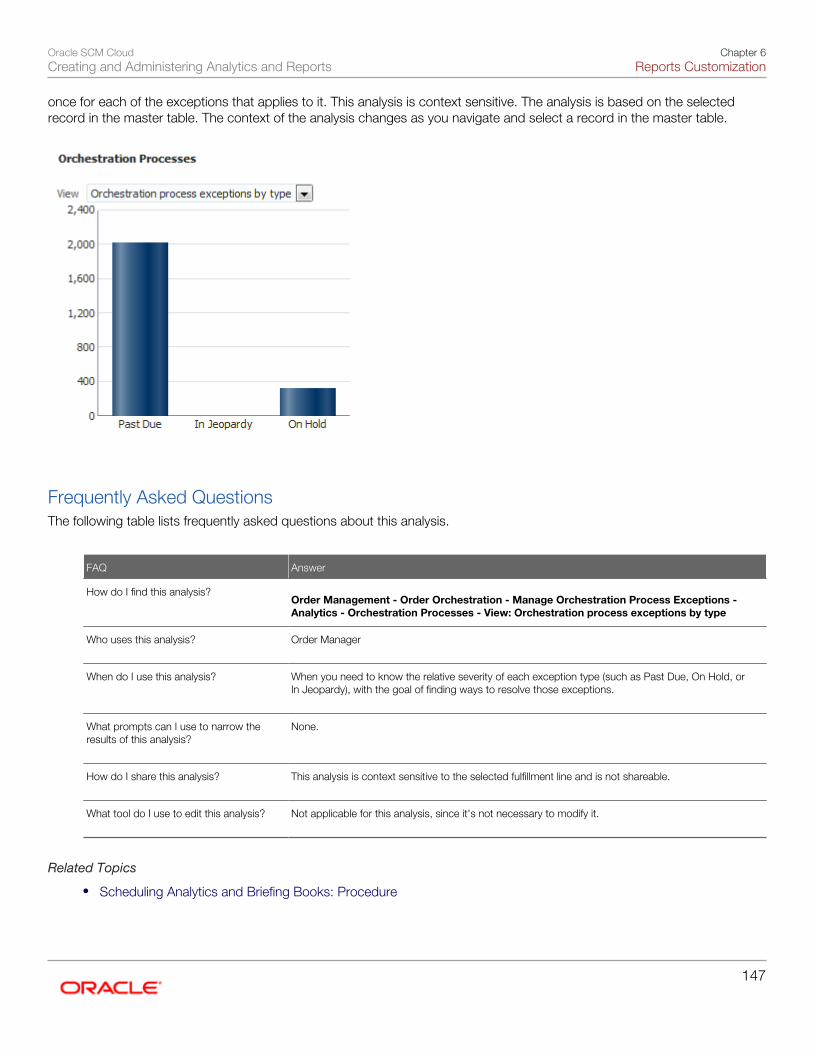
Oracle SCM CloudCreating and Administering Analytics and Reports
Chapter 6Reports Customization
147
once for each of the exceptions that applies to it. This analysis is context sensitive. The analysis is based on the selectedrecord in the master table. The context of the analysis changes as you navigate and select a record in the master table.
Frequently Asked QuestionsThe following table lists frequently asked questions about this analysis.
FAQ Answer
How do I find this analysis? Order Management - Order Orchestration - Manage Orchestration Process Exceptions -
Analytics - Orchestration Processes - View: Orchestration process exceptions by type
Who uses this analysis?
Order Manager
When do I use this analysis?
When you need to know the relative severity of each exception type (such as Past Due, On Hold, orIn Jeopardy), with the goal of finding ways to resolve those exceptions.
What prompts can I use to narrow theresults of this analysis?
None.
How do I share this analysis?
This analysis is context sensitive to the selected fulfillment line and is not shareable.
What tool do I use to edit this analysis?
Not applicable for this analysis, since it's not necessary to modify it.
Related Topics
• Scheduling Analytics and Briefing Books: Procedure
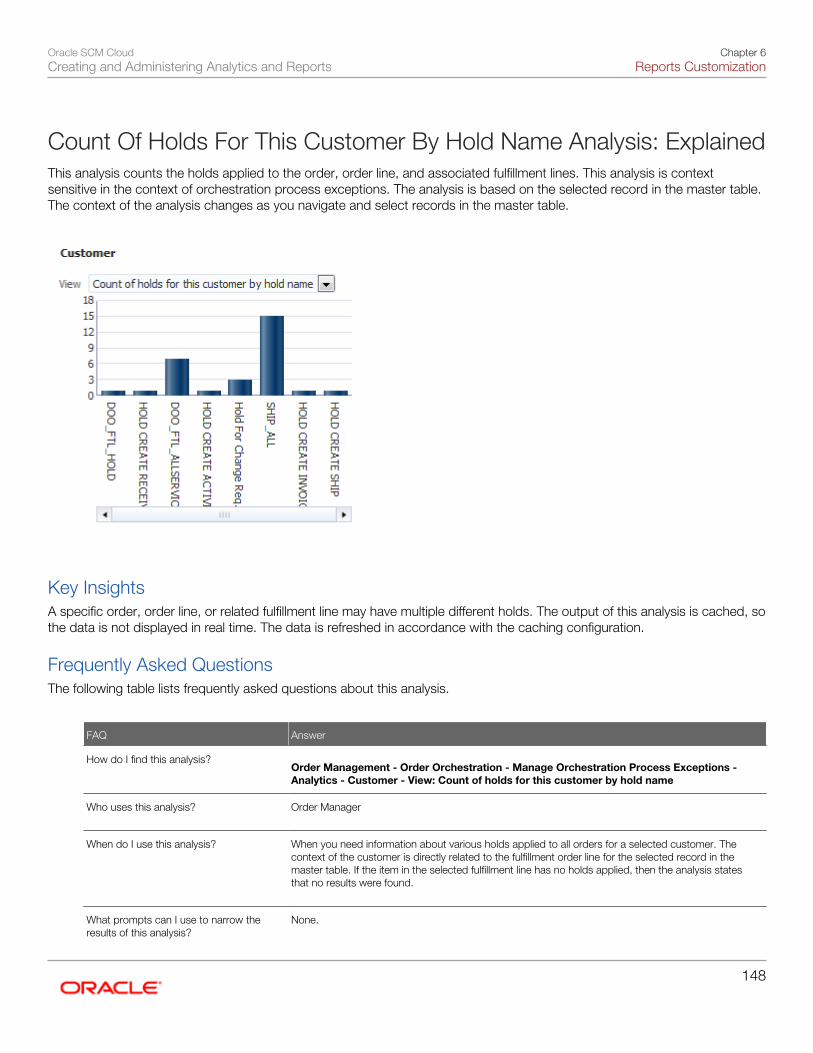
Oracle SCM CloudCreating and Administering Analytics and Reports
Chapter 6Reports Customization
148
Count Of Holds For This Customer By Hold Name Analysis: ExplainedThis analysis counts the holds applied to the order, order line, and associated fulfillment lines. This analysis is contextsensitive in the context of orchestration process exceptions. The analysis is based on the selected record in the master table.The context of the analysis changes as you navigate and select records in the master table.
Key InsightsA specific order, order line, or related fulfillment line may have multiple different holds. The output of this analysis is cached, sothe data is not displayed in real time. The data is refreshed in accordance with the caching configuration.
Frequently Asked QuestionsThe following table lists frequently asked questions about this analysis.
FAQ Answer
How do I find this analysis? Order Management - Order Orchestration - Manage Orchestration Process Exceptions -
Analytics - Customer - View: Count of holds for this customer by hold name
Who uses this analysis?
Order Manager
When do I use this analysis?
When you need information about various holds applied to all orders for a selected customer. Thecontext of the customer is directly related to the fulfillment order line for the selected record in themaster table. If the item in the selected fulfillment line has no holds applied, then the analysis statesthat no results were found.
What prompts can I use to narrow theresults of this analysis?
None.
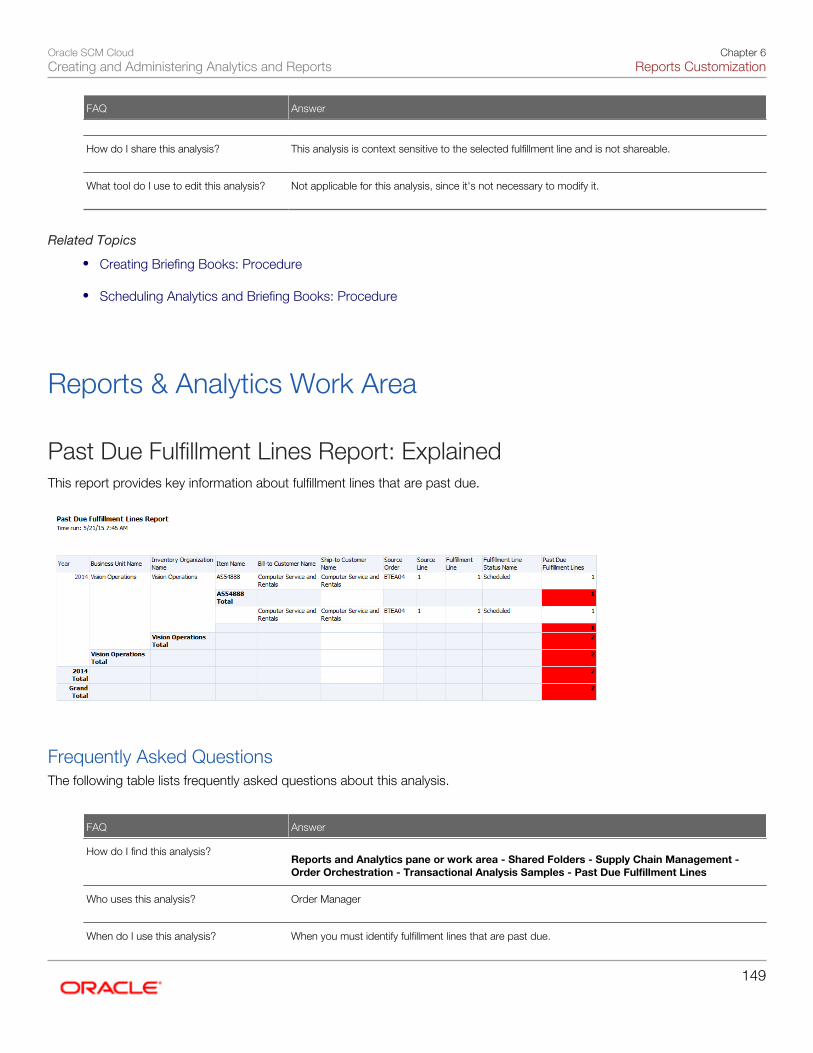
Oracle SCM CloudCreating and Administering Analytics and Reports
Chapter 6Reports Customization
149
FAQ Answer
How do I share this analysis?
This analysis is context sensitive to the selected fulfillment line and is not shareable.
What tool do I use to edit this analysis?
Not applicable for this analysis, since it's not necessary to modify it.
Related Topics
• Creating Briefing Books: Procedure
• Scheduling Analytics and Briefing Books: Procedure
Reports & Analytics Work Area
Past Due Fulfillment Lines Report: ExplainedThis report provides key information about fulfillment lines that are past due.
Frequently Asked QuestionsThe following table lists frequently asked questions about this analysis.
FAQ Answer
How do I find this analysis? Reports and Analytics pane or work area - Shared Folders - Supply Chain Management -
Order Orchestration - Transactional Analysis Samples - Past Due Fulfillment Lines
Who uses this analysis?
Order Manager
When do I use this analysis? When you must identify fulfillment lines that are past due.
Oracle SCM CloudCreating and Administering Analytics and Reports
Chapter 6Reports Customization
150
FAQ Answer
What prompts can I use to narrow theresults of this analysis?
• Use the following required parameters to filter the results:
◦ Year
◦ Inventory Organization Name
◦ Item Name
◦ Business Unit Name
◦ Bill-to Customer Name
◦ Ship-to Customer Name
• For printing formats, select an appropriate format from the Output tab under the Advancedoptions.
How do I share this analysis?
This analysis is context sensitive to the selected fulfillment line and is not shareable.
What tool do I use to edit this analysis?
Not applicable for this analysis, since it's not necessary to modify it.
Related Topics
• Creating Briefing Books: Procedure
• Scheduling Analytics and Briefing Books: Procedure
Reports for Global Order Promising
Review Supply Availability Report: ExplainedThis report shows availability of an item at warehouses. This report queries the in-memory data within the Global OrderPromising (GOP) engine and displays the current availability of the item. The GOP engine is a real-time promising engine thatis always online, promising orders as they are created. This report generated by GOP is thus only valid at the point of timethat it is generated. This report displays the initial supply, consumed quantity, and the net available supply for future orders
Key InsightsThis analytic shows aggregate supply and does not provide visibility to the specific supply type. If you have some On Handand some Purchase Order supply today, you would only see the consolidated supply number in this report, without visibility tothe individual On Hand and Purchase Order quantity.
Frequently Asked QuestionsThe following table lists frequently asked questions about this analysis.
Oracle SCM CloudCreating and Administering Analytics and Reports
Chapter 6Reports Customization
151
FAQ Answer
How do I find this analysis? Order Management - Order Orchestration - Reports and Analytics pane - Review Supply
Availability
Who uses this analysis?
Order Manager
When do I use this analysis?
When an order has been promised late, and you want to understand whether this was due to supplynot being available, and to also find other warehouses where supply may be available.
What prompts can I use to narrow theresults of this analysis?
Use the following required parameters to filter the results:
• Item• Warehouse• From Date• To Date
How do I share this analysis?
This analysis cannot be shared; it is also not relevant for sharing since the supply report is only validat the time it is generated. Since orders are promised in real time, the availability numbers in thisreport may no longer be accurate.
What tool do I use to edit this analysis?
This analysis cannot be edited.
Related Topics• Scheduling Analytics and Briefing Books: Procedure
Review Supply Allocation Report: ExplainedSupply within GOP can be allocated to demand classes through a planning allocation rule. As orders are promised, theyconsume allocations from their demand class. This report shows the allocated, consumed, and available quantities for ademand class at a point in time.
Key InsightsThis report is only relevant for items that are assigned to a planning allocation rule.
Frequently Asked QuestionsThe following table lists frequently asked questions about this analysis.
FAQ Answer
How do I find this analysis? Order Management - Order Orchestration - Reports and Analytics pane - Review Supply
Allocation
Who uses this analysis?
Order Manager
When do I use this analysis?
When an order has been promised late, and you want to understand whether this was due toinsufficient supply at a demand class, and to also identify other demand classes where sufficientallocation is available.
Oracle SCM CloudCreating and Administering Analytics and Reports
Chapter 6Reports Customization
152
FAQ Answer
What prompts can I use to narrow theresults of this analysis?
Use the following required parameters to filter the results:
• Item• Warehouse• From Date• To Date• Demand Class
How do I share this analysis?
This analysis cannot be shared; it is also not relevant for sharing since the supply report is only validat the time it is generated. Since orders are promised in real time, the availability numbers in thisreport may no longer be accurate.
What tool do I use to edit this analysis?
This analysis cannot be edited.
Related Topics
• Scheduling Analytics and Briefing Books: Procedure
Manage Fulfillment Lines
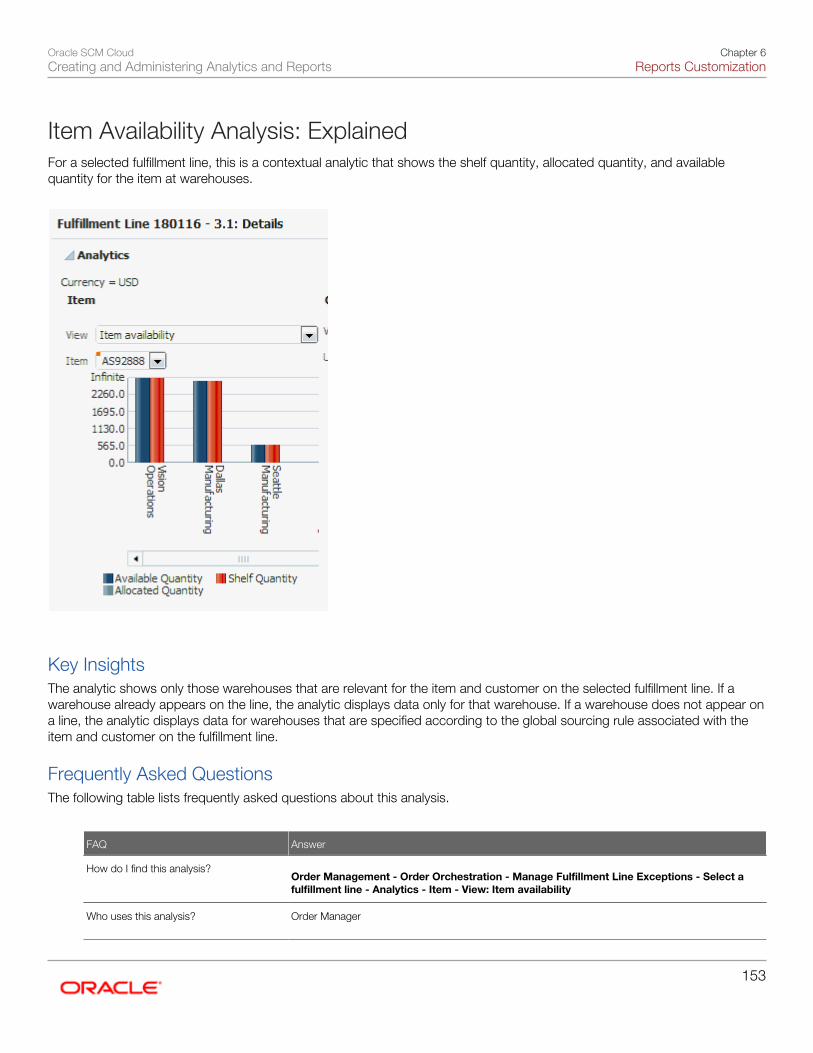
Oracle SCM CloudCreating and Administering Analytics and Reports
Chapter 6Reports Customization
153
Item Availability Analysis: ExplainedFor a selected fulfillment line, this is a contextual analytic that shows the shelf quantity, allocated quantity, and availablequantity for the item at warehouses.
Key InsightsThe analytic shows only those warehouses that are relevant for the item and customer on the selected fulfillment line. If awarehouse already appears on the line, the analytic displays data only for that warehouse. If a warehouse does not appear ona line, the analytic displays data for warehouses that are specified according to the global sourcing rule associated with theitem and customer on the fulfillment line.
Frequently Asked QuestionsThe following table lists frequently asked questions about this analysis.
FAQ Answer
How do I find this analysis? Order Management - Order Orchestration - Manage Fulfillment Line Exceptions - Select a
fulfillment line - Analytics - Item - View: Item availability
Who uses this analysis?
Order Manager
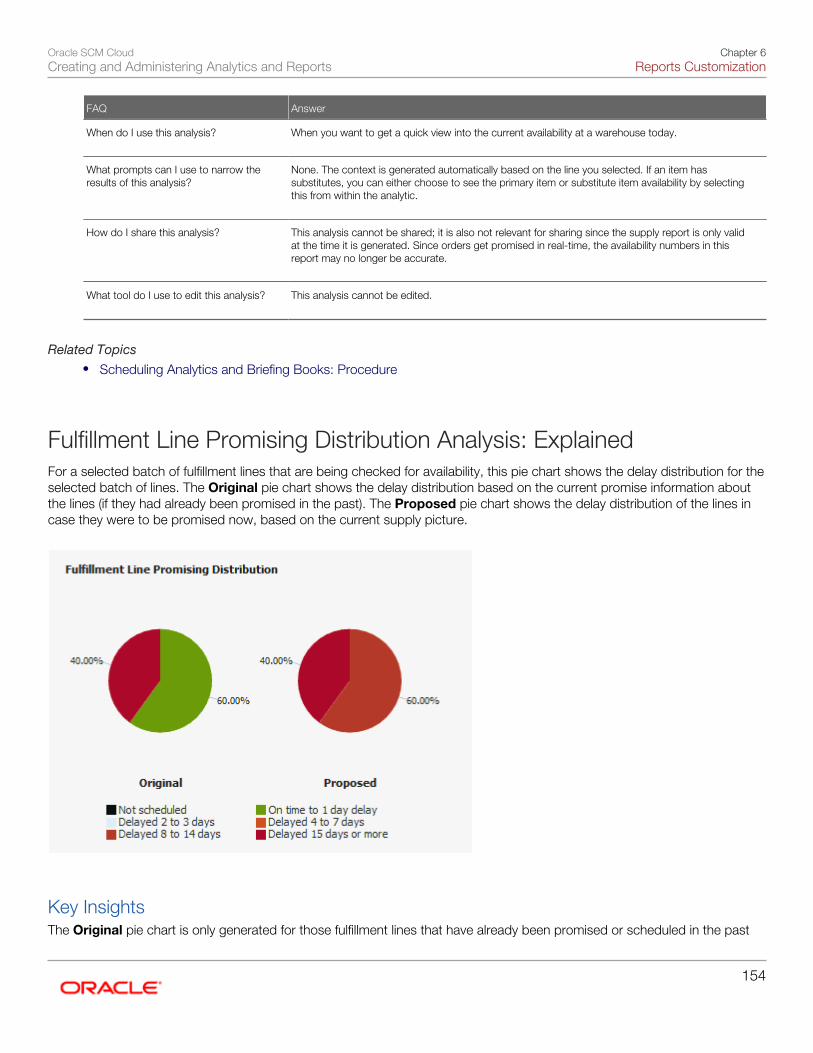
Oracle SCM CloudCreating and Administering Analytics and Reports
Chapter 6Reports Customization
154
FAQ Answer
When do I use this analysis?
When you want to get a quick view into the current availability at a warehouse today.
What prompts can I use to narrow theresults of this analysis?
None. The context is generated automatically based on the line you selected. If an item hassubstitutes, you can either choose to see the primary item or substitute item availability by selectingthis from within the analytic.
How do I share this analysis?
This analysis cannot be shared; it is also not relevant for sharing since the supply report is only validat the time it is generated. Since orders get promised in real-time, the availability numbers in thisreport may no longer be accurate.
What tool do I use to edit this analysis?
This analysis cannot be edited.
Related Topics• Scheduling Analytics and Briefing Books: Procedure
Fulfillment Line Promising Distribution Analysis: ExplainedFor a selected batch of fulfillment lines that are being checked for availability, this pie chart shows the delay distribution for theselected batch of lines. The Original pie chart shows the delay distribution based on the current promise information aboutthe lines (if they had already been promised in the past). The Proposed pie chart shows the delay distribution of the lines incase they were to be promised now, based on the current supply picture.
Key InsightsThe Original pie chart is only generated for those fulfillment lines that have already been promised or scheduled in the past
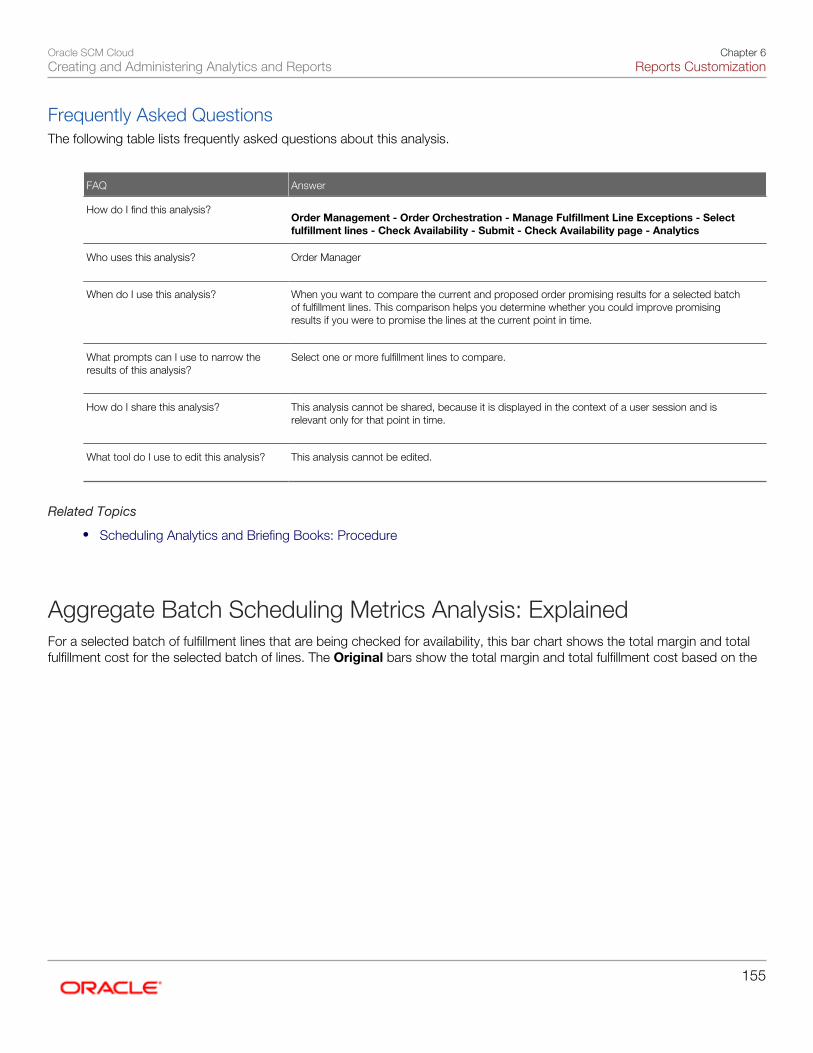
Oracle SCM CloudCreating and Administering Analytics and Reports
Chapter 6Reports Customization
155
Frequently Asked QuestionsThe following table lists frequently asked questions about this analysis.
FAQ Answer
How do I find this analysis? Order Management - Order Orchestration - Manage Fulfillment Line Exceptions - Select
fulfillment lines - Check Availability - Submit - Check Availability page - Analytics
Who uses this analysis?
Order Manager
When do I use this analysis?
When you want to compare the current and proposed order promising results for a selected batchof fulfillment lines. This comparison helps you determine whether you could improve promisingresults if you were to promise the lines at the current point in time.
What prompts can I use to narrow theresults of this analysis?
Select one or more fulfillment lines to compare.
How do I share this analysis?
This analysis cannot be shared, because it is displayed in the context of a user session and isrelevant only for that point in time.
What tool do I use to edit this analysis?
This analysis cannot be edited.
Related Topics
• Scheduling Analytics and Briefing Books: Procedure
Aggregate Batch Scheduling Metrics Analysis: ExplainedFor a selected batch of fulfillment lines that are being checked for availability, this bar chart shows the total margin and totalfulfillment cost for the selected batch of lines. The Original bars show the total margin and total fulfillment cost based on the
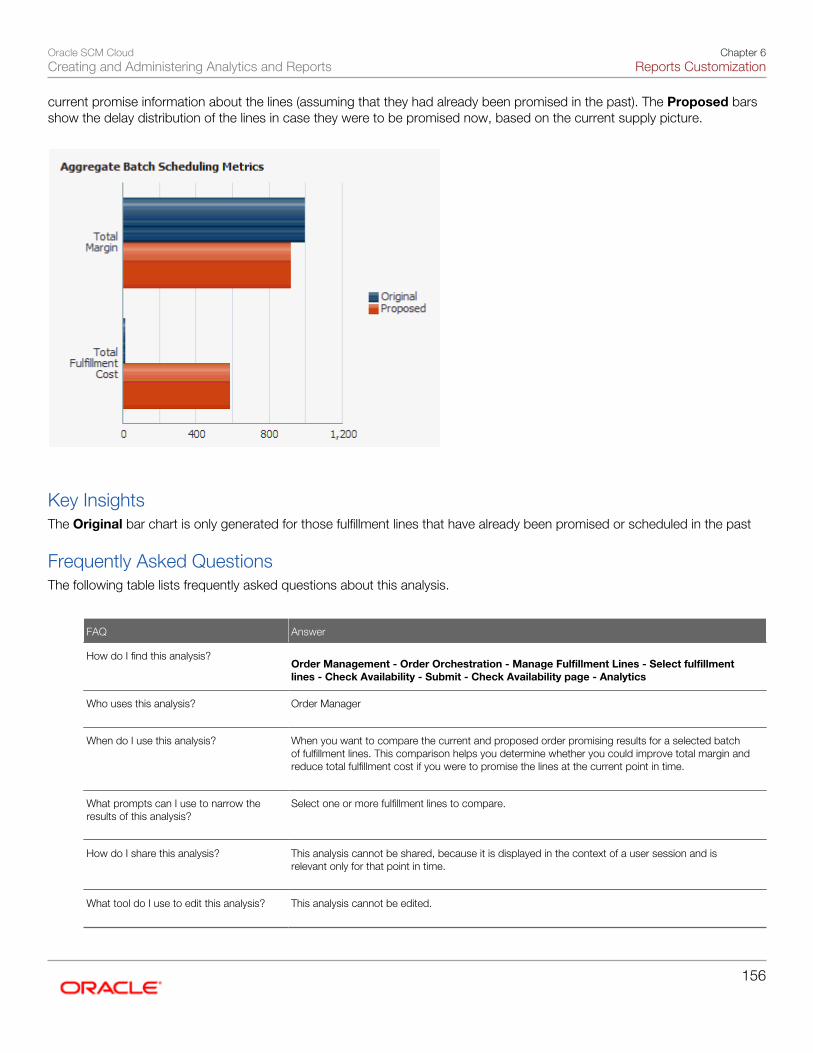
Oracle SCM CloudCreating and Administering Analytics and Reports
Chapter 6Reports Customization
156
current promise information about the lines (assuming that they had already been promised in the past). The Proposed barsshow the delay distribution of the lines in case they were to be promised now, based on the current supply picture.
Key InsightsThe Original bar chart is only generated for those fulfillment lines that have already been promised or scheduled in the past
Frequently Asked QuestionsThe following table lists frequently asked questions about this analysis.
FAQ Answer
How do I find this analysis? Order Management - Order Orchestration - Manage Fulfillment Lines - Select fulfillment
lines - Check Availability - Submit - Check Availability page - Analytics
Who uses this analysis?
Order Manager
When do I use this analysis?
When you want to compare the current and proposed order promising results for a selected batchof fulfillment lines. This comparison helps you determine whether you could improve total margin andreduce total fulfillment cost if you were to promise the lines at the current point in time.
What prompts can I use to narrow theresults of this analysis?
Select one or more fulfillment lines to compare.
How do I share this analysis?
This analysis cannot be shared, because it is displayed in the context of a user session and isrelevant only for that point in time.
What tool do I use to edit this analysis?
This analysis cannot be edited.
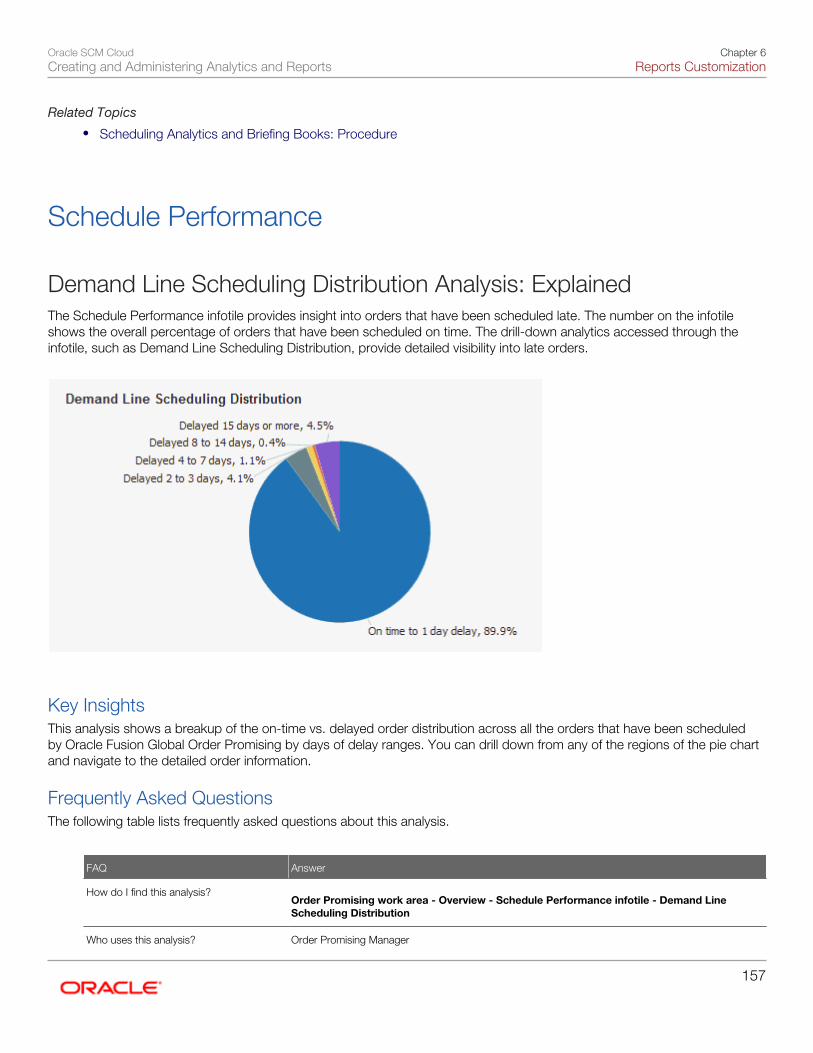
Oracle SCM CloudCreating and Administering Analytics and Reports
Chapter 6Reports Customization
157
Related Topics
• Scheduling Analytics and Briefing Books: Procedure
Schedule Performance
Demand Line Scheduling Distribution Analysis: ExplainedThe Schedule Performance infotile provides insight into orders that have been scheduled late. The number on the infotileshows the overall percentage of orders that have been scheduled on time. The drill-down analytics accessed through theinfotile, such as Demand Line Scheduling Distribution, provide detailed visibility into late orders.
Key InsightsThis analysis shows a breakup of the on-time vs. delayed order distribution across all the orders that have been scheduledby Oracle Fusion Global Order Promising by days of delay ranges. You can drill down from any of the regions of the pie chartand navigate to the detailed order information.
Frequently Asked QuestionsThe following table lists frequently asked questions about this analysis.
FAQ Answer
How do I find this analysis? Order Promising work area - Overview - Schedule Performance infotile - Demand Line
Scheduling Distribution
Who uses this analysis? Order Promising Manager
Oracle SCM CloudCreating and Administering Analytics and Reports
Chapter 6Reports Customization
158
FAQ Answer
When do I use this analysis?
When you want to understand overall order promising performance.
What prompts can I use to narrow theresults of this analysis?
None
How do I share this analysis?
This analysis cannot be shared. It is also not relevant for sharing since the data is context-dependent.
What tool do I use to edit this analysis?
This analysis cannot be edited.
Related Topics
• Scheduling Analytics and Briefing Books: Procedure
Scheduling Performance by Demand Line Requested Date Analysis:ExplainedThe Schedule Performance report provides insight into orders that have been scheduled late. The number on the infotileshows the overall percentage of orders that have been scheduled on time. Among the drill-down analytics accessed through
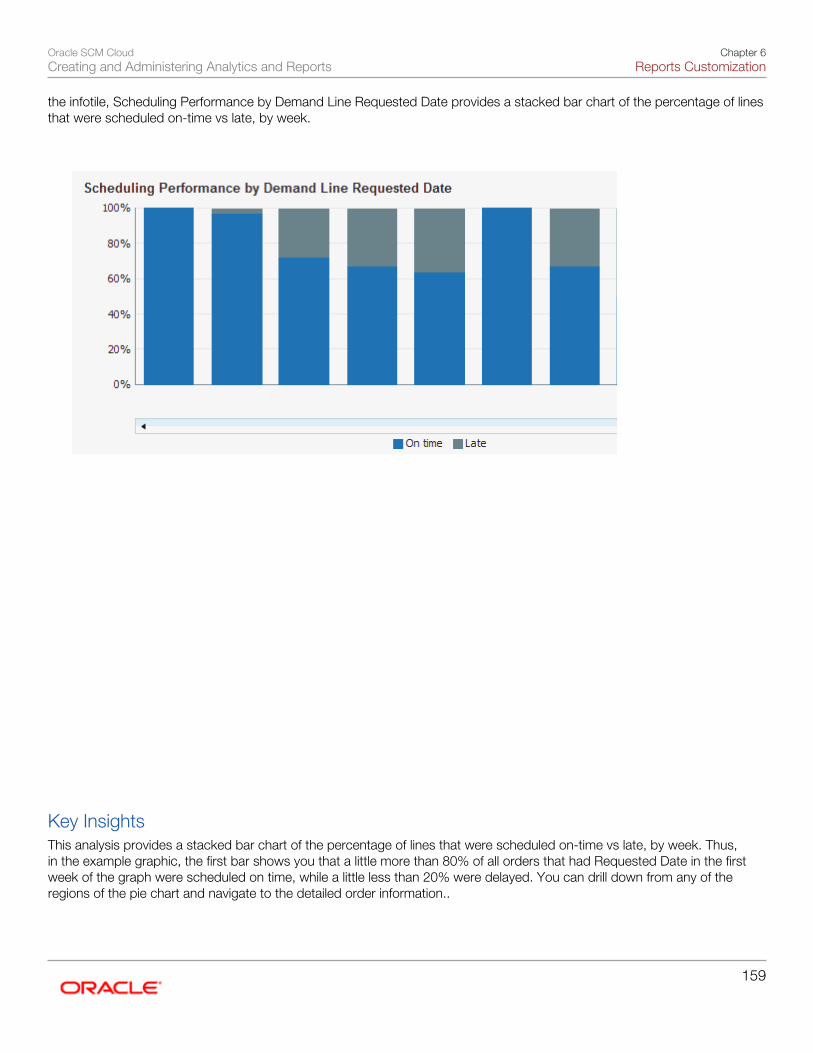
Oracle SCM CloudCreating and Administering Analytics and Reports
Chapter 6Reports Customization
159
the infotile, Scheduling Performance by Demand Line Requested Date provides a stacked bar chart of the percentage of linesthat were scheduled on-time vs late, by week.
Key InsightsThis analysis provides a stacked bar chart of the percentage of lines that were scheduled on-time vs late, by week. Thus,in the example graphic, the first bar shows you that a little more than 80% of all orders that had Requested Date in the firstweek of the graph were scheduled on time, while a little less than 20% were delayed. You can drill down from any of theregions of the pie chart and navigate to the detailed order information..
Oracle SCM CloudCreating and Administering Analytics and Reports
Chapter 6Reports Customization
160
Frequently Asked QuestionsThe following table lists frequently asked questions about this analysis.
FAQ Answer
How do I find this analysis? Order Promising work area - Overview - Schedule Performance infotile - Scheduling
Performance by Demand Line Requested Date
Who uses this analysis?
Order Promising Manager
When do I use this analysis?
When you want to understand overall order promising performance.
What prompts can I use to narrow theresults of this analysis?
None
How do I share this analysis?
This analysis cannot be shared. It is also not relevant for sharing since the data is context-dependent.
What tool do I use to edit this analysis?
This analysis cannot be edited.
Related Topics
• Scheduling Analytics and Briefing Books: Procedure
Demand Line Count over Time Analysis: ExplainedThe Schedule Performance report provides insight into orders that have been scheduled late. The number on the infotileshows the overall percentage of orders that have been scheduled on time. Among the drill-down analytics accessed through
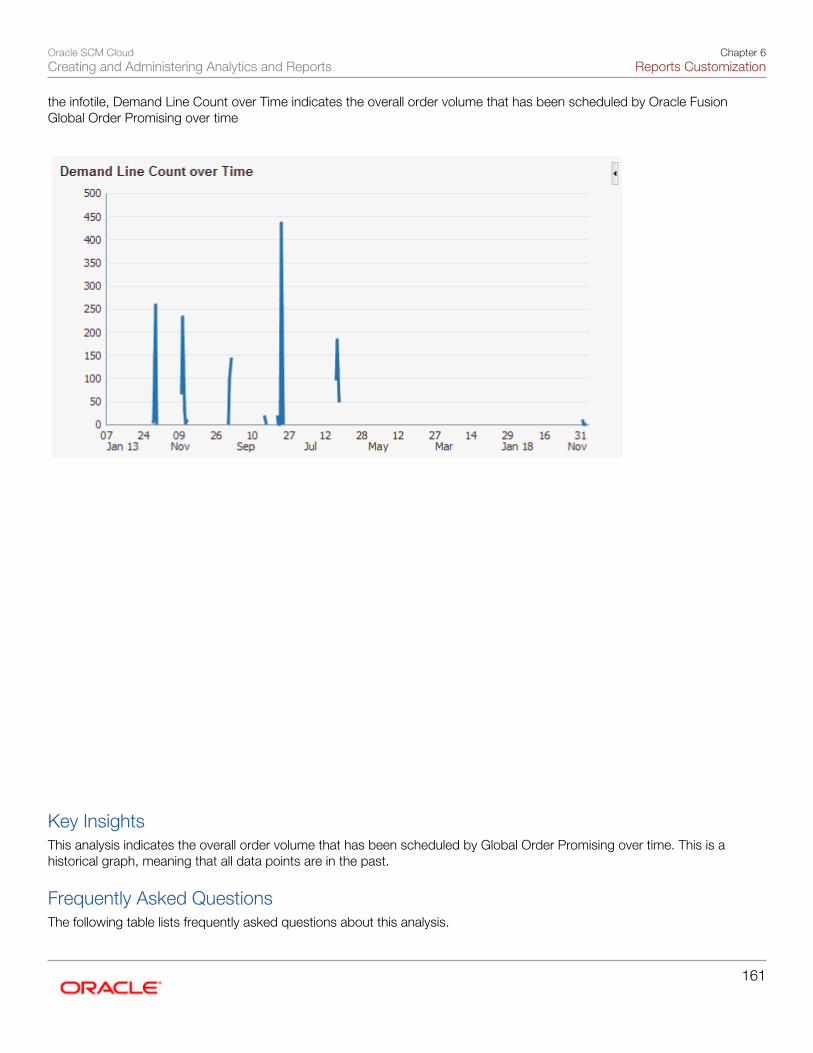
Oracle SCM CloudCreating and Administering Analytics and Reports
Chapter 6Reports Customization
161
the infotile, Demand Line Count over Time indicates the overall order volume that has been scheduled by Oracle FusionGlobal Order Promising over time
Key InsightsThis analysis indicates the overall order volume that has been scheduled by Global Order Promising over time. This is ahistorical graph, meaning that all data points are in the past.
Frequently Asked QuestionsThe following table lists frequently asked questions about this analysis.
Oracle SCM CloudCreating and Administering Analytics and Reports
Chapter 6Reports Customization
162
FAQ Answer
How do I find this analysis? Order Promising work area - Overview - Schedule Performance infotile - Demand Line
Count over Time
Who uses this analysis?
Order Promising Manager
When do I use this analysis?
When you want to understand overall order promising performance.
What prompts can I use to narrow theresults of this analysis?
None
How do I share this analysis?
This analysis cannot be shared. It is also not relevant for sharing since the data is context-dependent.
What tool do I use to edit this analysis?
This analysis cannot be edited.
Related Topics
• Scheduling Analytics and Briefing Books: Procedure
Scheduling Performance by Demand Line Creation Date Analysis:ExplainedThe Schedule Performance report provides insight into orders that have been scheduled late. The number on the infotileshows the overall percentage of orders that have been scheduled on time. Among the drill-down analytics accessed through
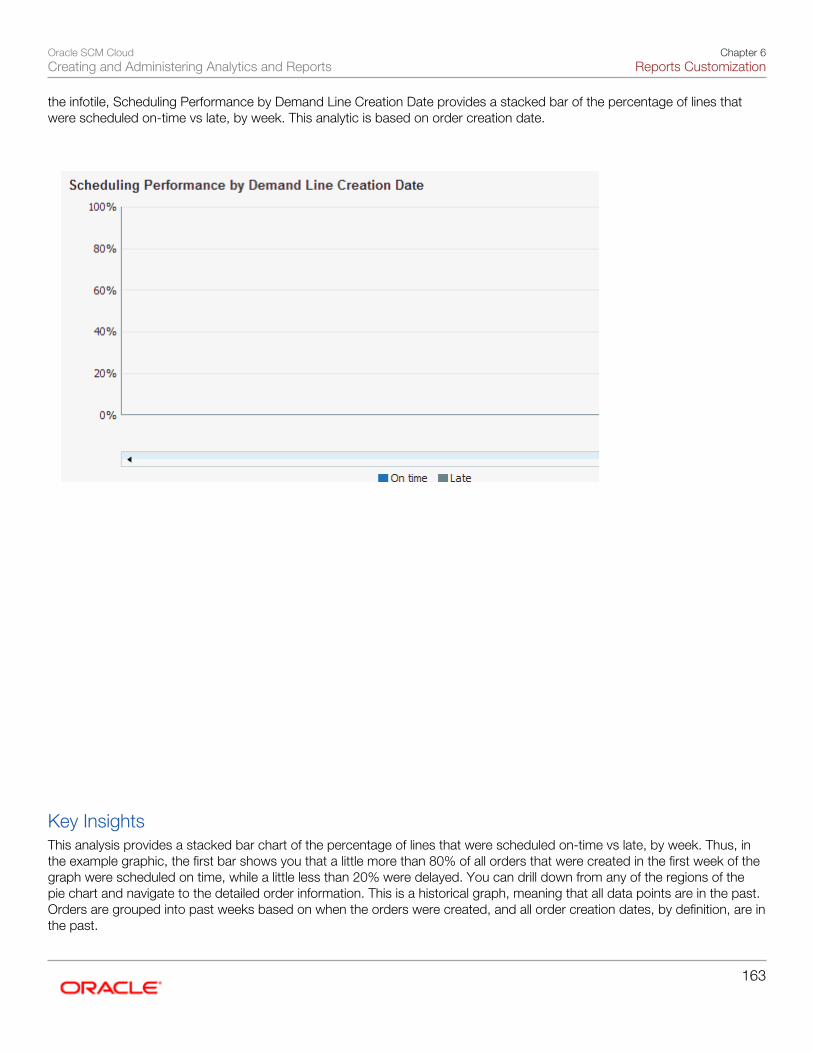
Oracle SCM CloudCreating and Administering Analytics and Reports
Chapter 6Reports Customization
163
the infotile, Scheduling Performance by Demand Line Creation Date provides a stacked bar of the percentage of lines thatwere scheduled on-time vs late, by week. This analytic is based on order creation date.
Key InsightsThis analysis provides a stacked bar chart of the percentage of lines that were scheduled on-time vs late, by week. Thus, inthe example graphic, the first bar shows you that a little more than 80% of all orders that were created in the first week of thegraph were scheduled on time, while a little less than 20% were delayed. You can drill down from any of the regions of thepie chart and navigate to the detailed order information. This is a historical graph, meaning that all data points are in the past.Orders are grouped into past weeks based on when the orders were created, and all order creation dates, by definition, are inthe past.
Oracle SCM CloudCreating and Administering Analytics and Reports
Chapter 6Reports Customization
164
Frequently Asked QuestionsThe following table lists frequently asked questions about this analysis.
FAQ Answer
How do I find this analysis? Order Promising work area - Overview - Schedule Performance infotile - Scheduling
Performance by Demand Line Creation Date
Who uses this analysis?
Order Promising Manager
When do I use this analysis?
When you want to understand overall order promising performance.
What prompts can I use to narrow theresults of this analysis?
None
How do I share this analysis?
This analysis cannot be shared. It is also not relevant for sharing since the data is context-dependent.
What tool do I use to edit this analysis?
This analysis cannot be edited.
Related Topics
• Scheduling Analytics and Briefing Books: Procedure
Number of Demand Lines Scheduled Late
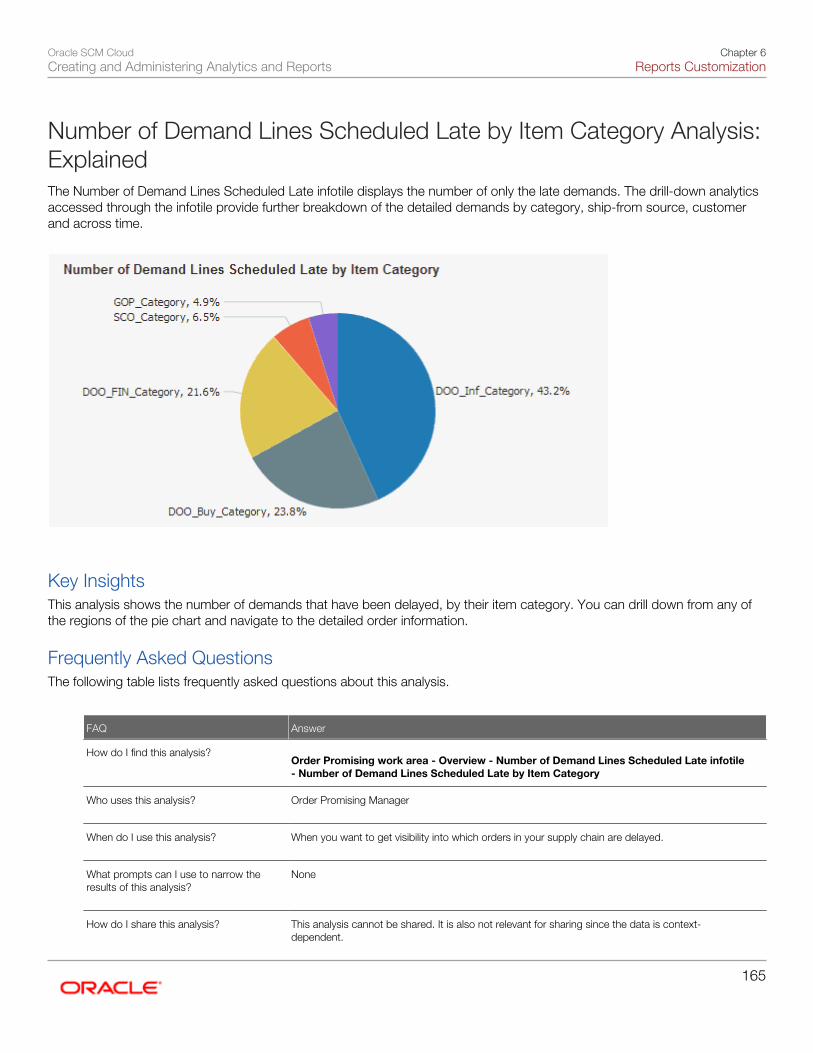
Oracle SCM CloudCreating and Administering Analytics and Reports
Chapter 6Reports Customization
165
Number of Demand Lines Scheduled Late by Item Category Analysis:ExplainedThe Number of Demand Lines Scheduled Late infotile displays the number of only the late demands. The drill-down analyticsaccessed through the infotile provide further breakdown of the detailed demands by category, ship-from source, customerand across time.
Key InsightsThis analysis shows the number of demands that have been delayed, by their item category. You can drill down from any ofthe regions of the pie chart and navigate to the detailed order information.
Frequently Asked QuestionsThe following table lists frequently asked questions about this analysis.
FAQ Answer
How do I find this analysis? Order Promising work area - Overview - Number of Demand Lines Scheduled Late infotile
- Number of Demand Lines Scheduled Late by Item Category
Who uses this analysis?
Order Promising Manager
When do I use this analysis?
When you want to get visibility into which orders in your supply chain are delayed.
What prompts can I use to narrow theresults of this analysis?
None
How do I share this analysis?
This analysis cannot be shared. It is also not relevant for sharing since the data is context-dependent.
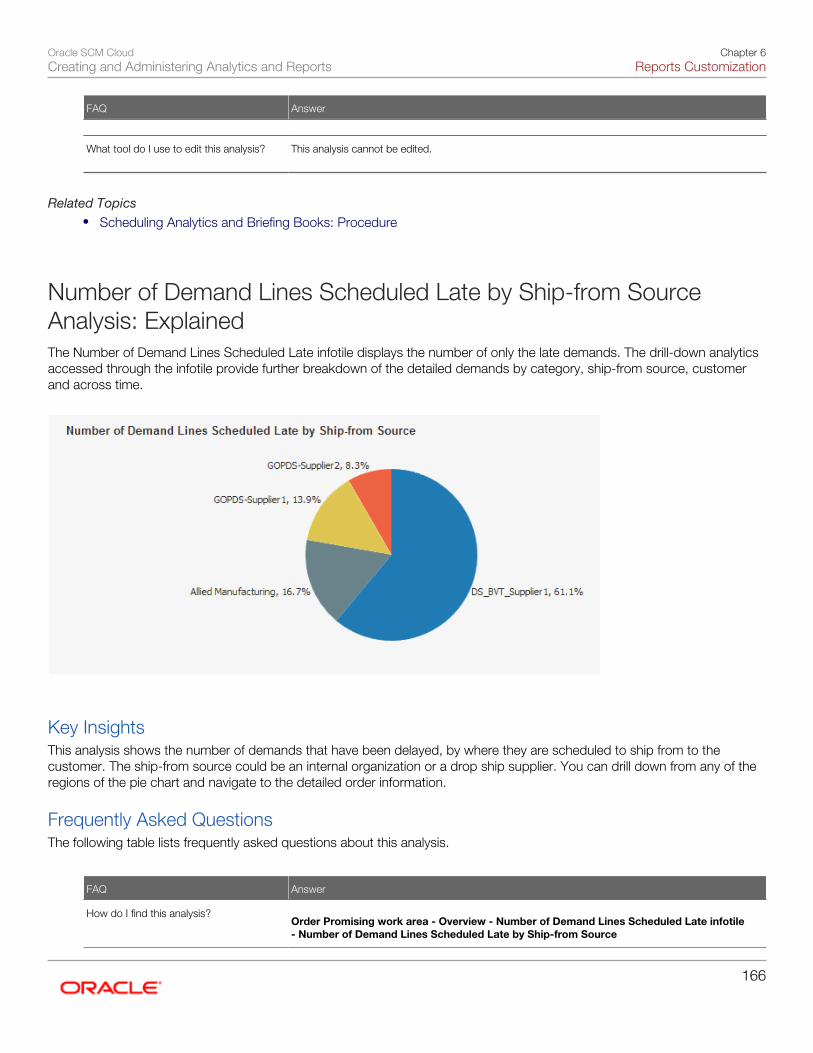
Oracle SCM CloudCreating and Administering Analytics and Reports
Chapter 6Reports Customization
166
FAQ Answer
What tool do I use to edit this analysis?
This analysis cannot be edited.
Related Topics• Scheduling Analytics and Briefing Books: Procedure
Number of Demand Lines Scheduled Late by Ship-from SourceAnalysis: ExplainedThe Number of Demand Lines Scheduled Late infotile displays the number of only the late demands. The drill-down analyticsaccessed through the infotile provide further breakdown of the detailed demands by category, ship-from source, customerand across time.
Key InsightsThis analysis shows the number of demands that have been delayed, by where they are scheduled to ship from to thecustomer. The ship-from source could be an internal organization or a drop ship supplier. You can drill down from any of theregions of the pie chart and navigate to the detailed order information.
Frequently Asked QuestionsThe following table lists frequently asked questions about this analysis.
FAQ Answer
How do I find this analysis? Order Promising work area - Overview - Number of Demand Lines Scheduled Late infotile
- Number of Demand Lines Scheduled Late by Ship-from Source
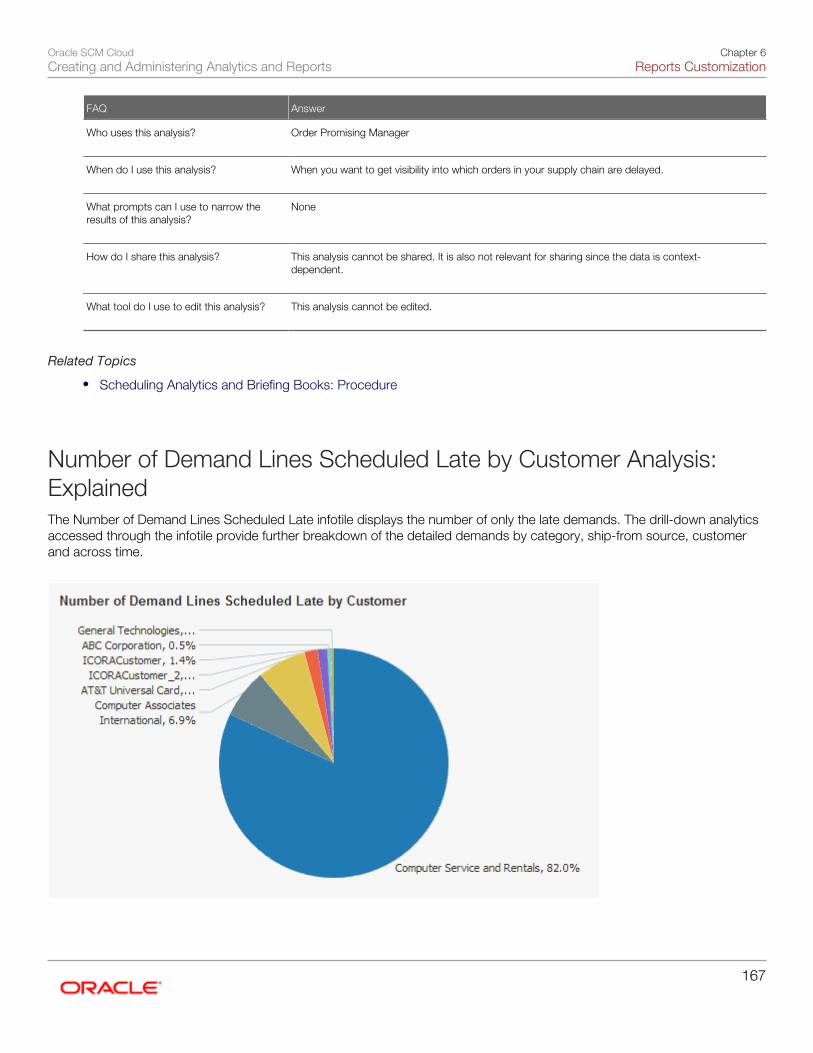
Oracle SCM CloudCreating and Administering Analytics and Reports
Chapter 6Reports Customization
167
FAQ Answer
Who uses this analysis?
Order Promising Manager
When do I use this analysis?
When you want to get visibility into which orders in your supply chain are delayed.
What prompts can I use to narrow theresults of this analysis?
None
How do I share this analysis?
This analysis cannot be shared. It is also not relevant for sharing since the data is context-dependent.
What tool do I use to edit this analysis?
This analysis cannot be edited.
Related Topics
• Scheduling Analytics and Briefing Books: Procedure
Number of Demand Lines Scheduled Late by Customer Analysis:ExplainedThe Number of Demand Lines Scheduled Late infotile displays the number of only the late demands. The drill-down analyticsaccessed through the infotile provide further breakdown of the detailed demands by category, ship-from source, customerand across time.
Oracle SCM CloudCreating and Administering Analytics and Reports
Chapter 6Reports Customization
168
Key InsightsThis analysis shows the number of demands that have been delayed, by customer. You can drill down from any of theregions of the pie chart and navigate to the detailed order information.
Frequently Asked QuestionsThe following table lists frequently asked questions about this analysis.
FAQ Answer
How do I find this analysis? Order Promising work area - Overview - Number of Demand Lines Scheduled Late infotile
- Number of Demand Lines Scheduled Late by Customer
Who uses this analysis?
Order Promising Manager
When do I use this analysis?
When you want to get visibility into which orders in your supply chain are delayed.
What prompts can I use to narrow theresults of this analysis?
None
How do I share this analysis?
This analysis cannot be shared. It is also not relevant for sharing since the data is context-dependent.
What tool do I use to edit this analysis?
This analysis cannot be edited.
Related Topics
• Scheduling Analytics and Briefing Books: Procedure
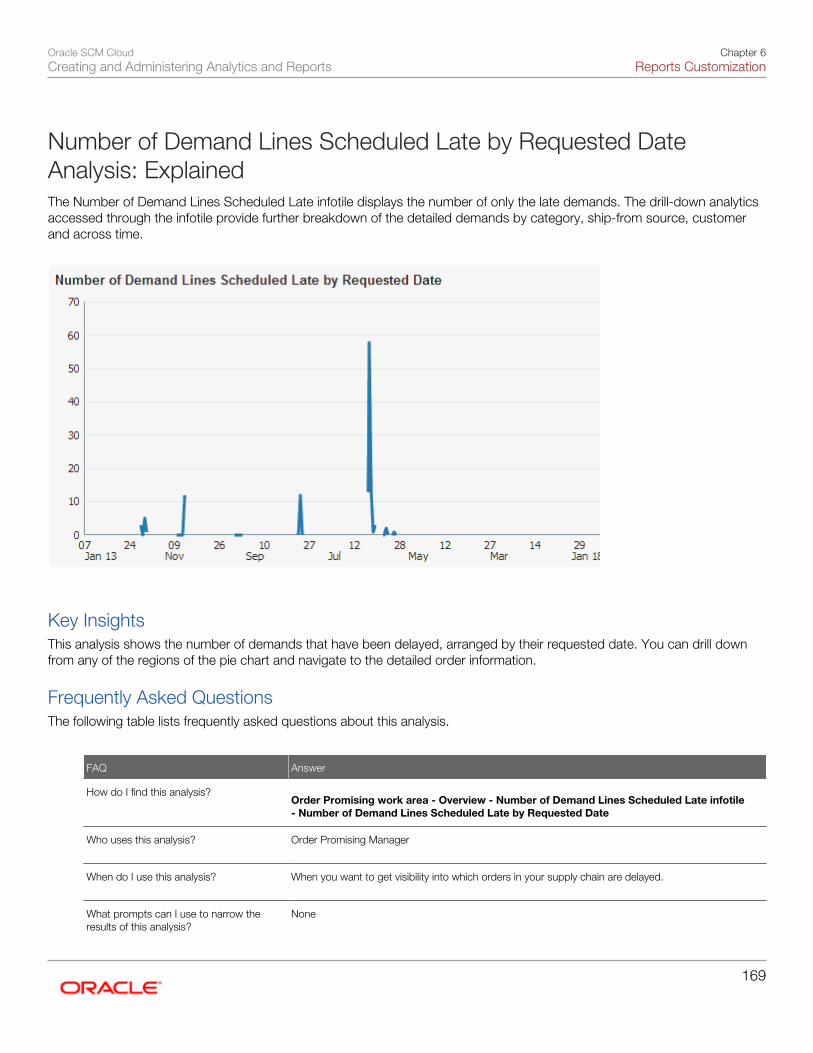
Oracle SCM CloudCreating and Administering Analytics and Reports
Chapter 6Reports Customization
169
Number of Demand Lines Scheduled Late by Requested DateAnalysis: ExplainedThe Number of Demand Lines Scheduled Late infotile displays the number of only the late demands. The drill-down analyticsaccessed through the infotile provide further breakdown of the detailed demands by category, ship-from source, customerand across time.
Key InsightsThis analysis shows the number of demands that have been delayed, arranged by their requested date. You can drill downfrom any of the regions of the pie chart and navigate to the detailed order information.
Frequently Asked QuestionsThe following table lists frequently asked questions about this analysis.
FAQ Answer
How do I find this analysis? Order Promising work area - Overview - Number of Demand Lines Scheduled Late infotile
- Number of Demand Lines Scheduled Late by Requested Date
Who uses this analysis?
Order Promising Manager
When do I use this analysis?
When you want to get visibility into which orders in your supply chain are delayed.
What prompts can I use to narrow theresults of this analysis?
None
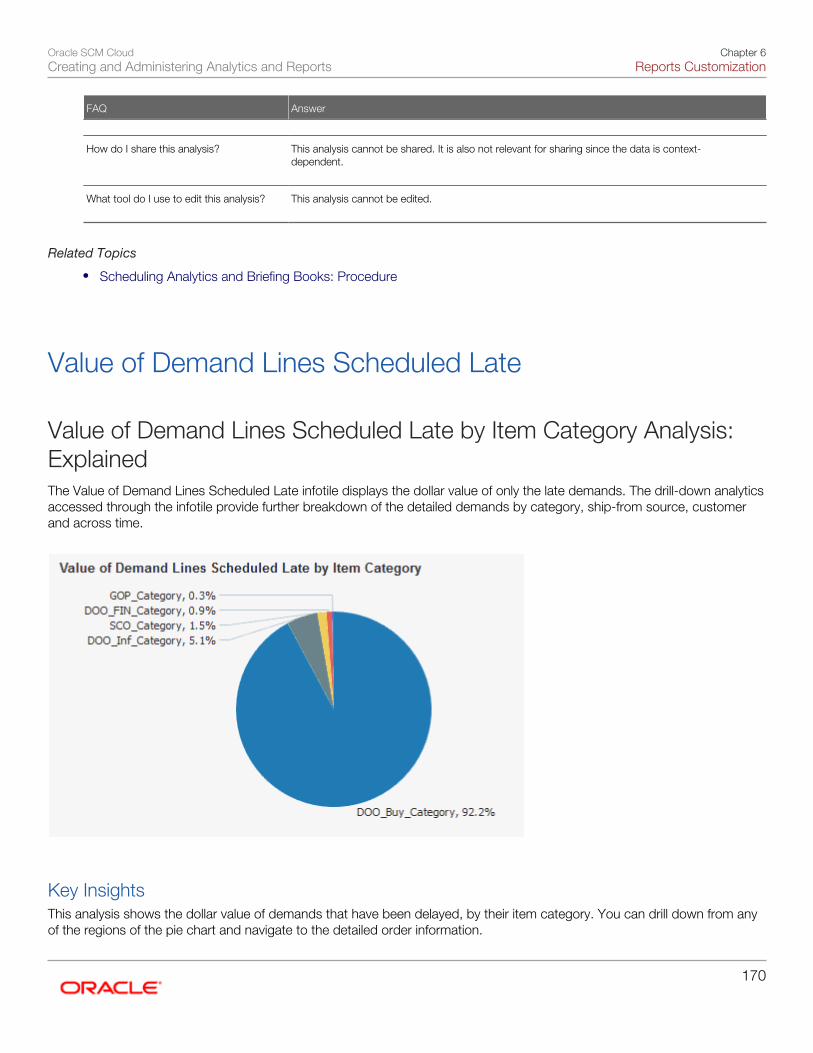
Oracle SCM CloudCreating and Administering Analytics and Reports
Chapter 6Reports Customization
170
FAQ Answer
How do I share this analysis?
This analysis cannot be shared. It is also not relevant for sharing since the data is context-dependent.
What tool do I use to edit this analysis?
This analysis cannot be edited.
Related Topics
• Scheduling Analytics and Briefing Books: Procedure
Value of Demand Lines Scheduled Late
Value of Demand Lines Scheduled Late by Item Category Analysis:ExplainedThe Value of Demand Lines Scheduled Late infotile displays the dollar value of only the late demands. The drill-down analyticsaccessed through the infotile provide further breakdown of the detailed demands by category, ship-from source, customerand across time.
Key InsightsThis analysis shows the dollar value of demands that have been delayed, by their item category. You can drill down from anyof the regions of the pie chart and navigate to the detailed order information.
Oracle SCM CloudCreating and Administering Analytics and Reports
Chapter 6Reports Customization
171
Frequently Asked QuestionsThe following table lists frequently asked questions about this analysis.
FAQ Answer
How do I find this analysis? Order Promising work area - Overview - Value of Demand Lines Scheduled Late infotile -
Value of Demand Lines Scheduled Late by Item Category
Who uses this analysis?
Order Promising Manager
When do I use this analysis?
When you want to get visibility into which orders in your supply chain are delayed, by dollar value.
What prompts can I use to narrow theresults of this analysis?
None
How do I share this analysis?
This analysis cannot be shared. It is also not relevant for sharing since the data is context-dependent.
What tool do I use to edit this analysis?
This analysis cannot be edited.
Related Topics
• Scheduling Analytics and Briefing Books: Procedure
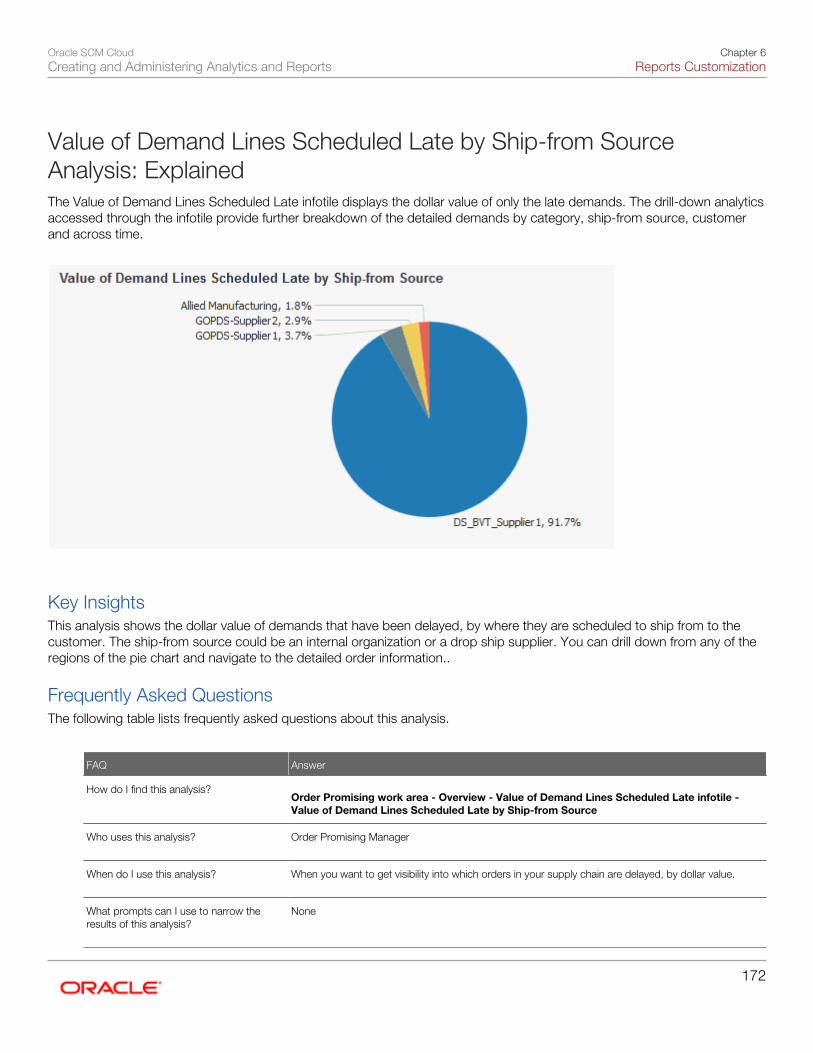
Oracle SCM CloudCreating and Administering Analytics and Reports
Chapter 6Reports Customization
172
Value of Demand Lines Scheduled Late by Ship-from SourceAnalysis: ExplainedThe Value of Demand Lines Scheduled Late infotile displays the dollar value of only the late demands. The drill-down analyticsaccessed through the infotile provide further breakdown of the detailed demands by category, ship-from source, customerand across time.
Key InsightsThis analysis shows the dollar value of demands that have been delayed, by where they are scheduled to ship from to thecustomer. The ship-from source could be an internal organization or a drop ship supplier. You can drill down from any of theregions of the pie chart and navigate to the detailed order information..
Frequently Asked QuestionsThe following table lists frequently asked questions about this analysis.
FAQ Answer
How do I find this analysis? Order Promising work area - Overview - Value of Demand Lines Scheduled Late infotile -
Value of Demand Lines Scheduled Late by Ship-from Source
Who uses this analysis?
Order Promising Manager
When do I use this analysis?
When you want to get visibility into which orders in your supply chain are delayed, by dollar value.
What prompts can I use to narrow theresults of this analysis?
None
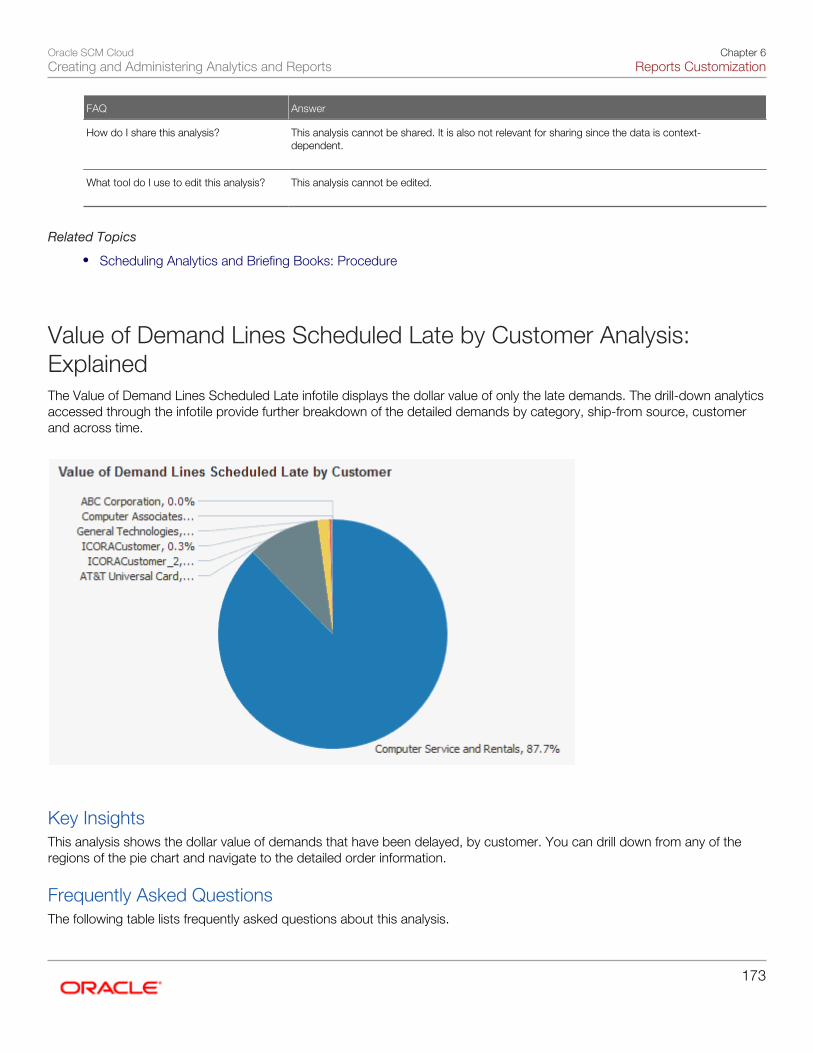
Oracle SCM CloudCreating and Administering Analytics and Reports
Chapter 6Reports Customization
173
FAQ Answer
How do I share this analysis?
This analysis cannot be shared. It is also not relevant for sharing since the data is context-dependent.
What tool do I use to edit this analysis?
This analysis cannot be edited.
Related Topics
• Scheduling Analytics and Briefing Books: Procedure
Value of Demand Lines Scheduled Late by Customer Analysis:ExplainedThe Value of Demand Lines Scheduled Late infotile displays the dollar value of only the late demands. The drill-down analyticsaccessed through the infotile provide further breakdown of the detailed demands by category, ship-from source, customerand across time.
Key InsightsThis analysis shows the dollar value of demands that have been delayed, by customer. You can drill down from any of theregions of the pie chart and navigate to the detailed order information.
Frequently Asked QuestionsThe following table lists frequently asked questions about this analysis.
Oracle SCM CloudCreating and Administering Analytics and Reports
Chapter 6Reports Customization
174
FAQ Answer
How do I find this analysis? Order Promising work area - Overview - Value of Demand Lines Scheduled Late infotile -
Value of Demand Lines Scheduled Late by Customer
Who uses this analysis?
Order Promising Manager
When do I use this analysis?
When you want to get visibility into which orders in your supply chain are delayed, by dollar value.
What prompts can I use to narrow theresults of this analysis?
None
How do I share this analysis?
This analysis cannot be shared. It is also not relevant for sharing since the data is context-dependent.
What tool do I use to edit this analysis?
This analysis cannot be edited.
Related Topics
• Scheduling Analytics and Briefing Books: Procedure
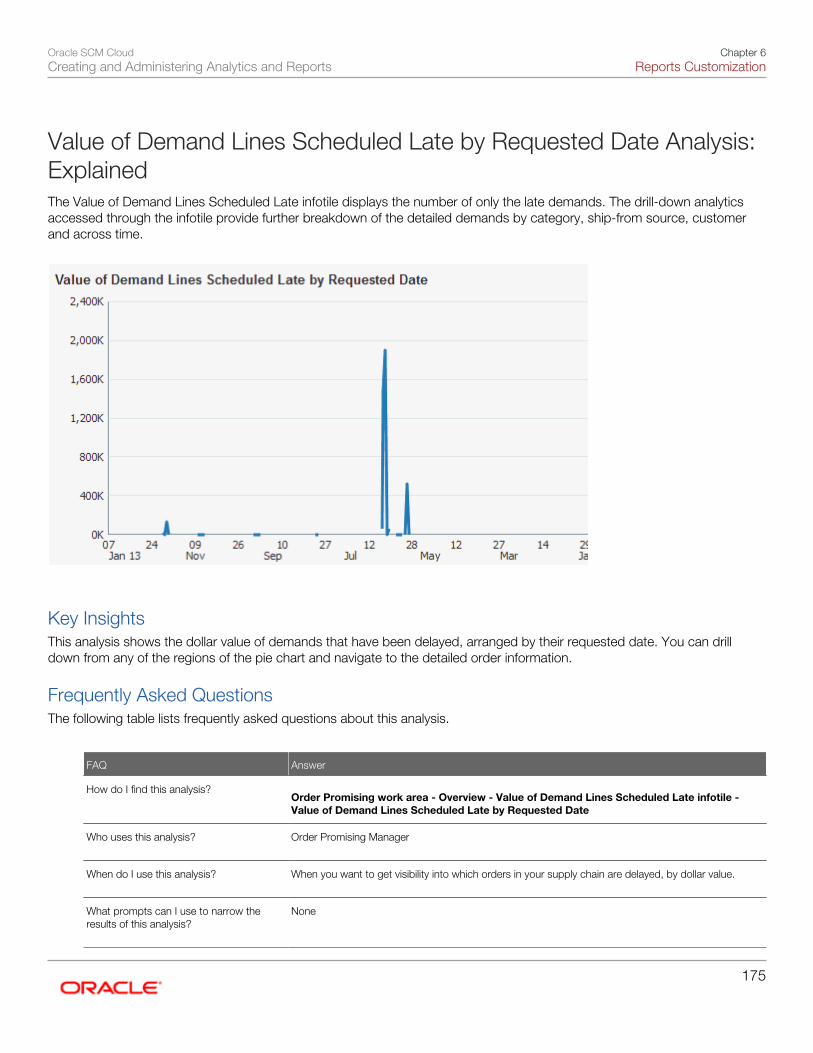
Oracle SCM CloudCreating and Administering Analytics and Reports
Chapter 6Reports Customization
175
Value of Demand Lines Scheduled Late by Requested Date Analysis:ExplainedThe Value of Demand Lines Scheduled Late infotile displays the number of only the late demands. The drill-down analyticsaccessed through the infotile provide further breakdown of the detailed demands by category, ship-from source, customerand across time.
Key InsightsThis analysis shows the dollar value of demands that have been delayed, arranged by their requested date. You can drilldown from any of the regions of the pie chart and navigate to the detailed order information.
Frequently Asked QuestionsThe following table lists frequently asked questions about this analysis.
FAQ Answer
How do I find this analysis? Order Promising work area - Overview - Value of Demand Lines Scheduled Late infotile -
Value of Demand Lines Scheduled Late by Requested Date
Who uses this analysis?
Order Promising Manager
When do I use this analysis?
When you want to get visibility into which orders in your supply chain are delayed, by dollar value.
What prompts can I use to narrow theresults of this analysis?
None
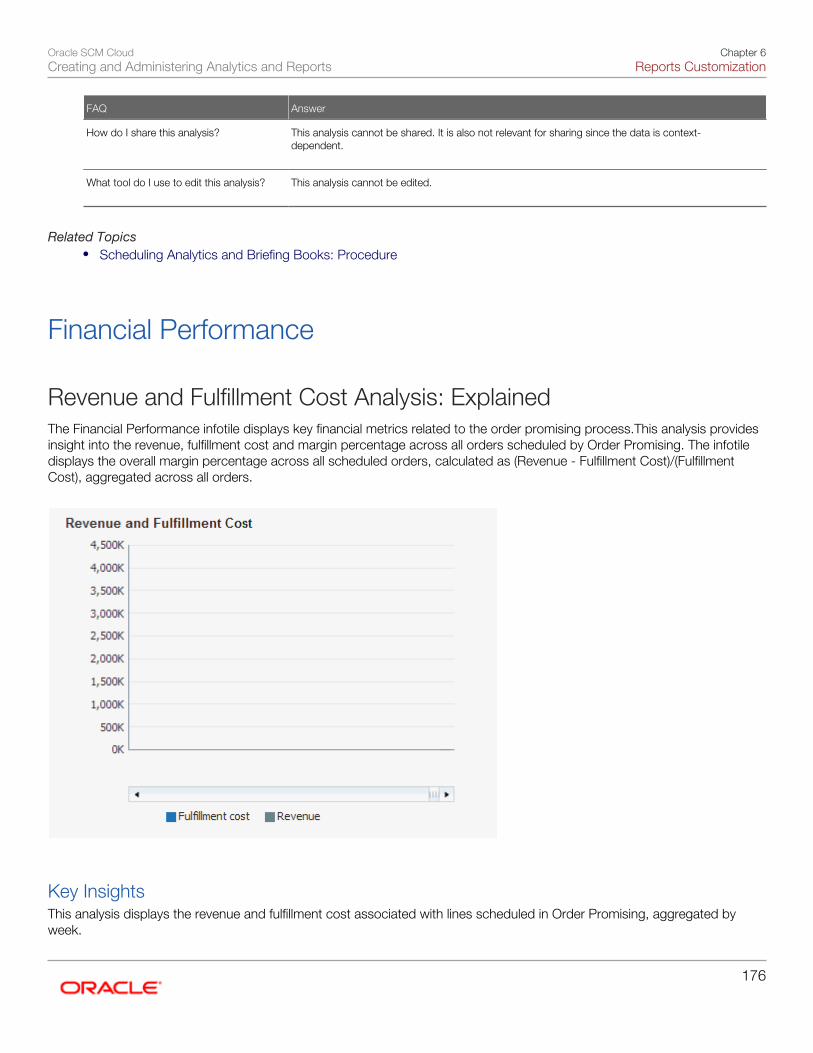
Oracle SCM CloudCreating and Administering Analytics and Reports
Chapter 6Reports Customization
176
FAQ Answer
How do I share this analysis?
This analysis cannot be shared. It is also not relevant for sharing since the data is context-dependent.
What tool do I use to edit this analysis?
This analysis cannot be edited.
Related Topics• Scheduling Analytics and Briefing Books: Procedure
Financial Performance
Revenue and Fulfillment Cost Analysis: ExplainedThe Financial Performance infotile displays key financial metrics related to the order promising process.This analysis providesinsight into the revenue, fulfillment cost and margin percentage across all orders scheduled by Order Promising. The infotiledisplays the overall margin percentage across all scheduled orders, calculated as (Revenue - Fulfillment Cost)/(FulfillmentCost), aggregated across all orders.
Key InsightsThis analysis displays the revenue and fulfillment cost associated with lines scheduled in Order Promising, aggregated byweek.
Oracle SCM CloudCreating and Administering Analytics and Reports
Chapter 6Reports Customization
177
Frequently Asked QuestionsThe following table lists frequently asked questions about this analysis.
FAQ Answer
How do I find this analysis? Order Promising work area - Overview - Financial Performance infotile - Revenue and
Fulfillment Cost
Who uses this analysis?
Order Promising Manager
When do I use this analysis?
When you want to get visibility into the financial performance of the order promising process.
What prompts can I use to narrow theresults of this analysis?
None
How do I share this analysis?
This analysis cannot be shared. It is also not relevant for sharing since the data is context-dependent.
What tool do I use to edit this analysis?
This analysis cannot be edited.
Related Topics
• Scheduling Analytics and Briefing Books: Procedure
Margin Percentage by Schedule Date Analysis: ExplainedThe Financial Performance infotile displays key financial metrics related to the order promising process. This analysisprovides insight into the revenue, fulfillment cost and margin percentage across all orders scheduled by Order Promising. The
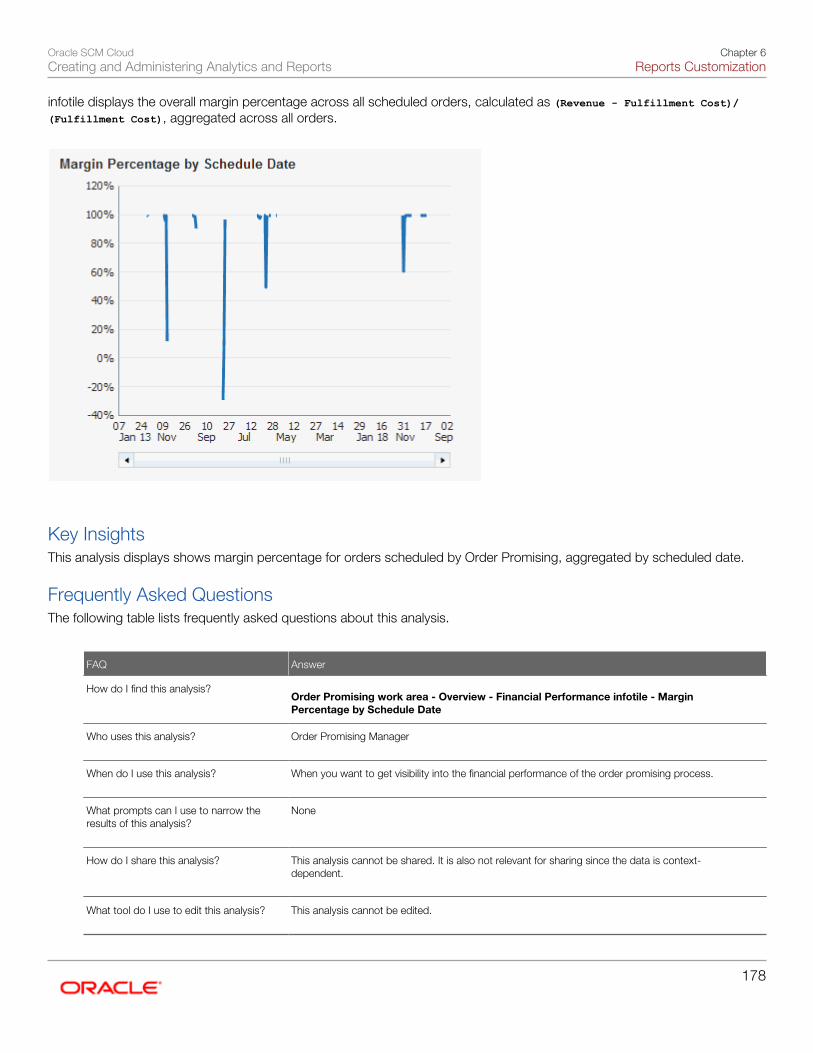
Oracle SCM CloudCreating and Administering Analytics and Reports
Chapter 6Reports Customization
178
infotile displays the overall margin percentage across all scheduled orders, calculated as (Revenue - Fulfillment Cost)/(Fulfillment Cost), aggregated across all orders.
Key InsightsThis analysis displays shows margin percentage for orders scheduled by Order Promising, aggregated by scheduled date.
Frequently Asked QuestionsThe following table lists frequently asked questions about this analysis.
FAQ Answer
How do I find this analysis? Order Promising work area - Overview - Financial Performance infotile - Margin
Percentage by Schedule Date
Who uses this analysis?
Order Promising Manager
When do I use this analysis?
When you want to get visibility into the financial performance of the order promising process.
What prompts can I use to narrow theresults of this analysis?
None
How do I share this analysis?
This analysis cannot be shared. It is also not relevant for sharing since the data is context-dependent.
What tool do I use to edit this analysis?
This analysis cannot be edited.

Oracle SCM CloudCreating and Administering Analytics and Reports
Chapter 6Reports Customization
179
Related Topics
• Scheduling Analytics and Briefing Books: Procedure
Manufacturing Reports
Work Definition Report: ExplainedThe Work Definition Report enables you to review work definition operations including materials and resources. The report isconfigured by default to print in a format most suitable for a contract manufacturer such as printing only milestone operations.
Frequently Asked QuestionsThe following table lists frequently asked questions about this report.
FAQ Answer
How do I find this report? Work Definition work area - Overview page - Tasks panel - Print Work Definition Report
OR
Manage Work Definitions page - Select work definition - Print Work Definition Report
Who uses this report?
Manufacturing Engineer
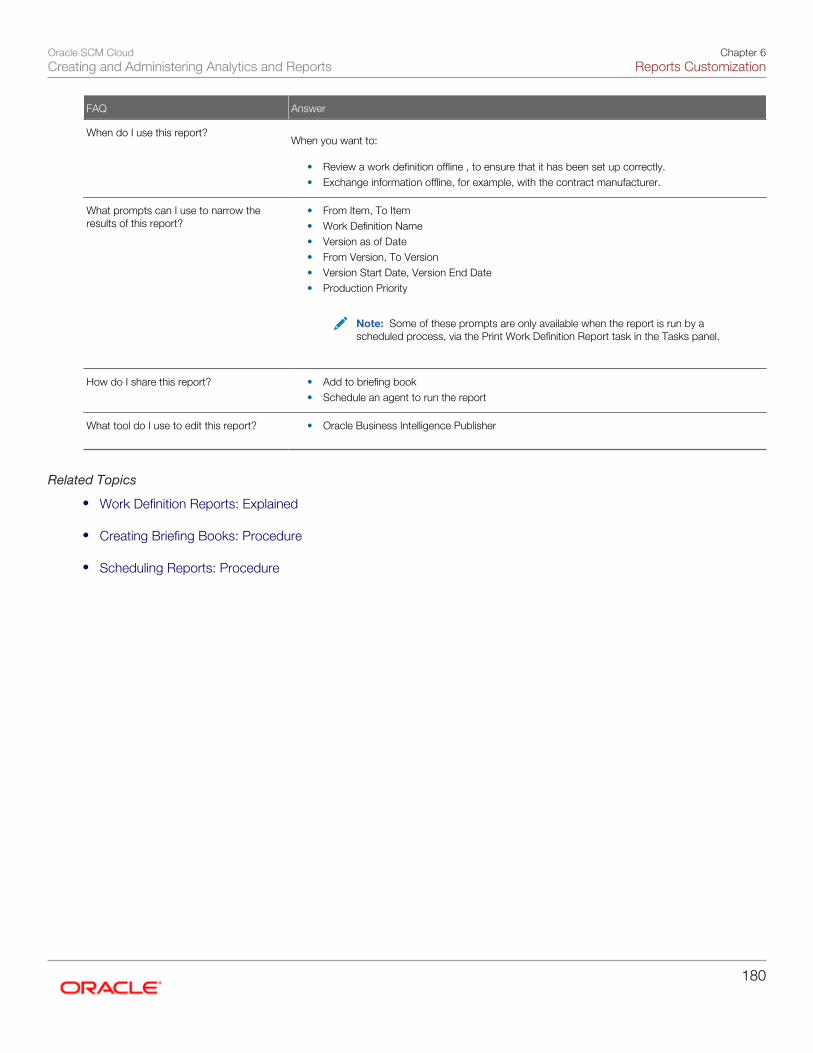
Oracle SCM CloudCreating and Administering Analytics and Reports
Chapter 6Reports Customization
180
FAQ Answer
When do I use this report? When you want to:
• Review a work definition offline , to ensure that it has been set up correctly.• Exchange information offline, for example, with the contract manufacturer.
What prompts can I use to narrow theresults of this report?
• From Item, To Item• Work Definition Name• Version as of Date• From Version, To Version• Version Start Date, Version End Date• Production Priority
Note: Some of these prompts are only available when the report is run by ascheduled process, via the Print Work Definition Report task in the Tasks panel.
How do I share this report?
• Add to briefing book• Schedule an agent to run the report
What tool do I use to edit this report?
• Oracle Business Intelligence Publisher
Related Topics
• Work Definition Reports: Explained
• Creating Briefing Books: Procedure
• Scheduling Reports: Procedure
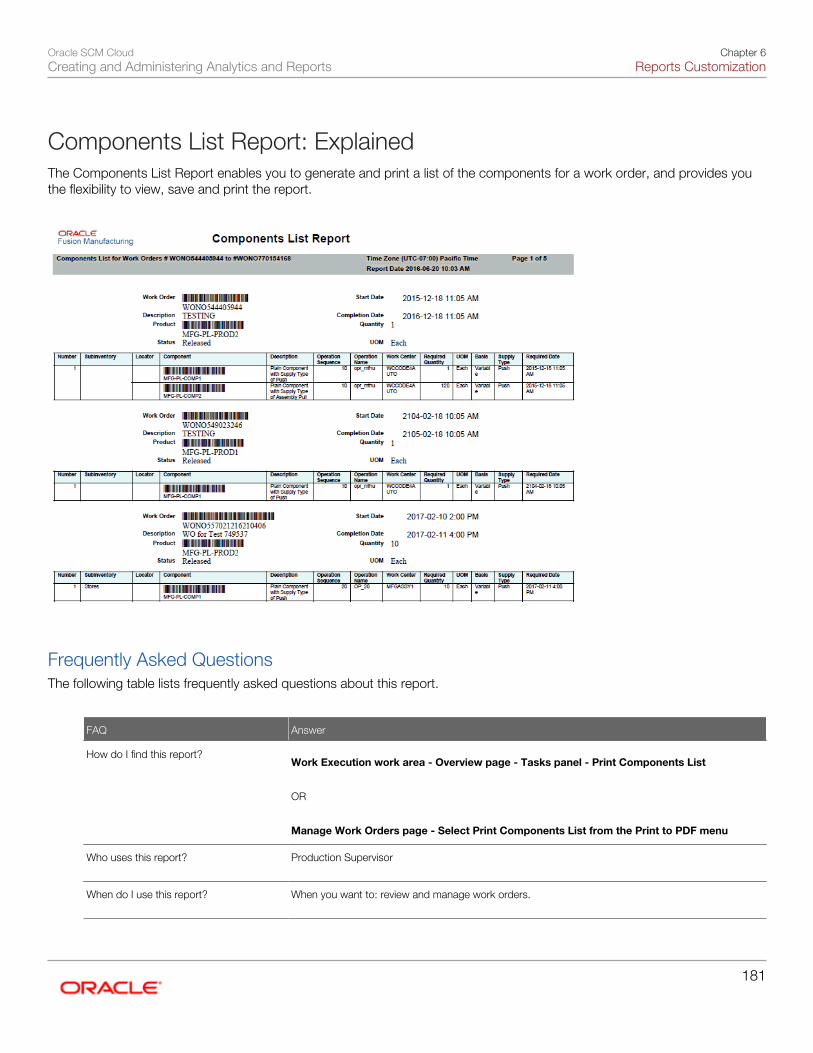
Oracle SCM CloudCreating and Administering Analytics and Reports
Chapter 6Reports Customization
181
Components List Report: ExplainedThe Components List Report enables you to generate and print a list of the components for a work order, and provides youthe flexibility to view, save and print the report.
Frequently Asked QuestionsThe following table lists frequently asked questions about this report.
FAQ Answer
How do I find this report? Work Execution work area - Overview page - Tasks panel - Print Components List
OR
Manage Work Orders page - Select Print Components List from the Print to PDF menu
Who uses this report?
Production Supervisor
When do I use this report?
When you want to: review and manage work orders.
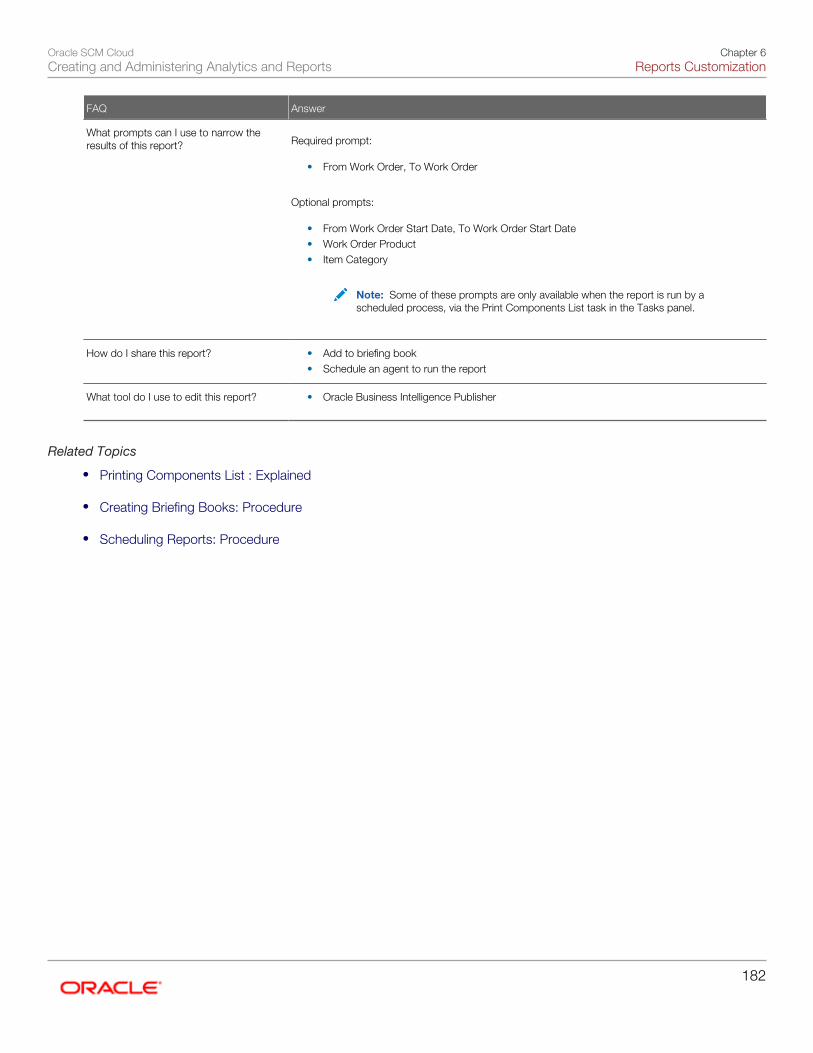
Oracle SCM CloudCreating and Administering Analytics and Reports
Chapter 6Reports Customization
182
FAQ Answer
What prompts can I use to narrow theresults of this report?
Required prompt:
• From Work Order, To Work Order
Optional prompts:
• From Work Order Start Date, To Work Order Start Date• Work Order Product• Item Category
Note: Some of these prompts are only available when the report is run by ascheduled process, via the Print Components List task in the Tasks panel.
How do I share this report?
• Add to briefing book• Schedule an agent to run the report
What tool do I use to edit this report?
• Oracle Business Intelligence Publisher
Related Topics
• Printing Components List : Explained
• Creating Briefing Books: Procedure
• Scheduling Reports: Procedure
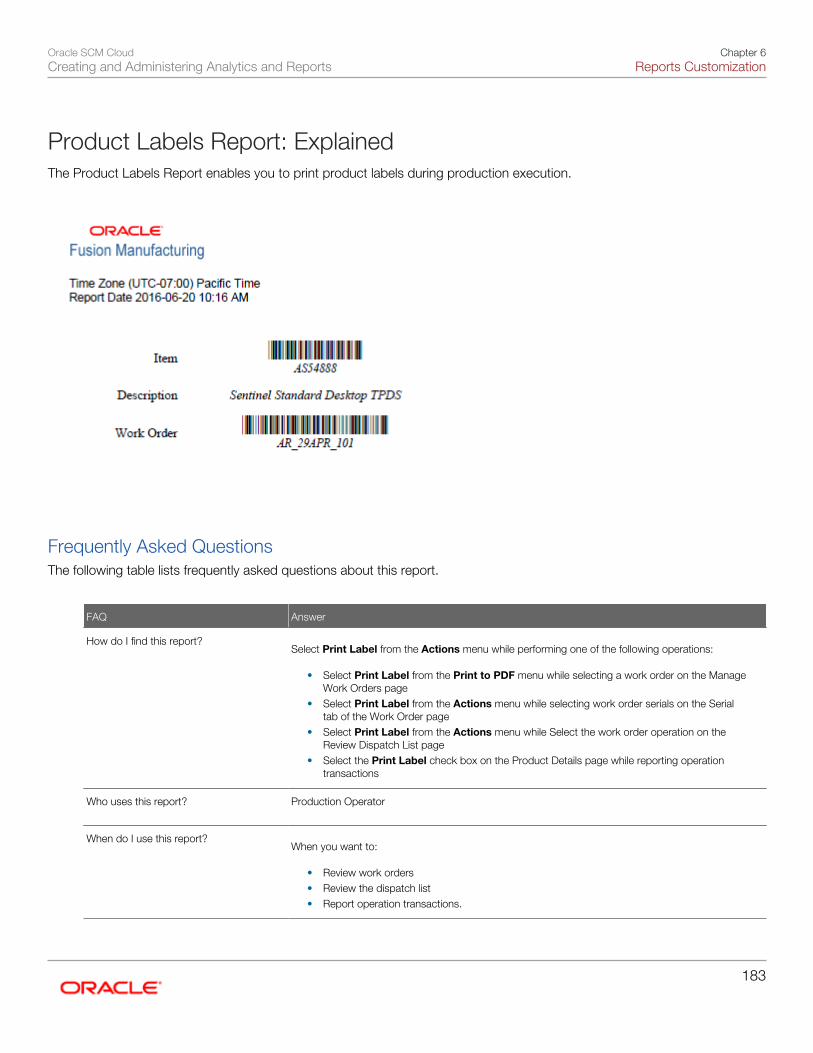
Oracle SCM CloudCreating and Administering Analytics and Reports
Chapter 6Reports Customization
183
Product Labels Report: ExplainedThe Product Labels Report enables you to print product labels during production execution.
Frequently Asked QuestionsThe following table lists frequently asked questions about this report.
FAQ Answer
How do I find this report? Select Print Label from the Actions menu while performing one of the following operations:
• Select Print Label from the Print to PDF menu while selecting a work order on the ManageWork Orders page
• Select Print Label from the Actions menu while selecting work order serials on the Serialtab of the Work Order page
• Select Print Label from the Actions menu while Select the work order operation on theReview Dispatch List page
• Select the Print Label check box on the Product Details page while reporting operationtransactions
Who uses this report?
Production Operator
When do I use this report? When you want to:
• Review work orders• Review the dispatch list• Report operation transactions.
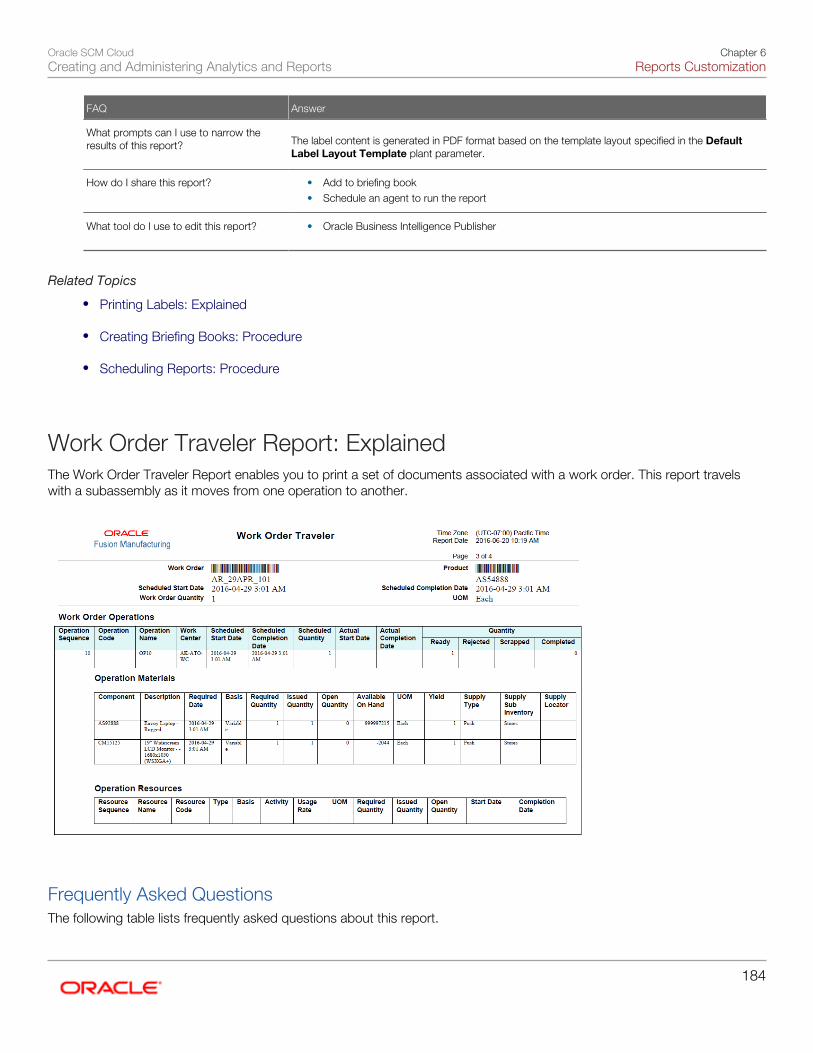
Oracle SCM CloudCreating and Administering Analytics and Reports
Chapter 6Reports Customization
184
FAQ Answer
What prompts can I use to narrow theresults of this report?
The label content is generated in PDF format based on the template layout specified in the DefaultLabel Layout Template plant parameter.
How do I share this report?
• Add to briefing book• Schedule an agent to run the report
What tool do I use to edit this report?
• Oracle Business Intelligence Publisher
Related Topics
• Printing Labels: Explained
• Creating Briefing Books: Procedure
• Scheduling Reports: Procedure
Work Order Traveler Report: ExplainedThe Work Order Traveler Report enables you to print a set of documents associated with a work order. This report travelswith a subassembly as it moves from one operation to another.
Frequently Asked QuestionsThe following table lists frequently asked questions about this report.
Oracle SCM CloudCreating and Administering Analytics and Reports
Chapter 6Reports Customization
185
FAQ Answer
How do I find this report? Using this option, you can print travelers for multiple work orders. Also, you can schedule the
printing as required:Work Execution work area - Overview page - Tasks panel - Print WorkOrder Traveler
OR
Manage Work Orders page - Select work definition - Select a row - Select Print WorkOrder Traveler from the Print to PDF menu
OR
Work Execution work area - Overview page - Tasks panel - Review Dispatch List - Select arow in the dispatch list - Print Work Order Traveler
Who uses this report?
Production Supervisor, Production Operator
When do I use this report?
When you want to print the work order traveler during production execution.
What prompts can I use to narrow theresults of this report?
These prompts are required only if the traveler is printed by clicking Print Work Order Travelerfrom the tasks menu on overview page:
• From Work Order, To Work Order• From Work Order Start Date, To Work Order Start Date• Work Order Product• Work Order Type• Work Order Status• Item Category
There is also an option to include attachments, which can be unchecked if needed.
How do I share this report?
• Add to briefing book• Schedule an agent to run the report
What tool do I use to edit this report?
• Oracle Business Intelligence Publisher
Related Topics
• Printing Work Order Traveler: Explained
• Creating Briefing Books: Procedure
• Scheduling Reports: Procedure

Oracle SCM CloudCreating and Administering Analytics and Reports
Chapter 6Reports Customization
186
Oracle SCM CloudCreating and Administering Analytics and Reports
Chapter 7Analytics and Reports Management
187
7 Analytics and Reports Management
Managing Folders
Creating Folders: ProcedureYou manage analyses and reports in the business intelligence catalog, where you create folders to organize them.
Creating FoldersFollow these steps:
1. In the catalog, navigate to the desired location of the new folder in the Folders pane.2. In the catalog toolbar, click New, and select Folder.3. In the New Folder dialog box, enter the folder name, and click OK.
Addressing Automatically Created Folders
If conflicts are detected during upgrade, folders named backup_nnn are automatically created in the catalog. After reviewingand resolving any conflicts, Oracle recommends that you manually delete the backup folders from the catalog. You cancontact your help desk to request an automated removal if you have a large number of folders to delete.
Setting Folder Permissions and Attributes: ProcedureBusiness intelligence catalog folder properties control folder permissions and other attributes. You can access the propertiesof any object or folder in the catalog to perform tasks such as viewing system information or changing attributes orownership. All other users can only access and modify the properties of the objects that they create or own.
Setting Folder PropertiesFollow these steps:
1. In the catalog, select the folder you want to assign properties to.2. In the Tasks pane, click Properties.3. In the Properties dialog box, select any of the options in the Attributes section:
◦ Hidden: Specifies that the object is hidden.
◦ System: Specifies that the object is a system object.
◦ Read Only: Specifies that the object is read-only.
◦ Do Not Index: Excludes the object from the index used by the full-text catalog search. Excluded objects donot display in the results of any full-text catalog search; the object can still be found using the basic catalogsearch.
Oracle SCM CloudCreating and Administering Analytics and Reports
Chapter 7Analytics and Reports Management
188
4. Use the Ownership section to take ownership of a folder or object in the catalog. This area displays only if the properprivileges were assigned to the user, group, or role. Note that the owner of an object or folder can't automaticallyaccess the object or folder.
◦ Set ownership of this item: Click to become the owner of the folder or object.
◦ Set ownership of this item and all sub items: Click to become the owner of the folder and any sub folders orsub items contained within the item. For example, if you click this link for a dashboard folder, then you takeownership of all of the dashboard's components.
Setting Folder Permissions: ProcedureYou can assign permissions on folders and other objects.
Accessing and Setting PermissionsYou can set permissions or change ownership for any catalog object or folder. Nonadministrative users can access andmodify the permissions of the objects that they create or own.
To set folder permissions:
1. In the catalog, select the folder or object.2. In the Tasks pane click Permissions.3. In the Permissions dialog box, the owner and any other users, roles, or groups with permissions are listed in the
Permissions list. To add a user or role, click Add users/roles in the toolbar and search for users or roles to addthem to the Selected Members list in the Add Application Roles, Catalog Groups and Users dialog box. To delete auser or role, select the account or role in the Permissions list and click Delete selected users/roles.
4. In the Permissions list, to set ownership for a user, select Custom in the Permissions drop-down list for the account,then select Set Ownership in the Custom Permissions dialog box and click OK. You can also select the Owneroption for the user or role.
5. Use the Permissions drop-down to set permissions for the object. Object permissions vary by object.6. Use the Apply permissions to sub-folders option to assign permissions to the folder's subfolders, and the Apply
permissions to items within a folder to assign them to objects in the folder but not to subfolders.
Using Briefing Books
Creating Briefing Books: ProcedureA briefing book is a collection of updatable or static analyses or dashboard pages (which can contain reports). The staticsnapshots give you a picture of what's going on at the time that the analysis or dashboard page is added to the briefingbook. You can download briefing books as PDF or MHTML for viewing or printing, and share them with others. The PDF fileincludes a table of contents for the book. Like analytics and reports, briefing books are stored in the business intelligence (BI)catalog.
Adding Content to New Briefing BooksFollow these steps:
1. Open the Reports and Analytics work area, or the Reports and Analytics pane if available in other work areas.2. Click the Browse Catalog button.3. Select your analysis, then click More and select Add to Briefing Book.
Oracle SCM CloudCreating and Administering Analytics and Reports
Chapter 7Analytics and Reports Management
189
Or, find your dashboard and click Open.
a. Go to the dashboard page you want to add.b. Click the Page Options button and select Add to Briefing Book.
4. Indicate if you want the analysis or dashboard results to change (Updatable) or not (Snapshot) whenever thebriefing book is downloaded or rerun.
5. Click Browse.6. Name your briefing book and save it in My Folders.
Adding Content to Existing Briefing BooksFollow these steps:
1. Open the Reports and Analytics work area, or the Reports and Analytics pane if available in other work areas.2. Click Browse Catalog.3. Select your analysis, then click More and select Add to Briefing Book.
Or, find your dashboard and click Open.
a. Go to the dashboard page you want to add.b. Click the Page Options button and select Add to Briefing Book.
4. Indicate if you want the analysis or dashboard results to change (Updatable) or not (Snapshot) whenever thebriefing book is downloaded or rerun.
Downloading and Editing Briefing BooksFollow these steps:
1. Open the Reports and Analytics work area, or the Reports and Analytics pane if available in other work areas.2. Click Browse Catalog to locate your briefing book.
You can find briefing books only in the BI catalog.
Related Topics• Reports and Analytics Pane: Explained
Scheduling Analytics and Reports
Setting Reports Up to Run as Scheduled Processes: Points toConsiderYou can create a job definition for predefined or custom reports so that users can run them as scheduled processes. Use theDefine Custom Enterprise Scheduler Jobs task in the Setup and Maintenance work area to create job definitions. Otherwise,users can open reports (which are set up to be run online) through the Reports and Analytics pane, or open and schedulethem from the business intelligence catalog.
General Job Definition InformationThis table describes the general information to enter for your job definition.
Oracle SCM CloudCreating and Administering Analytics and Reports
Chapter 7Analytics and Reports Management
190
Field What You Enter
Job Type
BIPJobType
Report ID
The path to the report in the catalog, starting with the folder beneath Shared Folders, for example:Custom/ <Family Name>/ <Product Name>/<Report File Name>.xdo. Make sure to include the .xdo extension for the report definition.
Default Output
A default output format.
ParametersYou can define parameters to be available to users when they submit scheduled processes based on your job definition.When users run the scheduled process, the values they enter for the parameters:
• Are passed to the data model that the report is using.
• Determine the data to be included in the report.
The parameters that you define must be in the same order as parameters in the data model. For example, the data model hasparameters in this order:
• P_START_DATE
• P_END_DATE
• P_CURRENCY
You create parameters as follows:
• Start Date
• End Date
• Currency
Note: Because you define parameters using the list of values sources from the Define Custom EnterpriseScheduler Jobs task, you should not define lists of values in the data model.
User PropertyThe only user property you need to define is EXT_PortletContainerWebModule. Only lists of values associated with theapplication that you select are made available for parameters in this job definition.
Related Topics
• Managing Job Definitions: Highlights
• Managing List of Values Sources: Highlights
• Customizing Data Models: Procedure
• Creating Custom Reports: Procedure
Oracle SCM CloudCreating and Administering Analytics and Reports
Chapter 7Analytics and Reports Management
191
Setting Reports Up for Scheduling in the Reports and Analytics Pane:ProcedureYou can set up reports as scheduled processes, which means users can submit them from the Scheduled Processes andother work areas. If you want users to also submit these scheduled processes from the Reports and Analytics pane, then youmust configure properties for the corresponding reports.
Enabling a Report for SchedulingTo enable scheduling in the Reports and Analytics pane:
1. Select the report in the business intelligence catalog and click Edit.2. Click Properties.3. On the General tab in the Properties dialog box, enter the following fields:
Field Value
Enterprise Scheduler Job PackageName
The path for the job definition, for example: / oracle/ apps/ ess/<product family>/ <product>/<business area>/ Jobs
Enterprise Scheduler Job DefinitionName
The job definition name (not display name), for example: ABCDEFG
Related Topics
• Setting Up the Reports and Analytics Pane: Procedure
• Accessing Report Components to Customize: Points to Consider
Scheduling Analytics and Briefing Books: ProcedureAnalytics and briefing books can run based on a schedule that you define. You can set up other automated tasks, forexample to deliver results to specific recipients or send notifications. You create what's called an agent to set this all up for ananalysis, dashboard, or briefing book. The agent itself is saved as an object in the business intelligence (BI) catalog.
Creating an Agent
1. Open the Reports and Analytics work area, or the Reports and Analytics pane if available in other work areas.2. Click the Browse Catalog button.3. Click New and select Agent under Actionable Intelligence.4. Ensure that you enter information on the Delivery Content tab to specify the analysis, dashboard, or briefing book to
run.5. Save the agent in My Folders.
Note: To edit an agent, browse the BI catalog to find the agent.
Oracle SCM CloudCreating and Administering Analytics and Reports
Chapter 7Analytics and Reports Management
192
Related Topics
• Reports and Analytics Pane: Explained
Scheduling Reports: ProcedureReports can run based on a schedule that you define. You can set up other automated tasks, for example to deliver results tospecific recipients or send notifications. You submit a report with the schedule and criteria for other automated tasks defined.
If a report is set up as a scheduled process, you submit the process as you would any scheduled process. You can schedulethem from:
• Any work area where there's a link to the report.
• The Scheduled Processes work area, where you can submit all processes that you have access to.
• The Reports and Analytics work area or pane, if the report is set up for submission from there.
Submitting a Report or Scheduled ProcessFollow these steps:
1. Open the Reports and Analytics work area, or the Reports and Analytics pane if available in other work areas whereyou can find the report.
2. Click the name of your report.3. Click Schedule if the option is there. The report is set up as a scheduled process.
a. Enter any parameters to avoid unnecessarily large results.b. Click Advanced to enter a schedule, deliver results to a specific destination (including e-mail or printer), or
define criteria for sending notifications.4. If you don't see Schedule, then click View.
a. Click the Actions button for the report and select Schedule.b. Enter information similar to step 3.
Related Topics
• Scheduled Processes: Explained
• Reports and Analytics Pane: Explained
• Managing Scheduled Processes That You Submitted: Points to Consider
• Submitting Scheduled Processes and Process Sets: Procedure
Adding Analyses to Application Pages
Oracle SCM CloudCreating and Administering Analytics and Reports
Chapter 7Analytics and Reports Management
193
Adding an Analysis to the Concepts Details Dashboard: WorkedExampleThis example shows how to add an analysis to the Supply Chain Management Concepts Details dashboard. You can addanalyses to many pages that you can personalize or customize.
Caution: Make sure that the analysis isn't querying against a large volume of records. If it is, then the page cantake a long time to open after you add the analysis.
The following table summarizes key decisions for this scenario.
Decisions to Consider In This Example
Which analysis do you want to add?
Concepts with most Related Ideas Ensure that the analysis isn't querying against a large volume ofrecords. If it is, then the dashboard can take a long time to open afteryou add the analysis.
Do you have to change the layout of the page?
Yes, to a two-column layout that is wider on the right side. Theone- or two-column layout gives enough space to properly displayanalyses.
Do you want all or only one view of the analysis?
All views.
Are these changes for you only, or for all users of the Concepts Detailsdashboard?
You only.
Adding an Analysis1. Open the Concepts Details dashboard.2. Click your name in the global header and select Edit Current Page.3. Click Change Layout and select Two columns, narrow left.4. Click Add Content for the wider column.
The Reports and Analytics folder in the Add Content dialog box contains what's in the BI catalog.5. Click through the folders in the catalog until you see the name of the analysis, and click Add to include all views of
the analysis.
If you instead click Open or Concepts with most Related Ideas, you can select a specific view to add.6. Click Close after you see the analysis added to the top of the wider column on the dashboard.7. Click Save and then Close.
Oracle SCM CloudCreating and Administering Analytics and Reports
Chapter 7Analytics and Reports Management
194
Oracle SCM CloudCreating and Administering Analytics and Reports
Chapter 8Maintenance and Migration
195
8 Maintenance and Migration
Performance Tuning for Analytics and Reports: Points toConsiderWhen you create analytics and reports, don't use blind queries and include sufficient filters when creating analytics or reportswith hierarchies.
Blind QueriesAvoid blind queries because they are performed without filters and therefore fetch large data sets. Performance could bean issue with these queries and can easily overload the application. All Transactional Business Intelligence queries on largetransaction tables must be time bound. For example, include a time dimension filter and additional filters to restrict by keydimensions such as worker. In addition, apply filters to columns that have database indexes in the transaction tables. Thisensures a good execution plan is generated for the Business Intelligence query.
Hierarchies and Trees in Transactional Business IntelligenceQueries on trees and hierarchical dimensions such as manager can have an impact on performance. Transactional BusinessIntelligence uses a column-flattening approach to quickly fetch data for a specific node in the hierarchy. Still, because thereis no pre-aggregation for the different levels of the hierarchy, carefully craft any query involving hierarchies to ensure thatsufficient filters are applied to keep the result set small.
Reviewing SQL Statements Used in Analyses: ProcedureYou can review the SQL statement using either of the following procedures.
Using Analysis in Edit Mode
1. Open the analysis in Edit mode and click the Advanced tab.2. In the SQL Issued section, review the logical SQL statement.
Using Administration Page
1. On the Administration page, in the Session Management section, click the Manage Sessions link.
Note: You must be a Business Intelligence Administrator to access the Administration and ManageSessions page.
2. On the Manage Sessions page, in the Action column, click the View Log link to review the SQL statement.
Oracle SCM CloudCreating and Administering Analytics and Reports
Chapter 8Maintenance and Migration
196
Moving Analyses and Reports: ProcedureYou can archive to bundle the entire catalog, specific folders, or multi component objects as a .catalog file and uploadthe .catalog file to unarchive the data to another location in the catalog. Use the archive process to transfer specific dataacross environments, for example from a development environment to a production environment.
Creating an Archive
To create an archive file:
1. Locate the object in the catalog.2. Select More and then select Archive.3. In the Archive dialog box, select one or more of the following options:
◦ Keep Permissions: Maintain the object or folder's existing permissions. If you do not select this option, thenthe archiving process does not include any permissions. Upon unarchiving, the parent folder's permissions areassigned to all of the objects and folders.
◦ Keep Time stamps: Maintain the Creation Time, Last Modified, and Last Accessed times assigned to theobject or folder. Upon unarchiving, the LastModified time is updated to indicate the time at which the objector folder is unarchived. If you select this option, the Old option in the Paste Overview area of the Preferencesdialog box is available when unarchiving. You use the Old option to overwrite existing catalog items that areolder than the catalog items in the archive.If you do not select this option, then the archiving process does not include time information and the Oldoption in the Paste Overview area of the Preferences dialog box is not available.
4. Click OK to download the archive file.
Moving a File to a New Location
To unarchive a file:
1. Select the folder in the catalog where you want to upload the archived file.2. In the Tasks pane click Unarchive.3. In the Unarchive dialog box, browse for and select the archive file.4. Use the Replace option to specify whether to replace an existing folder or object with the same name.
◦ All: Select this option to replace any existing folders or objects with the same names as folders or objectsincluded in the archive file that you are uploading.
◦ Old: Select this option to replace folders or objects except those folders or objects that exist, unless they areolder than the source.
◦ None: Select this option to add any new folders or objects, but preserve any existing folders or objects.
◦ Force: Select this option to add and replace all folders or objects.
5. Use the ACL option to specify how the folders or objects are assigned permissions using Access Control Lists(ACLs) when unarchived.
◦ Inherit: Inherits the folder or object's permissions (ACL) from its new parent folder.
◦ Preserve: Preserves the folder or object's permissions (ACL) as it was in the original, mapping accounts asnecessary.
Oracle SCM CloudCreating and Administering Analytics and Reports
Chapter 8Maintenance and Migration
197
◦ Create: Preserves the folder or object's permissions (ACL) as it was in the original, creating and mappingaccounts as necessary.
6. Click OK.
Oracle SCM CloudCreating and Administering Analytics and Reports
Chapter 8Maintenance and Migration
198
Oracle SCM CloudCreating and Administering Analytics and Reports
Glossary
199
Glossary
analysis
A selection of data displayed in one or more views, such as a table or chart, to provide answers to business questions.
analytics
Business intelligence objects such as analyses and dashboards that provide meaningful data to help with decision making.
briefing book
A collection of static or updatable analyses or dashboard pages that you can download, print, and share with others.
business intelligence catalog
The repository where all business intelligence objects, including analytics, reports, briefing books, and agents, are stored. Thecatalog contains separate folders for personal, shared, and custom objects.
business intelligence repository
The metadata that determines all of the columns, or pieces of data, that you can include in analytics. You can also use therepository as a source of data for reports.
customization
A change to the predefined artifacts of the application. Customizations impact multiple users.
dashboard
A collection of analyses and other content, presented on one or more pages to help users achieve specific business goals.Each page is a separate tab within the dashboard.
data model
The metadata that determines where data for a report comes from and how that data is retrieved.
EDI
Abbreviation for electronic data interchange.
EFT
Acronym for Electronic Funds Transfer. A direct transfer of money from one account to another, such as an electronicpayment of an amount owed a supplier by transferring money from a payer's disbursement bank account into the supplier'sbank account.
flexfield
A flexible data field that you can customize to contain one or more segments or store additional information. Each segmenthas a value and a meaning.
Oracle SCM CloudCreating and Administering Analytics and Reports
Glossary
200
flexfield segment
An extensible data field that represents an attribute and captures a value corresponding to a predefined, single extensioncolumn in the database. A segment appears globally or based on a context of other captured information.
global area
The region at the very top of the user interface that remains the same no matter which page you're on.
job definition
The metadata that determines what a job does and what options are available to users when they submit the scheduledprocess. A job is the executable for a scheduled process.
panel tab
A tab on the right side of the page that slides out when you open it. Each panel tab has an icon as the tab label.
personalization
A change that users make to control the look or behavior of the application. Personalizations impact only the user making thechange.
prompt
A parameter that you set when you use analytics, limiting the data in the analysis or in all analyses on the dashboard ordashboard page (tab).
regional area
The collapsible region in the work area that lets you control what's in the local area, for example by selecting a task or runninga search.
report
An output of select data in a predefined format that's optimized for printing.
role
Controls access to application functions and data.
scheduled process
A program that you run to process data and, in some cases, generate output as a report.
subject area
A set of columns, or pieces of data, related to a specific business object or area.
view
A specific way to present the results of an analysis, for example as a table or graph. Other types of views, such as the titleview, show other components of the analysis.
Oracle SCM CloudCreating and Administering Analytics and Reports
Glossary
201
work area
A set of pages containing the tasks, searches, and other content you need to accomplish a business goal.

Oracle SCM CloudCreating and Administering Analytics and Reports
Glossary
202