oracle performance for...
TRANSCRIPT

Oracle Performance for Developers
And the DBA’s That Love Them!
by Kerry Osborne
- an oldish Oracle guy

whoami
I added this slide because everyone else had one!
Started working with Oracle in 1983Primarily a developer for the first 5-6 yearsBecame a consultant around 1987…
Never worked directly for OracleNot certified in anything (except Scuba Diving)But I have attended the Hotsos Symposium 4 years in a row!

It’s the Code!
“Let me blurt out the punch line of this article in one sentence. The main performance problem in the huge majority of database The main performance problem in the huge majority of database applications is bad SQL code.”
Joe Celko - It’s the Code Stupid!Information Management Magazine, June 2005

Why is there so much “bad” code?And the Survey Says:
Lack of Education – No. 1 Answer

Why is there so much “bad” code?
• My Education was Definitely Lacking!
• Most developers have a decent understanding of SQL
• But most have a significant blind spot:• But most have a significant blind spot:
• They don’t really know very much about the database
• Also there hasn’t been a really good certification program
• OCP is OK, but not great
• OCP is primarily aimed at DBAs

Why is there so much “bad” code?
- By Comparison Plumbers in Texas Require Apprenticeship- Master Plumber – 8,000 hours + testing- Journeyman Plumber – 8,000 hours- Certified Drain Cleaner – 4,000 hours

Why is there so much “bad” code?
Just One More Reminder: This guy needed 4 years as an apprentice to get his Master Plumbers Certification! For a
profession that can be summed up as “&!*% runs down hill”.

Why is there so much “bad” code?
SQL is a set language
- Very different from a procedural language- Reasonable to expect pretty linear response- Reasonable to expect pretty linear response- If your doing 10 records/min you can do 600/hour
- Also very different from an object oriented type language
“If we politely request an object to do something for us instead of brutally calling its procedures directly, this is called message passing, even if no actual 'message' is transmitted. The joy here is that many different kinds of objects may understand the same message, which leads to the notion of polymorphism. For example, we can ask many different kinds of documents to Print themselves, and they each respond appropriately.”
- Unknown Java Evangelist

Why is there so much “bad” code?
SQL is a very very very high level language
- Actually it’s closer to a software spec than a program- Basically only the result is defined (I’m stretching here)- Basically only the result is defined (I’m stretching here)- But many many implementation decisions are left to the DB
- the most import input is the statistics- lots of optimizer parameters as well
- 194 in 10.2.0.3 on linux- 270 in 11.1.0.7 on linux
- It can be like giving instructions to my kids

Why is there so much “bad” code?

Why is there so much “bad” code?
My Original Top Ten List Things NOT to Do
1.Hire Developers that Don’t Know SQL2.Write a Meta-Layer (hide the database from the developers)
------ Oracle
3.Don’t use connection pooling4.Leave Autocommit On5.Hinder the CBO (Bad Stats, Bad Histograms, Bad Hints, …)6.Use an Unpopular Language/Tool7.Don’t Use the Tools You Already Own8.Throw Hardware At It9.Don’t Worry About Concurrency (What Me Worry)10.Do Everything One Row at a Time

Why is there so much “bad” code?
Some Things I left out of my original list:
1. Not Using Bind Variables (yes Virginia, it’s still a problem)2. Not Closing Cursors (ditto) – it’s a memory leak2. Not Closing Cursors (ditto) – it’s a memory leak3. Doing Unnecessary Work (200,000 execs a day – no rows)4. Not Using Constraints (or worse, not believing that they work)5. Not Instrumenting Your Code6. Over-Instrumenting Your Code

Why is there so much “bad” code?
Oracle is NOT a Persistent Data Store!
- Well it is, but that’s only a small part or what it is- It’s an engine (it has it’s own jvm, and pl/sql)- It’s an engine (it has it’s own jvm, and pl/sql)- It performs some types of operations blazingly fast
- sorting, filtering, joining … for example- It’s basically a big, sophisticated disk cache
Please don’t think of it as a place to save everything if you have to reboot the app server!

Why is there so much “bad” code?
The development environment doesn’t match production
- Lot’s of issues come into play here- Stats mainly (these can be set to match Production)- Stats mainly (these can be set to match Production)- But also the myriad optimizer parameters
A close corollary to this is lack of access to production
- Developers are quite often not even aware of the differences

DBAs are from Venus, Developers are from Mars
1. Lack of a Common Language
2. Most Companies are Organized Wrong
I would like to buy a Dam-burgen!
3. DBAs Often Don’t Respect Developers
4. Developers Often Resent DBAs

DBAs are from Venus, Developers are from Mars
Emailing instead of talking

DBAs are from Venus, Developers are from Mars
Typical DBA Characteristics- Cranky- More Experienced- More Experienced- Goal is to Keep Anything Really Bad from Happening- Basically Pessimistic (envisions the catastrophes)
Typical Developer Characteristics- Creative- Less Experienced- Goal is to Complete the Unified Field Theory - Basically Optimistic (envisions the possibilities)

Can’t We All Just Get Along
- DBAs stay up all night resolving performance probl ems(even though they weren’t consulted on the design)
- This experience leads to DBAs start resenting deve lopers
- DBAs attack Developers for lack of expertise(even though they have no idea what they were attem pting)
- Developers begin to feel mistreated and resent DBA s
- Developers begin to write bad code on purpose(just to keep the DBAs up at night)
- DBAs now have a real reason to abuse the Developer s
- Repeat (at least until you can find a new job)
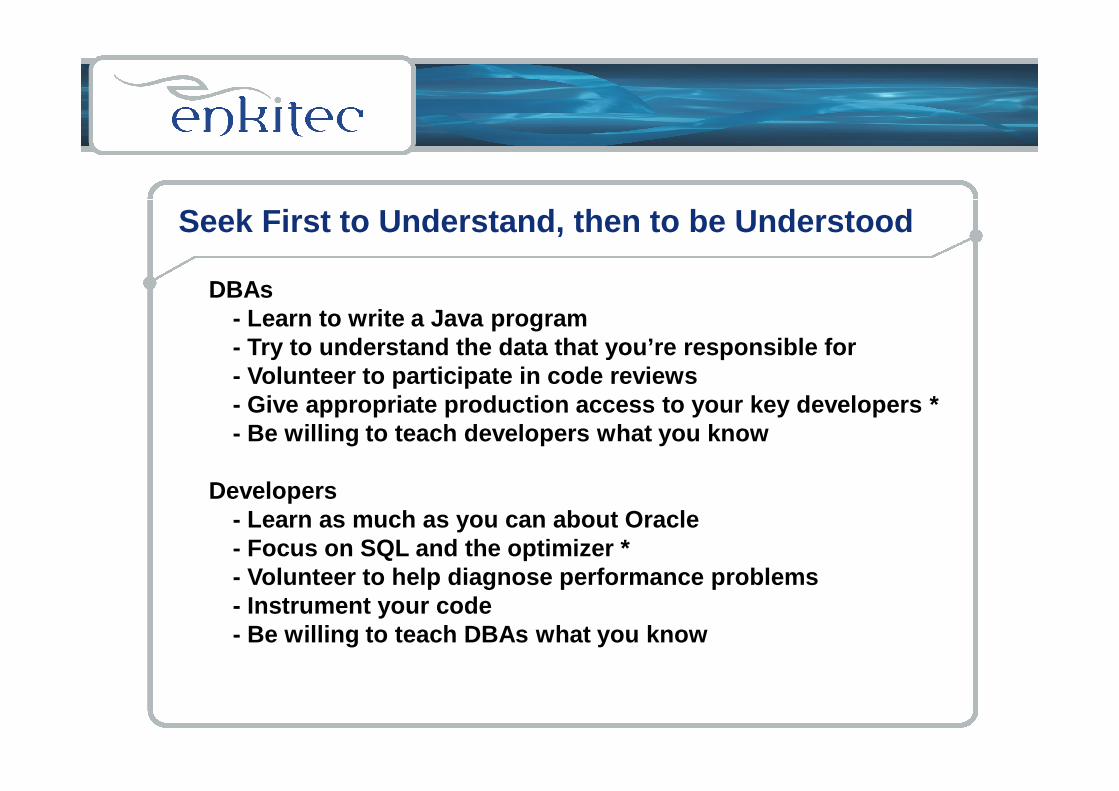
Seek First to Understand, then to be Understood
DBAs- Learn to write a Java program- Try to understand the data that you’re responsible for- Volunteer to participate in code reviews- Give appropriate production access to your key deve lopers *- Give appropriate production access to your key deve lopers *- Be willing to teach developers what you know
Developers- Learn as much as you can about Oracle- Focus on SQL and the optimizer * - Volunteer to help diagnose performance problems- Instrument your code- Be willing to teach DBAs what you know

Tools Every Oracle Developer Should Know
Explain PlanDBMS_XPLANV$SQL, V$SQLAREA, V$SQL_PLANAUTOTRACEAUTOTRACETrace FilesStatspack/AWRBasic Wait Events – Reads, SQL*Net, Log File Sync, C PUDBMS_STATS

Explain Plan -
Your probably familiar with this:
SQL> explain plan for select …SQL> select * from table(dbms_xplan.display('plan_t able’,'','ALL'));
SucksLies
I hardly ever use it, because EXPLAIN PLAN LIES!
It tells you what it thinks the optimizer might do …It’s basically a different code pathGoogle for “Explain Plan Lies” for more info
… and unless Burleson has recently written something with that title recently you should find something I wro te!
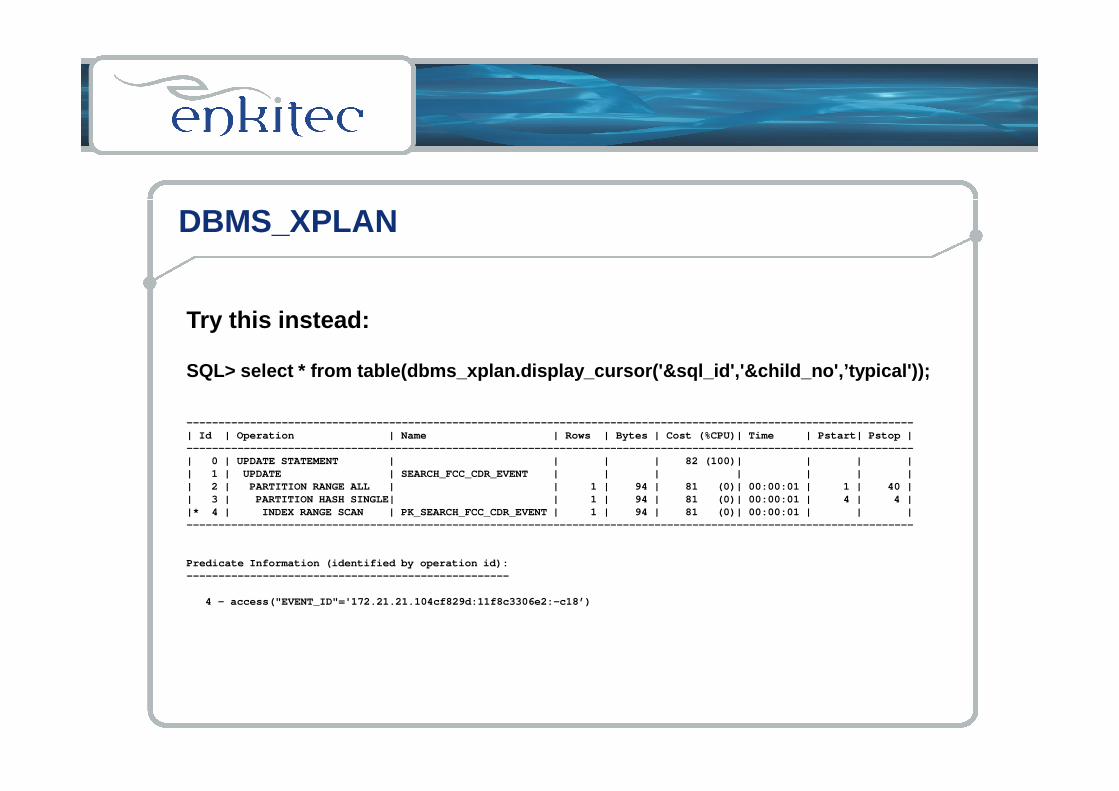
DBMS_XPLAN
Try this instead:
SQL> select * from table(dbms_xplan.display_cursor( '&sql_id','&child_no',’typical'));
--------------------------------------------------- --------------------------------------------------- -------------| Id | Operation | Name | Rows | Bytes | Cost (%CPU)| Time | Ps tart| Pstop |--------------------------------------------------- --------------------------------------------------- -------------| 0 | UPDATE STATEMENT | | | | 82 (100)| | | || 1 | UPDATE | SEARCH_FCC_CDR_EV ENT | | | | | | || 2 | PARTITION RANGE ALL | | 1 | 94 | 81 (0)| 00:00:01 | 1 | 40 || 3 | PARTITION HASH SINGLE| | 1 | 94 | 81 (0)| 00:00:01 | 4 | 4 ||* 4 | INDEX RANGE SCAN | PK_SEARCH_FCC_CDR _EVENT | 1 | 94 | 81 (0)| 00:00:01 | | |--------------------------------------------------- --------------------------------------------------- -------------
Predicate Information (identified by operation id):---------------------------------------------------
4 - access("EVENT_ID"='172.21.21.104cf829d:11f8c3306 e2:-c18’)

DBMS_XPLAN
4 Display Functions:
Display – plan tableDisplay_Cursor – shared poolDisplay_AWR – AWR tablesDisplay_Baseline – 11gDisplay_Baseline – 11g
Options:
ALLSTATS *IOSTATSMEMSTATSOUTLINEPEEKED_BINDS *
See Rob van Wijk’s blog for a very detailed set of exampleshttp://rwijk.blogspot.com/2008/03/dbmsxplandisplayc ursor.html
And the Oracle Documentationhttp://download.oracle.com/docs/cd/B19306_01/appdev .102/b14258/d_xplan.htm#i999189

DBMS_XPLAN - Options
allstats –
select /*+ gather_plan_statistics */ blah,blah,blah …select * from table(dbms_xplan.display_cursor('&sql _id','&child_no',’allstats'));--------------------------------------------------- --------------------------------------------------- ------------------| Id | Operation | Name | Starts | E - Rows | A - Rows | A - Time | Buffers || Id | Operation | Name | Starts | E - Rows | A - Rows | A - Time | Buffers |--------------------------------------------------- --------------------------------------------------- ------------------|* 1 | COUNT STOPKEY | | 1 | | 1 |00:00 :00.01 | 44 || 2 | PARTITION RANGE ALL | | 1 | 1 | 1 |00:00 :00.01 | 44 || 3 | PARTITION HASH ALL | | 10 | 1 | 1 |00:00 :00.01 | 44 || 4 | TABLE ACCESS BY LOCAL INDEX ROWID| DODA _TABLE | 37 | 1 | 1 |00:00 :00.01 | 44 ||* 5 | INDEX RANGE SCAN | DODA _TABLE_IDX1 | 37 | 3403K| 1 |00:00 :00.01 | 43 |--------------------------------------------------- --------------------------------------------------- ------------------
Predicate Information (identified by operation id):---------------------------------------------------
1 - filter(ROWNUM<2)5 - access(”COL1">SYSDATE@!)
Hint is not required:
alter session set statistics_level=all;alter session set “_rowsource_execution_statistics” =true;

DBMS_XPLAN - Options
peeked_binds –
select * from table(dbms_xplan.display_cursor('&sql_id','&child_n o',’+peeked_binds'));
--------------------------------------------------- --------------------------------------------------- ------------------------------------------------------- --------------------------------------------------- ----| Id | Operation | Name | Rows | Bytes | Cost (%CPU)| Time |--------------------------------------------------- --------------------------------------------------- ----| 0 | SELECT STATEMENT | | | | 10 (100)| || 1 | NESTED LOOPS | | | | | || 2 | NESTED LOOPS | | 1 | 44 | 10 (0)| 00:00: 01 ||* 3 | TABLE ACCESS BY INDEX ROWID| DTN_ENTRY | 6 | 96 | 4 (0)| 00:00: 01 ||* 4 | INDEX RANGE SCAN | RELATIONSHI P_13_FK | 6 | | 1 (0)| 00:00: 01 ||* 5 | INDEX UNIQUE SCAN | AK_UNIQUE_M ATCH_DTN_ENTR | 1 | | 0 (0)| || 6 | TABLE ACCESS BY INDEX ROWID | DTN_ENTRY_P ATTERN | 1 | 28 | 1 (0)| 00:00: 01 |--------------------------------------------------- --------------------------------------------------- ----
Peeked Binds (identified by position):--------------------------------------
1 - :1 (VARCHAR2(30), CSID=873): '1'2 - :2 (VARCHAR2(30), CSID=873): '8108371336'3 - :3 (VARCHAR2(30), CSID=873): '1001439286'
Predicate Information (identified by operation id):---------------------------------------------------
3 - filter("ENT"."ACTIVE"='Y')4 - access("ENT"."CONTROL_ENTITY_ID"=TO_NUMBER(:3))5 - access("PAT"."DTN_ENTRY_ID"="ENT"."DTN_ENTRY_ID" AND "PAT"."MATCH_TYPE"='E' AND
"PAT"."DTN_MATCH_CC"=:1 AND "PAT"."DTN_MATCH_NUMBER "=:2)

Digression – Bind Variable Peeking
Drives Me Nuts!

Shared Pool Layout (V$SQL…)
V$SQLAREA V$SQLSql_IdSql_TextChild_NumberPlan_Hash_Value(various stats)
Sql_IdSql_Text(various stats)
V$SQL_PLAN
Sql_IdChild_NumberPlan_Hash_ValueId (step)OperationOptionsObject_Name
Note: prior to 10g hash_value used as key (no sql_i d)
To use dbms_xplan.display_cursor you need to be able to find the statement in the shared pool. .

Finding Statements in the Shared Pool
SQL> !cat find_sql.sqlselect sql_id, child_number, plan_hash_value plan_h ash, executions execs,(elapsed_time/1000000)/decode(nvl(executions,0),0,1 ,executions) avg_etime,disk_reads/decode(nvl(executions,0),0,1,executions) avg_pio,buffer_gets/decode(nvl(executions,0),0,1,executions ) avg_lio,sql_textfrom v$sql swhere upper(sql_text) like upper(nvl('&sql_text',sq l_text))where upper(sql_text) like upper(nvl('&sql_text',sq l_text))and sql_text not like '%from v$sql where sql_text l ike nvl(%'and sql_id like nvl('&sql_id',sql_id)order by 1, 2, 3/
SQL> @find_sqlEnter value for sql_text: %skew%Enter value for sql_id:
SQL_ID CHILD PLAN_HASH EXECS AVG_ETIME AVG_LIO SQL_TEXT------------- ------ ---------- ------ ---------- ------ ------ --------------------------------------------- ----0qa98gcnnza7h 0 568322376 5 13.09 142,646 select avg(pk_col) from kso.skew where col1 > 00qa98gcnnza7h 1 3723858078 1 9.80 2,626,102 select avg(pk_col) from kso.skew where col1 > 0

Finding Statements in the Shared Pool
SQL> !cat dplan.sqlset lines 150select * from table(dbms_xplan.display_cursor('&sql _id','&child_no','typical'))/
SQL> @dplanEnter value for sql_id: 0qa98gcnnza7hEnter value for child_no: 0Enter value for child_no: 0
PLAN_TABLE_OUTPUT--------------------------------------------------- --------------------------------------------------- ---------------SQL_ID 0qa98gcnnza7h, child number 0-------------------------------------select avg(pk_col) from kso.skew where col1 > 0
Plan hash value: 568322376
--------------------------------------------------- ------------------------| Id | Operation | Name | Rows | Bytes | Cost (%CPU)| Time |--------------------------------------------------- ------------------------| 0 | SELECT STATEMENT | | | | 31719 (100)| || 1 | SORT AGGREGATE | | 1 | 11 | | ||* 2 | TABLE ACCESS FULL| SKEW | 32M| 335M| 31719 (37)| 00:00:43 |--------------------------------------------------- ------------------------
Predicate Information (identified by operation id):---------------------------------------------------
2 - filter("COL1">0)

XPLAN - Access
What You Need:
SELECT ON V_$SQLSELECT ON V_$SQL_PLANSELECT ON V_$SQL_PLAN_STATISTICS_ALLSELECT ON V_$SQL_PLAN_STATISTICS_ALL
Or
SELECT ANY DICTIONARY

Autotrace
SQL> set autotrace traceonlySQL> @avgskew
Execution Plan--------------------------------------------------- -------Plan hash value: 568322376
--------------------------------------------------- ------------------------| Id | Operation | Name | Rows | Bytes | Cost (%CPU)| Time || Id | Operation | Name | Rows | Bytes | Cost (%CPU)| Time |--------------------------------------------------- ------------------------| 0 | SELECT STATEMENT | | 1 | 11 | 31719 (37)| 00:00:43 || 1 | SORT AGGREGATE | | 1 | 11 | | ||* 2 | TABLE ACCESS FULL| SKEW | 32M| 335M| 31719 (37)| 00:00:43 |--------------------------------------------------- ------------------------
Predicate Information (identified by operation id):---------------------------------------------------
2 - filter("COL1">0)
Statistics--------------------------------------------------- -------
0 recursive calls0 db block gets
173731 consistent gets109968 physical reads
0 redo size433 bytes sent via SQL*Net to client396 bytes received via SQL*Net from client
2 SQL*Net roundtrips to/from client0 sorts (memory)0 sorts (disk)1 rows processed

Autotrace
SQL*Plus command- useful for quick and dirty look at interactive SQL
set autotrace statistics – statistics section is use fulset autotrace traceonly – suppresses query outputset autotrace traceonly – suppresses query output
Unfortunately – it uses Explain Plan!
My Conclusion: – not overly useful, but it’s easy an d I do use it
Tom Kyte. Autotracehttp://asktom.oracle.com/tkyte/article1/autotrace.h tml

Autotrace – Uses Explain Plan
SQL> @flush_pool
System altered.
SQL> @find_sqlEnter value for sql_text: %skew%Enter value for sql_id:
no rows selected
SQL> set autotrace traceonlySQL> @avgskew
Execution Plan--------------------------------------------------- -------Plan hash value: 568322376
--------------------------------------------------- ------------------------| Id | Operation | Name | Rows | Bytes | Cost (%CPU)| Time |--------------------------------------------------- ------------------------| 0 | SELECT STATEMENT | | 1 | 11 | 31719 (37)| 00:00:43 || 1 | SORT AGGREGATE | | 1 | 11 | | ||* 2 | TABLE ACCESS FULL| SKEW | 32M| 335M| 31719 (37)| 00:00:43 |--------------------------------------------------- ------------------------
Predicate Information (identified by operation id):---------------------------------------------------
2 - filter("COL1">0)
Statistics--------------------------------------------------- -------Bla, bla, bla ….
Autotrace – Uses Explain Plan
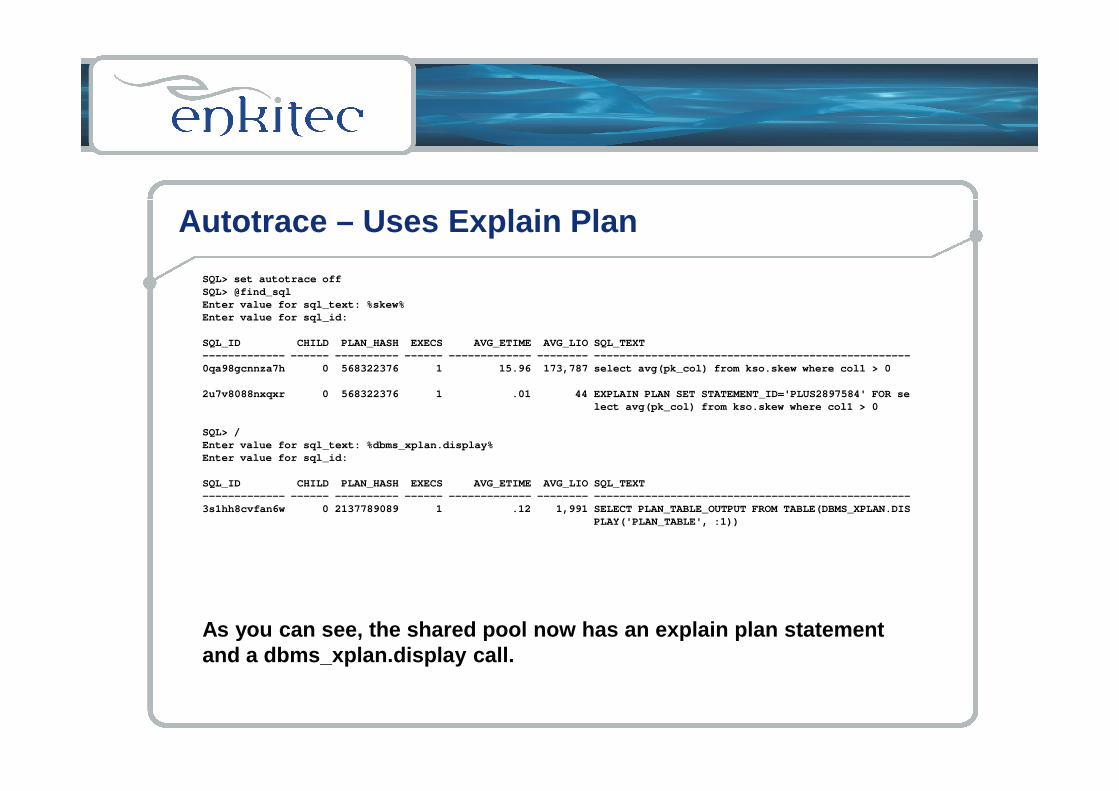
SQL> set autotrace offSQL> @find_sqlEnter value for sql_text: %skew%Enter value for sql_id:
SQL_ID CHILD PLAN_HASH EXECS AVG_ETIM E AVG_LIO SQL_TEXT------------- ------ ---------- ------ ------------- --- ----- ---------------------------------------------- ----0qa98gcnnza7h 0 568322376 1 15.9 6 173,787 select avg(pk_col) from kso.skew where c ol1 > 0
2u7v8088nxqxr 0 568322376 1 .0 1 44 EXPLAIN PLAN SET STATEMENT_ID='PLUS28975 84' FOR se2u7v8088nxqxr 0 568322376 1 .0 1 44 EXPLAIN PLAN SET STATEMENT_ID='PLUS28975 84' FOR select avg(pk_col) from kso.skew where col1 > 0
SQL> /Enter value for sql_text: %dbms_xplan.display%Enter value for sql_id:
SQL_ID CHILD PLAN_HASH EXECS AVG_ETIM E AVG_LIO SQL_TEXT------------- ------ ---------- ------ ------------- --- ----- ---------------------------------------------- ----3s1hh8cvfan6w 0 2137789089 1 .1 2 1,991 SELECT PLAN_TABLE_OUTPUT FROM TABLE(DBMS _XPLAN.DIS
PLAY('PLAN_TABLE', :1))
As you can see, the shared pool now has an explain plan statementand a dbms_xplan.display call.

Autotrace - Access
What You Need:
SELECT ON V_$SQLSELECT ON V_$SQL_PLAN
Or
SELECT ANY DICTIONARY
And
PLUSTRACE

Trace Files
10046 - Extended Trace Files10053 - CBO Choices
Cary Millsap & Jeff Holt. Optimizing Oracle Performance O’Reilly, 2003.
Pete Finnigan. How to Set Trace…http://www.petefinnigan.com/ramblings/how_to_set_tr ace.htm
Wolfgang Breitling. A Look under the Hood of CBO: The 10053 Eventhttp://www.centrexcc.com/A%20Look%20under%20the%20H ood%20of%20CBO%20-%20the%2010053%20Event.pdf
Tom Kyte. Use the 10053 Event to Trace CBO Choiceshttp://asktom.oracle.com/pls/asktom/f?p=100:11:0::: :P11_QUESTION_ID:63445044804318
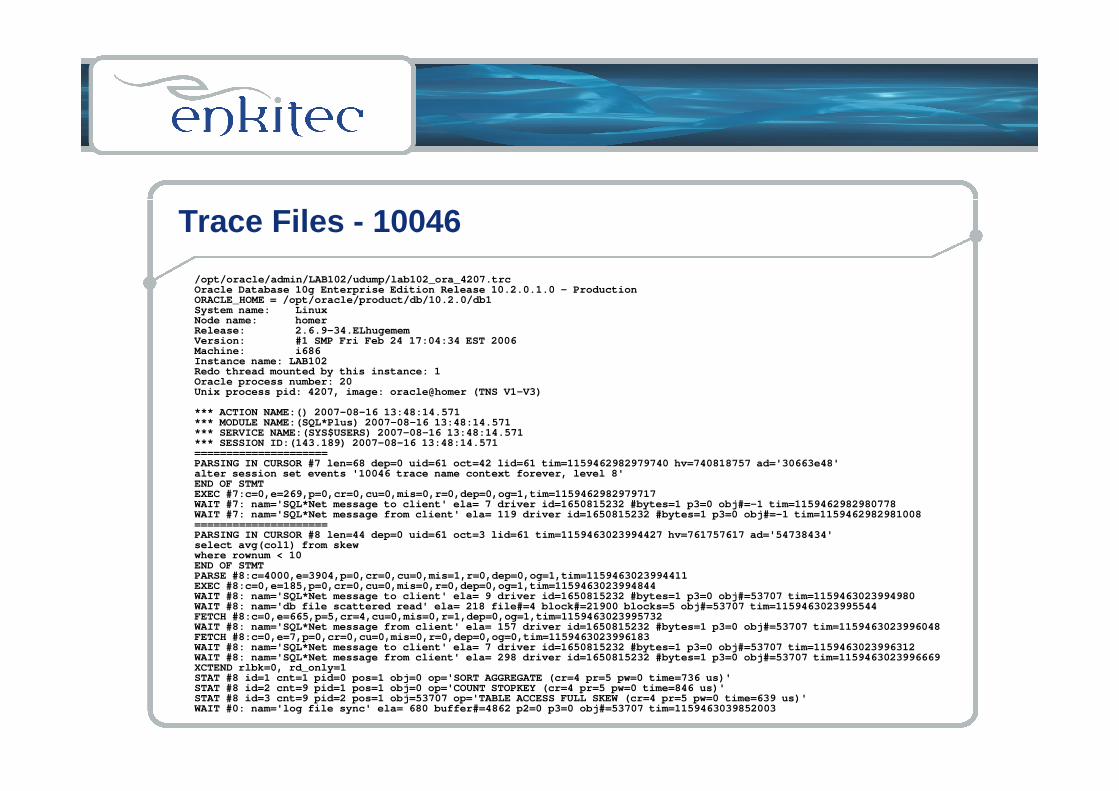
Trace Files - 10046
/opt/oracle/admin/LAB102/udump/lab102_ora_4207.trcOracle Database 10g Enterprise Edition Release 10.2 .0.1.0 - ProductionORACLE_HOME = /opt/oracle/product/db/10.2.0/db1System name: LinuxNode name: homerRelease: 2.6.9-34.ELhugememVersion: #1 SMP Fri Feb 24 17:04:34 EST 2006Machine: i686Instance name: LAB102Redo thread mounted by this instance: 1Oracle process number: 20Unix process pid: 4207, image: oracle@homer (TNS V1 - V3)Unix process pid: 4207, image: oracle@homer (TNS V1 - V3)
*** ACTION NAME:() 2007-08-16 13:48:14.571*** MODULE NAME:(SQL*Plus) 2007-08-16 13:48:14.571*** SERVICE NAME:(SYS$USERS) 2007-08-16 13:48:14.57 1*** SESSION ID:(143.189) 2007-08-16 13:48:14.571=====================PARSING IN CURSOR #7 len=68 dep=0 uid=61 oct=42 lid =61 tim=1159462982979740 hv=740818757 ad='30663e48'alter session set events '10046 trace name context forever, level 8'END OF STMTEXEC #7:c=0,e=269,p=0,cr=0,cu=0,mis=0,r=0,dep=0,og= 1,tim=1159462982979717WAIT #7: nam='SQL*Net message to client' ela= 7 dri ver id=1650815232 #bytes=1 p3=0 obj#=-1 tim=1159462 982980778WAIT #7: nam='SQL*Net message from client' ela= 119 driver id=1650815232 #bytes=1 p3=0 obj#=-1 tim=115 9462982981008=====================PARSING IN CURSOR #8 len=44 dep=0 uid=61 oct=3 lid= 61 tim=1159463023994427 hv=761757617 ad='54738434'select avg(col1) from skewwhere rownum < 10END OF STMTPARSE #8:c=4000,e=3904,p=0,cr=0,cu=0,mis=1,r=0,dep= 0,og=1,tim=1159463023994411EXEC #8:c=0,e=185,p=0,cr=0,cu=0,mis=0,r=0,dep=0,og= 1,tim=1159463023994844WAIT #8: nam='SQL*Net message to client' ela= 9 dri ver id=1650815232 #bytes=1 p3=0 obj#=53707 tim=1159 463023994980WAIT #8: nam='db file scattered read' ela= 218 file #=4 block#=21900 blocks=5 obj#=53707 tim=1159463023 995544FETCH #8:c=0,e=665,p=5,cr=4,cu=0,mis=0,r=1,dep=0,og =1,tim=1159463023995732WAIT #8: nam='SQL*Net message from client' ela= 157 driver id=1650815232 #bytes=1 p3=0 obj#=53707 tim= 1159463023996048FETCH #8:c=0,e=7,p=0,cr=0,cu=0,mis=0,r=0,dep=0,og=0 ,tim=1159463023996183WAIT #8: nam='SQL*Net message to client' ela= 7 dri ver id=1650815232 #bytes=1 p3=0 obj#=53707 tim=1159 463023996312WAIT #8: nam='SQL*Net message from client' ela= 298 driver id=1650815232 #bytes=1 p3=0 obj#=53707 tim= 1159463023996669XCTEND rlbk=0, rd_only=1STAT #8 id=1 cnt=1 pid=0 pos=1 obj=0 op='SORT AGGRE GATE (cr=4 pr=5 pw=0 time=736 us)'STAT #8 id=2 cnt=9 pid=1 pos=1 obj=0 op='COUNT STOP KEY (cr=4 pr=5 pw=0 time=846 us)'STAT #8 id=3 cnt=9 pid=2 pos=1 obj=53707 op='TABLE ACCESS FULL SKEW (cr=4 pr=5 pw=0 time=639 us)'WAIT #0: nam='log file sync' ela= 680 buffer#=4862 p2=0 p3=0 obj#=53707 tim=1159463039852003

Trace Files - 10053
Outlines Options Considered by the Optimizer
But also…Lists all optimizer parameters (split by default/al tered)Lists all optimizer parameters (split by default/al tered)Lists all object stats (including partition / comp osite)List all values of peeked bind variablesLists the actual query being executed (unnesting, e tc…)Lists single table access options for each tableLists all calculationsFinally shows plan it came up with including outlin e

Trace Files - 10053***************************************BASE STATISTICAL INFORMATION***********************Table Stats::
Table: SKEW Alias: SKEW#Rows: 32000004 #Blks: 180074 AvgRowLen: 31.00
Index Stats::Index: COL3_INDEX Col#: 4
LVLS: 2 #LB: 84881 #DK: 1000001 LB/K: 1.00 DB/K : 31.00 CLUF: 31999920.00Index: SKEW_COL1 Col#: 2
…
***************************************SINGLE TABLE ACCESS PATH
Column (#2): COL1(NUMBER)AvgLen: 5.00 NDV: 895516 Nulls: 0 Density: 1.6792e- 06 Min: 1 Max: 1000000Histogram: HtBal #Bkts: 254 UncompBkts: 254 EndP tVals: 230
Table: SKEW Alias: SKEW Card: Original: 32000004 Rounded: 32000004 Comput ed: 32000004.00 Non Adjusted: 32000004.00
Access Path: TableScanCost: 31718.67 Resp: 31718.67 Degree: 0
Cost_io: 20027.00 Cost_cpu: 8322387067Resp_io: 20027.00 Resp_cpu: 8322387067
Access Path: index (RangeScan)Index: SKEW_COL1resc_io: 28901466.00 resc_cpu: 217660057141ix_sel: 1 ix_sel_with_filters: 1Cost: 29207244.77 Resp: 29207244.77 Degree: 1
…
*********************************Number of join permutations tried: 1*********************************Final - All Rows Plan: Best join order: 1
Cost: 31718.6688 Degree: 1 Card: 32000004.0000 B ytes: 352000044

Trace Files – Access
What You Need:
An o/s account on the db serverAccess to the user_dump_dest directory*Access to v$parameter to find the udump directoryAccess to v$session if tracing a remote sessionAccess to v$session if tracing a remote session
And
Have to be in DBA groupunless _public_trace_files=true
* Jared Still. A Novel Use for Oracle External Tableshttp://www.dbazine.com/oracle/or-articles/still1

Trace Files – Access
_public_trace_files=true
sets .trc files created in udump to 644 (rw-r--r--)sets .trc files created in bdump to 644 (rw -r--r--) sets .trc files created in bdump to 644 (rw -r--r--) does not change alert log permissionsdoes not change adump file permissionsdoes require a bounce of the instance
Note: 10046 trace files do not contain clear text p asswords.They may, however, contain hashed value of passwordif trace on at level 12 (binds) for a dba session w hen it is setting a password .

Statspack / AWR
Provides a lot of data
Very useful despite the aggregation of data
Snapshots collected once per hour by default (OK)Snapshots collected once per hour by default (OK)
Retention is 7 days by default (not long enough)
Can report between any two snapshots
(but not across a bounce)
•AWR / Statspack - basically the same thing (except for the licensing fee)

Statspack / AWR
Contains Basic Workload Informationtransactions, parses, db time, etc…
Contains a profile of how the database spent it’s t ime Contains a profile of how the database spent it’s t ime also known as a wait event profile
Contains most expensive SQL (along with %)by Etime, CPU , Gets, Reads, Execs
(and so much more)

Statspack / AWRWORKLOAD REPOSITORY report for
DB Name DB Id Instance Inst Num Rele ase RAC Host------------ ----------- ------------ -------- -------- --- --- ------------XXX 3484184718 XXX1 1 10.2 .0.3.0 YES xx-xxxx
Snap Id Snap Time Sessions Curs/Sess--------- ------------------- -------- ---------
Begin Snap: 10081 01-May-08 11:00:09 245 57.8End Snap: 10082 01-May-08 12:00:29 215 56.9
Elapsed: 60.33 (mins)Elapsed: 60.33 (mins)DB Time: 60.12 (mins)
Cache Sizes~~~~~~~~~~~ Begin End
---------- ----------Buffer Cache: 944M 1,104M Std Block Size : 8K
Shared Pool Size: 1,440M 1,280M Log Bu ffer: 14,352K
Load Profile~~~~~~~~~~~~ Per Second Per Transaction
--------------- ---------------Redo size: 45,573.66 6,151 .79
Logical reads: 7,166.25 967.34Block changes: 247.94 33.47
Physical reads: 186.44 25.17Physical writes: 40.93 5.52
User calls: 62.09 8.38Parses: 28.05 3.79
Hard parses: 10.90 1.47Sorts: 53.18 7.18
Logons: 0.46 0.06Executes: 35.54 4. 80
Transactions: 7.41% Blocks changed per Read: 3.46 Recursive Cal l %: 76.32Rollback per transaction %: 15.44 Rows per Sort: 20.44

Statspack / AWR
Instance Efficiency Percentages (Target 100%)~~~~~~~~~~~~~~~~~~~~~~~~~~~~~~~~~~~~~~~~~~~~~
Buffer Nowait %: 99.94 Redo NoWait %: 99. 92Buffer Hit %: 97.40 In-memory Sort %: 100. 00Library Hit %: 87.03 Soft Parse %: 61. 13
Execute to Parse %: 21.07 Latch Hit %: 99.93Parse CPU to Parse Elapsd %: 63.65 % Non - Parse CPU: 79.10Parse CPU to Parse Elapsd %: 63.65 % Non - Parse CPU: 79.10
Shared Pool Statistics Begin End------ ------
Memory Usage %: 66.76 54.22% SQL with executions>1: 8.34 22.47
% Memory for SQL w/exec>1: 15.15 47.83
Top 5 Timed Events Avg %Total~~~~~~~~~~~~~~~~~~ wait CallEvent Waits Time (s) (ms) Time Wait Class------------------------------ ------------ --------- -- ------ ------ ----------db file sequential read 655,969 2 ,769 4 76.8 User I/OCPU time 516 14.3gc current block 2-way 364,108 115 0 3.2 Clustergc cr grant 2-way 395,360 70 0 1.9 Clusterlibrary cache lock 207,165 49 0 1.3 Concurrenc

Statspack / AWR
SQL ordered by Elapsed Time DB/Inst: PRORAC/p rorac1 Snaps: 10081-10082...
Elapsed CPU Elap per % TotalTime (s) Time (s) Executions Exec (s) DB Time SQL Id
---------- ---------- ------------ ---------- ------- -- -----------409 15 16 25.5 11.3 fahc qt234ft6f
SELECT blah, blah1, balh3 …SELECT blah, blah1, balh3 …
387 13 16 24.2 10.7 932q p5mmkj5rrSELECT blah, blah2, blah3 …
…
SQL ordered by Gets DB/Inst: PRORAC/p rorac1 Snaps: 10081-10082...
Gets CPU ElapsedBuffer Gets Executions per Exec %Total Time (s) Time (s) SQL Id
-------------- ------------ ------------ ------ ------- - --------- -------------3,984,767 18,544 214.9 15.4 11.15 11.15 9ungu4m6h9t7p
Module: is_domDecisionSupport@as-seebeyond06 (TNS V 1-V3)SELECT username AS table_schem FROM all_users ORDER BY table_schem
546,482 27 20,240.1 2.1 8.63 8.70 ach580jj1zsfxSELECT COUNT(*) from Bob_Loblaw …
Statspack / AWR
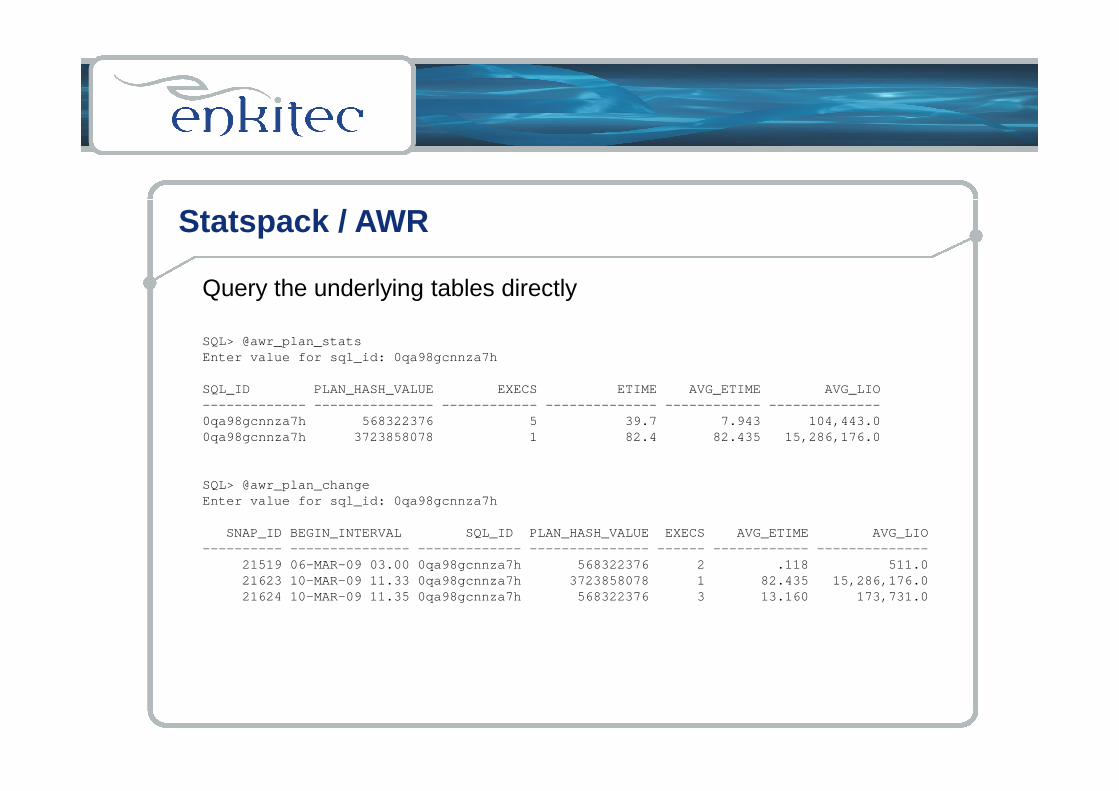
Query the underlying tables directly
SQL> @awr_plan_statsEnter value for sql_id: 0qa98gcnnza7h
SQL_ID PLAN_HASH_VALUE EXECS ETIME AVG_ETIME AVG_LIOSQL_ID PLAN_HASH_VALUE EXECS ETIME AVG_ETIME AVG_LIO------------- --------------- ------------ ----------- --- ------------ --------------0qa98gcnnza7h 568322376 5 39.7 7.943 104,443.00qa98gcnnza7h 3723858078 1 82.4 82.435 15,286,176.0
SQL> @awr_plan_changeEnter value for sql_id: 0qa98gcnnza7h
SNAP_ID BEGIN_INTERVAL SQL_ID PLAN_HASH_VAL UE EXECS AVG_ETIME AVG_LIO---------- --------------- ------------- ------------- -- ------ ------------ --------------
21519 06-MAR-09 03.00 0qa98gcnnza7h 568322376 2 .118 511.021623 10-MAR-09 11.33 0qa98gcnnza7h 3723858078 1 82.435 15,286,176.021624 10-MAR-09 11.35 0qa98gcnnza7h 568322376 3 13.160 173,731.0

Statspack / AWR
SQL> !cat unstable_plans.sqlselect * from (select sql_id, sum(execs), min(avg_etime) min_etime , max(avg_etime) max_etime, stddev_etime/min(avg_etime) norm_stddevfrom (select sql_id, plan_hash_value, execs, avg_etime,stddev(avg_etime) over (partition by sql_id) stddev _etime from (from (select sql_id, plan_hash_value,sum(nvl(executions_delta,0)) execs,(sum(elapsed_time_delta)/decode(sum(nvl(executions_ delta,0)),0,1,sum(executions_delta))/1000000) avg_etime-- sum((buffer_gets_delta/decode(nvl(buffer_gets_del ta,0),0,1,executions_delta))) avg_liofrom DBA_HIST_SQLSTAT S, DBA_HIST_SNAPSHOT SSwhere ss.snap_id = S.snap_idand ss.instance_number = S.instance_number and executions_delta > 0and elapsed_time_delta > 0and s.snap_id >= nvl('&earliest_snap_id',0)and s.snap_id <= nvl('&last_snap_id',9999999)group by sql_id, plan_hash_value))group by sql_id, stddev_etime)where norm_stddev > nvl(to_number('&min_stddev'),2)and max_etime > nvl(to_number('&min_etime'),.1)order by norm_stddev;

Statspack / AWR
SQL> @unstable_plansEnter value for min_stddev: Enter value for min_etime:
SQL_ID SUM(EXECS) MIN_ETIME MAX_ETIME NORM_STDDEV------------- ---------- ----------- ----------- ------ -------c5by9gdw3814r 14 .03 .12 2.1274848dyu9288c3h 16 .02 .16 2.1309848dyu9288c3h 16 .02 .16 2.13092am60vd2kw8ux 11 .05 .22 2.4976frxg53fac2n8j 5 .03 .30 4.24790qa98gcnnza7h 62 25.58 314.34 7.9833g0jvz8csyrtcf 2 .09 1.19 8.23042cn0kc8u4b81w 545 .02 .42 12.80229wt62290ah0f7 6 .01 .47 38.5857d8mayxqw0wnpv 1373 .01 .85 48.3874
AWR - Access
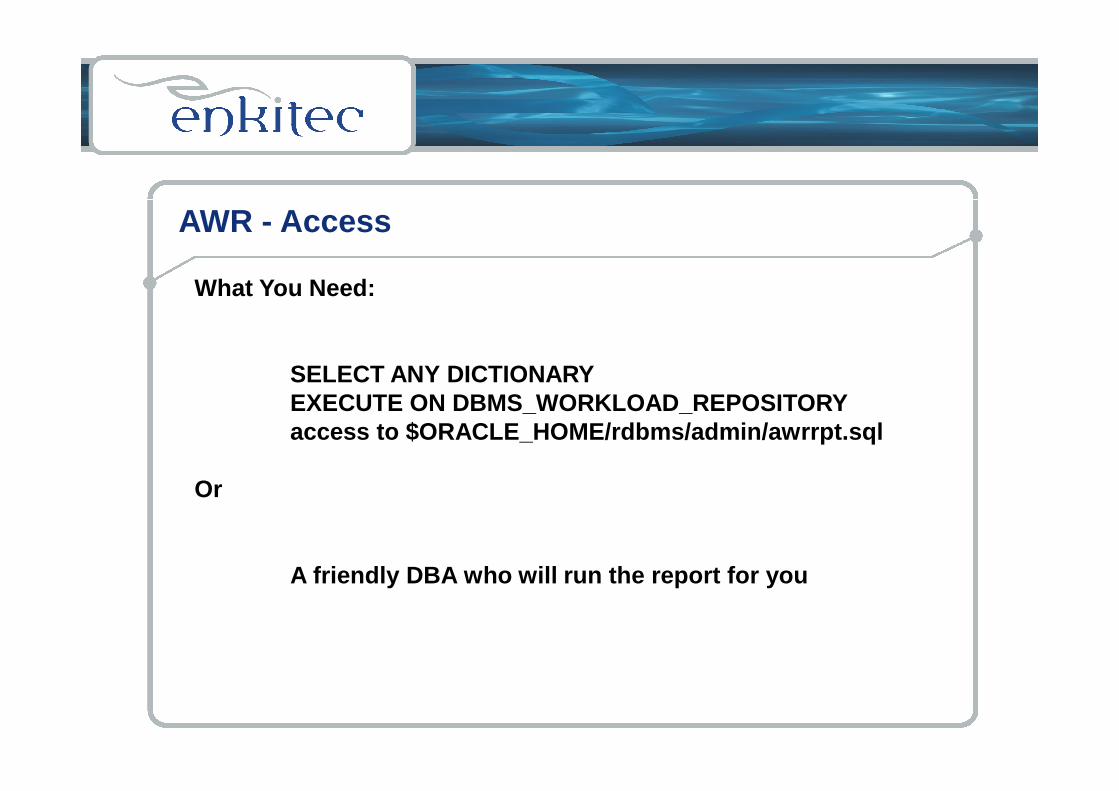
What You Need:
SELECT ANY DICTIONARYEXECUTE ON DBMS_WORKLOAD_REPOSITORYEXECUTE ON DBMS_WORKLOAD_REPOSITORYaccess to $ORACLE_HOME/rdbms/admin/awrrpt.sql
Or
A friendly DBA who will run the report for you

Basic Wait Events
You should know a few of them:
CPU – not really a wait eventdb file sequential readdb file scattered readdb file scattered readlog file syncSQL*Net message to clientSQL*Net message from clientdirect path read…
•Read Optimizing Oracle Performance
Wait Events That Everyone Should Knowhttp://oracle-guy.com/papers/Oracle%20Wait%20Events%20That%20Everyone%20Should%20Know.ppt

DBMS_STATS
You should know the capabilities of this package:
gather_table_statsgather_schema_statsmethod_opt (for all columns)method_opt (for all columns)set_table_statsset_column_statsset_index_statsrestore_table_statsrestore_schema_stats
*Read Karen’s paper.*Read the Oracle docs on DBMS_STATS

References
Tom Kyte. Pretty much everything he has ever written
Jonathan Lewis. Cost-Based Oracle FundamentalsApress, 2006.
Cary Millsap & Jeff Holt. Optimizing Oracle Performance Cary Millsap & Jeff Holt. Optimizing Oracle Performance O’Reilly, 2003.
Karen Morton. Managing Statistics for Optimal Query Performancehttp://method-r.com/downloads/doc_download/11-managing-statistics-for-optimal-query-performance-karen-morton
And a couple of my posts:
Kerry Osborne. Explain Plan Lieshttp://kerryosborne.oracle-guy.com/2008/10/explain-plan-lies/
Kerry Osborne. Bind Variable Peeking – Drives Me Nuts!http://kerryosborne.oracle-guy.com/2008/10/unstable-plans
Kerry Osborne. Unstable Plans (Plan Instability)http://kerryosborne.oracle-guy.com/2008/10/unstable-plans/

Questions / Contact Information
Questions?0cx7jrp8y6368
Contact Information : Kerry Osborne
www.enkitec.com
0cx7jrp8y6368