oracle® retail operational insights
TRANSCRIPT
Oracle® Retail Operational InsightsUser Guide
Release 15.0.1
E75710-01
June 2016
Oracle® Retail Operational Insights User Guide, Release 15.0.1
E75710-01
Copyright © 2016, Oracle and/or its affiliates. All rights reserved.
Primary Author: Nritya Reddy
Contributing Author: Maria Andrew
This software and related documentation are provided under a license agreement containing restrictions onuse and disclosure and are protected by intellectual property laws. Except as expressly permitted in yourlicense agreement or allowed by law, you may not use, copy, reproduce, translate, broadcast, modify, license,transmit, distribute, exhibit, perform, publish, or display any part, in any form, or by any means. Reverseengineering, disassembly, or decompilation of this software, unless required by law for interoperability, isprohibited.
The information contained herein is subject to change without notice and is not warranted to be error-free. Ifyou find any errors, please report them to us in writing.
If this is software or related documentation that is delivered to the U.S. Government or anyone licensing iton behalf of the U.S. Government, then the following notice is applicable:
U.S. GOVERNMENT END USERS: Oracle programs, including any operating system, integrated software,any programs installed on the hardware, and/or documentation, delivered to U.S. Government end usersare "commercial computer software" pursuant to the applicable Federal Acquisition Regulation andagency-specific supplemental regulations. As such, use, duplication, disclosure, modification, andadaptation of the programs, including any operating system, integrated software, any programs installed onthe hardware, and/or documentation, shall be subject to license terms and license restrictions applicable tothe programs. No other rights are granted to the U.S. Government.
This software or hardware is developed for general use in a variety of information managementapplications. It is not developed or intended for use in any inherently dangerous applications, includingapplications that may create a risk of personal injury. If you use this software or hardware in dangerousapplications, then you shall be responsible to take all appropriate fail-safe, backup, redundancy, and othermeasures to ensure its safe use. Oracle Corporation and its affiliates disclaim any liability for any damagescaused by use of this software or hardware in dangerous applications.
Oracle and Java are registered trademarks of Oracle and/or its affiliates. Other names may be trademarks oftheir respective owners.
Intel and Intel Xeon are trademarks or registered trademarks of Intel Corporation. All SPARC trademarksare used under license and are trademarks or registered trademarks of SPARC International, Inc. AMD,Opteron, the AMD logo, and the AMD Opteron logo are trademarks or registered trademarks of AdvancedMicro Devices. UNIX is a registered trademark of The Open Group.
This software or hardware and documentation may provide access to or information about content,products, and services from third parties. Oracle Corporation and its affiliates are not responsible for andexpressly disclaim all warranties of any kind with respect to third-party content, products, and servicesunless otherwise set forth in an applicable agreement between you and Oracle. Oracle Corporation and itsaffiliates will not be responsible for any loss, costs, or damages incurred due to your access to or use ofthird-party content, products, or services, except as set forth in an applicable agreement between you andOracle.
Value-Added Reseller (VAR) Language
Oracle Retail VAR Applications
The following restrictions and provisions only apply to the programs referred to in this section and licensedto you. You acknowledge that the programs may contain third party software (VAR applications) licensed toOracle. Depending upon your product and its version number, the VAR applications may include:
(i) the MicroStrategy Components developed and licensed by MicroStrategy Services Corporation(MicroStrategy) of McLean, Virginia to Oracle and imbedded in the MicroStrategy for Oracle Retail DataWarehouse and MicroStrategy for Oracle Retail Planning & Optimization applications.
(ii) the Wavelink component developed and licensed by Wavelink Corporation (Wavelink) of Kirkland,Washington, to Oracle and imbedded in Oracle Retail Mobile Store Inventory Management.
(iii) the software component known as Access Via™ licensed by Access Via of Seattle, Washington, andimbedded in Oracle Retail Signs and Oracle Retail Labels and Tags.
(iv) the software component known as Adobe Flex™ licensed by Adobe Systems Incorporated of San Jose,California, and imbedded in Oracle Retail Promotion Planning & Optimization application.
You acknowledge and confirm that Oracle grants you use of only the object code of the VAR Applications.Oracle will not deliver source code to the VAR Applications to you. Notwithstanding any other term orcondition of the agreement and this ordering document, you shall not cause or permit alteration of any VAR

Applications. For purposes of this section, "alteration" refers to all alterations, translations, upgrades,enhancements, customizations or modifications of all or any portion of the VAR Applications including allreconfigurations, reassembly or reverse assembly, re-engineering or reverse engineering and recompilationsor reverse compilations of the VAR Applications or any derivatives of the VAR Applications. Youacknowledge that it shall be a breach of the agreement to utilize the relationship, and/or confidentialinformation of the VAR Applications for purposes of competitive discovery.
The VAR Applications contain trade secrets of Oracle and Oracle's licensors and Customer shall not attempt,cause, or permit the alteration, decompilation, reverse engineering, disassembly or other reduction of theVAR Applications to a human perceivable form. Oracle reserves the right to replace, with functionalequivalent software, any of the VAR Applications in future releases of the applicable program.


v
Contents
Send Us Your Comments ........................................................................................................................ ix
Preface ................................................................................................................................................................ xi
Audience...................................................................................................................................................... xiDocumentation Accessibility .................................................................................................................... xiRelated Documents .................................................................................................................................... xiCustomer Support ...................................................................................................................................... xiiReview Patch Documentation .................................................................................................................. xiiImproved Process for Oracle Retail Documentation Corrections ....................................................... xiiOracle Retail Documentation on the Oracle Technology Network .................................................... xiiConventions ............................................................................................................................................... xiii
1 Introducing Oracle Retail Operational Insights
Operational Business Intelligence Overview ..................................................................................... 1-1Oracle Retail Operational Insights in Oracle Retail Environment .............................................. 1-1
Operational Insights Overview ............................................................................................................. 1-2Operational Insights for Retail Sales Audit.................................................................................... 1-2Operational Insights for Retail Invoice Matching ......................................................................... 1-2Operational Insights for Retail Allocation...................................................................................... 1-3
Operational Insights Data Source ......................................................................................................... 1-3User Roles and Responsibilities............................................................................................................ 1-3Operational Insights Language Options ............................................................................................. 1-4OI Accessibility Options......................................................................................................................... 1-4
2 Pre-defined Operational Insights Reports
Predefined OI Reports for ReSA........................................................................................................... 2-1Dashboard Reports ............................................................................................................................ 2-1
Open Store Days Report............................................................................................................. 2-2Top Ten Late Polling Stores Report.......................................................................................... 2-3Open Transaction Errors Report............................................................................................... 2-4Over/Short Summary Report ................................................................................................... 2-5
Contextual Business Intelligence (BI) Reports ............................................................................... 2-6Contextual BI Reports on Store Day Search Window ........................................................... 2-6Contextual BI Reports on Store Day Summary Window...................................................... 2-9Contextual BI Reports on Transaction Maintenance Window.......................................... 2-12

vi
Contextual BI Reports on Tender Summary Window ....................................................... 2-14Support for Primary Currency and Local Currency ................................................................. 2-15
Predefined OI Reports for Allocation ............................................................................................... 2-15Setting up System Options in Allocation for Operational Insights Reports........................... 2-16Dashboard Reports ......................................................................................................................... 2-16
Purchase Order Arrivals Report ........................................................................................... 2-17Stock to Sales Report .............................................................................................................. 2-19Sales - Top Report ................................................................................................................... 2-19Sales - Bottom Report ............................................................................................................. 2-19
Contextual Business Intelligence (BI) Reports ............................................................................ 2-20Contextual BI Reports on Allocation Maintenance Window ............................................ 2-20Contextual BI Reports on What If Allocation Window...................................................... 2-23
Predefined OI Reports for Retail Invoice Match (ReIM) .............................................................. 2-24Dashboard Reports ......................................................................................................................... 2-24
Upcoming Invoices Report .................................................................................................... 2-24Automatch Rate Report........................................................................................................... 2-25Supplier Site Performance Report ......................................................................................... 2-25Employee Workload Report................................................................................................... 2-27Invoices Report......................................................................................................................... 2-27
Contextual Business Intelligence (BI) Reports ............................................................................ 2-30Contextual BI Reports on the Detail Match Window ......................................................... 2-30Contextual BI Reports on Summary Match Window......................................................... 2-31Contextual BI Reports on Discrepancy Window................................................................. 2-31Supplier Site Details Report ................................................................................................... 2-31Cost Event Report .................................................................................................................... 2-32Quantity Comparison Report................................................................................................. 2-32Tolerance Range Report .......................................................................................................... 2-33
3 Creating and Modifying Reports
Subject Areas............................................................................................................................................. 3-1Dimensions and Attributes .................................................................................................................... 3-1
Operational Insights Foundation - Dimensions and Attributes.................................................. 3-1Calendar ....................................................................................................................................... 3-1Item ............................................................................................................................................... 3-2Location ........................................................................................................................................ 3-3PO.................................................................................................................................................. 3-3Tran Code..................................................................................................................................... 3-3All Items ....................................................................................................................................... 3-4ASN............................................................................................................................................... 3-4Country......................................................................................................................................... 3-4All Suppliers ................................................................................................................................ 3-4Supplier ........................................................................................................................................ 3-5
Operational Insights Allocation - Dimensions and Attributes.................................................... 3-5Allocation ..................................................................................................................................... 3-5
Operational Insights ReIM - Dimensions and Attributes ............................................................ 3-6Invoices......................................................................................................................................... 3-6User ............................................................................................................................................... 3-6
vii
Metrics ........................................................................................................................................................ 3-6Metrics for Allocation OI................................................................................................................... 3-7
Order............................................................................................................................................. 3-7Sales and Inventory .................................................................................................................... 3-7Tran Data...................................................................................................................................... 3-9OTB ............................................................................................................................................... 3-9Allocation Inventory................................................................................................................ 3-10Promo......................................................................................................................................... 3-11
Metrics for ReIM OI ........................................................................................................................ 3-11Invoices...................................................................................................................................... 3-11Cost Events................................................................................................................................ 3-13

viii

ix
Send UsYour Comments
Oracle Retail Operational Insights User Guide, Release 15.0.1.
Oracle welcomes customers' comments and suggestions on the quality and usefulnessof this document.
Your feedback is important, and helps us to best meet your needs as a user of ourproducts. For example:
■ Are the implementation steps correct and complete?
■ Did you understand the context of the procedures?
■ Did you find any errors in the information?
■ Does the structure of the information help you with your tasks?
■ Do you need different information or graphics? If so, where, and in what format?
■ Are the examples correct? Do you need more examples?
If you find any errors or have any other suggestions for improvement, then please tellus your name, the name of the company who has licensed our products, the title andpart number of the documentation and the chapter, section, and page number (ifavailable).
Note: Before sending us your comments, you might like to checkthat you have the latest version of the document and if any concernsare already addressed. To do this, access the Online Documentationavailable on the Oracle Technology Network Web site. It contains themost current Documentation Library plus all documents revised orreleased recently.
Send your comments to us using the electronic mail address: [email protected]
Please give your name, address, electronic mail address, and telephone number(optional).
If you need assistance with Oracle software, then please contact your supportrepresentative or Oracle Support Services.
If you require training or instruction in using Oracle software, then please contact yourOracle local office and inquire about our Oracle University offerings. A list of Oracleoffices is available on our Web site at http://www.oracle.com.

x
xi
Preface
The Oracle Retail Operational Insights User Guide describes the reports available throughthe Oracle Retail Sales Audit Reports functions.
AudienceThis Reports User Guide is for users and administrators of Oracle Retail Sales Audit.This includes merchandisers, buyers, business analysts, and administrative personnel.
Documentation AccessibilityFor information about Oracle's commitment to accessibility, visit the OracleAccessibility Program website athttp://www.oracle.com/pls/topic/lookup?ctx=acc&id=docacc.
Access to Oracle SupportOracle customers that have purchased support have access to electronic supportthrough My Oracle Support. For information, visithttp://www.oracle.com/pls/topic/lookup?ctx=acc&id=info or visithttp://www.oracle.com/pls/topic/lookup?ctx=acc&id=trs if you arehearing impaired.
Related DocumentsFor more information, see the following documents:
■ Oracle Retail Merchandising System Release Notes
■ Oracle Retail Merchandising Batch Schedule
■ Oracle Retail Merchandising Implementation Guide
■ Oracle Retail Merchandising Security Guide
■ Oracle Retail Sales Audit documentation set
■ Oracle Retail Allocation documentation set
■ Oracle Retail Invoice Matching documentation set
■ Oracle Retail Merchandising System documentation set

xii
Customer SupportTo contact Oracle Customer Support, access My Oracle Support at the following URL:
https://support.oracle.com
When contacting Customer Support, please provide the following:
■ Product version and program/module name
■ Functional and technical Description of the problem (include business impact)
■ Detailed step-by-step instructions to re-create
■ Exact error message received
■ Window shots of each step you take
Review Patch DocumentationWhen you install the application for the first time, you install either a base release (forexample, 15.0) or a later patch release (for example, 15.0.1). If you are installing thebase release and additional patch releases, read the documentation for all releases thathave occurred since the base release before you begin installation. Documentation forpatch releases can contain critical information related to the base release, as well asinformation about code changes since the base release.
Improved Process for Oracle Retail Documentation CorrectionsTo more quickly address critical corrections to Oracle Retail documentation content,Oracle Retail documentation may be republished whenever a critical correction isneeded. For critical corrections, the republication of an Oracle Retail document may attimes not be attached to a numbered software release; instead, the Oracle Retaildocument will simply be replaced on the Oracle Technology Network Web site, or, inthe case of Data Models, to the applicable My Oracle Support Documentationcontainer where they reside.
This process will prevent delays in making critical corrections available to customers.For the customer, it means that before you begin installation, you must verify that youhave the most recent version of the Oracle Retail documentation set. Oracle Retaildocumentation is available on the Oracle Technology Network at the following URL:
http://www.oracle.com/technetwork/documentation/oracle-retail-100266.html
An updated version of the applicable Oracle Retail document is indicated by Oraclepart number, as well as print date (month and year). An updated version uses thesame part number, with a higher-numbered suffix. For example, part numberE123456-02 is an updated version of a document with part number E123456-01.
If a more recent version of a document is available, that version supersedes allprevious versions.
Oracle Retail Documentation on the Oracle Technology NetworkOracle Retail product documentation is available on the following web site:
http://www.oracle.com/technetwork/documentation/oracle-retail-100266.html

xiii
(Data Model documents are not available through Oracle Technology Network. Youcan obtain them through My Oracle Support.)
ConventionsThe following text conventions are used in this document:
Convention Meaning
boldface Boldface type indicates graphical user interface elements associatedwith an action, or terms defined in text or the glossary.
italic Italic type indicates book titles, emphasis, or placeholder variables forwhich you supply particular values.
monospace Monospace type indicates commands within a paragraph, URLs, codein examples, text that appears on the window, or text that you enter.

xiv
1
Introducing Oracle Retail Operational Insights 1-1
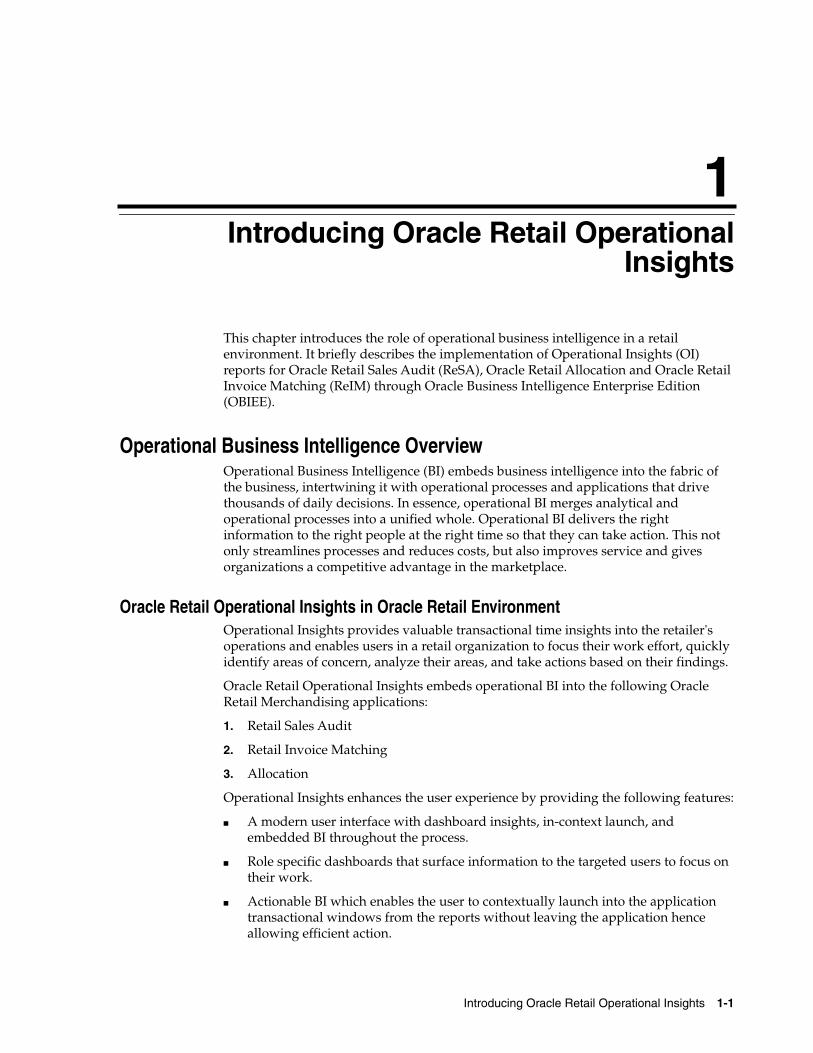
1Introducing Oracle Retail OperationalInsights
This chapter introduces the role of operational business intelligence in a retailenvironment. It briefly describes the implementation of Operational Insights (OI)reports for Oracle Retail Sales Audit (ReSA), Oracle Retail Allocation and Oracle RetailInvoice Matching (ReIM) through Oracle Business Intelligence Enterprise Edition(OBIEE).
Operational Business Intelligence OverviewOperational Business Intelligence (BI) embeds business intelligence into the fabric ofthe business, intertwining it with operational processes and applications that drivethousands of daily decisions. In essence, operational BI merges analytical andoperational processes into a unified whole. Operational BI delivers the rightinformation to the right people at the right time so that they can take action. This notonly streamlines processes and reduces costs, but also improves service and givesorganizations a competitive advantage in the marketplace.
Oracle Retail Operational Insights in Oracle Retail EnvironmentOperational Insights provides valuable transactional time insights into the retailer'soperations and enables users in a retail organization to focus their work effort, quicklyidentify areas of concern, analyze their areas, and take actions based on their findings.
Oracle Retail Operational Insights embeds operational BI into the following OracleRetail Merchandising applications:
1. Retail Sales Audit
2. Retail Invoice Matching
3. Allocation
Operational Insights enhances the user experience by providing the following features:
■ A modern user interface with dashboard insights, in-context launch, andembedded BI throughout the process.
■ Role specific dashboards that surface information to the targeted users to focus ontheir work.
■ Actionable BI which enables the user to contextually launch into the applicationtransactional windows from the reports without leaving the application henceallowing efficient action.
Operational Insights Overview
1-2 Oracle Retail Operational Insights User Guide
■ Contextual BI reports embedded into the application transactional windows thatdisplay data in context to the action being taken during the transaction. Thisenables the user to take intelligent action after analyzing the appropriate data.
■ Pervasive BI to reduce lag or latency between events and the subsequent actionhence driving the workforce efficiency in business.
Operational Insights OverviewThis chapter provides an overview of Operational Insights role within each of theOracle Retail merchandising products.
Operational Insights for Retail Sales AuditOperational Insights provides integration of OBIEE reports into the ReSA userinterface. ReSA provides the tools to evaluate point-of-sale data, to ensure the accuracyand completeness of information exported to downstream systems used inoptimization processes, financial reporting, and analysis. ReSA Operational Insightsdashboards and reports provide pervasive business intelligence and are designed to beembedded within the ReSA ADF application.
An auditor can use operational business intelligence embedded within ReSA to help inday-to-day activities as follows:
■ View store days that are ready for audit and complete the workflow by launchingthe appropriate ReSA window from the report
■ Identify and escalate high issue stores that are late polling on a continuous basis
■ View errors and fix them by launching the appropriate ReSA window from thereport
■ Identify and report fraudulent behavior in stores that report overage or shortageof monetary amounts
■ Draw comparisons and study patterns for a type of error that has multipleoccurrences across days
■ View income generated across different tenders
Operational Insights for Retail Invoice MatchingOperational Insights provides integration of OBIEE reports into the Retail InvoiceMatch user interface. Oracle Retail Invoice Match is an invoice matching applicationthat allows users to verify merchandise invoice costs and quantities before payment.ReIM operational invoice dashboards and reports brings useful business intelligenceto the surface to assist with matching invoices and resolving discrepancies. The reportsand dashboards are designed for 2 unique roles; Accounts Payable Specialist andFinance Manager.
The Accounts Payable Specialist and Finance Manager can use Operational businessintelligence embedded within ReIM to help with day to day activities as follows:
■ Measure employee workload and group invoices by due date. Invoice countshould be shown for Past Due, Due today, Due tomorrow, 2 days out and 3 daysout.
■ Sort upcoming invoices that are due to be matched using an algorithm to help theuser prioritize their workload.

User Roles and Responsibilities
Introducing Oracle Retail Operational Insights 1-3
■ Provide additional visibility to invoices with a cash discount, cost/qty discrepancyand tax discrepancy and allow the user to contextually launch into the ReIMapplication to view or resolve discrepancies.
Operational Insights for Retail AllocationOperational Insights provides integration of OBIEE reports into the Allocation userinterface. Oracle Retail Allocation helps allocate merchandise against each store orwarehouse after determining the inventory requirements for the given item, location,and week using real time inventory information. Allocation Operational Insightsdashboards and contextual reports provide pervasive business intelligence and aredesigned to be embedded within the Allocation ADF application.
An allocator can use operational business intelligence embedded within Allocation tohelp in day-to-day activities as follows:
■ Be alerted to a PO that needs to be allocated close to the time of receipt.
■ Compare the stock versus sales for the given merchandise hierarchy to preventoverstocking or understocking.
■ View details of the Top Selling and Bottom Selling item in order to prioritizegetting the fast selling product in time on the sales floor.
■ View the Open to Buy budget while creating a what-if allocation to check forbudget overflows.
Operational Insights Data SourceOperational insights for ReSA - uses Retail Merchandising System (RMS) as the datasource for foundation data and ReSA tables as the data source for transactional data.
Operational insights for Allocation uses Retail Merchandising System (RMS) as thedata source for foundation data and RMS, Allocation and RPM tables as the datasource for transactional data.
Operational insights for ReIM uses Retail Merchandising System (RMS) as the datasource for foundation data and RMS, ReIM tables as the data source for transactionaldata.
User Roles and ResponsibilitiesIn the standard Operational Insights installation, the predefined reports are organizedin the dashboard to facilitate role-based implementation. Oracle Retail Sales AuditOperational Insights dashboards and reports are designed for different categories ofusers such as:
■ Auditor
■ Auditor Manager
Oracle Retail Allocation Operational Insights dashboard and reports are designed fordifferent categories of users such as:
■ Allocator
■ Allocation Manager
Oracle Retail Invoice Matching Operational Insights dashboard and reports aredesigned for different categories of users such as:
■ Accounts Payable Specialist
Operational Insights Language Options
1-4 Oracle Retail Operational Insights User Guide
■ Finance Manager
In addition to role based security Operational Insights is also built to provide datalevel security, as configured in RMS, which controls the visibility of data (contentrendered in subject areas, dashboards, Oracle BI answers, and so on) based on theuser's association to data in the transactional system.
See the Oracle Fusion Middleware Security Guide for Oracle Business Intelligence EnterpriseEdition to learn about authentication and user role configurations for an enterprise.
See the Operational Insights Security Guide chapters on ReSA, Allocation and ReIMfor data level security implementation.
Operational Insights Language OptionsThe reports are displayed in the same language as set up in the integratedmerchandise applications user preferences page. To set your preferred language accessthe user preferences page by clicking user name > Preferences at the top of the homepage of the application.
The following languages are supported by Operational Insights:
■ Chinese (Simplified)
■ Chinese (Traditional)
■ Croatian
■ Dutch
■ English
■ French
■ German
■ Greek
■ Hungarian
■ Italian
■ Japanese
■ Korean
■ Polish
■ Portuguese (Brazilian)
■ Russian
■ Spanish
■ Swedish
■ Turkish
OI Accessibility OptionsThe reports support the accessibility mode selected in the integrated merchandiseapplications user preferences page. To select the user preferences, click user name >Preferences at the top of the home page.

2
Pre-defined Operational Insights Reports 2-1
2Pre-defined Operational Insights Reports
Predefined reports are packaged with Operational Insights and are available for ReSA,Allocation, and ReIM as dashboard and contextual BI reports. You can use thesepackaged reports without modifications to begin reporting on your retail measures.You can also use these reports as foundation or examples for building your owncustom reports. In addition to the predefined reports, Operational Insights includes avariety of predefined fundamental metrics for Allocation and ReIM that can be usedfor creating custom reports.
Predefined OI Reports for ReSAReSA Operational Insights reports can be divided into the Dashboard Reports andContextual BI Reports. There reports are embedded within the ReSA ADF application.Ad-hoc creation of reports and dashboards in a standalone OBIEE environment is notan out of box feature.
Dashboard ReportsThe dashboard surfaces information in a manner that will help users - Sales auditors -prioritize their day-to-day activities as well as quickly identify areas of concern. Thedashboard allows a user to look at a consolidated view of their 'to-dos' and thendirectly and contextually launch into the corresponding ReSA windows to take anaction. The Dashboard Reports show data across assigned stores i.e the storesassigned to the logged in user.
Via the dashboard, a Sales Auditor can at a glance identify store days that are still opendue to errors or late polling by stores and can resolve or escalate the issues.
A view of all open transactional errors across his stores for the last seven days isavailable that helps him see error patterns and helps estimate his workload in fixingthem. The auditor can then start fixing the errors by launching the respective ReSAwindows directly from the links provided in the dashboard reports.
The over short summary report helps the sales auditor in the important function oftracking the overages or shortages at his stores and identifying fraudulent behavior.
The dashboard reports can be viewed by navigating to Tasks > Dashboard > ReSADashboard in ReSA.
Predefined OI Reports for ReSA
2-2 Oracle Retail Operational Insights User Guide
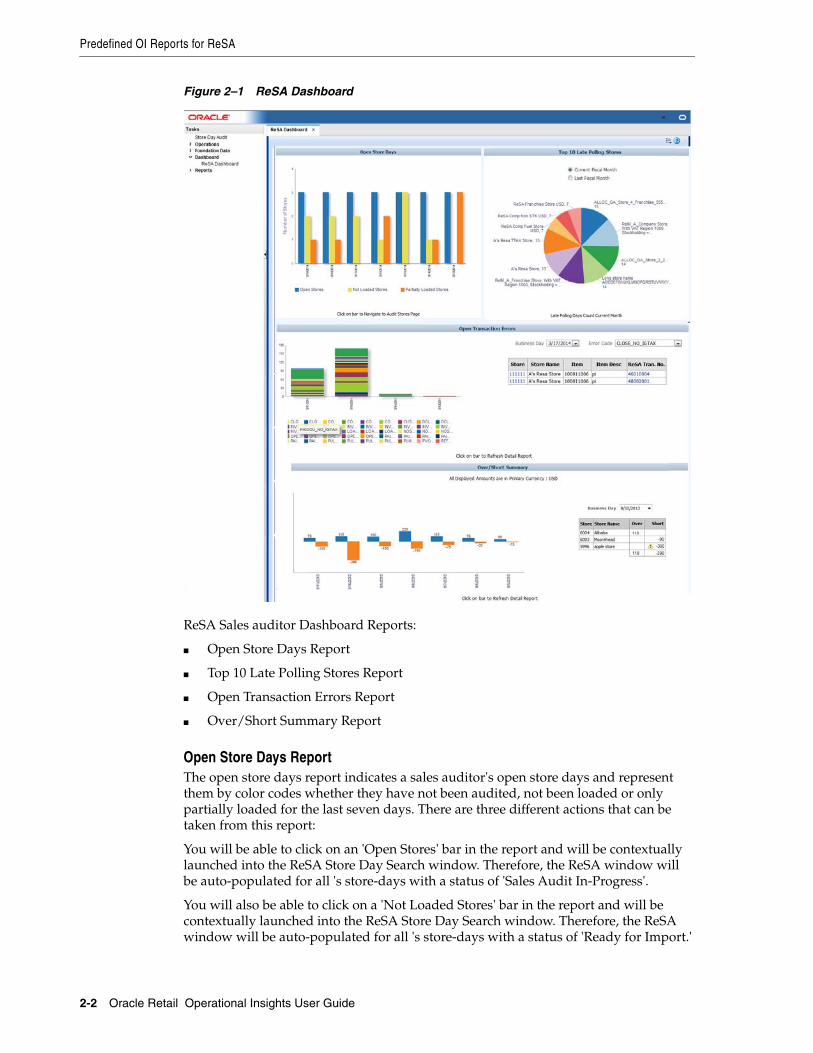
Figure 2–1 ReSA Dashboard
ReSA Sales auditor Dashboard Reports:
■ Open Store Days Report
■ Top 10 Late Polling Stores Report
■ Open Transaction Errors Report
■ Over/Short Summary Report
Open Store Days ReportThe open store days report indicates a sales auditor's open store days and representthem by color codes whether they have not been audited, not been loaded or onlypartially loaded for the last seven days. There are three different actions that can betaken from this report:
You will be able to click on an 'Open Stores' bar in the report and will be contextuallylaunched into the ReSA Store Day Search window. Therefore, the ReSA window willbe auto-populated for all 's store-days with a status of 'Sales Audit In-Progress'.
You will also be able to click on a 'Not Loaded Stores' bar in the report and will becontextually launched into the ReSA Store Day Search window. Therefore, the ReSAwindow will be auto-populated for all 's store-days with a status of 'Ready for Import.'

Predefined OI Reports for ReSA
Pre-defined Operational Insights Reports 2-3
You will be able to click on a 'Partially Loaded Stores' bar in the report and will becontextually launched into the ReSA Store Day Search window. Therefore, the ReSAwindow will be auto-populated for all 's store-days with a status of Partially Loaded.
Note: Only days for which data exists will be shown in the report.
Figure 2–2 Open Store Days Report
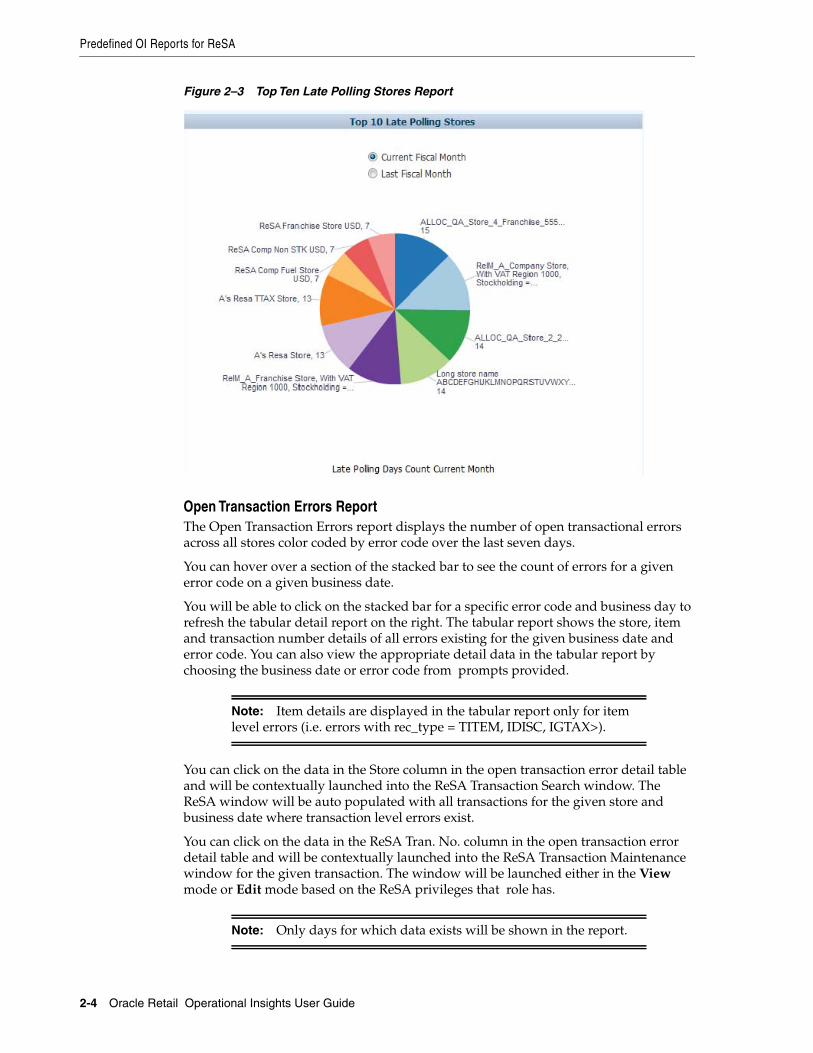
Top Ten Late Polling Stores ReportThe top 10 late polling report gives the auditor a view of top 10 stores that have thehighest number of late polling days in a given fiscal month. This report shows thecount of store days in status Ready to Import or Partially loaded per store for theCurrent Fiscal Month or Last Fiscal Month based on view selected. This will displaythe stores that have the maximum number of data loading issues for a given timeperiod. Based on this analysis the Auditor can contact these stores or escalate them ashigh issue stores to management.
Predefined OI Reports for ReSA
2-4 Oracle Retail Operational Insights User Guide
Figure 2–3 Top Ten Late Polling Stores Report
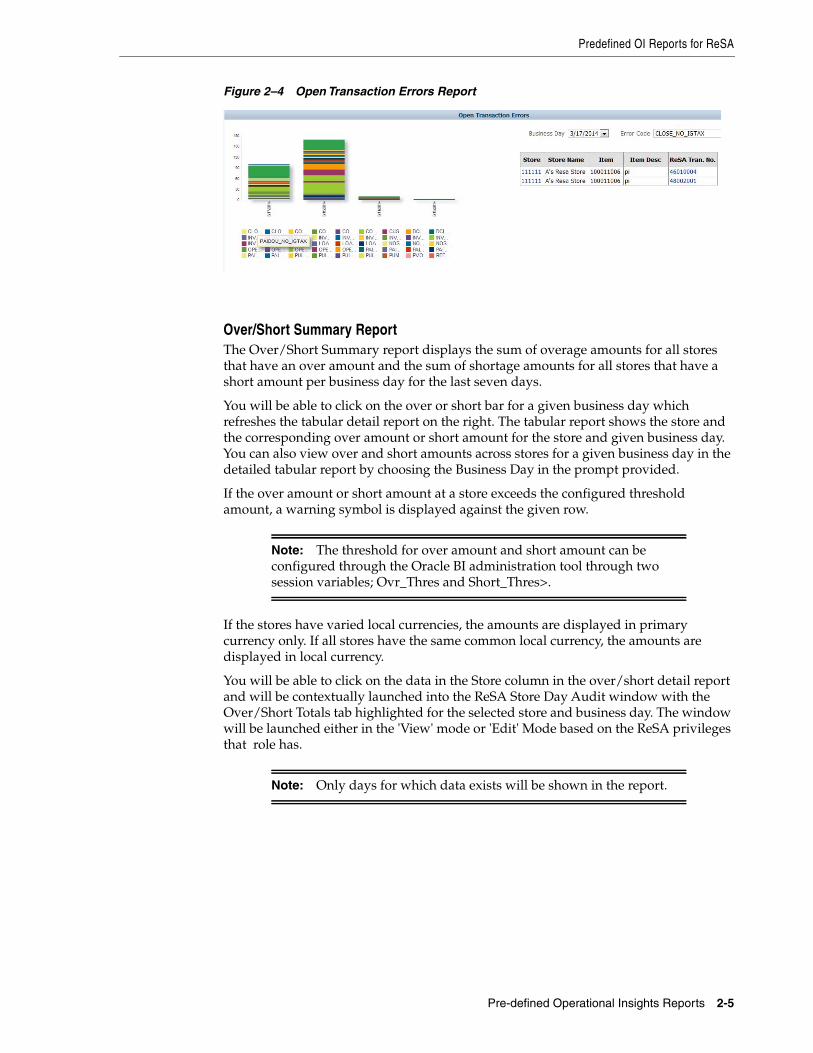
Open Transaction Errors ReportThe Open Transaction Errors report displays the number of open transactional errorsacross all stores color coded by error code over the last seven days.
You can hover over a section of the stacked bar to see the count of errors for a givenerror code on a given business date.
You will be able to click on the stacked bar for a specific error code and business day torefresh the tabular detail report on the right. The tabular report shows the store, itemand transaction number details of all errors existing for the given business date anderror code. You can also view the appropriate detail data in the tabular report bychoosing the business date or error code from prompts provided.
Note: Item details are displayed in the tabular report only for itemlevel errors (i.e. errors with rec_type = TITEM, IDISC, IGTAX>).
You can click on the data in the Store column in the open transaction error detail tableand will be contextually launched into the ReSA Transaction Search window. TheReSA window will be auto populated with all transactions for the given store andbusiness date where transaction level errors exist.
You can click on the data in the ReSA Tran. No. column in the open transaction errordetail table and will be contextually launched into the ReSA Transaction Maintenancewindow for the given transaction. The window will be launched either in the Viewmode or Edit mode based on the ReSA privileges that role has.
Note: Only days for which data exists will be shown in the report.
Predefined OI Reports for ReSA
Pre-defined Operational Insights Reports 2-5
Figure 2–4 Open Transaction Errors Report
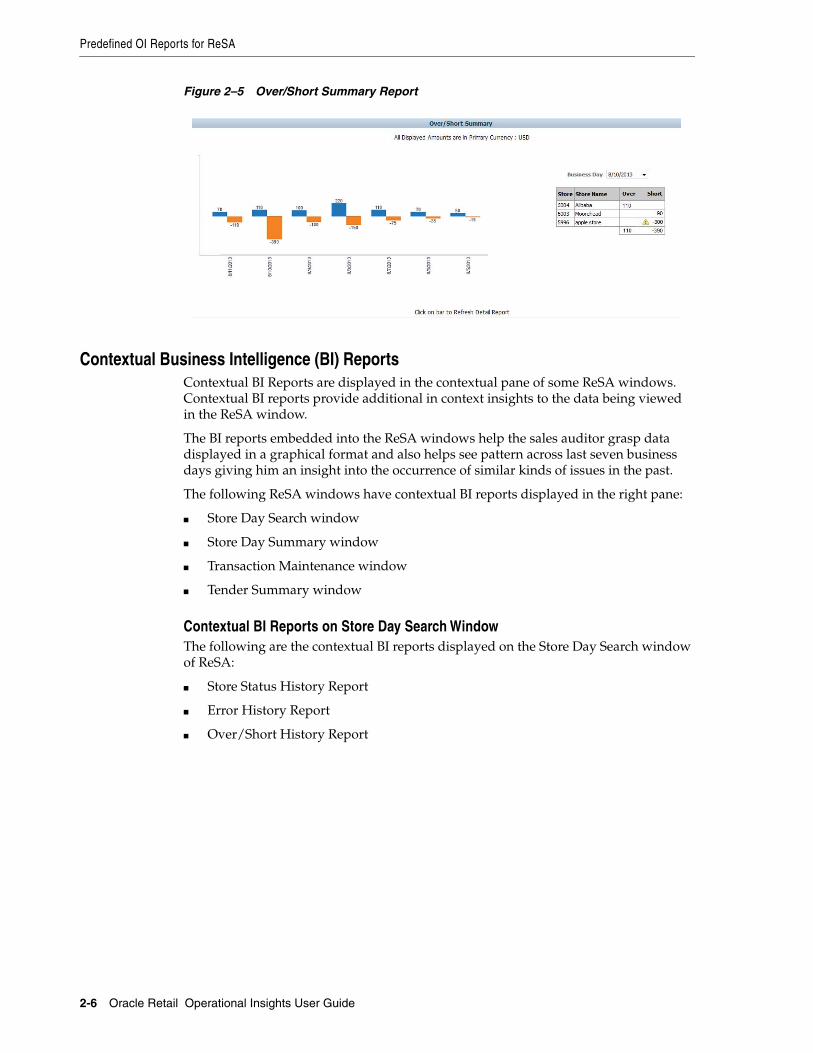
Over/Short Summary ReportThe Over/Short Summary report displays the sum of overage amounts for all storesthat have an over amount and the sum of shortage amounts for all stores that have ashort amount per business day for the last seven days.
You will be able to click on the over or short bar for a given business day whichrefreshes the tabular detail report on the right. The tabular report shows the store andthe corresponding over amount or short amount for the store and given business day.You can also view over and short amounts across stores for a given business day in thedetailed tabular report by choosing the Business Day in the prompt provided.
If the over amount or short amount at a store exceeds the configured thresholdamount, a warning symbol is displayed against the given row.
Note: The threshold for over amount and short amount can beconfigured through the Oracle BI administration tool through twosession variables; Ovr_Thres and Short_Thres>.
If the stores have varied local currencies, the amounts are displayed in primarycurrency only. If all stores have the same common local currency, the amounts aredisplayed in local currency.
You will be able to click on the data in the Store column in the over/short detail reportand will be contextually launched into the ReSA Store Day Audit window with theOver/Short Totals tab highlighted for the selected store and business day. The windowwill be launched either in the 'View' mode or 'Edit' Mode based on the ReSA privilegesthat role has.
Note: Only days for which data exists will be shown in the report.
Predefined OI Reports for ReSA
2-6 Oracle Retail Operational Insights User Guide
Figure 2–5 Over/Short Summary Report
Contextual Business Intelligence (BI) ReportsContextual BI Reports are displayed in the contextual pane of some ReSA windows.Contextual BI reports provide additional in context insights to the data being viewedin the ReSA window.
The BI reports embedded into the ReSA windows help the sales auditor grasp datadisplayed in a graphical format and also helps see pattern across last seven businessdays giving him an insight into the occurrence of similar kinds of issues in the past.
The following ReSA windows have contextual BI reports displayed in the right pane:
■ Store Day Search window
■ Store Day Summary window
■ Transaction Maintenance window
■ Tender Summary window
Contextual BI Reports on Store Day Search WindowThe following are the contextual BI reports displayed on the Store Day Search windowof ReSA:
■ Store Status History Report
■ Error History Report
■ Over/Short History Report

Predefined OI Reports for ReSA
Pre-defined Operational Insights Reports 2-7
Figure 2–6 Store Day Search Window
Store Status History Report The store status history report on store day search windowindicates a sales auditor's open store days and represent them by color codes whetherthey have not been audited, not been loaded or only partially loaded for the last sevendays. You can also hover over the bar charts to view the count.
Note: Only days for which data exists will be shown in the report.
Figure 2–7 Store Status History Report
Predefined OI Reports for ReSA
2-8 Oracle Retail Operational Insights User Guide
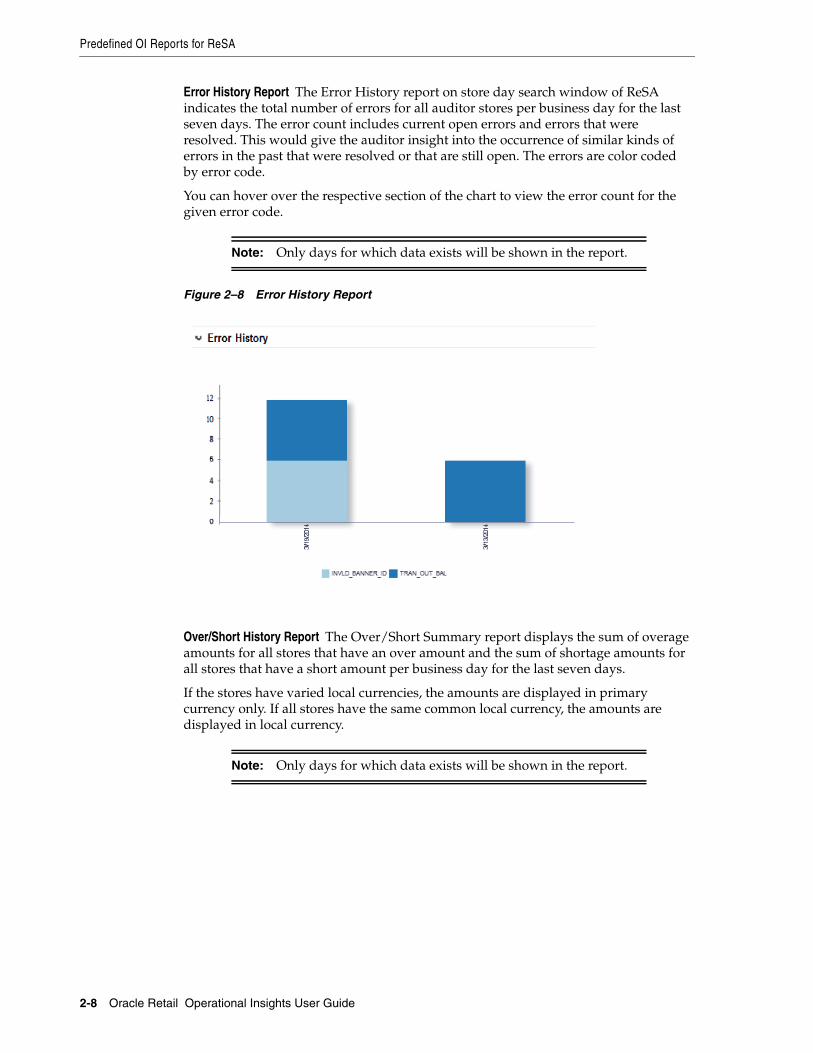
Error History Report The Error History report on store day search window of ReSAindicates the total number of errors for all auditor stores per business day for the lastseven days. The error count includes current open errors and errors that wereresolved. This would give the auditor insight into the occurrence of similar kinds oferrors in the past that were resolved or that are still open. The errors are color codedby error code.
You can hover over the respective section of the chart to view the error count for thegiven error code.
Note: Only days for which data exists will be shown in the report.
Figure 2–8 Error History Report
Over/Short History Report The Over/Short Summary report displays the sum of overageamounts for all stores that have an over amount and the sum of shortage amounts forall stores that have a short amount per business day for the last seven days.
If the stores have varied local currencies, the amounts are displayed in primarycurrency only. If all stores have the same common local currency, the amounts aredisplayed in local currency.
Note: Only days for which data exists will be shown in the report.

Predefined OI Reports for ReSA
Pre-defined Operational Insights Reports 2-9
Figure 2–9 Over/Short History Report
Contextual BI Reports on Store Day Summary WindowThe following are the contextual BI reports displayed on the Store Day Summarywindow of ReSA:
■ Store Status History Report
■ Error History Report
■ Cashier/Register Over Short Report
Figure 2–10 Store Day Summary Window

Predefined OI Reports for ReSA
2-10 Oracle Retail Operational Insights User Guide
Store Status History Report The store status history report on store day summarywindow indicates the presence of not audited store days, not loaded store days, andpartially loaded store days across the last seven days for the store that is being viewedin store day summary window. An indicator signifies if the given store is not audited,is not loaded or is partially loaded for the last seven business days.
Note: Only days for which data exists will be shown in the report.
Figure 2–11 Store Status History Report
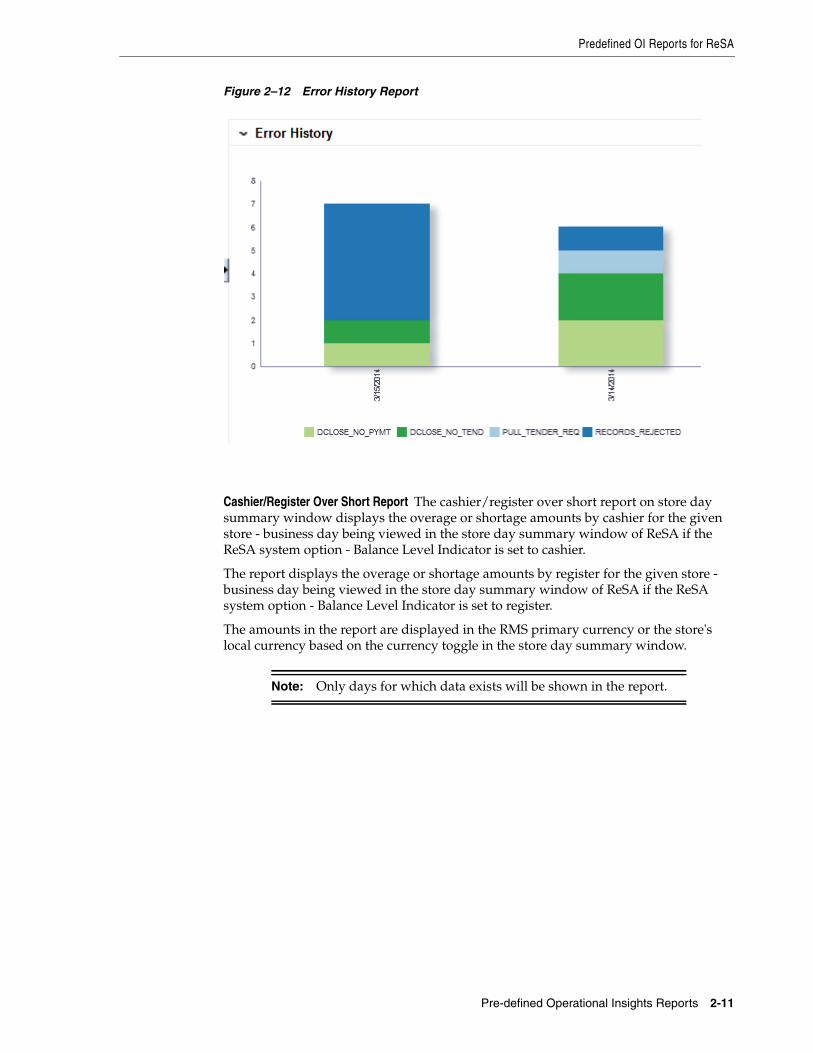
Error History Report The error history report on store day summary window indicatesthe pattern of the errors existing for the store day being viewed in the store daysummary window of ReSA over that last seven days.
The report indicates the number of occurrences of errors similar to the errors open forthe selected store day over the last seven days.
The error count includes both open errors and errors that were resolved for the storedays. This would give the auditor insight into the occurrence of similar kinds of errorsin the past that were resolved or that are still open. The errors are grouped and colorcoded by error code.
You can hover over a section of the chart to view the error count for the given errorcode and business day.
Note: Only days for which data exists will be shown in the report.
Predefined OI Reports for ReSA
Pre-defined Operational Insights Reports 2-11
Figure 2–12 Error History Report
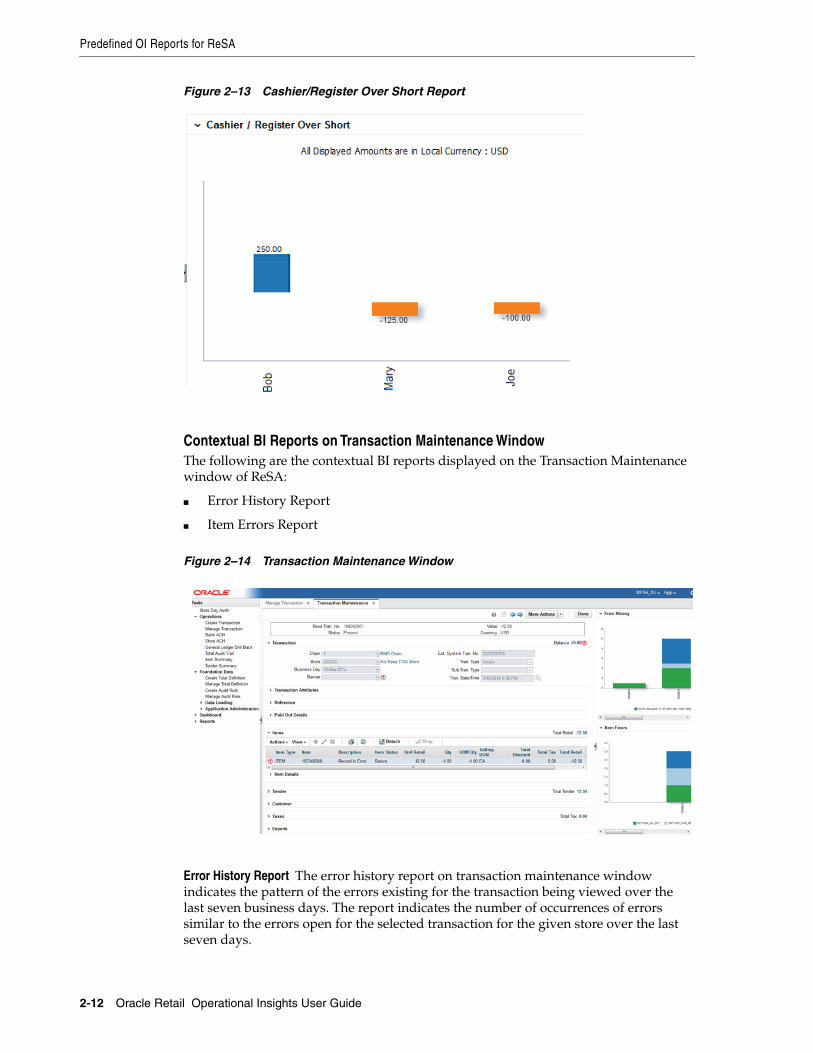
Cashier/Register Over Short Report The cashier/register over short report on store daysummary window displays the overage or shortage amounts by cashier for the givenstore - business day being viewed in the store day summary window of ReSA if theReSA system option - Balance Level Indicator is set to cashier.
The report displays the overage or shortage amounts by register for the given store -business day being viewed in the store day summary window of ReSA if the ReSAsystem option - Balance Level Indicator is set to register.
The amounts in the report are displayed in the RMS primary currency or the store'slocal currency based on the currency toggle in the store day summary window.
Note: Only days for which data exists will be shown in the report.
Predefined OI Reports for ReSA
2-12 Oracle Retail Operational Insights User Guide
Figure 2–13 Cashier/Register Over Short Report
Contextual BI Reports on Transaction Maintenance WindowThe following are the contextual BI reports displayed on the Transaction Maintenancewindow of ReSA:
■ Error History Report
■ Item Errors Report
Figure 2–14 Transaction Maintenance Window
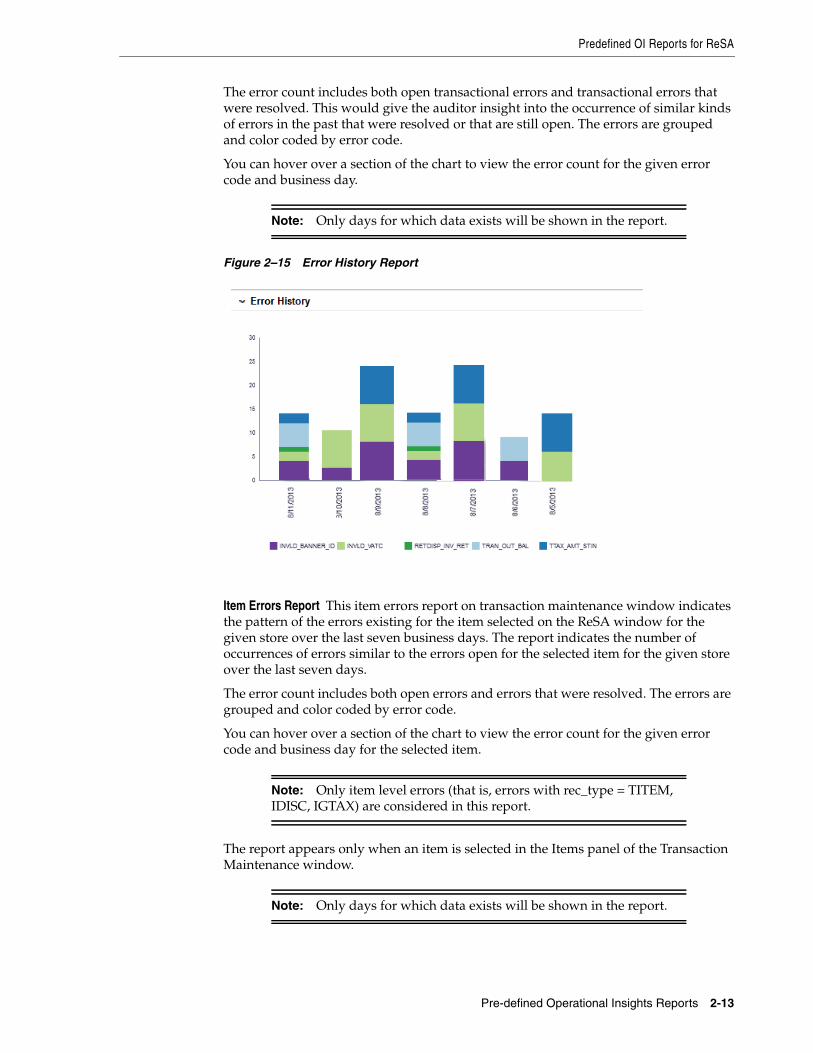
Error History Report The error history report on transaction maintenance windowindicates the pattern of the errors existing for the transaction being viewed over thelast seven business days. The report indicates the number of occurrences of errorssimilar to the errors open for the selected transaction for the given store over the lastseven days.
Predefined OI Reports for ReSA
Pre-defined Operational Insights Reports 2-13
The error count includes both open transactional errors and transactional errors thatwere resolved. This would give the auditor insight into the occurrence of similar kindsof errors in the past that were resolved or that are still open. The errors are groupedand color coded by error code.
You can hover over a section of the chart to view the error count for the given errorcode and business day.
Note: Only days for which data exists will be shown in the report.
Figure 2–15 Error History Report
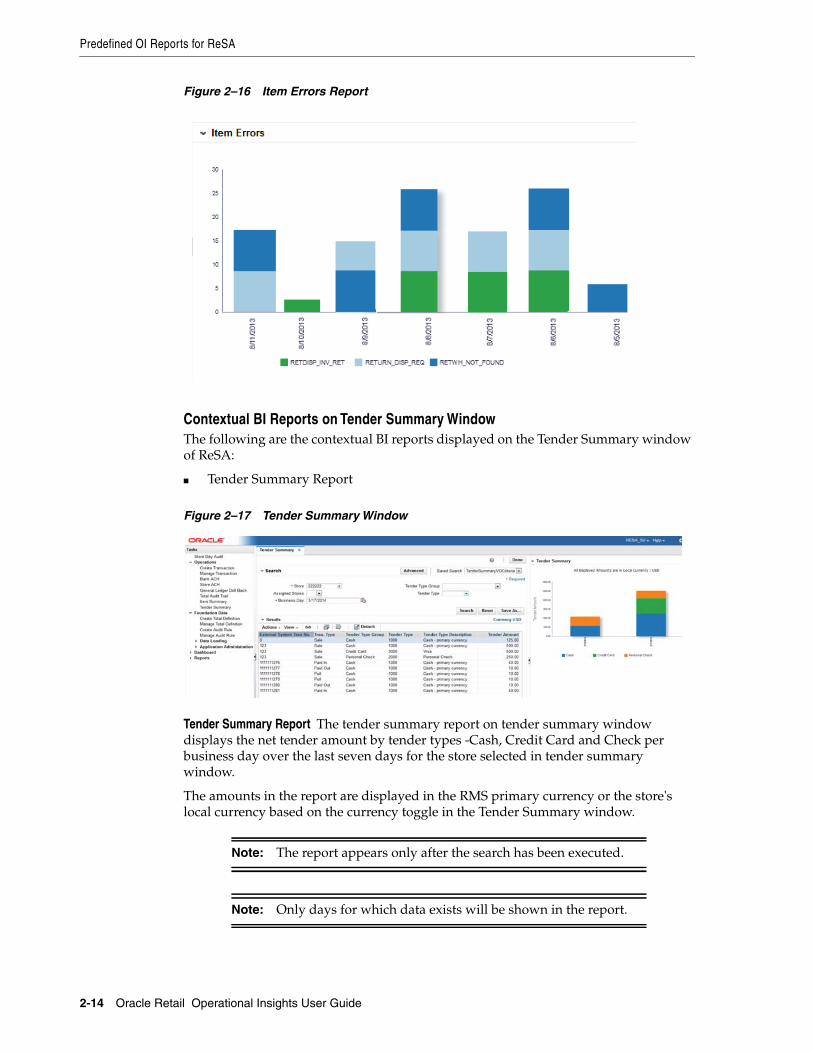
Item Errors Report This item errors report on transaction maintenance window indicatesthe pattern of the errors existing for the item selected on the ReSA window for thegiven store over the last seven business days. The report indicates the number ofoccurrences of errors similar to the errors open for the selected item for the given storeover the last seven days.
The error count includes both open errors and errors that were resolved. The errors aregrouped and color coded by error code.
You can hover over a section of the chart to view the error count for the given errorcode and business day for the selected item.
Note: Only item level errors (that is, errors with rec_type = TITEM,IDISC, IGTAX) are considered in this report.
The report appears only when an item is selected in the Items panel of the TransactionMaintenance window.
Note: Only days for which data exists will be shown in the report.
Predefined OI Reports for ReSA
2-14 Oracle Retail Operational Insights User Guide
Figure 2–16 Item Errors Report
Contextual BI Reports on Tender Summary WindowThe following are the contextual BI reports displayed on the Tender Summary windowof ReSA:
■ Tender Summary Report
Figure 2–17 Tender Summary Window
Tender Summary Report The tender summary report on tender summary windowdisplays the net tender amount by tender types -Cash, Credit Card and Check perbusiness day over the last seven days for the store selected in tender summarywindow.
The amounts in the report are displayed in the RMS primary currency or the store'slocal currency based on the currency toggle in the Tender Summary window.
Note: The report appears only after the search has been executed.
Note: Only days for which data exists will be shown in the report.

Predefined OI Reports for Allocation
Pre-defined Operational Insights Reports 2-15
Figure 2–18 Tender Summary Report
Support for Primary Currency and Local CurrencyReSA supports viewing amounts both in RMS primary currency and in the store localcurrency. The Operational insights reports support this in the following way.
For the following reports where amounts are aggregated across stores, if the auditorhas stores assigned that have varied local currencies, the amounts are displayed inprimary currency only. If all stores have the same common local currency, the amountsare displayed in local currency.
■ Over/Short Summary Report on Dashboard
■ Over/Short History Report on Store Day Search Window
For the following reports where amounts are displayed for a single store selected inthe ReSA window, the values are displayed in the currency selected in the currencytoggle of the corresponding ReSA window (Primary or Local). On window launch,Local Currency is the default.
■ Cashier/Register Over Short Report on Store Day Summary Window
■ Tender Summary Report on Tender Summary Window
Predefined OI Reports for AllocationAllocation Operational Insights reports can be divided into the Dashboard Reportsand Contextual BI Reports. These reports are embedded within the Allocation ADFapplication if the Allocation application has been installed with the OperationalInsights turned on. Ad-hoc creation of reports and dashboards utilizing the metricscreated in a standalone OBIEE environment by the Administrator is supported.
Predefined OI Reports for Allocation
2-16 Oracle Retail Operational Insights User Guide
Setting up System Options in Allocation for Operational Insights ReportsThe data reported and the alert conditions in some of the reports is configurable via adatabase table. This chapter details out the configuration parameters for OI reports forAllocation.
The ALC_SYSTEM_OPTIONS_OI table drives the configuration parameters for thesereports.
Table 2–1 ALC_SYSTEM_OPTIONS_OI
System Option Definition
Need Calculation Type The Allocated to Plan/Forecast report has the ability to comparethe allocated quantity to either the Forecast or the Plan data.Retailers can configure this parameter based on the data theyhave available for their items. Values - P;F
Simple Promo Only When set to 'Y' the promotion flag is displayed only for simplepromotions in the PO Arrival report.
When set to 'N' the promotion flag is displayed for both simpleand complex promotions in the PO Arrival report.
PO Allocation Timethreshold
Number of days before the not after date of the purchase orderthat the retailer expects a quantity greater than the PercentageAllocated PO Threshold to be allocated.
Percentage Allocated POThreshold
The percentage of the warehouse order quantity against thegiven PO that is expected to be allocated within the POAllocation Time Threshold defined.
Dashboard ReportsThe dashboard surfaces information in a manner that will give allocators visibility tothe highest priority tasks, such as incoming POs that need allocating or re-allocatingand visibility to potential stock shortages in stores based on sales forecasts. Thedashboard also provides a quick way for the allocator to take action on these alerts bylaunching them contextually into the appropriate Allocation windows.
The dashboard reports can be viewed by navigating to Tasks > Dashboard > AllocatorDashboard in Allocation. The dashboard is the default landing page for Allocation.
Users can filter data across the dashboard reports by selecting appropriate values inthe prompts provided. You must select the department, class, and subclass whichprompts to filter the data displayed in the reports.
Allocator Dashboard Reports:
■ Purchase Order Arrivals Report
■ Stock to Sales Report
■ Sales – Top Report
■ Sales – Bottom Report

Predefined OI Reports for Allocation
Pre-defined Operational Insights Reports 2-17
Figure 2–19 Allocator Dashboard Report
Purchase Order Arrivals Report
Figure 2–20 Purchase Order Arrivals Report

Predefined OI Reports for Allocation
2-18 Oracle Retail Operational Insights User Guide
The report consists of two parts:
1. Tile view that displays the number of POs that are incoming segregated by theirnot after date in This Week, Next Week, 2 Weeks Out and 3 Weeks Out,respectively. The report also indicates the number split of these incoming PO’s thatare fully allocated and partially allocated. You can view the pie chart to deduce theratio of the incoming POs that are fully allocated, partially allocated andunallocated. You can select a tile to view the details of the POs in a table belowthat are expected to be received in the given time bucket. By default, the ‘ThisWeek’ tile is selected.
2. Tabular report that lists the POs and the corresponding ordered quantities that areexpected to be received in the time line corresponding to selected tile. Below POdetails can be viewed:
a. Supplier Site against which the PO is raised
b. ’Not Before Date’ and ’Not After Date’ of the PO i.e the time window withinwhich the PO is expected to be received
c. ’Next Shipment Date’ i.e the date when the next shipment is expected to bereceived for the given PO
d. Ordered Qty i.e the remaining ordered quantity that is expected to be receivedin the chosen time period
e. Allocated %, which is the percentage of the ordered qty that has already beenallocated for a given PO
An alert is displayed against the POs that have not yet been allocated above thedefined Percentage Allocated PO Threshold beyond the PO Allocation Time threshold.For example, if the Percentage Allocated PO Threshold is set to 80% and the POAllocation Time Threshold is set to 5 days, and if the order quantity expected to bereceived is 100, then an alert is displayed for a PO that has a Not After Date that is lessthan 5 days from today and if the already allocated quantity against the PO is less than80.
The report also indicates if any of the items on the given PO is on a promotion duringthe given time period as additional guidance in prioritizing the allocation process.
Using the below action links, the allocator can launch the Allocation Maintenancewindow to create or edit allocations.
■ Allocate PO – You can click on the allocate PO icon to initiate a workflow to createan allocation for all items on the Purchase Order for the quantities expected to bereceived on the PO. The allocate PO is displayed only if the quantity against thePO that is yet to be received has not yet been completely allocated.
■ Reallocate - You can click on the Reallocate icon to initiate a workflow to edit anexisting allocation associated to the given PO. This is displayed only if anallocation already exists for the given PO. In case multiple allocations exist againstthe same PO, the allocation that was created most recently will be launched.
You can click on the purchase order number hyper link and contextually launch thePO Header Maintenance window of RMS and view the purchase order details.
Note: If the items on a given PO have varied UOM, Multi UOM isdisplayed in the Ordered Qty field, as quantity aggregation cannot beperformed across multiple UOM.

Predefined OI Reports for Allocation
Pre-defined Operational Insights Reports 2-19
Stock to Sales ReportThe Stock to Sales report compares the stock available for sale at the beginning of thegiven week and the corresponding sales achieved by the end of the same week. Datafor six weeks prior to the current week can be viewed in this report. The stock andsales is aggregated across all items belonging to the Department/Class/Subclassselected in the prompts and group of stores that source from the selected VWH.
The report also plots the trend of Stock to Sales ratio for six previous weeks to providehistorical context to the allocator of the inventory levels in their stores and help gaugewhere overage or shortage situations occurred.
Figure 2–21 Stock to Sales Report
Sales - Top ReportThe Sales - Top report displays the top selling item across theDepartment/Class/Subclass selected in the prompts for a day prior to the currentbusiness day.
Additional data on the given item such as the item image, total sales units, retail valueof sales and the margin can be viewed.
Note: For fashion items, the top seller will represent an item parent -diff aggregate.
Figure 2–22 Sales - Top Report
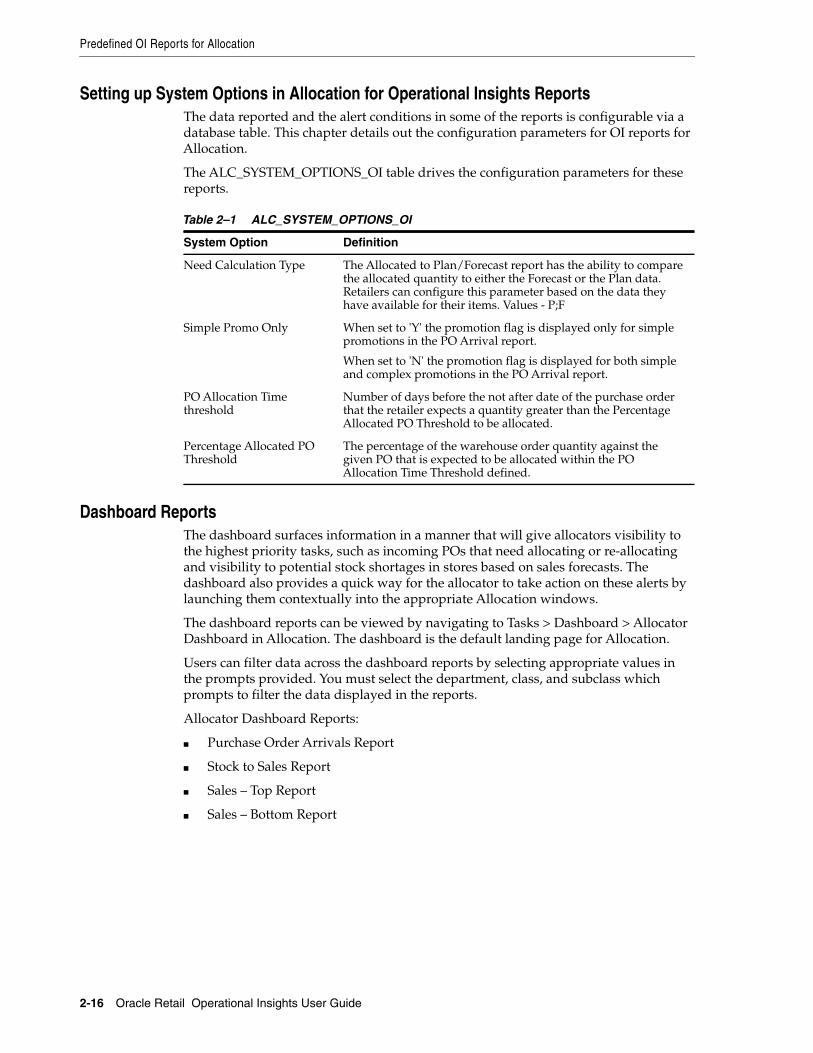
Sales - Bottom ReportThe Sales - Bottom report displays the least selling item across theDepartment/Class/Subclass selected in the prompts for a day prior to the currentbusiness day.
Predefined OI Reports for Allocation
2-20 Oracle Retail Operational Insights User Guide
Additional data on the given item such as the item image, total sales units, retail valueof sales and the margin can be viewed.
Note: For fashion items, the bottom seller will represent an itemparent - diff aggregate.
Figure 2–23 Sales - Bottom Report
Contextual Business Intelligence (BI) ReportsContextual BI Reports are displayed in the contextual pane of some Allocationwindows. Contextual BI reports provide additional in context insights to the databeing viewed in the Allocation window.
The following Allocation windows have contextual BI reports displayed in the rightpane:
■ Allocation Maintenance Window
■ What If Allocation Window
Contextual BI Reports on Allocation Maintenance WindowThe following are the contextual BI reports displayed on the Allocation Maintenancewindow:
■ Stock to Sales/Issues Report
■ Allocated to Plan/Forecast Report

Predefined OI Reports for Allocation
Pre-defined Operational Insights Reports 2-21
Figure 2–24 Allocation Maintenance Window

Predefined OI Reports for Allocation
2-22 Oracle Retail Operational Insights User Guide
Stock to Sales/Issues Report The stock to Sales/Issues report displays the stock availablefor sale at the beginning of the given week and the corresponding sales at the givenstore or issues at the given warehouse achieved by the end of the same week. Data forfour weeks prior to the current week can be viewed in this report. The report also plotsthe trend of Stock to Sales ratio across four previous weeks.
As a user moves between rows in the 'Results' table in the Allocation Maintenancewindow, the report will refresh to show information contextual to the item and the 'to'location corresponding to the row highlighted.
Figure 2–25 Stock to Sales/Issues Report
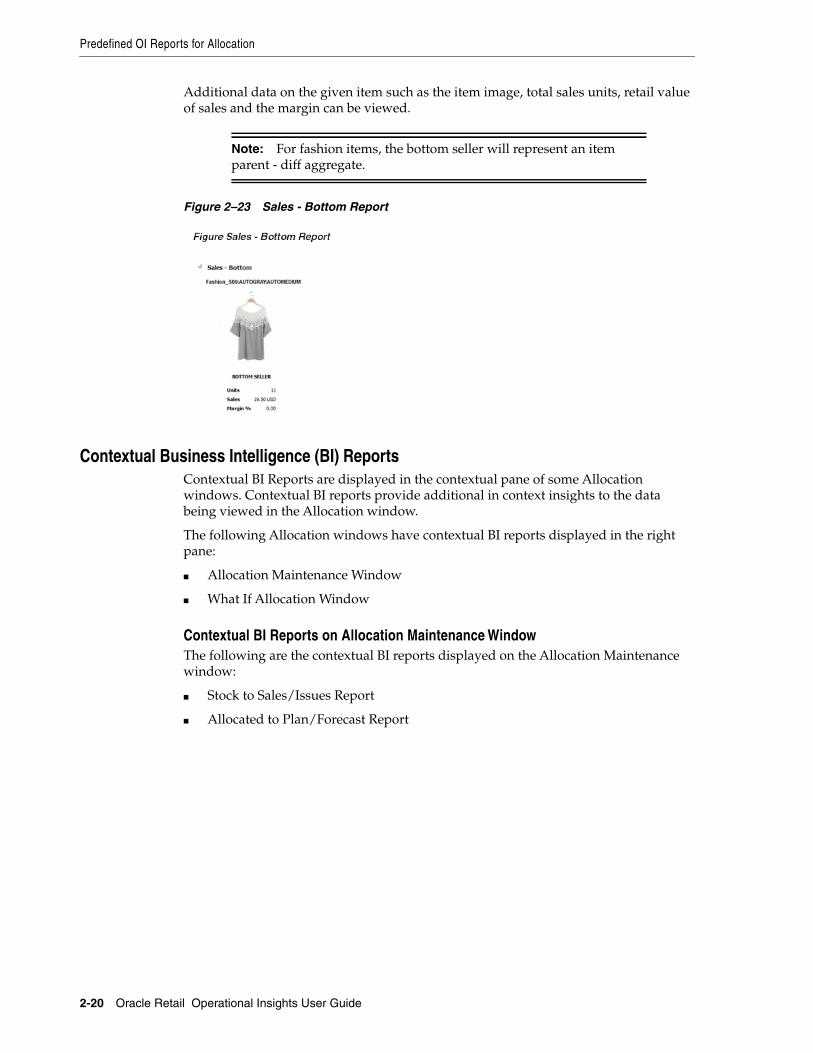
Allocated to Plan/Forecast Report The Allocated to Plan/Forecast report is to be usedprimarily for pre-season allocation decision-making, before there is stock available atthe stores. It shows the relationship between the need at a location, displayed as thesales forecast or sales plan for the next 4 weeks, and the allocations that are scheduledfor delivery in those weeks. The forecasted item need is used if the NEEDCALCULATION TYPE = Forecast and the plan need is used if NEED CALCULATIONTYPE = Plan.
As a user moves between rows in the 'Results' table in the Allocation Maintenancewindow, the report will refresh to show information contextual to the item and the 'to'location corresponding to the row highlighted.
Figure 2–26 Allocated to Plan/Forecast report; Need Calculation Type = Forecast
Predefined OI Reports for Allocation
Pre-defined Operational Insights Reports 2-23
Figure 2–27 Allocated to Plan/Forecast report; Need Calculation Type = Plan
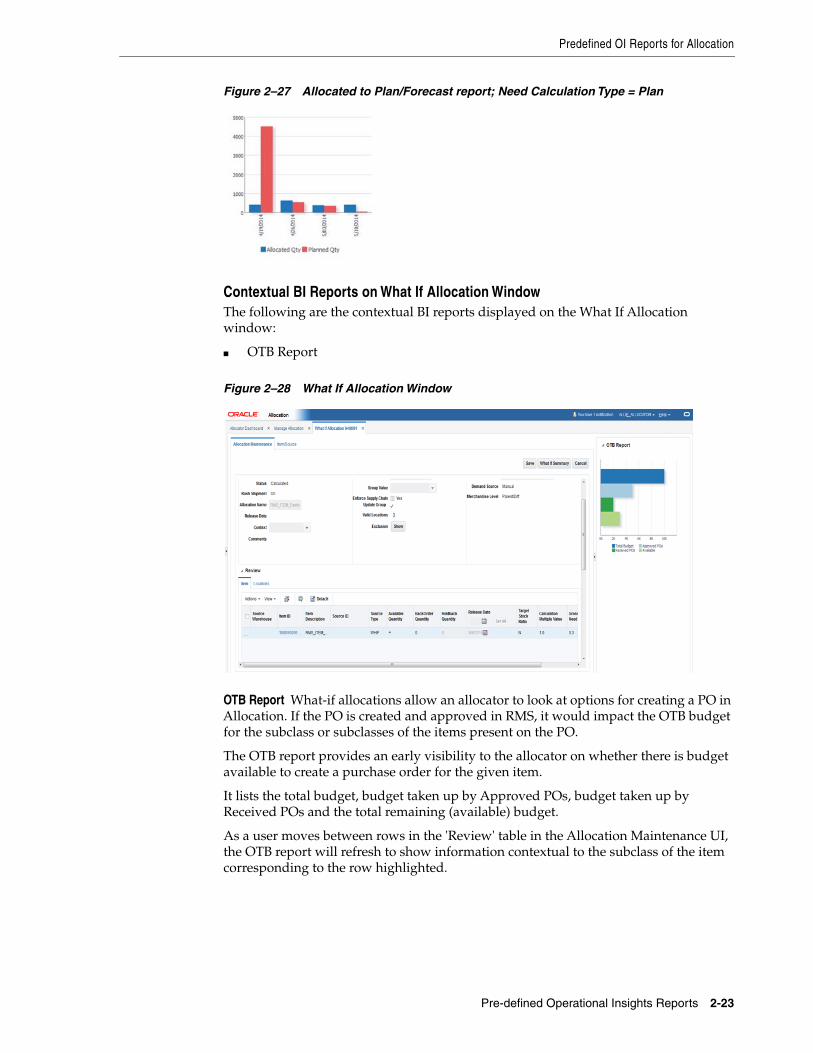
Contextual BI Reports on What If Allocation WindowThe following are the contextual BI reports displayed on the What If Allocationwindow:
■ OTB Report
Figure 2–28 What If Allocation Window
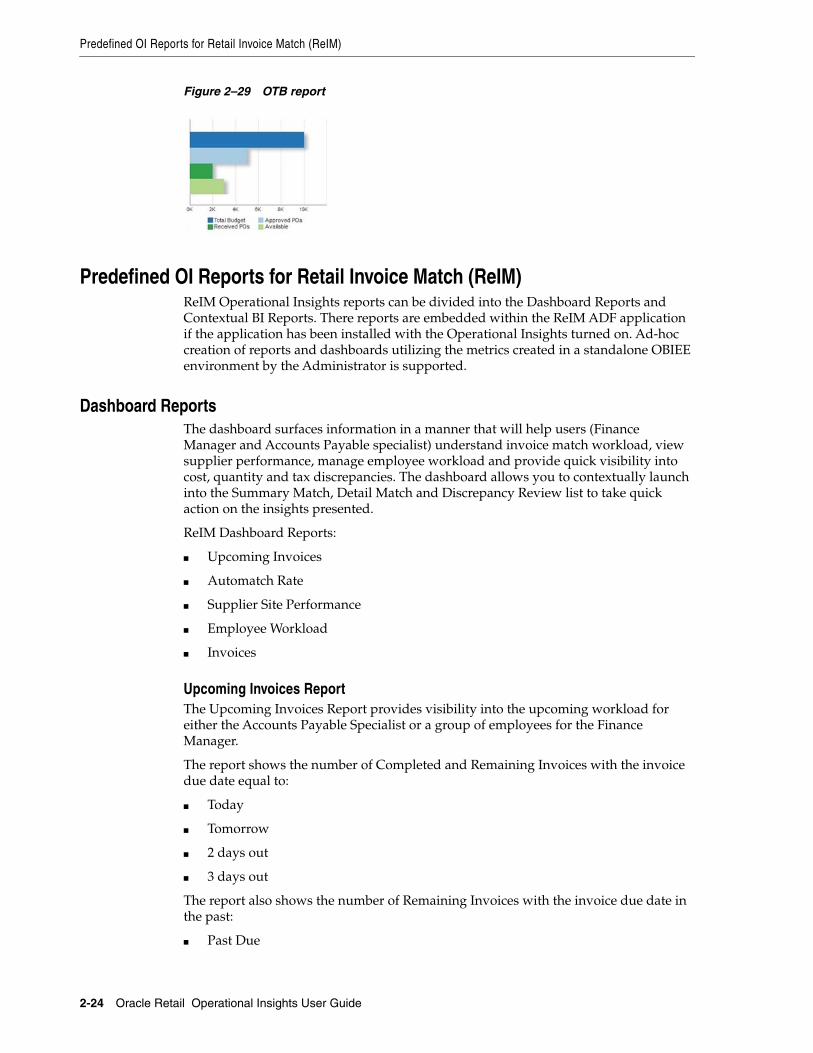
OTB Report What-if allocations allow an allocator to look at options for creating a PO inAllocation. If the PO is created and approved in RMS, it would impact the OTB budgetfor the subclass or subclasses of the items present on the PO.
The OTB report provides an early visibility to the allocator on whether there is budgetavailable to create a purchase order for the given item.
It lists the total budget, budget taken up by Approved POs, budget taken up byReceived POs and the total remaining (available) budget.
As a user moves between rows in the 'Review' table in the Allocation Maintenance UI,the OTB report will refresh to show information contextual to the subclass of the itemcorresponding to the row highlighted.
Predefined OI Reports for Retail Invoice Match (ReIM)
2-24 Oracle Retail Operational Insights User Guide
Figure 2–29 OTB report
Predefined OI Reports for Retail Invoice Match (ReIM)ReIM Operational Insights reports can be divided into the Dashboard Reports andContextual BI Reports. There reports are embedded within the ReIM ADF applicationif the application has been installed with the Operational Insights turned on. Ad-hoccreation of reports and dashboards utilizing the metrics created in a standalone OBIEEenvironment by the Administrator is supported.
Dashboard ReportsThe dashboard surfaces information in a manner that will help users (FinanceManager and Accounts Payable specialist) understand invoice match workload, viewsupplier performance, manage employee workload and provide quick visibility intocost, quantity and tax discrepancies. The dashboard allows you to contextually launchinto the Summary Match, Detail Match and Discrepancy Review list to take quickaction on the insights presented.
ReIM Dashboard Reports:
■ Upcoming Invoices
■ Automatch Rate
■ Supplier Site Performance
■ Employee Workload
■ Invoices
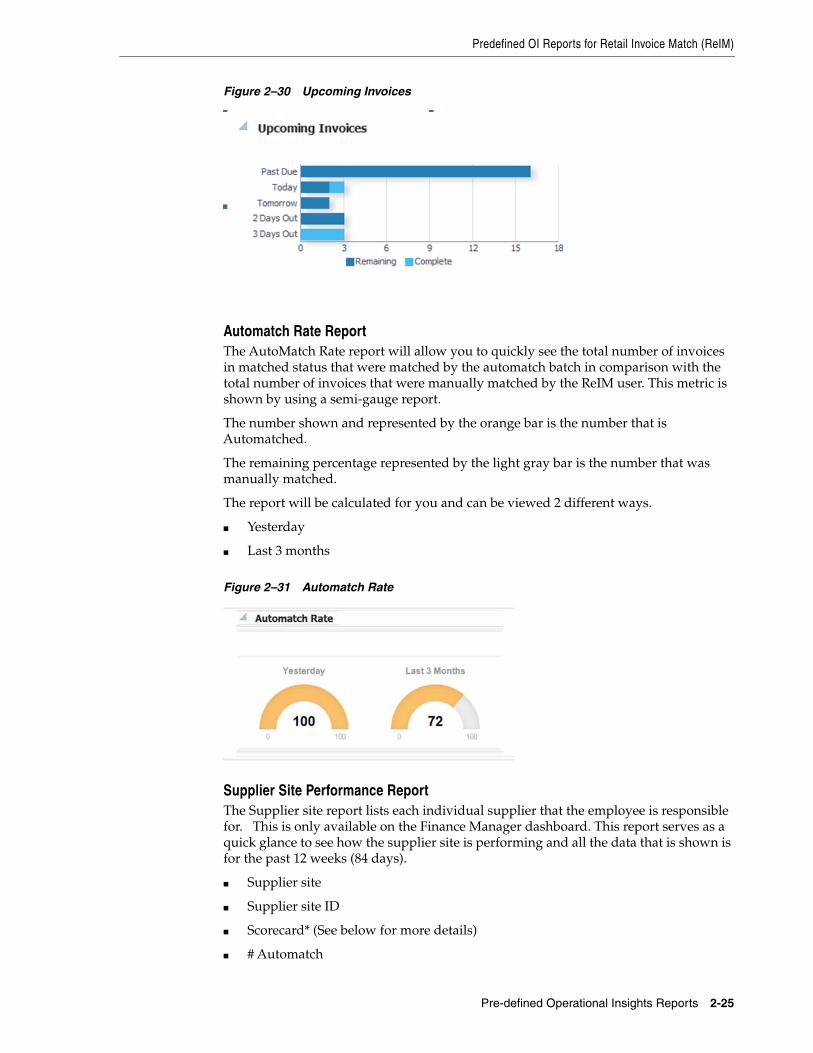
Upcoming Invoices ReportThe Upcoming Invoices Report provides visibility into the upcoming workload foreither the Accounts Payable Specialist or a group of employees for the FinanceManager.
The report shows the number of Completed and Remaining Invoices with the invoicedue date equal to:
■ Today
■ Tomorrow
■ 2 days out
■ 3 days out
The report also shows the number of Remaining Invoices with the invoice due date inthe past:
■ Past Due
Predefined OI Reports for Retail Invoice Match (ReIM)
Pre-defined Operational Insights Reports 2-25
Figure 2–30 Upcoming Invoices
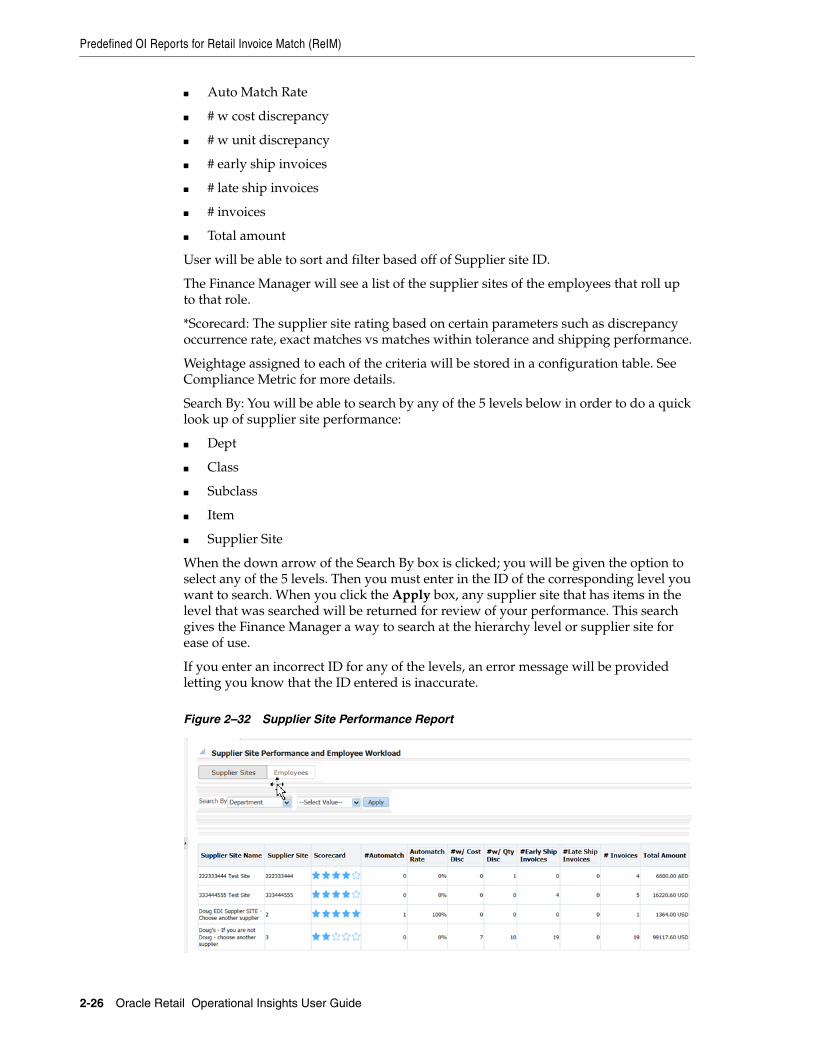
Automatch Rate ReportThe AutoMatch Rate report will allow you to quickly see the total number of invoicesin matched status that were matched by the automatch batch in comparison with thetotal number of invoices that were manually matched by the ReIM user. This metric isshown by using a semi-gauge report.
The number shown and represented by the orange bar is the number that isAutomatched.
The remaining percentage represented by the light gray bar is the number that wasmanually matched.
The report will be calculated for you and can be viewed 2 different ways.
■ Yesterday
■ Last 3 months
Figure 2–31 Automatch Rate
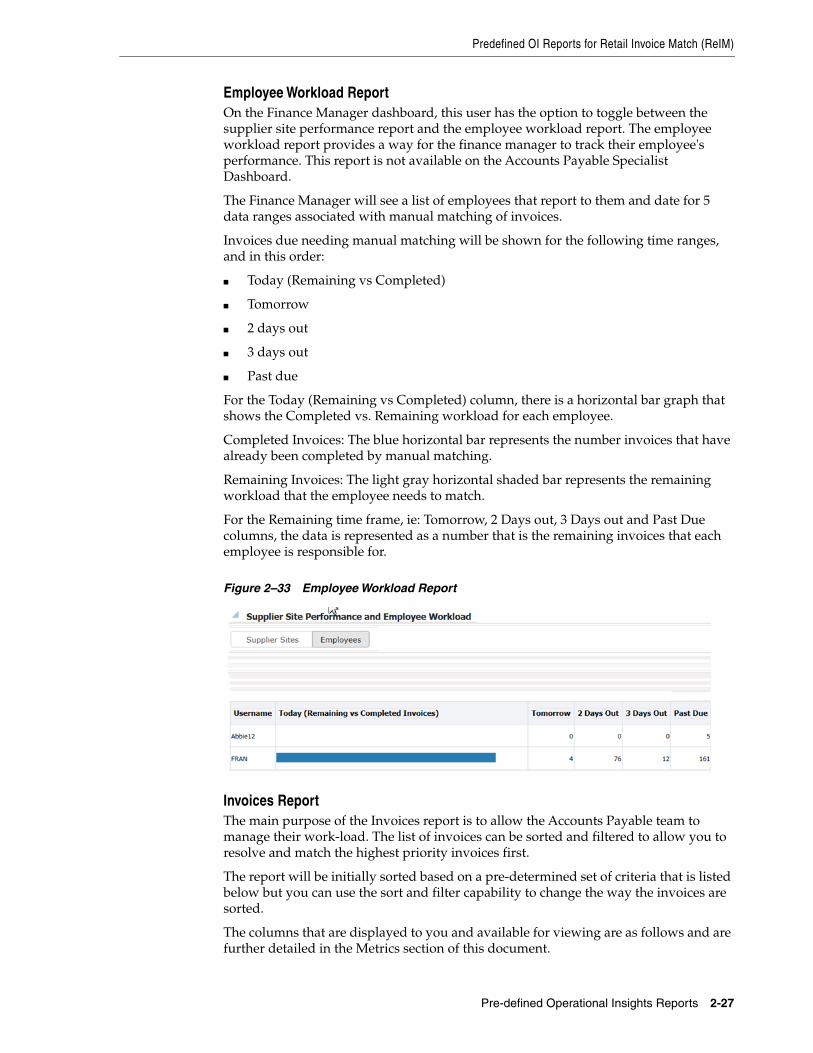
Supplier Site Performance ReportThe Supplier site report lists each individual supplier that the employee is responsiblefor. This is only available on the Finance Manager dashboard. This report serves as aquick glance to see how the supplier site is performing and all the data that is shown isfor the past 12 weeks (84 days).
■ Supplier site
■ Supplier site ID
■ Scorecard* (See below for more details)
■ # Automatch
Predefined OI Reports for Retail Invoice Match (ReIM)
2-26 Oracle Retail Operational Insights User Guide
■ Auto Match Rate
■ # w cost discrepancy
■ # w unit discrepancy
■ # early ship invoices
■ # late ship invoices
■ # invoices
■ Total amount
User will be able to sort and filter based off of Supplier site ID.
The Finance Manager will see a list of the supplier sites of the employees that roll upto that role.
*Scorecard: The supplier site rating based on certain parameters such as discrepancyoccurrence rate, exact matches vs matches within tolerance and shipping performance.
Weightage assigned to each of the criteria will be stored in a configuration table. SeeCompliance Metric for more details.
Search By: You will be able to search by any of the 5 levels below in order to do a quicklook up of supplier site performance:
■ Dept
■ Class
■ Subclass
■ Item
■ Supplier Site
When the down arrow of the Search By box is clicked; you will be given the option toselect any of the 5 levels. Then you must enter in the ID of the corresponding level youwant to search. When you click the Apply box, any supplier site that has items in thelevel that was searched will be returned for review of your performance. This searchgives the Finance Manager a way to search at the hierarchy level or supplier site forease of use.
If you enter an incorrect ID for any of the levels, an error message will be providedletting you know that the ID entered is inaccurate.
Figure 2–32 Supplier Site Performance Report
Predefined OI Reports for Retail Invoice Match (ReIM)
Pre-defined Operational Insights Reports 2-27
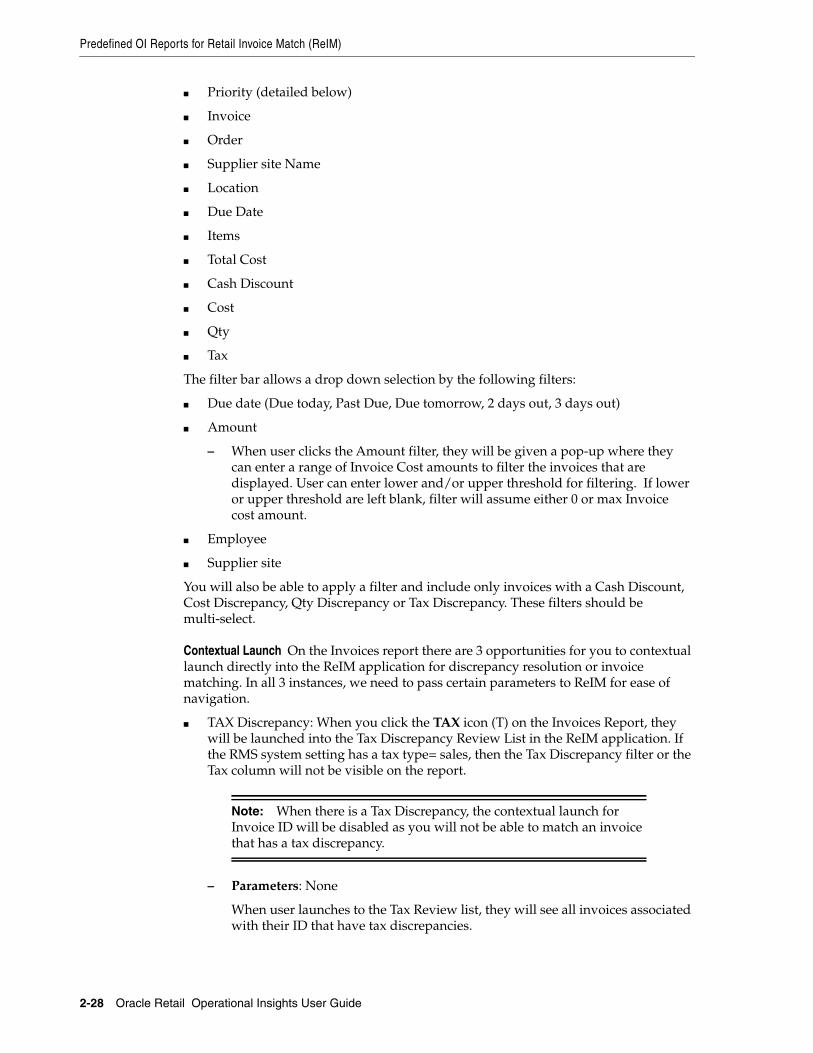
Employee Workload ReportOn the Finance Manager dashboard, this user has the option to toggle between thesupplier site performance report and the employee workload report. The employeeworkload report provides a way for the finance manager to track their employee'sperformance. This report is not available on the Accounts Payable SpecialistDashboard.
The Finance Manager will see a list of employees that report to them and date for 5data ranges associated with manual matching of invoices.
Invoices due needing manual matching will be shown for the following time ranges,and in this order:
■ Today (Remaining vs Completed)
■ Tomorrow
■ 2 days out
■ 3 days out
■ Past due
For the Today (Remaining vs Completed) column, there is a horizontal bar graph thatshows the Completed vs. Remaining workload for each employee.
Completed Invoices: The blue horizontal bar represents the number invoices that havealready been completed by manual matching.
Remaining Invoices: The light gray horizontal shaded bar represents the remainingworkload that the employee needs to match.
For the Remaining time frame, ie: Tomorrow, 2 Days out, 3 Days out and Past Duecolumns, the data is represented as a number that is the remaining invoices that eachemployee is responsible for.
Figure 2–33 Employee Workload Report
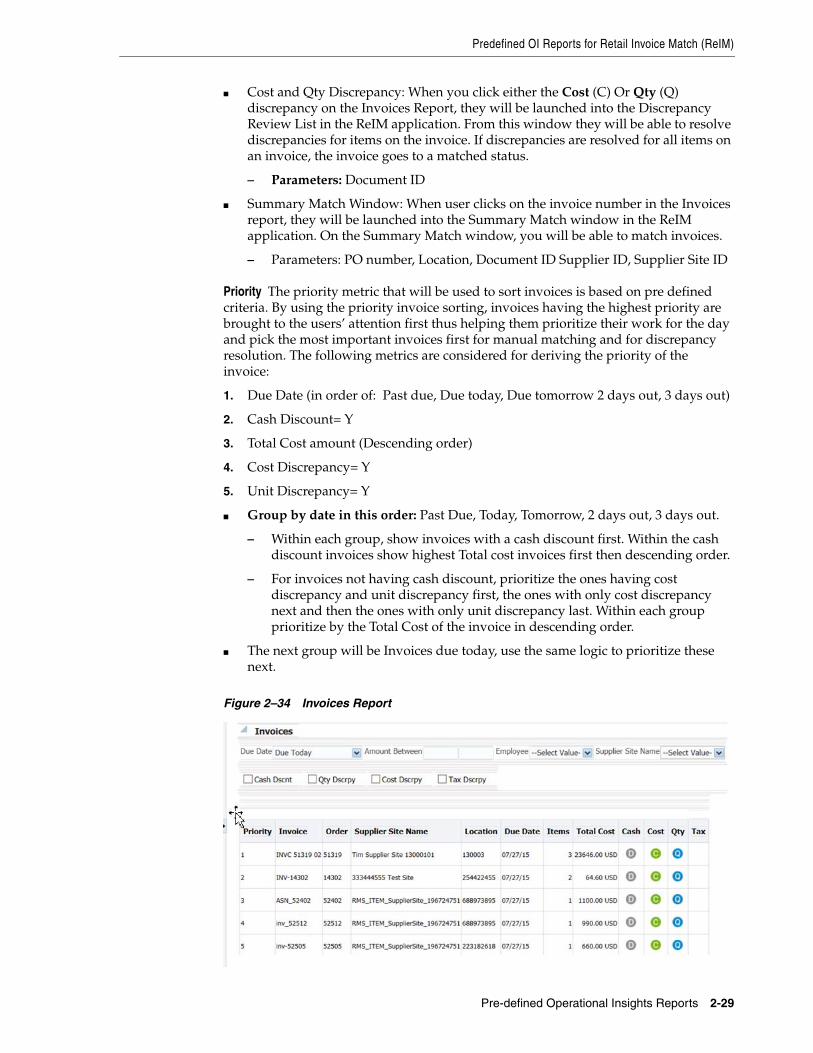
Invoices ReportThe main purpose of the Invoices report is to allow the Accounts Payable team tomanage their work-load. The list of invoices can be sorted and filtered to allow you toresolve and match the highest priority invoices first.
The report will be initially sorted based on a pre-determined set of criteria that is listedbelow but you can use the sort and filter capability to change the way the invoices aresorted.
The columns that are displayed to you and available for viewing are as follows and arefurther detailed in the Metrics section of this document.
Predefined OI Reports for Retail Invoice Match (ReIM)
2-28 Oracle Retail Operational Insights User Guide
■ Priority (detailed below)
■ Invoice
■ Order
■ Supplier site Name
■ Location
■ Due Date
■ Items
■ Total Cost
■ Cash Discount
■ Cost
■ Qty
■ Tax
The filter bar allows a drop down selection by the following filters:
■ Due date (Due today, Past Due, Due tomorrow, 2 days out, 3 days out)
■ Amount
– When user clicks the Amount filter, they will be given a pop-up where theycan enter a range of Invoice Cost amounts to filter the invoices that aredisplayed. User can enter lower and/or upper threshold for filtering. If loweror upper threshold are left blank, filter will assume either 0 or max Invoicecost amount.
■ Employee
■ Supplier site
You will also be able to apply a filter and include only invoices with a Cash Discount,Cost Discrepancy, Qty Discrepancy or Tax Discrepancy. These filters should bemulti-select.
Contextual Launch On the Invoices report there are 3 opportunities for you to contextuallaunch directly into the ReIM application for discrepancy resolution or invoicematching. In all 3 instances, we need to pass certain parameters to ReIM for ease ofnavigation.
■ TAX Discrepancy: When you click the TAX icon (T) on the Invoices Report, theywill be launched into the Tax Discrepancy Review List in the ReIM application. Ifthe RMS system setting has a tax type= sales, then the Tax Discrepancy filter or theTax column will not be visible on the report.
Note: When there is a Tax Discrepancy, the contextual launch forInvoice ID will be disabled as you will not be able to match an invoicethat has a tax discrepancy.
– Parameters: None
When user launches to the Tax Review list, they will see all invoices associatedwith their ID that have tax discrepancies.
Predefined OI Reports for Retail Invoice Match (ReIM)
Pre-defined Operational Insights Reports 2-29
■ Cost and Qty Discrepancy: When you click either the Cost (C) Or Qty (Q)discrepancy on the Invoices Report, they will be launched into the DiscrepancyReview List in the ReIM application. From this window they will be able to resolvediscrepancies for items on the invoice. If discrepancies are resolved for all items onan invoice, the invoice goes to a matched status.
– Parameters: Document ID
■ Summary Match Window: When user clicks on the invoice number in the Invoicesreport, they will be launched into the Summary Match window in the ReIMapplication. On the Summary Match window, you will be able to match invoices.
– Parameters: PO number, Location, Document ID Supplier ID, Supplier Site ID
Priority The priority metric that will be used to sort invoices is based on pre definedcriteria. By using the priority invoice sorting, invoices having the highest priority arebrought to the users’ attention first thus helping them prioritize their work for the dayand pick the most important invoices first for manual matching and for discrepancyresolution. The following metrics are considered for deriving the priority of theinvoice:
1. Due Date (in order of: Past due, Due today, Due tomorrow 2 days out, 3 days out)
2. Cash Discount= Y
3. Total Cost amount (Descending order)
4. Cost Discrepancy= Y
5. Unit Discrepancy= Y
■ Group by date in this order: Past Due, Today, Tomorrow, 2 days out, 3 days out.
– Within each group, show invoices with a cash discount first. Within the cashdiscount invoices show highest Total cost invoices first then descending order.
– For invoices not having cash discount, prioritize the ones having costdiscrepancy and unit discrepancy first, the ones with only cost discrepancynext and then the ones with only unit discrepancy last. Within each groupprioritize by the Total Cost of the invoice in descending order.
■ The next group will be Invoices due today, use the same logic to prioritize thesenext.
Figure 2–34 Invoices Report
Predefined OI Reports for Retail Invoice Match (ReIM)
2-30 Oracle Retail Operational Insights User Guide
Contextual Business Intelligence (BI) ReportsContextual BI Reports are displayed in the contextual pane of some ReIM windows.Contextual BI reports provide additional in context insights to the data being viewedin the ReIM window.
The following ReIM windows have contextual BI reports displayed in the right pane:
■ Detail Match
■ Summary Match
■ Discrepancy Match
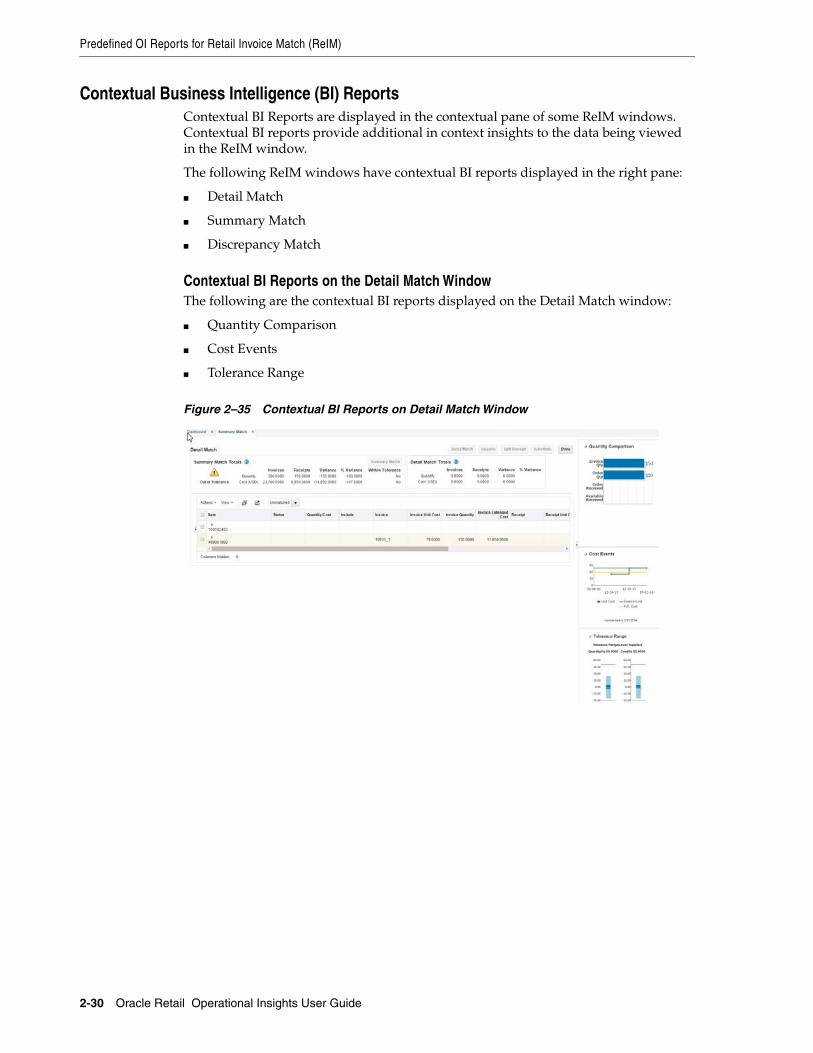
Contextual BI Reports on the Detail Match WindowThe following are the contextual BI reports displayed on the Detail Match window:
■ Quantity Comparison
■ Cost Events
■ Tolerance Range
Figure 2–35 Contextual BI Reports on Detail Match Window
Predefined OI Reports for Retail Invoice Match (ReIM)
Pre-defined Operational Insights Reports 2-31
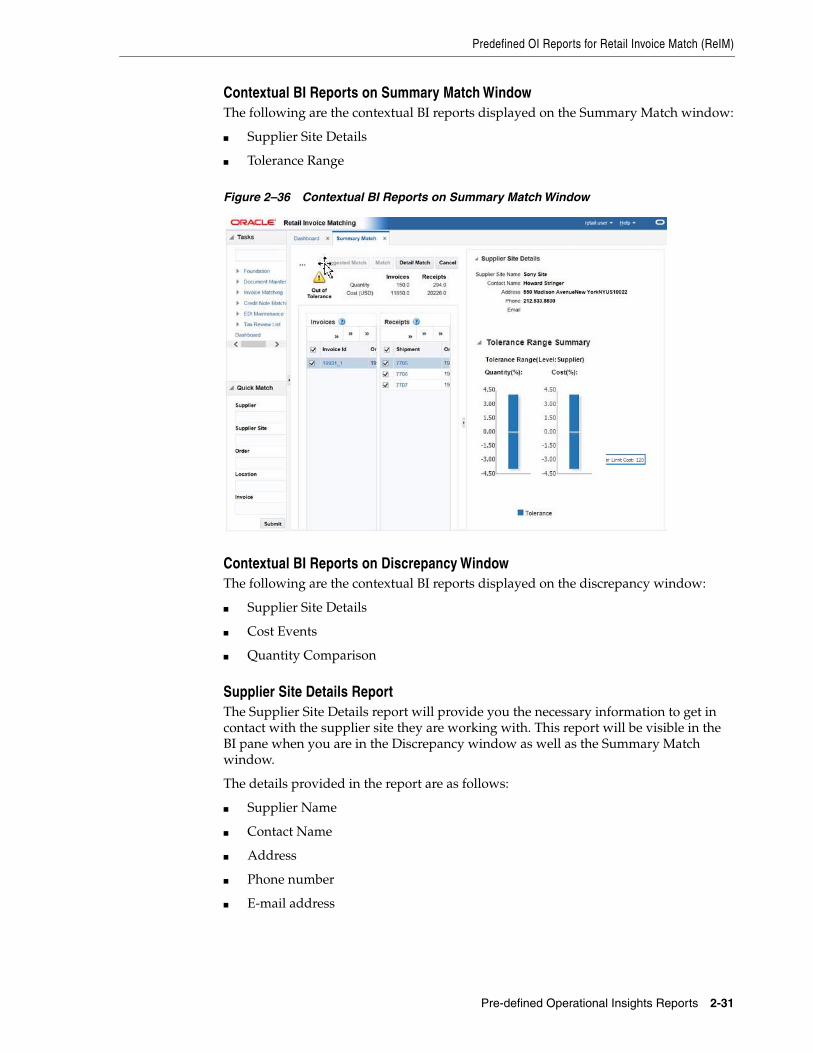
Contextual BI Reports on Summary Match WindowThe following are the contextual BI reports displayed on the Summary Match window:
■ Supplier Site Details
■ Tolerance Range
Figure 2–36 Contextual BI Reports on Summary Match Window
Contextual BI Reports on Discrepancy WindowThe following are the contextual BI reports displayed on the discrepancy window:
■ Supplier Site Details
■ Cost Events
■ Quantity Comparison
Supplier Site Details ReportThe Supplier Site Details report will provide you the necessary information to get incontact with the supplier site they are working with. This report will be visible in theBI pane when you are in the Discrepancy window as well as the Summary Matchwindow.
The details provided in the report are as follows:
■ Supplier Name
■ Contact Name
■ Address
■ Phone number
■ E-mail address

Predefined OI Reports for Retail Invoice Match (ReIM)
2-32 Oracle Retail Operational Insights User Guide
Figure 2–37 Supplier Site Details
Cost Event ReportThis report will provide you the visibility into the last two cost changes and one in thefuture using the approval date of the invoice date as a reference. This may help explainwhy an invoice has a cost variance in the ReIM application. This report is visible whenuser is on the discrepancy window and when user is on the Detail match window.
The X axis of the report shows the dates that the cost changes either occurred or willoccur and the Y axis shows the price points of the cost events. There are 2 lines thatrepresent both the P.O. Cost and the Invoice cost of the invoice that is selected so youcan see where the variance is.
There are three cost events displayed; using the Purchase Order date as the reference.There are two past cost changes and one future cost event.
The Detail Match window is a three-tiered table, If a style row is in focus, the report isrefreshed but will not show any data. If the SKU row is in focus, the report isrefreshed and PO Cost and Invoice cost will update based on the SKU. If the focus ison a row below the SKU level, the report is not refreshed. The Discrepancy Review Listis a single hierarchy table sowing the sku row, so the report will always be based onthe row in focus.
Invoice Date: The Invoice date is listed and plotted on the graph using a tic mark. Ifthe invoice date is outside of the cost changes listed (before first or after last), the ticmark will be right outside of the graph so it will not impact the scale of the graph.
Figure 2–38 Cost Event Report
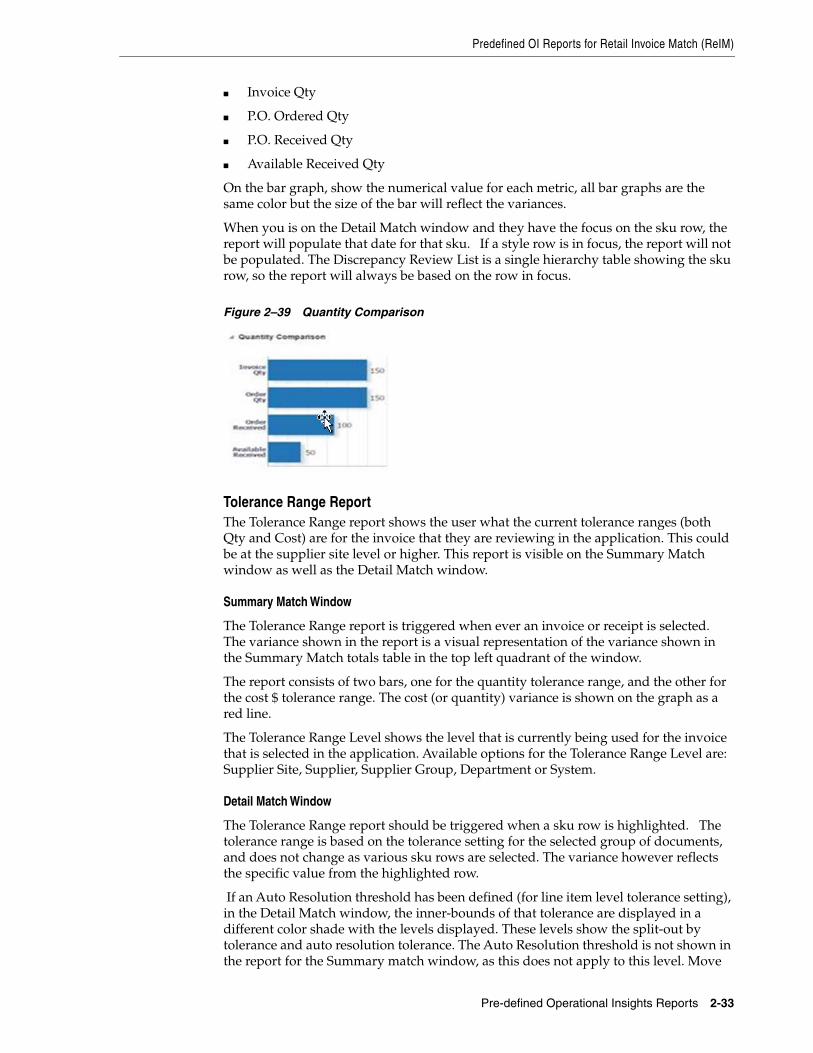
Quantity Comparison ReportThis Report gives you a quick glance at where the discrepancy lies in terms ofQuantity.
The report is visible when user is on the Discrepancy window in ReIM and when useris on the Detail Match window.
The report is made up of 4 horizontal bars:
Predefined OI Reports for Retail Invoice Match (ReIM)
Pre-defined Operational Insights Reports 2-33
■ Invoice Qty
■ P.O. Ordered Qty
■ P.O. Received Qty
■ Available Received Qty
On the bar graph, show the numerical value for each metric, all bar graphs are thesame color but the size of the bar will reflect the variances.
When you is on the Detail Match window and they have the focus on the sku row, thereport will populate that date for that sku. If a style row is in focus, the report will notbe populated. The Discrepancy Review List is a single hierarchy table showing the skurow, so the report will always be based on the row in focus.
Figure 2–39 Quantity Comparison
Tolerance Range ReportThe Tolerance Range report shows the user what the current tolerance ranges (bothQty and Cost) are for the invoice that they are reviewing in the application. This couldbe at the supplier site level or higher. This report is visible on the Summary Matchwindow as well as the Detail Match window.
Summary Match Window
The Tolerance Range report is triggered when ever an invoice or receipt is selected.The variance shown in the report is a visual representation of the variance shown inthe Summary Match totals table in the top left quadrant of the window.
The report consists of two bars, one for the quantity tolerance range, and the other forthe cost $ tolerance range. The cost (or quantity) variance is shown on the graph as ared line.
The Tolerance Range Level shows the level that is currently being used for the invoicethat is selected in the application. Available options for the Tolerance Range Level are:Supplier Site, Supplier, Supplier Group, Department or System.
Detail Match Window
The Tolerance Range report should be triggered when a sku row is highlighted. Thetolerance range is based on the tolerance setting for the selected group of documents,and does not change as various sku rows are selected. The variance however reflectsthe specific value from the highlighted row.
If an Auto Resolution threshold has been defined (for line item level tolerance setting),in the Detail Match window, the inner-bounds of that tolerance are displayed in adifferent color shade with the levels displayed. These levels show the split-out bytolerance and auto resolution tolerance. The Auto Resolution threshold is not shown inthe report for the Summary match window, as this does not apply to this level. Move

Predefined OI Reports for Retail Invoice Match (ReIM)
2-34 Oracle Retail Operational Insights User Guide
the cursor over the tolerance range bar to view the actual tolerance and auto resolutionlevels.
Figure 2–40 Tolerance Range Report

3
Creating and Modifying Reports 3-1
3Creating and Modifying Reports
In addition to the predefined reports, Operational Insights includes a variety ofpredefined, fundamental metrics that can be used to build custom reports.
New reports must be created or existing ones modified only by Administrators. Adhocreport performance may vary based on the metric and aggregation level used.Additional performance tuning on report by report basis might be needed which is notsupported out of the box. See Chapter - “Metrics” for more information on the metricsthat are supported for custom reports.
Subject AreasThe Operation Insights presentation model is designed in four different subject areasbased on the merchandise application and reporting scenarios that OperationalInsights supports:
■ Operational Insights Foundation
■ Operational Insights ReSA
■ Operational Insights Allocation
■ Operational Insights ReIM
Although some of the facts and dimensions appear similar across the four subjectareas, they are modeled differently in the Oracle BI repository. For example, Item orDay might appear similar in the four subject areas, but their sources and joinconditions are different to support the appropriate method of reporting.
Dimensions and AttributesOperational Insights dimensions and attributes represent the structure and activities ofoperational reporting and make measurement possible. Below are the Dimensions andthe attributes that Operational Insights custom reporting can utilize in each of thesubject Area.
Operational Insights Foundation - Dimensions and AttributesBelow are the dimensions and attributes of the Operational Insights foundation.
CalendarThe calendar (fiscal calendar) is a dimension based on a retailer's calendar. Thebusiness calendar is sometimes just called the time calendar. The business calendar can
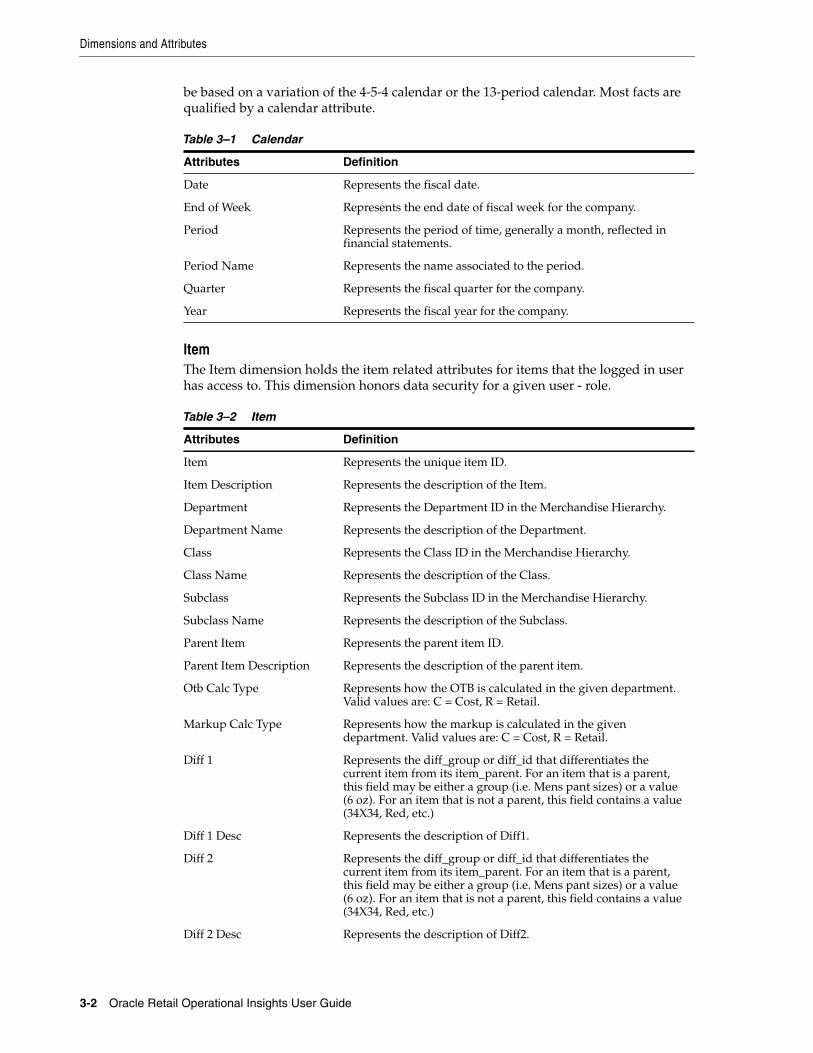
Dimensions and Attributes
3-2 Oracle Retail Operational Insights User Guide
be based on a variation of the 4-5-4 calendar or the 13-period calendar. Most facts arequalified by a calendar attribute.
Table 3–1 Calendar
Attributes Definition
Date Represents the fiscal date.
End of Week Represents the end date of fiscal week for the company.
Period Represents the period of time, generally a month, reflected infinancial statements.
Period Name Represents the name associated to the period.
Quarter Represents the fiscal quarter for the company.
Year Represents the fiscal year for the company.
ItemThe Item dimension holds the item related attributes for items that the logged in userhas access to. This dimension honors data security for a given user - role.
Table 3–2 Item
Attributes Definition
Item Represents the unique item ID.
Item Description Represents the description of the Item.
Department Represents the Department ID in the Merchandise Hierarchy.
Department Name Represents the description of the Department.
Class Represents the Class ID in the Merchandise Hierarchy.
Class Name Represents the description of the Class.
Subclass Represents the Subclass ID in the Merchandise Hierarchy.
Subclass Name Represents the description of the Subclass.
Parent Item Represents the parent item ID.
Parent Item Description Represents the description of the parent item.
Otb Calc Type Represents how the OTB is calculated in the given department.Valid values are: C = Cost, R = Retail.
Markup Calc Type Represents how the markup is calculated in the givendepartment. Valid values are: C = Cost, R = Retail.
Diff 1 Represents the diff_group or diff_id that differentiates thecurrent item from its item_parent. For an item that is a parent,this field may be either a group (i.e. Mens pant sizes) or a value(6 oz). For an item that is not a parent, this field contains a value(34X34, Red, etc.)
Diff 1 Desc Represents the description of Diff1.
Diff 2 Represents the diff_group or diff_id that differentiates thecurrent item from its item_parent. For an item that is a parent,this field may be either a group (i.e. Mens pant sizes) or a value(6 oz). For an item that is not a parent, this field contains a value(34X34, Red, etc.)
Diff 2 Desc Represents the description of Diff2.
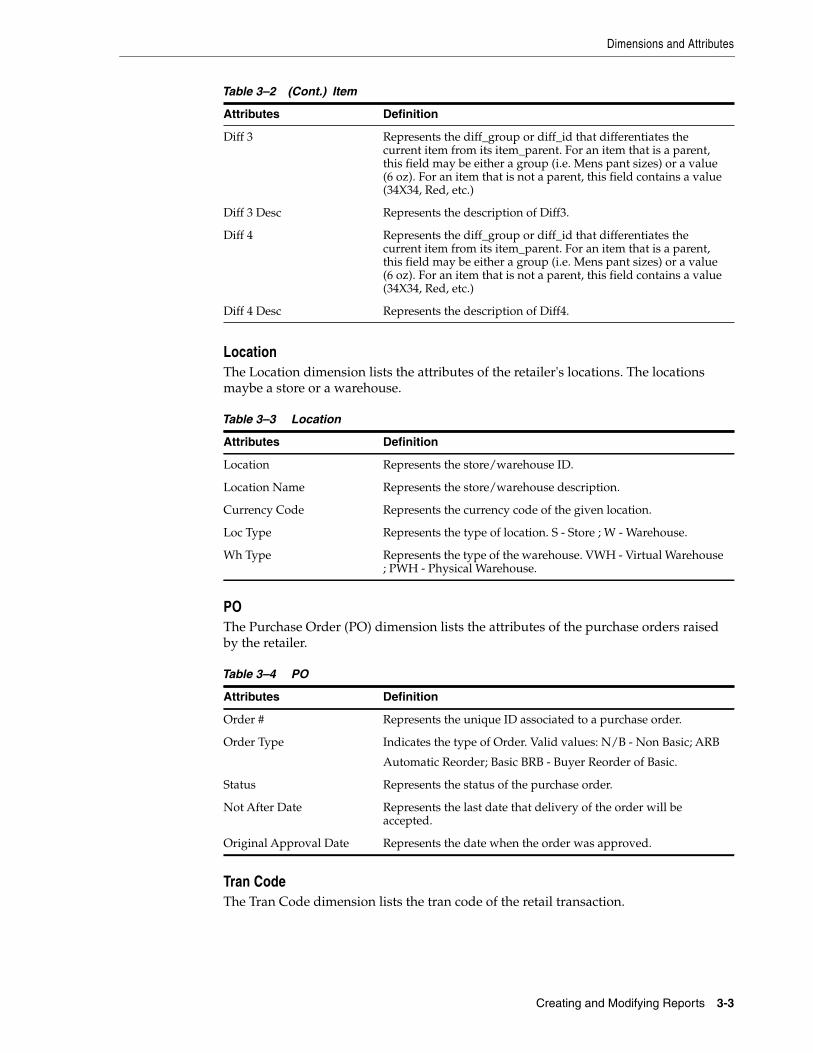
Dimensions and Attributes
Creating and Modifying Reports 3-3
LocationThe Location dimension lists the attributes of the retailer's locations. The locationsmaybe a store or a warehouse.
Table 3–3 Location
Attributes Definition
Location Represents the store/warehouse ID.
Location Name Represents the store/warehouse description.
Currency Code Represents the currency code of the given location.
Loc Type Represents the type of location. S - Store ; W - Warehouse.
Wh Type Represents the type of the warehouse. VWH - Virtual Warehouse; PWH - Physical Warehouse.
POThe Purchase Order (PO) dimension lists the attributes of the purchase orders raisedby the retailer.
Table 3–4 PO
Attributes Definition
Order # Represents the unique ID associated to a purchase order.
Order Type Indicates the type of Order. Valid values: N/B - Non Basic; ARB
Automatic Reorder; Basic BRB - Buyer Reorder of Basic.
Status Represents the status of the purchase order.
Not After Date Represents the last date that delivery of the order will beaccepted.
Original Approval Date Represents the date when the order was approved.
Tran CodeThe Tran Code dimension lists the tran code of the retail transaction.
Diff 3 Represents the diff_group or diff_id that differentiates thecurrent item from its item_parent. For an item that is a parent,this field may be either a group (i.e. Mens pant sizes) or a value(6 oz). For an item that is not a parent, this field contains a value(34X34, Red, etc.)
Diff 3 Desc Represents the description of Diff3.
Diff 4 Represents the diff_group or diff_id that differentiates thecurrent item from its item_parent. For an item that is a parent,this field may be either a group (i.e. Mens pant sizes) or a value(6 oz). For an item that is not a parent, this field contains a value(34X34, Red, etc.)
Diff 4 Desc Represents the description of Diff4.
Table 3–2 (Cont.) Item
Attributes Definition
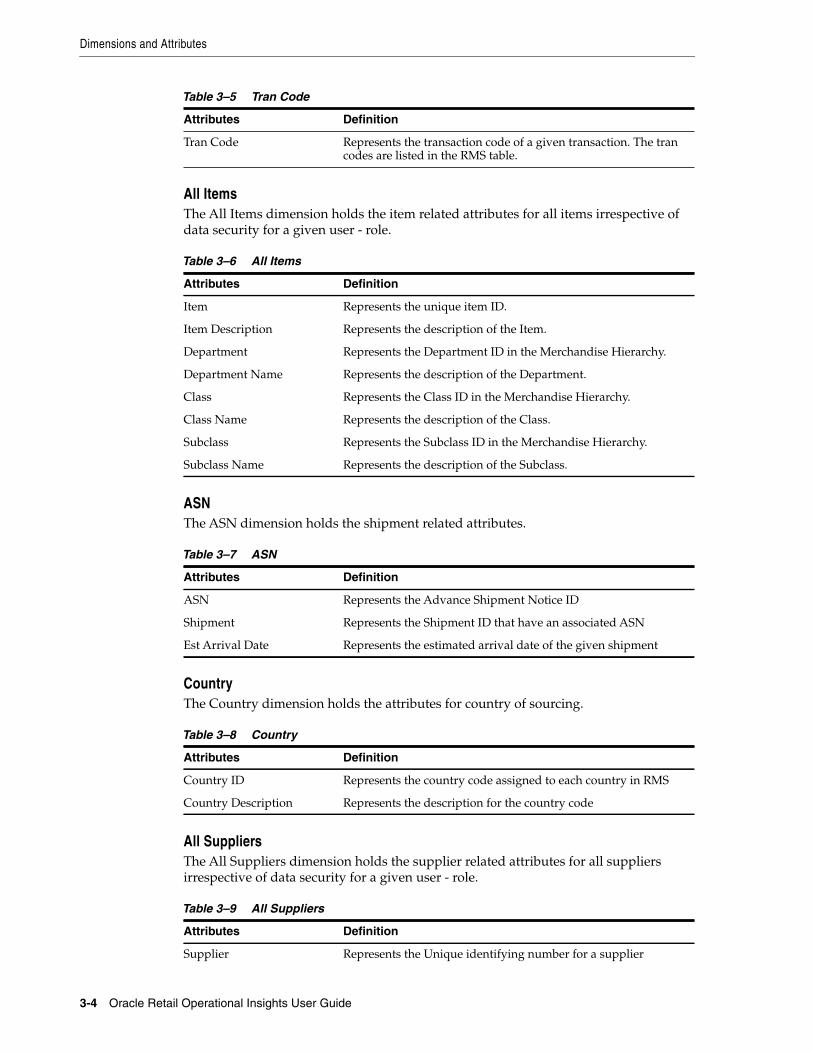
Table 3–5 Tran Code
Attributes Definition
Tran Code Represents the transaction code of a given transaction. The trancodes are listed in the RMS table.
Dimensions and Attributes
3-4 Oracle Retail Operational Insights User Guide
All ItemsThe All Items dimension holds the item related attributes for all items irrespective ofdata security for a given user - role.
Table 3–6 All Items
Attributes Definition
Item Represents the unique item ID.
Item Description Represents the description of the Item.
Department Represents the Department ID in the Merchandise Hierarchy.
Department Name Represents the description of the Department.
Class Represents the Class ID in the Merchandise Hierarchy.
Class Name Represents the description of the Class.
Subclass Represents the Subclass ID in the Merchandise Hierarchy.
Subclass Name Represents the description of the Subclass.
ASNThe ASN dimension holds the shipment related attributes.
Table 3–7 ASN
Attributes Definition
ASN Represents the Advance Shipment Notice ID
Shipment Represents the Shipment ID that have an associated ASN
Est Arrival Date Represents the estimated arrival date of the given shipment
CountryThe Country dimension holds the attributes for country of sourcing.
Table 3–8 Country
Attributes Definition
Country ID Represents the country code assigned to each country in RMS
Country Description Represents the description for the country code
All SuppliersThe All Suppliers dimension holds the supplier related attributes for all suppliersirrespective of data security for a given user - role.
Table 3–9 All Suppliers
Attributes Definition
Supplier Represents the Unique identifying number for a supplier
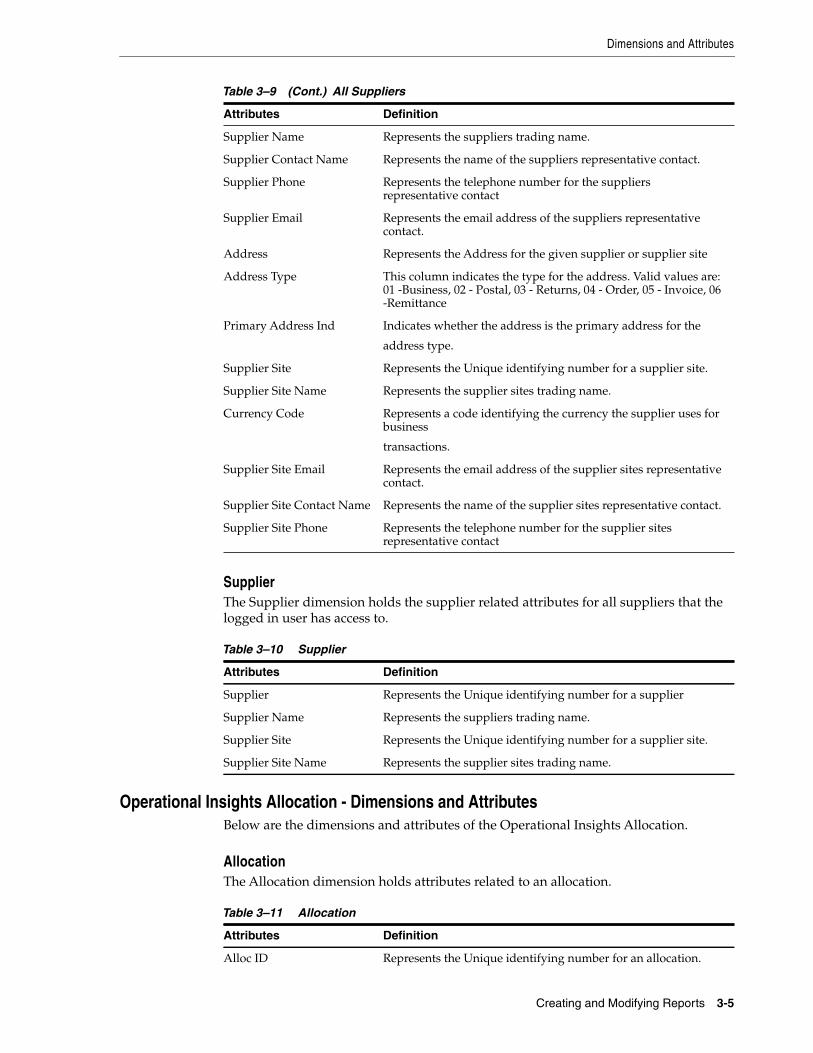
Dimensions and Attributes
Creating and Modifying Reports 3-5
SupplierThe Supplier dimension holds the supplier related attributes for all suppliers that thelogged in user has access to.
Table 3–10 Supplier
Attributes Definition
Supplier Represents the Unique identifying number for a supplier
Supplier Name Represents the suppliers trading name.
Supplier Site Represents the Unique identifying number for a supplier site.
Supplier Site Name Represents the supplier sites trading name.
Operational Insights Allocation - Dimensions and AttributesBelow are the dimensions and attributes of the Operational Insights Allocation.
AllocationThe Allocation dimension holds attributes related to an allocation.
Supplier Name Represents the suppliers trading name.
Supplier Contact Name Represents the name of the suppliers representative contact.
Supplier Phone Represents the telephone number for the suppliersrepresentative contact
Supplier Email Represents the email address of the suppliers representativecontact.
Address Represents the Address for the given supplier or supplier site
Address Type This column indicates the type for the address. Valid values are:01 -Business, 02 - Postal, 03 - Returns, 04 - Order, 05 - Invoice, 06-Remittance
Primary Address Ind Indicates whether the address is the primary address for the
address type.
Supplier Site Represents the Unique identifying number for a supplier site.
Supplier Site Name Represents the supplier sites trading name.
Currency Code Represents a code identifying the currency the supplier uses forbusiness
transactions.
Supplier Site Email Represents the email address of the supplier sites representativecontact.
Supplier Site Contact Name Represents the name of the supplier sites representative contact.
Supplier Site Phone Represents the telephone number for the supplier sitesrepresentative contact
Table 3–11 Allocation
Attributes Definition
Alloc ID Represents the Unique identifying number for an allocation.
Table 3–9 (Cont.) All Suppliers
Attributes Definition
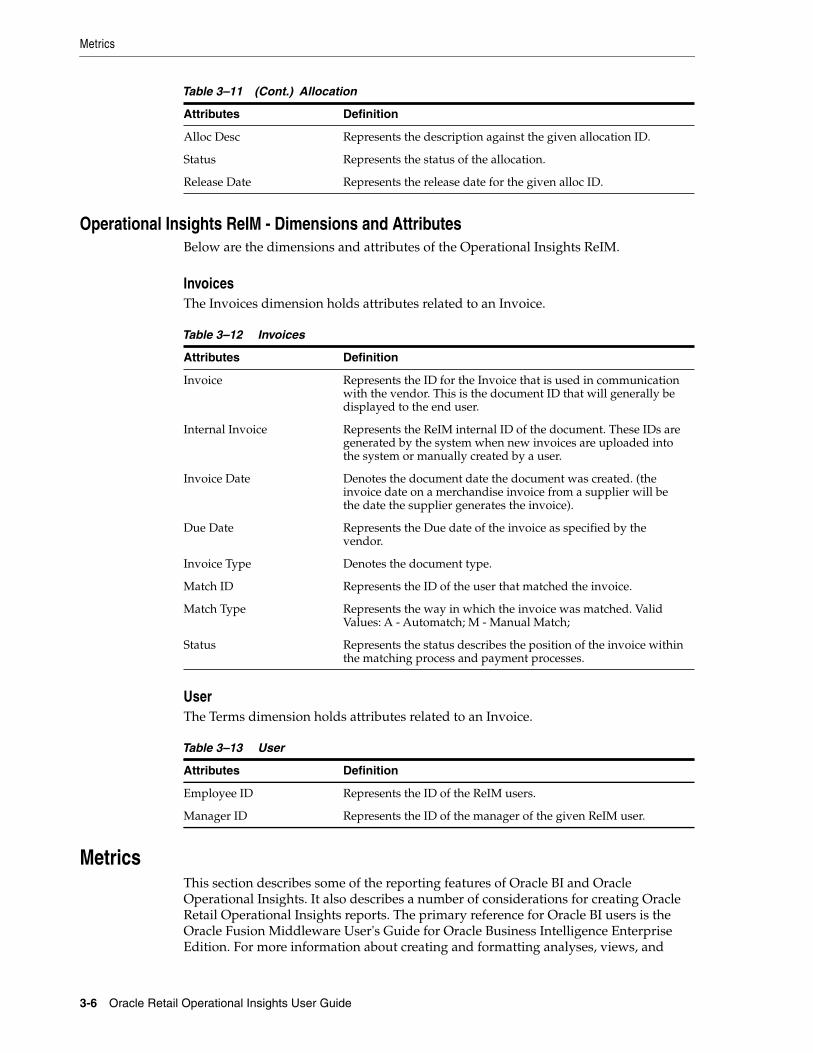
Metrics
3-6 Oracle Retail Operational Insights User Guide
Operational Insights ReIM - Dimensions and AttributesBelow are the dimensions and attributes of the Operational Insights ReIM.
InvoicesThe Invoices dimension holds attributes related to an Invoice.
Table 3–12 Invoices
Attributes Definition
Invoice Represents the ID for the Invoice that is used in communicationwith the vendor. This is the document ID that will generally bedisplayed to the end user.
Internal Invoice Represents the ReIM internal ID of the document. These IDs aregenerated by the system when new invoices are uploaded intothe system or manually created by a user.
Invoice Date Denotes the document date the document was created. (theinvoice date on a merchandise invoice from a supplier will bethe date the supplier generates the invoice).
Due Date Represents the Due date of the invoice as specified by thevendor.
Invoice Type Denotes the document type.
Match ID Represents the ID of the user that matched the invoice.
Match Type Represents the way in which the invoice was matched. ValidValues: A - Automatch; M - Manual Match;
Status Represents the status describes the position of the invoice withinthe matching process and payment processes.
UserThe Terms dimension holds attributes related to an Invoice.
Table 3–13 User
Attributes Definition
Employee ID Represents the ID of the ReIM users.
Manager ID Represents the ID of the manager of the given ReIM user.
MetricsThis section describes some of the reporting features of Oracle BI and OracleOperational Insights. It also describes a number of considerations for creating OracleRetail Operational Insights reports. The primary reference for Oracle BI users is theOracle Fusion Middleware User's Guide for Oracle Business Intelligence EnterpriseEdition. For more information about creating and formatting analyses, views, and
Alloc Desc Represents the description against the given allocation ID.
Status Represents the status of the allocation.
Release Date Represents the release date for the given alloc ID.
Table 3–11 (Cont.) Allocation
Attributes Definition
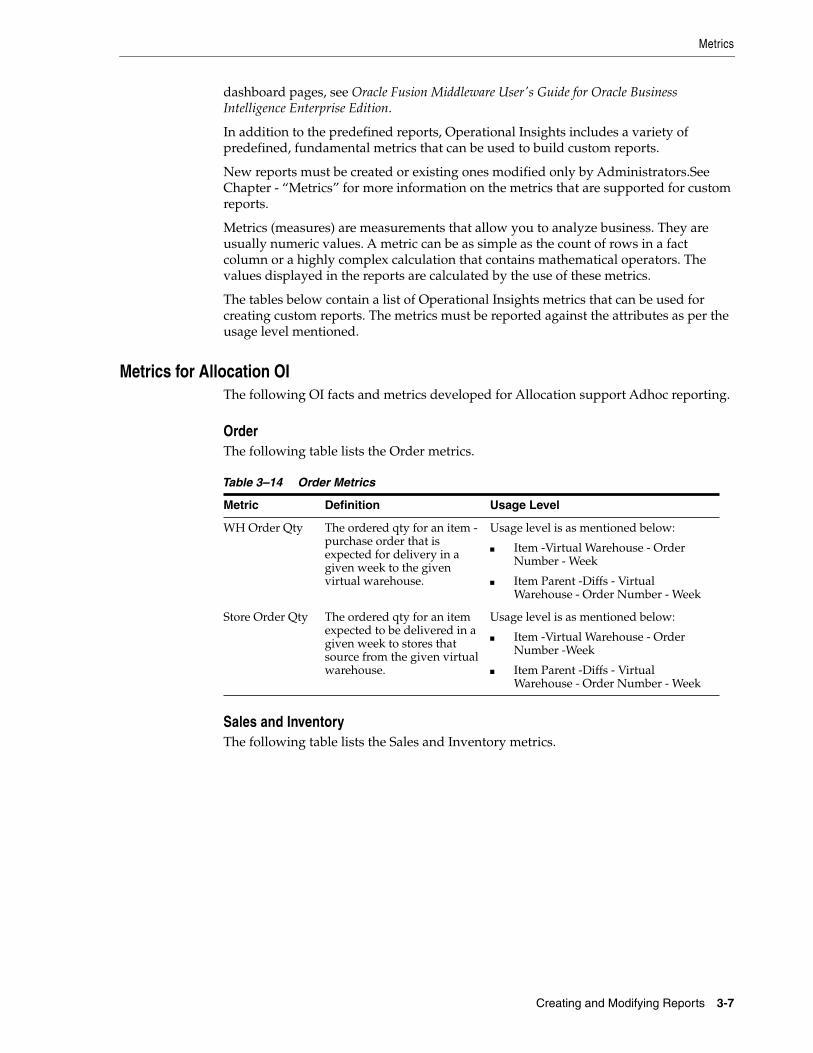
Metrics
Creating and Modifying Reports 3-7
dashboard pages, see Oracle Fusion Middleware User's Guide for Oracle BusinessIntelligence Enterprise Edition.
In addition to the predefined reports, Operational Insights includes a variety ofpredefined, fundamental metrics that can be used to build custom reports.
New reports must be created or existing ones modified only by Administrators.SeeChapter - “Metrics” for more information on the metrics that are supported for customreports.
Metrics (measures) are measurements that allow you to analyze business. They areusually numeric values. A metric can be as simple as the count of rows in a factcolumn or a highly complex calculation that contains mathematical operators. Thevalues displayed in the reports are calculated by the use of these metrics.
The tables below contain a list of Operational Insights metrics that can be used forcreating custom reports. The metrics must be reported against the attributes as per theusage level mentioned.
Metrics for Allocation OIThe following OI facts and metrics developed for Allocation support Adhoc reporting.
OrderThe following table lists the Order metrics.
Table 3–14 Order Metrics
Metric Definition Usage Level
WH Order Qty The ordered qty for an item -purchase order that isexpected for delivery in agiven week to the givenvirtual warehouse.
Usage level is as mentioned below:
■ Item -Virtual Warehouse - OrderNumber - Week
■ Item Parent -Diffs - VirtualWarehouse - Order Number - Week
Store Order Qty The ordered qty for an itemexpected to be delivered in agiven week to stores thatsource from the given virtualwarehouse.
Usage level is as mentioned below:
■ Item -Virtual Warehouse - OrderNumber -Week
■ Item Parent -Diffs - VirtualWarehouse - Order Number - Week
Sales and InventoryThe following table lists the Sales and Inventory metrics.
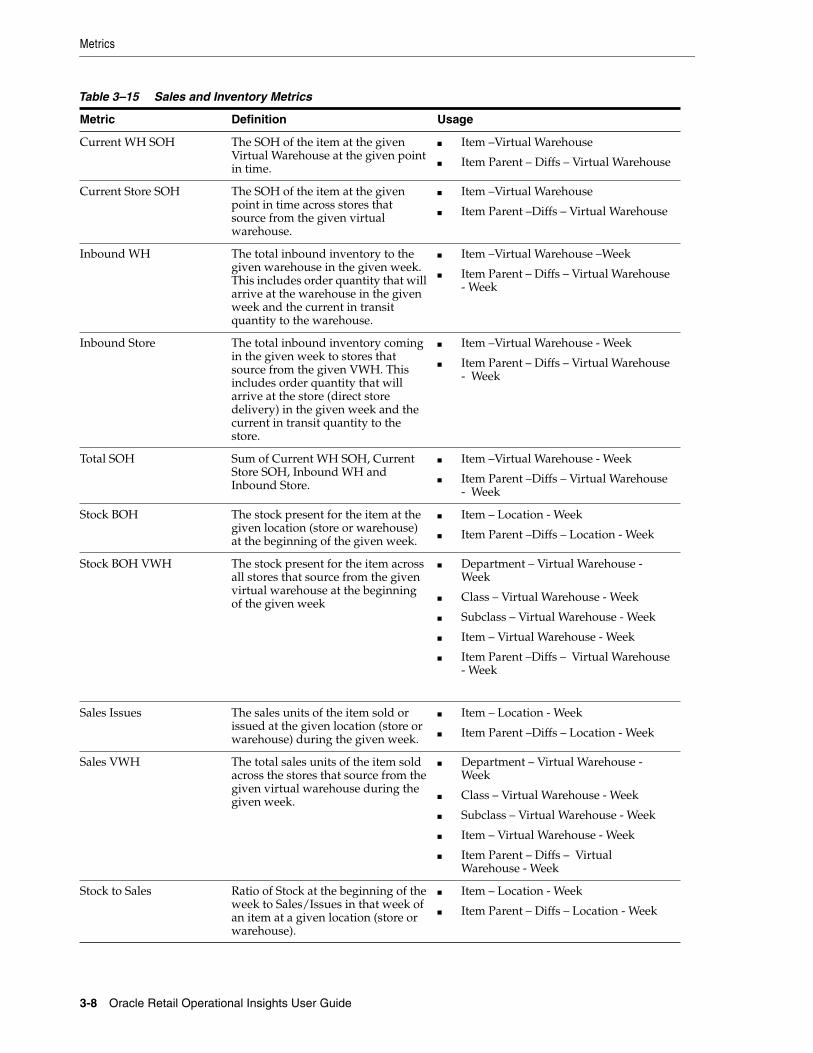
Metrics
3-8 Oracle Retail Operational Insights User Guide
Table 3–15 Sales and Inventory Metrics
Metric Definition Usage
Current WH SOH The SOH of the item at the givenVirtual Warehouse at the given pointin time.
■ Item –Virtual Warehouse
■ Item Parent – Diffs – Virtual Warehouse
Current Store SOH The SOH of the item at the givenpoint in time across stores thatsource from the given virtualwarehouse.
■ Item –Virtual Warehouse
■ Item Parent –Diffs – Virtual Warehouse
Inbound WH The total inbound inventory to thegiven warehouse in the given week.This includes order quantity that willarrive at the warehouse in the givenweek and the current in transitquantity to the warehouse.
■ Item –Virtual Warehouse –Week
■ Item Parent – Diffs – Virtual Warehouse- Week
Inbound Store The total inbound inventory comingin the given week to stores thatsource from the given VWH. Thisincludes order quantity that willarrive at the store (direct storedelivery) in the given week and thecurrent in transit quantity to thestore.
■ Item –Virtual Warehouse - Week
■ Item Parent – Diffs – Virtual Warehouse- Week
Total SOH Sum of Current WH SOH, CurrentStore SOH, Inbound WH andInbound Store.
■ Item –Virtual Warehouse - Week
■ Item Parent –Diffs – Virtual Warehouse- Week
Stock BOH The stock present for the item at thegiven location (store or warehouse)at the beginning of the given week.
■ Item – Location - Week
■ Item Parent –Diffs – Location - Week
Stock BOH VWH The stock present for the item acrossall stores that source from the givenvirtual warehouse at the beginningof the given week
■ Department – Virtual Warehouse -Week
■ Class – Virtual Warehouse - Week
■ Subclass – Virtual Warehouse - Week
■ Item – Virtual Warehouse - Week
■ Item Parent –Diffs – Virtual Warehouse- Week
Sales Issues The sales units of the item sold orissued at the given location (store orwarehouse) during the given week.
■ Item – Location - Week
■ Item Parent –Diffs – Location - Week
Sales VWH The total sales units of the item soldacross the stores that source from thegiven virtual warehouse during thegiven week.
■ Department – Virtual Warehouse -Week
■ Class – Virtual Warehouse - Week
■ Subclass – Virtual Warehouse - Week
■ Item – Virtual Warehouse - Week
■ Item Parent – Diffs – VirtualWarehouse - Week
Stock to Sales Ratio of Stock at the beginning of theweek to Sales/Issues in that week ofan item at a given location (store orwarehouse).
■ Item – Location - Week
■ Item Parent – Diffs – Location - Week

Metrics
Creating and Modifying Reports 3-9
Tran DataThe following table lists the tran data metrics.
Table 3–16 Tran Data metrics
Metric Definition Usage
Units The sales units of the item acrosslocations on the given business date.
■ Item – Day
■ Item Parent - Diffs - Day
Sales The total retail value of the sales forthe given item across locations inRMS Primary Currency.
■ Item – Day
■ Item Parent –Diffs – Day
Margin% The profit margin in percentage forthe given item based on the sales onthe given day
■ Item – Day
■ Item Parent –Diffs – Day
OTBThe following table lists the OTB metrics.
Stock to Sales VWH Ratio of Stock across all stores thatsource from the given VWH to Salesacross all stores that source from thegiven VWH for the given week.
■ Department – Virtual Warehouse -Week
■ Class – Virtual Warehouse - Week
■ Subclass – Virtual Warehouse - Week
■ Item – Virtual Warehouse - Week
■ Item Parent – Diffs – VirtualWarehouse - Week
Forecasted Qty Location The sales forecast of an item at alocation for a given week.
■ Item – Location – Week
■ Item Parent – Diffs – Location - Week
Forecasted Qty VWH The sales forecast of an item acrossall stores that source from the givenVWH.
■ Item – Virtual Warehouse – Week
■ Item Parent – Diffs – Virtual Warehouse- Week
Expected Shipment Qty The quantity of an item that isexpected for delivery in the givenweek against an ASN to the physicalwarehouse that has the given Virtualwarehouse as its primary VWH.
■ Item –Virtual Warehouse – OrderNumber - Week
■ Item Parent – Diffs – Virtual Warehouse– Order Number - Week
Table 3–15 (Cont.) Sales and Inventory Metrics
Metric Definition Usage
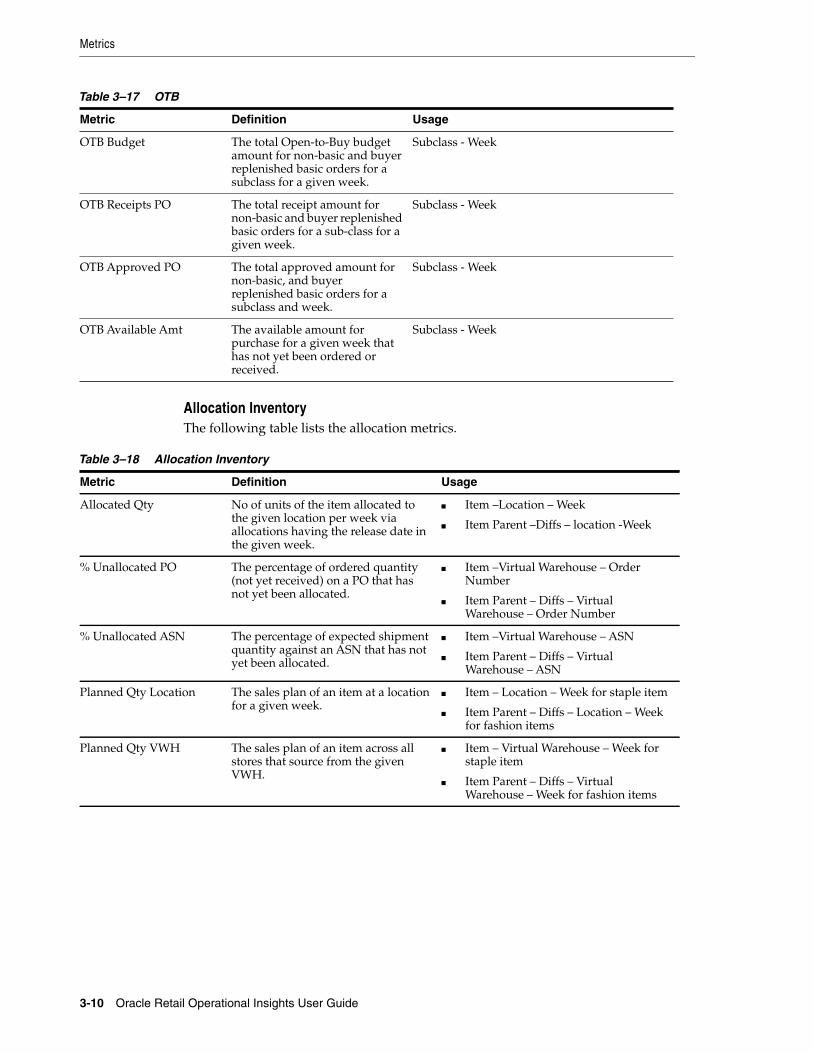
Table 3–17 OTB
Metric Definition Usage
OTB Budget The total Open-to-Buy budgetamount for non-basic and buyerreplenished basic orders for asubclass for a given week.
Subclass - Week
OTB Receipts PO The total receipt amount fornon-basic and buyer replenishedbasic orders for a sub-class for agiven week.
Subclass - Week
OTB Approved PO The total approved amount fornon-basic, and buyerreplenished basic orders for asubclass and week.
Subclass - Week
OTB Available Amt The available amount forpurchase for a given week thathas not yet been ordered orreceived.
Subclass - Week
Metrics
3-10 Oracle Retail Operational Insights User Guide
Allocation InventoryThe following table lists the allocation metrics.
Table 3–18 Allocation Inventory
Metric Definition Usage
Allocated Qty No of units of the item allocated tothe given location per week viaallocations having the release date inthe given week.
■ Item –Location – Week
■ Item Parent –Diffs – location -Week
% Unallocated PO The percentage of ordered quantity(not yet received) on a PO that hasnot yet been allocated.
■ Item –Virtual Warehouse – OrderNumber
■ Item Parent – Diffs – VirtualWarehouse – Order Number
% Unallocated ASN The percentage of expected shipmentquantity against an ASN that has notyet been allocated.
■ Item –Virtual Warehouse – ASN
■ Item Parent – Diffs – VirtualWarehouse – ASN
Planned Qty Location The sales plan of an item at a locationfor a given week.
■ Item – Location – Week for staple item
■ Item Parent – Diffs – Location – Weekfor fashion items
Planned Qty VWH The sales plan of an item across allstores that source from the givenVWH.
■ Item – Virtual Warehouse – Week forstaple item
■ Item Parent – Diffs – VirtualWarehouse – Week for fashion items

Metrics
Creating and Modifying Reports 3-11
PromoThe following table lists the Promo metrics.
Table 3–19 Promo
Metric Definition Usage
All Promo Count of all promotions bothsimple and complex that thegiven item is on in stores thatsource from the given virtualwarehouse in the given week.
■ Item - Virtual Warehouse - Week
■ Item Parent -Diffs - Virtual Warehouse- Week
Simple Promo Count of all simple promotionsthat the given item is on instores that source from the givenvirtual warehouse in the givenweek.
■ Item - Virtual Warehouse - Week
■ Item Parent -Diffs - Virtual Warehouse- Week
Metrics for ReIM OIThe following table lists the ReIM facts and metrics.
InvoicesThe following table lists the invoices metrics used by ReIM.
Table 3–20 Invoices metrics
Metric Definition Usage
Invoices Remaining Number of Invoices that are in notmatched status
■ Calendar
■ Invoice
■ User
Total Matched Invoices The total number of Invoices thatare in matched status.
■ Calendar
■ Invoice
■ User
Manual Matched The total number of Invoices thatare in matched status which werematched manually
■ Calendar
■ Invoice
■ User
AutoMatch Rate The percentage of invoices out ofthe total matched invoices thatwere auto matched.
■ Calendar
■ User
■ All Supplier
#Automatch The total number of Invoices in thegiven period of time that werematched successfully by the automatch process for the givensupplier.
■ Calendar
■ All Supplier
AutoMatch withinTolerance
The number of invoices by thegiven supplier in a given period oftime that were matched withintolerance but not perfectly matchedduring the matching process.
■ Calendar
■ All Supplier
#w/cost Disc The number of invoices by thegiven supplier in a given period oftime that have/had costdiscrepancies.
■ Calendar
■ All Supplier
■ Invoice
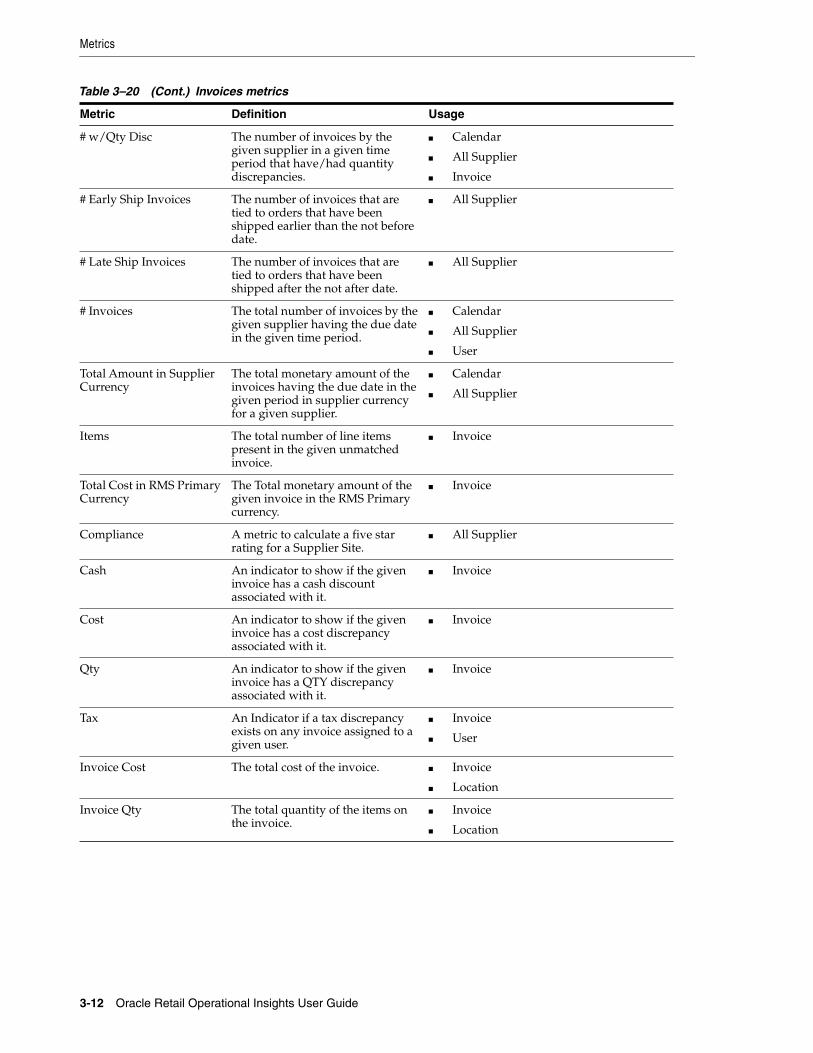
Metrics
3-12 Oracle Retail Operational Insights User Guide
# w/Qty Disc The number of invoices by thegiven supplier in a given timeperiod that have/had quantitydiscrepancies.
■ Calendar
■ All Supplier
■ Invoice
# Early Ship Invoices The number of invoices that aretied to orders that have beenshipped earlier than the not beforedate.
■ All Supplier
# Late Ship Invoices The number of invoices that aretied to orders that have beenshipped after the not after date.
■ All Supplier
# Invoices The total number of invoices by thegiven supplier having the due datein the given time period.
■ Calendar
■ All Supplier
■ User
Total Amount in SupplierCurrency
The total monetary amount of theinvoices having the due date in thegiven period in supplier currencyfor a given supplier.
■ Calendar
■ All Supplier
Items The total number of line itemspresent in the given unmatchedinvoice.
■ Invoice
Total Cost in RMS PrimaryCurrency
The Total monetary amount of thegiven invoice in the RMS Primarycurrency.
■ Invoice
Compliance A metric to calculate a five starrating for a Supplier Site.
■ All Supplier
Cash An indicator to show if the giveninvoice has a cash discountassociated with it.
■ Invoice
Cost An indicator to show if the giveninvoice has a cost discrepancyassociated with it.
■ Invoice
Qty An indicator to show if the giveninvoice has a QTY discrepancyassociated with it.
■ Invoice
Tax An Indicator if a tax discrepancyexists on any invoice assigned to agiven user.
■ Invoice
■ User
Invoice Cost The total cost of the invoice. ■ Invoice
■ Location
Invoice Qty The total quantity of the items onthe invoice.
■ Invoice
■ Location
Table 3–20 (Cont.) Invoices metrics
Metric Definition Usage

Metrics
Creating and Modifying Reports 3-13
Cost EventsThe following table lists the cost events metrics used by ReIM.
Table 3–21 Cost Events Metrics
Metric Definition Usage
Price Hist Unit Cost The historical cost of the item at thegiven location and date.
■ Item - Location -Calendar
Future Cost Net Cost The future cost of the item at the givenlocation and date for a given supplierorigin country.
■ Item - Location - Calendar SupplierOrigin country
This documentation is in preproduction status and is intended for demonstration andpreliminary use only. It may not be specific to the hardware on which you are usingthe software. Oracle Corporation and its affiliates are not responsible for and expresslydisclaim all warranties of any kind with respect to this documentation and will not beresponsible for any loss, costs, or damages incurred due to the use of thisdocumentation.
The information contained in this document is for informational sharing purposesonly and should be considered in your capacity as a customer advisory board memberor pursuant to your beta trial agreement only. It is not a commitment to deliver anymaterial, code, or functionality, and should not be relied upon in making purchasingdecisions. The development, release, and timing of any features or functionalitydescribed in this document remains at the sole discretion of Oracle.
This document in any form, software or printed matter, contains proprietaryinformation that is the exclusive property of Oracle. Your access to and use of thisconfidential material is subject to the terms and conditions of your Oracle SoftwareLicense and Service Agreement, which has been executed and with which you agree tocomply. This document and information contained herein may not be disclosed,copied, reproduced, or distributed to anyone outside Oracle without prior writtenconsent of Oracle. This document is not part of your license agreement nor can it beincorporated into any contractual agreement with Oracle or its subsidiaries oraffiliates.

Metrics
3-14 Oracle Retail Operational Insights User Guide