oracle retail xbr loss prevention cloud service release... · oracle® retail xbri loss prevention...
TRANSCRIPT

Oracle® Retail
XBRi Loss Prevention Cloud Service Release Notes Release 10.8
September 2014
XBRi 10.8
2 of 28
Copyright © 2015, Oracle and/or its affiliates. All rights reserved.
Primary Author:
Contributors:
This software and related documentation are provided under a license agreement containing restrictions on use and disclosure and are protected by intellectual property laws. Except as expressly permitted in your license agreement or allowed by law, you may not use, copy, reproduce, translate, broadcast, modify, license, transmit, distribute, exhibit, perform, publish, or display any part, in any form, or by any means. Reverse engineering, disassembly, or decompilation of this software, unless required by law for interoperability, is prohibited.
The information contained herein is subject to change without notice and is not warranted to be error-free. If you find any errors, please report them to us in writing.
If this software or related documentation is delivered to the U.S. Government or anyone licensing it on behalf of the U.S. Government, then the following notice is applicable:
U.S. GOVERNMENT END USERS: Oracle programs, including any operating system, integrated software, any programs installed on the hardware, and/or documentation, delivered to U.S. Government end users are "commercial computer software" pursuant to the applicable Federal Acquisition Regulation and agency-specific supplemental regulations. As such, use, duplication, disclosure, modification, and adaptation of the programs, including any operating system, integrated software, any programs installed on the hardware, and/or documentation, shall be subject to license terms and license restrictions applicable to the programs. No other rights are granted to the U.S. Government.
This software or hardware is developed for general use in a variety of information management applications. It is not developed or intended for use in any inherently dangerous applications, including applications that may create a risk of personal injury. If you use this software or hardware in dangerous applications, then you shall be responsible to take all appropriate fail-safe, backup, redundancy, and other measures to ensure its safe use. Oracle Corporation and its affiliates disclaim any liability for any damages caused by use of this software or hardware in dangerous applications.
Oracle and Java are registered trademarks of Oracle and/or its affiliates. Other names may be trademarks of their respective owners.
Intel and Intel Xeon are trademarks or registered trademarks of Intel Corporation. All SPARC trademarks are used under license and are trademarks or registered trademarks of SPARC International, Inc. AMD, Opteron, the AMD logo, and the AMD Opteron logo are trademarks or registered trademarks of Advanced Micro Devices. UNIX is a registered trademark of The Open Group.
This software or hardware and documentation may provide access to or information on content, products, and services from third parties. Oracle Corporation and its affiliates are not responsible for and expressly disclaim all warranties of any kind with respect to third-party content, products, and services unless otherwise set forth in an applicable agreement between you and Oracle. Oracle Corporation and its affiliates will not be responsible for any loss, costs, or damages incurred due to your access to or use of third-party content, products, or services, except as set forth in an applicable agreement between you and Oracle.
Contact Information
30500 Bruce Industrial Parkway
Cleveland, OH 44139 USA
Toll Free: 888.328.2826
Tel: 440.498.4414
Fax: 440.542.3043
1800 West Park Drive
Westboro, MA 01581
Tel:508.655.7500
Fax:508.647.9495
7031 Columbia Gateway Drive
Columbia, MD 21046-2289
Tel: 443.285.6000
XBRi 10.8
3 of 28
Table of Contents
RELEASE OVERVIEW ............................................................................................... 4
FEATURES .............................................................................................................. 5
New Dashboards .................................................................................................................... 5
Sales Analysis Dashboard .................................................................................................. 5
Void Activity Dashboard ...................................................................................................... 6
Discount Activity Dashboard ............................................................................................... 7
XBR Ingenium Mobile App ...................................................................................................... 8
XBR Ingenium Home Page ................................................................................................. 8
Sidebar Menu ..................................................................................................................... 9
Page Navigation ................................................................................................................10
Annotating, Sharing and Printing........................................................................................10
Quick Lookups ...................................................................................................................11
Loss Prevention Dashboards .............................................................................................14
Reports ..............................................................................................................................15
Survey ...............................................................................................................................16
Visual Insight .........................................................................................................................19
Import Data ........................................................................................................................19
Create Documents and Dashboards ..................................................................................20
Example: A Visual Insight Dashboard ................................................................................21
Master File Distribution ..........................................................................................................23
KEY RESOLVED ISSUES ........................................................................................ 24
KEY KNOWN ISSUES ............................................................................................. 25
SUPPORTED PLATFORMS ...................................................................................... 26
Supported Platforms in 10.8 ..................................................................................................26
DATABASE UPDATES ............................................................................................ 27
New Fields in Existing Tables ................................................................................................27
New Tables ...........................................................................................................................27
DOCUMENTATION................................................................................................. 28
XBRi 10.8
4 of 28
Release Overview
Note: The rebranding for the latest version of this documentation set is in development as part
of post MICROS acquisition activities. References to former MICROS product names may exist
throughout this existing documentation set.
This document contains the release notes for XBRi Ingenium 10.8 release. These release notes
cover new features and enhancements for this version. XBRi
10.8 is available to Food and Beverage customers in all global markets. Embedded on a leading Business Intelligence platform, it adds robust Self-Service BI (Visual Insight custom dashboard and document) capabilities, several new pre-designed dashboards, Dynamic Address Lists for external subscription delivery, and the XBR Ingenium mobile app that lets users easily look up data on locations and employees, and run reports and dynamic dashboards from anywhere, at any time on an iPad, iPad mini, or Android tablet.
Release version Release Date
10.8 9/2014
XBRi 10.8
5 of 28
Features
This section includes a brief summary of the new features in XBRi Ingenium 10.8.
New Dashboards There are three new pre-designed dashboards provided in the categories of Discounts, Sales
Analysis, and Voids. These dashboards and the KPI Dashboard are also available on the XBR
Ingenium mobile app. Dashboards allow for interactive analysis by using grids, graphs,
control selectors, and widgets.
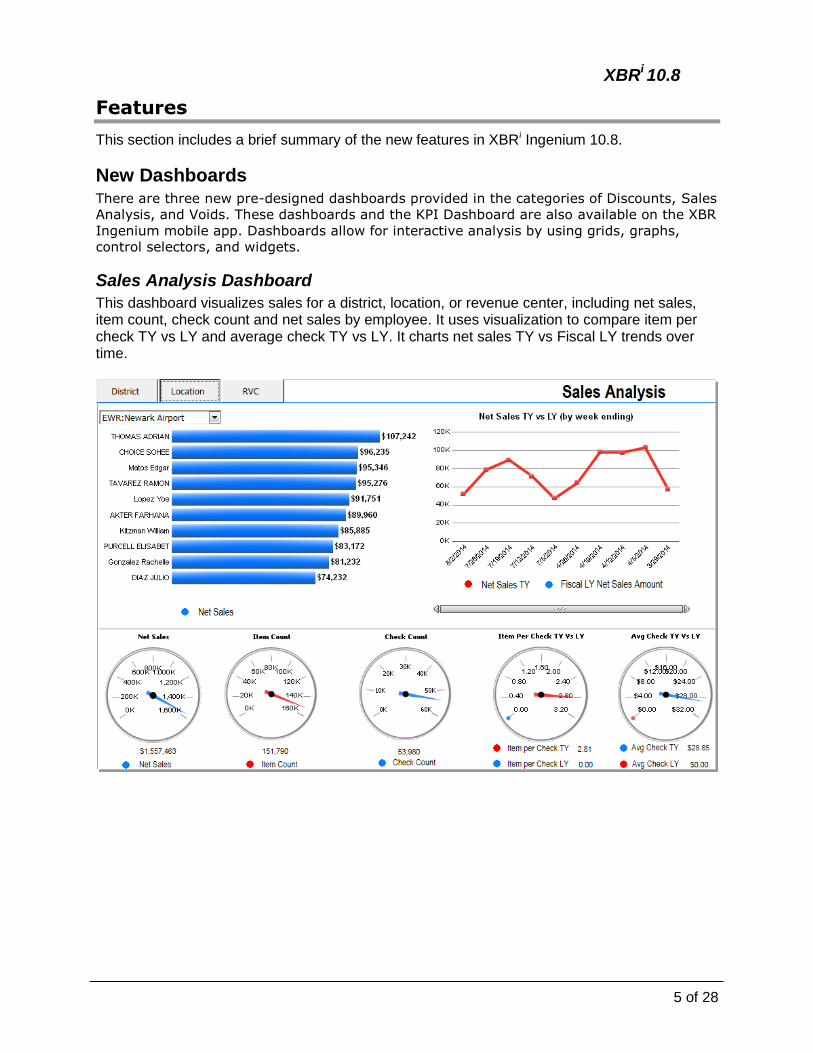
Sales Analysis Dashboard
This dashboard visualizes sales for a district, location, or revenue center, including net sales, item count, check count and net sales by employee. It uses visualization to compare item per check TY vs LY and average check TY vs LY. It charts net sales TY vs Fiscal LY trends over time.
XBRi 10.8
6 of 28
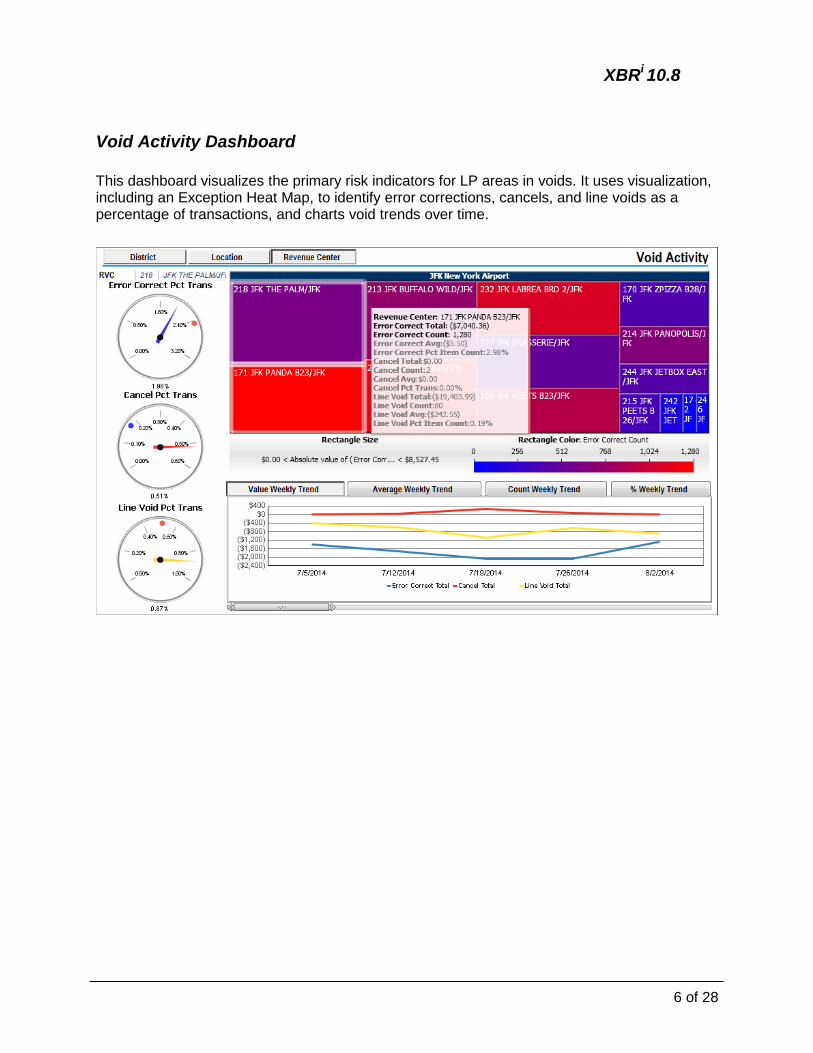
Void Activity Dashboard
This dashboard visualizes the primary risk indicators for LP areas in voids. It uses visualization, including an Exception Heat Map, to identify error corrections, cancels, and line voids as a percentage of transactions, and charts void trends over time.
XBRi 10.8
7 of 28
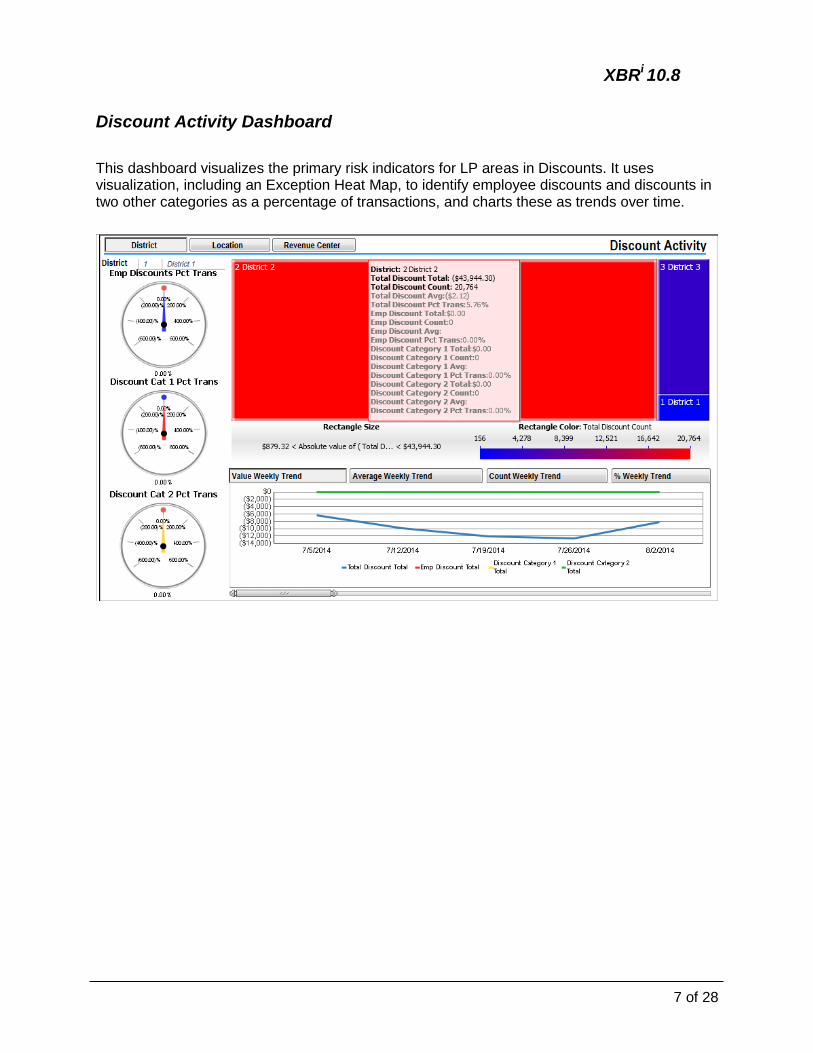
Discount Activity Dashboard
This dashboard visualizes the primary risk indicators for LP areas in Discounts. It uses visualization, including an Exception Heat Map, to identify employee discounts and discounts in two other categories as a percentage of transactions, and charts these as trends over time.

XBRi 10.8
8 of 28
XBR Ingenium Mobile App XBRi
10.8 introduces the XBR Ingenium mobile app for Food and Beverage customers. This
app provides ease of use for LP team members working in the field and in remote locations. The app provides access to targeted dashboards and reports and the ability to look up data on locations and employees. The Survey feature allows you to view and rate location compliance parameters. You can then enter the responses in a survey form. All survey information will be available in the XBRi system for in-depth analysis.
XBR Ingenium Home Page
The home page offers access icons for lookups, dashboards, reports, surveys and e-learning. A
tap on the icon in the top left corner reveals a menu with access to all of these features and their sub-menus. To access a feature, tap on the related icon or item from the home page or the menu.
XBRi 10.8
9 of 28
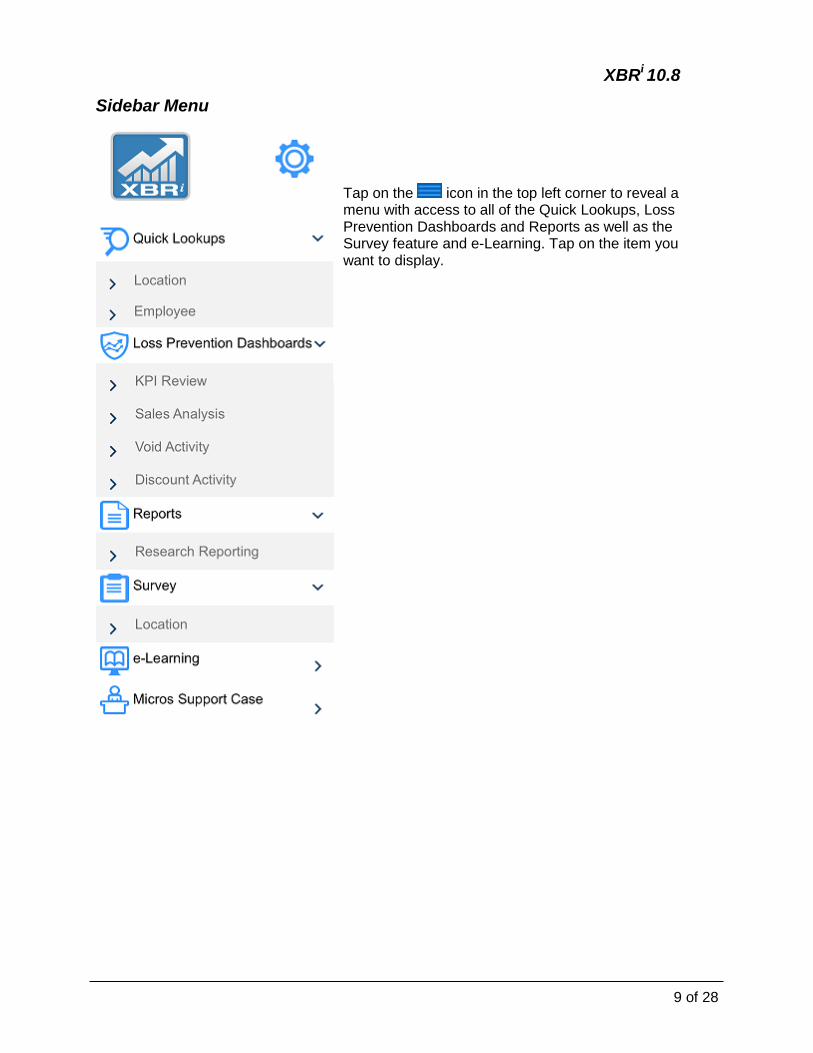
Sidebar Menu
Tap on the icon in the top left corner to reveal a menu with access to all of the Quick Lookups, Loss Prevention Dashboards and Reports as well as the Survey feature and e-Learning. Tap on the item you want to display.
XBRi 10.8
10 of 28
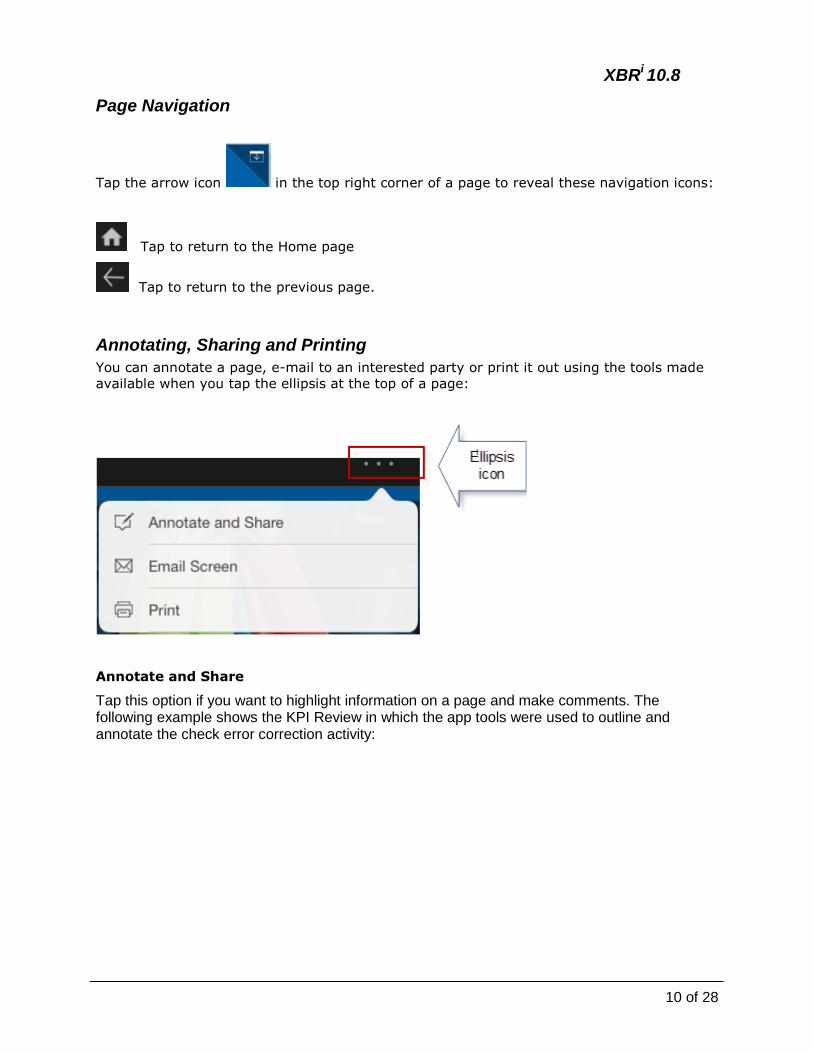
Page Navigation
Tap the arrow icon in the top right corner of a page to reveal these navigation icons:
Tap to return to the Home page
Tap to return to the previous page.
Annotating, Sharing and Printing
You can annotate a page, e-mail to an interested party or print it out using the tools made
available when you tap the ellipsis at the top of a page:
Annotate and Share
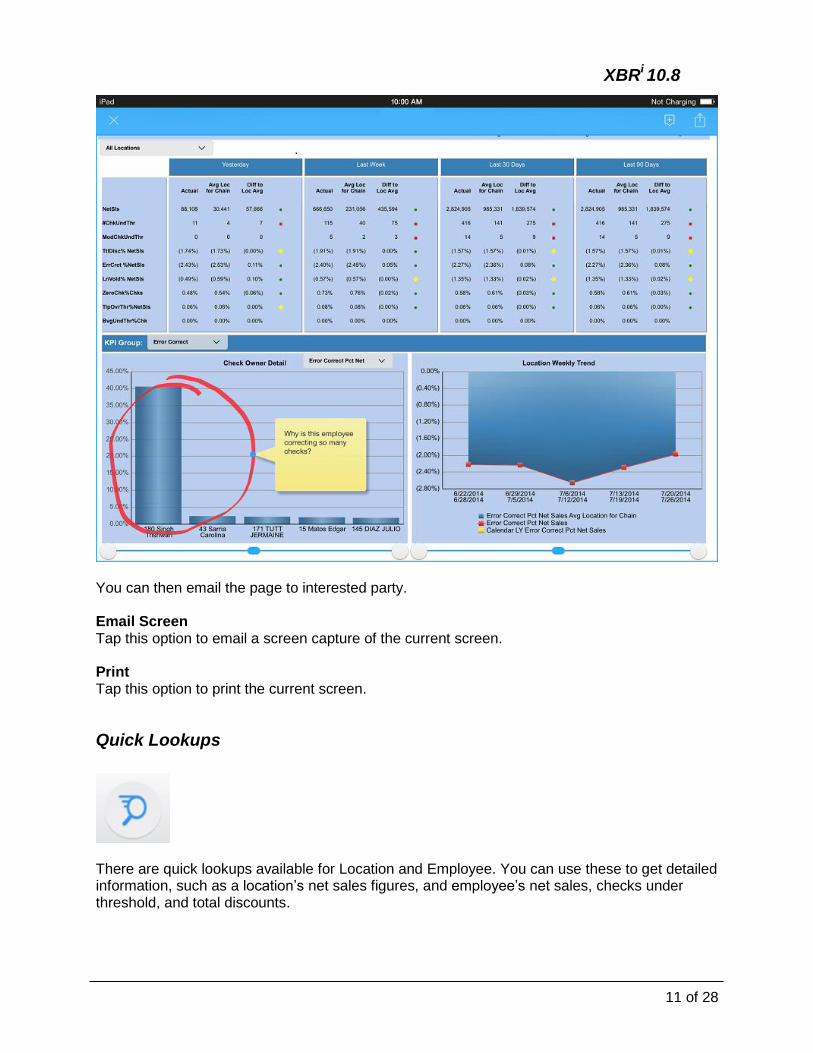
Tap this option if you want to highlight information on a page and make comments. The following example shows the KPI Review in which the app tools were used to outline and annotate the check error correction activity:
XBRi 10.8
11 of 28
You can then email the page to interested party. Email Screen Tap this option to email a screen capture of the current screen. Print Tap this option to print the current screen.
Quick Lookups
There are quick lookups available for Location and Employee. You can use these to get detailed information, such as a location’s net sales figures, and employee’s net sales, checks under threshold, and total discounts.
XBRi 10.8
12 of 28
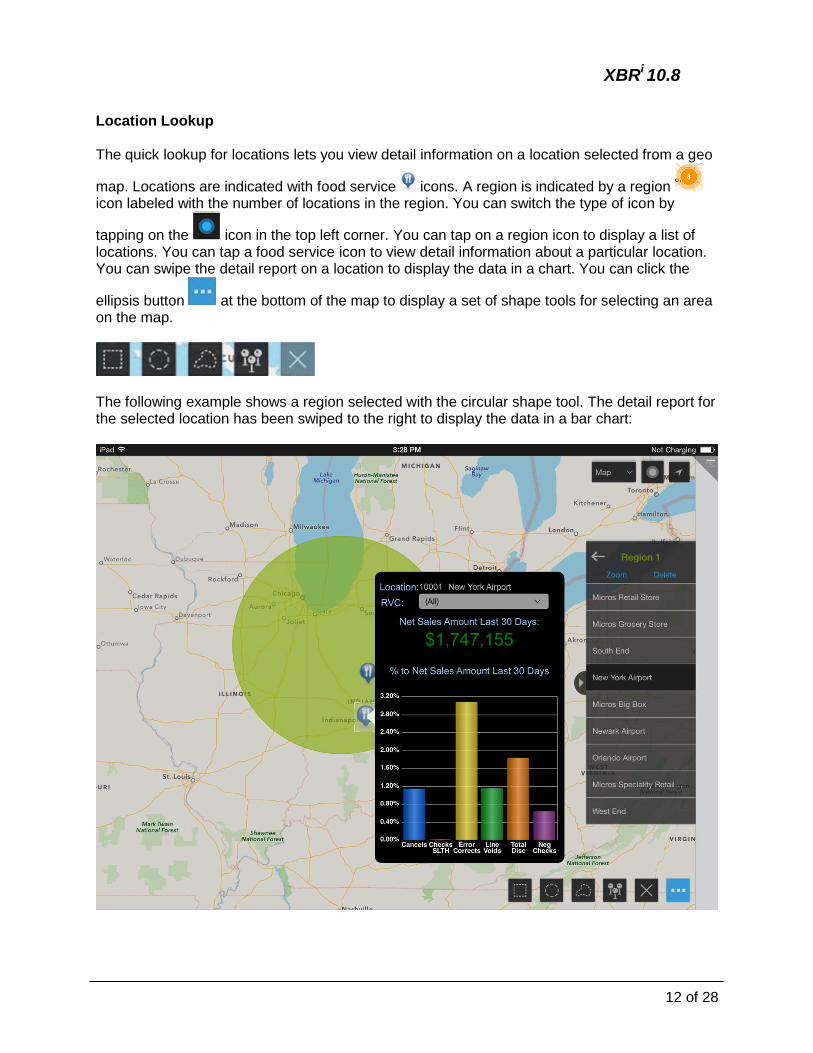
Location Lookup The quick lookup for locations lets you view detail information on a location selected from a geo
map. Locations are indicated with food service icons. A region is indicated by a region icon labeled with the number of locations in the region. You can switch the type of icon by
tapping on the icon in the top left corner. You can tap on a region icon to display a list of locations. You can tap a food service icon to view detail information about a particular location. You can swipe the detail report on a location to display the data in a chart. You can click the
ellipsis button at the bottom of the map to display a set of shape tools for selecting an area on the map.
The following example shows a region selected with the circular shape tool. The detail report for the selected location has been swiped to the right to display the data in a bar chart:
XBRi 10.8
13 of 28
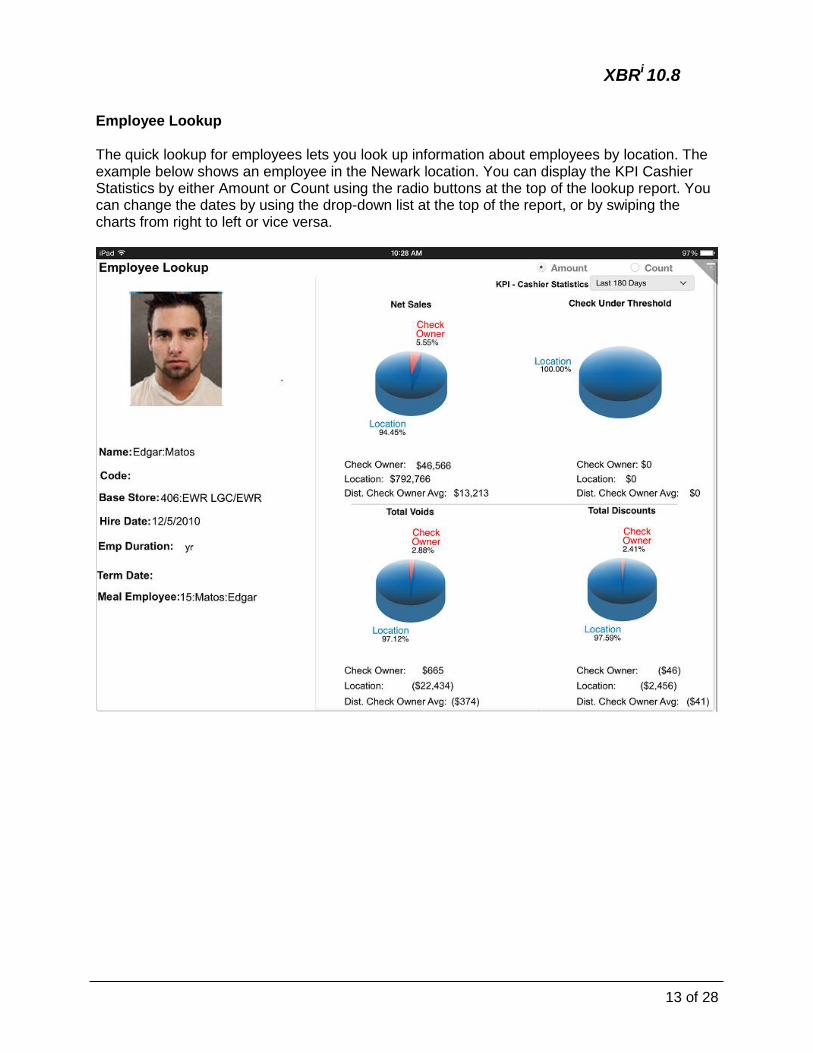
Employee Lookup The quick lookup for employees lets you look up information about employees by location. The example below shows an employee in the Newark location. You can display the KPI Cashier Statistics by either Amount or Count using the radio buttons at the top of the lookup report. You can change the dates by using the drop-down list at the top of the report, or by swiping the charts from right to left or vice versa.
XBRi 10.8
14 of 28
Loss Prevention Dashboards
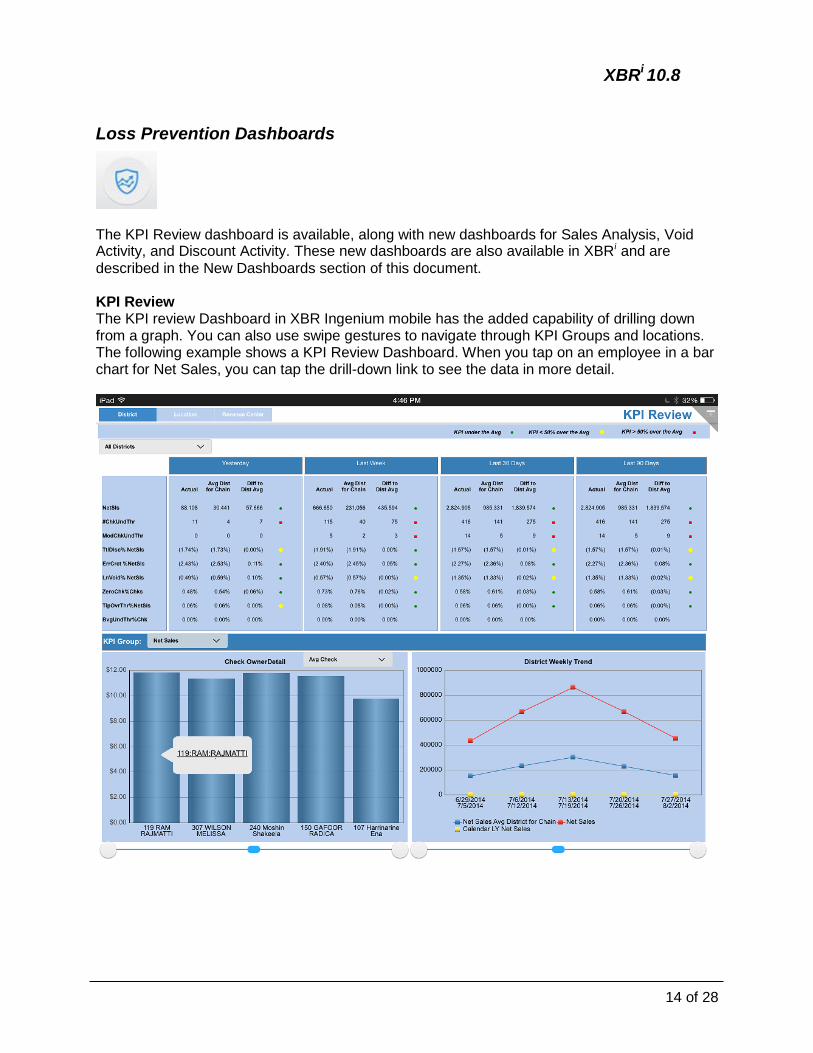
The KPI Review dashboard is available, along with new dashboards for Sales Analysis, Void Activity, and Discount Activity. These new dashboards are also available in XBRi and are
described in the New Dashboards section of this document. KPI Review The KPI review Dashboard in XBR Ingenium mobile has the added capability of drilling down from a graph. You can also use swipe gestures to navigate through KPI Groups and locations. The following example shows a KPI Review Dashboard. When you tap on an employee in a bar chart for Net Sales, you can tap the drill-down link to see the data in more detail.
XBRi 10.8
15 of 28
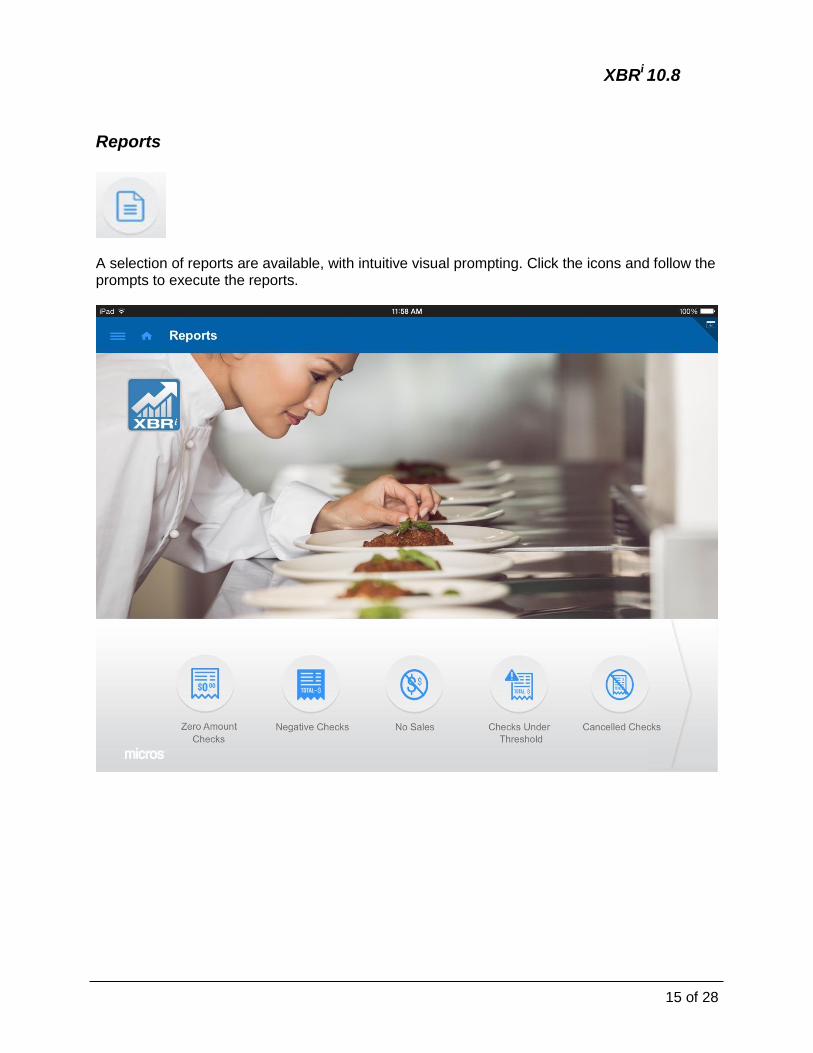
Reports
A selection of reports are available, with intuitive visual prompting. Click the icons and follow the prompts to execute the reports.
XBRi 10.8
16 of 28
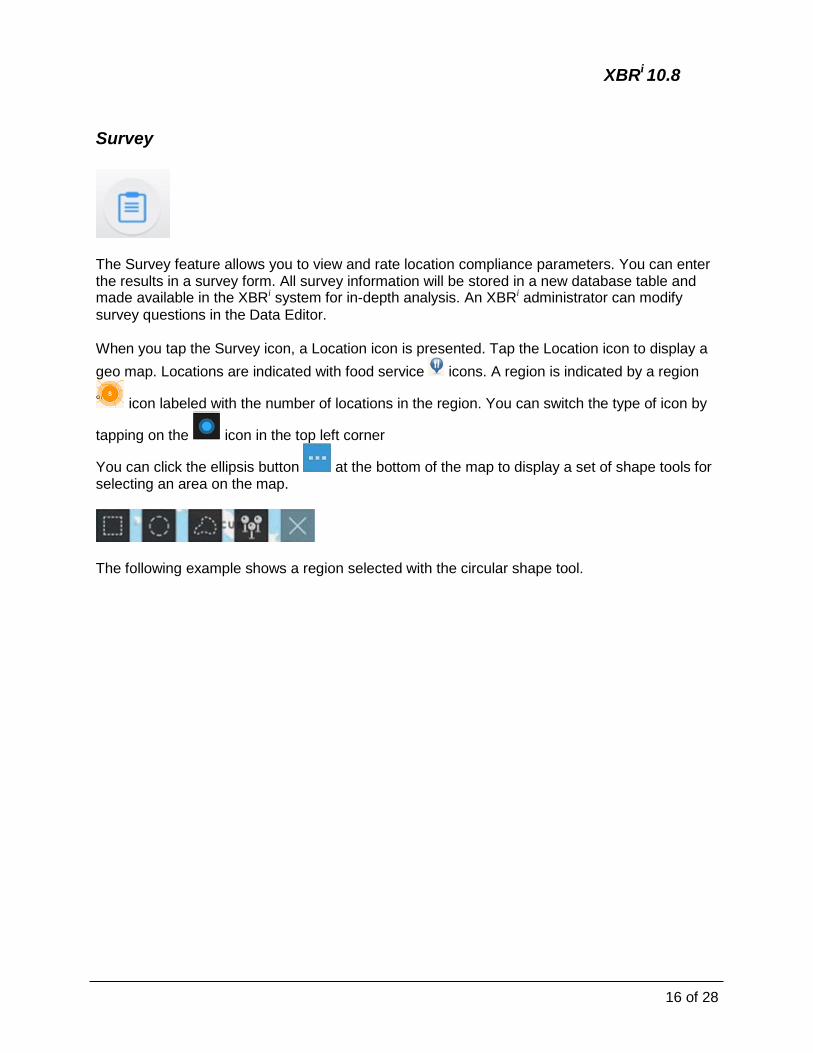
Survey
The Survey feature allows you to view and rate location compliance parameters. You can enter the results in a survey form. All survey information will be stored in a new database table and made available in the XBRi system for in-depth analysis. An XBRi administrator can modify
survey questions in the Data Editor. When you tap the Survey icon, a Location icon is presented. Tap the Location icon to display a
geo map. Locations are indicated with food service icons. A region is indicated by a region
icon labeled with the number of locations in the region. You can switch the type of icon by
tapping on the icon in the top left corner
You can click the ellipsis button at the bottom of the map to display a set of shape tools for selecting an area on the map.
The following example shows a region selected with the circular shape tool.
XBRi 10.8
17 of 28
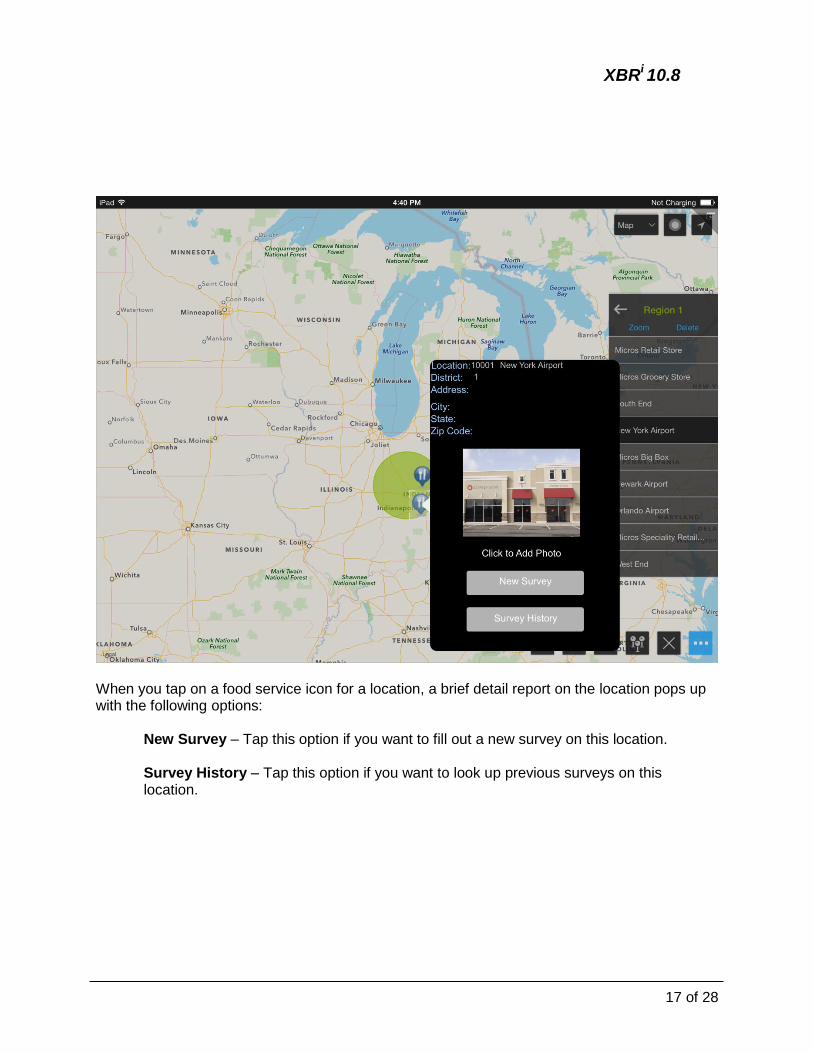
When you tap on a food service icon for a location, a brief detail report on the location pops up with the following options:
New Survey – Tap this option if you want to fill out a new survey on this location. Survey History – Tap this option if you want to look up previous surveys on this location.
XBRi 10.8
18 of 28
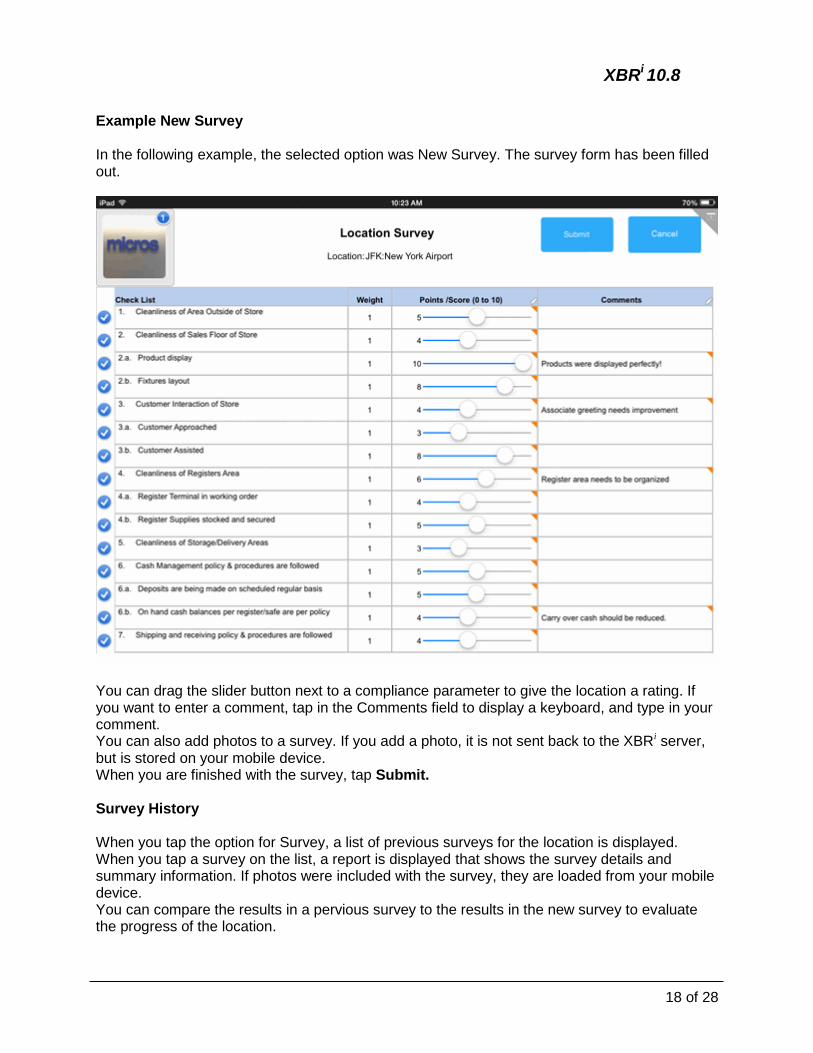
Example New Survey In the following example, the selected option was New Survey. The survey form has been filled out.
You can drag the slider button next to a compliance parameter to give the location a rating. If you want to enter a comment, tap in the Comments field to display a keyboard, and type in your comment. You can also add photos to a survey. If you add a photo, it is not sent back to the XBRi server, but is stored on your mobile device. When you are finished with the survey, tap Submit. Survey History When you tap the option for Survey, a list of previous surveys for the location is displayed. When you tap a survey on the list, a report is displayed that shows the survey details and summary information. If photos were included with the survey, they are loaded from your mobile device. You can compare the results in a pervious survey to the results in the new survey to evaluate the progress of the location.
XBRi 10.8
19 of 28
Visual Insight Visual Insight allows power users to connect XBRi to other data sources across their enterprise for LP focus and flexibility. Integrate with multi-source database tables or Excel, CSV, or text files. Visualize your data with the ability to build your own dashboards to be shared and used with others across your organization.
Import Data
With Visual Insight functionality, you can import data from the XBRi
database or from your own database tables and join multiple tables in the way you want. You can also import data that you have copied to Excel, CSV or txt files. Import a File If you choose the File Import option, you can import the Excel. CSV or txt file from your computer or network or from a URL. Once imported to XBRi, the data in the file can be mapped
to project attributes and metrics and saved as a dataset to be used in creating documents and dashboards. You can save the data in either tabbed or cross-tabbed format, and modify it as needed. Import a Database
If you choose the Database Import option, you can choose available tables from your own or XBRi databases and join different tables as needed. The imported data can be mapped to
project attributes and metrics. You can save the imported tables as datasets for creating documents and dashboards.

XBRi 10.8
20 of 28
Create Documents and Dashboards
You can use Visual Insight to create your own custom documents and dashboards out of datasets that you have imported or out of available XBRi reports. The variety of options offered
make it possible to design documents and dashboards to fit just about any LP reporting requirement. You can use one of the many pre-formatted templates provided, or create a document or dashboard from a blank template. These are the Dashboard and Document templates that are presented when you choose the Create Document command:
XBRi 10.8
21 of 28
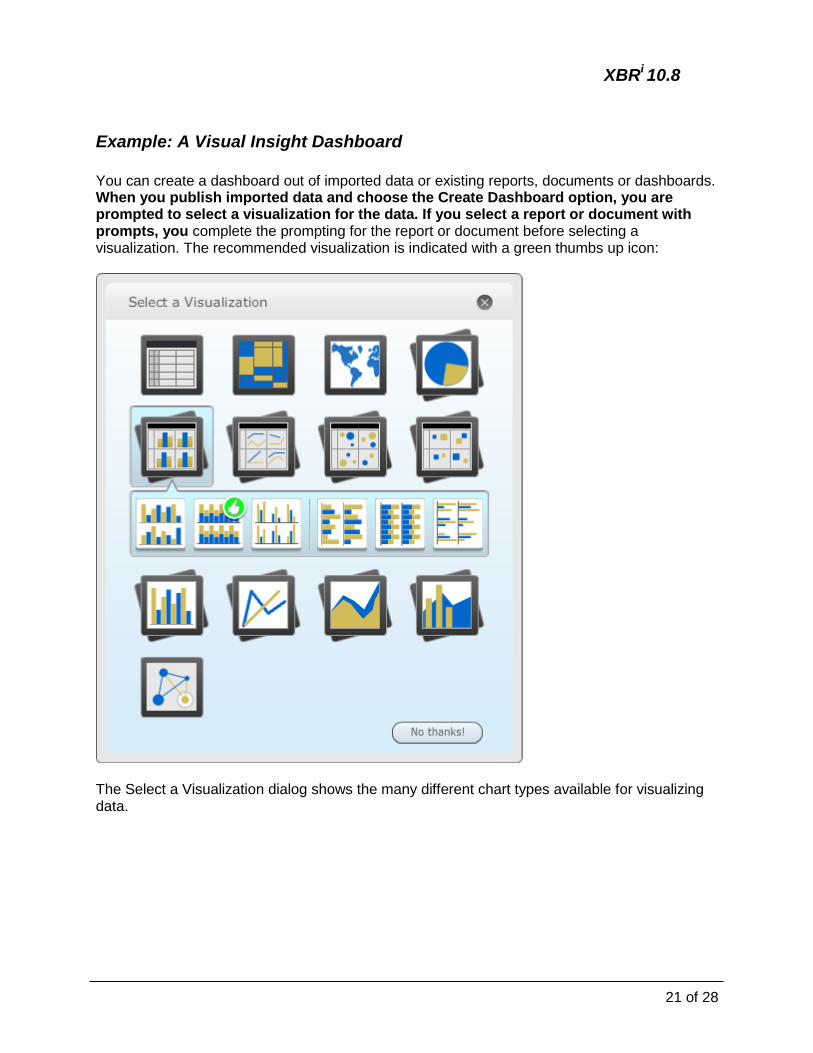
Example: A Visual Insight Dashboard
You can create a dashboard out of imported data or existing reports, documents or dashboards. When you publish imported data and choose the Create Dashboard option, you are prompted to select a visualization for the data. If you select a report or document with prompts, you complete the prompting for the report or document before selecting a visualization. The recommended visualization is indicated with a green thumbs up icon:
The Select a Visualization dialog shows the many different chart types available for visualizing data.

XBRi 10.8
22 of 28
The example below shows a dashboard created using Visual Insight. It consists of three parts, an existing dashboard, a table visualization and a network visualization.
A. The Units vs. Cost Units by Store dashboard offers store-to-store comparisons of units invoiced
and delivered by date, and provides the ability to drill down on product unit variance for a
particular store. B. This tabular visualization show the items in a store by delivery date with the cost variance and
unit variance for each item. C. This network visualization shows the weighted variance for each item in a store. At a glance, it is
obvious that the variance for the Diet Coke 12 pack item should be investigated.
Dashboards are dynamic and interactive, allowing you to switch between visualizations for stores and other dynamic elements.

XBRi 10.8
23 of 28
Master File Distribution The Master File Distribution feature allows customers to send subscription reports to recipients who are not defined users in XBRi. This is done through Dynamic address lists that are derived
from reports based on the core master tables for Store, District, and Region for Retail installations and District and Location for Food and Beverage installations. When you create a Dynamic address list, it becomes available on the Recipients list when creating email subscriptions for reports. MICROS provides Master File Distribution reports that can be used to create Dynamic address lists for the relevant core master tables. The customer can modify these reports by adding filtering, and then use them to create their own Dynamic address lists.
The example above shows the User Preferences > Dynamic address lists page with Dynamic Address Lists created from the Master File Distribution reports provided for a Retail installation.
XBRi 10.8
24 of 28
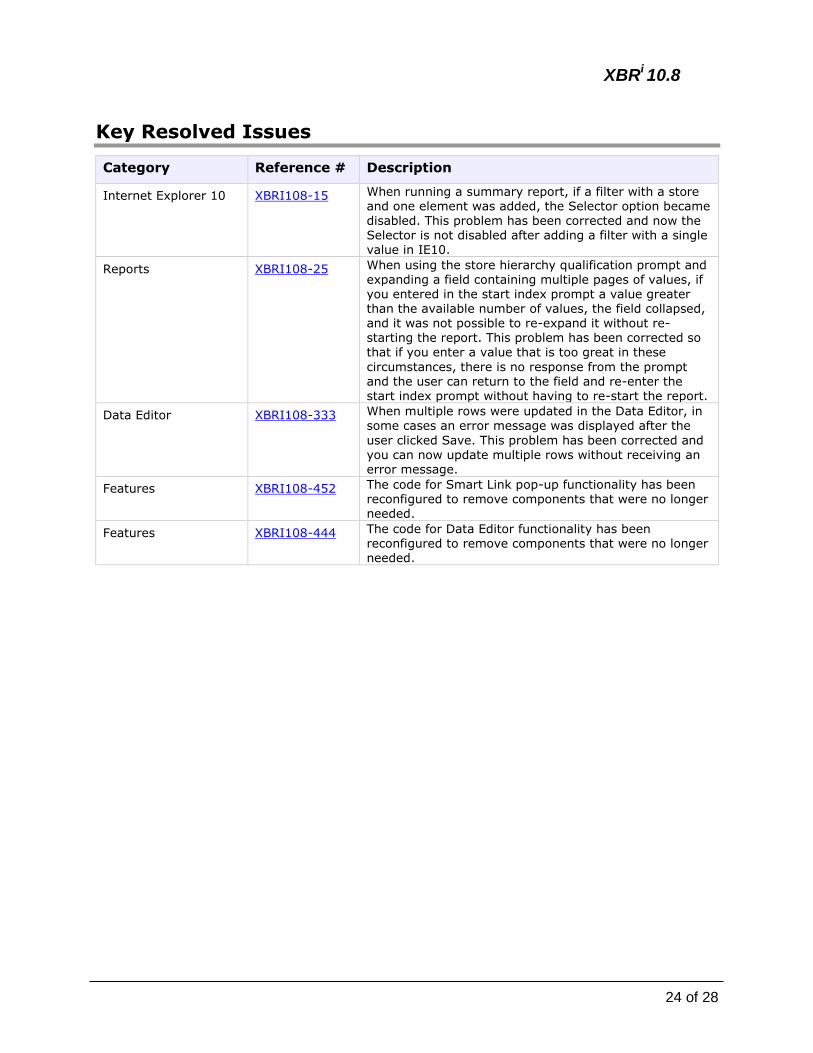
Key Resolved Issues
Category Reference # Description
Internet Explorer 10 XBRI108-15 When running a summary report, if a filter with a store and one element was added, the Selector option became disabled. This problem has been corrected and now the Selector is not disabled after adding a filter with a single value in IE10.
Reports XBRI108-25 When using the store hierarchy qualification prompt and expanding a field containing multiple pages of values, if you entered in the start index prompt a value greater than the available number of values, the field collapsed, and it was not possible to re-expand it without re-starting the report. This problem has been corrected so
that if you enter a value that is too great in these
circumstances, there is no response from the prompt and the user can return to the field and re-enter the start index prompt without having to re-start the report.
Data Editor XBRI108-333 When multiple rows were updated in the Data Editor, in some cases an error message was displayed after the
user clicked Save. This problem has been corrected and you can now update multiple rows without receiving an error message.
Features XBRI108-452 The code for Smart Link pop-up functionality has been reconfigured to remove components that were no longer needed.
Features XBRI108-444 The code for Data Editor functionality has been reconfigured to remove components that were no longer needed.
XBRi 10.8
25 of 28
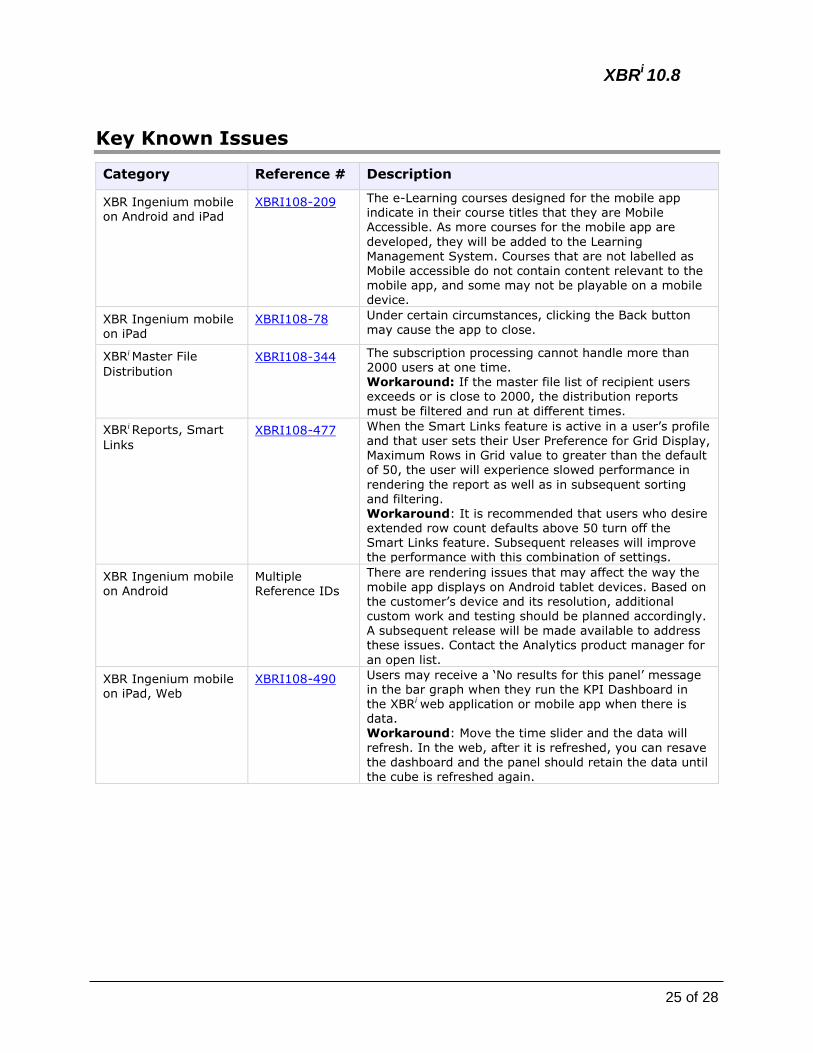
Key Known Issues
Category Reference # Description
XBR Ingenium mobile on Android and iPad
XBRI108-209 The e-Learning courses designed for the mobile app indicate in their course titles that they are Mobile Accessible. As more courses for the mobile app are
developed, they will be added to the Learning Management System. Courses that are not labelled as Mobile accessible do not contain content relevant to the mobile app, and some may not be playable on a mobile device.
XBR Ingenium mobile on iPad
XBRI108-78 Under certain circumstances, clicking the Back button may cause the app to close.
XBRi Master File
Distribution
XBRI108-344 The subscription processing cannot handle more than 2000 users at one time. Workaround: If the master file list of recipient users exceeds or is close to 2000, the distribution reports
must be filtered and run at different times.
XBRi Reports, Smart
Links
XBRI108-477 When the Smart Links feature is active in a user’s profile and that user sets their User Preference for Grid Display, Maximum Rows in Grid value to greater than the default of 50, the user will experience slowed performance in
rendering the report as well as in subsequent sorting and filtering. Workaround: It is recommended that users who desire extended row count defaults above 50 turn off the Smart Links feature. Subsequent releases will improve the performance with this combination of settings.
XBR Ingenium mobile on Android
Multiple Reference IDs
There are rendering issues that may affect the way the mobile app displays on Android tablet devices. Based on the customer’s device and its resolution, additional custom work and testing should be planned accordingly. A subsequent release will be made available to address these issues. Contact the Analytics product manager for
an open list.
XBR Ingenium mobile on iPad, Web
XBRI108-490 Users may receive a ‘No results for this panel’ message in the bar graph when they run the KPI Dashboard in the XBRi web application or mobile app when there is data. Workaround: Move the time slider and the data will
refresh. In the web, after it is refreshed, you can resave the dashboard and the panel should retain the data until the cube is refreshed again.

XBRi 10.8
26 of 28
Supported Platforms
The XBRi version 10.8 release is supported on the following platforms:
Supported Platforms in 10.8
Category Platform Comments
DBMS MS SQL Server 2008, 2012
Oracle 10g, 11g, 12c
OS (Web Server, I-Server)
Windows Server 2008 R2, 2012
The Xconnect server for the ETL process does not currently support Windows Server 2012
OS (Client) Windows 7
OS (Mobile Client) iOS7
Apple Mac PC and Laptop
OS X For video linking, Apple-compatible video software is required
WEB SERVER Apache Tomcat 7 (64 bit)
JVM JDK 1.7 JRE 1.7 required for video linking
Browsers Comments
Internet Explorer 8/9/10 Compatibility view is not supported
Safari (iPad) Basic analyst functionality supported on iPad browser
Firefox Version 30.0
Google Chrome Version 37.0
Mobile Devices (XBR Ingenium mobile) Comments
Apple iPad iOS7
Android tablet 4.0.3 (1280X800 Resolution)
XBRi 10.8
27 of 28
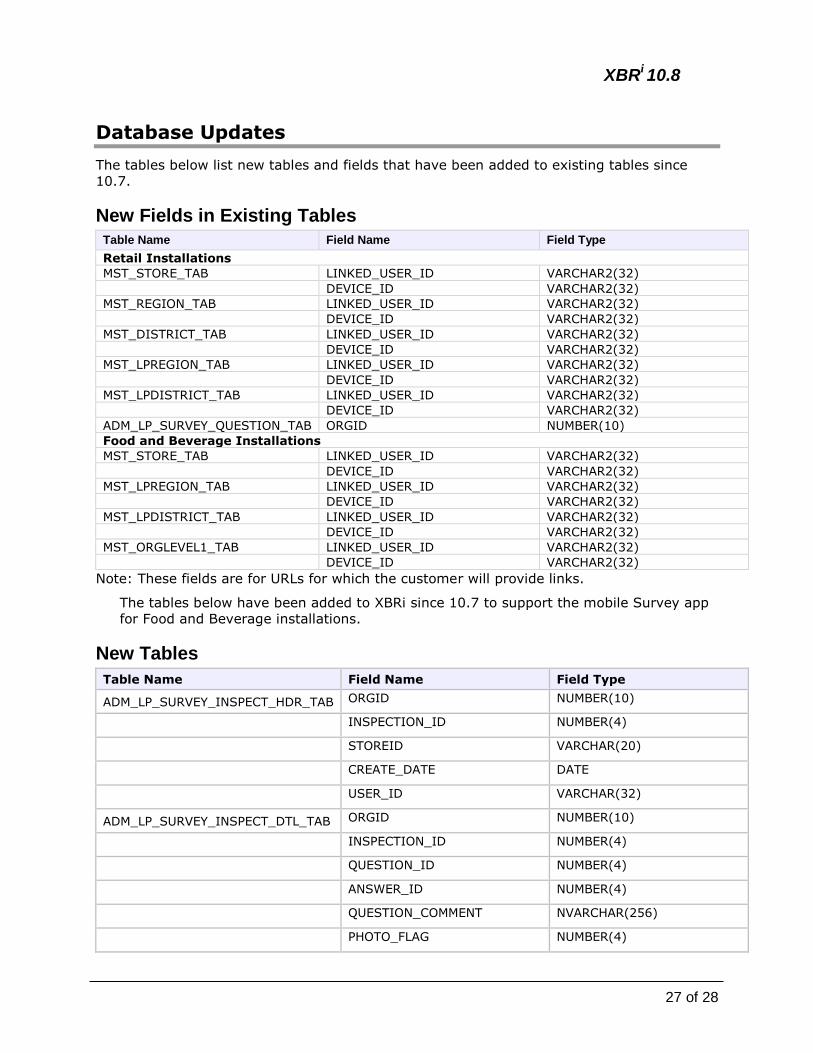
Database Updates
The tables below list new tables and fields that have been added to existing tables since
10.7.
New Fields in Existing Tables
Table Name Field Name Field Type
Retail Installations
MST_STORE_TAB LINKED_USER_ID VARCHAR2(32)
DEVICE_ID VARCHAR2(32)
MST_REGION_TAB LINKED_USER_ID VARCHAR2(32)
DEVICE_ID VARCHAR2(32)
MST_DISTRICT_TAB LINKED_USER_ID VARCHAR2(32)
DEVICE_ID VARCHAR2(32)
MST_LPREGION_TAB LINKED_USER_ID VARCHAR2(32)
DEVICE_ID VARCHAR2(32)
MST_LPDISTRICT_TAB LINKED_USER_ID VARCHAR2(32)
DEVICE_ID VARCHAR2(32)
ADM_LP_SURVEY_QUESTION_TAB ORGID NUMBER(10)
Food and Beverage Installations
MST_STORE_TAB LINKED_USER_ID VARCHAR2(32)
DEVICE_ID VARCHAR2(32)
MST_LPREGION_TAB LINKED_USER_ID VARCHAR2(32)
DEVICE_ID VARCHAR2(32)
MST_LPDISTRICT_TAB LINKED_USER_ID VARCHAR2(32)
DEVICE_ID VARCHAR2(32)
MST_ORGLEVEL1_TAB LINKED_USER_ID VARCHAR2(32)
DEVICE_ID VARCHAR2(32)
Note: These fields are for URLs for which the customer will provide links.
The tables below have been added to XBRi since 10.7 to support the mobile Survey app
for Food and Beverage installations.
New Tables
Table Name Field Name Field Type
ADM_LP_SURVEY_INSPECT_HDR_TAB ORGID NUMBER(10)
INSPECTION_ID NUMBER(4)
STOREID VARCHAR(20)
CREATE_DATE DATE
USER_ID VARCHAR(32)
ADM_LP_SURVEY_INSPECT_DTL_TAB ORGID NUMBER(10)
INSPECTION_ID NUMBER(4)
QUESTION_ID NUMBER(4)
ANSWER_ID NUMBER(4)
QUESTION_COMMENT NVARCHAR(256)
PHOTO_FLAG NUMBER(4)
XBRi 10.8
28 of 28
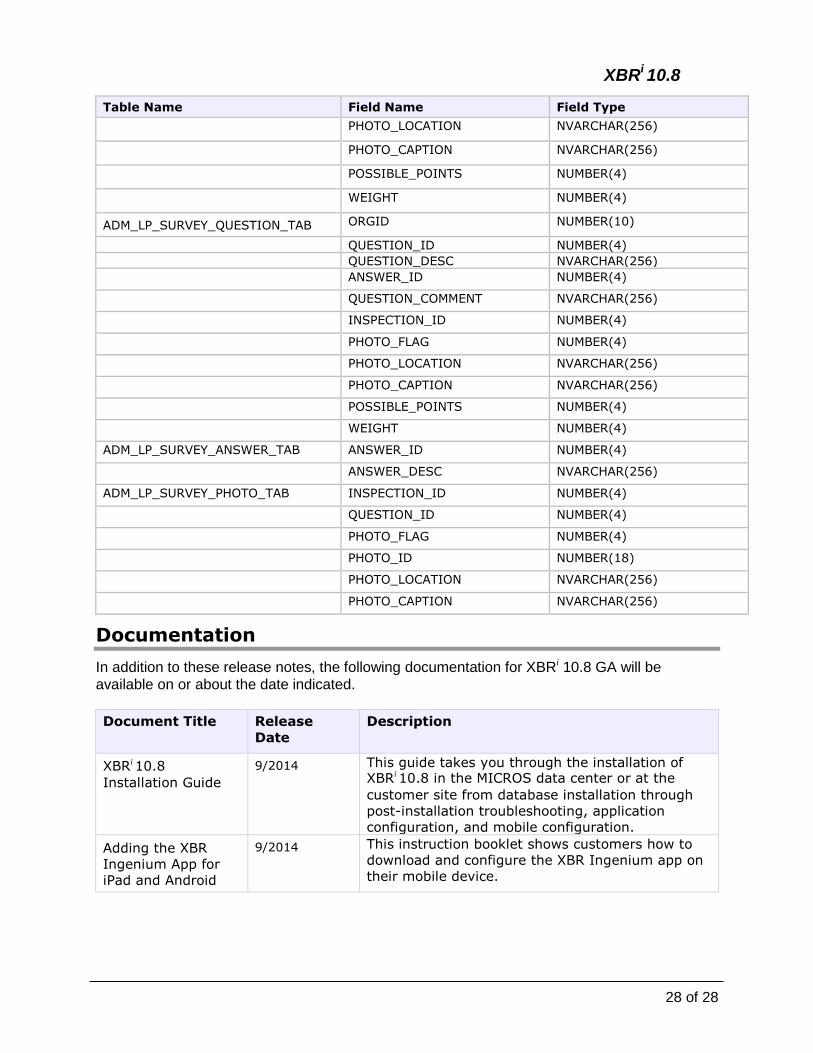
Table Name Field Name Field Type
PHOTO_LOCATION NVARCHAR(256)
PHOTO_CAPTION NVARCHAR(256)
POSSIBLE_POINTS NUMBER(4)
WEIGHT NUMBER(4)
ADM_LP_SURVEY_QUESTION_TAB ORGID NUMBER(10)
QUESTION_ID NUMBER(4)
QUESTION_DESC NVARCHAR(256)
ANSWER_ID NUMBER(4)
QUESTION_COMMENT NVARCHAR(256)
INSPECTION_ID NUMBER(4)
PHOTO_FLAG NUMBER(4)
PHOTO_LOCATION NVARCHAR(256)
PHOTO_CAPTION NVARCHAR(256)
POSSIBLE_POINTS NUMBER(4)
WEIGHT NUMBER(4)
ADM_LP_SURVEY_ANSWER_TAB ANSWER_ID NUMBER(4)
ANSWER_DESC NVARCHAR(256)
ADM_LP_SURVEY_PHOTO_TAB INSPECTION_ID NUMBER(4)
QUESTION_ID NUMBER(4)
PHOTO_FLAG NUMBER(4)
PHOTO_ID NUMBER(18)
PHOTO_LOCATION NVARCHAR(256)
PHOTO_CAPTION NVARCHAR(256)
Documentation
In addition to these release notes, the following documentation for XBRi 10.8 GA will be
available on or about the date indicated.
Document Title Release
Date
Description
XBRi 10.8
Installation Guide
9/2014 This guide takes you through the installation of XBRi 10.8 in the MICROS data center or at the
customer site from database installation through
post-installation troubleshooting, application
configuration, and mobile configuration.
Adding the XBR
Ingenium App for
iPad and Android
9/2014 This instruction booklet shows customers how to
download and configure the XBR Ingenium app on
their mobile device.