orange county sanitation district infrastructure committee update ocbc – aug 9, 2011 nick...
TRANSCRIPT
Orange County Sanitation District
Infrastructure CommitteeUpdate
Orange County Sanitation District
Infrastructure CommitteeUpdate
OCBC – Aug 9, 2011
Nick Arhontes, P.E.Director of Facilities Support ServicesOrange County Sanitation District
www.ocsd.com
Nick Arhontes, P.E.Director of Facilities Support ServicesOrange County Sanitation District
www.ocsd.com
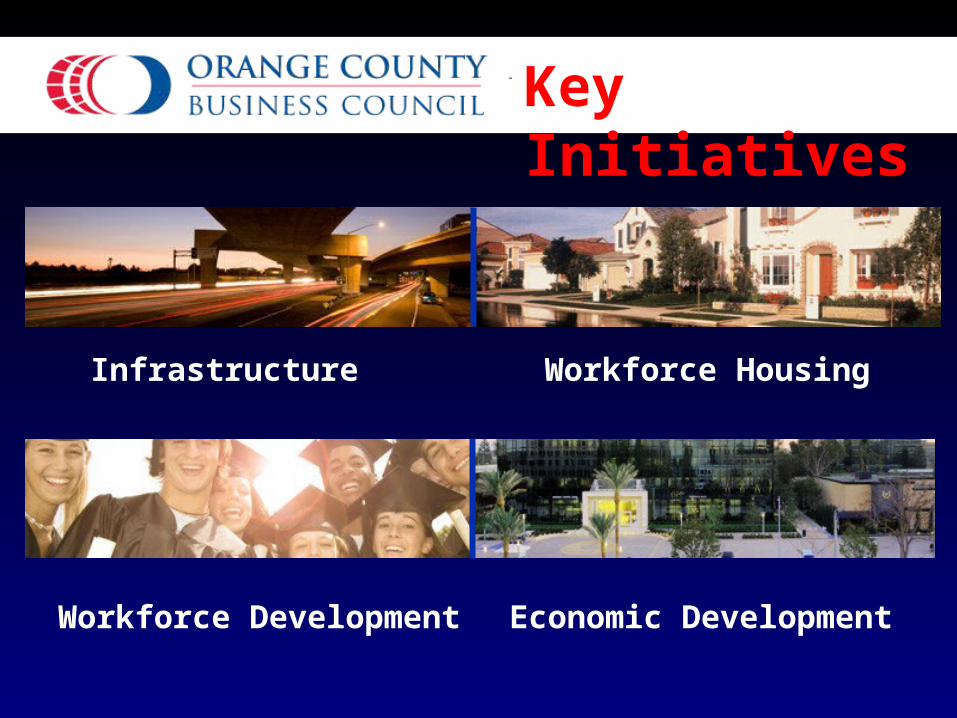
Key Initiatives
Infrastructure Workforce Housing
Workforce Development Economic Development
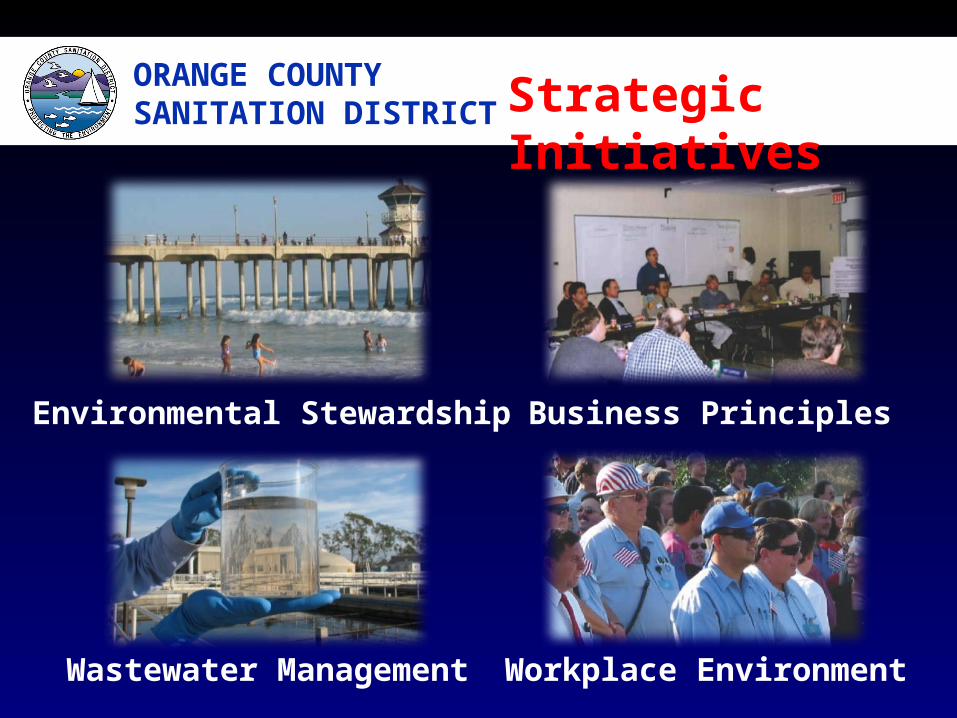
Strategic InitiativesORANGE COUNTYSANITATION DISTRICT
Environmental Stewardship Business Principles
Wastewater Management Workplace Environment

OCSD Infrastructure
OrangeCountyOrangeCounty
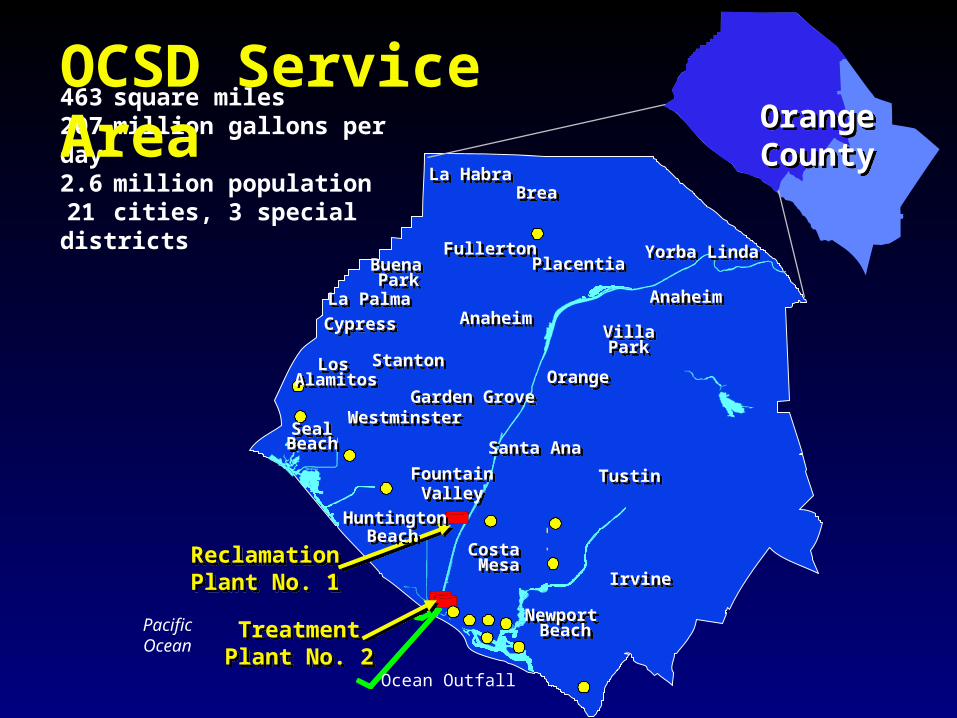
PacificOcean
Ocean Outfall
ReclamationPlant No. 1
ReclamationPlant No. 1
TreatmentPlant No. 2TreatmentPlant No. 2
NewportNewport Beach Beach
FountainFountainValleyValley
Santa AnaSanta Ana
Los Los AlamitosAlamitos
Buena Buena ParkPark
FullertonFullerton
TustinTustin
Garden GroveGarden Grove
La HabraLa HabraBreaBrea
PlacentiaPlacentia Yorba LindaYorba Linda
AnaheimAnaheimAnaheimAnaheim
OrangeOrange
La PalmaLa Palma
CypressCypress
WestminsterWestminster
IrvineIrvine
StantonStanton
VillaVillaParkPark
CostaCosta Mesa Mesa
HuntingtonHuntingtonBeachBeach
SealSealBeachBeach
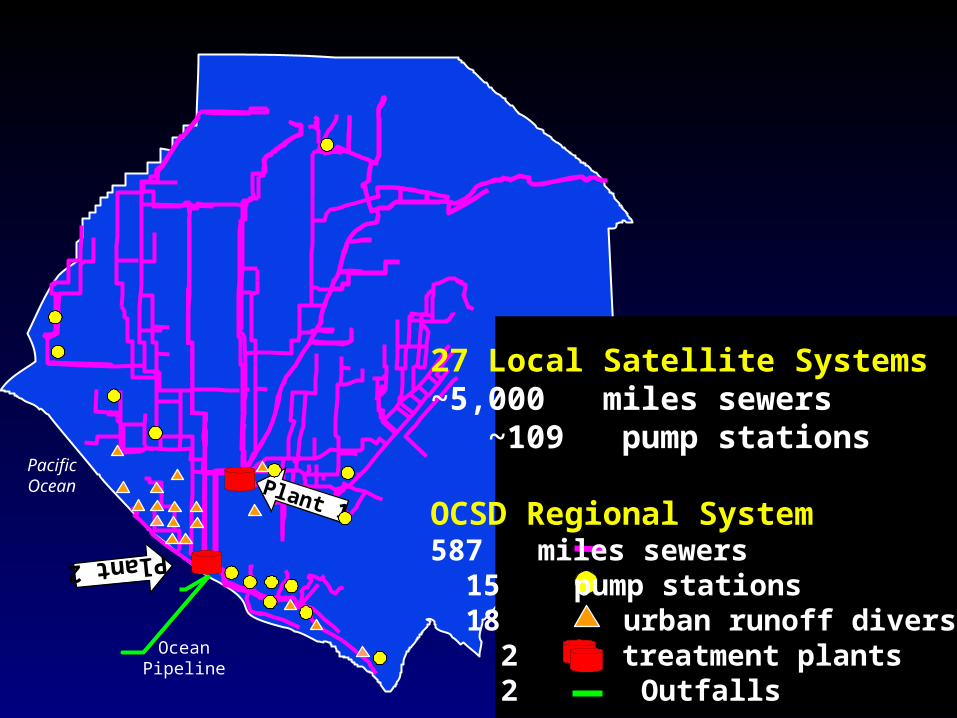
463 square miles207 million gallons per day2.6 million population21 cities, 3 special districts
OCSD Service Area
Plant 2
PacificOcean
OceanPipeline
Plant 1
27 Local Satellite Systems~5,000 miles sewers ~109 pump stations
OCSD Regional System587 miles sewers 15 pump stations 18 urban runoff diversions 2 treatment plants 2 Outfalls
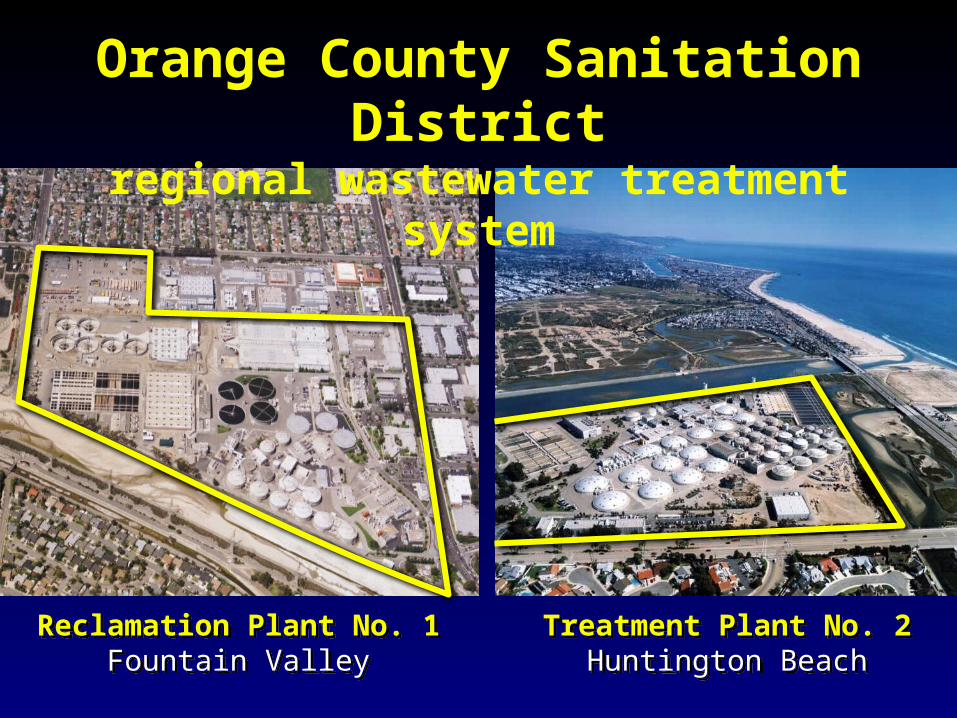
Orange County Sanitation Districtregional wastewater treatment system
Reclamation Plant No. 1Fountain Valley
Reclamation Plant No. 1Fountain Valley
Treatment Plant No. 2Huntington Beach
Treatment Plant No. 2Huntington Beach
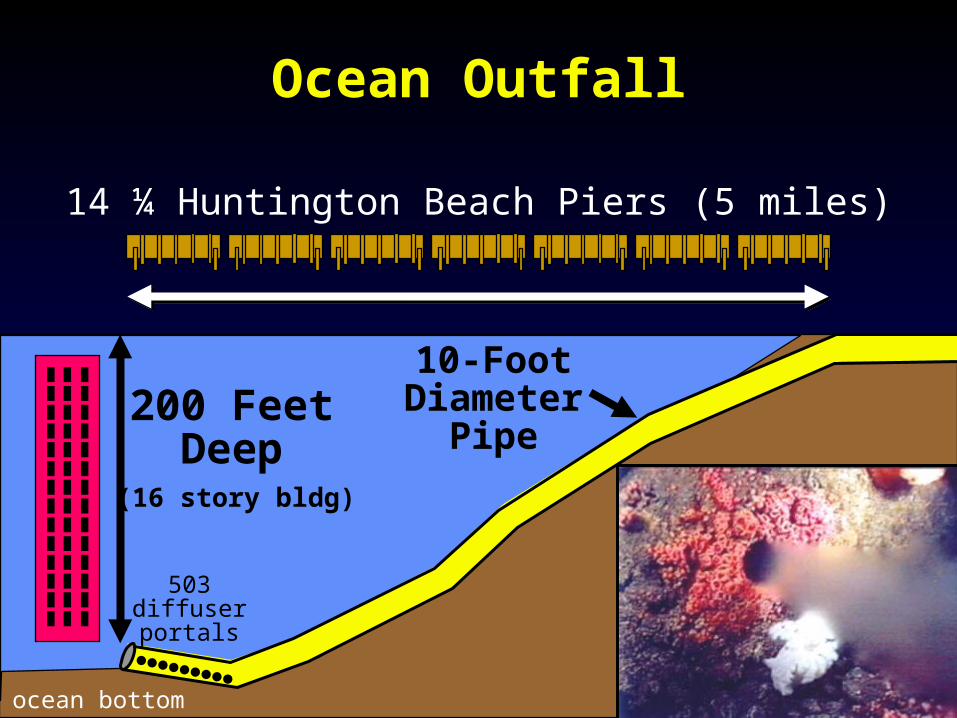
200 FeetDeep
ocean bottom
(16 story bldg)
14 ¼ Huntington Beach Piers (5 miles)
503diffuserportals
Ocean Outfall
10-FootDiameter
Pipe
OCSDStrategic Planning
Process
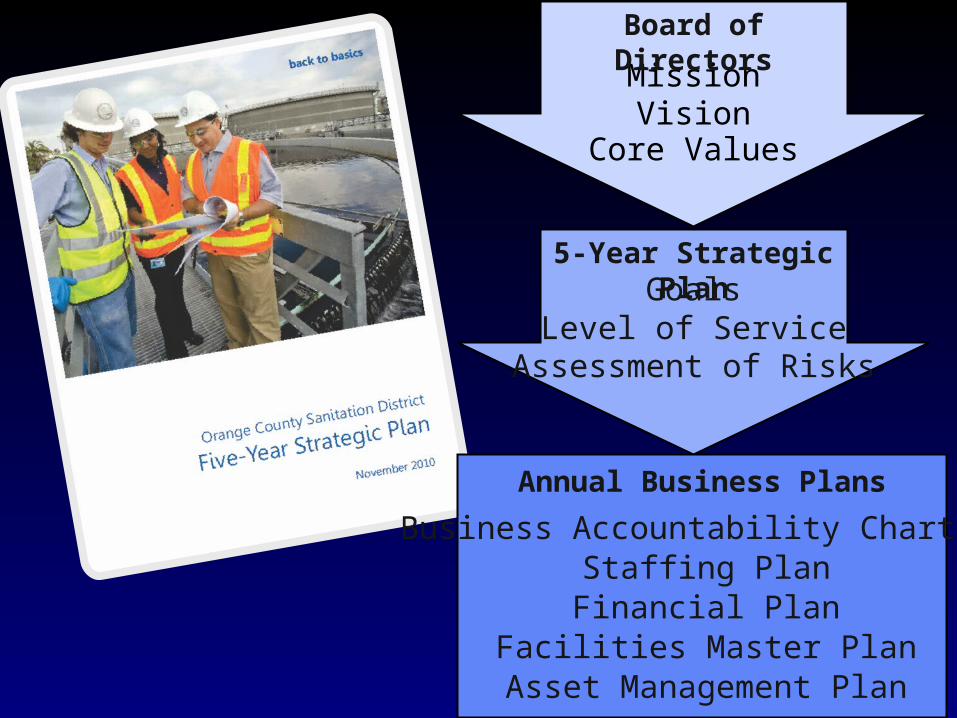
Core Values
MissionVision
Board of Directors
Level of ServiceAssessment of Risks
Goals5-Year Strategic Plan
Annual Business Plans
Business Accountability ChartersStaffing Plan
Financial PlanFacilities Master Plan
Asset Management Plan
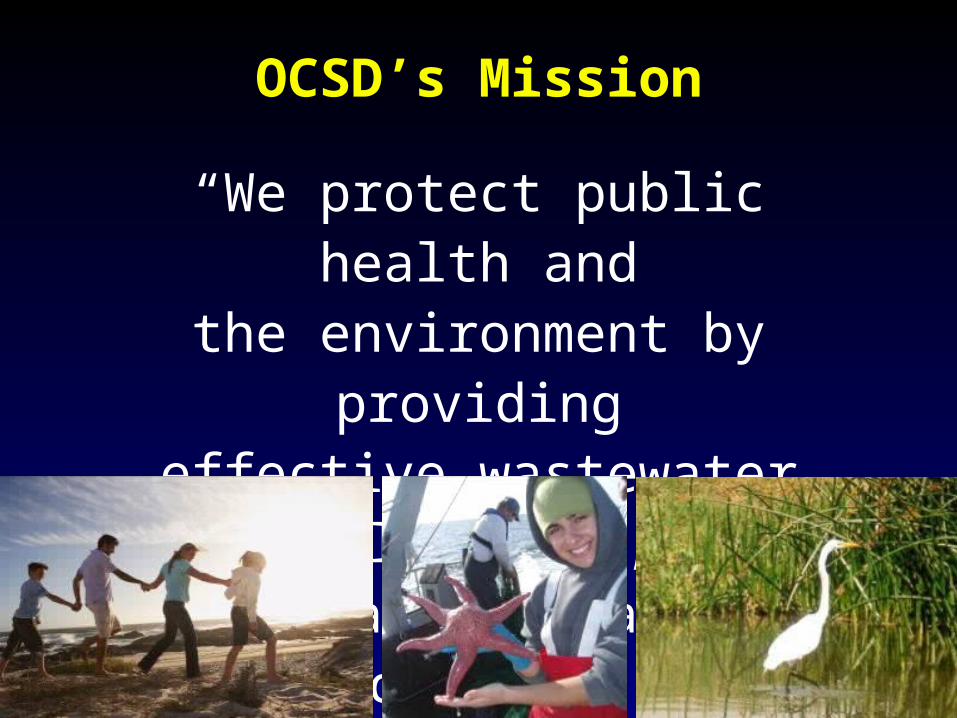
OCSD’s Mission
“We protect public health andthe environment by providing
effective wastewater collection,treatment, and recycling.”

Strategic InitiativesEnvironmental Stewardship Business Principles
Workplace EnvironmentWastewater Management
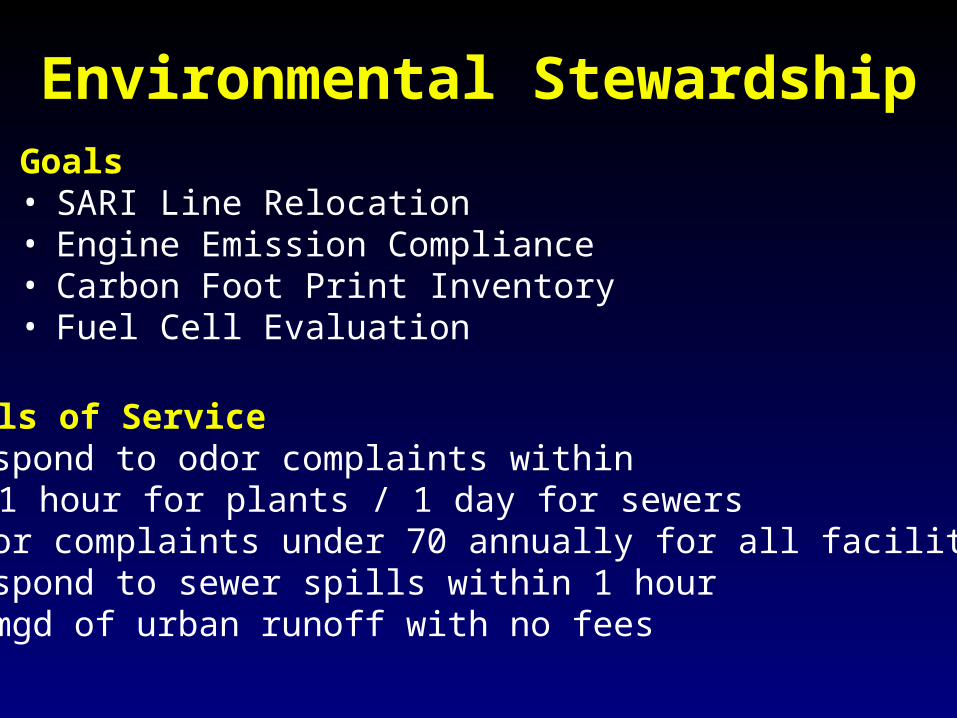
Environmental StewardshipGoals• SARI Line Relocation• Engine Emission Compliance• Carbon Foot Print Inventory• Fuel Cell Evaluation
Levels of Service• Respond to odor complaints within
• 1 hour for plants / 1 day for sewers• Odor complaints under 70 annually for all facilities • Respond to sewer spills within 1 hour• 4 mgd of urban runoff with no fees
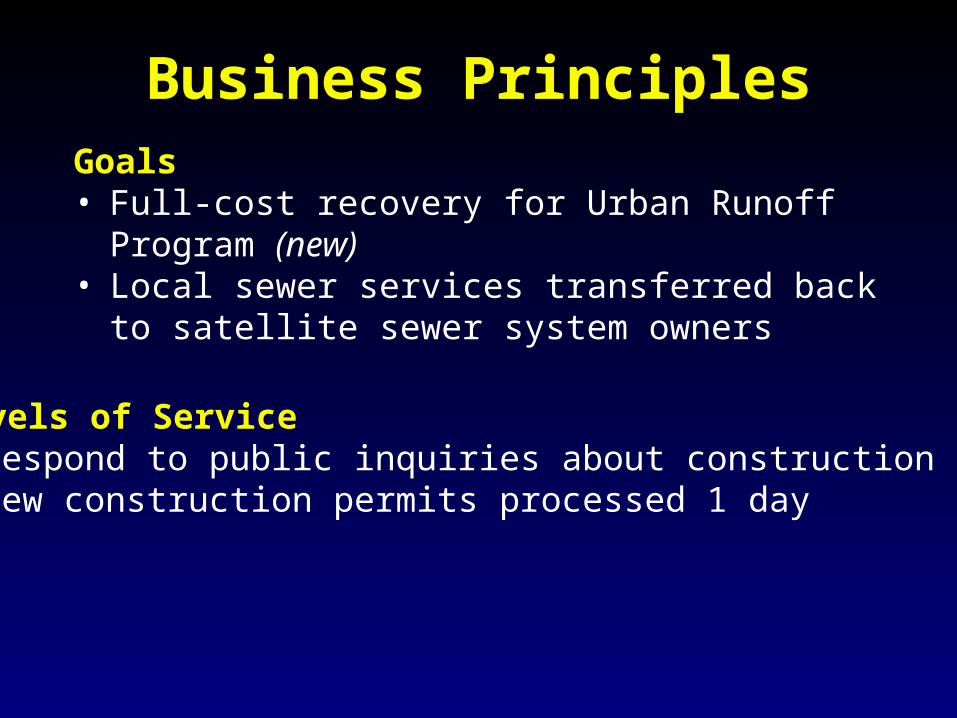
Business PrinciplesGoals• Full-cost recovery for Urban Runoff Program (new)• Local sewer services transferred back to satellite
sewer system owners
Levels of Service• Respond to public inquiries about construction 1 day• New construction permits processed 1 day
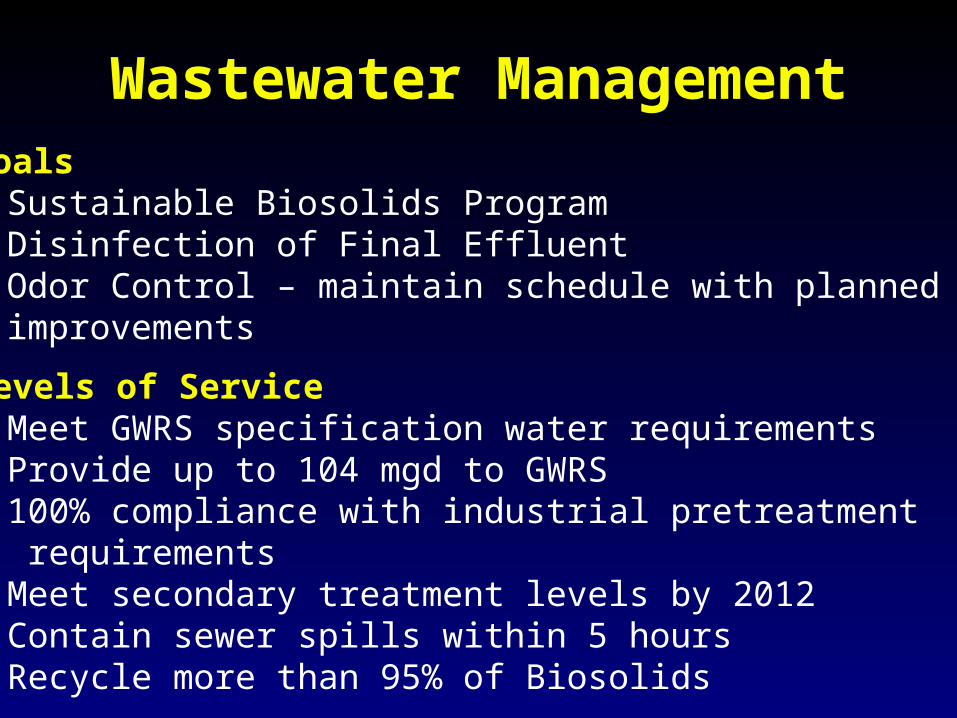
Wastewater ManagementGoals• Sustainable Biosolids Program• Disinfection of Final Effluent• Odor Control – maintain schedule with planned
improvements
Levels of Service• Meet GWRS specification water requirements• Provide up to 104 mgd to GWRS• 100% compliance with industrial pretreatment
requirements• Meet secondary treatment levels by 2012• Contain sewer spills within 5 hours• Recycle more than 95% of Biosolids
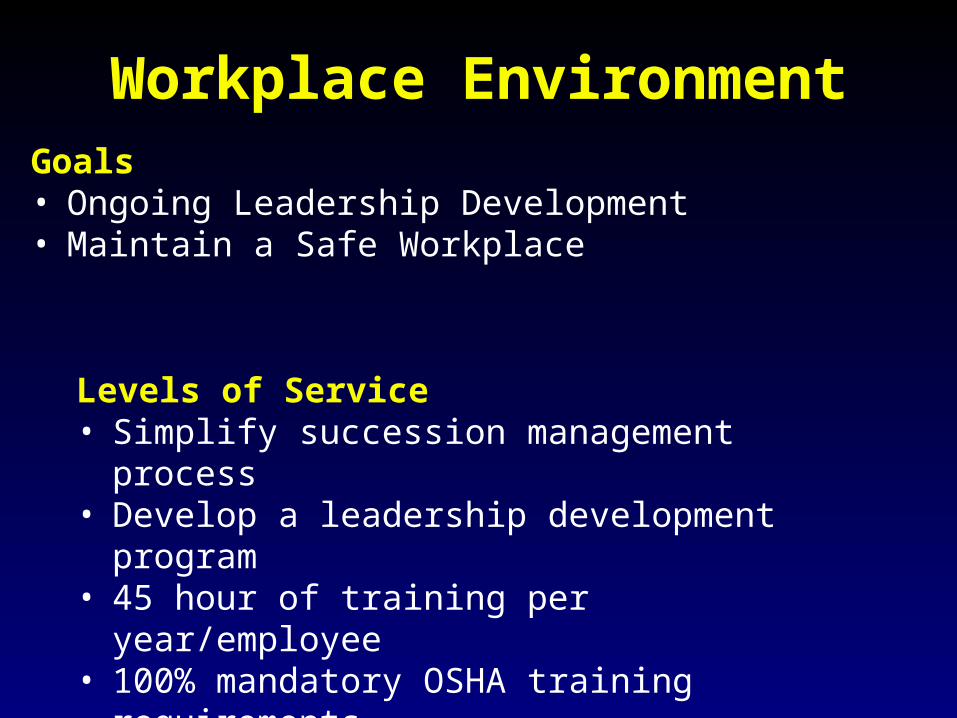
Workplace EnvironmentGoals• Ongoing Leadership Development• Maintain a Safe Workplace
Levels of Service• Simplify succession management process• Develop a leadership development program• 45 hour of training per year/employee• 100% mandatory OSHA training requirements• Maintain industry average or lower for accidents• 2.5 work days or less lost or away from work
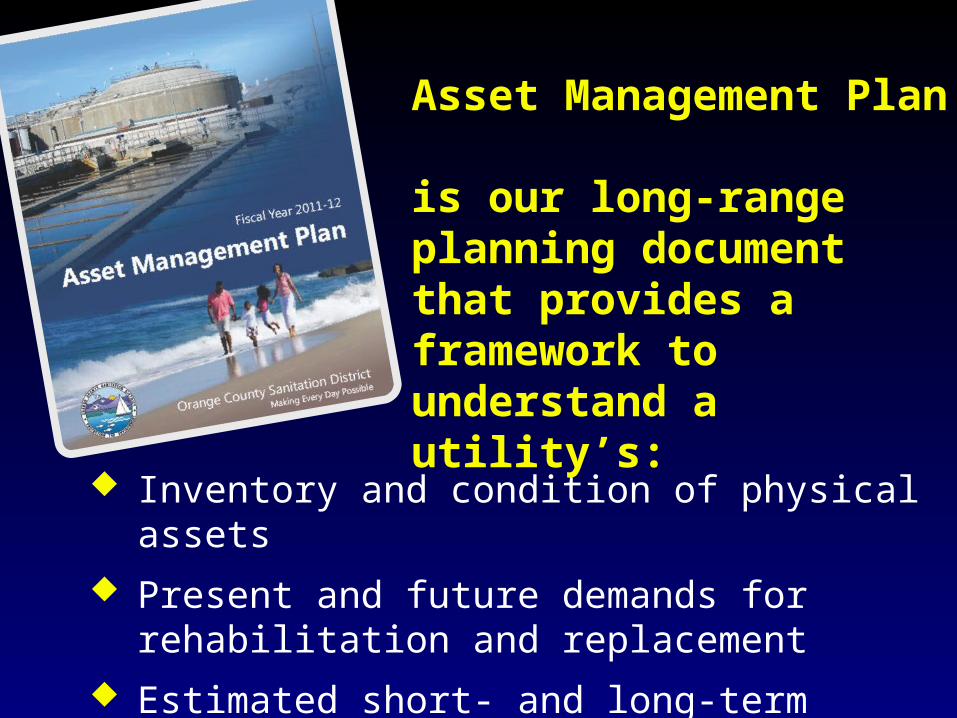
Asset Management Plan is our long-range planning document that provides a framework to understand a utility’s:
Inventory and condition of physical assets
Present and future demands for rehabilitation and replacement
Estimated short- and long-term financial needs
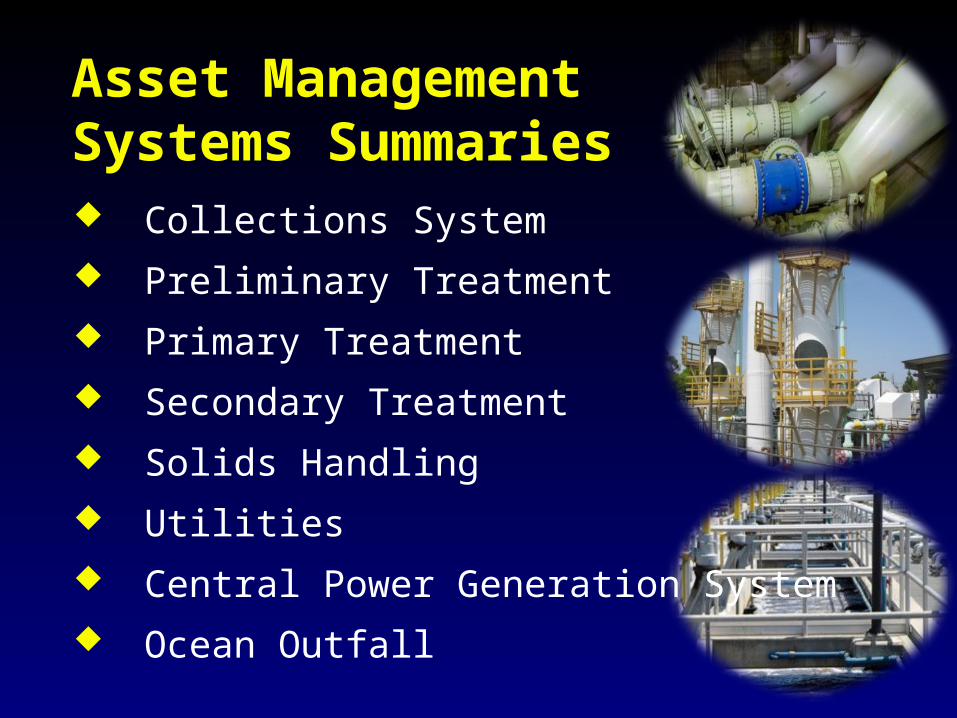
Asset Management Systems Summaries Collections System
Preliminary Treatment
Primary Treatment
Secondary Treatment
Solids Handling
Utilities
Central Power Generation System
Ocean Outfall
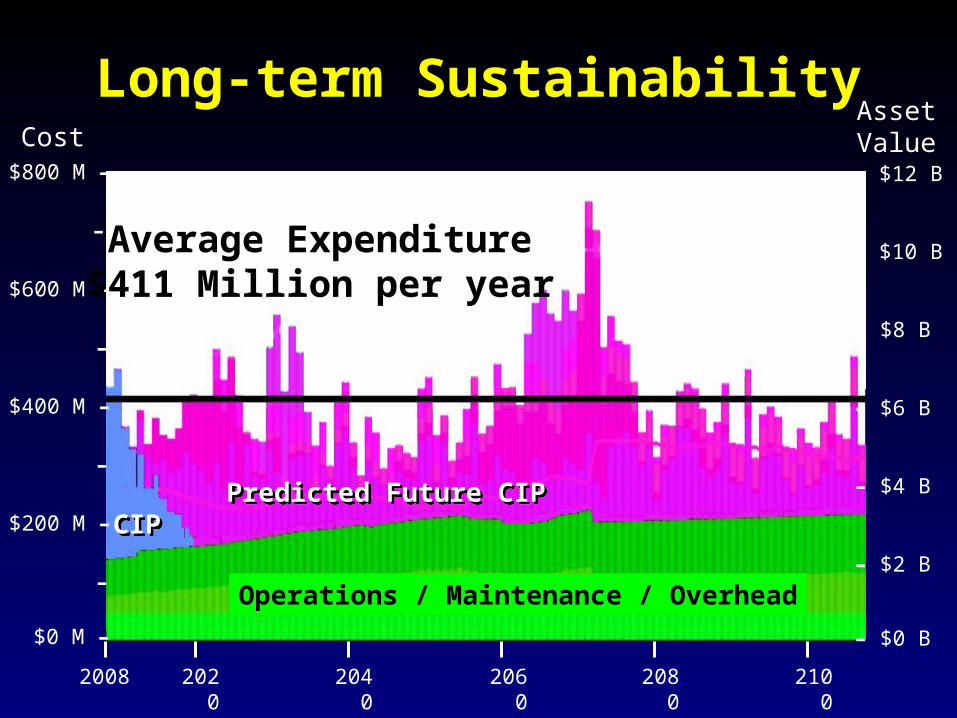
Long-term Sustainability
2008 2020 2040 2060 2080 2100
– $12 B
– $10 B
– $8 B
– $6 B
– $4 B
– $2 B
– $0 B
$800 M –
$400 M –
–
$200 M –
–
$0 M –
–
$600 M –
–
CostAssetValue
Average Expenditure$411 Million per year
Operations / Maintenance / Overhead
CIPCIPPredicted Future CIPPredicted Future CIP
OCSDAdequate Future
Revenue

Annual CIP BudgetValidation Process
OCSD Resources
Cash Flow
Program
RatesRisks &
Impacts to OCSD
New Information
(Strategic Plan) AnalysisAnalysis2 YearBudget2 YearBudget
RevisedCIP
RevisedCIP
05-06
06-07
07-08
08-09
09-10
10-11
11-12
12-13
13-14
14-15
15-16
16-17
17-18
18-19
19-20
$0 M
$100 M
$200 M
$300 M
$400 M
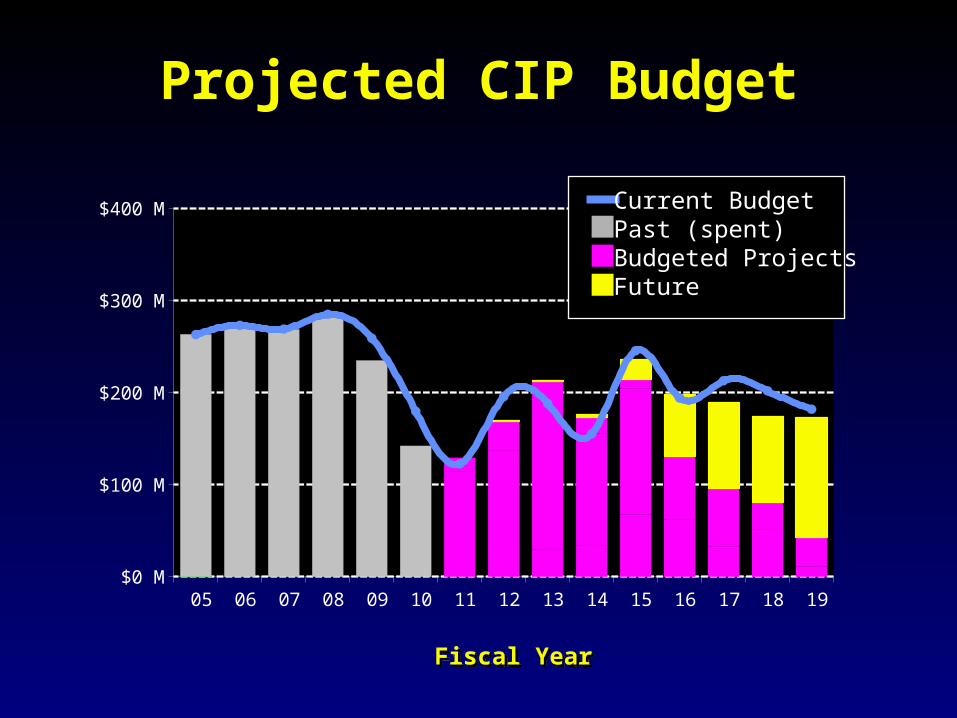
Projected CIP Budget
Fiscal YearFiscal Year
Current BudgetPast (spent)Budgeted ProjectsFuture
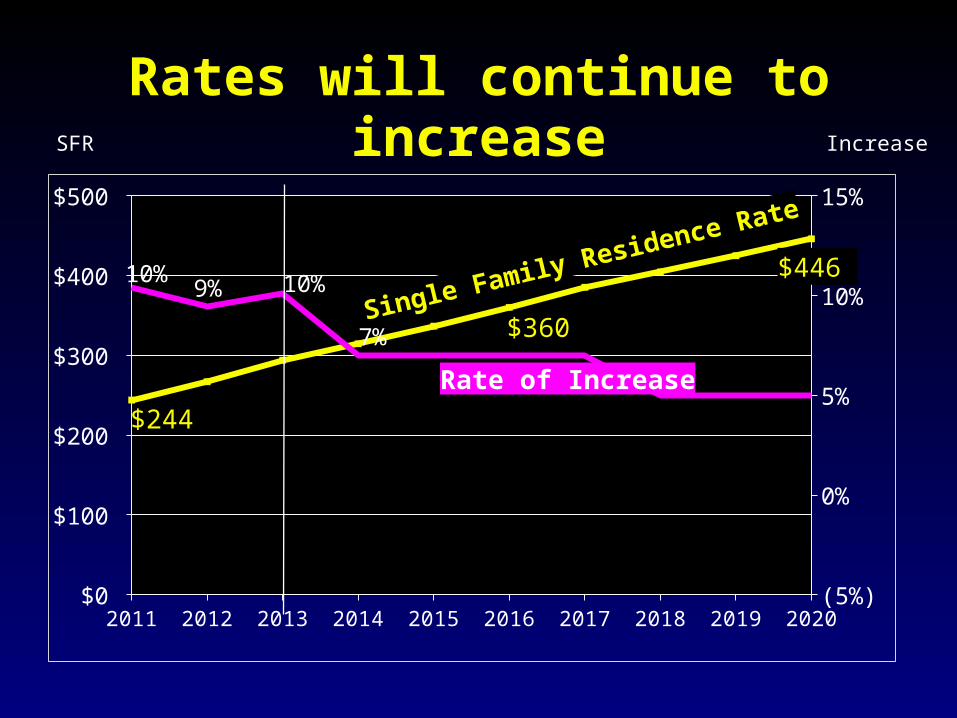
Rates will continue to increase
2011 2012 2013 2014 2015 2016 2017 2018 2019 2020$0
$100
$200
$300
$400
$500
(5%)
0%
5%
10%
15%
$244
$360
$446 10%9% 10%
7%
5%
SFR
Rate of Increase
Single Family Residence Rate
Increase
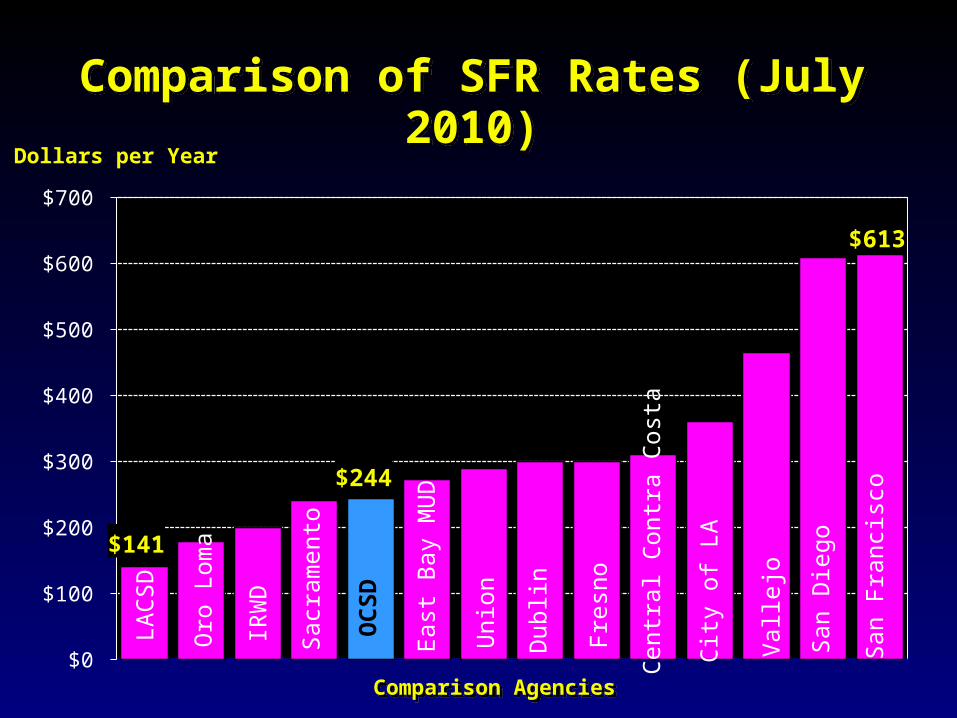
Comparison of SFR Rates (July 2010)Comparison of SFR Rates (July 2010)
$0
$100
$200
$300
$400
$500
$600
$700
Comparison AgenciesComparison Agencies
$141
$244
$613
LA
CSD
IRW
D
OC
SD
Oro
Lom
a
Fres
no
Sacr
amen
to
Eas
t Bay
MU
D
Uni
on
Cen
tral
Con
tra
Cos
ta
Dub
lin
Cit
y of
LA
Val
lejo
San
Fra
ncis
co
San
Die
go
Dollars per Year
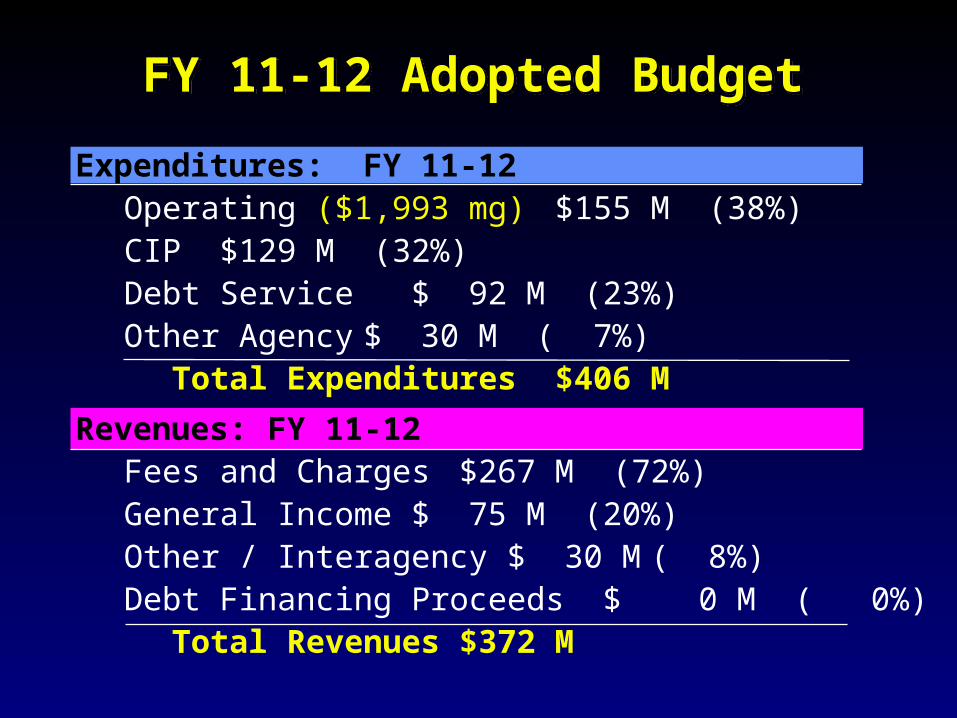
Expenditures: FY 11-12Operating ($1,993 mg) $155 M (38%) CIP $129 M (32%)Debt Service $ 92 M (23%)Other Agency $ 30 M ( 7%)
Total Expenditures$406 M
Revenues: FY 11-12Fees and Charges $267 M (72%)General Income $ 75 M (20%)Other / Interagency $ 30 M ( 8%)Debt Financing Proceeds $ 0 M ( 0%)
Total Revenues $372 M
FY 11-12 Adopted BudgetFY 11-12 Adopted Budget

Key Operating Expenses
Transportation More biosolids result in an increase in hauling costs
Chemicals Decrease in usage, but increases in unit costs
Energy Usage exceeds generation – unit costs continue to increase
Labor Although staffing is flat, labor costs will increase

Construction Projects Start Finish
1. Plant No. 1 – FV 2007 Fall 2011
2. Plant No. 2 – HB 2005 Spring 2012
3. Bitter Point PS Summer 2009 Spring 2012
4. Rocky Point PS Dec 2009 Fall 2011
5. Dover Trunk Sewer Spring 2011 Winter 2013
6. Balboa Trunk Sewer Fall 2011 Summer 2013
7. Newport Force Main Fall 2012 Spring 2013
OCSDCurrent
Challenges
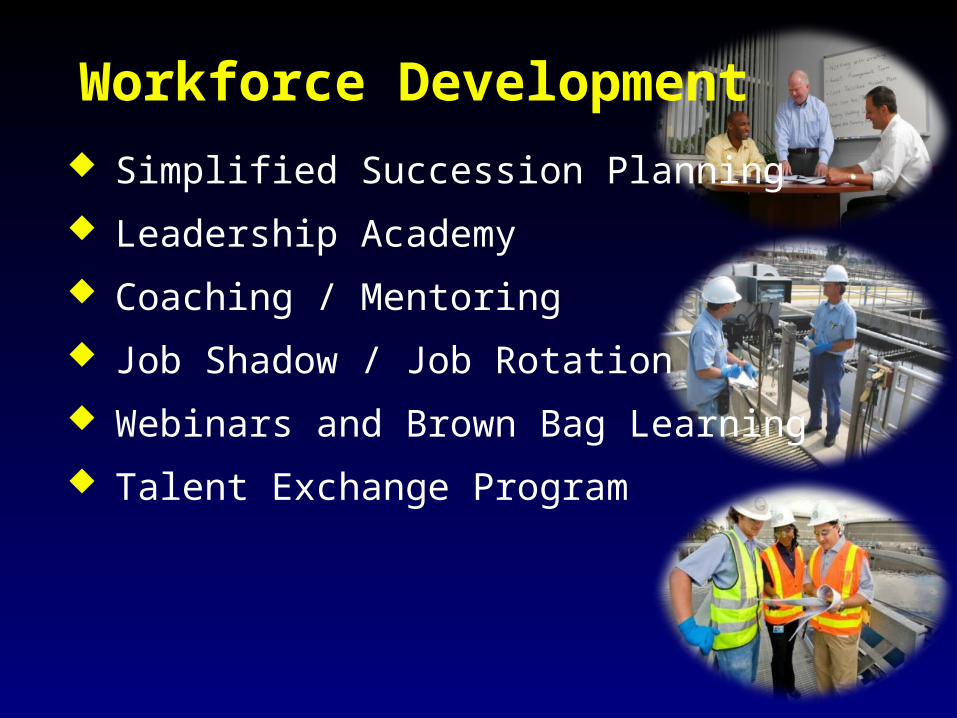
Workforce Development
Simplified Succession Planning
Leadership Academy
Coaching / Mentoring
Job Shadow / Job Rotation
Webinars and Brown Bag Learning
Talent Exchange Program
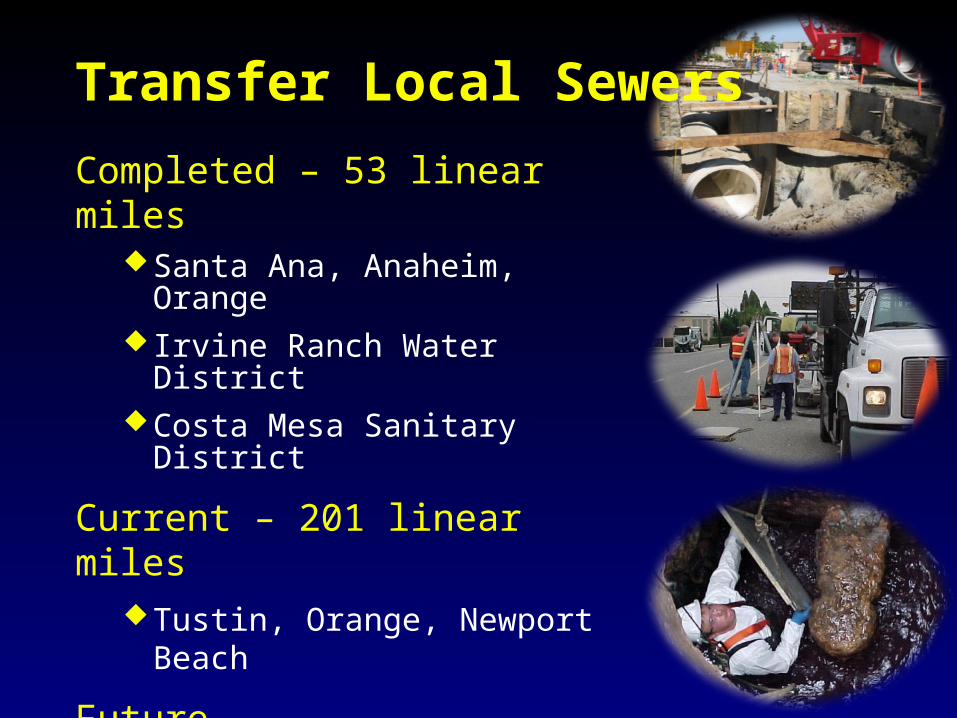
Completed – 53 linear milesSanta Ana, Anaheim, Orange Irvine Ranch Water DistrictCosta Mesa Sanitary District
Current – 201 linear milesTustin, Orange, Newport Beach
FutureHuntington Beach, Fullerton,
Santa Ana
Transfer Local Sewers

Energy Sustainability
Utilize renewable fuels
Fuel cell demonstration projectwith hydrogen fueling station
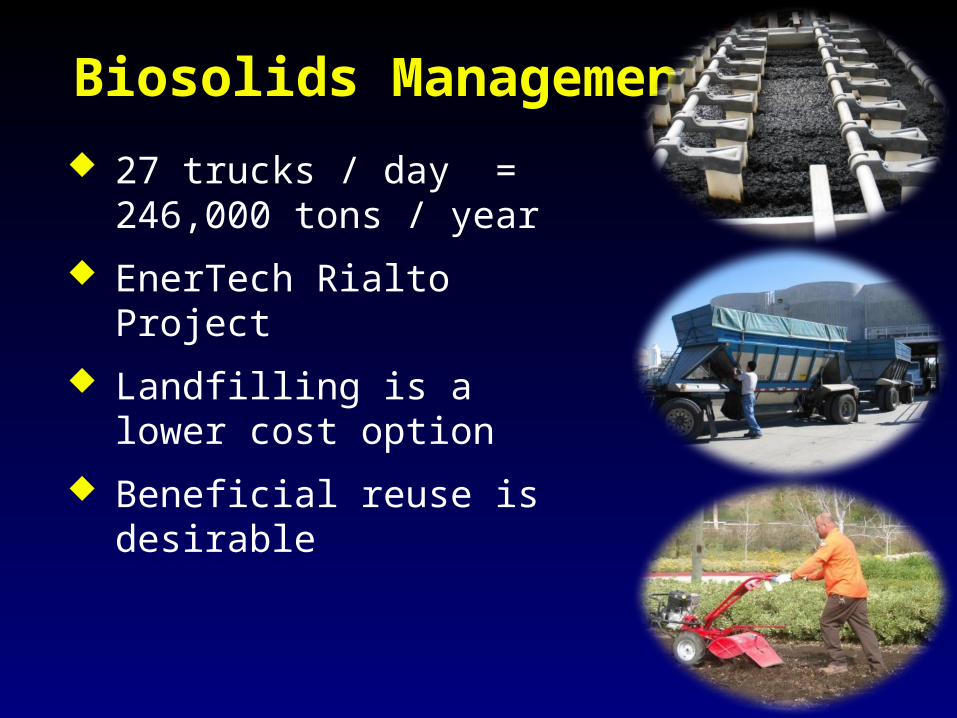
Biosolids Management
27 trucks / day = 246,000 tons / year
EnerTech Rialto Project
Landfilling is a lower cost option
Beneficial reuse is desirable
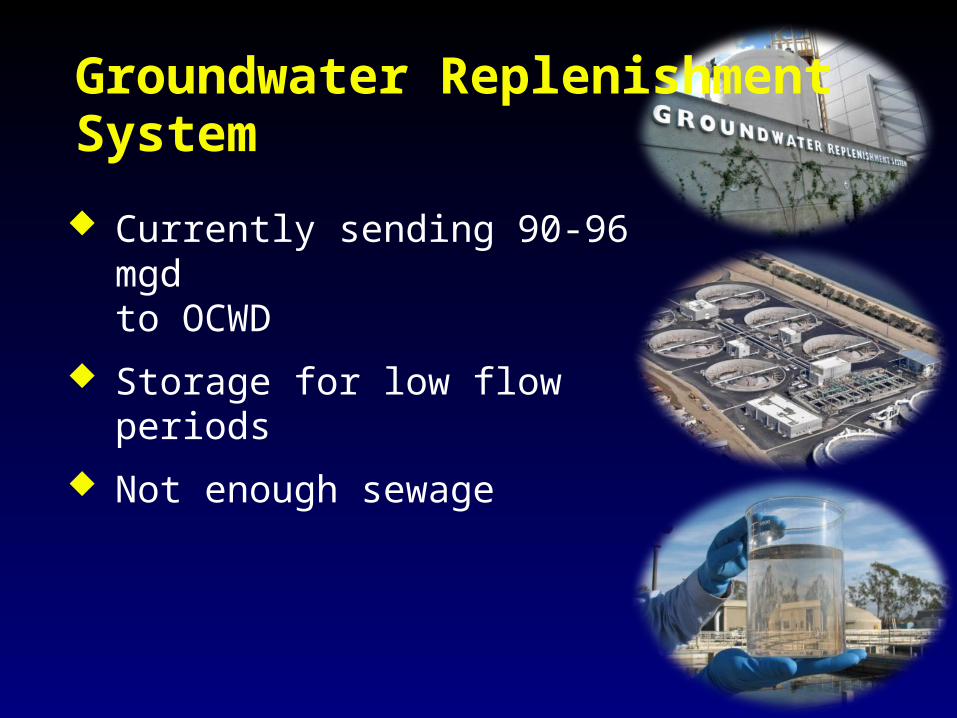
Currently sending 90-96 mgdto OCWD
Storage for low flow periods
Not enough sewage
Groundwater Replenishment System
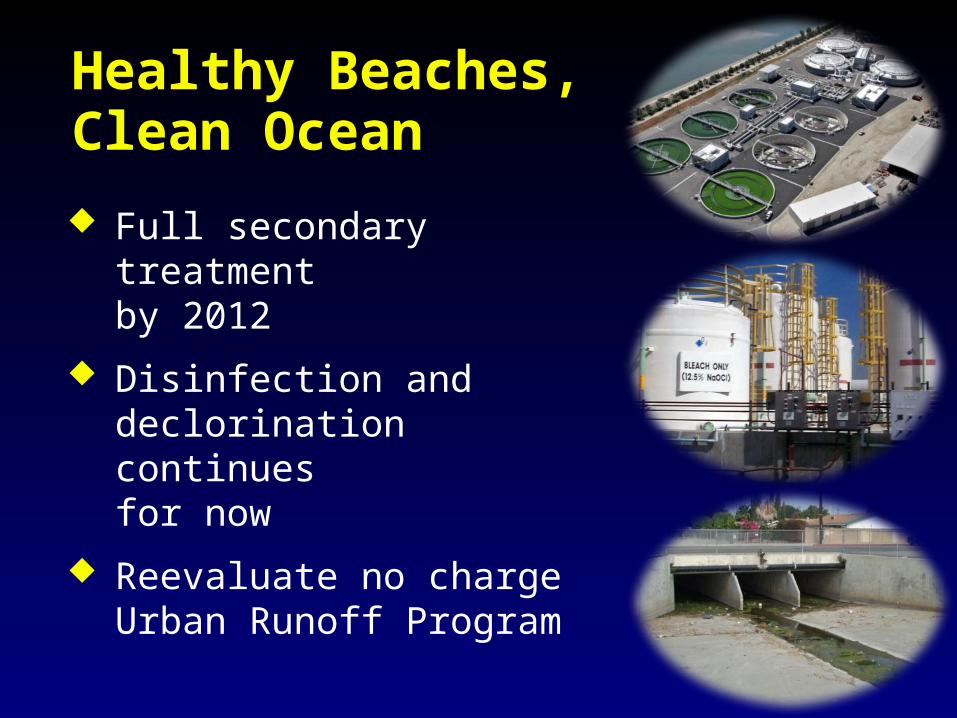
Healthy Beaches,Clean Ocean
Full secondary treatmentby 2012
Disinfection and declorination continuesfor now
Reevaluate no chargeUrban Runoff Program
OCSDStaying Connected

Benefits of Social Media
Be more transparent
Better engage the public
Identify stakeholder networks
Quicker response time

@ OCSanitationDistrict
@OCSD_PIO
on Channel 2OCSD
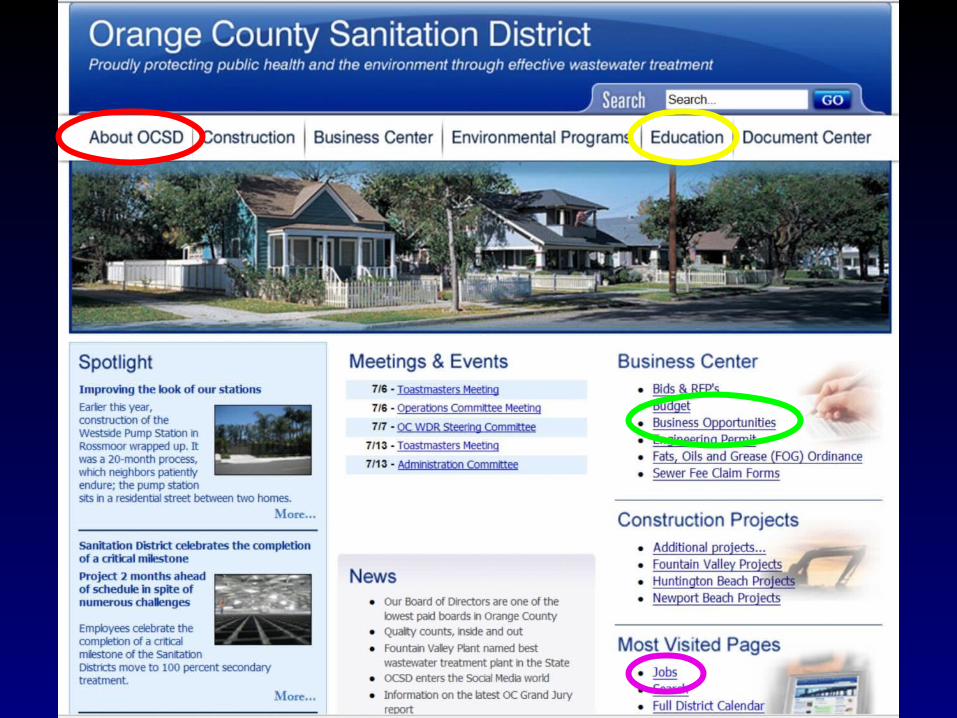
www.OCSD.com
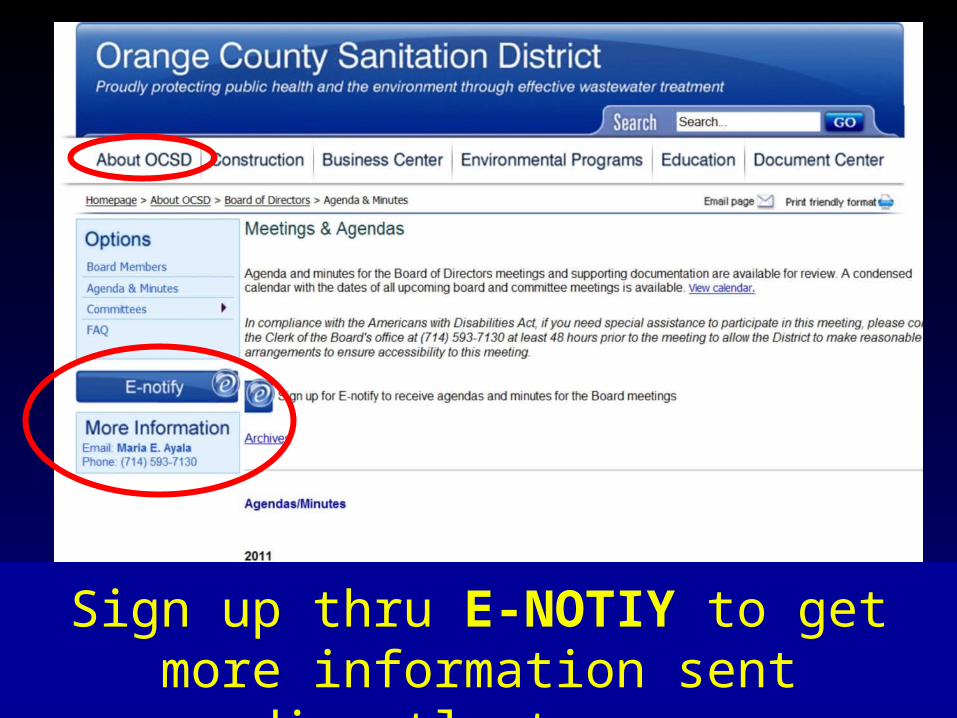
Sign up thru E-NOTIY to get more information sent directly to you
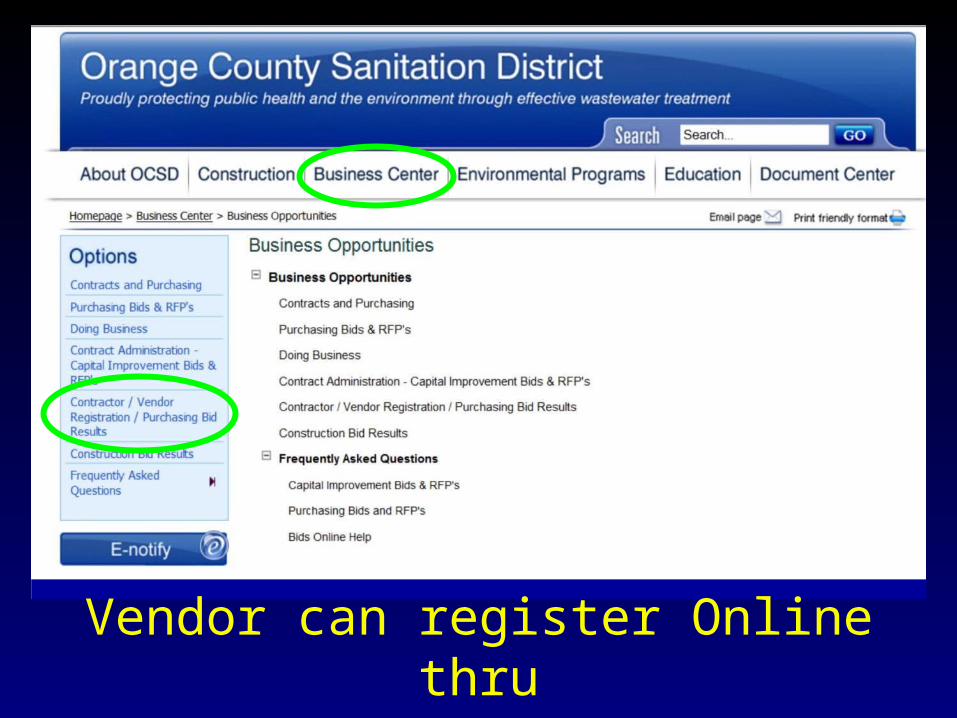
Vendor can register Online thruPLANETBID
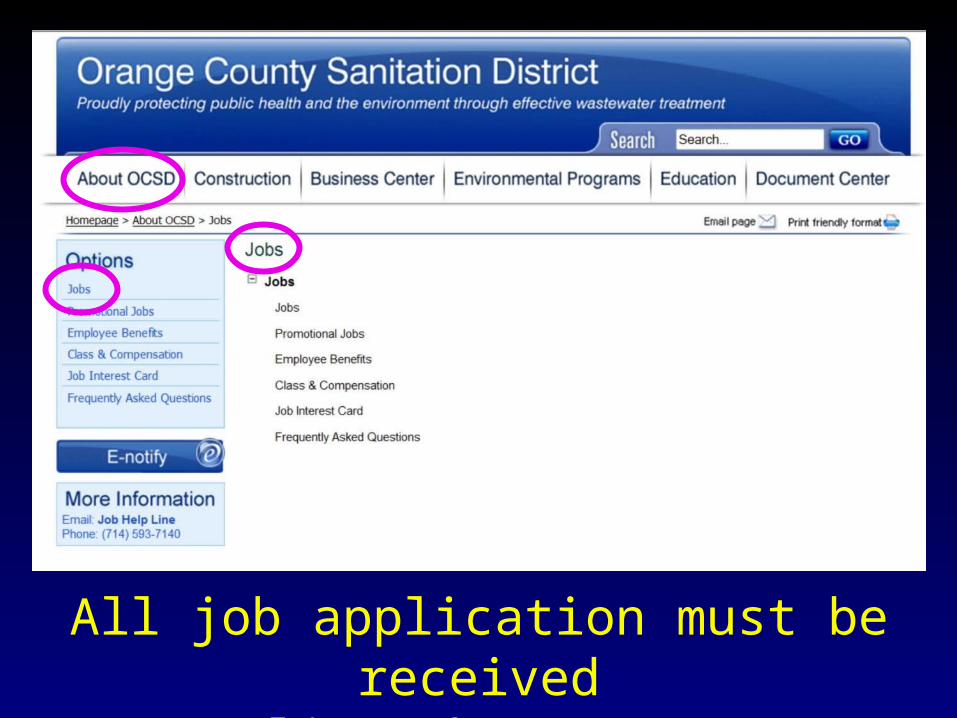
All job application must be receivedOnline thru NEOGOV
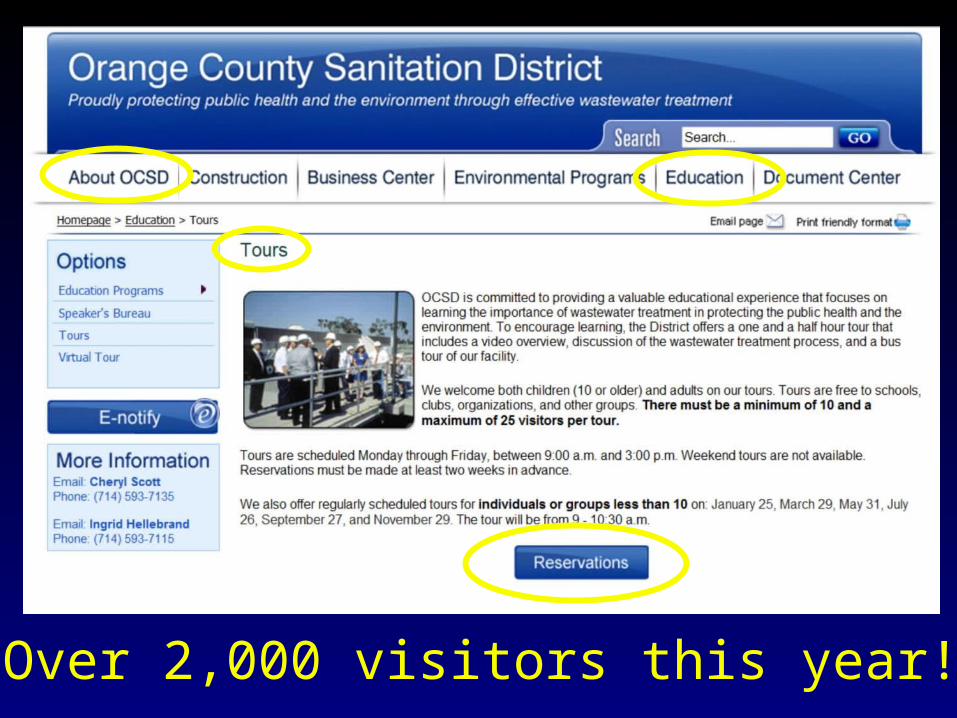
Over 2,000 visitors this year!


1,066,000people over 18 years of age
are on
in our service area!
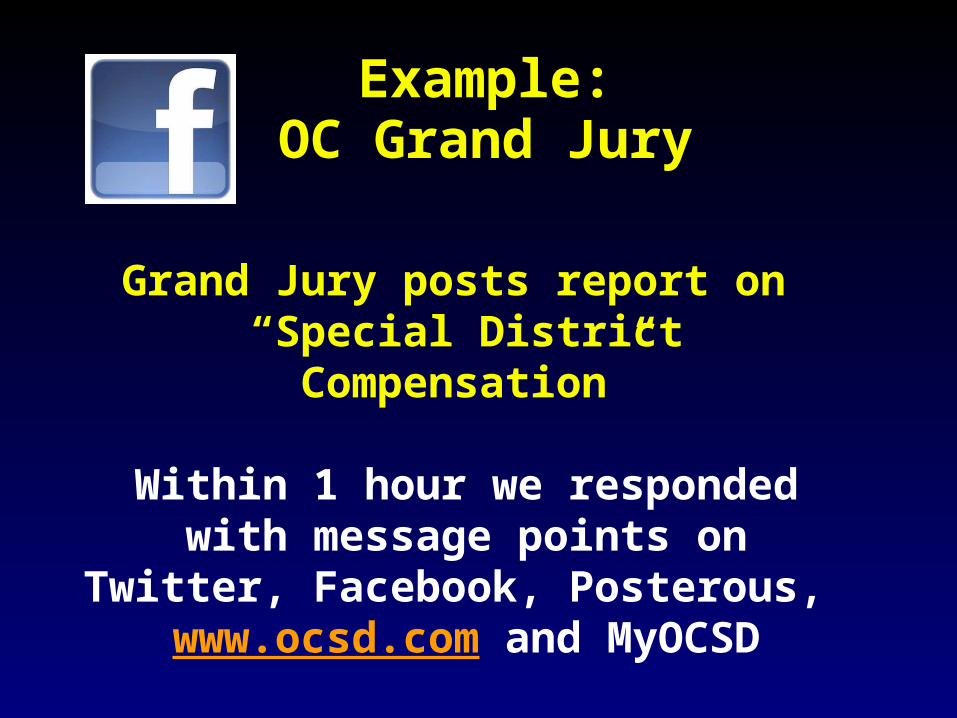
Example:OC Grand Jury
Grand Jury posts report on “Special District Compensation”
Within 1 hour we responded with message points on Twitter, Facebook,
Posterous, www.ocsd.com and MyOCSD

Immediate Response
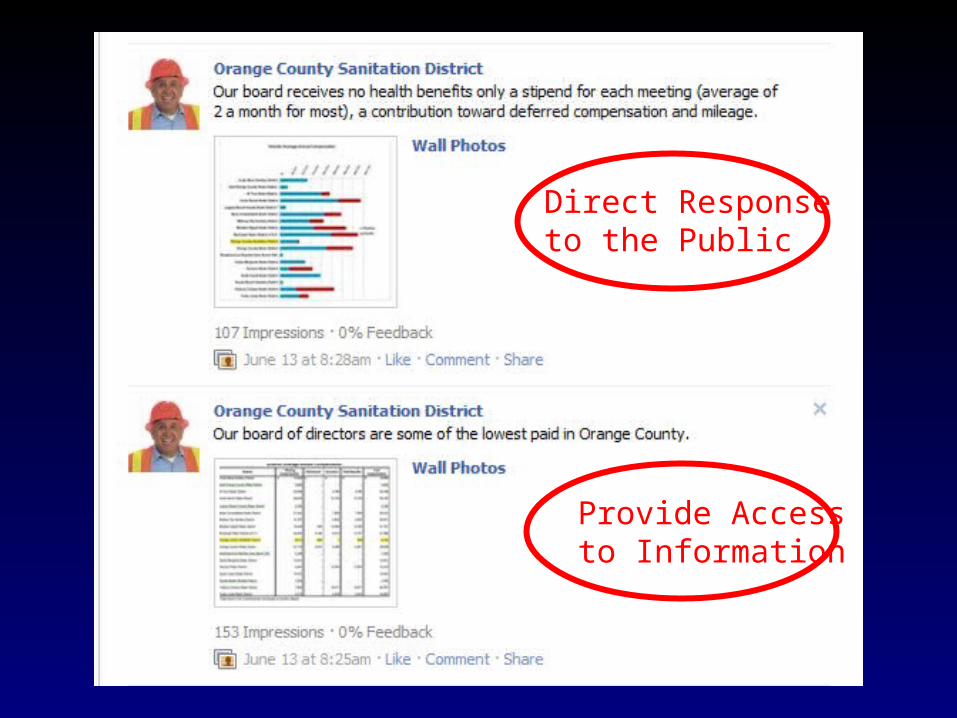
Direct Responseto the Public
Provide Access to Information

It puts a human face on government
It’s fast!
It’s where the conversation is happening!
Social Media

Key Initiatives
Infrastructure Workforce Housing
Workforce Development Economic Development
Nick Arhontes, P.E.Director, FSSD(714) 593-7210
Nick Arhontes, P.E.Director, FSSD(714) 593-7210
Thank You! Questions?