orbitoutlook: autonomous verification and validation of ... · figure 1. artist's depiction of...
TRANSCRIPT

OrbitOutlook: Autonomous Verification and Validation of Non-Traditional Data for Improved Space Situational Awareness
Lt. Col. Jeremy Raley
Defense Advanced Research Projects Agency (DARPA) Ryan M. Weisman
Air Force Research Laboratory (AFRL) C. Channing Chow II
Integrity Applications Incorporated – Pacific Defense Solutions Michael Czajkowski
Lockheed Martin Corporation, Advanced Technology Laboratory Kristin Sotzen
Johns Hopkins University, Applied Physics Laboratory
CONFERENCE PAPER
As the space object population has rapidly grown, the data volume required to produce reliable orbital estimates has far surpassed the pace of the traditional government sensor acquisition process. Fortunately, over the last few years, the commercial, academic, and amateur communities have stepped up to build cost-effective sensor networks leveraging commercial off-the-shelf (COTS) and existing hardware. Certifying and calibrating this multitude of diverse sensors using the traditional manual process is not feasible. Over the last three years, the Defense Advanced Research Projects Agency (DARPA) has been investing in concepts to develop a highly autonomous process to parametrically assess the quality of data originating from non-traditional sensors and to fuse this information with that obtained from certified sensors. Successful simulations and the development of automatic calibration algorithms have set the stage for an active demonstration effort using a global network of sensors including commercial, academic, amateur, and government sources. This paper will discuss progress to date and demonstrations scheduled for completion through spring 2017.
1. INTRODUCTION Space is littered with debris…and the problem is only getting worse. As the number of artificial objects in Earth orbit increases, the probability of collisions between these objects also increases – in the case of space debris, this effect is known as the Kessler Syndrome [1]. Currently, more than 500,000 pieces of manmade debris – including spent rocket stages, defunct satellites, and other fragments (e.g., flecks of paint, nuts/bolts, particulates from solid rocket motors) – currently hurtle around the Earth at roughly 17,000 miles per hour [2]. The National Aeronautics and Space Administration (NASA) estimates approximately 18,000 objects greater than 10 cm with 77-percent of them categorized as either debris or rocket bodies1 while the European Space Agency estimates there are around 23,000 objects (5 cm to 10 cm in low Earth orbit and 30 cm to 1 m at geosynchronous orbit) with 94-percent of the population being debris, decommissioned satellites, or rocket bodies2. The varying population size estimates coupled with continued investment in space-supported infrastructures (e.g., communication satellites, navigation constellations) creates a situation where it is imperative to better understand the space population and how it is evolving.
1 http://orbitaldebris.jsc.nasa.gov/FAQ.html 2 http://www.esa.int/Our_Activities/Operations/Space_Debris/About_space_debris
Copyright © 2016 Advanced Maui Optical and Space Surveillance Technologies Conference (AMOS) – www.amostech.com
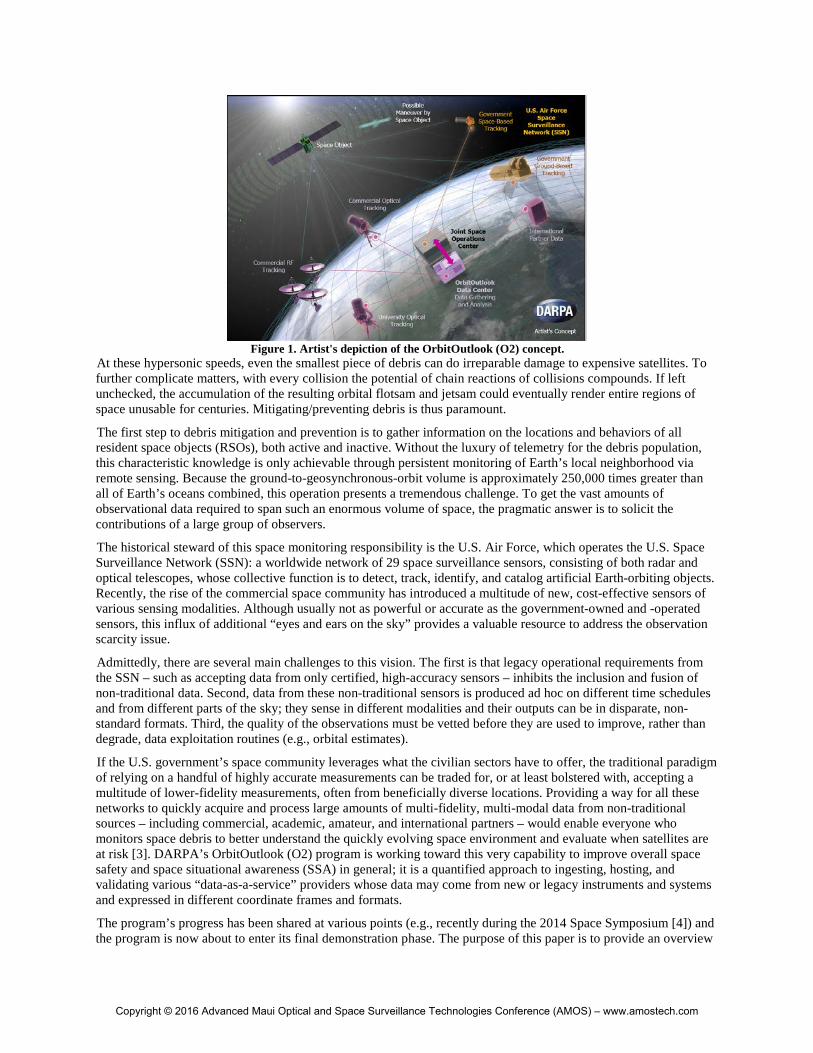
Figure 1. Artist's depiction of the OrbitOutlook (O2) concept.
At these hypersonic speeds, even the smallest piece of debris can do irreparable damage to expensive satellites. To further complicate matters, with every collision the potential of chain reactions of collisions compounds. If left unchecked, the accumulation of the resulting orbital flotsam and jetsam could eventually render entire regions of space unusable for centuries. Mitigating/preventing debris is thus paramount.
The first step to debris mitigation and prevention is to gather information on the locations and behaviors of all resident space objects (RSOs), both active and inactive. Without the luxury of telemetry for the debris population, this characteristic knowledge is only achievable through persistent monitoring of Earth’s local neighborhood via remote sensing. Because the ground-to-geosynchronous-orbit volume is approximately 250,000 times greater than all of Earth’s oceans combined, this operation presents a tremendous challenge. To get the vast amounts of observational data required to span such an enormous volume of space, the pragmatic answer is to solicit the contributions of a large group of observers.
The historical steward of this space monitoring responsibility is the U.S. Air Force, which operates the U.S. Space Surveillance Network (SSN): a worldwide network of 29 space surveillance sensors, consisting of both radar and optical telescopes, whose collective function is to detect, track, identify, and catalog artificial Earth-orbiting objects. Recently, the rise of the commercial space community has introduced a multitude of new, cost-effective sensors of various sensing modalities. Although usually not as powerful or accurate as the government-owned and -operated sensors, this influx of additional “eyes and ears on the sky” provides a valuable resource to address the observation scarcity issue.
Admittedly, there are several main challenges to this vision. The first is that legacy operational requirements from the SSN – such as accepting data from only certified, high-accuracy sensors – inhibits the inclusion and fusion of non-traditional data. Second, data from these non-traditional sensors is produced ad hoc on different time schedules and from different parts of the sky; they sense in different modalities and their outputs can be in disparate, non-standard formats. Third, the quality of the observations must be vetted before they are used to improve, rather than degrade, data exploitation routines (e.g., orbital estimates).
If the U.S. government’s space community leverages what the civilian sectors have to offer, the traditional paradigm of relying on a handful of highly accurate measurements can be traded for, or at least bolstered with, accepting a multitude of lower-fidelity measurements, often from beneficially diverse locations. Providing a way for all these networks to quickly acquire and process large amounts of multi-fidelity, multi-modal data from non-traditional sources – including commercial, academic, amateur, and international partners – would enable everyone who monitors space debris to better understand the quickly evolving space environment and evaluate when satellites are at risk [3]. DARPA’s OrbitOutlook (O2) program is working toward this very capability to improve overall space safety and space situational awareness (SSA) in general; it is a quantified approach to ingesting, hosting, and validating various “data-as-a-service” providers whose data may come from new or legacy instruments and systems and expressed in different coordinate frames and formats.
The program’s progress has been shared at various points (e.g., recently during the 2014 Space Symposium [4]) and the program is now about to enter its final demonstration phase. The purpose of this paper is to provide an overview
Copyright © 2016 Advanced Maui Optical and Space Surveillance Technologies Conference (AMOS) – www.amostech.com
of OrbitOutlook, describe our infrastructure for integrating space data from disparate sources, and detail our data quality assessment algorithms, including plans for verifying and validating the results from the demonstration and experimentation phases of O2 beginning in fall 2016 and ending in spring 2017. We conclude with a summary of the current status of the program and statements on future work.
2. SYSTEM OVERVIEW
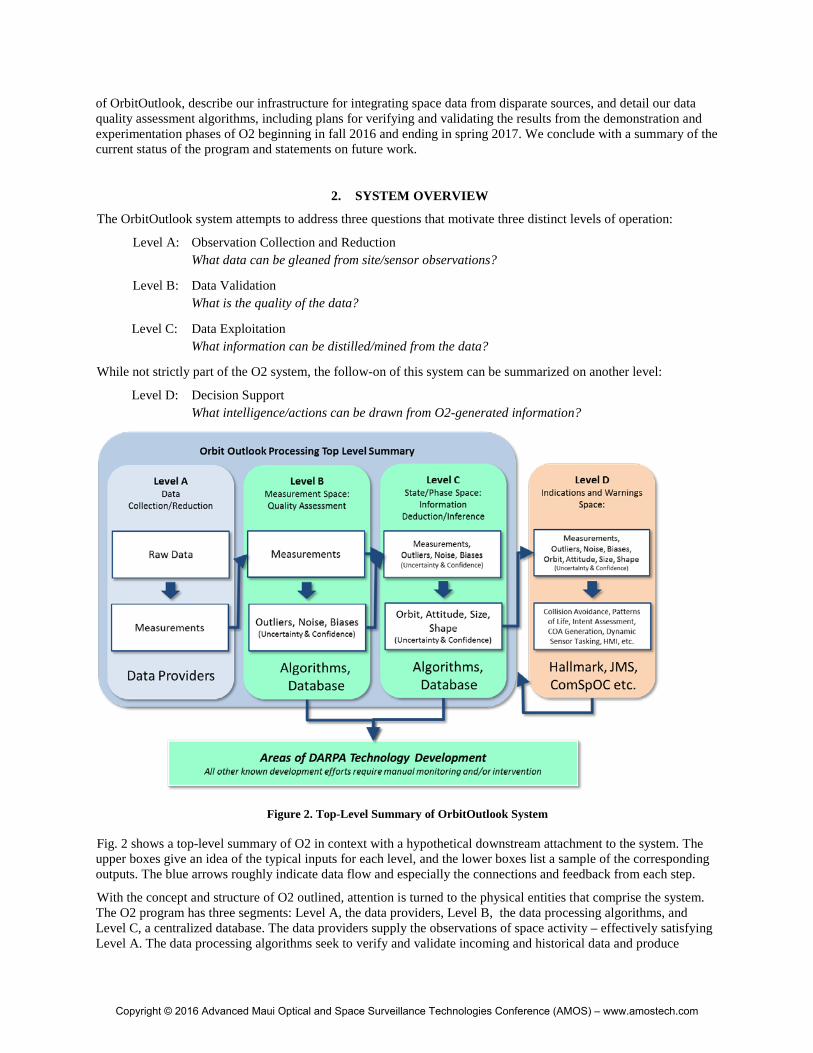
The OrbitOutlook system attempts to address three questions that motivate three distinct levels of operation:
Level A: Observation Collection and Reduction What data can be gleaned from site/sensor observations?
Level B: Data Validation What is the quality of the data?
Level C: Data Exploitation What information can be distilled/mined from the data?
While not strictly part of the O2 system, the follow-on of this system can be summarized on another level:
Level D: Decision Support What intelligence/actions can be drawn from O2-generated information?
Figure 2. Top-Level Summary of OrbitOutlook System Fig. 2 shows a top-level summary of O2 in context with a hypothetical downstream attachment to the system. The upper boxes give an idea of the typical inputs for each level, and the lower boxes list a sample of the corresponding outputs. The blue arrows roughly indicate data flow and especially the connections and feedback from each step.
With the concept and structure of O2 outlined, attention is turned to the physical entities that comprise the system. The O2 program has three segments: Level A, the data providers, Level B, the data processing algorithms, and Level C, a centralized database. The data providers supply the observations of space activity – effectively satisfying Level A. The data processing algorithms seek to verify and validate incoming and historical data and produce
Copyright © 2016 Advanced Maui Optical and Space Surveillance Technologies Conference (AMOS) – www.amostech.com

analysis products derived from such data (e.g., measurement outliers, noise, biases, and RSO orbits and attitudes) – this segment accomplishes both Level B and Level C. For the final piece, the database stores and organizes all parameters produced and serves as the communications hub for O2. Further details on each of the three segments are addressed separately in the following sections.
3. INCREASE THE NUMBER OF THE OBSERVERS
Gathering observations of space objects is no small feat. When trying to monitor space objects, sensors have to deal with many factors, such as weather, obstructions, and line-of-sight geometries, and hardware limitations (e.g., signal-to-noise ratio, power, tracking capability) to name a few. And then there is the matter of the number of sensors versus the number of space objects to monitor.
Since the dawn of the Space Age, the United States has maintained a catalog of more than 39,000 artificial space objects orbiting Earth [2]. This number records the objects that are larger than about 10 cm in diameter. There are an estimated several hundred thousand smaller pieces that are not catalogued. Fig. 3 illustrates the low-Earth orbital regime – where most of the debris population resides – with the current trackable space object population plotted for a given time (albeit, with the scale of the space objects’s size exaggerated for clarity). Though only showing a portion of Earth’s local neighborhood, this depiction gives an idea of the staggering number of objects required to be monitored.
Figure 3. Space objects in Earth's local neighborhood (courtesy of ESA).
Currently, the U.S. Air Force Space Command (AFSPC) controls a mixture of 29 dedicated and collateral sensors for the purposes of collecting data for the SSN, with only a small handful of non-government auxiliary sensors contributing sporadic observations (see Fig. 4 for SSN locations from U.S. Strategic Command). Over the last few years, the growing commercial space community has developed its own cost-effective networks incorporating hundreds of different sensors. These networks and the SSN cannot easily or quickly share data with each other, however, because such sharing requires manual fusion of data in different formats. Additionally, the SSN can accept data collected only from certified, high-accuracy sensors.
Providing a way for all these networks to quickly acquire and process large amounts of high-quality data from diverse sources—including civil, commercial, academic, and international partners—would enable everyone monitoring space debris to better understand the quickly evolving space environment and evaluate when satellites are at risk.
© European Space Agency
Copyright © 2016 Advanced Maui Optical and Space Surveillance Technologies Conference (AMOS) – www.amostech.com
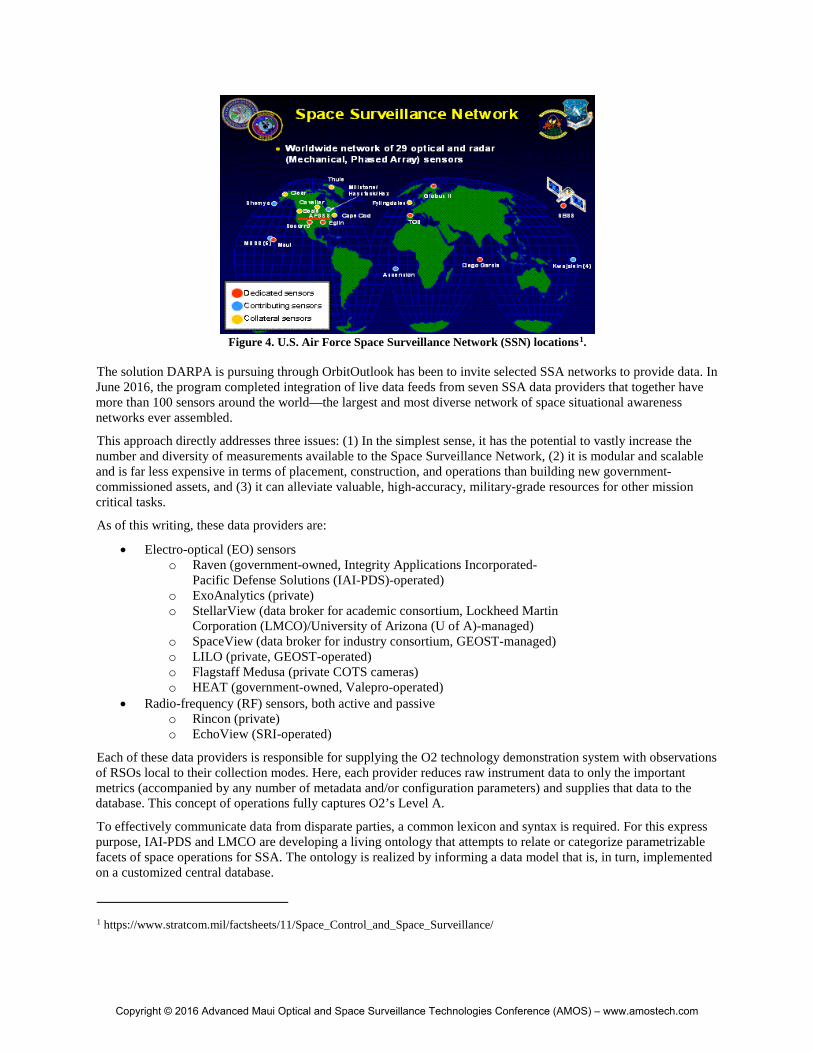
Figure 4. U.S. Air Force Space Surveillance Network (SSN) locations1.
The solution DARPA is pursuing through OrbitOutlook has been to invite selected SSA networks to provide data. In June 2016, the program completed integration of live data feeds from seven SSA data providers that together have more than 100 sensors around the world—the largest and most diverse network of space situational awareness networks ever assembled.
This approach directly addresses three issues: (1) In the simplest sense, it has the potential to vastly increase the number and diversity of measurements available to the Space Surveillance Network, (2) it is modular and scalable and is far less expensive in terms of placement, construction, and operations than building new government-commissioned assets, and (3) it can alleviate valuable, high-accuracy, military-grade resources for other mission critical tasks.
As of this writing, these data providers are:
• Electro-optical (EO) sensors o Raven (government-owned, Integrity Applications Incorporated-
Pacific Defense Solutions (IAI-PDS)-operated) o ExoAnalytics (private) o StellarView (data broker for academic consortium, Lockheed Martin
Corporation (LMCO)/University of Arizona (U of A)-managed) o SpaceView (data broker for industry consortium, GEOST-managed) o LILO (private, GEOST-operated) o Flagstaff Medusa (private COTS cameras) o HEAT (government-owned, Valepro-operated)
• Radio-frequency (RF) sensors, both active and passive o Rincon (private) o EchoView (SRI-operated)
Each of these data providers is responsible for supplying the O2 technology demonstration system with observations of RSOs local to their collection modes. Here, each provider reduces raw instrument data to only the important metrics (accompanied by any number of metadata and/or configuration parameters) and supplies that data to the database. This concept of operations fully captures O2’s Level A.
To effectively communicate data from disparate parties, a common lexicon and syntax is required. For this express purpose, IAI-PDS and LMCO are developing a living ontology that attempts to relate or categorize parametrizable facets of space operations for SSA. The ontology is realized by informing a data model that is, in turn, implemented on a customized central database.
1 https://www.stratcom.mil/factsheets/11/Space_Control_and_Space_Surveillance/
Copyright © 2016 Advanced Maui Optical and Space Surveillance Technologies Conference (AMOS) – www.amostech.com

4. ORGANIZE AND STORE THE DATA
Some sensors take images and others receive signals; for O2’s purposes, both are considered raw data. After these images/signals are processed to glean only the meaningful bits of information (i.e., often called data reduction), the extracted metrics1 are referred to as simply data. It is this reduced set of data that is requested of the data providers. By applying this guidance across all O2 participants, we have standardized what we will accept from the community; the next step is to determine how we will organize and store it.
The storage mechanism is a graph database called the OrbitOutlook Data Archive (OODA) [5].
LMCO is charged with the design and development of the database. OODA has at its center the world model (WM). The world model is a distributed data store built to quickly query big-data quantities of information spread out across multiple processing nodes and data centers. The world model applies a multi-index approach where each index is a distinct view on the data. This strategy allows analysts and analytics/algorithms the flexibility to access information through queries with a variety of terms that may be of interest to them. Our indices include a structured global-graph view of knowledge, a keyword search of data content, and an object characteristic range search. In addition, the world model applies a federated approach by connecting to existing databases and integrating them into one single interface as a “one stop” shopping place to access SSA information.
Together with LMCO, IAI-PDS has created an extensible data dictionary with which to use as the common lexicon to communicate all space operations data. The novelty of this parameter set is that it incorporates the union of all contributing data models and formats (e.g., two-line elements (TLE), B3, and Electro-Optical Space Situational Awareness (EOSSA)), rather than tailoring to any particular legacy service. By generalizing the data dictionary into distinct spaces (e.g., configuration space, measurement space, phase/state space, indications and warnings space), a common representation of SSA concepts (i.e., an ontology) is achieved for both non-traditional and traditional processing of data. Fig. 5 shows a sample branch of the ontological structure that represents the class “space object.”
Figure 5. Sample ontological representation of a Space Object.
Analytic algorithms can use OODA to take observational data and build information from it. They can store these products back into the world model, allowing analysts to gain situational awareness with this information. Analysts in turn would help decision makers use this knowledge to address a wide range of SSA problems. Our data model’s most commonly used terms are: track, sensor information, time sample, observable, measurable, metadata, expectation, report card, space object, and catalog.
1 Here, “metrics” is used in its generic form to mean any quantity that can be measured or computed.
Copyright © 2016 Advanced Maui Optical and Space Surveillance Technologies Conference (AMOS) – www.amostech.com
We implement the data model in such a way that data providers, algorithm developers, and human-machine interface (HMI) tools written in Java, C++, and Python can seamlessly integrate and interact with one another. To accomplish this functionality, we supply a set of application program interfaces (APIs) wrapped up into an OrbitOutlook software development kit. In addition to this, the O2 team also built a world-model interaction layer through the Matlab shell to allow analysts to explore the content of SSA data in the context of other Matlab-based analytics.
It is also critically important to the O2 program for there to be a set of dedicated resources necessary to quickly integrate new algorithms and data provider solutions to bring in and process data. We have created an OrbitOutlook data center (OODC) comprised of seven nodes, physically located in Cherry Hill, NJ, to meet this need. The OODC hosts an instance of the OODA processes including a world model that can fully scale to storing approximately 15 TB of data. The OODC and the OODA world model were designed to take advantage of scaling up (adding more resources to existing nodes) and scaling out (adding more nodes) as determined by program needs. Using the OODC along with algorithms and data providers, we have addressed dozens of integration challenges in preparation for our demonstration events. The OODC will also serve as the processing platform for the demonstrations themselves and allow for post-run analytics to verify the program’s claims.
5. VALIDATE AND EXPLOIT THE DATA
Data processing, in the context of OrbitOutlook, comprises two fundamental steps: data validation and data exploitation. Part of the solution path is to utilize predictive filtering, data assimilation, and data-decimation algorithms that can continuously adapt to available information to provide confidence in the generated solution, establish credibility of the sensor, and consistency of the sensor observations. The path requires efforts in nonlinear dynamical modeling, uncertainty characterization, outlier monitoring, and confidence estimation that are fully integrated to prevent any information truncation during analysis hand-off. Along with other necessary overhead components and underlying messaging framework, the collection is summarized as the OrbitOutlook data processing algorithms (O2DPA). IAI-PDS is tasked with the design, development, testing, and integration of this piece.
For government operations, the typical process for assessing a space surveillance sensor is to analyze a representative data set and determine whether or not the quality of the data is acceptable. Once a sensor is accredited, the sensor and its software and operations are strictly controlled. Any changes would require re-accreditation. The O2DPA validation piece instead seeks to assess the quality of the data. The general notion is that the data is never initially trusted and so must go through this process regardless of past performance. In other words, OrbitOutlook does not perform sensor certification.
The following O2DPA process of data exploitation seeks to deduce and/or infer information from the supplied data. For example, this step is where orbits are determined or where the sizes of the RSOs are estimated. All inputs and outputs of these processes are stored in the database using the underlying data dictionary.
Traditionally, these processes of validation and exploitation are performed by analysts and trained operators. Before getting to O2, even with the smaller number of sensing resources of the current SSN, the data volume is already too much to be efficiently processed by humans. So, automated solutions are necessary for ingesting and processing the data to ensure that space operations stay temporally relevant.
The O2DPA system designed two data processing units (DPUs) to address this issue of automation. The DPUs are distinguished based on the type of data they are meant to process.1 Here, the two data types are generally classified into either astrometric or radiometric data. Astrometric data is data that is of or pertaining to the kinematics of the object (e.g., right ascension and declination). Radiometric data is data that is of or pertaining to the spectral characteristics of the object (e.g., brightness magnitude).
1 The choice of DPU separation is not unique. The distinction made by O2 is merely one selected to fit the current operational needs of the system.
Copyright © 2016 Advanced Maui Optical and Space Surveillance Technologies Conference (AMOS) – www.amostech.com
Each DPU is a separate dedicated research effort. The astrometric DPU is called Parametric Assessment of Data-integrity and Model Estimation (PADME), while the radiometric DPU is called Validation And Data Exploitation of Radiometry (VADER). The two processes are described separately in the following sections.
PADME
PADME operates on astrometric data such as range, Doppler, right ascension, declination, time difference of arrival (TDOA), and frequency difference of arrival (FDOA), from both EO and RF sensing modalities. The first step analyzes an astrometric track1 for outliers in a quality assurance component called PADME-QA. This process is accomplished using orbit fits (e.g., polynomial) to the observations and checking for individual points that are statistically out of family. This determination is only possible if the observations are submitted in tracks instead of as single observations. The more observations in a track, the better the outlier detection algorithm will perform. Since the outlier detection process is not perfect, outliers are not actually deleted or rejected, but merely scored with a weight and recorded in the database. Downstream processes can choose whether or not to accept PADME’s judgement.
After outlier processing has completed, the noise characteristics of the track are evaluated. Noise is the measure of variation in the sample. We characterize this quantity by taking the residuals, 𝑦𝑦𝑖𝑖 , for each observation, as the observed measurements minus those computed from the orbit fit. Then the normalized unbiased estimate of the standard deviation, 𝜎𝜎, is computed assuming a normal distribution:
𝜎𝜎 = �1
𝑝𝑝(𝑚𝑚 − 𝑛𝑛) − 0.5�𝑦𝑦𝑖𝑖𝑇𝑇𝑊𝑊𝑖𝑖𝑦𝑦𝑖𝑖
𝑚𝑚
𝑖𝑖=1
Here, 𝑝𝑝 is the number of measurements per observation, 𝑚𝑚 is the number of observations, and 𝑛𝑛 is the number of parameters being estimated. For a linear fit, 𝑛𝑛 is 2 (the slope and the intercept). For a quadratic fit, 𝑛𝑛 is 3. The 0.5 offset is added as a rule of thumb to produce an unbiased estimation of standard deviation for a normal distribution. 𝜎𝜎 can be used to indicate variability if the expected measurement noise covariance matrices, 𝑊𝑊𝑖𝑖, are correct using the confidence interval, 𝐶𝐶, which is
𝐶𝐶𝑙𝑙𝑙𝑙𝑤𝑤𝑒𝑒𝑒𝑒 = �𝜎𝜎2[𝑝𝑝(𝑚𝑚 − 3)]
𝜒𝜒2[1 − 𝛼𝛼2 𝑝𝑝(𝑚𝑚− 3)]
where 𝛼𝛼 is 0.05 for 95-percent confidence and the 𝜒𝜒2 function gives the lower critical value of the 𝜒𝜒2 distribution. If 𝐶𝐶𝑙𝑙𝑙𝑙𝑤𝑤𝑒𝑒𝑒𝑒 is greater than 1.0, there is a 95-percent chance the observations have more uncertainty than expected and the measurement noise covariance is set using 𝜎𝜎 as the standard deviation.
In this way, abnormal noise or outlier characteristics are identified in PADME-QA as long as there are sufficient observations per track. Fig. 6 shows a set of sample outputs from a PADME-QA analysis of TDOA and FDOA data types. The TDOA/FDOA tracks come from 24-hour observations of the Anik F1-R satellite, using a pair of Rincon passive-RF antennae, one located in Denver, CO, and the other in Tucson, AZ. The top row shows the computed measurements (green) overlaid on top of the recorded measurements (blue), the differences of which lead to the residuals for each data type in the next row. The third row, whose ordinate is entitled “z-score,” displays a metric that gauges the degree of deviation of each residual from the total distribution of residuals – the dotted red line is a configurable threshold that is set for outlier detection. The fourth row shows the normalized histogram of the residuals, representing the probability distribution. In this example, the TDOA/FDOA measurements taken from this long-baseline pair of dishes exhibits relatively low noise corruption and contains only a single outlier.
1 A collection of observations made by a single sensing unit (which can include a collection of sensors acting as one; e.g., long-baseline arrays of antennae) of a single target, over a contiguous period of time.
Copyright © 2016 Advanced Maui Optical and Space Surveillance Technologies Conference (AMOS) – www.amostech.com

Figure 6. Sample TDOA/FDOA quality assessment outputs.
The next step in PADME checks that the satellite ID given by the data provider for each track is reasonably correct using the ID verification component, PADME-VER. If the ID is confirmed using the orbits available (e.g., TLEs from SpaceTrack1 or PADME-produced orbit estimates) then the calibration component, PADME-CAL, performs bias estimation. PADME-CAL uses observations of calibration satellites to estimate measurement biases as well as a timing bias and drift for the sensor. Common mistakes in coordinate systems or processing can be checked in PADME-CAL as well. If sufficient observations have been accepted, previous observations with only rapid analysis results can be given their final analysis in PADME-CAL.
Next, a more rigorous correlation takes place in PADME-COR with respect to the entire internal space object catalog. Any uncorrelated tracks (UCT) can then be associated to build initial orbits for uncatalogued objects in a component called PADME-UCT.2 Finally, the orbits for correlated objects are updated with the new observations in a component called PADME-ORB. In the process of estimating the orbit in PADME-ORB, an additional check for outliers is performed; incidentally, this mechanism is the only method of detecting outliers when observations are submitted singly instead of in associated groups (i.e., tracks). The final estimate for measurement noise is determined by comparing the predicted noise for this sensor with 𝜎𝜎 along with the standard deviation of calibration satellite residuals and the standard deviation of the orbit fit residuals from PADME-ORB. All of the components mentioned can be mapped to their corresponding locations in the flow as shown in Fig. 7.
1 https://www.space-track.org/ 2 The UCT resolution routine currently is only able to process angles-only measurements.
Copyright © 2016 Advanced Maui Optical and Space Surveillance Technologies Conference (AMOS) – www.amostech.com

Figure 7. PADME flow diagram.
VADER
VADER operates on observational data such as the brightness magnitudes, coupled with the angular positions of the detected objects and the background stars. The VADER portion of O2DPA consists of several algorithms to provide both validation and exploitation of radiometry as shown in Fig. 8. Level B (validation) first checks the radiometric calibration and assigns an estimated systematic error, and then compares the current data to an empirical model created from past and concurrent data to assign each data point a score. The score and systematic error are then used to filter the data processed by the Level C (exploitation) algorithms.
Figure 8. VADER flow diagram.
Fig. 9 shows example output of the simple empirical algorithm, VADER-SE, using actual observations of IntelSat’s Galaxy 15 satellite from the Remote Maui Experiment (RME) small telescope. In Fig. 9a, most of the observations fall within the bounds of the empirical model and obtain a “pass” score. In Fig. 9b (later discovered to be a mis-tag), most of the observations fall outside the bounds of the empirical model and obtain a “marginal” or “fail” score.
Copyright © 2016 Advanced Maui Optical and Space Surveillance Technologies Conference (AMOS) – www.amostech.com

Figure 9. Sample VADER Level B output. (a) Representative "good" day and (b) an example mis-tag event.
It should be noted that the validation resulting from an empirical model comparison is only as good as the existence of good comparison data. In other words, it is straightforward to statistically identify the outlying bad data when compared to several examples of good data. If, however, the comparison data is biased, the resulting empirical model will also be biased; the scores for subsequent biased data would be artificially high while the scores for unbiased data would be artificially low. As another example, brightness variability caused by excessive poor-quality comparison data or intrinsic to the object itself (e.g., periodicity caused by rotation) will broaden the empirical model bounds and make the validation less sensitive to outliers.
VADER Level C (exploitation) utilizes various algorithms to calculate object characteristics. The current algorithms are three tools from the Air Force Research Laboratory (AFRL)’s Attitude Shape and Retrieval (ASR) suite, although other algorithms can of course be added as desired. As an example, Fig. 10 displays the best period output of the ASR Periodicity Analysis tool (PAtool) for observations of the XM-1 satellite (SSN 26761) recently injected into a super-sync graveyard orbit. It is evident that XM-1’s rotation rate is spinning up (shorter period) initially quite rapidly and then more or less linearly (see Fig. 10 inset). These periodicity changes are induced by internal torques (e.g., transfer from momentum wheels) and/or external torques (e.g., radiation pressure). Note, in some cases the period calculated by PAtool was adjusted to the correct harmonic.
Figure 10. Measured period by date for XM-1 graveyard object.
a) b)
Copyright © 2016 Advanced Maui Optical and Space Surveillance Technologies Conference (AMOS) – www.amostech.com
6. TESTING THE SYSTEM
The Johns Hopkins University Applied Physics Laboratory (JHU/APL) has been tasked to verify that the O2 system, including the data providers, the data center, and the data processing algorithms, fulfills the requirements and performs the functions specified by DARPA.
Data providers – Each data provider will be tested on whether or not they can publish the information for their sensors as well as their observation data to the database. This testing will be conducted on a pass-fail basis. Each data provider must complete the integration test for near-real-time collected data to participate in the O2 system performance tests.
Database – The O2 database (i.e., OODA) will be tested on whether or not it is able to ingest and store data (e.g., observations, calibration satellite ephemerides, and space object catalogs) at an acceptable rate. OODA will be stress-tested by publishing one week’s worth of observation data at an average rate of 3 observations per second and a peak rate of 8 observations per second. Furthermore, OODA is also expected to be able to accept data from at least six different data providers simultaneously. The calibration data for the high-confidence assets will be retrieved from online sources and submitted to the database in daily batch submissions of at least 2 lines of ephemeris per second. Lastly, SpaceTrack catalogs (i.e., a list of TLEs) will be submitted as part of autonomously scheduled jobs occurring at a frequency of once per day producing at least 500 TLEs per second. The overall system is expected to have a minimum storage capacity of 1 terabyte.
Data Processing Algorithms – A verification and validation (V&V) plan will be exercised to test the functionality and the accuracy of the PADME and VADER DPUs. The functionality will be tested by executing different use cases that span the various processing options. The accuracy will be tested in a modeling and simulation environment by comparing DPU outputs to known accurate data. Note that this testing involves only the standalone DPUs; the entire O2DPA infrastructure will be inspected and tested under a different mechanism (not presented here).
For the modeling and simulation environment, JHU/APL will generate synthetic observation data via its Extensible Simulator (ESIM). The computed measurements will be based on a set of scenarios designed to test the algorithms’ performance under varying conditions and combinations of data quality and quantity.
ESIM is a simulation environment designed to rapidly prototype low- to medium-fidelity sensor models along with concept of operations (CONOPS) with customizable detection capabilities. It is written in Java and utilizes the Orekit1 codebase for high-accuracy orbit propagation and frame transformations. The force models include: a high-degree and -order aspherical-gravitational geopotential; third-body perturbations; solid and ocean tides; atmospheric drag; and solar radiation pressure. Common coordinate systems include Earth-centered Earth-fixed (ECEF) and Earth-centered inertial (ECI) frames. The simulation framework supports modeling scenarios with several types of ground- and space-based sensors observing various geocentric targets. To manage the concurrent components, a Java library is developed (called Mantis) that rests on a simulation layer integrating the JSON2 messaging configuration with the ActiveMQ3 messaging service (see Fig. 11).
1 https://www.orekit.org/ 2 http://www.json.org/ 3 http://activemq.apache.org/
Copyright © 2016 Advanced Maui Optical and Space Surveillance Technologies Conference (AMOS) – www.amostech.com

Figure 11. ESIM simulation application layers.
The Java Astrodynamics Library at APL (JALA) is built on top of the Orekit framework and is used to configure specific sensor-target scenarios. ESIM allows for the configuration of several different sensor types: optical, radar, and passive RF (in progress). For each sensor type, appropriate detection models (e.g., elevation masks, signal-to-noise ratio, sun/moon exclusions) are used to provide realism to synthetic measurement generation. Visualizations are accomplished via the custom Tactic Globe Visualizer (TGV); Fig. 12 shows an example scenario, from a space-based perspective, of two terrestrial sensors each tracking a specific target over time.
ESIM follows a simplified closed-loop approach for simulation data flow (see Fig. 13). The basic ESIM construction contains three essential modules: ESIM Simulator, Tracker/Scheduler, and the Spacecraft Sensor. The ESIM Simulator is the main program that controls the execution of the configurable modules, such as the Tracker/Scheduler and the Spacecraft Sensor. This modular setup gives the user compartmentalized control over the processing thread composition and runtime flow, allowing them to test different combinations of various options in a single integrated environment.
Copyright © 2016 Advanced Maui Optical and Space Surveillance Technologies Conference (AMOS) – www.amostech.com
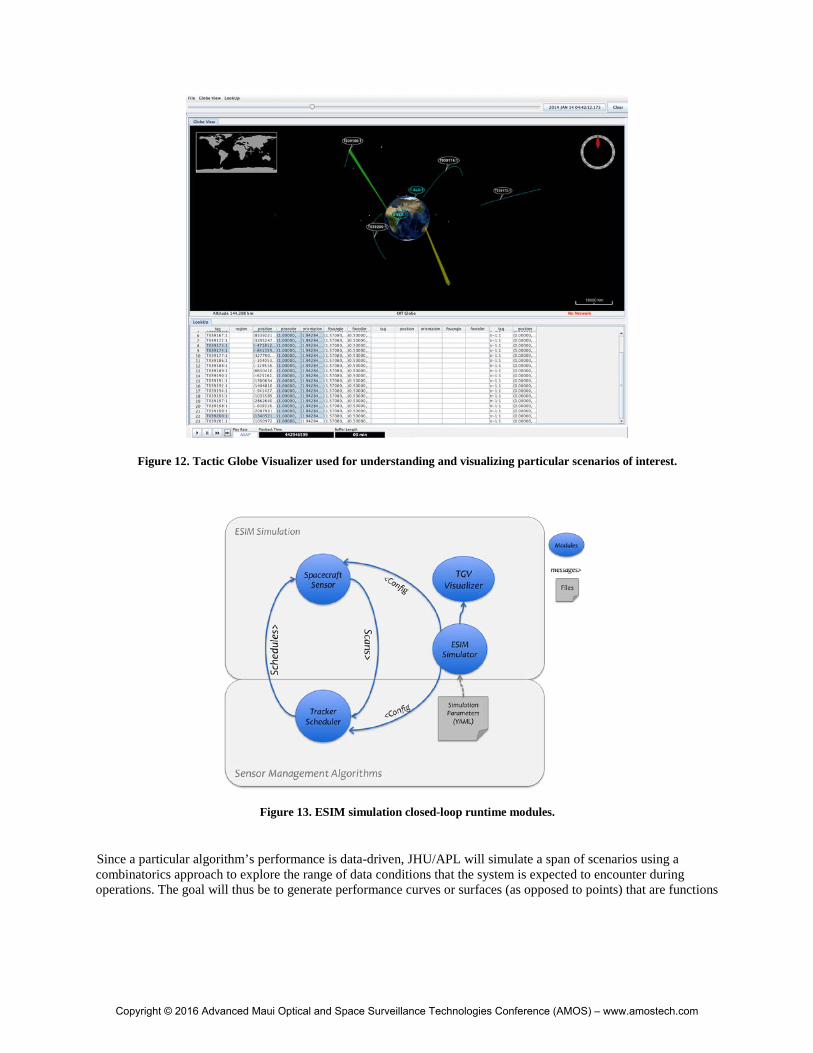
Figure 12. Tactic Globe Visualizer used for understanding and visualizing particular scenarios of interest.
Figure 13. ESIM simulation closed-loop runtime modules.
Since a particular algorithm’s performance is data-driven, JHU/APL will simulate a span of scenarios using a combinatorics approach to explore the range of data conditions that the system is expected to encounter during operations. The goal will thus be to generate performance curves or surfaces (as opposed to points) that are functions
Copyright © 2016 Advanced Maui Optical and Space Surveillance Technologies Conference (AMOS) – www.amostech.com

of each tuning parameter. The data quality conditions, here used as tuning parameters, are as follows: (1) number of sensors, (2) sensor noise, (3) sensor bias, (4) number of observations, (5) temporal spacing between observations, and (6) orbit regime.1 Table 1 lists each tuning parameter along with a range of values used as a discrete representation of a continuous span. If a particular scenario is described by selecting one value from each column, in a pure combination sense, the number of possible scenarios to consider is 864. Automation techniques are under development to allow timely generation of configuration files and execution of each simulation to be completed prior to the demonstration phase.
Table 1. Discrete ranges for each tuning parameter.
Number of Sensors
Noise (1-σ) Bias (percent of base unit)
Number of Observations
Observation Spacing (sec)
Orbit Regime
• 1
• 10
• None (0.0000)
• Low (0.0125)
• Medium (0.0500)
• High (0.2000)
• None (0.0000)
• Low (0.0125)
• Medium (0.0500)
• High (0.2000)
• 3
• 6
• 10
• 1
• 20
• 240
• LEO
• MEO
• GEO
The accuracy of the orbit estimates produced by PADME (while processing synthetic data) will be evaluated by comparing against the known accurate ephemeris used in the simulation. The associated covariance matrix provides a convenient factor with which to scale the state estimate to account for uncertainty; the Mahalanobis distance can then be used to measure the closeness of the data sets. Acceptable and unacceptable accuracies will be determined in accordance with the guidelines put forth by the user.
Given the difficulties of generating consistent and realistic radiometric data, the V&V for the VADER algorithms will be conducted by modifying real data rather than generating simulated data (the capability of ESIM to produce radiometric data is currently under development). The live-collected data will be modified by artificially adding sensor noise and bias to irradiance measurements that will be analyzed by VADER. The VADER algorithms will be evaluated using the same mechanisms as PADME, though the range of scenarios will likely be smaller due to the limitations of the real data sets.
The demonstrations of the O2 system include four separate data collection campaigns of increasing length, each followed by a data replay period during which the collected data will be processed by the PADME and VADER algorithms. JHU/APL will direct these data collection campaigns by providing guidance to the data providers regarding what to collect, including the specific RSOs that should be observed as well as the collection timeframe and number of observations that should be provided for each object. The results of the demonstrations will be documented at the culmination of these events.
7. CONCLUSION
As of this writing, almost all of the aforementioned data providers have successfully collected sample data records (local to their sensing modality) and published them to the OODA database; the only sensors on which the system is still awaiting contributions are the radar units. The data center and database, themselves, are fully operational prototypes – the planned stress testing, load balancing, and performance analyses have been completed and the results documented. The O2DPA suite of tools and accompanying highly autonomous processing infrastructure have been designed and developed, complete with software requirements and system design documents. The O2DPA component is currently connected to the OODA database on the production OODC system.
1 The orbit regimes for this work are approximated into three spherical shell manifolds whose boundaries are defined based on altitude: low Earth orbit (LEO), medium Earth orbit (MEO), and geosynchronous orbit (GEO).
Copyright © 2016 Advanced Maui Optical and Space Surveillance Technologies Conference (AMOS) – www.amostech.com
The next steps are to test the various O2DPA functionalities in end-to-end simulations while integrated with the database. Proceeding according to schedule, the demonstration phase is set to begin in November 2016 with live collections. The end of the demonstration phase is slated for March 2017.
Pending the successful outcome of these demonstrations, the O2DPA tools will progress into the transition phase to bridge the gap between research and operations. A rough order-of-magnitude (ROM) white paper has been written to capture the details of transitioning the tools developed under the O2 program to potential end-use customers (e.g., AFRL, AFSPC) and corresponding destination platforms (e.g., Joint Interagency Combined Space Operations Center or JICSpOC). Specific measures are identified for these future customers to incrementally advance the maturity of the tools to Technology Readiness Level (TRL) 7 and higher; the plan also considers the possibility of integrating the tools within multi-layer security enclaves.
Operational indications and warnings will undoubtedly benefit from increased observational evidence of space events. A commander’s decision options will be supported with higher confidence results drawn from a wider breadth of situational knowledge. With the data feed opened up to a larger community of observers, with a centralized data warehouse used to store and organize the information, and with highly autonomous data processing engines verifying and validating the flow of non-traditional observations, DARPA seeks to help radically shift the paradigm of space surveillance.
The views, opinions and/or findings expressed are those of the author(s) and should not be interpreted as reflecting the official views or policies of the Department of Defense or the U.S. Government.
8. REFERENCES
[1] Kessler, D. J. and B. G. Cour-Palais, “Collision Frequency of Artificial Satellites: The Creation of a Debris Belt,” Journal of Geophysical Research, Vol. 83, No. A6, 1978, pp. 2637–2646.
[2] National Aeronautics and Space Administration Orbital Debris Program Office, “Satellite Box Score,” NASA Orbital Debris Quarterly News, 20(1-2), 2016, p.13.
[3] Vallado, D., Kelecy, T., and M. Jah, “Data Integrity in Orbital Data Fusion,” 63rd International Astronautical Congress. Naples, Italy: International Astronautical Federation, 2012.
[4] Blake, T., Sanchez, M., and M. Bolden, “OrbitOutlook: Data-Centric Competition Based Space Domain Awareness (SDA),” 30th Space Symposium. Colorado Springs, CO: Space Foundation, 2014.
[5] Czajkowski, M. et al, “The OrbitOutlook Data Archive,” 17th Advanced Maui Optical and Space Surveillance Technologies (AMOS) Conference. Maui, HI: Maui Economic Development Board, 2016.
Copyright © 2016 Advanced Maui Optical and Space Surveillance Technologies Conference (AMOS) – www.amostech.com