orchestration of innovation in ecosystems: an analysis of
TRANSCRIPT
Orchestration of Innovation in Ecosystems: An Analysis of the Development and Management of Ecosystem Initiatives
D I S S E R T A T I O N of the University of St.Gallen,
School of Management, Economics, Law, Social Sciences,
International Affairs and Computer Science, to obtain the title of
Doctor of Philosophy in Management
submitted by
Maximilian Böger
from
Germany
Approved on the application of
Prof. Dr. Oliver Gassmann
and
Prof. Dr. Christoph H. Wecht
Dissertation no. 5038
Difo-Druck GmbH, Untersiemau 2021

The University of St.Gallen, School of Management, Economics, Law, Social Sciences, International Affairs and Computer Science, hereby consents to the printing of the present dissertation, without hereby expressing any opinion on the views herein expressed. St.Gallen, October 23, 2020 The President: Prof. Dr. Bernhard Ehrenzeller


Acknowledgments
This dissertation is one of the essential tangible results of my time as a doctoral student at the Institute of Technology Management (ITEM) at the University of St. Gallen. I would like to take this opportunity to express my gratitude to the people who have been at the center of my attention during my doctoral studies. First of all, I would like to thank my supervisor, Prof. Dr. Oliver Gassmann, who gave me the opportunity to develop personally and supported me continuously. I would also like to thank Prof. Dr. Christoph H. Wecht for co-supervising my dissertation, and for his constructive feedback and inspiring conversations. Thanks to my direct supervisor, Dr. Bernhard Lingens, who provided outstanding support. Thanks to Prof. Dr. Marion Rauner, who has accompanied me since my undergraduate studies. Through her, I discovered my passion for innovation-related research. I would like to thank the whole ITEM team, especially the Chair for Innovation Management and the Helvetia Innovation Lab, the community of students, my Ph.D. soccer team, guest scientists, and lecturers, whom I had the opportunity to learn from. I am grateful to my co-authors and, in general, to the people I have had a chance to work with.
Besides numerous conversations that have served as a rich source of inspiration, many vivid memories have made the past years an incredibly exciting and unforgettable adventure. In this context, I would like to express my special thanks to Charlotte Lekkas, Barbara Bencsik, Ursula Elsässer-Gähwiller, Irina Schreiber, Florian Huber, and Kilian Schmück, who have always been there for me. I hope to remain in close contact with my colleagues from the university, the institute and the chair of innovation management, including Dr. Naomi Häfner, Dr. Karla Linden, Veronika Seeholzer, Natalie Weiler, Manuela Huber, Carla Haake, Celine Stalder, Rebekka Ryf, Dr. Thomas Möllers, Dr. Henrik Wesemann, Dr. Lukas Neumann, Dr. Jonas Böhm, Dr. Steffan Berger, Dr. Erwin Hettich, Dr. Maximilian Palmié, Dr. Felix Wortmann, Dr. Florian Hohmann Erik Linden, Lucas Miehé, Raphael Bömmelburg, Peter Tinschert, Jan Niklas Kramer, Phillip Osterrieder, Camilo Visini, Alex Hunter and Arne Grüttner. Sonja Baumgartner, Elisabeth Vetsch-Keller, and Jörg Klaus were a great help in dealing with various administrative issues.
A big thank you goes to my family: Grandma Erika Martens and Grandpa Erwin Martens, Claudia Hohensee, Heiko Janz, Susanne Windisch, Dieter Windisch, Bianca Rexeis, Maximilian Windisch, Verena Rosner, Thomas Rosner, Elfriede Rexeis, Franz Rexeis, Eva Windisch, Leo Windisch, Maria Hlavac, Kurt Hlavac and Neel Martens. And my friends: Michael Neuhold, Tim Jürgens, Nadine Kirschner, Danny Kirschner,

Patrick Windhab, Marie Lang, Dr. Christoph Bayrle, Niklas Bayrle, Lasse Brüggemann, Nikolaus Mayr, Helge Busemann, Marco Hoffmann, Lena Eitzinger, Janice Dowen and John Dowen, who have always supported and motivated me.
Finally, I would like to thank my wife Vanessa, my parents, Sabine and Ingo, my sister Svea, my aunt and uncle, Danja and Olaf, my best friend Paul and my deceased grandparents, Hertha and Edzart, to whom I dedicate this work.
St. Gallen, June 2020 Maximilian Böger

i
Executive Summary (English)
The success factors for companies are changing fundamentally. Digitalization and globalization have caused a reordering of traditional industry boundaries, and firms can no longer meet customer expectations in isolation. In a more borderless economy, it is crucial to create a mindset more open to expanding the view of competitors and market possibilities. As boundaries between industries become blurred, companies need to consider partnering with other players, from corporations, to startups and public institutions. As a result, firms from various industries will develop or be part of ecosystems. Ecosystems – a novel way of cooperating – have the power to create a customer-centric, simplified joint value proposition that expands a product or service beyond what an end-user could previously obtain from a single firm. The combination of partners’ complementary skills enables an ecosystem to meet customer demands and allows firms to stay competitive. Yet, understanding the complex nature of this underlying phenomenon is a challenge for both theory and management alike.
Despite significant interest in ecosystems, the following questions remain unexplored: (i) the development of ecosystems, (ii) the role of startups as orchestrators within ecosystems, and (iii) the impact of ecosystems on innovation as R&D intensity. As a result, this thesis will be guided by these three research gaps. In order to provide the information needed, this dissertation uses two methodological approaches. It is based on two qualitative case studies (Chapter 2 and Chapter 3) and one quantitative text mining analysis with R, over the years 2013–2018 (Chapter 4 C), to explore the underlying phenomenon. I was one of the first to study the establishment of an ecosystem in general. Besides identifying four archetypes of ecosystems, my findings highlight the importance of search in the development process. Secondly, and contrary to the existing literature on the role of a startup as an orchestrator, I am able to prove that an ecosystem can be successfully orchestrated by a startup. Lastly, my findings highlight the relevance of ecosystems for innovation and R&D. My insights reveal that most STOXX Europe 50 companies engage in ecosystems to innovate and show an increasing trend of R&D intensity. The dissertation focuses on several contributions to the literature on ecosystems and provides hand-on guidance for practitioners.

iii
Executive Summary (German)
Die Erfolgsfaktoren für Unternehmen verändern sich grundlegend. Digitalisierung, und Globalisierung führen zu einer Neuordnung der traditionellen Branchengrenzen. Unternehmen können die Kundenerwartungen an neuen Innovationen nicht mehr alleine bewältigen. In einer grenzenloseren Wirtschaft ist es entscheidend, eine breitere Denkweise zu schaffen, um den Blick auf Wettbewerber und Marktmöglichkeiten zu erweitern. Da die Grenzen zwischen den Branchen immer mehr verschwimmen, müssen Unternehmen eine Partnerschaft mit anderen Akteuren wie Konzernen, Startups und öffentlichen Institutionen in Betracht ziehen. Infolgedessen werden Unternehmen aus verschiedenen Branchen Ökosysteme entwickeln oder Teil von diesen werden. Ökosysteme – sind eine neue Art der Zusammenarbeit - haben die Macht, ein kundenorientiertes, vereinfachtes gemeinsames Wertversprechen zu schaffen, das ein Produkt oder eine Dienstleistung kreiert, die der Endnutzer in dieser Form zuvor nicht erhalten konnte. Die Kombination, der sich ergänzenden Fähigkeiten, der Partner ermöglicht es einem Ökosystem, die Kundenanforderungen zu erfüllen und die Unternehmen wettbewerbsfähig zu halten. Das Verständnis der komplexen Natur dieses zugrunde liegenden Phänomens ist sowohl für die Theorie als auch für das Management eine Herausforderung. Trotz des großen Interesses bleiben Fragen bezüglich (i) der Entwicklung des Ökosystems, (ii) der Rolle von Startups als Orchestrator und (iii) der Auswirkungen von Ökosystemen auf die Innovation als F&E-Intensität bislang unerforscht. Diese drei Forschungslücken bilden die Grundlage für diese Dissertation. Um die benötigten Informationen zu liefern, verwendet diese Dissertation zwei methodische Ansätze. Sie stützt sich auf zwei qualitative Mehrfach-Fallstudien (Kapitel 2 & 3) und eine quantitative Text-Mining-Analyse mit R über die Jahre 2013-2018 (Kapitel 4), um das zugrunde liegende Phänomen zu untersuchen. Ich war einer der Ersten, der die Errichtung eines Ökosystems im Allgemeinen untersucht hat. Neben der Identifizierung von vier Archetypen von Ökosystemen unterstreichen meine Ergebnisse die Bedeutung der Suche im Aufbauprozess. Zweitens, und im Gegensatz zur vorhandenen Literatur, kann ich beweisen, dass ein Ökosystem erfolgreich durch Startups orchestriert werden kann. Und schließlich unterstreichen meine Ergebnisse die Bedeutung von Ökosystemen für Innovation und F&E. Meine Erkenntnisse zeigen, dass die meisten Unternehmen von STOXX Europe 50 versuchen sich in Ökosystemen zu engagieren, um Innovationen zu fördern. Die Dissertation konzentriert sich auf mehrere Beiträge zur Literatur über Ökosysteme und bietet Anleitungen für Praktiker.

v
Table of contents
List of Figures ............................................................................................................... vii
List of Tables ................................................................................................................. ix
List of Abbreviations ...................................................................................................... x
1 Innovation through Ecosystems ........................................................................... 1
Introduction to the Relevance and Overall Structure ....................................... 1
Attempt at a Definition .................................................................................... 6
State of the Art in the Literature about Ecosystems ...................................... 18
Research Questions and Outline of the Thesis .............................................. 21
Overall Structure of the Thesis ...................................................................... 25
2 No One can Whistle a Symphony – How Firms Search for Potential Value Propositions and Partners in Building-up an Ecosystem ........................................ 27
2.1. Introduction .................................................................................................... 27
2.2. Literature Review .......................................................................................... 29
2.3. Methods ......................................................................................................... 32
2.4. Findings ......................................................................................................... 46
2.5. Implications ................................................................................................... 68
3 A Single Conductor can Lead a Large Orchestra: How Startups Orchestrate Ecosystems ................................................................................................................... 74
Introduction .................................................................................................... 74
Literature Review .......................................................................................... 75
Methods ......................................................................................................... 79
Findings ......................................................................................................... 89
Implications ................................................................................................... 99
Contributions to Research ............................................................................ 103
4 The Effects of Ecosystems on Research and Development Intensity and Corporate Innovation ............................................................................................... 104
Introduction .................................................................................................. 104

vi
Literature Review ........................................................................................ 104
Methods ....................................................................................................... 106
Findings ....................................................................................................... 111
4.4. Implications ................................................................................................. 115
5 Conclusion .......................................................................................................... 118
Theoretical Contributions ............................................................................ 118
Managerial Implications .............................................................................. 121
Future Research ........................................................................................... 122
Discussion .................................................................................................... 123
6 References .......................................................................................................... 125
7 Appendix .............................................................................................................. vii
Study-related Appendices .............................................................................. vii
Curriculum Vitae ............................................................................................ xl

vii
List of Figures
Figure 1: Business Model Triangle according to Gassmann et al. (2014) .................... 2
Figure 2: Visualization of the merger of business and innovation ecosystems ........... 12
Figure 3: Summary of research gaps in current literature ........................................... 21
Figure 4: Exemplary coding scheme A ....................................................................... 40
Figure 5: Exemplary coding scheme B ....................................................................... 41
Figure 6: Exemplary coding scheme C ....................................................................... 42
Figure 7: Overall structure of findings ........................................................................ 44
Figure 8: Ecosystem development Access case .......................................................... 48
Figure 9: Ecosystem development Factoring case ....................................................... 50
Figure 10: Ecosystem development Smart Building case ........................................... 52
Figure 11: Ecosystem development Move case .......................................................... 53
Figure 12: Ecosystem development Sports case ......................................................... 54
Figure 13: Ecosystem development Mobility case ...................................................... 56
Figure 14: Ecosystem development Data case ............................................................ 59
Figure 15: Ecosystem development InsurTech case .................................................... 60
Figure 16: Ecosystem development Logistics case ..................................................... 62
Figure 17: Ecosystem development Analytics case .................................................... 63
Figure 18: Framework of ecosystem search and development .................................... 64
Figure 19: Exemplary quote extractions from archetype A and C .............................. 85
Figure 20: Exemplary quote extraction from archetype B and D ................................ 86
Figure 21: Different types of orchestrators ................................................................. 89
Figure 22: Core findings Chapter 3 ........................................................................... 100
Figure 23: Methodology Chapter 4 ........................................................................... 108
Figure 24: Matrix R&D intensity & word count ....................................................... 111
Figure 25: Cluster of industries ................................................................................. 115
Figure 26: Sketch Factoring case ................................................................................. ix
Figure 27: Sketch Sports case ........................................................................................ x

viii
Figure 28: Sketch InsurTech case ................................................................................. xi
Figure 29: Sketch Move case ...................................................................................... xii
Figure 30: Sketch Share case ...................................................................................... xiii
Figure 31: Sketch Maintenance Analytics case .......................................................... xiv
Figure 32: Sketch Smart Building case ....................................................................... xv
Figure 33: Sketch Visualization case ......................................................................... xvi
Figure 34: Sketch Access case .................................................................................. xvii

ix
List of Tables
Table 1: Overview of different ecosystem types ......................................................... 10
Table 2: Detailed description of six domains based on Isenberg (2011) ..................... 16
Table 3: Overall structure of the thesis ........................................................................ 25
Table 4: Overview of ecosystem terms ....................................................................... 31
Table 5: Case overview ................................................................................................ 35
Table 6: Case and data overview Chapter 2 ................................................................. 38
Table 7: Iterations of ecosystem search ....................................................................... 67
Table 8: Overview of ecosystem related concepts ....................................................... 77
Table 9: Case and data overview Chapter 3 ................................................................ 82
Table 10:Case descriptions and further information ................................................... 83
Table 11: STOXX Europe 50 (December 2019) ....................................................... 107
Table 12: Data about R&D intensity ........................................................................ xviii
Table 13: Word count ................................................................................................ xxii

x
List of Abbreviations
3D Three-Dimensional
3G Third Generation
5G Fifth Generation
AI Artificial Intelligence
App Application
API Application Programming Interface
B2B Business-to-Business
B2B2C Business-to-Business-to-Customer
B2C Business-to-Customer
B2G Business-to-Government
CAGR Compounded Annual Growth Rate
CEO Chief Executive Officer
C-level Chief-level
cf. confer (compare to)
CO2 Carbon Dioxide
COO Chief Operating Officer
e.g. exempli gratia (for example)
ERI European Innovation
et al. et alii (and others)
etc. et cetera (and so forth)
FMCG Fast Moving Consumer Goods
i.e. id est (that is)
IT Information Technology
IoT Internet of Things
IP Internet Protocol
M&A Merger & Acquisition
M2M Machine-to-Machine

xi
Min. Minute
MVP Minimum Viable Product
n.a. not available
p. page
P&C Property & Casualty
PDF Portable Document Format
R&D Research & Development
RGP Redemption Grace Period
SME Small and Medium Enterprise
TV Television
VC Venture Capital
vs. Versus

1
1 Innovation through Ecosystems
Introduction to the Relevance and Overall Structure
1.1.1 Ecosystems as a Business Model for Driving Innovation
In recent years, innovation has been a hot topic in management studies, with recognition of the reshaping taking place in organizations of all kinds and sizes, as well as the resulting new customer value (Tidd & Bessant, 2018). One such example is ShareNow (former Car2Go and DriveNow), which was able to create superior customer value by successfully implementing the so-called ‘ecosystem business model’. This specific ecosystem, consisting of the key actor Daimler AG and a number of complementary actors offers the world’s first and largest ‘free-float’ carsharing service through an app that allows members to temporarily hire a car (Herrmann et al., 2014; Leminen et al., 2012; Rong et al., 2015a). A notable benefit of ShareNow is that cars can be picked up and dropped off wherever and whenever the customer wants (Herrmann et al., 2014). Moreover, unlike a regular car rental business where a fixed amount of rental time is offered to a client, the ShareNow model allows cars to be rented by the minute (Gassmann et al., 2014). Daimler AG, BMW Group, and their partners were able to create unique customer value by building a successful ecosystem in ShareNow. This example illustrates how building up an ecosystem can create unique customer value by offering an easy, flexible, and complete customer experience. It shows how actors seek cooperation with partners in an ecosystem in order to create an innovative business model that they would not be able to realize in isolation (Adner, 2006; Chesbrough, 2006; Fjeldstad et al., 2012; Moore, 1993, 2006). However, an important question remains: How do ecosystems, such as ShareNow, develop from a business model to a system that offers value?
A business model describes who the customers are, what goods or services should be offered, how that market offering is created, and why the business is profitable (Gassmann et al., 2014). Similar to other business models, the ecosystem, at its core, aims to create value for the customer (Kandiah & Gossain, 1998; cf. Zott & Amit, 2010; Zott et al., 2011). In practice, a business model is often seen as a description of how ‘a business is run’ (Zott et al., 2011). Specifically, a business model encompasses all activities that serve the fulfillment of an overall objective (Zott & Amit, 2010), which – in the case of an ecosystem business model – is the joint value proposition (Adner,

2
2017; Cusumano & A., 2014; Iansiti & Levien, 2004b; Moore, 1993, 1996). In that sense, an ecosystem business model describes the entirety of activities in a system of mutually interdependent actors, as well as the mechanisms connecting these activities (Jacobides et al., 2018; Zott & Amit, 2010, 2015b). The magic-triangle, developed by Gassmann et al. (2014), is a popular and comprehensive tool to describe the components of a business model. It addresses both internal and external perspectives of a business model: who and what refer to external aspects, whereas how and why address the internal dimensions. Figure 1 below shows how these four dimensions of a business model relate to each other:
Figure 1: Business Model Triangle according to Gassmann et al. (2014)
In the context of the ecosystem topic, it is important to note the holistic characteristics of the business model concept: By bringing together internal and external factors that contribute to a market offering, a business model aims to illustrate the whole picture (cf. Leih et al., 2015; Martins et al., 2015; Teece, 2010, 2018a; Zott & Amit, 2015a; Zott et al., 2011). Therefore, the business model is seen as a concept spanning the boundaries of a single firm (Gassmann et al., 2014): A business model depicts how a focal actor interacts with and, thus, is embedded in its surrounding ecosystem (Shafer et al., 2005; Zott & Amit, 2010).

3
Who – the customer
Since every business model caters to a specific customer group, it is important to understand who is and who is not part of that customer segment (Gassmann et al., 2014). Only with that knowledge can companies create a market offering that generates targeted value (Chesbrough & Rosenbloom 2002; Hamel 2000; Gassmann et al., 2014). Customers are at the very core of every business model and should therefore always be the starting point of all business considerations (Gassmann et al., 2014).
What – the value proposition
This second dimension of a business model describes the offering brought to the market and is, thus, the manifestation of how the company intends to meet the customers’ needs (Gassmann et al., 2014).
How – the value chain
The how of a business model describes the value chain that yields the final market offering, i.e. the processes and activities resulting in the value proposition in conjunction with the necessary resources and capabilities, as well as their coordination (Gassmann et al., 2014).
Why – the profit mechanism
The last dimension describes how a business model is financially attractive or, essentially, how the business aims to make money. As such, it includes various financial elements, such as the cost structure, as well as the revenue mechanisms (Gassmann et al., 2014).
When considering these business model components and their interdependencies, the complex nature of the business model concept becomes very apparent (Gassmann et al., 2014). Value is, therefore, not realized by one component in isolation. In line with that idea, ecosystems can be embedded in the business model concept. Ecosystems have the overall purpose of creating a joint value proposition, which ecosystem partners could not create by themselves and, thus, they enable actors to innovate beyond the boundaries of their own limited resources, capabilities, and markets (Adner, 2017; Cusumano & A., 2014; Iansiti & Levien, 2004b; Moore, 1993, 1996). Innovation in the context of such a complex system consequentially entails great potential, but can also turn out to be very challenging (Brusoni & Prencipe, 2013; Clarysse et al., 2014; Gassmann et al., 2014; Moore, 1993).

4
In turn, the following Chapters will primarily focus on illuminating the innovative potential of an ecosystem business model in addition to creating a general understanding of the ecosystem concept.
1.1.2 The Significance of Ecosystems for Innovation With the rise of information technology, the business focus gradually shifted from the supply side to the demand side of the market. As such, this transition affected every aspect of market dynamics and signified a new business paradigm (Kandiah & Gossain, 1998). In recent years, customers have increasingly demanded integrated solutions rather than single products or service applications (Williamson & de Meyer, 2012). Consequentially, a profit-maximizing company has an inherent interest in meeting these needs.
One company alone can no longer meet these new customer expectations, which have been fostered by the potential of digitalization (Adner, 2006; Jacobides et al., 2018; Williamson & de Meyer, 2012). By focusing on the customer, companies in many industries have recognized the need for change: Companies must step away from a singular, vertically integrated approach to value creation and start drawing upon knowledge and capabilities that are dispersed globally (Williamson & de Meyer, 2012). Digitalization is not only changing customer expectations but is also fundamentally transforming whole industries and eroding their boundaries. New technologies allow companies to serve customers with a holistic value proposition by bringing together sectors and businesses that once appeared disconnected (Atluri et al., 2017). As a result, companies seek cooperation with partner firms in order to attain the innovation a single player would not be able to achieve alone (Adner, 2006; Chesbrough, 2006; Fjeldstad et al., 2012; Moore, 1993, 2006). A multitude of actors add complementary contributions, which together add up to a mutual value proposition (Adner, 2017; Jacobides et al., 2018). These contributors are significantly autonomous, yet interdependent, and are therefore characterized by modularity (Jacobides et al., 2018). As such, the interdependence of distinct modules differentiates ecosystems from other governance forms aimed at the co-creation of value (Adner, 2017). The interconnection between ecosystem partners enables the materialization of an ecosystem’s focal value proposition, which is at the very core of the ecosystem’s purpose. Importantly, for an ecosystem to matter, it must consist of a multiplicity of partners with relationships that cannot be broken down to a mere aggregation of bilateral partnerships. Partners must interact across industries and thus form multilateral relationships (Adner, 2017). This

5
particular form of relationship turns ecosystems into complex systems (Brusoni & Prencipe, 2013; Clarysse et al., 2014; Moore, 1993).
Having touched upon an ecosystem’s general characteristics, the question arises of how they emerge. In essence, companies have to deliberately establish and groom ecosystems as they do not develop autonomously (Adner, 2017; Jacobides et al., 2018). In other words, it requires a conscious and intentional effort for an ecosystem to emerge (Jacobides et al., 2018). In order to establish an ecosystem, companies not only have to identify potential partners, but they also have to settle on a joint value proposition (Adner, 2017; Moore, 1993). This mechanism will be further explained in Chapter 1.2.2. Furthermore, the ecosystem’s distinctive properties pose a number of challenges to its partners (Adner, 2017; Jacobides et al., 2018). Similar to the ecosystem as a whole, the value proposition is characterized by modularity. The value proposition, thus, consists of different modules, which are both non-generic and complementary. Hence, each partner’s contribution to the value proposition has to be specifically developed and only the aggregated totality of all contributions results in the full customer value (Jacobides et al., 2018). As a result, there is a strong mutual dependency among the partners and a single firm’s isolated contribution to the ecosystem is of relatively little value. This dynamic creates a chicken-and-egg problem: Companies often demonstrate hesitation when it comes to joining an ecosystem as their adapted individual contribution loses its generic value (Dattée et al., 2018; Jacobides et al., 2018). A solution to overcoming this problem is for the companies that are leading ecosystem initiatives to convince and assure potential partners, as well as promote mutual alignment (Adner, 2017; Altman & Tushman, 2017; Jacobides et al., 2018). This consideration leads the way to the specific measures a driving company – or orchestrator – has to take for the whole ecosystem to succeed. The study at hand accordingly aims to analyze the construction of an ecosystem. Looking at the type of company inclined to join an ecosystem, it can further be argued that ecosystems are especially attractive for start-ups as they allow for innovation and development a single firm would not be able to attain alone due to limited resources of all kinds (Adner, 2006; Chesbrough, 2006; Fjeldstad et al., 2012; Moore, 1993, 2006). Regarding a company’s position in an ecosystem, the question arises of whether and how startups take up the orchestrator role (e.g. Jacobides et al., 2018). As shown by many real-life examples and previous research (cf. Kiron et al., 2013; Lindgardt et al., 2009), competitive advantage and, thus, profits are often not dependent solely on unique ideas or products, but rather benefit most from an innovative business

6
model (Gassmann et al., 2014). As a result, this thesis will offer further analysis on these conditions and dynamics that are present in the ecosystem business model.
Attempt at a Definition
1.2.1 Terminology and Comparison to Natural Ecosystems
The concept of business ecosystems, first introduced by Moore (1996), was derived from the idea of a self-regulated ecological ecosystem. In his contribution to The Antitrust Bulletin (2006) on business ecosystems, Moore states:
“Like the idea of democracy galvanizing a society, the idea of a business ecosystem provides a vision and proof of concept that multiple contributors with differing interests can join in common cause.” (p. 55).
With this quote, Moore (2006) hints at what the different actors in an ecosystem have in common and what brings them together, despite differing interests – the joint value proposition. In that sense, an ecosystem is a network based on both competition and cooperation. Still, the question of what specific characteristics define a business ecosystem remains.
Ritala and Almpanopoulou (2017) argue that in order to achieve a consistent definition of the term ecosystem, attention has to be given to both the eco and the system aspects of an ecosystem. The prefix eco implicitly suggests an analogy to ecology or natural ecosystems (cf. Moore, 1993; Oh et al., 2016; Ritala & Almpanopoulou, 2017). While a number of authors argue in favor of such an analogy or simply make use of it (e.g. Geels, 2002; Huggett, 2011; Pickett & Cadenasso, 2002; Ritala & Almpanopoulou, 2017; Zahra & Nambisan, 2012), others (partly) question its applicability or leave it behind altogether (e.g. Oh et al., 2016; Papaioannou et al., 2009). Introduced to management studies by Moore (1993), the ecosystem concept relates to the idea that every entity in an ecosystem exists in a network of interdependencies: Each actor affects and is affected by other actors and is, thus, part of a constant process of co-evolution within the ecosystem (Moore, 1993, 2006).
The second part of the term – system – refers to the totality of distinct components that exhibit interdependencies between each other, and therefore form the system as a whole, which is distinguished from other systems (Rogers, 2010; Von Bertalanffy, 1956). In management studies, ecosystem literature widely recognizes the applicability of a system science perspective (e.g. Hartvigsen et al., 1998; Peltoniemi, 2006). When taking the innovative capabilities of an ecosystem into consideration, existing research

7
depicts business ecosystems as a form of complex adaptive system (e.g. Anderson, 1999; Cilliers, 2005; Durst & Poutanen, 2013; Xiaoren et al., 2014). In the past 30 years of management research, a number of authors have compared business dynamics to natural ecosystems (e.g. Hannan & Freeman, 1989; Moore, 1993; Nelson & Winter, 1982; Schot, 1998). Notably, Huggett (2011) creates a link between emergent business models and biological observations. This comparison is especially interesting when considering the start-up focus of this thesis.
Mainly due to the accessibility it creates for readers who are not familiar with the ecosystem topic, the natural ecosystem metaphor attained a certain popularity in social sciences and economics, including the field of business ecosystem research (Corallo et al., 2007; Corallo & Protopapa, 2007; Pickett & Cadenasso, 2002). Accordingly, the mentioned analogy finds its place in state-of-the-art ecosystem research (see Chapter 1.3). First, it is important to highlight its limits while diving further into the ecosystem terminology. In today’s time of globalization, a big limitation of the natural ecosystem analogy is its roots in territorial conditions. While natural ecosystems can be big in size, they are local (i.e. the Sahara Desert). Conversely, business ecosystems can be globally dispersed. Moreover, a comparison to natural ecosystems seems flawed in light of the designed and purposeful character of a business ecosystem. While natural ecosystems are the product of natural development and coincidence, business ecosystems must be designed and intentionally developed (Corallo & Protopapa, 2007; Dattée et al., 2018; Jacobides et al., 2018; Papaioannou et al., 2009). Business ecosystems change, adapt and evolve over time, which is both in contrast to and yet comparable with ecological or biological ecosystems (Zahra & Nambisan, 2012).
The terms ‘business ecosystems’ and ‘innovation ecosystems’ are often applied synonymously in existing ecosystem literature (e.g. Aarikka-Stenroos & Ritala, 2017; Adner, 2017; Gawer & Cusumano, 2014; Jacobides et al., 2018; Ozalp et al., 2018; Williamson & de Meyer, 2012). In a recent literature review, de Vasconcelos Gomes et al. (2018) were able, however, to identify a transition in literature ‘from business ecosystem to innovation ecosystem’ (p. 30). On that same note, the question of how different ecosystem concepts are distinguished arises. The next subchapter therefore aims to answer this question and equally differentiate ecosystems from other governance forms aimed at the co-creation of value.

8
1.2.2 Differentiation of Ecosystem Concepts and Comparison to Other Systems
With multilateralism as a differentiating characteristic (see Chapter 1.1.2), ecosystems can be distinguished from other configurations of activities and actors aimed at the materialization of a value proposition, such as platforms or networks (Adner, 2017). These constructs do, however, have some components in common with ecosystems, creating certain overlaps (Adner, 2017; Altman & Tushman, 2017; Gawer & Cusumano, 2014; Jacobides et al., 2018). It is therefore important to specifically differentiate ecosystems from other constructs of interdependence. New technologies reducing transaction costs made way for the rise of ecosystems (Adner, 2017; Baldwin & von Hippel, 2011), which was crucial given the ecosystem’s necessity for collaboration (Adner & Kapoor, 2010; Jacobides et al., 2018; Moore, 1996; Teece, 2016). Ecosystems structurally resemble networks and can be viewed as a web of alliances (Jacobides et al., 2018). Nevertheless, alliances and ecosystems only overlap partly and alliances ‘clearly represent a very specific subset of them’ (Jacobides et al., 2018). The fact that partners within an ecosystem are indispensable for the materialization of a joint value creation (Adner, 2017) distinguishes ecosystems from platforms (e.g. Gawer & Cusumano, 2002; Parker et al., 2016a), networks (e.g. Gulati, 1998, 1999; Gulati et al., 2000; Powell et al., 1996), or multi-sided markets (Hagiu & Wright, 2015; Rochet & Tirole, 2003). Research examining network or alliance constructs focuses on the interactions between the individual firms (e.g. Gulati et al., 2012; Powell et al., 1996). Ecosystem research takes this one step further and focuses on the purpose behind the collaboration between ecosystem members (i.e. the joint value proposition). However, the findings from the related field of platform research should not be entirely ignored when looking at the topic of ecosystems. The mechanisms found in platforms, especially the interconnection of complementors via the platform, yield valuable insights for ecosystem research (e.g. Gawer & Cusumano, 2002; Parker et al., 2016a). Aspects such as applied technology, network effects, or the study of inter-partner transactions (cf. Eisenmann et al., 2011; Gawer, 2014) are equally important for the examination of ecosystems.
Moreover, a comparison of ecosystems and alliances shows that the literature streams for both ecosystem research and network and alliance literature indicate a specific overlap: In certain situations, ecosystems and alliances can serve the same purpose. Network and alliance literature predominantly focuses on information and knowledge exchange for the establishment of theoretical and conceptual constructs (Ahuja, 2000; McEvily & Zaheer, 1999; Muthusamy & White, 2005; Powell, 1998; Powell et al.,

9
1996; Uzzi, 1996). Similarly, the exchange of information and knowledge (see also knowledge ecosystem) can be actively promoted by the instalment of an ecosystem. These two constructs of interdependency can therefore, and in certain situations, have the same generic motive.
The specific differences between different ecosystem forms will be elaborated upon in the following paragraphs. Differentiation of ecosystem concepts In existing ecosystem research, the ecosystem metaphor has not yet been clearly defined and, thus, a number of different – but not clearly distinguished – ecosystem concepts can be found in literature (de Vasconcelos Gomes et al., 2018; Valkokari, 2015).
Valkokari (2015) states that it is beneficial to distinguish the different ecosystem concepts along the lines of the ecosystem outcomes, the logic of the action (i.e. the rules), the interactions, and the actor roles. In an attempt to fill this gap in research, she names and distinguishes three main ecosystem concepts: (1) business ecosystems, (2) innovation ecosystems, and (3) knowledge ecosystems. Additionally, it is useful to further define and distinguish (4) platform ecosystems (Ceccagnoli et al., 2011; Cennamo & Santalo, 2013; Gawer, 2014; Gawer & Cusumano, 2014), as well as (5) entrepreneurial ecosystems (Acs et al., 2017; Prahalad, 2009).
The following subchapters will give a brief overview of the concepts named above, which will be summarized in Table 1 by comparing the different types of ecosystems.

10
Table 1: Overview of different ecosystem types
The first concept – business ecosystems – is defined in line with the definition provided by Moore (1996). As mentioned above, the interdependent relationship between distinct modules distinguishes business ecosystems from other governance forms aimed at the co-creation of value and other concepts within strategic management (Adner, 2017; Teece, 2007, 2016). The noteworthy definition in ecosystem literature comes from Moore (1996), who defines a business ecosystem as ‘an economic community supported by a foundation of interacting organizations and individuals – the organisms of the business world’ (p. 26). The majority of existing ecosystem research focuses on a business ecosystem’s role in creating competitive advantage or value for the ecosystem actors, as well as for the ecosystem as a whole (Adner, 2012; Adner & Kapoor, 2010; Iansiti & Levien, 2004a). In this stream of literature, business ecosystems are described as coordinative systems, which serves an economic purpose and rely on a multitude of interdependent actors that produce complementary and modular products and services (Adner & Kapoor, 2010; Iansiti & Levien, 2004a; Jacobides et al., 2018; Williamson & de Meyer, 2012). A business ecosystem is therefore aimed at resource exploitation for the creation of a joint value proposition (cf. Jacobides et al., 2018; Valkokari, 2015). Further, the business ecosystem can be seen as a global coalition of competitive and cooperative relationship ties, and operates around a focal firm with the goal of simultaneous value creation and capture through the combination of

11
complementary resources (Adner, 2017; Jacobides et al., 2018; Milinkovich, 2008; Valkokari, 2015)). The orchestrator’s role in aligning the ecosystem is central (Adner, 2017). The business ecosystem is characterized by the driving capacities of the ecosystem orchestrator (cf. Dattée et al., 2018; Jacobides et al., 2018). In this context, the variety and increased number of ecosystem entities in a business ecosystem differentiates it from other governance forms aimed at the capture of value, such as networks (Heikkil & Kuivaniemi, 2012).
As suggested above, the innovation ecosystem is not clearly defined and, therefore, the concept and the term are used ambiguously (Oh et al., 2016; Ritala & Almpanopoulou, 2017). In a recent study, de Vasconcelos Gomes et al. (2018) found a shift from the use of the term business ecosystem to the term innovation ecosystem. The authors discovered that the terms are distinguished from one another since the term business ecosystem relates to value capture, while the term innovation ecosystem focuses on value creation (de Vasconcelos Gomes et al., 2018). Adner and Kapoor (2010) refer to the innovation ecosystem in relation to its effect on firm performance. Similarly, Adner (2006) defines innovation ecosystems as ‘[…] the collaborative arrangements through which firms combine their individual offerings into a coherent, customer-facing solution’ (p. 2). In both of these articles, a focus on value creation becomes apparent, which is in line with the idea suggested by de Vasconcelos Gomes et al. (2018). On a more general note, Jackson (2011) defines an innovation ecosystem as ‘the complex relationships that are formed between actors or entities whose functional goal is to enable technology development and innovation’. van der Borgh et al. (2012) locate ecosystem value in innovation on either the individual company level or a subordinate innovation community. From the statements above, it becomes clear how closely related the concepts of innovation ecosystems and business ecosystems are. When looking at the aspect of ‘change’ in an innovation ecosystem, its ultimate goal is the co-creation of value through the implementation of a clear innovation strategy (Adner, 2006). Lastly, and to summarize this differentiation, it should be noted that the innovation ecosystem integrates certain aspects of other forms of ecosystems as it needs both the exploration (knowledge) and exploitation (business) aspects of ecosystem dynamics in order to generate novelty (Valkokari, 2015). I therefore define business ecosystems and innovation ecosystems as similar concepts, but nevertheless want to highlight the focus on innovative capacities in the latter as this aspect distinguishes these two types of ecosystems from each other. The graphic below, Figure 2, visualizes the separation of the two definitions at a certain stage. However, according to the literature stream, the

12
two concepts eventually merge to form one definition. For this reason, the business ecosystem and the innovation ecosystem are also summarized in the same column in Table 1.
Figure 2: Visualization of the merger of business and innovation ecosystems
A related stream of ecosystem research focuses on ecosystems surrounding a platform. The primary scope of this literature stream is the relationship between different customer groups via a physical or virtual platform (Evans & Schmalensee, 2016; Parker & Van Alstyne, 2005; Rochet & Tirole, 2003). Importantly, and as described in the paragraph above, an ecosystem rarely has a platform at its core (Autio & Thomas, 2014; Thomas et al., 2014). Consequentially, a platform is not a defining characteristic of an ecosystem in general (Gawer, 2014). Rather, a platform ecosystem differs from other ecosystem forms. In a platform ecosystem, the supply side performs the role of complementor by co-creating complementary products (e.g. Alt et al., 2010; Lucas Jr & Goh, 2009). These complementors utilize boundary resources provided by the platform provider (Ghazawneh & Henfridsson, 2013) to co-create precisely defined products or services (Boudreau, 2012). On the other side, customers in a platform ecosystem can be defined as the beneficiaries and compensators as they provide compensation through payments or by providing data. These data can be analyzed by the platform provider to increase the product quality, to tap into new markets, and to further develop the platform (Eisenmann et al., 2011). From an economic perspective, platform ecosystems are specific markets, which act as facilitators in creating mutual

13
exchange between heterogenous consumer groups that would not otherwise interact (Gawer, 2014). The platform provider aims to meet the needs of these customer groups while exploiting the positive network externalities (Ceccagnoli et al., 2011; Linder et al., 2003; Rochet & Tirole, 2003). These network externalities can be defined as the value of the ecosystem as it relates to the number of interactions within a platform ecosystem. Thereby, the value creation can be described as the result of scaled growth from provider and customer interactions (Eisenmann et al., 2011). The more interactions the platform allocates, the more valuable it is due to a greater variety of products and services (Scholten & Scholten, 2012). In this context, experts also refer to network effects that can be achieved by a platform. Thereby, the direct network effect can be described as a simple network effect: the increasing utility of a product or service simultaneously increases the value for the user (Kapoor & Lee, 2013). In this regard, WhatsApp is a good example to demonstrate the occurrence of these network effects. However, it should be noted that WhatsApp is used as an example of network effects in a one-sided market and is not directly related to the ecosystem concept. The application (app) can be defined a one-sided market as it basically only adds value for the user and network effects increase with the increasing number of users. This means that when WhatsApp was initially only being used by a small number of users, each new user added a higher value to the platform. However, the greater the number of users using the app, the lower the added value was for each new user. At some stage, an optimum number of users (U*) was achieved and WhatsApp’s main responsibility started to focus on continuous improvement of the app in order to remain competitive. In this vein, WhatsApp may not provide the highest security, but it benefits from the number of users using the app compared to other communication apps (e.g. Signal). At this point, the platform is scaled more by its size and less by its innovation.
In addition to the one-sided market, there can also be a two-sided platform market (Thomas & Autio, 2020). In the context of the two-sided market, the provider faces the well-known chicken-and-egg problem. The problem occurs any time the value proposition for two different groups is dependent on penetration. This means that the platform provider needs to subsidize the separate actors in an early stage of the ecosystem development to exploit the optimum network externalities (N*) later on. If the platform reaches N*, the ecosystem scales almost by itself as the added value is beneficial to all actors. Apple's App Store can be used as an example in this context: In the beginning the company had to subsidize individual providers to ensure the competitiveness of the App Store. Nowadays, Apple first submits new developed apps
14
to a quality and security assessment before they are available in the App Store. In order to continuously benefit from external network effects, Apple must ensure the continued improvement of the iPhone and the provided apps, as the iPhone and the apps provide the platform for the interactions between provider and customer, and ensure that Apple receives the profits from its network effects.
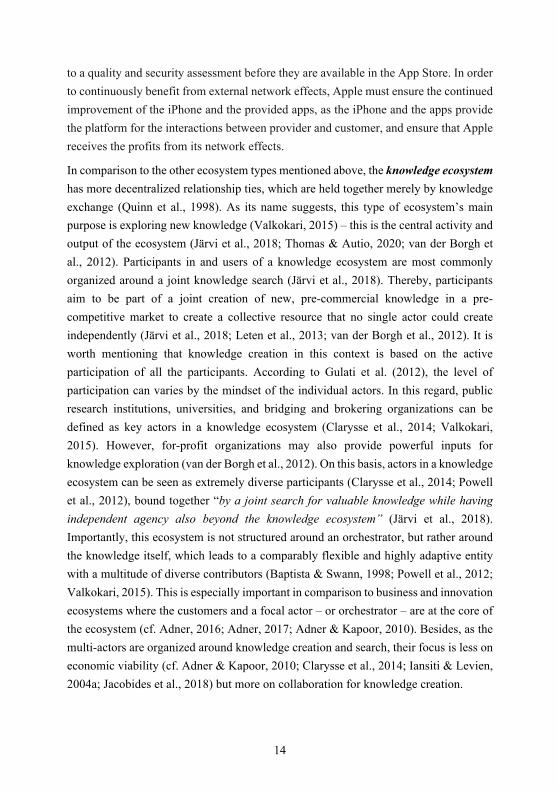
In comparison to the other ecosystem types mentioned above, the knowledge ecosystem has more decentralized relationship ties, which are held together merely by knowledge exchange (Quinn et al., 1998). As its name suggests, this type of ecosystem’s main purpose is exploring new knowledge (Valkokari, 2015) – this is the central activity and output of the ecosystem (Järvi et al., 2018; Thomas & Autio, 2020; van der Borgh et al., 2012). Participants in and users of a knowledge ecosystem are most commonly organized around a joint knowledge search (Järvi et al., 2018). Thereby, participants aim to be part of a joint creation of new, pre-commercial knowledge in a pre-competitive market to create a collective resource that no single actor could create independently (Järvi et al., 2018; Leten et al., 2013; van der Borgh et al., 2012). It is worth mentioning that knowledge creation in this context is based on the active participation of all the participants. According to Gulati et al. (2012), the level of participation can varies by the mindset of the individual actors. In this regard, public research institutions, universities, and bridging and brokering organizations can be defined as key actors in a knowledge ecosystem (Clarysse et al., 2014; Valkokari, 2015). However, for-profit organizations may also provide powerful inputs for knowledge exploration (van der Borgh et al., 2012). On this basis, actors in a knowledge ecosystem can be seen as extremely diverse participants (Clarysse et al., 2014; Powell et al., 2012), bound together “by a joint search for valuable knowledge while having independent agency also beyond the knowledge ecosystem” (Järvi et al., 2018). Importantly, this ecosystem is not structured around an orchestrator, but rather around the knowledge itself, which leads to a comparably flexible and highly adaptive entity with a multitude of diverse contributors (Baptista & Swann, 1998; Powell et al., 2012; Valkokari, 2015). This is especially important in comparison to business and innovation ecosystems where the customers and a focal actor – or orchestrator – are at the core of the ecosystem (cf. Adner, 2016; Adner, 2017; Adner & Kapoor, 2010). Besides, as the multi-actors are organized around knowledge creation and search, their focus is less on economic viability (cf. Adner & Kapoor, 2010; Clarysse et al., 2014; Iansiti & Levien, 2004a; Jacobides et al., 2018) but more on collaboration for knowledge creation.

15
The last concept – entrepreneurial ecosystem – introduces the ecosystem concept to entrepreneurship. This line of thought focuses on the specific ecosystem structure of the environment surrounding an entrepreneur or entrepreneurial activities (Acs et al., 2017). The entrepreneurial ecosystem has some similar characteristics to related concepts – such as industrial districts, clusters, and business ecosystems. These similarities include having as economic value creation as a purpose (Pitelis, 2012; Stam & Spigel, 2017), an association of independent actors (Stam, 2015), and knowledge as a key source (Stam & Spigel, 2017). However, another stream of entrepreneurial ecosystem research describes fundamental differences between these related concepts. In this stream of literature, Isenberg (2011) suggests that an entrepreneurial ecosystem consists of six general domains: a conductive culture, enabling policies & leadership, availability of appropriate financial resources, quality human capital, venture friendly markets, and institutional and infrastructural support. These domains indicate a shift towards an economic view that is more focused on people, networks, and institutions. To illustrate this economic shift more clearly, the following table, Table 2, offers a detailed description of the six domains:

16
Table 2: Detailed description of six domains based on Isenberg (2011)
With regard to the interconnection of the domains described in the table above, it is relevant to mention that the six domains may not be considered as isolated from one another, but, on the contrary, are created through their interdependences (Stam & Spigel, 2017). Additionally, and unlike previous definitions of the term ‘ecosystem’ introduced by Moore (1993), Iansiti and Levien (2004a), or Adner (2017), an
Domain Description
Policy & Leadership Government and policies enhance commitment of entrepreneurs to a region as an attractive place for entrepreneurship (Feld, 2012). Thereby, policies should cover economic development, taxes, and investment vehicles (Isenberg, 2011).
Finance Availability of strong and supportive communities of venture capital funds, investors, and other forms of financing across sectors (Feld, 2012; Isenberg, 2011).
Culture Culture supports ambitious entrepreneurs and their appetite for growth. It enables creativity and experimentation, shows acceptance for failure, and celebrates innovation (Foster et al., 2013; Isenberg, 2011).
Supports Infrastructural support is given by providing co-working clusters, transportation, and telecommunication. Institutional support is given through conferences, entrepreneur-friendly associations, or business plan contests (Isenberg, 2011)
Human Capital Availability of a broad and deep pool of skilled talents in all fields and areas can be named as a key resource for enabling an entrepreneurial ecosystem (Stam, 2015). In this context, universities should be well connected with the entrepreneurial community. (Feld, 2012; Foster et al., 2013)
Markets Access to entrepreneur’s network and a connection to domestic markets; large/medium/small companies as customers to support entrepreneurial economic growth (Foster et al., 2013; Isenberg, 2011)
17
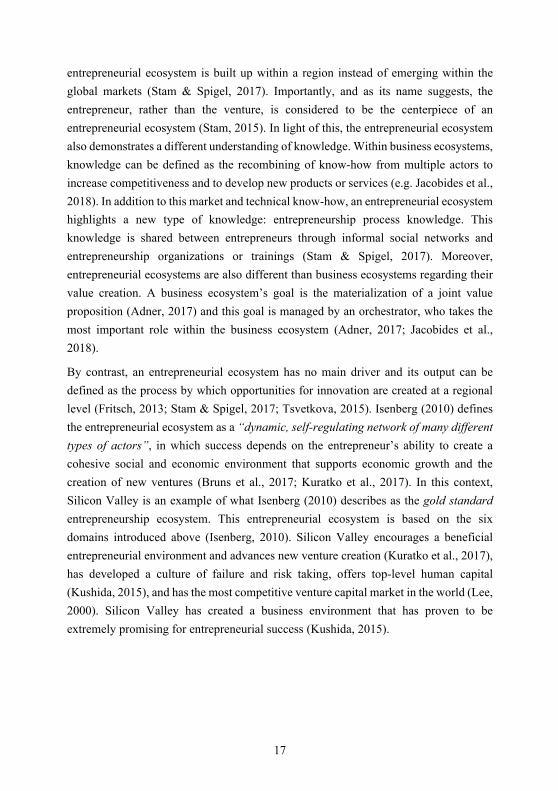
entrepreneurial ecosystem is built up within a region instead of emerging within the global markets (Stam & Spigel, 2017). Importantly, and as its name suggests, the entrepreneur, rather than the venture, is considered to be the centerpiece of an entrepreneurial ecosystem (Stam, 2015). In light of this, the entrepreneurial ecosystem also demonstrates a different understanding of knowledge. Within business ecosystems, knowledge can be defined as the recombining of know-how from multiple actors to increase competitiveness and to develop new products or services (e.g. Jacobides et al., 2018). In addition to this market and technical know-how, an entrepreneurial ecosystem highlights a new type of knowledge: entrepreneurship process knowledge. This knowledge is shared between entrepreneurs through informal social networks and entrepreneurship organizations or trainings (Stam & Spigel, 2017). Moreover, entrepreneurial ecosystems are also different than business ecosystems regarding their value creation. A business ecosystem’s goal is the materialization of a joint value proposition (Adner, 2017) and this goal is managed by an orchestrator, who takes the most important role within the business ecosystem (Adner, 2017; Jacobides et al., 2018).
By contrast, an entrepreneurial ecosystem has no main driver and its output can be defined as the process by which opportunities for innovation are created at a regional level (Fritsch, 2013; Stam & Spigel, 2017; Tsvetkova, 2015). Isenberg (2010) defines the entrepreneurial ecosystem as a “dynamic, self-regulating network of many different types of actors”, in which success depends on the entrepreneur’s ability to create a cohesive social and economic environment that supports economic growth and the creation of new ventures (Bruns et al., 2017; Kuratko et al., 2017). In this context, Silicon Valley is an example of what Isenberg (2010) describes as the gold standard entrepreneurship ecosystem. This entrepreneurial ecosystem is based on the six domains introduced above (Isenberg, 2010). Silicon Valley encourages a beneficial entrepreneurial environment and advances new venture creation (Kuratko et al., 2017), has developed a culture of failure and risk taking, offers top-level human capital (Kushida, 2015), and has the most competitive venture capital market in the world (Lee, 2000). Silicon Valley has created a business environment that has proven to be extremely promising for entrepreneurial success (Kushida, 2015).
18
State of the Art in the Literature about Ecosystems
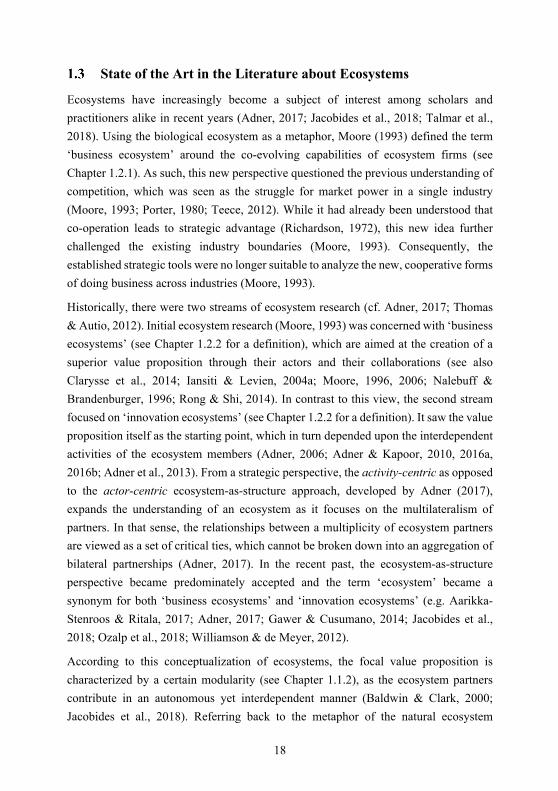
Ecosystems have increasingly become a subject of interest among scholars and practitioners alike in recent years (Adner, 2017; Jacobides et al., 2018; Talmar et al., 2018). Using the biological ecosystem as a metaphor, Moore (1993) defined the term ‘business ecosystem’ around the co-evolving capabilities of ecosystem firms (see Chapter 1.2.1). As such, this new perspective questioned the previous understanding of competition, which was seen as the struggle for market power in a single industry (Moore, 1993; Porter, 1980; Teece, 2012). While it had already been understood that co-operation leads to strategic advantage (Richardson, 1972), this new idea further challenged the existing industry boundaries (Moore, 1993). Consequently, the established strategic tools were no longer suitable to analyze the new, cooperative forms of doing business across industries (Moore, 1993).
Historically, there were two streams of ecosystem research (cf. Adner, 2017; Thomas & Autio, 2012). Initial ecosystem research (Moore, 1993) was concerned with ‘business ecosystems’ (see Chapter 1.2.2 for a definition), which are aimed at the creation of a superior value proposition through their actors and their collaborations (see also Clarysse et al., 2014; Iansiti & Levien, 2004a; Moore, 1996, 2006; Nalebuff & Brandenburger, 1996; Rong & Shi, 2014). In contrast to this view, the second stream focused on ‘innovation ecosystems’ (see Chapter 1.2.2 for a definition). It saw the value proposition itself as the starting point, which in turn depended upon the interdependent activities of the ecosystem members (Adner, 2006; Adner & Kapoor, 2010, 2016a, 2016b; Adner et al., 2013). From a strategic perspective, the activity-centric as opposed to the actor-centric ecosystem-as-structure approach, developed by Adner (2017), expands the understanding of an ecosystem as it focuses on the multilateralism of partners. In that sense, the relationships between a multiplicity of ecosystem partners are viewed as a set of critical ties, which cannot be broken down into an aggregation of bilateral partnerships (Adner, 2017). In the recent past, the ecosystem-as-structure perspective became predominately accepted and the term ‘ecosystem’ became a synonym for both ‘business ecosystems’ and ‘innovation ecosystems’ (e.g. Aarikka-Stenroos & Ritala, 2017; Adner, 2017; Gawer & Cusumano, 2014; Jacobides et al., 2018; Ozalp et al., 2018; Williamson & de Meyer, 2012).
According to this conceptualization of ecosystems, the focal value proposition is characterized by a certain modularity (see Chapter 1.1.2), as the ecosystem partners contribute in an autonomous yet interdependent manner (Baldwin & Clark, 2000; Jacobides et al., 2018). Referring back to the metaphor of the natural ecosystem

19
mentioned above (Moore, 1996), modularity of the joint value proposition helps the ecosystem to grow, flourish, and evolve. The growth of an ecosystem is attained by a modular configuration of the activities and actors, which is aimed at alignment (Adner, 2017). According to Adner (2017), the structure of an ecosystem is defined by four elements: the actors (actors undertaking activities in an ecosystem) and their activities (action, input), which need to be aligned through their positions (location of the firm in the flow of activities) and links (transfer across actors).
Moreover, researching the type of companies joining ecosystems is as compelling as the mechanics of an ecosystem. Considering a company’s resource level and capabilities, scholars have been questioning whether startups are suited as corporate firms to take up the orchestrator role (e.g. Jacobides et al., 2018). Two contradictory perspectives can be identified in existent literature. A substantial body of research posits that corporations possess a fundamental advantage regarding their orchestrating capabilities due to their size and resources – and are therefore prone to take the role of the orchestrator in an ecosystem (Adner, 2017; Dhanaraj & Parkhe, 2006; Iansiti & Levien, 2004b; Jacobides et al., 2018). However, a number of scholars (Brusoni & Prencipe, 2013; Gulati et al., 2012; Helfat & Raubitschek, 2018; Williamson & de Meyer, 2012) suggest that startups are suited to be orchestrators as they possess not only the necessary flexibility and an understanding of partners, but also credibility and influence due to specific knowledge or an important module.
Looking at the vast amount and totality of literature introduced above, certain gaps in understanding become apparent. The following paragraphs therefore aim to give an overview of the unclarified areas in ecosystem literature that have motivated my research.
Research gaps derived from existing literature
An ecosystem’s joint value proposition can be materialized through a process of co-creation (Adner, 2017). From a strategic perspective, a way to achieve this is for a driving company to encourage alignment among the partners through orchestration (Adner, 2017; Altman & Tushman, 2017; Jacobides et al., 2018). Despite an increasing consensus among scholars that the mechanisms of value co-creation need to be revisited in the ecosystem context (e.g. Adner, 2017; Adner & Kapoor, 2010; Meynhardt et al., 2016), existing literature falls short of providing a comprehensive understanding while including the central aspect of orchestration. While related research provides theoretical frameworks on how value co-creation can be promoted by platform owners (e.g.

20
Eisenmann et al., 2009; Parker & Alstyne, 2008), ecosystem research lacks a similar inquiry of value co-creation.
The idea that an orchestrator drives the success of an ecosystem (e.g. Adner, 2017; Jacobides et al., 2018) implies that specific measures exist, which a driving company must undertake in order for the whole ecosystem to succeed. Consequently, a number of additional issues need to be considered: How can orchestrators define the focal value proposition? How should potential partner companies be localized and selected? In what order are partners added to the ecosystem? How can the orchestrator generate an understanding of the partners’ individual agendas in order to facilitate alignment and commitment? The necessity and relevance of these questions has been expressed in previous research (Hannah & Eisenhardt, 2018; Jacobides et al., 2018). With the exception of Dattée et al. (2018), previous studies have, however, neglected to investigate these gaps while maintaining a focus on the orchestrator’s role in the ecosystem. Previous ecosystem research has therefore been unable to give sufficient answers to the aforementioned issues.
Secondly, existing literature generally questions a startup’s ability to fulfill the tasks of orchestration and therefore remains under-researched. While research provides theoretical frameworks on how corporations orchestrate ecosystems, streams of research have failed to examine startups in an ecosystem while maintaining a focus on orchestration. Both ecosystem and startup literature has therefore failed to specifically investigate cases in which startups take the role of the ecosystem orchestrator (Adner, 2017; Jacobides et al., 2018).
Finally, the emphasis shift towards an ecosystem as a new form of cooperation that can be measured through innovation input (research & development (R&D) costs) and innovation output (Gerybadze et al., 2010). In this regard, research has proven positive effects of R&D on a firm’s performance (Gerybadze et al., 2010; Park et al., 2018), and conducted studies have additionally highlighted the importance of innovation and R&D. However, due to the lack of studies emphasizing the relationship between R&D investments, corporate success, and financial performance (Baumann & Kritikos, 2016; Gerybadze et al., 2010), the impact of ecosystems on R&D costs remain unexplored. More specifically, the relationship of innovation input as R&D intensity and ecosystems as a new way of cooperating remain under-researched. Figure 3 aims to give an overview of all the gaps found in the existing research that inspired this dissertation.

21
Figure 3: Summary of research gaps in current literature
Research Questions and Outline of the Thesis
1.4.1 Research Questions to be Addressed by the Thesis
The dissertation aims to close the research gaps described above. The overall goal of this thesis is to provide an answer to the following research question:
Q: How can companies create innovation through ecosystems?
This research question is guided by three sub-questions, which will be addressed by three studies. Study 1 provides a better understanding of ecosystem development, and develops specific approaches and recommendations for value proposition search, partner search, and the order of adding partners to the ecosystem. This analysis is guided by the following research question:
Q1: How does a firm set up an ecosystem and the role of organizational search for finding and integrating potential ecosystem partners?
The research conducted for study 2 is based on study 1. The analysis in study 1 has proven, contrary to existing literature, that startups can overcome their disadvantages and fulfil the requirements to orchestrate an ecosystem. On the basis of this realization in study 1, the second sub-question arose. More precisely, the question to be answered is:
22
Q2: How do startups orchestrate ecosystems?
Based on the insights ascertained in study 2 showing that startups can orchestrate ecosystems successfully, despite their lack of resources (e.g. R&D expenditures), my third research question developed. Study 3 discusses the impact of ecosystems on innovation input as R&D intensity, as existing literature has not yet explored this relationship precisely. As a result, this third study addresses the following sub-question:
Q3: Does the fact that companies claim to innovate in ecosystems or with partners have an influence on their R&D budgets?
1.4.2 Thesis Outline
The aim of the dissertation is to create an overview of the orchestration of innovation in ecosystems. More precisely, it examines how ecosystems are developed, managed, and what potential they provide for companies of all sizes. For this reason, attention is paid to specific characteristics that affect the entire ecosystem (cf. Brusoni & Prencipe, 2013; Dattée et al., 2018; Jacobides et al., 2018). At present, it is rarely studied how firms build up ecosystems (Dattée et al., 2018). The noteworthy exception, Dattée et al. (2018), has focused on the question of how ecosystem orchestrators come up with a compelling vision for the ecosystem, even in situations of high uncertainty, in order to convince prospective partners to join. There is no empirical analysis that examines the development of ecosystems in general and their relevant characteristics of value proposition search, partner search, and the order of partners joining as inter-related functions. For this reason, the first study of the dissertation is nestled around the core challenges that evolved for the orchestrator when building up the ecosystem. To address these challenges, I first focus on the question of how the orchestrator searched for and identified suitable partners. In this regard, two types of orchestrators could be found: those with extensive networks and knowledge related to the field of business the ecosystem focuses on, and those without extensive networks or knowledge. Whilst the latter were searching for potential partners by themselves and were easily able to identify their agendas and pain-points, the first type of orchestrator relied entirely on partners, who functioned as scouts. Such scouts were, for example, accelerators, established companies with extensive networks, or consultants. Thus, orchestrators lacking the network and knowledge to find suitable partners were always delegating this task to scouting partners.

23
Second, the orchestrators were facing a chicken-and-egg problem: Since all partners are needed to form the joint value proposition in an ecosystem, and every partner must invest in the creation of its individual module for the joint value proposition (Jacobides et al., 2018), it is natural that no partner wants to be the first to commit. So how can an orchestrator convince a potential partner to be the first one to enter the ecosystem, invest in the respective module, and lay the foundation for all the subsequent partners to join? I found that the orchestrator needs to try to first integrate the partner contributing the most crucial module for the joint value proposition. If this firm is a founding member of the ecosystem, additional partners are more likely to join since they know that the most crucial partner has already committed. In one case, the orchestrator did not manage to convince a founding partner and was therefore unable to attract other partners; they were understandably reluctant to join an ecosystem knowing that their contributions would not be enough and that their success would be dependent upon the orchestrator’s ability to convince a partner capable of providing the core module to join.
Third, I strived to understand how an orchestrator convinced partners to commit to an ecosystem. For the partners, this turned out to be a decision made based on a risk-benefit reasoning. If the risk was minor compared to the expected benefit, they were likely to step into the ecosystem if the orchestrator was able to evoke a compelling vision of the ecosystem. If the risk-benefit relation was not as favourable, the orchestrator needed to build up credibility first. In cases where a scouting partner was involved, this partner appeared to help achieve this goal: a well-known scouting partner can demonstrate the credibility of the orchestrator. Additionally, a strong technology, reputable managers, or a strong track record were valuable tools to help an orchestrator increase its credibility as a suitable ecosystem leader. In addition, I found that the choice of partners also affects the long-term development of the ecosystem: The first partner typically determines the future path of the ecosystem, since it is likely to set the focus on its own fields of business and implicitly (by providing a network and knowledge) or explicitly (by using power) steers the ecosystem in a specific direction.
Considering my second analysis - the situation of startups as orchestrators of ecosystems - two contradictory perspectives can be identified. A large number of scientists believe that established companies have a significant advantage due to their access to available resources as well as their size, and are therefore more suitable for the role of orchestrator (Adner, 2017; Dhanaraj & Parkhe, 2006; Iansiti & Levien, 2004b; Jacobides et al., 2018). On the other hand, there are researchers (Brusoni & Prencipe, 2013; Gulati et al., 2012; Helfat & Raubitschek, 2018; Williamson & de
24
Meyer, 2012) who suggest startups for the role of orchestrator because they have, for example, an understanding of their partners or the necessary flexibility. To bring clarity to the discussion and close the research gap on how startups orchestrate ecosystems, my second study examines ecosystems that are successfully orchestrated by startups. The resulting framework will support founders, corporations, and investors.
Lastly, the shift towards an ecosystem value that includes customer value and value for all ecosystem partners (Parker et al., 2016a) considers innovation as one of the main possibilities for firms to adapt to these changing business environments (Gerybadze et al., 2010; Lome et al., 2016). However, for now, existing literature focuses on the impact of business model components on ecosystems (Madsen, 2020), on ecosystems as a new kind of partnership to meet customer expectations (Adner, 2017; Jacobides et al., 2018), and on the correlation between a company’s expenditures on innovation and its overall financial performance (Jaruzelski et al., 2018). Although research points out the relationship between cost and innovation, the link to ecosystems has not yet been considered. R&D costs should decrease as an ecosystem is formed, as it allows companies to focus on their core value propositions to generate new innovation that results from the knowledge acquired by the whole merger. To determine whether this logic is valid, and to close the gap between ecosystem and R&D costs, my third analysis aims to discover the impact of ecosystems on innovation as R&D intensity. The findings highlight the relationship between innovation in terms of R&D intensity and ecosystems.
To successfully explore the above-mentioned research gaps, this dissertation uses two methodological approaches. It is based on two qualitative case studies and one quantitative text mining analysis. The former methodology will answer the open ‘why’ and ‘how’ questions (Eisenhardt, 1989; Yin, 2014). In order to be able to guarantee that the results are of a general nature, the individual studies are based on data from multi-case studies (Eisenhardt, 1991; Ozcan & Eisenhardt, 2009). The latter methodology allows a broad evaluation of the R&D intensity and enables the count of specific words related to ecosystems and R&D in a broad pool of data. The next subchapter summarizes the main features of this thesis to give an overview of the structure of my dissertation.
25
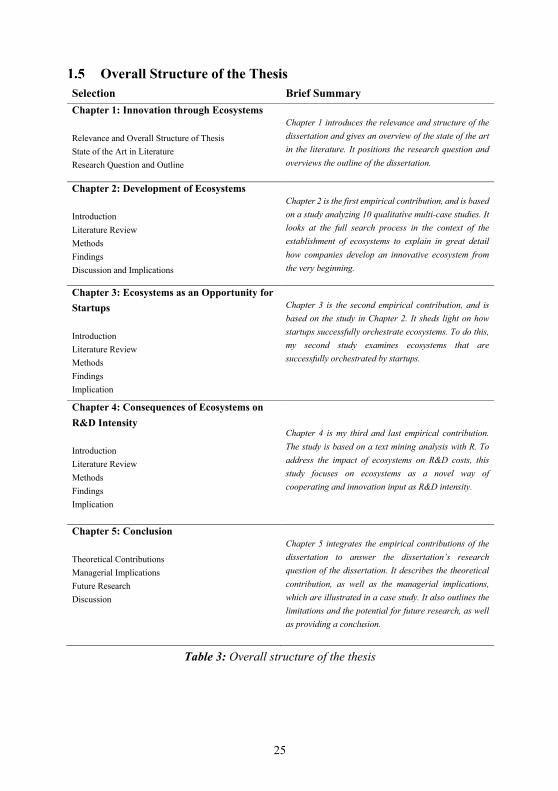
Overall Structure of the Thesis Selection Brief Summary Chapter 1: Innovation through Ecosystems Relevance and Overall Structure of Thesis State of the Art in Literature Research Question and Outline
Chapter 1 introduces the relevance and structure of the dissertation and gives an overview of the state of the art in the literature. It positions the research question and overviews the outline of the dissertation.
Chapter 2: Development of Ecosystems Introduction Literature Review Methods Findings Discussion and Implications
Chapter 2 is the first empirical contribution, and is based on a study analyzing 10 qualitative multi-case studies. It looks at the full search process in the context of the establishment of ecosystems to explain in great detail how companies develop an innovative ecosystem from the very beginning.
Chapter 3: Ecosystems as an Opportunity for Startups Introduction Literature Review Methods Findings Implication
Chapter 3 is the second empirical contribution, and is based on the study in Chapter 2. It sheds light on how startups successfully orchestrate ecosystems. To do this, my second study examines ecosystems that are successfully orchestrated by startups.
Chapter 4: Consequences of Ecosystems on R&D Intensity Introduction Literature Review Methods Findings Implication
Chapter 4 is my third and last empirical contribution. The study is based on a text mining analysis with R. To address the impact of ecosystems on R&D costs, this study focuses on ecosystems as a novel way of cooperating and innovation input as R&D intensity.
Chapter 5: Conclusion Theoretical Contributions Managerial Implications Future Research Discussion
Chapter 5 integrates the empirical contributions of the dissertation to answer the dissertation’s research question of the dissertation. It describes the theoretical contribution, as well as the managerial implications, which are illustrated in a case study. It also outlines the limitations and the potential for future research, as well as providing a conclusion.
Table 3: Overall structure of the thesis

26
This dissertation contains material from working papers that were presented in earlier stages at scientific conferences (ISPIM, 2018 & 2019; DRUID, 2019) and are currently under review in scientific journals. Specifically, Chapter two, three and four are built on working papers.
I hereby declare that I have written most of the content of the following chapters.
In Chapter two, I contributed 90% of the Introduction, 80% of the Literature Review, 80% of the Methods, 95% of Data Collection and Data Analysis, 90% of the Findings, 60% of the Implications.
In Chapter three, I contributed 70% of the Introduction, 70% of the Literature Review, 80% of the Methods, 100% of Data Collection and Data Analysis, 80% of the Findings, 80% of the Implications.
In Chapter four, I contributed 100% of the Introduction, 100% of the Literature Review, 70% of the Methods, 10% of Data Collection, 60% Data Analysis, 70% of the Findings, 70% of the Implications.
Of course, my co-authors contributed substantially to these manuscripts with their reviews, edits, changes and feedback. Accordingly, parts of this dissertation could bear striking resemblance or correspond literally to my own future publications.

27
2 No One can Whistle a Symphony – How Firms Search for
Potential Value Propositions and Partners in Building-up
an Ecosystem1
2.1. Introduction
In order to make use of the tempting opportunities provided by ecosystems, firms driving ecosystem initiatives, the orchestrators, must build them up, since ecosystems do not emerge by themselves (Dattée et al., 2018; Jacobides et al., 2018). Following the definition of an ecosystem, such build-up is based on defining a promising value proposition for the ecosystem´s customer(s) and identifying suitable partners for its implementation, especially as ecosystems partners intrinsically depend upon one another to create value for customers (Hannah & Eisenhardt, 2018). On top of this, one of the key characteristics of an ecosystem is the fact that the orchestrator cannot fully control the partners hierarchically. This implies a certain co-ordination among all parties in the ecosystem, and requires orchestrators to understand the interests of potential partners in order to convince them to commit to the ecosystem (Altman & Tushman, 2017; Dattée et al., 2018; Jacobides et al., 2018). Also, the aspect of co-ordination among ecosystem partners leads to an additional complication: Issues that arise in the context of ecosystem establishment have to be solved through co-ordination of the partners involved, which is why the establishment of ecosystems is not entirely driven by foresight but rather an iterative process with some element of trial-and-error involved (Jacobides et al., 2018). As a consequence, defining the ecosystem´s value proposition and identifying suitable partners and understanding their interests is not a straight-forward process, but rather an iterative process, which makes it necessary to study these three steps comprehensively and not in isolation. Surprisingly, while research in other fields has dealt extensively with the question of how firms perform the iterative processes of defining the value proposition and partner search (Foss & Saebi, 2018; Teece, 2018b), previous research on ecosystems has mostly ignored this aspect, despite its central role in the establishment of ecosystems (Dattée et al., 2018; Jacobides et al., 2018). Even the more general question of how firms build ecosystems has not yet been sufficiently addressed, which has led to repeated calls for research (Dattée et al., 2018; Hannah & Eisenhardt, 2018; Jacobides et al., 2018). One of the few
1This Chapter is based on the working paper “No One can Whistle a Symphony – How Firms Search for Potential Value Proposition and Partners in Building-up an Ecosystem” with co-authors Bernhard Lingens and Oliver Gassmann

28
works in this area, Dattée et al. (2018), focuses on the specific question of how orchestrators with particularly strong market power and resources convince partners to commit to radically innovative ecosystems, but it does not cover the other elements of the abovementioned process.
This motivated us to conduct a qualitative multiple-case study with 10 cases. Since the underlying motivation of this work is to provide insights into how firms can build up ecosystems, we focus on the firm – more specifically, on the orchestrator – as the unit of analysis. In order to guide our research endeavor (Yin, 2014), we use the concept of organizational search (please, see Cyert & March, 1963; Nelson & Winter, 1982; Stuart & Podolny, 1996) as a theoretical lens for several reasons. First, search focuses on identifying new opportunities, capabilities, and partners (Cyert & March, 1963; March & Simon, 1958). This corresponds neatly with the underlying logic of ecosystems, which are a means of pursuing new opportunities by searching for and involving external partners in order to bring in new capabilities (Adner, 2017; Dattée et al., 2018; Jacobides et al., 2018). Second, organizational search is driven by and embedded in organizational structures and organizational decision making. However, organiations are not islands onto themselves; rather, they operate in populations with other organizations and institutional environments, which is why the concept of search follows an open-system perspective on organizational structures and decision making (Gavetti et al., 2007). Likewise, ecosystems are viewed as inter-firm structures (i.e., open systems), in which organizations jointly execute decision making and innovation activities (Jacobides et al., 2018). And, third, search is not considered to be a straightforward process, but rather an iterative process of identifying, learning, and adapting (Bedeian, 1990; Miles, 1980; Thompson, 1967). Our study applies the same logic by making the iterative search process for new value propositions, partners, and their interests the center of attention.
As a foundation for our study, the following literature review explains the ecosystem concept and its specifics, thus elaborating on what makes the above-mentioned iterative search process so special in this context. In section two of the literature review, we explain the fundamentals of organizational search as the theoretical lens of our study. Thus grounded, we aim to provide several key contributions to the research on ecosystems. First, to our knowledge, we are the first to describe the iterative process of how firms define the joint value proposition, identify partners, and understand their interests – a question that is essential to understanding the establishment of ecosystems (Jacobides et al., 2018). Second, by doing so, we show how firms conduct both local

29
and distant search in the context of the establishment of ecosystems. Third, we show in greater detail how orchestrators understand the interests of potential ecosystem partners as a foundation for their subsequent integration into the ecosystem.
2.2. Literature Review 2.2.1. Literature Background on the Ecosystem Concept The ecosystem concept has been discussed by many scholars (e.g. Adner, 2017; Adner & Kapoor, 2010; Dattée et al., 2018; Davis, 2016; Davis & Eisenhardt, 2011; Jacobides et al., 2018; Kapoor & Agarwal, 2017; Moore, 1993). According to the structural view, the primary purpose of an ecosystem is the materialization of a joint value proposition that could not be achieved by one firm alone (Adner, 2017; Adner & Kapoor, 2010; Eisenhardt & Galunic, 2000; Jacobides et al., 2018; Li & Garnsey, 2014; Moore, 1993; Overholm, 2015). Thus, the multilateral set of partners needs to interact in order to materialize a joint value proposition (Adner, 2017; Autio & Thomas, 2019; Kapoor, 2018; Shipilov & Gawer, 2020). In the course of this manuscript, we will refer to ecosystems according to the structural view. In the context of development, Jacobides et al. (2018) name modularity as a main element of this concept as it creates the surroundings for an ecosystem to develop. Modularity describes the process of independent modules being manufactured separately but ultimately fitting together with other modules to create a new value proposition (Jacobides et al., 2018). As a result, an ecosystem’s value proposition needs to be modular in order for several partners to contribute to it (Baldwin & Clark, 2000; Jacobides et al., 2018). Furthermore, these modules need to be complementary, i.e., they either mutually increase their respective values (so-called supermodularity) (Milgrom & Roberts, 1990; Topkis, 1978, 1998) or they are unable to function on their own. The modules must also be non-generic and especially created for the ecosystem, or at least adapted to modules from other companies in the ecosystem (Baldwin & Clark, 2000; Jacobides et al., 2018). These modules and firms can, therefore, not be easily replaced (Jacobides et al., 2018).
In this vein, Teece (1986) introduces the term of co-specialization which indicates that two or more modules require each other. As a consequence, partners need to more or less adapt their modules, which leads to higher or lower costs of adaption and, therefore, risk. This is likely to affect the establishment of ecosystems as well, since higher risks resulting from higher degree of co-specialization create higher barriers for partners to

30
enter an ecosystem (Jacobides et al., 2018). The degree of co-specialization is exogenous as it arises from the joint value proposition (Jacobides et al., 2018).
As a consequence of the modularity, there needs to be at least three ecosystem actors as the relationships within an ecosystem are inherently multilateral, i.e., the ties between actors cannot be divided into bilateral relationships (Adner, 2017; Jacobides et al., 2018).
Adner (2017) distinguishes between ecosystem partners and ecosystem actors. The former includes the firms necessary to help the orchestrator create the joint value proposition. The latter constitutes the sum of all partners, including the orchestrator. Hereby, the orchestrator represents a key actor within the ecosystem. Its main tasks include: developing the ecosystem, aligning all partners, providing the needed stability within the ecosystem, and managing the ecosystem as a whole (Hannah & Eisenhardt, 2018; Iansiti & Levien, 2004a; Jacobides et al., 2018). Consequently, to achieve a joint value proposition, and to specifically create new, or at least mutually complementary, modules that can be adapted to the ones provided by partners (Baldwin & Clark, 2000; Jacobides et al., 2018), all ecosystem partners must be aligned. The aspect of alignment constitutes another specific characteristic of ecosystems: They are networks of partners that are bound together by some level of hierarchy, without being fully hierarchically managed (Jacobides et al., 2018). On the one hand, some level of hierarchy is needed in order for the orchestrator to align the partners towards the joint value proposition (Brusoni & Prencipe, 2013; Leten et al., 2013). On the other hand, all partners are providing modules, which are connected by non-generic complementarities. The resulting dependency of the orchestrator from the partners makes it difficult to set unilateral standards (Jacobides et al., 2018).
Taken together, the process of search for the ecosystem’s value proposition and partners may be influenced by different levels of co-specialization. Also, effects caused by varying levels of hierarchical control are likely to prevail. And both, in turn, will influence the orchestrator’s ability to convince potential partners to commit to the ecosystem throughout the search process. Please see Table 4 for an overview of the ecosystem related terms used in the manuscript.

31
Terms Description according to literature Self-perception
Ecosystem Initiatives
A firm’s ability to convince and assure partners, as well as to promote mutual
alignment to eventually bring them together for a common purpose (Adner, 2017)
Orchestrator Firm driving the ecosystem initiatives and
managing the whole ecosystem development process (Jacobides et al., 2018)
Ecosystem
Pursues the primary purpose of a materialization of a joint value proposition that
cannot be achieved by one firm in isolation (Adner, 2017; Jacobides et al., 2018; Moore,
1993)
Modularity
How independent modules of a system are manufactured by different firms with little
coordination effort (Jacobides et al., 2018, p. 8)
Actors Sum of partners and the orchestrator (Adner,
2017)
Partner
Firms providing non-generic and complementary modules for the joint value proposition of the ecosystem (Hannah &
Eisenhardt, 2018)
Degree of co-specialization
Determines the degree of co-dependence among the partners in order to adapt the
respective contributions to the value proposition. It further indicates that two or
more modules require each other (Jacobides et al., 2018)
Core elements of ecosystem
Namely actors, links, position, roles, and activities (Adner, 2017)
Key partner
Provides the key module that is considered the most significant module for the joint value proposition supplied
by the key partner
Module knowledge
Knowledge of the orchestrator of the different modules required for the creation of the ecosystem’s value
proposition
Key module Most significant module for the joint
value proposition supplied by the key partner
Committee partner
Ecosystem partner who has the closest relationship with the potential new partner or who could address the potential new partner’s interests
Table 4: Overview of ecosystem terms In the following section, we delve deeper into the mechanisms of this process from the perspective of organizational search.

32
2.2.2. Organizational Search as the Theoretical Lens of our Study Search can be traced back to concepts introduced in seminal works on organizational behavior (e.g., Cyert & March, 1963; March & Simon, 1958; Nelson & Winter, 1982; Simon, 1955) and has played an essential role in the theoretical reasoning of related streams of research (e.g., Cohen & Levinthal, 1990; Cohen et al., 1972; Ocasio, 1997). Search can be defined as a “controlled and proactive process of attending to, examining, and evaluating new knowledge and information” (Li et al., 2013, p. 893). Search is most commonly considered to be ‘local’, i.e., organizations search for solutions in the vicinity of existing solutions, within the company’s field, and in areas where the organization’s individuals already have knowledge and experience (Cyert & March, 1963; Nelson & Winter, 1982; Stuart & Podolny, 1996). Thus, incremental solutions are likely to prevail unless more distal and complex solutions are actively pursued (Monteiro et al., 2008; Shimizu, 2007). In the latter case, firms perform ‘distant search’ to access new solutions and knowledge beyond their existing fields of expertise (Kogut & Zander, 1992; March, 1991; Miner et al., 2001). However, distant search is difficult to achieve (Argote & Greve, 2007) and, thus, often leads to poorer performance and a higher likelihood of failure (Cyert & March, 1963; Martin & Mitchell, 1998). Firms are more likely to successfully absorb new knowledge when there is an overlap between the novel information and the firm’s existing knowledge base (Cohen & Levinthal, 1990; Zahra & George, 2002). Thus, the development of knowledge is a rather time-consuming and difficult affair – particularly in fields that are far from the orchestrator’s core business (Birkinshaw et al., 2007; Meulman et al., 2018; Rosenkopf & Nerkar, 2001). Consequentially, the distance of knowledge is given as an exogenous condition for ecosystem development.
2.3. Methods Given the novelty of the phenomenon in general and our research goal in particular, we view a multiple-case study as a suitable methodology (Eisenhardt, 1989; Ozcan & Eisenhardt, 2009). This method is specifically suitable for answering process-centric questions, such as the process of defining the value proposition, suitable partners, and understanding their interests (Eisenhardt et al., 2016).
A qualitative study was perceived as more suitable than a quantitative study due to the ability of a qualitative study to capture patterns, trajectories, and mechanisms with increased complexity. As opposed to a single-case study, a multiple-case study has the potential to produce a theoretical framework on a higher level of abstraction and

33
provides a better generalizability of the findings. (Eisenhardt, 1991; Eisenhardt & Graebner, 2007; Ozcan & Eisenhardt, 2009).
2.3.1. Data Sampling The sample in our multiple-case study consists of ten cases, with the firm, more specifically the orchestrator, being the unit of analysis. The cases were selected according to several criteria. First, and obviously, the cases needed to fulfill the criteria of an ecosystem (cf. Adner, 2017; Adner & Kapoor, 2010; Eisenhardt & Galunic, 2000; Jacobides et al., 2018; Li & Garnsey, 2014; Moore, 1993; Overholm, 2015). Second, the cases varied in the orchestrators’ characteristics (e.g., size, resources, power). In this vein, we examined cases with orchestrators from both established companies and spin-offs/ joint ventures/ start-ups. The selection and representation of ecosystems consisting of different types of companies acknowledge the real-life representation of companies in ecosystems. By following a similar approach to preceding ecosystem research, we further assured comparability (e.g., Mäkinen & Dedehayir, 2013; Rong et al., 2015b). The cases stem from different industry backgrounds (Eisenhardt, 1989; Ozcan & Eisenhardt, 2009), which is a frequently used means of increasing the generalizability of a multiple-case study (e.g., Chatman & Jehn, 1994; De Wulf et al., 2001; Frankenberger & Sauer, 2018; Schoenecker & Cooper, 1998), especially in the context of ecosystems (e.g., Davis, 2016; Mäkinen & Dedehayir, 2013; Rong et al., 2015b). In addition to the aspect of theoretical sampling, the decision to use cases from different industries was also due to the fact that it would have been challenging to find a sufficient number of cases that could provide the rich data needed to explore such a novel phenomenon, while relying exclusively on a single industry. Accordingly, our sample includes cases from areas such as mobility, public transport, logistics, finance, insurance, and housing. On the other hand, we are confident that our findings are not being distorted by differences across the sectors studied: since ecosystems are usually cross-sector collaborations, all of our cases involve partners from various sectors.
In general, our case sampling was based on an iterative process with continuous adjustments between case selection, data collection, and data analysis (Eisenhardt, 1989). Our initial set included about 20 brief cases, of which we chose five as primary samples based on our sampling criteria. After completing the first interviews and data analysis, we researched additional cases to expand and enrich our sample and gain a better understanding of the emerging theory (Eisenhardt, 1989). Accordingly, we excluded from our sample those cases that were shown to not meet our criteria

34
optimally, and we added further cases until we reached a state where additional cases did not significantly enhance our understanding of the context (Eisenhardt, 1989).
As a result of our sampling, ten cases have been selected. The ecosystem actors come from a variety of industries and are either established firms or spin-offs/ joint ventures/ start-ups. The value propositions identified in our cases address several customer demands in the contexts of Business-to-Business (B2B) (e.g., Factoring case), Business-to-Customer (B2C) (e.g., Sports case), and Business-to-Government (B2G) (e.g., Analytics case). The firms’ value propositions, however, all have in common that they offer a digital service of some sort.
The ecosystems found in our cases further varied in size, ranging from at least three actors (e.g., InsurTech case) to 16 actors (e.g., Smart Building case). The establishment of the ecosystems took between one year and five years. The orchestrators were both corporates as well as start-ups, spin-offs, and joint ventures. For a detailed overview and case-by-case descriptions, including the contribution of each actor in the ten ecosystems, please see Table 5.

35
Case Foundation of Orchestrator
Foundation of
Ecosystem
Orchestrator origin
Number of
actors Partner Origin Case Description
Access 2006 2011 Germany 5 Germany, United Kingdom, United States of America
The Access case focuses on keyless access to rental cars. The development of an app for the end customers and the technological equipment of the rental cars enables these cars to be opened using a smartphone. The ecosystem partners have adapted their software, hardware, and service components, and have also implemented new modules in the fleet.
Logistics 1849 2017 Switzerland 7 Switzerland,
Germany, United States of America
The value proposition of the Logistics case is the delivery of goods by an autonomous drone. To make this service promise a reality, a logistics company cooperated with an airline (which later left the ecosystem) and a drone technology provider. A hospital provided the use case and, in addition to the test site, also offered knowledge and experience in logistics. Finally, the government authorities also became partners in the ecosystem to develop a legal basis for autonomous flying drones. A multitude of service promises are possible. Currently, the focus is on the transport of sensitive and high-quality medical objects (e.g., organs, blood, etc.) from one hospital to another.
Mobility 1906 2017 Switzerland 9 Switzerland, Germany, France,
The Mobility case refers to an ecosystem consisting of five core partner who promise an autonomous bus in pedestrian zones. To deliver on this promise, a university is providing expertise on the use of Big Data and a public transport company is bringing knowledge and experience, particularly in public transport processes. In addition, some start-ups specialized in autonomous driving are part of the ecosystem. A city was provided as a test site, which means that the public sector also plays an important role in the ecosystem. Another university contributed market knowledge and provided a network as well as market research. All these contributions were crucial for the realization of the performance promise of autonomous buses.
Move 2014 2015 Switzerland 7 Switzerland
The value proposition of the Move case focuses on a personally tailored relocation process. The primary aim is to relieve the customer of the burden of communicating individually with each company involved in the relocation process. The all-round service ranges from the organization of cleaning and the sale and transport of furniture, to a customized insurance service for the household. The service is offered in cooperation with an insurance partner. In this case, the function of the orchestrator has changed over time. In the initial phase, when the company was still a start-up, most of the process steps were executed manually and there was a lack of technical support regarding partner communication (later referred to as Move Phase 1). By establishing the company and implementing a platform, communication with the partners was largely automated (later referred to as Move Phase 2). The integration of the platform created more time for the orchestrator staff to shift their attention to new subject areas.
Smart Building 2015 2016 Italy 16
France, Italy, Netherlands, United
Kingdom, United States of America,
Switzerland
The Smart Building case has developed a smart air conditioning and heating solution to achieve an optimal and sustainable indoor climate (e.g., in offices or in the metro). The temperature is measured by a sensor and the existing ventilation is switched on and off by a device developed by the orchestrator. This ecosystem consists of a large number of partners, with relations both bilateral and multilateral. This case is referred to as an ecosystem because there are multilateral relationships. The enterprise has a large number of partners that have developed the hardware for the enterprise, as well as partners that supply the corresponding software.
InsurTech 2017 2017 Austria 3 Austria, Germany
The InsurTech case represents an ecosystem that merges a physical product with a customized insurance solution. An example application combines a smart toothbrush with a dental insurance policy. Specifically, the company acts as an insurance intermediary between B2C companies that manufacture physical products and insurers. The aim is to offer a customized and comprehensible insurance solution. The insurance is thus fully implemented in the sales process of the physical product.
Sport 2014 2014 Switzerland 6 Canada, Germany, Switzerland
The Sports case focuses on a solution for the creation of 3D soles, especially for ski boots. The soles are made using the technology of a 3D printer, which promises a unique experience. Customers typically receive a standard boot sole when buying ski boots. The problem is that a boot that doesn’t fit properly will cause pain. An important player in this ecosystem is the partner who provides the 3D printer technology. In addition, the ecosystem has an e-commerce partner to successfully market its products.
Factoring 2016 2016 Switzerland 6 Switzerland, United States of America
The orchestrator of the Factoring case offers Swiss SMEs operating in developing countries a factoring solution for doing business with developing countries. Long payment periods (up to half a year) pose numerous challenges that can trigger liquidity problems for SMEs. The Fintech Ecosystem offers a customized solution for eliminating liquidity bottlenecks in order to enable business activities in developing countries. In addition to the orchestrator, the ecosystem includes funding partners, an insurance company, a reinsurer, a bank and a software company that uses an algorithm to assess the risk of SME claims.
Analytics 2016 2017 Turkey 13
Great Britain, Netherlands, United States of America,
Switzerland
The ecosystem of the Analytics case has developed software that analyses potholes, rocks, bumps, and other types of data about damage to public roads. the software them evaluates this data with a unique algorithm. In order to achieve this value proposition, the company collaborates with many different players: the public sector is crucial for providing information about the roads, and private companies also provide the ecosystem with essential geo data. City managers also play an important role, as the software solution promises to reduce maintenance costs.
Data 1876 2017 Switzerland 11 Switzerland,
Germany, United States of America
The Data case refers to an ecosystem consisting of five core partner who promise an autonomous bus in pedestrian zones. To deliver on this promise, a university is providing expertise on the use of Big Data and a public transport company is bringing knowledge and experience, particularly in public transport processes. In addition, some start-ups specialized in autonomous driving are part of the ecosystem. A city was provided as a test site, which means that the public sector also plays an important role in the ecosystem. Another university contributed market knowledge and provided a network as well as market research. All these contributions were crucial for the realization of the performance promise of autonomous buses.
Table 5: Case overview

36
2.3.2. Data Collection Our data collection process was divided into five main phases. In the first phase, the researchers conducted initial interviews of 15 to 60 minutes to determine whether the ecosystem structure met the case selection criteria. Moreover, we wanted to gain an initial understanding of these cases. The interviews were conducted with the primary contact person from the ecosystem orchestrator.
In the second phase, we conducted semi-structured interviews based on the interview protocols included in the appendix. We interviewed managers from the orchestrator under the assumption that they would have an optimal overview of the ecosystem. The duration of the interviews varied from 30 and 90 minutes. The interviews were structured around the core elements of ecosystem development (cf. Adner, 2017; Adner & Kapoor, 2010; Eisenhardt & Galunic, 2000; Jacobides et al., 2018; Li & Garnsey, 2014; Moore, 1993; Overholm, 2015) – for further details, please see Interview Protocol in the appendix. We sought to learn more about the following aspects:
(1) Company history, number of employees, contextual embedding (2) Timeline of the ecosystem development (3) Company’s role within the ecosystem (4) Key elements of the ecosystem according to, namely, actors, links, positions,
roles, and activities (Adner, 2017) (5) Initial situation at the beginning of the ecosystem initiative (6) Orchestrator’s knowledge related to the joint values proposition, the
ecosystem modules, and (potential) ecosystem partners (7) Orchestrator’s understanding of partner interests (8) External conditions of the ecosystem, i.e., environmental uncertainty,
industry characteristics, or competitive situation.
In the third phase, we conducted interviews with partners of the ecosystems or other third parties with strong insights into the ecosystem, such as investors or customers. We conducted these interviews in order to triangulate and enrich our findings.
In the fourth phase, we collected extensive additional data, such as internal presentations and reports, annual reports, press releases, homepages, and media reports. We deemed this a suitable approach since several of the cases in our study received extensive media attention due to their novelty or impact. As a result, we collected data from a wide range of data sources, including both external and (orchestrator) internal documents, as well as those from third parties within the ecosystem and other aspects

37
addressed in the first interview protocol (see Interview Protocol I in the appendix). This enabled us to augment, validate, and triangulate the findings of the first interviews (Jick, 1979). Also, it improved our ability to identify possible inconsistencies between the statements made in the initial interviews and the internal and external documents.
As a last step, we subsequently conducted additional interviews with the orchestrator, to deepen our existing knowledge and resolve any inconsistencies or ambiguities. In some cases, we organized workshops with some of the companies to gather further insights and check the correspondence between emerging theoretical constructs and the perception of practitioners. If required, we also approached the interview partners by e-mail and held brief follow-up interviews.
During all interviews, we took detailed notes, recorded them on tapes, and transcribed them within a short time period after the interviews (cf. Yin, 1981, 2014). Additionally, we worked with our respondents to create graphical representations of the ecosystems studied (Dattée et al., 2018). Afterwards, all three authors analyzed the information (Mayring, 2007) and elaborated the findings together.
In most of our cases, information about the core elements of the ecosystem was publicly accessible. In all of our cases, we were able to validate the key messages of our interviewees and thus strengthen their credibility. Also, we consciously observed time delays of several weeks to several months between interviews and follow-ups and withheld transcripts or information from previous interviews from the interviewees. By doing so, we were able to ask questions from previous interviews during follow-ups to check the consistency of the responses. No significant differences were found between the information provided from one interview to the next, which also affirmed the credibility of our interviewees. Finally, to further verify consistency, we conducted interviews with other companies in the ecosystems. An overview of our data sources is shown in Table 6.

38
Case Field of business # of Inter-views
Interviewee position O = Orchestrator company
P = Partner company
Interview
code Interview duration
(min) Total pages transcripts Additional data
Source (additional data)
Access Security 7
Chief Executive Officer (O) Chief Sales Officer (O)
Head Ecosystems & Venturing (P) Venture Fund Manager (P)
1A 1B 1C 1D
67+20+63 81+67
60 21
33+9+39 40+40
34 12
Company documents Blog posts & online articles
internal external
Logistics Logistics 5
Head of Autonomous Delivery (O) Head of Open Innovation (O)
Program Manager (O) Project Manager (O)
Chief Executive Officer (P)
2A 2B 2C 2D 2E
36 53 55 36 39
17 25 26 21 14
Company documents Blog posts & online articles
Radio & TV reports
internal external external
Mobility Public transportation 6
Head of Open Innovation (O) Head Project Lab (O)
Coordinator Project Lab (O)
3A 3B 3C
52 75+48+58
45+13
27 38+30+33
24+8
Company documents Blog posts, Newspaper & online articles
Radio & TV reports
internal external external
Move Home 8
Key Account Manager (O) Business Development Manager (O)
Founder & CEO (O) Head of Business Development (O)
Innovation Manager (P)
4A 4B 4C 4D 4E
9+60 86 66
25+24 40+60
6+23 36 40
15+15 17+23
Company documents Online & magazine articles
Newspaper articles
internal external external
Smart Building Energy 4
Chief Product Officer (O) Chief Executive Officer (O)
5A 5B
53+55+40 22
18+21+27 10
Company documents Online & magazine articles
internal external
InsurTech Insurance 5 Chief Executive Officer (O) Chief Operating Officer (O)
6A 6B
38+31 40+29+43
20+19 21+18+25
Company documents Newspaper articles
internal external
Sports Sports equipment 3 Chief Executive Officer (O) 7A 104+26+16 26+13+8 Blog posts & online articles external
Factoring Finance 8 Co-founder & Head of Sales & Marketing (O)
Product Officer (O) Innovation Consultant (P)
8A 8B 8C
137+23+80+27+22+6 81 36
29+10+38+12+15+26 42 15
Online & magazine articles external
Analytics Analytics 2 Head of Sales (O) 9A 23+39 9+20 E-Mail Interview internal
Data IT 6 Managing Director of New Businesses (O)
Chief Marketing Officer & Board Member (O) Director of Global and Local Partner Integration (P)
10A 10B 10C
18+65 11+36 60+23
9+39 6+20
40+13
Internal Company presentation Online & magazine articles
internal external
Total 54 2443 1214
Table 6: Case and data overview Chapter 2

39
2.3.3. Data Analysis We initiated our analysis by summarizing the data available to date into a comprehensive case narrative for each company. This case narrative was extended in later phases of data collection, as described above. For each case, the case narrative was first created based on our interview records and then supplemented with other data sources and follow-up questions (Yin, 2014). When conflicts arose, we reviewed our data to resolve them.
We then identified emerging patterns by analyzing each case through the lens of our research question and the aspects of co-specialization, type of search, and potential influences of varying levels of hierarchy. Also, with the help of tables, drawings, and other types of visualization, we were able to provide an overview of our content and more clearly identify patterns in our data (Miles, 1994; Yin, 2014). Due to the novelty of the ecosystem phenomenon, as well as the inductive nature of our inquiry, the authors independently segmented the data into meaningful clusters (Strauss & Corbin, 1998). The identification of codes continued until additional information from the interviews did not yield additional, meaningful codes (Guest et al., 2006, p. 65; Locke, 2001). For further details on the coding, please see the exemplary coding scheme in the figures 4 to 6.

40
Figure 4: Exemplary coding scheme A

41
Figure 5: Exemplary coding scheme B

42
Figure 6: Exemplary coding scheme C

43
After completing the in-case analysis, we performed a cross-case analysis. We looked at all ten cases together to understand parallels and differences between them (Ozcan & Eisenhardt, 2009). With a replication logic in mind, we were able to develop first recursive constructs and, thus, identify emergent patterns across cases (Eisenhardt & Graebner, 2007). We then switched between emergent theory and data to clarify constructs, adjust abstraction, and confirm the underlying logical arguments.
When our theoretical knowledge was refined, we referred to previous literature to compare previous research with our research. By doing so, we followed an iterative process of refining knowledge, strengthening underlying logical arguments, and linking them to existing theory (Eisenhardt, 1989).
Our findings are guided by two main concepts, namely local search (Cyert & March, 1963; Nelson & Winter, 1982; Stuart & Podolny, 1996) and distant search (Kogut & Zander, 1992; March, 1991; Miner et al., 2001), as well as the degree of co-specialization (Jacobides et al., 2018). Additionally, throughout the data analysis, we kept the key defining aspects of ecosystems, especially varying levels of hierarchy, in mind. Search is performed in order to define both the value proposition for the ecosystem as well to identify and select potential partners. In our framework, the endpoint of the first search process is a clearly defined value proposition. The endpoint of the second search process is a defined set of partners. Both search processes are described below and illustrated in Figure 7.
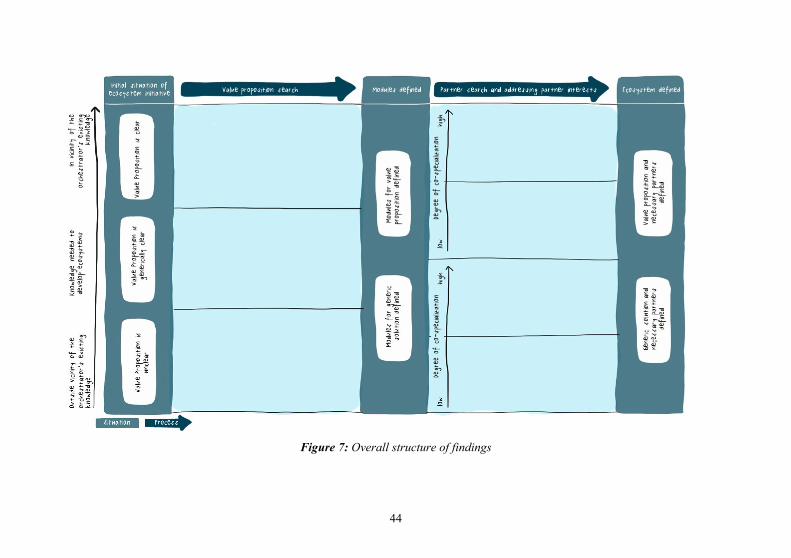
44
Figure 7: Overall structure of findings

45
2.3.4. The Search for an Ecosystem´s Value Proposition As far as the search for the value proposition is concerned, we identified three different initial situations, which lead to different approaches for the development of the value proposition.
Initial situation (A): The orchestrator has sufficient knowledge of the market and customers to independently define a value proposition for the future ecosystem.
Initial situation (B): The orchestrator has a vision for the ecosystem´s future value proposition but is unable to specify it.
Initial situation (C): The orchestrator can define a solution (e.g., a technology) that can be used to address a multitude of customer demands. However, it is not able to find a specific customer demand that can be addressed by using this solution. Thus, the orchestrator is aware of a generic solution but not a corresponding problem that can be solved with this solution.
Before the ecosystem modules can be defined, the orchestrator has to attain clarity over the value proposition or generic solution. Once the value proposition and the generic solution, as well as necessary modules, are defined, the search for the ecosystem partners can begin.
2.3.5. The Search for Ecosystem Partners The difficulty with which orchestrators identify and find the necessary ecosystem partners depends upon their knowledge of the potential partners. Two different starting points for the search for ecosystem partners can be inductively derived from our cases:
(A) The required partners are easily identified by the orchestrator and can be found using simple methods, such as desk research.
(B) The required partners are not easily identified by the orchestrator and cannot be easily found.
These two starting points result in two approach categories (A and B). When the ecosystem partners’ levels of co-specialization are taken into consideration, four approaches to partner search can be identified. As shown in Figure 7, the approaches are structured along the dimensions of knowledge related to potential partners and the partners’ levels of co-specialization, which could be either high or low. The approaches (A1, A2, B1, and B2) all indicate different configurations of the dimensions mentioned above:

46
(A1): The knowledge needed to identify partners is in the vicinity of the orchestrator’s existing knowledge base and the degree of co-specialization is low
(A2): The knowledge needed to identify partners is in the vicinity of the orchestrator’s existing knowledge base and the degree of co-specialization is high
(B1): The knowledge needed to identify partners is outside the vicinity of the orchestrator’s existing knowledge base and the degree of co-specialization is low
(B2): The knowledge needed to identify partners is outside the vicinity of the orchestrator’s existing knowledge base and the degree of co-specialization is high
As a result of the configuration of partner knowledge and the degree of co-specialization, the orchestrator either does (A1 and A2) or does not (B1 and B2) have the ability to search for partners independently. Therefore, the approach to partner search has to be chosen accordingly.
Throughout the whole process of partner search, our cases further revealed another core aspect of ecosystem establishment: The order in which partners are searched for and involved in the ecosystem by the orchestrator. This will be explained in detail following the overall case-by-case description of the findings.
2.4. Findings 2.4.1. Case-by-case Findings In the following, the cases will be explained in detail to demonstrate how the approaches to value proposition search and partner search were derived from the case data. The presentation of all ten cases will be structured along the three initial situations outlined in section 4.1 (A, B, and C) to facilitate practical applicability.
Initial situation (A)
As an illustrative example of the first initial situation, the founders of the orchestrator of the Access case participated in a university competition on the topic ‘What are the biggest problems in the car sharing sector?”. After an in-depth analysis and examination of current issues, the founders realized that the major problem for the customer was opening a rental car without a key. In highly frequented places, such as large airports or train stations, handing over the keys at any time, day or night, is not a problem. In suburban areas, however, the situation changes because keys can only be handed over during business hours. In remote regions, the customer is unable to find a rental car

47
offer because the operation of a branch office in a remote region would not be profitable. Although the founders had a clear idea of the value proposition that they aspired to bring to market, there were technical specifications that they had to address before finalizing this value proposition. Limitations to what was technically possible, thus, impacted the envisioned value proposition. The founders eventually submitted their proposal to the contest and subsequently developed a technology for opening cars with a smartphone. Through their research, the founders came to know the market and the modules required to solve the problem. They were able to independently establish the value proposition, define the necessary modules, and look for ecosystem partners to implement the value proposition, thus purposefully driving the ecosystem. The managing director described this as follows:
“Yes. The value proposition was very clear. The invention of this software concept made it clear what advantages it offered. What was added afterward is that it is not
only useful in the automotive sector, but also for many other electronic applications.” (1B)
Since the founding team was confronted with a rather high market uncertainty, they struggled to know which companies would prove to be the right key partners. Therefore, partners were identified and integrated one at a time in an iterative process, as the orchestrator had to learn to understand the market as well as future partners, which meant that the iterations were unplanned. Within the Access case, the orchestrator chose as its first partner the hardware manufacturer, which provided the connection module. This was because the development of this module was expected to take the most time. The Chief Executive Officer (CEO) explains this reasoning:
“I first added the hardware supplier, because he has to undertake the most significant
developments of all partners. The software components, on the other hand, can be easily
adapted and developed.” (1A)
An important event, which had great impact on the set-up of the ecosystem modules, was changing the key partner, who provided the key module, due to the module fit. The key module is considered the most significant module for the value proposition supplied by the key partner. It turned out that the initial key partner’s module was not in total congruency with the necessary ecosystem modules, as the solution specificities of the key module and the orchestrator did not align. After replacing the initial key partner with a new key partner, the team was able to develop the ecosystem and integrate its additional partners with relatively little friction, with the exception of some contractual

48
disagreements, which lead to another partner shift. Finally, the modules and necessary partners were set and defined, allowing the ecosystem to develop. For an illustration of the ecosystem development see Figure 8.
Figure 8: Ecosystem development Access case
In the Factoring case, the orchestrator’s management team developed the value proposition based on the deep domain knowledge it had acquired during previous working engagements in the banking sector. During that time, constant customer inquiries made the managers aware of a problem: Their company did not offer a factoring solution for Small and Medium Enterprises (SMEs) doing business in developing countries. In these regions, payment terms are typically very long-term, which can be a serious problem for the liquidity of these companies. Regular factoring can deal with this problem, but it is usually only granted to SMEs that have sufficient liquidity to begin with. As a result, SMEs with low ratings from doing business in these markets are excluded. The orchestrator’s co-founder and Head of Sales and Marketing describes the process of identifying customer needs as follows:

49
“From the very beginning, we knew what our customers were doing and what they were missing. From there, we developed our value proposition. (...) In this respect, you can clearly say that we developed the value proposition entirely by ourselves.”
(8A)
The founders initially presented a solution to serve this niche market, but it was rejected by their employer company's top management. Afterwards, they decided to start their own company and implement and further develop the value proposition themselves. During this independent process of value proposition search, the founders came to understand that a part of their value proposition was actually unnecessary as there was no substantial customer need for it. The orchestrator summarizes the situation as follows:
“We have a nice solution and for every nice solution it is very difficult to find customers.” (8A)
After getting rid of this element that had no actual customer demand and, thus, adjusting and correcting the value proposition, it was possible for the founders to define and set-up the necessary ecosystem modules. From there, they were able to search for partners catering to these modules through an independent search process due to the founders’ strong network of relationships, as well as their superior knowledge of the industry. They, therefore, created the ecosystem purposefully. Figure 9 further shows the detailed development of the ecosystem.

50
Figure 9: Ecosystem development Factoring case
Noticeably, the fundamental value proposition was defined at the beginning. Later on, only slight adjustments were made to the value proposition and its specific modules to adapt it to different geographical markets, since the conditions for loan payments, as well as market specificities, differ slightly from country to country. Further, the following quote from the orchestrator illustrates this development:
“The value proposition, per se, remained unchanged. The specific characteristics of our value proposition have been slightly adjusted over time. I would say that it is changing in the lower single-digit percentage range. But the fundamental value
proposition remains stable.” (8A)
Similar to the first two cases, at the beginning of the Smart Building case, the orchestrator was fairly certain of the value proposition of the service. The individual modules and the market itself could easily be defined and understood, and they were therefore able to purposefully build up the ecosystems. As the Chief Product Officer nicely puts it, there was a clear understanding of customer need and the potential of the value proposition:
51
“We saw the potential; we discovered that we could save money on energy bills because every building consumes energy and therefore every owner of a building is a
potential client, so that's when we started.” (5A)
The orchestrator was joined by a key partner early on, and additional ecosystem partners were identified and integrated alongside this initial search partner. The orchestrator benefited particularly from these partners’ established networks and reputations. In the early days of the partner search process, it was necessary to change partners due to the misjudgment of partners’ abilities, as the orchestrater states:
“And this people knowledge brought us to the right suppliers. But we did [make] mistakes, we changed suppliers over time.”(5A)
Trust and the ability of partners to actually deliver the necessary individual modules were important factors during this change of partners. Later on, to specifically cater to new clients with differing technical predispositions, the modules had to be slightly adapted to assure the technical implementability of the solution:
“We needed a market opener, and technical partners, so that we can work with the local teams and […] target specific tradeshows, specific touchpoints for new clients
and install the first pilots […].” (5A)
The orchestrators eventually developed sufficient market knowledge to independently search for additional partners for these specific use cases. Figure 10 shows how the ecosystem emerged.

52
Figure 10: Ecosystem development Smart Building case
The founders in the Move case were very informed about the moving market from the get-go. Hence, they had a clear understanding of what the value proposition should be. The orchestrator had sufficient market knowledge to form a value proposition for a specific use case, thereby purposefully building the ecosystem. As explained by the CEO, they identified a clear customer need, which served as the starting point for developing the value proposition:
“We have seen that the problem is that in Switzerland the removal market is highly untransparent […]. […] a lot is done in illegal work because there are no big brands. […] Especially we have seen that there is a customer need for a certain security and
comparability in the market. And this was the starting point of our product development.” (4C)
Due to their high level of market knowledge and the clear value proposition, the orchestrator was able to independently define the necessary modules. The orchestrator could easily understand potential ecosystem partners due to the low degree of co-specialization. Hence, the founders independently identified and integrated four partners. During this process, some small but impactful adjustments were made. For instance, there was a change in the insurance partner due to contractual disagreements and some interpersonal challenges. Additionally, the founders eventually decided to
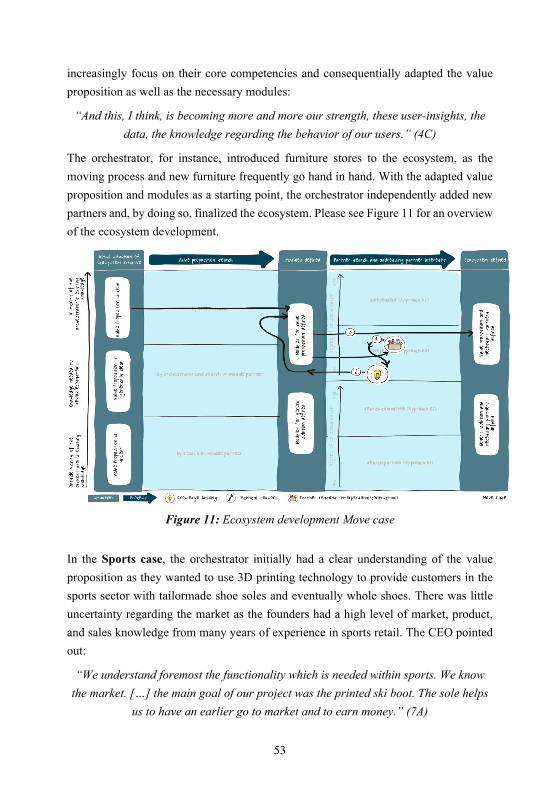
53
increasingly focus on their core competencies and consequentially adapted the value proposition as well as the necessary modules:
“And this, I think, is becoming more and more our strength, these user-insights, the data, the knowledge regarding the behavior of our users.” (4C)
The orchestrator, for instance, introduced furniture stores to the ecosystem, as the moving process and new furniture frequently go hand in hand. With the adapted value proposition and modules as a starting point, the orchestrator independently added new partners and, by doing so, finalized the ecosystem. Please see Figure 11 for an overview of the ecosystem development.
Figure 11: Ecosystem development Move case
In the Sports case, the orchestrator initially had a clear understanding of the value proposition as they wanted to use 3D printing technology to provide customers in the sports sector with tailormade shoe soles and eventually whole shoes. There was little uncertainty regarding the market as the founders had a high level of market, product, and sales knowledge from many years of experience in sports retail. The CEO pointed out:
“We understand foremost the functionality which is needed within sports. We know the market. […] the main goal of our project was the printed ski boot. The sole helps
us to have an earlier go to market and to earn money.” (7A)

54
There was, however, a fair amount of uncertainty regarding the specific technologies (like the software, scanning solutions, and 3D printing), as the product had to be developed from scratch and the founders had to find a way to integrate the technology into their business model to create the value proposition. Due to their high level of customer knowledge and experience of interacting with customers, the orchestrator was, nevertheless, able to independently develop the value proposition and define the ecosystem modules. Figure 12 shows the development of the ecosystem.
Figure 12: Ecosystem development Sports case
The ecosystem was built purposefully since the orchestrator used a targeted process to search for and gather ecosystem partners around the value proposition. For instance, the search for potential partners was quite easy as the orchestrator was able to find partners through simple desk research. This is underlined by the following statement from the CEO:
“It's just that you start googling.” (7A)
The orchestrator’s lack of experience in the technical domains related to the value proposition, which implied that the potential partners had to be more intensively convinced of the merits of being part of the ecosystem. Due to a higher degree of co-specialization, the complexity of the partner system was increased. This complexity, in turn, increased the uncertainty about the success of the initiative. For this reason, the

55
orchestrator had to build up knowledge in order to understand and address partner interests. A major adaption and change in modules came with the switch from a B2C to a Business-to-Business-to-Customer (B2B2C) business model, as the latter model was able to effectively provide access to a viable customer base. The orchestrator came to understand that it was much easier to reach end customers with an intermediary sports retailer in between. Through intensive collaboration and continuous learning, the orchestrator was able to align all necessary partners and bring an innovative product to market. The CEO described the situation as follows:
“I know our network of dealers all over the world by heart. […] But everything that is body scanning, that is speedy printing and that is software development […] is
actually the result of consistent networking and learning.” (7A)
Initial situation (B)
In the Mobility case, there was no clear value proposition at the start of the initiative. The head of Project Labs said:
‘The value proposition was not really known. The goal was to define a strategy [...]. It was a process. Because there are so many factors that could influence this value
proposition […].” (3B)
As the Head of Open Innovation explained, only a superficial vision as a multimodal integrated mobility provider was defined:
“A vision had been identified. We did not want to be just a public transport provider anymore; we wanted to be a multimodal integrated mobility provider. […] and then
we said we couldn't achieve that alone. Disruptive topics such as autonomous driving cannot be tackled by us alone. […] And then we activated our network.” (3A)
The orchestrator was dependent on a partner to specify possible problems and associated solutions and to assist in the development of a value proposition. The orchestrators were purposefully driving the ecosystem, and therefore selected a university as a partner because it is a well-known institution in the field of new mobility solutions. Also, the orchestrator had a personal connection to the public institution. The university was able to provide knowledge regarding the market and potential technologies. With regard to the value proposition development, the university significantly shaped and changed the orchestrator’s understanding by identifying and foregrounding what was technically possible in alternative mobility solutions. This

56
enabled the consortium to develop the idea of an autonomous bus in pedestrian zones. Please see figure 13 for an overview of the ecosystem development.
Figure 13: Ecosystem development Mobility case
For the Mobility case, as explained above, the definition of the value proposition, as well as the necessary ecosystem modules, would not have been possible without what we call a ‘search and module partner’.
Due to the high degree of co-specialization of the modules, it was difficult for the orchestrator to understand and address partner interests. For this reason, the orchestrator jointly searched together with its existing partners in what we call a ‘search committee’. Due to common ground among the partners and the broad joint network of all partners involved, it was possible for the search committee to locate suitable partners. The search committee held meetings in person or digitally. During the meetings, the requirements and capabilities of potential partners were discussed, defined, and analyzed, and a shortlist of all potential partners was drawn up. Thereupon potential ecosystem partners were contacted by the committee partner who has the closest relationship to the potential new partner or by the committee partner who could address the potential new partner’s interests in the most conceivable way. If a new partner joined the ecosystem, this partner was integrated into the search committee if they had relevant and complementary skills.

57
It must be noted that the ecosystem initiative discussed here, the Mobility case, was part of a group of ecosystem projects initiated by the same orchestrator, a consortium. These projects were, therefore, not entirely independent from one another – especially not in the early stages of development. In the early phase of ecosystem development, the lab, which controlled these projects, initiated an adaption to modules to allow for the projects to fit together optimally as a whole. Consequentially, the module components of each ecosystem project – including the one analyzed in this Mobility case – were developed and adapted to maximize synergies and knowledge transfer. The development of these projects is summarized in the following quote:
“There was a lot of uncertainty. When the consortium started, they didn't know exactly which direction to take - there were other projects as well. […] For each project, we should sign new [specific] contracts. Depending on the funding of the
project, new agreements are concluded. The outline contract is just very rough.” (3B)
It was the consortium’s goal to have the value propositions materialize jointly in synergy. In the Mobility case, the process of partner search as part of the ecosystem development was further characterized by early customer interactions and feedback loops. This, in turn, lead to a certain shift and the addition of ecosystem partners before the ecosystem was eventually realized. Specifically, the orchestrator worked together with the authority responsible for public transportation in a rather rural, but touristic canton of Switzerland. In doing do, they were able to identify additional partner needs.
In the Data case, the orchestrator was able to define around 80% of the value proposition based on its own knowledge. The orchestrator gained this ability through a previously developed project. After this project failed after several months, the orchestrator moved on from simple IT storage to a multi-cloud solution. This was followed by the hiring of employees with in-depth domain knowledge, who helped elaborate the concept. In order to define the ultimate stage of the value proposition, a partner was needed, similar to the Mobility case. The following quotes from the Managing Director of New Businesses explain the process perfectly:
“So the innovation, the idea, […] came […] from us out of the failed customer project. […] The tasks of the partners and the value proposition were largely clear.
Let me now say that was 80 percent. The remaining 20 percent were then created […] in cooperation with the technology partner.” (10A)
The contact to this technology partner, one of the largest global technology leaders, came from the personal network of a leading employee, and shows that the orchestrator

58
in this case was also driving the ecosystem with a purpose. This employee personally reached out and convinced the partner of the value of the initiative. The orchestrator chose the partner first that contributed the most important module to the ecosystem, as explained by the orchestrator of the Data case:
“Together with the search partner, a committee scouted the most important technology
partner. It could be convinced by the commitment of the search partner [to the ecosystem].”
(10C)
The Data case also resembles the Mobility case in terms of the partner search approach. A search committee was used to identify potential partners, who were then contacted by the existing partner with the most common connection in order to convince the potential partner of the initiative’s merit. This was specifically relevant when it came to the local adaption of the ecosystem. To ensure technical feasibility with regard to differing technological points of departure, the modules were adapted with the help of partners. This cooperative process is described as follows:
“[…] the partners refined that and then they came to us with it or we did it together. It was a bit of a flowing process, it wasn't something that was done exactly according to
a certain methodology.” (10A)
From there, and with the adapted modules in mind, the orchestrator finalized the partner search with the help of a search committee. Figure 14 shows how the ecosystem was built.

59
Figure 14: Ecosystem development Data case
Initial situation (C)
The orchestrator in the InsurTech case recognized a market in the InsurTech area. The founders noticed that almost all insurance contracts are too complicated, too long, and too unspecific to be useful in individual use cases. This represents a barrier to the digital sale of supplementary insurances for physical products. Based on the orchestrator’s personal experience, it was known that insurance companies were too slow to provide such a service, so the idea emerged to solve this issue by being a sort of ‘spider in the middle’. The orchestrator was purposefully building an ecosystem since he knew that it would offer a better solution than existing alternatives. A minimum viable product (MVP) was built to prove that the solution worked. After a hypothesis test, following the lean startup concept, the orchestrator quickly came to find that there was market potential for its generic solution. In line with the lean startup approach, this first process of defining a solution was characterized by iteration. In partnership with the partner who would eventually provide the key module, the orchestrator started developing its technical solution. With constant feedback, the orchestrator was able to technically specify its idea within the InsurTech field as there was initial uncertainty about which specific technology should be used to realize the vision. Further, they changed the generic business model from a B2C model to a B2B2C model due to improved customer accessibility. The modules for this generic solution therefore changed slightly, but were

60
eventually set. Subsequently, and with help from the same partner, more partners were added to the ecosystem. Eventually, the generic solution was adapted to specific use cases and the development of the ecosystem can be seen below (see Figure 15).
Figure 15: Ecosystem development InsurTech case
In collaboration with partners, the specific value propositions were then defined and the orchestrator independently added the last ecosystem partners with the use case in mind. This adaption per use case is described by the orchestrator as follows:
‘From the very beginning, we were focused on making our product be something behind the actual sales channel. It's an augmented product. We get the specific use
case through our respective partner with access to the customer.” (6B)
To a certain degree, the Logistics case behaved similarly to the InsurTech case, as the orchestrator was also driving the ecosystem’s goal orientation and followed a similar approach to value proposition and partner search. The orchestrator is one of the largest logistics providers in Switzerland. One day, during a meeting, the idea of using an autonomously flying drone for logistics was born. The idea can be summarized by the following statement:

61
“When we started the case, of course, we had some knowledge about drone technology. We had to know this to understand what was possible. We also had an initial understanding of the case, but of course, the idea about the case grew out of
dozens of conversations with various customers. Our strength in Switzerland was our market knowledge. We know the local conditions, and we have the contacts to
potential customers.” (2D)
At first, the value proposition was generically defined but could not be specified for one use case. The orchestrator started with the development of a generic drone-centered solution. During this process, the necessary expertise of which modules are needed for the specific value proposition was elevated with a partner, who helped to define the generic value proposition. Hence, there was a change in outlook related to feasibility and potential customer needs quite early in the process. Given the innovation potential of a drone solution, it became apparent that a promising use case existed. Thus, there was a relatively low risk of implementing the value proposition and not being able to monetarize it later.
As the orchestrator lacked specific domain knowledge, ecosystem partners could not be identified and integrated independently. Therefore, the orchestrator required the help of a committee of partners. During the joint process of ecosystem development, an early change of modules happened as the application of the drone solution within the logistics sector was narrowed down to transporting smaller goods. Later, a change of partners followed a subsequent specification regarding the scope of the transportation of smaller goods. As soon as the modules and partners for the generic solution were set, the solution was developed to a specific use case. For this concretization, the existing ecosystem partners helped define the use case specific modules as also illustrated in Figure 16.

62
Figure 16: Ecosystem development Logistics case
Eventually, when the orchestrator had acquired substantial knowledge and industry relationships, they were able to independently search for and integrate the last partners. During this process, and in collaboration with the customers, the application of the drone was further narrowed down and the modules underwent some last, minor changes. This iteration is specified in the following statement by the Head of Open Innovation:
“[…] the idea of the case has of course grown out of dozens of conversations with various customers.” (2B).
The idea in the Analytics case was born as a joke between four co-workers. However, they quickly and precisely developed into an ecosystem. As they decided to pursue the idea, they initiated a strong interaction with academia and potential customers from the get-go. This interaction allowed the orchestrator to define the necessary modules for the generic solution. Due to the low degree of co-specialization of the modules, it was possible for the orchestrator, as well as the search partner, to easily understand and address partner interests. The search for technical partners, however, was difficult because the orchestrator did not have any knowledge related to these fields. A key partner had to help, and in doing so, re-shaped the understanding of the necessary modules. Quite frankly, the orchestrator did not know what was necessary to transfer the value proposition into an ecosystem. The opportunity provided by the generic

63
solution, as well as the association with the key partner, helped convince a search partner to join the ecosystem. The search partner helped to scout new partners and established contact with these potential partners. The Head of Sales pointed out:
“They [the search partner] were introducing us to some of the partners, and with some
others, we met in events on smart cities and startups. Just the telecom partner could be
identified based on my personal network.” (9A)
These new relationships led to an adaption of the vision as the focus shifted to more pressing customer needs and, consequentially, induced a change of modules. After this last change, the orchestrator and partners adjusted the vision to a specific value proposition in close contact with specific customers. The value proposition of the initiative was ultimately based on software that analyses potholes, rocks, bumps, and other types of damage on public roads and evaluates them with a unique algorithm. The IoT solution provides a report about the condition of a road, and uses live map data to calculate the importance of possible road rehabilitation. Please see figure 17 for an overview of the ecosystem development.
Figure 17: Ecosystem development Analytics case
2.4.2. Cross-case Findings The cross-case findings are summarized in the illustration below (Figure 18).

64
Figure 18: Framework of ecosystem search and development
65
As shown by Figure 18, different initial situations require different actions to define the
value proposition. If the information needed to define the value proposition is in the
vicinity of the orchestrator’s knowledge and experience (local search), then the
orchestrator is able to define the value proposition itself (for instance in the Factoring
case). If the orchestrator lacks the related knowledge and experience (distant search),
and starts with only a vision of the future value proposition, a search partner can help
to further develop the value proposition prior to the start of the partner search, as
demonstrated in the Data case. The search partner offers support during the search for
the value proposition, the search for partners, and the process of understanding, and also
helps addressing partner pain points. The search partner can be either a permanent (e.g.,
in the Mobility case) or a temporary member (e.g., in the Logistics case) of the
ecosystem. Additionally, this partner can either provide a module for the value
proposition (e.g., in the Smart Building case) or not (e.g., in the Sports case). Finally,
the InsurTech and Analytics cases also show situations in which the orchestrator defines
a solution as a value proposition, which can potentially then be applied across a variety
of markets and situations. In these cases, specific applications are chosen later in the
search process, even after the partners have been integrated.
This initial step, of defining the value proposition, is followed by the search for partners.
In addition to the type of search, it is important to consider the degree of co-
specialization, which leads to four different approaches to how the orchestrator can
acquire partners. If the orchestrator has sufficient knowledge of and a network in the
field the ecosystem is focusing on (local search), it can search, select, and find potential
partners independently, as shown in the Access and Sports cases. Otherwise (in
situations of distant search, e.g., in the Data and Mobility cases), it is essential to have
a partner who has this network and knowledge – the search partner, as we call it. In
either scenario, the degree of co-specialization determines the necessary degree of
mutual learning among the partners in order to adapt their respective contributions to
the value proposition. If a search partner is required, it is essential that the orchestrator
learns from this partner as well as from future partners involved in the ecosystem.
These different starting points also affect the occurrence and intensity of iterations
throughout the search process. This, in turn, has a significant influence on the time it
takes to implement the ecosystem – ceteris paribus, the fewer iterations, the shorter the
development time. In summary, if the value proposition is clear, the iteration level
during the value proposition search is lower since the orchestrator is able to use its
available resources to determine the modules needed. During the partner search,

66
however, the iteration level is high because the orchestrator first needs to identify the
partners with the necessary modules. Then again, if the value proposition is unclear, the
level of iterations is high in the first half of the search process and is lower during the
partner search because the identified search partner has already contributed its
knowledge to the value proposition search. These results are summarized in Table 7.
Finally, all cases clearly show that the partner providing the key module was integrated
into the ecosystem first. This key module is the most significant module, and either
requires the greatest number of adjustments or development efforts (e.g., as in the
Access or the Smart Building cases), or is the core module of the joint value proposition
(e.g., in the Data or InsurTech cases). The participation of the partner with the key
module also influences potential additional partners, as they can be convinced more
easily to commit to the ecosystem when the provider of the most significant module is
already a part of the ecosystem. The following statement by the search partner in the
Data case nicely illustrates this aspect:
“First, we added the most important partner, then the second […] and so on. This means that as one company after the other was […] added, this search group changed accordingly. […] Once the most important partner had been convinced, it was much
easier to convince all further partners.” (10C)
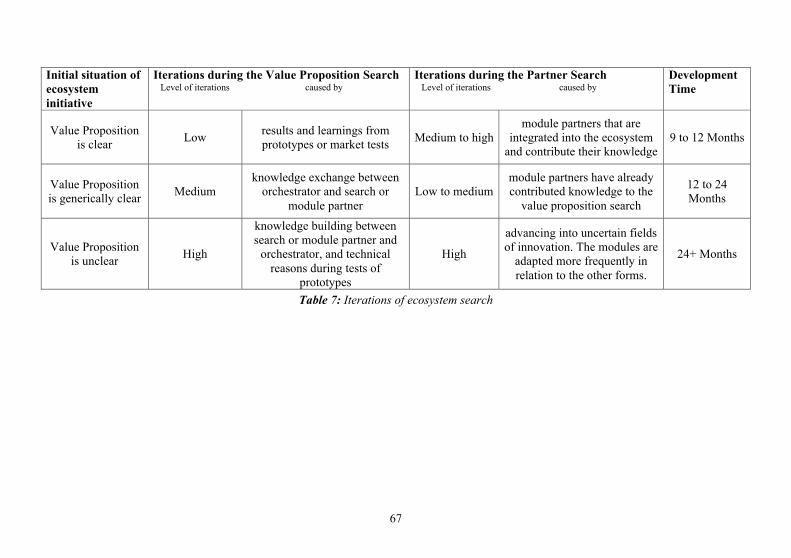
67
Initial situation of ecosystem initiative
Iterations during the Value Proposition Search Level of iterations caused by
Iterations during the Partner Search Level of iterations caused by
Development Time
Value Proposition is clear Low results and learnings from
prototypes or market tests Medium to high module partners that are
integrated into the ecosystem and contribute their knowledge
9 to 12 Months
Value Proposition is generically clear Medium
knowledge exchange between orchestrator and search or
module partner Low to medium
module partners have already contributed knowledge to the
value proposition search
12 to 24 Months
Value Proposition is unclear High
knowledge building between search or module partner and
orchestrator, and technical reasons during tests of
prototypes
High
advancing into uncertain fields of innovation. The modules are
adapted more frequently in relation to the other forms.
24+ Months
Table 7: Iterations of ecosystem search
68
2.5. Implications 2.5.1. Contributions to Research Our findings allow us to contribute to literature on three levels. First, we contribute to
the core of our study, the mechanisms that firms use to conduct the search for the
ecosystem’s value proposition as well as for the partners needed for its instantiation. In
the same vein, we show how these mechanisms, as well as the type of search (local vs.
distant) and the level of co-specialization, influence the intensity and occurrence of
iterations throughout the search process. Second, based on these findings, we contribute
to the broader topic of ecosystem establishment. And third, we contribute to the
literature on ecosystems in general.
Regarding the first contribution, Figure 18 summarizes the findings of our cross-case
analysis. We show that, based on the question of whether the knowledge needed to
define the value proposition is in the vicinity of the orchestrator’s knowledge or not
(i.e., the type of search, local vs. distant), there are three different possible starting
points for the value proposition search. Depending on which of these is used, the
orchestrator either conducts the value proposition search by itself or jointly with a
partner. The latter is either a module partner or, as introduced in this study, a search
partner. The same logic applies for the subsequent search for the ecosystem partners. If
the situation allows orchestrators to search for partners in the vicinity of their existing
knowledge and experience, i.e., in situations of local search, such a search is conducted
by the orchestrator in isolation. Conversely, in situations of distant search, the
orchestrator either involves a search partner (in a case with a lower degree of co-
specialization) or a search committee (in a case with a higher degree of co-
specialization). For a more detailed view of these key findings, please refer to the cross-
case Chapter, as well as Figure 18.
The mechanisms used throughout the search process also have a direct influence on the
occurrence and intensity of iterations during this process. Table 7 clearly shows that if
both the occurrence and the intensity of iterations increase, then the orchestrator has to
conduct a greater distant search for both the value proposition and the partners.
The summary of our findings in Figure 18 and Table 7 reveals several further
implications, which are of relevance for both researchers and practitioners alike.
Situations of local search for both value proposition and partners, and lower degrees of
co-specialization, might be ideal settings for startups, new ventures or, more generally,
innovation initiatives in situations where resources are limited. They allow for
69
comparably fast ecosystem establishment, quick market testing of ideas, and faster
implementation of the value proposition. The more the orchestrator has to conduct
distant search and is confronted with higher degrees of co-specialization, the longer the
time needed for the establishment of the ecosystem, and the greater the resources and
manpower required. This is due to the increased occurrence and intensity of iterations
and the necessary involvement of search partners or search committees. However,
orchestrators conducting local search should not allow themselves to be caught by
surprise: As Table 7 shows, even though the search for the value proposition might be
a straightforward process in situations of local search, iterations during the partner
search seem almost inevitable, and will consume both resources and time in the later
stages of ecosystem establishment.
With these findings, we are among the first to describe the iterative process involved in
the search for value propositions and partners in the context of ecosystems. Beyond this
contribution to literature, per se, these insights provide a second level of contributions,
namely to the wider field of ecosystem establishment.
In this regard, we show that it is beneficial to integrate the partner with the key module
into the ecosystem first. As defined in the findings section, we use the term ‘key
module’ to refer to (one of) the most significant module(s) for the value proposition –
either because it is particularly crucial for the functioning of the value proposition or
because it is particularly difficult to implement. If the orchestrator succeeds in doing
so, this is one way of overcoming the chicken-and-egg problem of ecosystem
establishment (Dattée et al., 2018). Considering the integration of the key module, it is
possible to estimate at an early stage how quickly and successfully an ecosystem can be
established, since it becomes obvious whether the orchestrator has managed to integrate
the key partner, thus setting a strong foundation for the further development of the
ecosystem – or not.
With this finding, we extend the statements of Dattée et al. (2018), who suggest that the
ecosystem blueprint (also see Adner, 2012; Baldwin & Clark, 2000; Iansiti & Levien,
2004b) is of great importance for convincing partners to join the ecosystem. The
blueprint can be seen as a clear vision for the future ecosystem, including a definition
of the desired value proposition, as well as governance, interactions, and structures (e.g.,
which value is created by which partner, who does what, how do members benefit, who
controls what) (Adner, 2006, 2012; Iansiti & Levien, 2004b; Williamson & de Meyer,
2012). We additionally extend the statements of Dattée et al., as the orchestrator does
not necessarily need a blueprint for a situation of distant search. In that case, the
70
orchestrator only needs a vision or an opportunity to convince a search partner of the
business opportunity provided by the ecosystems. With the help of the search partner,
a blueprint for the initiative can be elaborated, and necessary additional partners can be
convinced to join the ecosystem. Moreover, it is not enough to just have such a
blueprint; the initiative also needs the key module to convince other partners to commit
to the ecosystem. Furthermore, based on our findings, we argue that the importance of
the blueprint decreases with the development of an ecosystem. While the blueprint is
most relevant to convince key partners to join at the beginning of the initiative, at a later
stage, its relevance decreases when persuading the partners who provide less significant
modules to come on board.
These findings also imply that ecosystems develop in a path-dependent way. Based on
our findings, we postulate that the degree of co-specialization has a strong influence on
this dependence. A higher degree of co-specialization increases the need for
overlapping knowledge between ecosystem partners and, thus, increases the path
dependency: By remaining on common ground with mutual understanding, the
specialization of modules limits the spectrum of their future adaptions. On the other
hand, a low degree of co-specialization leads to less path dependency. In contrast to the
high degree of co-specialization, it is possible to deviate from the previous path via new
search partners, as perfectly demonstrated by the Data case.
On a third level, our findings provide contributions to the literature on ecosystems in
general. In this regard, previous studies have differentiated between ecosystem partners
as being, for instance, orchestrators, ecosystem leaders or hub firms, or complementors
(Adner, 2016, 2017; Adner & Kapoor, 2010; Jacobides et al., 2018; Moore, 1996;
Nambisan & Baron, 2013; Teece, 2016), or have distinguished between strategic
bottlenecks and technical bottlenecks (Baldwin, 2018; Hannah & Eisenhardt, 2018).
With our results, we introduce another type of actor in addition to the ones mentioned
above: The search partner. We discover that either the orchestrator, the search partner,
or the partners within the search committee define and search for the value proposition
or relevant ecosystem partners by conducting local search, i.e., all further partners stem
from the search field of this partner. As shown by our findings, specifically the ones
illustrated in Figure 18, the search partner has a strong influence on the value
proposition, as well as on the partners involved in situations of distant search. Based on
this strong influence, we can further show the influence of search partners on the
governance of ecosystems. This aspect is at the core of the ecosystem concept.
Accordingly, Jacobides et al. (2018) call for a better understanding of how ecosystems

71
are governed and how the orchestrator fills the role of ecosystem administrator. Our
results shed light on this very topic: If the initial orchestrator possesses the knowledge
to search for and define the value proposition, as well as find the necessary partners by
itself (i.e., to conduct local search), it is the ‘captain’ of the ecosystem initiative. In the
case of distant search, however, the orchestrator’s significance in shaping and building
the ecosystem is diminished. Instead, the orchestrator merely assigns either a search
partner or a search committee to these tasks. It is important to note that, upon fulfilling
this role, the search partners typically leave the ecosystem. In situations where there is
a low degree of co-specialization, the orchestrator will govern the ecosystem after this
happens. In cases where there is a high degree of co-specialization, the partners will be
organized into a search committee, which will continue to significantly influence the
ecosystem. Thus, the degree of co-specialization has a major influence on the
governance of ecosystems in situations of distant search.
Beyond the contributions to the ecosystem concept, our study offers interesting insights
into the intersection of organizational search and ecosystems. We found that ecosystems
are driven by a process of local search – either because the orchestrator builds up the
ecosystem in the vicinity of the existing knowledge base or because it involves search
partners/ committees to conduct that task. Thus, the ecosystem member that searches
for the value proposition and partners, and helps to understand their interests, conducts
local search. Contrary to the established notion in the literature on search (e.g., Cyert &
March, 1963; Monteiro et al., 2008; Moore et al., 2007; Shimizu, 2007), solutions
resulting from such local searches are not necessarily ‘simple-minded’ or less
innovative in an ecosystem context. Rather, the recombination of modules within the
ecosystem invokes major innovation potential, as effectively demonstrated by the
Access, Smart Building, and Sports cases, in which highly innovative solutions
emerged from local search.
We also found an interesting mechanism for avoiding distant search in situations in
which the orchestrator intends to build up an ecosystem in a field that is not in the
vicinity of their existing knowledge: Instead of searching alone, the orchestrator makes
itself visible and waits to be found by potential partners. For instance, in the Logistics
case, the orchestrator developed a prototype of the solution – in this case the
autonomous drone – used extensive media coverage to draw attention to this innovative
solution, and then waited for potential partners to approach their firm. The underlying
logic of this approach strongly resembles that of Afuah and Tucci (2012) conceptional
work on crowdsourcing as a means of conducting distant search: Instead of performing
72
distant search, firms might present a problem on a crowdsourcing platform and wait
until a member of the platform shows off by being able to solve it. For such an approach
to be valuable, the ‘crowd’ needs to represent distant fields of knowledge to be able to
propose very innovative solutions. An additional, necessary precondition is that the
interdependencies between the modules provided by the initiator of the crowdsourcing
initiative and the solution providers must be low, otherwise efficient collaboration
between them would be complicated. Our cases provide empirical evidence of these
thoughts and extend them to the ecosystem context: A low degree of co-specialization
among existing ecosystem partners, such as in the Logistics case, is necessary to apply
this approach in the ecosystem context.
2.5.2. Limitations and Future Research Beyond the usual limitations that come with any qualitative research endeavour
(Eisenhardt, 1989, 1991; Eisenhardt & Graebner, 2007), our findings might be prone to
several, more specific, limitations. First, we show the influence of the type of search
(local vs. distant) and the degree of co-specialization on the occurrence and intensity of
iterations during the search processes. However, given our qualitative research method,
we were not able to quantify this effect. Yet, such an understanding might be
particularly relevant for practitioners, since it would enable them to more precisely
assess the time and resources needed to establish ecosystems. For the same purpose, it
would be beneficial to conduct a more fine-grained analysis of the influence different
factors and conditions have on the time and resources needed to establish an ecosystem.
Second, our findings show that ecosystems develop in a path-dependent way, depending
on the type of search and the degree of co-specialization. However, we focus on the
early phases of an ecosystem’s lifecycle (Moore, 1993). It would be exciting to conduct
further investigations to determine whether this path-dependent development occurs
over the entire life cycle of an initiative. Through this research, it would be possible to
make a more precise statement about how far the selection of partners in the early stages
determines the future of ecosystems, and what criteria should be considered in the
selection of partners given these long-term effects.
Additionally, we analyzed the different mechanisms that firms were using to
successfully conduct their searches for the value proposition and partners. However, we
did not delve deeper into the question of whether these mechanisms were the result of
a perfectly planned and executed approach, entirely driven by foresight, or whether they
were, to some degree, unplanned and happened by chance. The literature on
organizational search suggests that the focus of attention on certain information can be

73
the result of an intentional search process or it could happen due to spontaneous
reactions to environmental stimuli. The first possibility increases the speed and
accuracy of perception and action, but might lead to potentially neglecting
opportunities, while, for the second possibility, the opposite is true (Barnett, 2008;
Ocasio, 1997). Further investigations along these lines would be intriguing, since the
literature on ecosystems is still divided on the question of the planned vs. unplanned
emergence of ecosystems (Jacobides et al., 2018).
Previous research (e.g. Granstrand & Holgersson, 2020; Hannah & Eisenhardt, 2018;
Jacobides et al., 2018; Rohrbeck et al., 2009) has called for a better understanding of
the interplay between competition and cooperation in ecosystems. While this aspect is
beyond the scope of our research, we do believe that mechnisms such as the search
committee or even the cooperation between orchestrator and search partners might be
affected by competition. This might open up several intruiguing questions for future
resaerch.
Finally, and more generally, since this work is among the first to study the iterative
search processes for the value proposition and partners in the context of ecosystem
establishment, we hope to motivate future research along these lines.

74
3 A Single Conductor can Lead a Large Orchestra: How Startups Orchestrate Ecosystems2
Introduction
As mentioned before an ecosystem is usually managed by an orchestrator, who plays a
key role within an ecosystem (Adner, 2006, 2017; Jacobides et al., 2018). Given this
pivotal role, existing research has largely agreed on big and powerful corporates being
the logical orchestrators (Fuller et al., 2019; Iansiti & Levien, 2004b; Moore, 1993).
However, some studies are questioning this established believe and mention startups as
ecosystem orchestrators, without explaining how such a small and vulnerable firm can
orchestrate an ecosystem of several and potentially much larger and more powerful
companies (Clarysse et al., 2014; Dhanaraj & Parkhe, 2006; Iansiti & Levien, 2004b;
Jacobides et al., 2018; Zahra & Nambisan, 2012). Jacobides et al. (2018), setting the
foundations of the structural stream on ecosystems, take up this open question and call
for research that answers whether small firms are equally suitable for orchestrating
ecosystems and, in case they are, how they manage to do so. This question is particularly
important since startups have a major influence on today’s economy (Criscuolo et al.,
2014; Haltiwanger et al., 2013; Holcombe, 2003). On top of this, startups as ecosystem
orchestrators might be an intriguing new phenomenon, combining the speed and
innovativeness of startups with the power of an ecosystem of several and large firms.
This might not just change the dynamics of competition and question existing believes
on the role and impact of startups. It also opens-up new questions for startup investors
or corporates being members of startup-led ecosystems.
We were able to identify several startups that have built up and are managing
ecosystems, and we used these empirical insights to conduct a qualitative multi-case
study (Eisenhardt, 1989; Yin, 2014) with nine cases. This allowed us to understand how
a startup can successfully orchestrate an ecosystem, despite the inherent challenges that
come, among others, from its lack of resources, power, or credibility (Clarysse et al.,
2014; Dhanaraj & Parkhe, 2006; Iansiti & Levien, 2004b; Jacobides et al., 2018;
Nambisan & Baron, 2013; Zahra & Nambisan, 2012).
2This Chapter is based on the working paper “A Single Conductor can Lead a Large Orchestra: How Startups Orchestrate Ecosystems” with co-authors Bernhard Lingens and Oliver Gassmann

75
In the course of our qualitative study, we identified two key dimensions, which we
subsequently used to build the central framework. This framework determines four
types of startup-led ecosystems. Based on our findings, we demonstrate the approaches
that startups are using to orchestrate these different types of ecosystems. In doing so,
we contribute to research on the ecosystem concept in several ways. First, our findings
show that startups can be successful orchestrators as well as how they achieve this
despite their inherent disadvantages. In this regard, our framework summarizing our
findings (presented in the implications section of this study) could serve as an aid in
making decisions about which strategies to use for the orchestration of a specific type
of ecosystem. Second, we discuss the resulting implications of these findings for the
orchestrating start-up, its ecosystem partners, accelerators, and investors, as well as for
other types of resource-constrained firms striving to orchestrate an ecosystem. And
third, by presenting the startup in a new role as an orchestrator of an ecosystem, we
strive to open up a new stream of research along these lines.
In the next Chapter, the literature review, we elucidate further about ecosystems and
orchestration. Then we introduce four tasks that startups must perform in order to
successfully orchestrate an ecosystem; these tasks provide the underlying structure for
our empirical exploration.
Literature Review 3.2.1 Key Characteristics of an Ecosystem and Ecosystem orchestration
According to the structural view 3 , the ultimate goal of an ecosystem is the
materialization of a joint value proposition by the firms involved, which provide
modules for this joint value proposition (Adner, 2017; Jacobides et al., 2018). However,
not all of the firms involved are ecosystem members: only firms whose modules fulfill
two critical criteria are considered to be part of the ecosystem (Jacobides et al., 2018).
The first criterion is that the modules need to be complementary, i.e. they increase each
other’s value (the so-called supermodularity) (Milgrom & Roberts, 1990; Topkis, 1978,
1998) or cannot function without each other (Teece, 1986). This implies that actors need
to explicitly create new modules – or at least mutually adapt existing modules – to
3 The so-called “structural view”, introduced by (Adner, 2017) emerged recently and has quickly established itself as an independent stream of research (already sited 10 times in A+ journals, 14 times in A journals and 28 times in B journals in just two years) within the broader area of ecosystems. Thus, in line with the notion within the ecosystem community, I consider the ecosystem-as-structure view to be a suitable foundation for my work.
76
achieve complementarity with the modules provided by the other partners (Baldwin &
Clark, 2000). The second criterion is that the modules are ‘unique’, i.e. the partner
providing them cannot easily be replaced. As a result, ecosystem partners are mutually
dependent on each other: if one of them is failing or leaving the ecosystem, then the
ecosystem as a whole will fail. This interdependence has two crucial implications for
the subsequent discussions. First, it defines the boundaries of an ecosystem since firms
providing modules that are relevant for the joint value proposition but are not
characterized by complementarity and uniqueness, must be regarded as suppliers but
not as ecosystem members. Second, it highlights the importance of the orchestrator,
whose main task is to align this interdependent set of partners towards the joint value
proposition.
Beyond the ecosystem concept, streams of literature on related concepts, such as
alliances and networks, also discuss the role of startups (Doz, 2019) or firms with
similar resource constraints, such as SMEs (Radziwon & Bogers, 2019). However,
since these concepts lack the aspect of orchestration, which is central to ecosystems,
they do not explain how startups can take over the particular tasks related to such
orchestration (Adner, 2006, 2017; Jacobides et al., 2018). Additionally, ecosystems are
different than platforms (Gawer & Cusumano, 2014). For instance, a platform offers
heterogenous groups that would not otherwise interact the possibility for exchange
(Gawer, 2014). Hereby, the value proposition of a platform can be defined as the result
of the increasing interaction between customer and provider (Eisenmann et al., 2011).
For differentiation of ecosystems from related concepts, please see Table 8.

77
Construct Ecosystema Supply Chainsb Network and Alliancesc
Transaction Platformsd Open Innovatione
Description
The alignment of a multilateral set of partners that must
interact in order for a focal value proposition
to materialize.
Partners operate autonomously and create their own
value propositions. Precise hierarchical
structure and bilateral agreements.
The focus on a joint value proposition is
missed. No interaction in order to materialize
a new value proposition. Precise
hierarchical structure.
No joint value proposition is
pursued at the core. Rather, there is an
exchange opportunity
between supply and demand sides with
bilateral agreements.
The focus on a joint value proposition is
missed. No hierarchical
structure and no set of multilateral
partners.
Logic
Materialization of a joint value proposition by firms that provide
complementary modules.
End product is the sum of partial value
propositions.
Partners follow own strategic goals but
benefit from network effects.
Two-sided market, which connects
buyers and sellers.
Firms profit from unilateral exchange
of expertise.
Key difference
to ecosystem
n.a.
Independent and replaceable partners. Existence of bilateral
agreements.
Alliance partners operate autonomously. No creation of a joint
value proposition.
No unique and complementary
partners who jointly create a value proposition.
No focal value proposition for a multilateral set of
partners.
Table 8: Overview of ecosystem related concepts a (Adner, 2006; Jacobides et al., 2018), b (Porter, 1985; Simchi-Levi, 2008), c (Gulati, 1999; Powell et al., 1996), d (Gawer, 2002; Parker et al., 2016b), e (Chesbrough, 2006;
von Hippel, 2005)

78
In the following Chapter, we delve deeper in the actual tasks of orchestration.
According to the structural view, an ecosystem is defined as the alignment of partners,
by an orchestrator, towards a joint value proposition. This definition allows us to define
the key tasks an orchestrator has to fulfill. First, the materialization of a joint value
proposition is at the very heart of the ecosystem concept, and the orchestrator’s key task
is to make sure this value proposition comes true (Adner, 2017; Jacobides et al., 2018).
In this study, we refer to this task as product development, which includes activities
related to the materialization of the joint value proposition. As a second cornerstone,
alignment refers “not only to compatible incentives and motives but also raises the question of actors’ consistent construal of the configuration of activities” (Adner,
2017). The first part of this task, the provision of incentives for partners to join the
ecosystem and stay with it, will be referred to as persuasion. The second part, which is
based on the exchange of information among partners .(Adner, 2017), will be called
coordination. However, ecosystems are usually not static – rather, as with most
economic activities, the usual aim is to grow the ecosystem and to scale the value
proposition. This growth is particularly relevant in an ecosystem context, since an
increasing number of partners might shift incentive systems as well as dynamics within
the partner structure, and, thus, might also shift the alignment of partners. Therefore,
studies on ecosystems should not view orchestration as a static task but must consider
its growth as well (Adner, 2017; Jacobides et al., 2018; Moore, 1993). In this study, we
refer to the task of growing the ecosystem as scaling. Beyond these four key tasks,
which are directly derived from the definition of an ecosystem according to the
structural view, namely product development, persuasion, coordination, and scaling, there might be a multitude of other tasks relevant to the orchestration of ecosystems.
However, in this study, we only focus on these four tasks, since they are at the very
heart of the ecosystem concept.
3.2.2 Key Challenges Startups Face when Orchestrating an Ecosystem
The abovementioned tasks lead to significant challenges for startups, which is why
scholars have repeatedly claimed that large firms are better suited to orchestrate
ecosystems.
The tasks of persuasion and scaling, in particular, require an ecosystem orchestrator to
display compliance and conformity in order to secure ecosystem membership, and also
to be the provider of stability within the ecosystem (Dhanaraj & Parkhe, 2006; Hannah

79
& Eisenhardt, 2018; Iansiti & Levien, 2004b). These aspects are arguably associated
with corporates, not startups. In this regard, the advantages that come from size and
bargaining power are helpful when it comes to persuasion and scaling (Adner, 2017).
On top of this, the tasks of product development and coordination generate significant
coordination efforts, development costs, and transaction costs for the orchestrator
(Jacobides et al., 2018). This might be particularly challenging for startups, given their
limited resources (Skala, 2019).
This raises the question of how startups can orchestrate ecosystems, despite these
challenges. Some authors have claimed that the orchestrator does not have to be the
most resource-rich actor in the ecosystem, but rather the one that uses particular skills
or power to steer the ecosystem, i.e. intellectual capital to stimulate and shape the
business ecosystem (Williamson & de Meyer, 2012), ‘informal authority’ based on
knowledge and status, control over crucial resources and technologies (Gulati et al.,
2012), or the capability for ‘problem-framing’ to understand and solve problems to
stimulate innovation and capture its value (Brusoni & Prencipe, 2013). Others have
argued that the firm’s capability to innovate, to scan and sense the environment, and the
capability to integrate are all crucial for successful ecosystem orchestration (Helfat &
Raubitschek, 2018). Startups might display some critical advantages in this regard in
terms of learning, sharing their knowledge, and adaption (Zahra & Nambisan, 2012).
However, even though these scholars propose that startups might use these specific
strengths to overcome the challenges of orchestration, they have not sufficiently
explained how they are doing so. Thus, in the following methods section, we explain
how we have used our qualitative multi-case study to explore this crucial question.
Methods
We believe a case study is a suitable methodological approach to address the
abovementioned questions (Eisenhardt, 1989). This is because the ecosystem concept
is still under-researched and lacks empirical foundations (Jacobides et al., 2018).
Moreover, we view this as a suitable approach since we intend to open up a new stream
of research on startup-led ecosystems. In this vein, we follow established notions in
case study research (Eisenhardt, 1989), and intend to observe different patterns of ‘how’
startups orchestrate ecosystems and describe the boundary conditions driving the
differences among them – the ‘why question’.

80
Based on the four tasks of orchestration defined in the literature review, we used several
criteria to sample our nine cases. First, we selected the cases due to our definition of an
ecosystem, introduced above. This definition of an ecosystem also defined its
boundaries, i.e. which firms are part of the ecosystem and which are not. In this sense,
we only considered partners who offer a unique and complementary contribution to the
joint value proposition. Mere suppliers, who provide generic modules, are not within
this studies scope. Second, all of the ecosystems studied needed to be orchestrated by
startups. For this, we applied the following criteria to distinguish startups from
established firms: First, startups are innovation-driven firms and aim to create products
or services that do not yet exist (Gërguri‐Rashiti et al., 2017). Second, they have a short
operating history (Szarek & Piecuch, 2018) and are, on average, less than 10 years old
(Gërguri-Rashiti et al., 2017). However, they are massively growth-oriented despite
having limited resources, such as knowledge, talent, and capital (Skala, 2019), as well
as high uncertainty (Katila et al., 2012), and being at an early stage of operation (Davila
et al., 2003; Gurel & Sari, 2015; Schlaegel & Koenig, 2014; Veselovsky et al., 2017).
In addition, we verified that all startups were orchestrators and were performing
orchestration tasks. Lastly, in order to ensure generalizability, we chose cases with high
diversity in terms of value proposition (Eisenhardt, 1991; Ozcan & Eisenhardt, 2009).
This kind of approach has also been used by previous studies on ecosystems (Chatman
& Jehn, 1994; De Wulf et al., 2001; Schoenecker & Cooper, 1998). However, we do
not believe that our findings are in danger of being distorted by industry specifics. This
is because ecosystems usually involve different types of partners from different
industries. Furthermore, previous ecosystem research has also used such sampling
techniques to provide a more comprehensive overview, while ensuring that results are
not distorted by cross-industry differences (Davis, 2016; Mäkinen & Dedehayir, 2013;
Rong et al., 2015b). Finally, we follow the recommendation to use polar cases in order
to derive clear and extreme patterns (Eisenhardt, 1989).
The focus of our data collection was on interviews with startup managers responsible
for orchestration, C-level staff, and/or co-founders, since these people are mainly
responsible for performing the tasks of orchestration. (Given the nature of startups,
these roles may overlap in some cases.) To triangulate and deepen our results, we
conducted additional interviews with other ecosystem participants, investors,
accelerator staff, and even customers. Typically, interviews lasted between 30–90
minutes and were recorded and transcribed verbatim immediately after the interviews.
Furthermore, we consulted external data for the evaluation of the funding and costs. For

81
instance, we used investor reports and startup news and included standard key ratios to
understand what funding has usually been obtained. Additionally, we interviewed
experts regarding main cost drivers, and checked the type of investor and the associated
investment (e.g. an early-stage venture capital firm might only provide small amounts,
a later stage venture capital firm, or even a corporate venture capital firm, might provide
large amounts). Lastly, we conducted a consistency check on all these sources. It is to
be noted that in the Sports Case, we were only able to interview one person, the
company's CEO, and, furthermore, we have triangulated even more intensively in this
case. This was possible because the case is excellently documented in public records
(newspapers, blog entries, etc.). Nonetheless, we were able to gather information from
a similar case (Factoring Case) with a more extensive database showing similar findings
to the Sports Case. For this reason, we can be confident that the given information from
the Sports Case is correct. For triangulation, the interviews were willingly conducted
with temporal distance, and questions from previous interviews were repeated to ensure
the validity of the information received. In the Maintenance Analytics Case, one
interviewee requested not to be recorded, which is why there is no transcript of this
interview. This triangulation interview was held with a person external to the
ecosystem, lasted for approximately 20 minutes, and aimed to verify the information
we received from our case company. In all cases, we collected secondary data, such as
media reports, internal documents, or presentations, to triangulate our findings (Jick,
1979). Our data sources and case descriptions are shown in Tables 9 and 10.
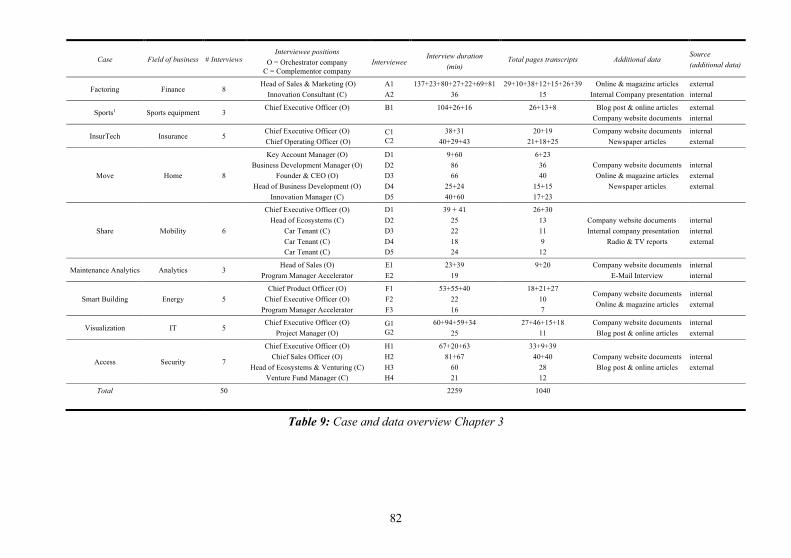
82
Case Field of business # Interviews Interviewee positions
O = Orchestrator company C = Complementor company
Interviewee Interview duration
(min) Total pages transcripts Additional data
Source (additional data)
Factoring Finance 8 Head of Sales & Marketing (O)
Innovation Consultant (C) A1 A2
137+23+80+27+22+69+81 36
29+10+38+12+15+26+39 15
Online & magazine articles Internal Company presentation
external internal
Sports1 Sports equipment 3 Chief Executive Officer (O)
B1
104+26+16
26+13+8
Blog post & online articles
Company website documents external internal
InsurTech Insurance 5 Chief Executive Officer (O) Chief Operating Officer (O)
C1 C2
38+31 40+29+43
20+19 21+18+25
Company website documents Newspaper articles
internal external
Move Home 8
Key Account Manager (O) Business Development Manager (O)
Founder & CEO (O) Head of Business Development (O)
Innovation Manager (C)
D1 D2 D3 D4 D5
9+60 86 66
25+24 40+60
6+23 36 40
15+15 17+23
Company website documents Online & magazine articles
Newspaper articles
internal external external
Share Mobility 6
Chief Executive Officer (O) Head of Ecosystems (C)
Car Tenant (C) Car Tenant (C) Car Tenant (C)
D1 D2 D3 D4 D5
39 + 41 25 22 18 24
26+30 13 11 9
12
Company website documents Internal company presentation
Radio & TV reports
internal internal external
Maintenance Analytics Analytics 3 Head of Sales (O)
Program Manager Accelerator E1 E2
23+39 19
9+20
Company website documents E-Mail Interview
internal internal
Smart Building Energy 5 Chief Product Officer (O)
Chief Executive Officer (O) Program Manager Accelerator
F1 F2 F3
53+55+40 22 16
18+21+27 10 7
Company website documents Online & magazine articles
internal external
Visualization IT 5 Chief Executive Officer (O)
Project Manager (O) G1 G2
60+94+59+34 25
27+46+15+18 11
Company website documents Blog post & online articles
internal external
Access Security 7
Chief Executive Officer (O) Chief Sales Officer (O)
Head of Ecosystems & Venturing (C) Venture Fund Manager (C)
H1 H2 H3 H4
67+20+63 81+67
60 21
33+9+39 40+40
28 12
Company website documents Blog post & online articles
internal external
Total 50 2259 1040
Table 9: Case and data overview Chapter 3

83
Case (Orchestrator
origin)
Foundation of
Orchestrator Number of partners
Number of Orchestrator employees at
the start of the ecosystem
initiative (and today)
Partner origin Case Description4
Factoring (Switzerland) 2016 6
2-10 (today: 11-50)
Switzerland, United States of America
The Orchestrator of the Factoring case offers Swiss SMEs operating in developing countries a factoring solution for doing business with developing countries. Long payment periods (up to half a year) pose numerous challenges that can trigger liquidity problems for SMEs. The Fintech ecosystem offers a customized solution for eliminating liquidity bottlenecks in order to enable business activities in developing countries. In addition to the orchestrator, the ecosystem includes funding partners, an insurance company, a reinsurer, a bank, and a software company that uses an algorithm to assess the risk of SME claims. For a detailed outline of this ecosystem, see Figure 26.
Sports (Switzerland) 2014 6 1 (today: 2-10)
Canada, Germany, Switzerland
The Sports case focuses on a solution for the production of 3D soles specifically for sports shoes. The soles are manufactured using the technology of a 3D printer and knowledge of biomechanics, and they promise unique wearing comfort as well as performance. The customer (private individuals) usually receives a standard shoe sole when purchasing sports shoes. The problem is that when a sole doesn’t fit, it can cause pain. Important players in this ecosystem are the partners who offer the 3D printing technology and the software solution. In addition, the ecosystem has an e-commerce partner to successfully commercialize its products. For a detailed overview of this ecosystem, see Figure 27.
InsurTech (Austria) 2017 3 1 (today: 2-10) Austria, Germany
The InsurTech case represents an ecosystem that merges a physical product with a customized insurance solution. An example application combines a smart toothbrush with a dental insurance policy. Specifically, the company acts as an insurance intermediary between B2C companies that manufacture physical products and insurers. The aim is to offer a customized and comprehensible insurance solution for private customers. The insurance is thus fully implemented into the sales process for the physical product. For a detailed overview of this ecosystem, see Figure 28.
Move (Switzerland) 2014 7
2-10 (today: 11-50) Switzerland
The orchestrator of the Move case developed a personalized relocation solution. Generally, the person moving must address all companies involved in the move (e.g. cleaning service, furniture transport, etc.) individually and deal with them. The Orchestrator fulfills this task and coordinates all ecosystem partners involved in order to provide a personalized relocation solution from a single source. For a detailed overview of this ecosystem, see Figure 29.
Share (Switzerland) 2013 7
2-10 (today: 11-50) Switzerland
The value proposition of the Share Case is a peer-to-peer car sharing opportunity. With the use of a technical solution, private car owners and renters are interactive, although employees of the rental platform are usually there to assist them personally during the entire process. Furthermore, an independent insurer offers an insurance solution for the rented cars. In addition to these core partners, there are a number of other players, such as garages, petrol stations, credit partners, or supermarkets, that offer additional services or benefits to tenants or private lessors. For a detailed overview of this ecosystem, see Figure 30.
Maintenance Analytics (Turkey)
2016 13 2-10 (today: 2-
10)
Great Britain, Netherlands, United States of America,
Turkey
The ecosystem of the Maintenance Analytics case developed a software that analyzes potholes, rocks, bumps, and other types of damage on public roads, using a unique algorithm. To achieve this performance promise, the company works with many different stakeholders. Firstly, the public sector is crucial for road information, and secondly, the ecosystem obtains geodata from private companies. The software solution promises cities and countries a reduction in maintenance costs and helps to detect the damage mentioned above at an early stage and initiate prophylactic actions. For a detailed overview of this ecosystem, see Figure 31.
Smart Building
(Italy) 2015 16
2-10 (today: 11-50)
France, Italy, Netherlands, United
Kingdom, United States of America,
Switzerland
The Smart Building case has developed an intelligent climate and heating solution to achieve an optimal and sustainable indoor climate (e.g. in office buildings or shopping malls). The temperature is monitored by a sensor and the existing ventilation is turned on and off by a device developed by the orchestrator. This ecosystem consists of a multitude of actors with multilateral and bilateral relations. The company has a large number of partners who have developed the hardware for the company, as well as partners who have developed the appropriate software and other technologies (e.g. data transfer). For a detailed overview of this ecosystem, see Figure 32.
Visualization (Switzerland) 2015 4
2-10 (today: 11-50)
United States of America, Switzerland
The orchestrator of the Visualization case develops 3D model maps of cities with two resulting value propositions for different customers. First, the 3D model allows cities to evaluate whether their infrastructure is ready for autonomous driving of cars (e.g. if the curbs are high enough to be recognized by these vehicles). Secondly, car manufacturers have the possibility to use the simulation model for digital test cycles of autonomous vehicles. The creation of such maps requires an ecosystem approach, as an intensive co-specialization of software and hardware providers is required, and the authorities must facilitate the creation of 3D models of the respective metropolitan areas. For a detailed overview of this ecosystem, see Figure 33.
Access (Germany) 20065 5
2-10 (today: 11-50)
Germany, United Kingdom, United States of America
The promise of the Digital Access case lies in a digital solution that allows the customer to open doors of cars, rooms, buildings, etc. with a temporary smartphone code. This eliminates the need to exchange keys, which is particularly advantageous in connection with shared goods. Therefore, one of the most significant applications (among others for which the Orchestrator has different employees and partners) offers keyless digital access to rental cars. To unlock cars via smartphone, the car rental company has technically converted its cars to the new system and has developed a mobile app for customers. Other hardware and software solutions had to be implemented by the other ecosystem partners. To this end, the actors adapted their modules to synchronize the software, hardware, and service components. For a detailed overview of this ecosystem, see Figure 34.
Table 10:Case descriptions and further information
4For a visual illustration of the different cases please see figures 26 to 34 in the appendix. 5The Orchestrator of the Access case has carried out research and development activities for a long time and has only begun to build its own ecosystem in recent years. For this reason, the founding year differs from that of the other startups.

84
Our case sampling includes a diverse set of value propositions: Business-to-Customer and Business-to-Business (e.g. Factoring case), and physical goods (e.g. Sports case), as well as services (e.g. Move case). In addition, Maintenance Analytics provides infrastructure support and the Smart Building Case focuses on process optimizations.
We analyzed our data by inductively searching for patterns and emerging themes across the cases (Eisenhardt, 1989), both by using methods such as case pairings, drawings, and tables to detect patterns more easily, as well as by word codings for deep-dive and validation. Our coding scheme is shown in Figures 19 and 20. The analysis of the case studies was guided by the four tasks of orchestration, as described in the literature review. However, one additional task emerged in the course of our analysis, namely funding. Startups are usually not profitable during their early stage of operating, which requires them to collect funds from investors in order to cover their expenses (Picken, 2017). It is to be noted that by ‘funding’ we do not mean the funding of the ecosystem per se, but merely of the startup. As shown by our empirical data, funding was tightly linked to the four tasks of orchestration as derived from theory: Depending on the product development, the startups had to collect more or less funding. The differing coordination efforts led to significant differences in costs and therefore funding needs. The same accounts for scaling and persuasion. Given its significance, we added funding as a fifth task of orchestration in the context of startup-led ecosystems. This is consistent to the literature on startups since funding is widely considered as one of the key aspects of the startup world (Cassar, 2004; Garg & Shivam, 2017; Manigart & Struyf, 1997; Mustapha & Tlaty, 2018). Thus, we believe it is justifiable to add this startup specific task to the other tasks of orchestration derived from the ecosystem stream, especially given our intention to open up a new stream of literature on the intersection of ecosystems and startups as orchestrators.
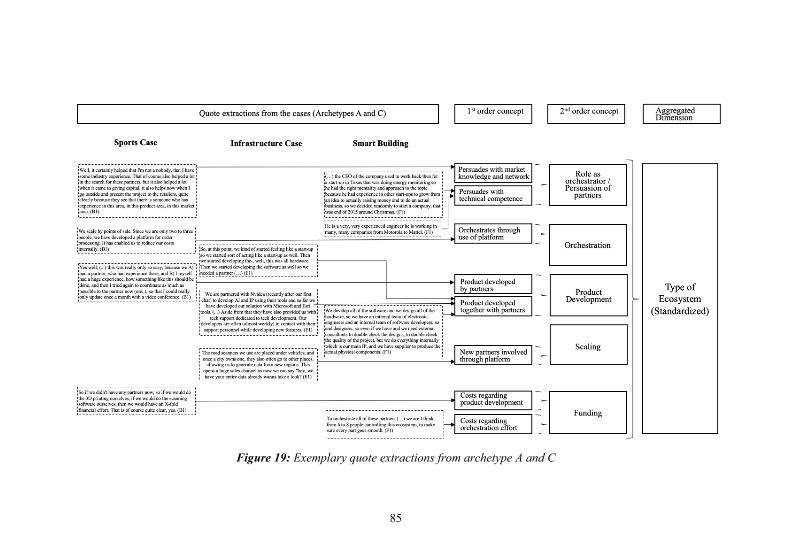
85
Figure 19: Exemplary quote extractions from archetype A and C

86
Figure 20: Exemplary quote extraction from archetype B and D

87
In the course of both data analysis but also data collection, it was essential to ensure that the four tasks of orchestration were actually performed by the startup. Given its significance, we explain for each task how we ensured this critical matter: Product development (i.e. activities related to the materialization of the value proposition) was both checked based on data and external validity checks. Since the ecosystems studied aimed to sell their value propositions, external data (such as sales brochures, homepages etc.) very available and allowed for consistency checks with the descriptions given by the interview partners (both from the orchestrator as well as from the partners). Thus grounded, we were able to double-check (both based on the interviews with actors involved in the ecosystem and externals) what was needed for this value proposition to come true and who was the main driver behind that. We see a strong validity of this finding since all interviews with both orchestrators and partners, external data, and external estimations were consistent throughout all the cases. This is all the more true since in all cases, the orchestrator was the only player being in interaction with all partners involved in the product development. Thus, it is very unlikely that another player within the ecosystem performed the task of product development even though this player did not deal with all relevant partners being involved in that task. The same is true for the tasks of coordination and persuasion. Given the multilateral nature of ecosystem interactions, coordination needs to embrace all partners involved in the ecosystem and can, thus, only be performed by the firm being connected with all partners (Adner, 2017; Jacobides et al., 2018). On top of this, coordination was done either by a platform or by people. In case of the first, it was easy to track who was in charge of implementing that platform and, in case of the latter, whose employees were coordinating the other players, i.e. setting up and managing meetings, gatherings etc. Scaling involved activities such as the integration of sales and additional module partners. We were able to trace back these activities to the orchestrator for the same reasons as mentioned above: Based on interviews with the orchestrator but also with the partners involved for the purpose of scaling we were able to double check who actually involved these partners, i.e. set-up meetings and contracts. Finally, funding could only be performed by the orchestrating startup because this firm being the one selling its shares and receiving funding in return. Obviously, selling shares can only be performed by the company owning these.
As a result of our analysis, we observed that some of our cases show similar patterns, while others are considerably different from each other. We found that these patterns can be traced back to two surrounding conditions, which we call value creation and type

88
of ecosystem. The first dimension, value creation, indicates whether the orchestrator participated in the value creation for the joint value proposition (i.e. providing a module) or if the modules are provided solely by the partners, with the orchestrator merely focusing on the task of orchestration. The findings section shows whether the orchestrator provides a complementary and non-generic module for the joint value proposition or if that firm merely acts as an orchestrator. The second dimension, type of value proposition, indicates whether the ecosystem is ‘standardized’ or ‘customized’. A standardized value proposition is one that delivers the same value proposition to every client, by always involving the same partners in the same way. On the contrary, a customized ecosystem provides a unique value proposition to each customer.
This implies that the value proposition changes for each customer. Consequently, different modules, and thus different partners, are required. Based on these two dimensions, we were able to define four different archetypes of startup-led ecosystem orchestrators (Miles, 1994). Although these archetypes emerged from our inductive analysis, they correlate nicely with the ‘types’ of ecosystems identified by Iansiti and Levien (2004b), which increases their validity and generalizability as well as the link to further studies on ecosystems. Figures 19 and 20 illustrate how quote extractions from the cases are used to determine the startup’s role in the value creation, which allows us to classify it as one of the four archetypes. Also, the figures illustrate the classification of the cases based on the type of value proposition (standardized vs. customized). We further used a matrix that addresses each of the four archetypes and the four core tasks of orchestration executed by a startup. The principal differences between the four archetypes are, on the one hand, which actors provide the necessary modules for value creation and, on the other hand, whether the value creation is standardized or customized. For instance, archetypes A and C both offer a standardized value creation. In archetype C, the startup itself contributes a module to the value proposition, thus going beyond the mere role of orchestrator of the ecosystem. In contrast, the startup in archetype A is only responsible for the orchestration of the ecosystem and does not contribute a generic module towards the value creation. Please see Figure 21 for an overview of the archetypes and associated cases. This framework allowed us to structure our findings and connect the patterns (i.e. approaches of ‘how’ startups orchestrate ecosystems) with the underlying boundary conditions (i.e. ‘why’ they are doing so (Eisenhardt, 1989). In the following Chapter we present these findings by describing each archetype one by one in great detail, structured along the four core tasks.
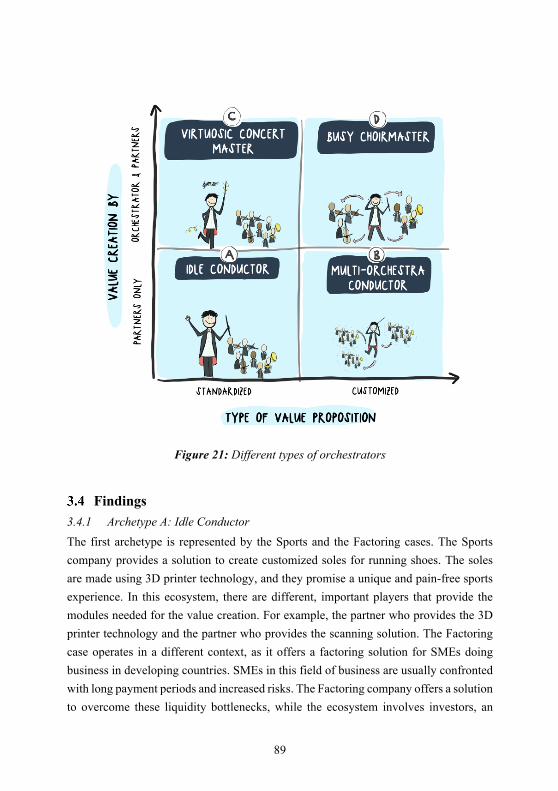
89
Figure 21: Different types of orchestrators
Findings 3.4.1 Archetype A: Idle Conductor The first archetype is represented by the Sports and the Factoring cases. The Sports company provides a solution to create customized soles for running shoes. The soles are made using 3D printer technology, and they promise a unique and pain-free sports experience. In this ecosystem, there are different, important players that provide the modules needed for the value creation. For example, the partner who provides the 3D printer technology and the partner who provides the scanning solution. The Factoring case operates in a different context, as it offers a factoring solution for SMEs doing business in developing countries. SMEs in this field of business are usually confronted with long payment periods and increased risks. The Factoring company offers a solution to overcome these liquidity bottlenecks, while the ecosystem involves investors, an

90
insurance company, banks, and a software company that assesses the risk of the SMEs' claims.
Arguably, when considering joining an ecosystem, firms evaluate the tradeoff between the opportunity and the potential risks incurred. Therefore, the orchestrator needs to provide evidence that the ecosystem is likely to succeed, which relates to the challenge of persuasion. To persuade new partners to join their ecosystems, the orchestrators in the Factoring and Sports cases showed their potential partners that they had an excellent network and knowledge of the market. In both cases, the startup fulfilled the tasks of product development and cooperation that define an orchestrator by actively searching for partners to implement their ideas for a new joint value proposition, which they were not able to realize in isolation. The CEO from the Sports case sums it up nicely:
“I have found the partners through my many years of experience in the industry. (...) It certainly helped that I am not a nobody in the industry.” (B1)
Indeed, in this first archetype, in which the orchestrator does not contribute a module to the joint value proposition, and where the value proposition is standardized, the founders of the analyzed firms had worked in the industry concerned before, and were well regarded. They then used their knowledge of the industry and their networks to engage with potential partners and convince them to join the ecosystem. Therefore, their roles as startups were solely to build and orchestrate the ecosystems, and their networks and their knowledge gave them the ability and legitimacy to do so.
As the startup does not contribute a content-related module to the value proposition, its minor role is to coordinate. We observed in both the Factoring and Sports cases that the standardization of the ecosystem enabled the use of a platform. (In this Chapter, the term ‘platform’ can be understood as a coordination possibility.) In this context, using a platform affects the running costs of the ecosystem since the platform allows for a reduction in costs, for example, by coordinating with partners about new inquiries, which previously had to be carried out by the employees of the orchestrator. Furthermore, the platform facilitates scaling of the ecosystem. The Head of Sales & Marketing in the Factoring case described it as follows:
“That's when a software provider came into play [...] with whom we developed a platform. It allows us to automatically manage the interplay among funding partner,
the insurance company, and our customers.” (A1)
In the Sports case, the partner provided the scanning software, which was installed at the electronic point-of-sale devices. The devices scan the client’s feet and send the data
91
to the orchestrator, who forwards it to the manufacturer. Hence, rather than providing a complementary module for the value creation, the Sports startup’s primary role was to make sure the partners are aligned.
Additionally, the orchestrator in the Sports case tried to keep transaction costs low by optimizing communication behaviour, as illustrated in the following quote:
“Yeah, how can you be an orchestrator? [...] By trying to communicate as efficiently as possible. Do not travel to Italy, but make a FaceTime call, because one hour later
you will be able to talk to Canada and the hour after that to Belgium.” (B1)
As already mentioned, in this archetype the orchestrator does not contribute a module to the value proposition. In both of our cases, we saw that the orchestrator developed the value proposition based on insider knowledge, and subsequently gathered the different partners together to set up the ecosystem. Because the orchestrator had experience in the industry and could trust the partners, the orchestrator was able to focus on controlling and developing the ecosystem rather than product development.
Further down the line, scaling happened through involving additional sales partners, who brought new customers to the ecosystem. This growing pool of partners and customers was first managed by the orchestrator’s team until an internal platform for order processing was launched. From that moment, the business grew more rapidly, while simultaneously enabling the startup to reduce its coordination efforts, as described by the Sports company’s CEO:
“We scale by points of sale. Since we are only two to three people, we have developed a platform for order processing. It has enabled us to reduce our internal costs.” (B1)
In terms of funding, both of our cases have shown that coordinating the first partners to ensure alignment and, later, building the platform, were the main costs drivers. However, once the platform was running, the business rapidly became profitable since the platform enabled quick scaling while keeping transaction costs low. More importantly, the startup did not develop a key component or technology for the ecosystem’s value proposition, which kept the expenses low. For these reasons, the need for funding was relatively low, which is highlighted by the following quote from the Factoring case:
“If we had built the solution on our own, our financing requirements would have been much, much, much higher. So if that had been possible at all, the funding would have
been [...] ten, twenty, fifty times higher.” (A1)

92
Regarding the type of funding, it is to be noted that in both case companies received capital in the form of smart money. This is money provided by an investor who has knowledge, a background, and a network in the field the startup is in.
3.4.2 Archetype B: Multi-orchestra Conductor Since the Move company displays two distinct value propositions, we split the Move case into two sub-cases for the purpose of our investigation. Move 1 describes Move’s main value proposition, which consists of a platform for a personally tailored relocation process. This aims to relieve the customer of the burden of communicating individually with each company involved in a relocation process. The all-around solution ranges from organizing cleaning and transport of furniture to an included insurance solution for the household. However, beneath its main value proposition, which is the relocation platform (Move 1), we define a second case, Move 2. Indeed, for aspects that are not intrinsic to the relocation process, such as a client requesting the pick-up of newly purchased furniture, Move hands the client over to an ecosystem partner. The partner will then coordinate the ecosystem to perform the task rather than using the initial orchestrator’s platform. Move 2 fits in the current archetype, Multi-orchestra Conductor, because of its ecosystem structure and the provenance of its value proposition, while Move 1 will be described through the next archetype, Virtuosic Concert Master. In the context of the Move case, the challenge of the task coordination can be shown by the fact that the startup coordinates and tailors the ecosystem partners for each client, leading to significant coordination effort. In the InsurTech case, the ecosystem combines a physical product with a tailored insurance solution. As an example, an intelligent toothbrush is combined with dental insurance. In concrete terms, the company interacts as an insurance intermediary between B2C companies producing physical products and insurance companies.
Similar to archetype A, the orchestrator in this second archetype does not contribute to the value proposition. However, the startup fulfills the role as an orchestrator by actively searching for ecosystem partners. Accordingly, the InsurTech case shows similar persuasion patterns as the first archetype, since the founder used his existing personal network as a serial entrepreneur to convince the ecosystem’s first and most important partner, the insurance company, to work with them. This evidence is demonstrated by the following statement from InsurTech's Chief Operating Officer (COO):
93
“I was building the model within two months [...]And then it went fast [...] At the beginning of December, I pitched in front of the board of this big Austrian insurance company. The connection came via the Innovation Manager, who is responsible for
investment there.” (C2)
This pattern was predictable since the value proposition happened through the partners only, meaning that the orchestrator had no key component to offer. The role of the startup was solely to build and coordinate the ecosystem, and the founder’s network and knowledge gave it legitimacy and helped convince partners to join the ecosystem. These insights show that the startup actively sought ecosystem partners as it had to align a large number of different partners. And they demonstrate how the startup successfully overcame the challenge of coordination.
In our cases, the InsurTech company built a platform as an overarching solution that it then adapted to every new use case. Similar to the previous approach, building an ecosystem for communicating with the core partners can help to reduce the coordination effort. In Move 2, the orchestrator assigned each orchestration task that was not essentially related to the core relocation process to one of its partners, who then coordinated its ecosystem partners to perform the task. Hence, for this particular value proposition, Move 2 can be described as a strategic orchestrator of the ecosystem, while the assigned partner became the operative orchestrator. Hence, the value proposition happens only through the partners within the operational orchestrator's ecosystem. However, the value proposition can only be created through the assigned partners because of Move as a strategic orchestrator. Also, the value proposition is adapted to every particular client request, leading to a customized value proposition process.
As in the last archetype, the orchestrator does not contribute a complementary module to the ecosystem. Here again, its sole role is the coordination of the partners in the ecosystem, who, in turn, contribute to the value proposition. However, we observed that as the value proposition becomes customized, product development becomes more complicated. Indeed, the InsurTech startup’s first function was to understand all of the partners’ pain points and to conciliate them during the implementation process. Since the value proposition had to be adapted for each customer, the contribution of each partner changed, which required an even more considerable coordination effort.
Since the InsurTech’s value proposition was customized, scaling was only possible in new use cases that involved additional partners who brought new customers to the ecosystem. The InsurTech Startup needed these partners because it does not own any
94
end customer products. Indeed, the InsurTech startup was continually looking for new companies that might be interested in insurance solutions to augment their core product (InsurTech’s solution is B2B2C). Developing these use cases and convincing new partners took a great deal of time, effort, and resources, which was the reason the orchestrator chose to be funded through corporate venture capital from one of its core partners. Indeed, this quickly available amount of money enabled the startup to scale more rapidly. Also, building the previously described platform helped to reduce operating expenditures, such as coordination efforts, and also contributed to speeding up growth, as demonstrated by the following quote from InsurTech's co-founder:
“Whether there are a hundred thousand or ten thousand premiums running over it is irrelevant, that is what a platform does. [...] But in order to generate independent use
cases [...], we would have to increase the sales staff.” (C2)
Both InsurTech and Move 2 did not face high product development costs since their partners were responsible for this activity. However, due to the customized structure of its value proposition, the coordinating startup faced higher costs – in terms of persuasion and coordination – than in the previous archetype, and profits emerged at a later stage. This led to high capital needs, which were covered, in the second funding round, through corporate venture capital that came from the core partner. Capital needs are different for every archetype and case study; that is why they cannot be described as absolute needs. When talking about capital needs, we always refer to relative capital needs regarding the industry and the size of the startup. In the following quote, the InsurTech Case’s co-founder explains what was essential to convince the core partner to invest:
“The proof of concept was essential in the seed round in order to prove that it works and that we already have a decent income.“ (C2)
The orchestrator described this source of funding as a strategic maneuver that strengthened the bond between the orchestrator and the partner. This was particularly important because in the InsurTech case value proposition only happened via the partners of the ecosystem, making the orchestrator more vulnerable in case one of the partners withdrew.
3.4.3 Archetype C: Virtuosic Concert Master The third archetype is described by the following cases: Move 1, Share, and Smart Building. As described in the previous archetype, Move’s main value proposition is a platform that functions as a coordination possibility for a personally tailored relocation
95
process. The platform aims to relieve the customer of the burden of communicating individually with each company involved in the relocation process. This ecosystem, named Move 1, is classified in the Virtuosic Concert Master archetype because of its ecosystem structure and the provenance of its value proposition. The value proposition of the Share case is a platform that exchanges peer-to-peer carsharing opportunities. In addition to this core offering, an independent insurer provides insurance solutions for rental cars and several other players, such as garages, petrol stations, and supermarkets, providing additional services or benefits to the users. The Maintenance Analytics company has developed software that analyses data about potholes, rocks, bumps, and other types of damage/potential threats on public roads and evaluates the data with a unique algorithm. The company collaborates with many different players in the ecosystem, mainly with the public sector, which provides crucial information about the roads, but also with private companies that supply geodata. Finally, the Smart Building case company has developed smart air conditioning and heating solutions to achieve an optimal and sustainable indoor climate. Sensors measure different parameters, such as temperature and Carbon Dioxide (CO2) concentration in, for instance, offices, shopping malls, or metros, which then automatically regulate ventilation and heating. All these startups fulfill the role of an orchestrator since they defined the joint value proposition and earnestly sought partners.
In this third approach, both the orchestrator and its partners contribute to the value proposition, and the value proposition is standardized. Our cases have shown that convincing partners is easier when the orchestrator has not only a particular knowledge or network but can also provide the ecosystem with a key component. For example, in both the Maintenance Analytics and Smart Building cases, the startups were the companies in their ecosystem to have the know-how to build an innovative key module, while they required partners only for communication, design, supply, and other services. Therefore, the respective coordinating startup built a prototype of their key component, which was then presented to the potential partners, convincing them to provide further components to the ecosystem. The startup consequently fulfilled a triple role: it not only coordinated the ecosystem and brought knowledge and connections from its founding team, but it also actively contributed to developing the ecosystem's joint value proposition.
In this configuration, where the value proposition is standardized, half of our cases coordinated and scaled through a platform as soon as it was possible. Indeed, the Move 1 and Share cases, which both enable their clients to buy services through a two-sided

96
platform, also used this platform internally to coordinate their partners. The Maintenance Analytics and the Smart Building cases, however, did not use a platform to coordinate their partners, since their clients were businesses and governments, meaning that the number of customers (less than 100) was lower compared to B2C models and could be handled manually.
As the orchestrator also contributes to the value proposition, the partners’ components must be aligned with the orchestrator’s. In the Maintenance Analytics case, the developers from the coordinating company worked closely together with developers from the partnering companies to ensure this alignment, as the following quote highlights:
“We have partnered with [...] to develop AI and IP using their tools, and so far, we have developed our solution with [...] and [...] tools. [...]. Our developers are often
almost weekly in contact with their support personnel while developing new features.” (E1)
The Move 1 and Share cases, with business models based on B2C, using peer-to-peer platforms to scale their business internally (to acquire new partners), as well as externally (to acquire new customers), assuming they reached a sufficient network effect. The Maintenance Analytics and Smart Building cases both used an internal platform, but they were used for calculations and not suited for partner management or scaling. To gain new customers, the Maintenance Analytics company instead used already existing data, which was collected through other users or market agents. The head of sales at the Maintenance Analytics described how they reached out to local governments, which are their main customers:
“The road scanners we use are placed under vehicles, and once a city owns one, they also often go to other places, allowing us to generate data from new regions. This
opens a huge sales channel as now we can say, ‘Hey, we have your entire data already – wanna take a look?” (E1)
In terms of funding, the need for capital in these cases was much higher than in the previous archetypes, because the Virtuosic Concert Master orchestrators developed a component of the value proposition for their respective ecosystems. Our examples in this archetype covered these capital needs differently regarding their ecosystem’s use cases. In the Move 1 case, which is a B2C platform and represents Move's main value proposition, the company needed to market its product to build up a very significant network effect. This need for resources to be able to scale was the reason Move had five
97
funding rounds in a short period. In their fifth and final round, the company sought funding through venture capital, as described by its CEO:
“VCs are enormously well trained to let you grow very fast and strong.” (D3)
The Smart Building company, on the contrary, targeted businesses and governments, leading to a longer sales process than in the B2C market, and meant that the company required additional capital. However, selling to businesses and governments also has advantages, as the number of clients is lower. This also means that there was no need to use an external platform to sell the product and that the orchestrator started to earn revenues very soon, as explained by the following quote:
“Both first seed rounds [...] were provided by angels, which is more about a long-term investment, as they do not expect very quick returns. [...] And we only asked for a
small funding, because we were able to earn some money on the way, with early products.” (F1)
To conclude, in this archetype, funding needs are much higher than in the previously described cases, as the orchestrator builds a technical component for the ecosystem. However, these relative capital needs differ in their amount and source, depending on the ecosystem’s use cases.
3.4.4 Archetype D: Busy Choirmaster Finally, the last archetype was built on the Access and Visualization cases. The Access case provides keyless access to rental cars. It developed an app for the end customer and the technological equipment for the rental cars, which enables cars to be opened using a smartphone. The Visualization Case creates an extremely accurate 3D digital twin of the world, a so-called ‘true mirror world’, making it visible to software. This technology, which is based on high-resolution cameras, enables the building of spatial applications of the highest quality. Both cases had defined the value proposition of their ecosystems and were looking for partners to finalize and implement it. Similar to the last approach presented, the startup in the Busy Choirmaster archetype fulfilled a triple role: it coordinated the ecosystem and brought knowledge and connections into it, and it also actively contributed to developing the ecosystem's joint value proposition.
In this fourth and last approach, regarding our two global dimensions, both the orchestrator and its partners contribute to the value proposition, and the value proposition is customized. In both the Visualization and Access cases, the startup developed a prototype of their component that could be tested by potential partners in

98
order to convince them to get onboard. The Visualization case’s CEO describes this as follows:
“To be a viable partner in such an ecosystem, you need to bring something to the table that no one else has (…) We built a very high-resolution camera and the ability
to create these 3D models, [...] that was our USP that we could bring to the table, and that made us actually interesting to the other partners.” (G1)
Since the orchestrator also participated in the value proposition by providing a key module to the ecosystem, tech-savvy people were needed to develop the component and later align the high number of partners with it. In the Visualization case, finding these people was particularly challenging, to the extent that the startup relocated its office to be closer to universities teaching these technologies. Further, the customized nature of the value proposition made it even harder to coordinate, as the partners needed might differ from one value proposition for one customer to the other. As it is therefore not possible to standardize the coordination process through a platform, the Access case tried reducing transaction costs by processing certain administrative tasks more systematically, as described by the CEO:
“We were able to reduce our transaction costs by standardizing certain administrative processes, such as contract structures. This allowed us to process more
partners at the same time.” (H1)
In order to create value, the partners’ components must be aligned with the orchestrator’s. Also, with the value proposition being customized, a vivid and regular exchange is needed between the partners. To ensure this alignment, our cases have shown that the coordinating company needs people who perfectly understand the module they provide and develop the product together with the partners.
In the situation where each ecosystem is different, every new value proposition has to be rebuilt – with different partners – around the orchestrator’s component. The situation is even more difficult when the orchestrator not only aligns the partners but also develops a module. We have seen in our cases that this makes the scaling process very challenging because each new value proposition requires different partners and thus coordination effort. In the Access case, for example, demand had to be generated via the B2B customers, who then exert pressure on the other customers:
“We want to scale by generating more demand from the value chain of our system integrators. [...] by generating a pull towards the manufacturers. And the larger this

99
pull is, the stronger is our lock-in [...] Accordingly, our solution will also spread to other lock manufacturers.” (H1)
The capital needs in this fourth archetype are the highest because the orchestrator faces costs for the development of its module and because the value proposition is customized, meaning that coordination efforts are increased. However, because scaling is a long and challenging process for this archetype for the aforementioned reasons, some types of funding are not well suited. In the Visualization case, for example, venture capital was explicitly not an option because of its tighter deadlines. Consequently, only business angels, former entrepreneurs, and high-net-worth individuals invested. Also, in the Visualization case, the orchestrator refused to take money from its ecosystem partners, as it wanted to remain independent in case one of the partners needed to be replaced:
“We did not consider raising money from our ecosystem partners. [...]Because, in the end, we want us to remain independent. I mean, having partners is nice, but you need
to be independent in terms of maneuverability.” (G1)
The Access company did turn one of its partners into an investor, but regretted it for the reasons mentioned in the Visualization case, as illustrated by the following quote:
“That's where we [...] came to the conclusion that it's not so beneficial to turn your customer or partner into an investor, and we've been avoiding this ever since.” (H2)
In contrast to archetype B, where the orchestrator willingly strengthened the bond with its core partner, both the Access and Visualization cases intentionally avoided this source of funding. The reason is that in this fourth archetype, the orchestrators mainly contributed to the value proposition with their key technology, providing them with more power over their ecosystem partners. Having this power, the orchestrators were then able to maintain their independence towards partners in case one of them needed to be replaced. For all of these reasons, this last archetype needs long-term and independent investors.
Implications The findings above are summarized in the previously introduced matrix, providing hands-on insights for researchers and practitioners alike.
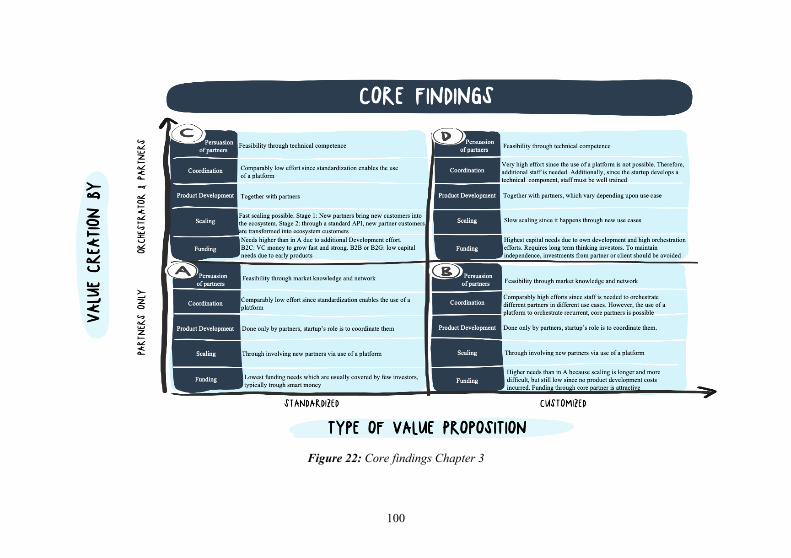
100
Figure 22: Core findings Chapter 3
101
The matrix offers value for startups orchestrating an ecosystem in several ways. First,
it allows the firm to classify itself as one of the archetypes and use the respective
recommendations provided as guidance on how to do so. Further, it allows the startup
to assess whether it is suitable to perform the implications given, which helps to assess
whether it is feasible to orchestrate the ecosystem at hand. Beyond these guidelines, our
findings and the framework may provide several interesting implications for startups as
well as other types of organizations interested in the topic of ecosystems. These are
presented in the following:
For startups
First and foremost, our findings demonstrate that startups can be successful ecosystem
orchestrators. Even more, our research shows that to do so they do not even need to
provide a core competency in the form of a technical module or key module to the
ecosystem, as shown in archetypes A and B. Thus, the role of the orchestrator offers
new possibilities for founders with small teams and few resources, as an orchestrator’s
core contribution may lie solely in the network and market knowledge its founders bring
to the ecosystem. We show that it is possible for startups to build up an ecosystem
without contributing a module. For this type of orchestration, the startup must at least
have market knowledge and a network. The downside is that the orchestrator must be
careful when selecting the necessary ecosystem partners: the startup must make sure
that not all of the partners are aware of each other’s involvement, otherwise they could
make the orchestrating startup redundant. However, taking on the role as an orchestrator
can also disclose some challenges, for instance, when the value proposition is
customized, as in archetypes B and D. These ecosystems require a lot more human
resources, which is a resource many startups lack. As a result, the capital needs are
much higher, especially for persuasion and coordination.
For corporates
Beyond startups, which is our studies focus, the findings presented in our framework
are also be of value to corporate firms.
First, when being the orchestrator, corporations and SMEs (which face challenges
similar to those startups face when it comes to ecosystem orchestration (Radziwon &
Bogers, 2019), especially the challenge of resource constraints) might also profit from
our study, since we show how to orchestrate an ecosystem. Our research shows that,
regarding resource constraints, standardization must be considered. Indeed, the number
of resources needed decreases with the degree of standardization of the ecosystem,

102
regardless on whether the orchestrator is a startup or corporate. For this reason, we argue
that customized value propositions are not well-suited to startups or corporate teams,
where few employees are available to be assigned to the tasks necessary for ecosystem
orchestration.
From the perspective of firms involved in a startup-led ecosystem as complementors,
corporates also profit from this research as they can now assess if a startup might be
able to orchestrate the type of ecosystem at hand. Hence, corporate firms have an
additional decision-making basis for whether they should engage in a startup-led
ecosystem or not.
For investors and accelerators
The findings presented in our framework are also valuable to investors and accelerators.
The framework helps investors to evaluate startups that fulfill the roles of orchestrators.
In particular, our findings help investors and accelerators assess the startup’s capital
needs and success potentials. Concretely, our research shows that funding needs may
radically differ in terms of amount and duration from one orchestrator to the other,
depending on its position in our framework. Obviously, funding needs increase in the
case when the orchestrator develops a part of the value proposition, such as in
archetypes C and D. However, they are also higher when the value proposition is
customized as compared to standardized, as depicted in archetypes B and D. Therefore,
archetype A displays the lowest capital needs and archetype D displays the highest. The
funding type also depends on these two dimensions. Indeed, when the orchestrator does
not contribute a module to the value creation, it will be interested in seeking funding
from one of its core partners, such as in archetype B. On the contrary, when the startup
contributes to the creation of value, such as in archetype D, it will avoid being funded
by its partner or client to keep its independence. Further, our study shows that the type
of funding also differs depending on the type of ecosystem. Indeed, in customized value
proposition structures, such as archetypes B and D, scaling is slower and more
complicated and, therefore, only suited for long-term investors.
Finally, for our research, we needed case studies of currently operating startups. As a
result, one question that could not be addressed is how startups should enter the last
phase of their lifetimes, the exit strategy. Thus, we argue that further research is needed
concerning the exit strategy for orchestrating startups, depending on the archetype.

103
Contributions to Research This Chapter aims to open up a new stream of research on startup-led ecosystems.
Accordingly, we hope and believe that it sparks several new questions, based as much
on its limitations as on its findings. First, we focused on the tasks of orchestration that
are most crucial from the perspective of the structural view of ecosystems. However, in
the course of our data analysis, we discovered an additional task, which emerged from
the very nature of startups. Thus, while we believe that the tasks of orchestration, we
focus on are of particular relevance, we would like to encourage future research on
additional tasks of orchestration in order to create a more comprehensive view of how
startups orchestrate ecosystems. This is in-line with previous calls for a better
understanding of ecosystem orchestration in general (Jacobides et al., 2018). For the
same reason, this study merely provides an overview of how the tasks of orchestration
are being performed by startups, which we believe is justifiable given that the study is
a first step in this direction. However, we would like to encourage more in-depth
research along these lines, which could be particularly valuable for managers. Second,
based on two contingencies, our study introduces four distinct patterns of how startups
orchestrate ecosystems. However, there might be additional approaches in-between
these polar types. Thus, future research might develop a more fine-grained view of
ecosystem orchestration by startups by looking at more variances in the surrounding
conditions and the resulting approaches. Third, given the nature of a case study, this
study introduces approaches without discussing the outcomes. This raises the question
of which approaches are particularly successful under which circumstances and how
the quality of orchestration affects the success of the ecosystem. Finally, this study
follows the structural perspective of ecosystems, which is characterized by a focus on
the materialization of a joint value proposition. Other views of ecosystems, for instance
platform, knowledge, or business ecosystems, are equally relevant but apply different
foci. This raises the question of whether startups are acting as orchestrators in those
kinds of ecosystems as well, and of how they are doing so. In other words, how do
startups orchestrate ecosystems if the underlying intention goes beyond the
materialization of a value proposition?

104
4 The Effects of Ecosystems on Research and Development Intensity and Corporate Innovation6
Introduction Since innovation is linked to ecosystems as a new form of cooperation, and can be
measured through innovation input (R&D expenses) and innovation output (patents,
market cap, etc.) (Gerybadze et al., 2010), this Chapter focuses on identifying the
impact of R&D expenses as well as innovation output on ecosystems. There is a
consensus in research that R&D has a positive effect on firm performance (Lome et al.,
2016). However, knowledge about the effects of R&D activities on ecosystems is scant
and, thus far, offers no managerial guidance. Although it has been argued that
innovating is one of the main ways that firms can adapt to changing environments,
hardly any studies have considered the role of R&D on ecosystems. So far, the literature
has focused on the way ecosystems are built (Dattée et al., 2018), on the impact of
business model components on ecosystems (Madsen, 2020), on ecosystems as the new
model of cooperation (Adner, 2017; Jacobides et al., 2018), and on the correlation
between the amount of money a company spends on innovation and its overall financial
performance (Jaruzelski et al., 2018).
In this Chapter, the STOXX Europe 50, an index consisting of the 50 largest European
companies by market capitalization, serves as a database. Using the programming
language R, we conduct a text analysis of the annual reports from STOXX Europe 50
companies between the years 2013–2018, to observe the development of specific words
related to both innovation and ecosystems. Additionally, we analyze R&D intensity –
the ratio of R&D expenses to net revenues – over the same time frame.
Literature Review
4.2.1 Ecosystems
An ecosystem's ultimate purpose is the realization by several actors of a joint value
proposition that cannot be achieved by any one actor in isolation (Adner, 2017; Adner
& Kapoor, 2010; Eisenhardt & Galunic, 2000; Hannah & Eisenhardt, 2018; Jacobides
6This Chapter is based on the working paper “The Effects of Ecosystems on Research and Development Intensity and Corporate Innovation” with co-authors Natalie Weiler and Christoph H. Wecht. The support of Natalie Weiler in the development of this paper is gratefully acknowledged. The student supported the data collection and parts of the data analysis for this research.

105
et al., 2018; Moore, 1993). This kind of inter-firm cooperation opens up a wide range
of opportunities for companies, such as the development of emerging markets, products
or technologies, as well as access to resources and skills that a stand-alone enterprise
would not have on its own (Adner, 2006; Kahney, 2004; Moore, 1996). Ecosystem
actors can only create a joint value proposition if it is modular and can be broken into
several independent modules that the actors involved can independently produce
(Baldwin & Clark, 2000; Jacobides et al., 2018). These complementary modules either
mutually increase their respective values (so-called supermodularity) (Milgrom &
Roberts, 1990; Topkis, 1978, 1998) or cannot work in isolation without the other
modules (Teece, 1986). Therefore, the actors are called upon to create new modules in
a targeted manner or to at least adapt their existing modules to fit with and complement
the other actors’ modules (Baldwin & Clark, 2000; Jacobides et al., 2018) For this
reason, the actors must align themselves mutually with the joint value proposition
(Adner, 2017). This orientation is multilateral by nature, i.e., links between the actors
cannot be merely bilateral, and it ensures that all the modules fit together and exploit
the full potential of their complementarity (Adner, 2017; Jacobides et al., 2018).
This implies a high degree of interdependency between the actors, especially since
adaptation of the modules can entail considerable costs (Adner, 2017; Jacobides et al.,
2018). Hence, if one actor leaves the ecosystem or fails, then the entire structure is at
risk (Dattée et al., 2018; Moore, 1996). The possibility of joint innovation raises the
question of whether ecosystem innovation or innovation partnerships have an impact
on the R&D budgets of the respective companies.
4.2.2 R&D Intensity
According to the Schumpeterian definition of innovation (Hardy, 1945), innovations
are strategic instruments that can be used to gain a competitive advantage and that lead,
at least temporarily, to a monopolistic position, and thereby to higher returns for
innovative firms in comparison to non-innovative companies (Aghion et al., 2014). As
mentioned above, the ecosystem has recently emerged as a new opportunity for joint
innovation, delivering a new value proposition thanks to a multilateral set of partners
(Adner, 2017). In fact, both R&D and innovation are considered as drivers for change
and key determinants of growth across several industries (Gerybadze et al., 2010). Only
companies that continuously invest in R&D and rethink their businesses on an ongoing
basis are able to maintain a long-term competitive advantage and achieve stable growth
(Gerybadze et al., 2010). Although, the effect of R&D expenditures on growth and
innovation has recently gained relevance in research (Park et al., 2018), there is still a

106
lack of studies that emphasize the relationship between R&D investment, corporate
growth, and financial performance (Baumann & Kritikos, 2016; Gerybadze et al.,
2010). Companies currently face several challenges when it comes to pursuing
innovation and to gaining a leading position in the market. To assess this issue,
ecosystems and R&D intensity can be drawn in as indicators to explore a possible
relationship between the two and their effects on a company’s degree of innovation and
competitiveness. At the present time, the gap between the relationship of innovation
input as R&D intensity and the ecosystem as a nascent, innovative form of partnership
has not yet been addressed. Although there have been international studies on the
importance of innovation and R&D, such as the European Innovation (ERI) Scoreboard
(European Commission, 2018) and the Global Innovation Index, as well as surveys
(McKinsey, 2019; BCG, 2019) conducted by well-known consulting firms, these have
failed to highlight the link to ecosystems.
Methods
As mentioned above, the impact of innovation through R&D on joint innovative
partnerships, such as ecosystems, has not yet been discussed. Therefore, this study aims
to analyze the impact of R&D intensity on ecosystems, by considering companies that
belong to the STOXX Europe 50 Index over a 5-year time frame from 2013 to 2018.
This index (STOXX 2019) provides an overview of 50 stocks from 17 European
countries based on market capitalization (please see Table 11). The data were collected
in two ways and the analysis can be split into two parts (A and B):
A. Analyzing R&D intensity with data retrieved from Bloomberg and cross checked
with annual reports (for detailed information please see Table 12 in the
appendix). The 5-year time frame and the CAGR (compounded annual growth
rate) have been fundamental for the Global Innovation Index (Jaruzelski et al.,
2018) and these metrics are therefore used in this study. B. Text analysis of annual reports using the programming tool R to identify and
count specific words linked to ecosystems and R&D.
4.3.1 Data Sampling The companies considered focus on Europe since research has not yet investigated the
relation of R&D intensity and ecosystems. Thus, we chose the STOXX Europe 50 Index
to address that research gap as the index groups the largest European companies by
market capitalization.

107
STOXX EUROPE 50 INDEX (December 2019)
AB INBEV ABB Adidas Air Liquide Airbus
Allianz ASML Holding Astrazeneca Axa Banco Santander
BASF Bayer BNP Paribas BP BAT
Daimler Deutsche Telekom Diageo ENEL ENI
Glaxosmith HSBC Iberdrola ING Groep ISP
L’oreal Linde PLC Lloyds Bank LVMH National Grid
Nestle Novartis Novo Prudential Reckitt
Relx PLC Rio Tinto Roche Safran Sanofi
SAP Schneider Electric Shell Siemens Total
UBS Unilever Vinci Vodafone Zurich
Table 11: STOXX Europe 50 (December 2019) 4.3.2 Data Collection The data collection process was divided into A (R&D intensity) and B (word count
analysis) and is shown in Figure 23.

108
Figure 23: Methodology Chapter 4
A & B are mapped on a graph (see Figure 24)

109
4.3.1. R&D intensity
We used the Bloomberg database to retrieve the relevant data. For our research, we mainly focused on the financial information for publicly listed companies belonging to the STOXX Europe 50 Index to analyze the R&D intensity, i.e., the ratio of R&D expenses to net revenues. The index comprises 50 European companies from several countries and industries. The overall procedure for analyzing the companies’ specific data was composed of three steps. First, we used Bloomberg to retrieve the revenues and the R&D expenses for all of the STOXX Europe 50 companies during 2013–2018, in order to then calculate each company’s R&D Intensity, which we crossed checked with the values that the companies issued in their annual reports (retrieved from the company websites). Second, we calculated the compounded annual growth rate (CAGR) of R&D intensity over the considered time frame to comprehend industry trends around research activities and the firms’ investments in innovation. Third, based on a positive or negative value of CAGR, we were able to understand R&D intensity in relation to other parameters, like the results obtained by the word count analysis (part B).
4.3.2. Word count
In order to assess the text analysis by conducting a word count, we used a code that had the annual reports for each of the STOXX Europe 50 companies from 2013 to 2018 as a database. Annual reports provide information to support decision-making and are mainly provided as digital Portable Document Format (PDF) files. Outside of the United States, these reports represent companies’ primary reporting vehicles (El-Haj et al., 2020). In general, annual reports consist of two elements: a narrative element and a mandatory one, the latter of which includes financial statements, footnotes, and other statutory information. The narrative components include management commentary on financial performance during the year, together with additional information, such as a letter to shareholders, information regarding primary risks, the company’s corporate social responsibility policy, etc. (El-Haj et al., 2020). We proposed a procedure using R to retrieve text from the digital PDFs of the annual reports published by the firms listed in the STOXX Europe 50. When a large amount of information on an organization is captured through text (McKenny et al., 2018), it becomes important to find ways to evaluate this information. Computer-aided text analysis methods are currently being used to deal with these large volumes of written information (Blei, 2012) and are gaining more relevance in research (Banks et al., 2018). We programmed a code in R to assess the word count of the annual reports from each of the 50 companies over the
110
selected time frame of 2013–2018. R serves as a basic open-source programming tool for text analysis (Banks et al., 2018), which, in this case, automates the count of specific words related to both innovation (R&D input and R&D output) and ecosystems. Since R&D intensity (which is analyzed with numerical data in A) mainly focuses on innovation input, we decided to complement it with factors concerning innovation output, like patents, competencies, and knowledge. Gerybadze et al. (2010) suggest that a set of dynamic capabilities can help to transform innovation input into innovation output (see Figure 24). Based on Gerybadze et al. (2010), the following words were used to focus on innovation (innovation input and innovation output): ‘technology’, ‘competencies’, ‘knowledge’, ‘patent’, and ‘innovation’.
To define ecosystems, we chose words based on Adner (2017) definition of the term: “Ecosystem—the alignment structure of the multilateral set of partners that need to
interact in order for a focal value proposition to materialize.”
The words selected for ecosystems were: ‘ecosystem’, ‘collaboration’, ‘partner’, and ‘joint value proposition’. The process of selecting words was based on McKenny et al. (2018) who used a similar approach to conduct a text analysis.
After defining the key words, the R code revealed how the word count had developed over time, and a value represents the development using the Redemption Grace Period (RGP) function (for detailed information please see Table 13 in the appendix).
4.3.3. Data Analytics
In order to derive a link between the R&D intensity analysis (A) and the word count (B), we had to bring together both analyses. The value for A is simply defined by the CAGR value, which can be either positive or negative. It was more complex for B, as we had to find a way to represent the increasing or decreasing development of the word count over time. We used the function RGP to assess this issue, as it measures the trend over a specific time frame. It was then possible to evaluate whether the word count in sum was positive or negative.
By bringing together the two analyses, it was possible to get a positive or negative value for the R&D intensity in terms of CAGR and a positive or negative value for the word count. This information was subsequently mapped on a graph and the findings are discussed in the next section.

111
Findings
As Figure 24 shows, both the R&D intensity and the word count vary between sectors.
Figure 24: Matrix R&D intensity & word count
Overall, we can identify an increasing trend for both dimensions, meaning that the amount of R&D in relation to revenues increased, as did the words related to ecosystems and innovation. This is linked to the awareness that innovation is a factor that allows firms to be competitive and continue reinventing themselves. This trend is validated by several sources (European Commission 2018; McKinsey, 2019; BCG, 2019) that state that average R&D spending by firms has increased in the last few years (Jaruzelski et al., 2018).
Due to accounting and reporting standards, banks and insurance companies do not issue a value for R&D expenses. Therefore, we considered companies from these industries from our STOXX Europe 50 sample separately, and we did not plot them on our graph. Our analysis demonstrated that the word count for banks is positive, which indicates that the banks are doing an effective job of communicating their innovative activities to stakeholders through their annual reports. Many banks have created

112
accelerators/incubators or building platforms in response to new, smaller players, as these startups are closer to customers and can innovate faster. The analysis showed that a similar scenario is happening with insurance companies: they have a positive word count and are trying to innovate by cooperating with partners from several industries. Axa (Axa, 2018), for example, is working closely with Uber and is simultaneously building a digital insurance platform together with ING. Allianz has its own accelerator, Allianz X, to foster innovation (Allianz, 2018). Thus, the alignment of various partners to deliver a value proposition is fully embraced by banks and insurance companies. All of the other companies in our sample issue a value for R&D expenses in their annual reports and can therefore be illustrated in the graph.
Technological firms Siemens and SAP show a low but positive CAGR in R&D intensity and a negative word count. Siemens is facing a growing demand for energy efficiency in buildings as well as the need to reduce costs by increasing space efficiency and utilization. Additionally, customers demand smart space solutions (Siemens, 2018). SAP’s stated aim is to connect technology-driven innovation and corporate leadership (SAP, 2018), while focusing on engineering solutions to fuel innovation. SAP targets acquisitions that complement their solution offerings, and one of their latest innovations has resulted in the Digital Partner Network – a new platform ecosystem to help customers to engage and manage external partners (SAP, 2018). Although the word count is not positive for either company, both SAP and Siemens promote the ecosystem concept by partnering with other players. Unlike the technology companies, the telecommunications companies Vodafone and Deutsche Telekom have a negative CAGR and a positive word count. The telecommunication industry has provided the network and data infrastructure that has enabled the internet to become smart and mobile. Yet there is now a stagnant number of new customers due to market saturation, which has led to declining profits in response to competition, both from within the industry and outside of the industry, and increased cybercrime. At the same time, there are opportunities related to rising trends, such as the Internet of Things (IoT), Machine-to-Machine (M2M); cloud computing, and 5G, waiting to be seized.
Consumer goods show both a positive word count and a positive CAGR, albeit low in both cases. Large Fast Moving Consumer Goods (FMCG) firms have to invest in innovation to remain competitive with the many start-ups entering the market. And since these younger, smaller companies are closer to customers and to the market, they can react faster to changes in consumers’ preferences. Innovation for those companies is closely linked to products, packaging, and the way the products are produced, as these
113
represent ways the companies can differentiate their portfolios. Nestle acquired Atrium Innovations, a leader in natural supplements, and at the same time brought to market new products, such as KitKat Ruby, Perrier & Juice, Garden Gourmet, etc. (Nestle, 2018). Expanding the network of partners is one of the key resources Nestle can use to stay competitive in the market. Nestle thrives by driving growth through large R&D investments. Reckitt Benckiser, another consumer goods company, implemented two separate end-to-end business units to improve innovation focus and market execution, and also focuses on the e-commerce channel. To innovate effectively means to listen to consumers and to their needs. LVMH launched La Maison des Startups LVMH at STATION F, the world’s biggest incubator, to focus on global innovation and sustainable development (LVMH, 2018). Looking at all these individual companies, it becomes clear that the words related to ecosystem partnership and technology in particular have been increasing in the last years. And once again, partnerships seem to be the key to remaining competitive in the future.
Pharmaceutical companies are known for their strong M&A (mergers and acquisitions) activities. Several start-ups have tried to disrupt the pharmaceutical industry, which is dominated by the big players from the diagnosis level all the way up to the delivery of medicine, by staying in proximity to the market and the customers. Additionally, big tech firms can threaten the industry since many solutions do not have to be regulated. In general, pharmaceutical companies must take advantage of the digitization wave to get closer to their customers along the entire value chain. As is shown in our graph, there is not a unified position for the pharmaceutical companies: although all these companies show a positive CAGR development for R&D intensity, the word count varies within a broad range when considering the whole word count trend.
The companies in the energy sector show a positive CAGR development and overall a positive development regarding the words ‘collaboration’, ‘partner’, ‘knowledge’, and ‘technology’. In this sector, the positive word count can be explained by the fact that companies need to innovate in order to become sustainable producers of clean and renewable energies. Enel, for example, is the largest producer of renewable energies in the world, and has communicated its intention to be CO2 free by 2050.
When we look at our analysis from a broader point of view, it becomes clear that the terms ‘partner’ and ‘collaboration’ have the highest counts in firms that have negative CAGRs in R&D intensity. This implies that even if a firm decides to invest less in R&D, it can still be innovative and competitive by fostering partnerships: a high R&D intensity does not seem to be a necessity to build an ecosystem.
114
On the other hand, firms with the largest spending on R&D over the past years show a rather low consolidated word count. Regarding the specific word ‘ecosystem’, only a few companies use the term in their annual reports. In our sample, only Adidas, Daimler and Schneider show a rather high positive development of the word ‘ecosystem’. Innovation is characterized instead by a positive word development for almost every company, which implies that the companies that belong to the STOXX Europe 50 all promote innovation.
As mentioned above, banks and insurance companies do not issue a value for their R&D expenses. Thus, we have determined their degree of innovation and their competitiveness through the word count analysis. This analysis shows that the terms ‘collaboration’ and ‘partner’ increased in the considered time frame, which therefore highlights that both insurance companies and banks engage in cooperation and innovative ways of collaborating to foster innovation. Additionally, engaging in partnerships allows these companies to meet increasingly demanding customer needs and to quickly adapt to industry trends.
When focusing on the industries considered in our sample data from the STOXX Europe 50, and taking into account the development of the word count and the R&D intensity, we can map them as shown in Figure 25. Overall, the companies tend to have a positive R&D intensity. Only the telecommunication industry sees a negative value for R&D intensity and a positive one for the word count. The pharmaceutical and chemical industries cannot be associated with one position, as R&D can be either positive or negative as can the word count. The energy and the FMCG industries are characterized by a positive value for both R&D intensity and word count. Lastly, the technology industry sees a negative word count but a positive value for R&D intensity.
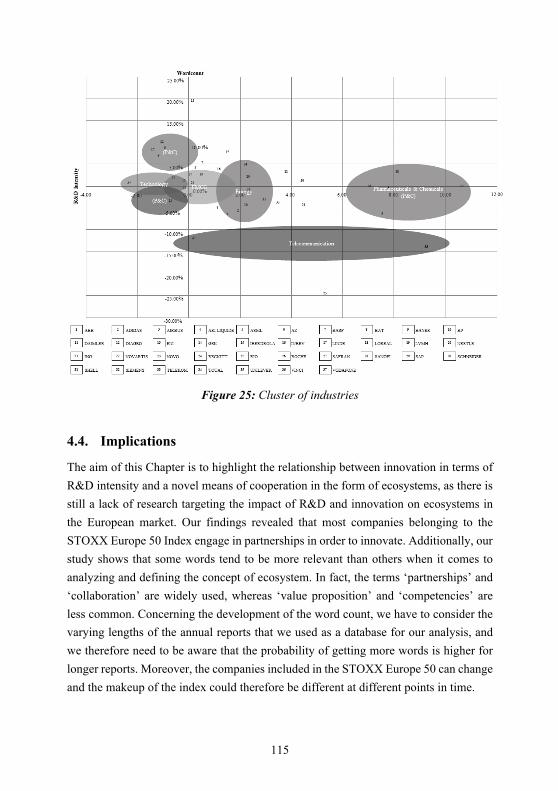
115
Figure 25: Cluster of industries
4.4. Implications
The aim of this Chapter is to highlight the relationship between innovation in terms of R&D intensity and a novel means of cooperation in the form of ecosystems, as there is still a lack of research targeting the impact of R&D and innovation on ecosystems in the European market. Our findings revealed that most companies belonging to the STOXX Europe 50 Index engage in partnerships in order to innovate. Additionally, our study shows that some words tend to be more relevant than others when it comes to analyzing and defining the concept of ecosystem. In fact, the terms ‘partnerships’ and ‘collaboration’ are widely used, whereas ‘value proposition’ and ‘competencies’ are less common. Concerning the development of the word count, we have to consider the varying lengths of the annual reports that we used as a database for our analysis, and we therefore need to be aware that the probability of getting more words is higher for longer reports. Moreover, the companies included in the STOXX Europe 50 can change and the makeup of the index could therefore be different at different points in time.

116
Previous literature (Dattée et al., 2018; Jacobides et al., 2018; Jaruzelski et al., 2018; Madsen, 2020) offers limited guidance to managers about the implications of R&D and innovation on ecosystems. Our findings reveal that ecosystems can be established as a new way of jointly collaborating without spending large amounts on R&D, and that the importance of innovation must be highlighted in annual reports, as is the case for all the firms listed on the STOXX Europe 50. This study therefore also addresses the call for research by Kapoor (2018) about the importance of how firms allocate their resources, such as R&D, alliances, and collaborations, to fix bottlenecks in their ecosystems.
Ecosystems represent an increasingly prevalent form of joint cooperation. This implies that new considerations must be taken into account and further researched to explain the mechanism behind this construct Additionally, it is necessary to understand which activities firms undertake themselves and which activities they decide that others in the ecosystem should undertake.
Managers can use companies from the STOXX Europe 50 as an orientation when they need to analyze their R&D and innovation and the impact on their ecosystem as several industries and countries are taken into account. In sum, our research highlights how engaging in collaborations and partnerships – building ecosystems – without necessarily spending large amounts on R&D, can offer companies the possibility to continually innovate and be competitive in the present dynamic environment. This should be an incentive for managers to trigger and foster the above-mentioned opportunities. An example is given by the actions taken by banks and insurance companies, which realized that cooperating with partners allows them to be closer to the customer and to expand into other sectors they would otherwise not be able to access. Collaboration is the only way for these companies to change and/or adapt their existing business models, which are threatened by numerous small players that do not necessarily come from within the banking or insurance industries. Thus, the only way for big banks and insurance companies to stay in the market is by engaging in cooperation and starting to invest in R&D as, for example, the Spanish Bank Banco Santander has done. In fact, Santander is the first bank to be mentioned in the ERI Scoreboard study (European Commission, 2018).
Our findings have three main implications for future research. First, this study was conducted for a variety of countries and industries in Europe and future studies could focus on a specific country or industry. Second, further evidence to demonstrate the impact of R&D and innovation on ecosystems is necessary, particularly to show that innovation and competitive advantages can be achieved through new means of

117
collaboration and new partnerships. Third, additional methods, other than the RGP functions we used, could be proposed to measure the development of the specific word count over time.

118
5 Conclusion In summary, the existing ecosystem literature lacks understanding in three areas: (1) the development process of value creation within an ecosystem and the dynamics of establishing and steering an ecosystem; (2) the characteristics of the orchestrator and the ability of a startup to orchestrate an ecosystem successfully; (3) the relationship between innovation in terms of R&D intensity and ecosystems. In light of these research gaps, the overall aim of this dissertation has been to explore the orchestration of innovation in ecosystems. By means of empirical data, I conducted twelve qualitative case studies to gain greater insights relevant for theory advancement and management practice alike. Additionally, a text analysis with R of the STOXX Europe 50 companies’ annual reports in the years 2013–2018 was conducted to evaluate the ratio of R&D expenses to net revenues. Motivated by the gaps in research, the thesis was guided by three sub-questions.
1. First, I want to broaden insights on the process of ecosystem development by conceptually applying the theory of organizational search and by including three different search sub-processes: (1) the search for the value proposition, (2) the search for partners, and (3) the search for a better understanding of (potential) partners.
2. Secondly, I aim to create an understanding of how the specific company type startup – a key actor in terms of its innovative capabilities – orchestrates an ecosystem.
3. Lastly, I discuss the impact of ecosystems, as a novel kind of partnership, on innovation in terms of R&D intensity.
Theoretical Contributions
This dissertation offers contributions to the existing literature on ecosystem development, the role of startups, and the impact of ecosystems on R&D intensity. I structure the key theoretical contributions along three sub-questions:
Q1: How does a firm set up an ecosystem and what is the role of
organizational search for finding and integrating potential ecosystem
partners?
I contribute to theories on ecosystem development through interesting insights and mechanisms on organizational search. The existing literature on ecosystem development has been limited and the process of organizational partner search has not

119
been applied to ecosystems or to other forms of inter-firm collaborations. Therefore, my findings highlight that this process plays a crucial role in the ecosystem establishment. I have studied two type of search processes: local and distant search. As a result, I am able to illustrate the fact that if ecosystems are developed through local search, they do not necessarily ease distant search. In local search, the orchestrator searches for partners based on its existing knowledge and thereby drives the development of the ecosystem by itself. Contrary to existing literature on the search process, this finding does not necessarily mean that the orchestrator is less innovative, but rather invokes major innovation potential as seen in three cases (Access, Smart Building, and Sports). In the case of distant search, an interesting mechanism has emerged: Rather than searching by itself, the orchestrator waits to be found by potential partners (e.g. the Logistics case). The logic of this insight strongly correlates with the work of Afuah and Tucci (2012) on crowdsourcing. However, the underlying logic of crowdsourcing is that firms present a problem on a crowdsourcing platform and wait. Eventually, a member of the platform might be able to solve the presented issue. My findings present empirical evidence for this logic of thoughts and introduce it further and more importantly to the ecosystem concept. It needs to be stated that a low degree of co-specialization between the existing partners is fundamental to applying the approach in the ecosystem context. In this vein, I was also able to show that ecosystems appear to be effective vehicles for distant search, despite the fact that the existing literature has typically assumed that this type of search is difficult to execute. With regard to execution, the dominant notion in literature (Adner, 2017; Clarysse et al., 2014; Dhanaraj & Parkhe, 2006; Iansiti & Levien, 2004b; Jacobides et al., 2018; Nambisan & Baron, 2013; Zahra & Nambisan, 2012) also states that corporations display internal advantages when orchestrating an ecosystem and, therefore, startups are considered to be less suitable as orchestrators. However, in the course of my case analyses, it was possible for me to observe that some ecosystems were, indeed, successfully orchestrated by startups. This discovery contradicts the opinions of existing scholars regarding startups as orchestrators and has therefore been the basis of my second sub-question:

120
Q2: How do startups orchestrate ecosystems?
Sub-question 2 guided my empirical analysis in Chapter 3. My findings provide several crucial implications for startups as well as for other types of organizations in the field of ecosystem orchestration. Most importantly, it has been possible for me to refute major literature opinions as my findings demonstrate that a startup can successfully orchestrate an ecosystem. Second, the resulting framework can serve as a guideline and allows startups and corporate organizations to individually assess whether they are able to perform duties of an orchestrator, which further leads to an assessment of whether they could successfully orchestrate an ecosystem. Further, the framework also assists in the decision-making process to evaluate which strategy to use for the orchestration of a specific type of ecosystem. Fourth, I demonstrate approaches that startups use to orchestrate these different types of ecosystems with limited resources. Again, these approaches can also serve as guidance for corporations as I generally show how startups orchestrate ecosystems. And lastly, by presenting startups as capable in the new role of orchestration, I open up a new research stream along these lines. Given the high degree of innovation in these ecosystems, the question of R&D costs becomes interesting. Since there is a consensus that innovation as R&D intensity has a positive effect on a company’s performance, this leads me to my third sub-question:
Q3: Does the fact that companies claim to innovate in ecosystems or with
partners have an influence on their R&D budgets?
I contribute to the literature on R&D expenses and innovation by introducing the findings of my third empirical study. Overall, my findings reveal that most STOXX Europe 50 firms engage in ecosystems to innovate. The overall mining analysis shows that in the word count, the terms ‘partner’ and ‘innovation’ are targeted the most. I was further able to identify an increasing trend for both dimensions (word count and R&D intensity). This means that the amount of R&D in relation to revenues increased as did the words related to ecosystems and innovation. This enhancement might be due to an awareness of innovation as a component that enables firms to stay competitive. Surprisingly, firms with the greatest spending on R&D show a rather low word count for ecosystems. More specifically, only three of the STOXX Europe 50 companies show a rather high positive development of the term ‘ecosystem’. However, the matrix (Figure 25) in the third study (Chapter 4) reveals that the word count varies within different industries. As a result, there are also differences within industries regarding the R&D intensity.
121
Managerial Implications
In addition to my theoretical insights, my research is valuable for management practice. First, managers can benefit from several insights into ecosystem development and be informed about potential challenges that may arise when building an ecosystem. In this regard, I introduce three scenarios for practitioners when defining a joint value proposition as the first task of an orchestrator: (i) the orchestrator is able to define the value proposition from the beginning onward; (ii) the orchestrator starts with a vision of the future joint value proposition (iii); or the orchestrator can define a solution without a specific application in mind. Each situation requires different actions for the definition of the joint value proposition. Next, this process is followed by ecosystem implementation, which includes the search for potential partners. For this, it is important to consider the degree of co-specialization. The degree of co-specialization defines how much the partners need to learn from one another to modify their input towards the joint value proposition. Managers are advised to integrate the partner providing the key modules into the ecosystem first, as this will reduce the level of uncertainty for subsequent partners.
Second, my findings identify two key dimensions: (i) value creation indicates whether the orchestrator contributes any key module to the ecosystem or if the orchestrator simply builds and coordinates the ecosystem. In this regard, I was able to demonstrate that there is no need for startups to provide a core competency in the form of a key module to orchestrate an ecosystem successfully, as seen in archetype A and B. The second dimension, (ii) type of ecosystem, indicates that an ecosystem is either ‘customized’ or ‘standardized’. The former includes the value proposition and its partners, and the latter defines a generic solution and its partners. Based on these two dimensions, I introduce a framework that illustrates four different archetypes of startup-led ecosystem orchestrations. Hereby, the framework also highlights some challenges startups might face as orchestrators, seen in archetypes B and D. Beyond the managerial implications for startups, my findings might also be of value to corporate managers (e.g. SME managers). Especially with regards to resources, my research shows that, regardless of whether the orchestrator is a startup or not, the amount of resources necessary decreases with the degree of standardization of an ecosystem. This indicates that standardized ecosystems are better suited for startups or corporations with few members and that, conversely, customized ecosystems are better suited for companies that have greater resources at their disposal. On top of this, corporations have an additional decision-making basis for evaluating whether they should engage in a

122
startup-led ecosystem or not. Finally, the framework provided enables investors and accelerators to better assess startup-led ecosystems, and to evaluate whether a startup meets the conditions for successfully orchestrating an ecosystem.
Third, as previous literature offers limited guidance to managers about the impact of ecosystems on R&D costs, my research offers managers guidance for analyzing a firm’s R&D and innovation levels. Overall, my findings reveal that most companies belonging to the STOXX Europe 50 Index cooperate with other companies in order to innovate. I am able to demonstrate that when a company is a partner within an ecosystem, the ecosystem has a positive effect on the company’s R&D costs. In this regard, my findings demonstrate how fostering collaboration, i.e., building an ecosystem, offers firms an opportunity to increase their degree of innovation and therefore remain competitive in a fast-changing business environment. Additionally, an ecosystem can be developed without spending large amounts on R&D. Moreover, this study addresses the importance of how companies allocate their resources, such as R&D, alliances, and collaborations, to solve bottlenecks in their ecosystems.
Overall, my contribution to research offers empirical insights on ecosystem development, the role of startups as orchestrators, and the relationship of R&D intensity and innovation ecosystems. Best-practice management evaluations and decisions can be guided by my empirical findings for an organization’s own ecosystem activities.
Future Research
The three studies within this dissertation relate to the orchestration of innovation in ecosystems (Chapters 2, 3, 4). They are characterized by a strong inductive and phenomenon-based research approach. Thereby, some topics have emerged that could be of great interest for future research. In the first study (Chapter 2), one case study demonstrated a very successful strategy of implementing new staff into an established company to ensure the knowledge overlap required for a high degree of co-specialization. This insight raises the first question for future research: How can the knowledge overlap required for high co-specialization be achieved in existing companies when the integration of new staff might be challenging to accomplish? Moreover, I hope that future research might address the emergence of ecosystems even more directly. Lastly, there is potential to rethink the existing perspectives on distant search, as I was able to show that ecosystems appear to be an effective vehicle for this type of search. In this vein, a stimulus question could be: Is it more unlikely or rare for an ecosystem to be established by distant search rather than by local search?

123
For my second study (Chapter 3), the question of how startups should enter the last phase of exit could be a thought-provoking question, since further research is needed concerning the exit strategies of orchestrating startups. Further, and more precisely, research could analyze how exactly a startup orchestrates an ecosystem (e.g. resource allocation). And lastly, a more detailed analysis of the types of orchestration could be conducted. For instance, what are the distinctions between the differently classified startups in my introduced framework?
The findings from my third study (Chapter 4), suggest four main implications for further research. First, the study was conducted for a variety of countries and industries, thus, future research could focus on a specific country or industry to illustrate the various trends for R&D intensity in different industries. Second, my findings need further evidence of exactly how innovation and competitive advantage can be achieved through ecosystems as a new form of collaboration. Third, this study gives some line of thought to extending the existing literature regarding the ecosystem establishment. Fourth, I propose utilizing a different method to measure the increase of the word count used.
Discussion
In recent years, interest in the ecosystem concept has grown. Yet research is still in its early stages, and there are questions and research gaps that need to be answered and explored. Therefore, this thesis focuses on three unexplored sub-questions that relate to the orchestration of innovation in ecosystems.
With my first study (Chapter 2), I contribute to the process of ecosystem development in general. I was able to extend the process-centric view of ecosystem creation introduced by Dattée et al. (2018). Whilst I focus on the same stage of development, I build my research upon a broader case sample to provide a more holistic approach. Dattée et al. (2018) found that an initially broad proto-vision crystalizes into a clear blueprint of interdependencies as mutual alignment within the ecosystem increases. However, I was able to identify decreasing significance for the blueprint with the development of an ecosystem. As a result, my findings highlight the importance of initial blueprint clarification in literature. Further, whilst Dattée et al. (2018) examine the influence and steering of the dynamic interdependencies and relationships within an ecosystem, I focus on the development of such interdependencies and relationships. In doing so, I provide a complementary viewpoint on the process of ecosystem development. Moreover, Jacobides et al. (2018) called for a better understanding of the
124
government of ecosystems and the fulfillment criteria of an orchestrator. My analysis sheds light on these two significant topics: It describes the process of search in great detail and discusses two different approaches (local and distant search) to searching for potential partners. Importantly, my analysis highlights how the degree of co-specialization is a fundamental influence on the governance of ecosystems in situations of distant search.
In the context of governance and orchestration, the literature has repeatedly claimed that young companies – startups – are not ideal for orchestrating ecosystems. Indeed, size and bargaining power might be helpful for ecosystem development and its coordination as this generates significant coordination efforts, development costs, and transaction costs for the orchestrator (Jacobides et al., 2018). In this vein, Skala (2019) also points out that this can be especially challenging for startups, given their limited resources. However, unlike the work of these scholars, the analysis of my second study (Chapter 3) was able to prove that startups can overcome significant challenges and can fulfill the characteristics to successfully orchestrate an ecosystem. I introduce four archetypes to offer value for startups and corporate organizations alike. The framework aims to provide guidance to help firms assess whether they are capable of orchestrating an ecosystem at hand and, importantly, demonstrates that startups can be considered as orchestrators.
Startups are closely associated with innovation, and as innovation is linked to ecosystems as a new form of partnership, my last study (Chapter 4) addresses the limitations given by scholars (Dattée et al., 2018; Jacobides et al., 2018; Jaruzelski et al., 2018; Madsen, 2020) regarding the implications of R&D and innovation on ecosystems. It provides firms with great insight into the establishing ecosystems without spending large amounts on R&D. Additionally, this study closes the gap to ecosystems, as several studies (e.g. ERI Scoreboard and the Global Innovation Index) have drawn attention to the importance of innovation and R&D, but have neglected to make the connection to ecosystems. My findings can be used as an orientation to analyze R&D and innovation and the impact on ecosystems, as several industries and countries are considered in my research. In this vein, my research highlights how building an ecosystem to constantly innovate and be competitive is possible with low investment in R&D.

125
6 References Aarikka-Stenroos, & Ritala. (2017). Network management in the era of ecosystems:
Systematic review and management framework. Industrial Marketing
Management, 67, 23-36
Acs, Stam, Audretsch, & O’Connor. (2017). The lineages of the entrepreneurial ecosystem approach.
Adner. (2006). Match your innovation strategy to your innovation ecosystem. Harvard
Business Review, 84(4), 98-107
Adner. (2012). The wide lens: A new strategy for innovation: Penguin Uk.
Adner. (2016). Navigating the leadership challenges of innovation ecosystems. Mit
Sloan Management Review, 58(1)
Adner. (2017). Ecosystem as structure: an actionable construct for strategy. Journal of
Management, 43(1), 39-58
Adner, & Kapoor. (2010). Value creation in innovation ecosystems: How the structure of technological interdependence affects firm performance in new technology generations. Strategic Management Journal, 31(3), 306-333
Adner, & Kapoor. (2016a). Innovation ecosystems and the pace of substitution: Re-examining technology S-curves. Strategic Management Journal, 37(4), 625-648
Adner, & Kapoor. (2016b). Right tech, wrong time. Harvard Business Review, 94(11), 60-67
Adner, Oxley, & Silverman. (2013). Introduction: Collaboration and competition in business ecosystems Advances in Strategic Management (pp. ix-xvii).
Afuah, & Tucci. (2012). Crowdsourcing as a solution to distant search. Academy of
Management Review, 37(3), 355-375
Aghion, Bechtold, Cassar, & Herz. (2014). The causal effects of competition on innovation: Experimental evidence: National Bureau of Economic Research.
Ahuja. (2000). Collaboration networks, structural holes, and innovation: A longitudinal study. Administrative Science Quarterly, 45(3), 425-455
Alt, Abramowicz, & Demirkan. (2010). Service-orientation in electronic markets. Electronic Markets, 20(3-4), 177-180
126
Altman, & Tushman. (2017). Platforms, open/user innovation, and ecosystems: A strategic leadership perspective. Advances in Strategic Management, 37, 177-207
Anderson. (1999). Perspective: Complexity theory and organization science. Organization Science, 10(3), 216-232
Argote, & Greve. (2007). A behavioral theory of the firm—40 years and counting: Introduction and impact. Organization Science, 18(3), 337-349
Atluri, Dietz, & Henke. (2017). Competing in a world of sectors without borders. McKinsey Quarterly, 54, 1-14
Autio, & Thomas. (2014). Innovation ecosystems. The Oxford handbook of innovation
management, 204-288
Autio, & Thomas. (2019). Value co-creation in ecosystems: Insights and research promise from three disciplinary perspectives.
Baldwin. (2018). Design Rules, Volume 2: How Technology Shapes Organizations: Chapter 7 The Value Structure of Technologies, Part 2: Technical and Strategic Bottlenecks as Guides for Action. Harvard Business School Research Paper
Series(19-042)
Baldwin, & Clark. (2000). Design rules: The power of modularity. Cambridge, MA: MIT Press.
Baldwin, & von Hippel. (2011). Modeling a paradigm shift: From produceriInnovation to user and open collaborative innovation. Organization Science, 22(6), 1399-1417
Banks, Woznyj, Wesslen, & Ross. (2018). A review of best practice recommendations for text analysis in R (and a user-friendly app). Journal of Business and
Psychology, 33(4), 445-459
Baptista, & Swann. (1998). Do firms in clusters innovate more? Research Policy, 27(5), 525-540
Barnett. (2008). An attention-based view of real options reasoning. Academy of
Management Review, 33(3), 606-628
Baumann, & Kritikos. (2016). The link between R&D, innovation and productivity: Are micro firms different? Research Policy, 45(6), 1263-1274
Bedeian. (1990). Choice and determinism: a comment. Strategic Management Journal,
11(7), 571-573
127
Birkinshaw, Bessant, & Delbridge. (2007). Finding, forming, and performing: Creating networks for discontinuous innovation. California Management Review, 49(3), 67-84
Blei. (2012). Probabilistic topic models. Communications of the ACM, 55(4), 77-84
Boudreau. (2012). Let a thousand flowers bloom? An early look at large numbers of software app developers and patterns of innovation. Organization Science, 23(5), 1409-1427
Bruns, Bosma, Sanders, & Schramm. (2017). Searching for the existence of entrepreneurial ecosystems: a regional cross-section growth regression approach. Small Business Economics, 49(1), 31-54
Brusoni, & Prencipe. (2013). The organization of innovation in ecosystems: Problem framing, problem solving, and patterns of coupling. Advances in Strategic
Management, 30, 167-194
Cassar. (2004). The financing of business start-ups. Journal of business venturing,
19(2), 261-283
Ceccagnoli, Forman, Huang, & Wu. (2011). Co-creation of value in a platform ecosystem: The case of enterprise software. MIS Quarterly, Forthcoming
Cennamo, & Santalo. (2013). Platform competition: Strategic trade‐offs in platform markets. Strategic Management Journal, 34(11), 1331-1350
Chatman, & Jehn. (1994). Assessing the relationship between industry characteristics and organizational culture: How different can you be? Academy of Management
Journal, 37(3), 522-553
Chesbrough. (2006). Open innovation: The new imperative for creating and profiting
from technology. Boston, MA: Harvard Business School.
Cilliers. (2005). Complexity, deconstruction and relativism. Theory, culture & society,
22(5), 255-267
Clarysse, Wright, Bruneel, & Mahajan. (2014). Creating value in ecosystems: Crossing the chasm between knowledge and business ecosystems. Research Policy, 43(7), 1164-1176
Cohen, & Levinthal. (1990). Absorptive capacity: A new perspective on learning and innovation. Administrative science quarterly, 35(1), 128-152

128
Cohen, March, & Olsen. (1972). A garbage can model of organizational choice. Administrative Science Quarterly, 17(1), 1-25
Corallo, Passiante, & Prencipe. (2007). The digital business ecosystem: Edward Elgar Publishing.
Corallo, & Protopapa. (2007). Business networks and ecosystems: rethinking the biological metaphor. Digital business ecosystems, 6064, 1-6
Criscuolo, Gal, & Menon. (2014). The dynamics of employment growth.
Cusumano, & Gawer. (2014). Industry platforms and ecosystem innovation.
Cyert, & March. (1963). A behavioral theory of the firm.
Dattée, Alexy, & Autio. (2018). Maneuvering in poor visibility: How firms play the ecosystem game when uncertainty is high. Academy of Management Journal,
61(2), 466-498
Davila, Foster, & Gupta. (2003). Venture capital financing and the growth of startup firms. Journal of business venturing, 18(6), 689-708
Davis. (2016). The group dynamics of interorganizational relationships: Collaborating with multiple partners in innovation ecosystems. Administrative Science
Quarterly, 61(4), 621-661
Davis, & Eisenhardt. (2011). Rotating leadership and collaborative innovation: Recombination processes in symbiotic relationships. Administrative Science
Quarterly, 56(2), 159-201
de Vasconcelos Gomes, Facin, Salerno, & Ikenami. (2018). Unpacking the innovation ecosystem construct: Evolution, gaps and trends. Technological Forecasting and
Social Change, 136, 30-48
De Wulf, Odekerken-Schröder, & Iacobucci. (2001). Investments in consumer relationships: A cross-country and cross-industry exploration. Journal of
Marketing, 65(4), 33-50
Dhanaraj, & Parkhe. (2006). Orchestrating innovation networks. Academy of
management review, 31(3), 659-669
Doz. (2019). Governing Multilateral Alliances. California Management Review, 61(3), 93-114
Durst, & Poutanen. (2013). Success factors of innovation ecosystems-Initial insights from a literature review. Co-create, 27-38

129
Eisenhardt. (1989). Building theories from case study research.
Eisenhardt. (1991). Better stories and better constructs: The case for rigor and comparative logic. Academy of Management Review, 16(3), 620-627
Eisenhardt, & Galunic. (2000). Coevolving. Harvard Business Review, 78(1), 91-101
Eisenhardt, & Graebner. (2007). Theory building from cases: Opportunities and challenges. Academy of Management Journal, 50(1), 25-32
Eisenhardt, Graebner, & Sonenshein. (2016). Grand challenges and inductive methods: Rigor without rigor mortis: Academy of Management Briarcliff Manor, NY.
Eisenmann, Parker, & Alstyne. (2011). Platform envelopment. Strategic Management
Journal, 32(12), 1270-1285
Eisenmann, Parker, & Van Alstyne. (2009). Opening platforms: how, when and why? Platforms, markets and innovation, 6, 131-162
El-Haj, Alves, Rayson, Walker, & Young. (2020). Retrieving, classifying and analysing narrative commentary in unstructured (glossy) annual reports published as PDF files. Accounting and Business Research, 50(1), 6-34
Evans, & Schmalensee. (2016). Matchmakers: The new economics of multisided
platforms: Harvard Business Review Press.
Feld. (2012). Startup communities: Building an entrepreneurial ecosystem in your city: John Wiley & Sons.
Fjeldstad, Snow, Miles, & Lettl. (2012). The architecture of collaboration. Strategic
Management Journal, 33(6), 734-750
Foss, & Saebi. (2018). Business models and business model innovation: Between wicked and paradigmatic problems. Long Range Planning, 51(1), 9-21
Foster, Shimizu, Ciesinski, Davila, Hassan, Jia, & Morris. (2013). Entrepreneurial
ecosystems around the globe and company growth dynamics. Paper presented at the World Economic Forum.
Frankenberger, & Sauer. (2018). Cognitive antecedents of business models: Exploring the link between attention and business model design over time. Long Range
Planning
Fritsch. (2013). New business formation and regional development: A survey and assessment of the evidence. Foundations and Trends® in Entrepreneurship, 9(3), 249-364

130
Fuller, Jacobides, & Reeves. (2019). The myths and realities of business ecosystems. Mit Sloan Management Review, 60(3), 1-9
Garg, & Shivam. (2017). Funding to growing start-ups. Research Journal of Social
Sciences, 10(2), 22-31
Gassmann, Frankenberger, & Csik. (2014). The business model navigator: 55 models
that will revolutionise your business: Pearson UK.
Gavetti, Levinthal, & Ocasio. (2007). Perspective—Neo-Carnegie: The Carnegie School’s past, present, and reconstructing for the future. Organization Science,
18(3), 523-536
Gawer. (2002). Platform leadership: How Intel, Microsoft, and Cisco drive industry
innovation.
Gawer. (2014). Bridging differing perspectives on technological platforms: Toward an integrative framework. Research Policy, 43(7), 1239-1249
Gawer, & Cusumano. (2002). Platform leadership: How Intel, Microsoft, and Cisco
drive industry innovation. Boston, MA: Harvard Business School Press.
Gawer, & Cusumano. (2014). Industry platforms and ecosystem innovation. Journal of
product innovation management, 31(3), 417-433
Geels. (2002). Technological transitions as evolutionary reconfiguration processes: a multi-level perspective and a case-study. Research Policy, 31(8-9), 1257-1274
Gërguri‐Rashiti, Ramadani, Abazi‐Alili, Dana, & Ratten. (2017). ICT, innovation and firm performance: the transition economies context. Thunderbird International
Business Review, 59(1), 93-102
Gerybadze, Hommel, Reiners, & Thomaschewski. (2010). Introduction: Managing innovation in turbulent times Innovation and international corporate growth (pp. 1-7): Springer.
Ghazawneh, & Henfridsson. (2013). Balancing platform control and external contribution in third‐party development: the boundary resources model. Information systems journal, 23(2), 173-192
Granstrand, & Holgersson. (2020). Innovation ecosystems: A conceptual review and a new definition. Technovation, 90, 102098
Guest, Bunce, & Johnson. (2006). How many interviews are enough? An experiment with data saturation and variability. Field methods, 18(1), 59-82
131
Gulati. (1998). Alliances and networks. Strategic Management Journal, 19(4), 293-317
Gulati. (1999). Network location and learning: the influence of network resources and firm capabilities on alliance formation. Strategic Management Journal, 20(5), 397-420
Gulati, Nohria, & Zaheer. (2000). Strategic networks. Strategic Management Journal,
21(3), 203-215
Gulati, Puranam, & Tushman. (2012). Meta-Organization design: Rethinking design in interorganizational and community contexts. Strategic Management Journal,
33(6), 571-586
Gurel, & Sari. (2015). Strategic Planning for Sustainability in a Start-Up Company: A Case Study on Human Resources Consulting Firm. European Journal of
Sustainable Development, 4(2), 313-313
Hagiu, & Wright. (2015). Multi-sided platforms. International Journal of Industrial
Organization, 43, 162-174
Haltiwanger, Jarmin, & Miranda. (2013). Who creates jobs? Small versus large versus young. Review of Economics and Statistics, 95(2), 347-361
Hannah, & Eisenhardt. (2018). How firms navigate cooperation and competition in nascent ecosystems. Strategic Management Journal, 39(12), 3163-3192
Hannan, & Freeman. (1989). Organizational ecology: Harvard university press.
Hardy. (1945). Schumpeter on Capitalism, Socialism, and Democracy. Journal of
Political Economy, 53(4), 348-356
Hartvigsen, Kinzig, & Peterson. (1998). Complex adaptive systems: Use and analysis of complex adaptive systems in ecosystem science: Overview of special section. Ecosystems, 1(5), 427-430
Heikkil, & Kuivaniemi. (2012). Ecosystem Under Construction: An Action Research Study on Entrepreneurship in a Business Ecosystem. Technology Innovation Management Review, 2 (6): 1824.
Helfat, & Raubitschek. (2018). Dynamic and integrative capabilities for profiting from innovation in digital platform-based ecosystems.
Herrmann, Schulte, & Voß. (2014). Increasing acceptance of free-floating car sharing
systems using smart relocation strategies: a survey based study of car2go

132
Hamburg. Paper presented at the International conference on computational logistics.
Holcombe. (2003). Progress and entrepreneurship. Quarterly Journal of Austrian
Economics, 6(3), 3-26
Huggett. (2011). New startup models emerge as investor landscape shifts: Nature Publishing Group.
Iansiti, & Levien. (2004a). The keystone advantage: What the new dynamics of business
ecosystems mean for strategy, innovation, and sustainability. Boston, MA: Harvard Business School Press.
Iansiti, & Levien. (2004b). Strategy as ecology. Harvard business review, 82(3), 68-78
Isenberg. (2010). How to start an entrepreneurial revolution. Harvard Business Review,
88(6), 40-50
Isenberg. (2011). Introducing the entrepreneurship ecosystem: Four defining characteristics. Forbes, 25, 2011
Jacobides, Cennamo, & Gawer. (2018). Towards a theory of ecosystems.
Jaruzelski, Chwalik, & Goehle. (2018). What the top innovators get right. strategy+
business, 93
Järvi, Almpanopoulou, & Ritala. (2018). Organization of knowledge ecosystems: Prefigurative and partial forms.
Jick. (1979). Mixing qualitative and quantitative methods: Triangulation in action. Administrative science quarterly, 24(4), 602-611
Kahney. (2004). Inside Look at Birth of the iPod. Wired July
Kandiah, & Gossain. (1998). Reinventing value: The new business ecosystem. Strategy
& leadership, 26(5), 28-33
Kapoor. (2018). Ecosystems: Broadening the locus of value creation. Journal of
Organization Design, 7(1), 12
Kapoor, & Agarwal. (2017). Sustaining superior performance in business ecosystems: Evidence from application software developers in the iOS and Android smartphone ecosystems. Organization Science, 28(3), 531-551
Kapoor, & Lee. (2013). Coordinating and competing in ecosystems: How organizational forms shape new technology investments.

133
Katila, Chen, & Piezunka. (2012). All the right moves: How entrepreneurial firms compete effectively. Strategic Entrepreneurship Journal, 6(2), 116-132
Kiron, Kruschwitz, Reeves, & Goh. (2013). The benefits of sustainability-driven innovation. MIT Sloan Management Review, 54(2), 69
Kogut, & Zander. (1992). Knowledge of the firm, combinative capabilities, and the replication of technology. Organization Science, 3(3), 383-397
Kuratko, Fisher, Bloodgood, & Hornsby. (2017). The paradox of new venture legitimation within an entrepreneurial ecosystem. Small Business Economics,
49(1), 119-140
Kushida. (2015). A strategic overview of the Silicon Valley ecosystem: Towards effectively “harnessing” Silicon Valley. Report submitted to the Stanford Silicon
Valley-New Japan (SV-NJ) Project
Lee. (2000). The Silicon Valley edge: A habitat for innovation and entrepreneurship: Stanford University Press.
Leih, Linden, & Teece. (2015). Business model innovation and organizational design: A dynamic capabilities perspective.
Leminen, Westerlund, Rajahonka, & Siuruainen. (2012). Towards IOT ecosystems and business models Internet of things, smart spaces, and next generation networking (pp. 15-26): Springer.
Leten, Vanhaverbeke, Roijakkers, Clerix, & van Helleputte. (2013). IP Models to orchestrate innovation ecosystems: IMEC, a public research institute in nano-electronics.
Li, & Garnsey. (2014). Policy-driven ecosystems for new vaccine development. Technovation, 34(12), 762-772
Li, Maggitti, Smith, Tesluk, & Katila. (2013). Top management attention to innovation: The role of search selection and intensity in new product introductions. Academy
of Management Journal, 56(3), 893-916
Linder, Jarvenpaa, & Davenport. (2003). Toward an innovation sourcing strategy. MIT
Sloan Management Review, 44(4), 43
Lindgardt, Reeves, Stalk, & Deimler. (2009). Business model innovation. When the
Game Gets Tough, Change the Game, The Boston Consulting Group, Boston,
MA

134
Locke. (2001). Grounded theory in management research. Thousand Oaks, CA: Sage.
Lome, Heggeseth, & Moen. (2016). The effect of R&D on performance: Do R&D-intensive firms handle a financial crisis better? The Journal of High Technology
Management Research, 27(1), 65-77
Lucas Jr, & Goh. (2009). Disruptive technology: How Kodak missed the digital photography revolution. The Journal of Strategic Information Systems, 18(1), 46-55
Madsen. (2020). Business model innovation and the global ecosystem for sustainable development. Journal of Cleaner Production, 247, 119102
Mäkinen, & Dedehayir. (2013). Business ecosystems’ evolution — An ecosystem clockspeed perspective. In Adner, Oxley, & Silverman (Eds.), Collaboration and
competition in business ecosystems (Advances in Strategic Management, Vol. 30) (Vol. 30, pp. 99-125). Bingley: Emerald.
Manigart, & Struyf. (1997). Financing high technology startups in Belgium: An explorative study. Small Business Economics, 9(2), 125-135
March. (1991). Exploration and exploitation in organizational learning. Organization
Science, 2(1), 71-87
March, & Simon. (1958). Organizations. New York, NY: Wiley.
Martin, & Mitchell. (1998). The influence of local search and performance heuristics on new design introduction in a new product market. Research Policy, 26(7-8), 753-771
Martins, Rindova, & Greenbaum. (2015). Unlocking the hidden value of concepts: a cognitive approach to business model innovation. Strategic Entrepreneurship
Journal, 9(1), 99-117
Mayring. (2007). Qualitative Inhaltsanalyse: Grundlagen und Techniken (9th ed.). Weinheim: Beltz Verlag.
McEvily, & Zaheer. (1999). Bridging ties: A source of firm heterogeneity in competitive capabilities. Strategic Management Journal, 20(12), 1133-1156
McKenny, Aguinis, Short, & Anglin. (2018). What doesn’t get measured does exist: Improving the accuracy of computer-aided text analysis. Journal of
Management, 44(7), 2909-2933

135
Meulman, Reymen, Podoynitsyna, & L. Romme. (2018). Searching for partners in open innovation settings: How to overcome the constraints of local search. California
Management Review, 60(2), 71-97
Meynhardt, Chandler, & Strathoff. (2016). Systemic principles of value co-creation: Synergetics of value and service ecosystems. Journal of Business Research,
69(8), 2981-2989
Miles. (1980). Macro organizational behavior. Santa Monica. Cal.: Goodyear
Publishing
Miles. (1994). Qualitative data analysis: An expanded sourcebook.
Milgrom, & Roberts. (1990). Rationalizability, learning, and equilibrium in games with strategic complementarities. Econometrica, 58(6), 1255-1277
Milinkovich. (2008). A Practioners Guide to Ecosystem Development. Retrieved, 15, 2014
Miner, Bassof, & Moorman. (2001). Organizational improvisation and learning: A field study. Administrative Science Quarterly, 46(2), 304-337
Monteiro, Arvidsson, & Birkinshaw. (2008). Knowledge flows within multinational corporations: Explaining subsidiary isolation and its performance implications. Organization Science, 19(1), 90-107
Moore. (1993). Predators and prey: A new ecology of competition. Harvard Business
Review, 71(3), 75-86
Moore. (1996). The death of competition: Leadership and strategy in the age of business
ecosystems. New York, NY: HarperCollins.
Moore. (2006). Business ecosystems and the view from the firm. Antitrust Bulletin,
51(1), 31-75
Moore, Oesch, & Zietsma. (2007). What competition? Myopic self-focus in market-entry decisions. Organization Science, 18(3), 440-454
Mustapha, & Tlaty. (2018). The entrepreneurial finance and the issue of funding startup companies. European Scientific Journal, 14(13), 268-279
Muthusamy, & White. (2005). Learning and knowledge transfer in strategic alliances: A social exchange view. Organization studies, 26(3), 415-441
Nalebuff, & Brandenburger. (1996). Co-opetition. New York, NY: Crown Business.
136
Nambisan, & Baron. (2013). Entrepreneurship in innovation ecosystems: Entrepreneurs' self-regulatory processes and their implications for new venture success. Entrepreneurship: Theory & Practice, 37(5), 1071-1097
Nelson, & Winter. (1982). The Schumpeterian tradeoff revisited. The American
Economic Review, 72(1), 114-132
Ocasio. (1997). Towards an attention-based view of the firm. Strategic Management
Journal, 18(S1), 187-206
Oh, Phillips, Park, & Lee. (2016). Innovation ecosystems: A critical examination. Technovation, 54, 1-6
Overholm. (2015). Collectively created opportunities in emerging ecosystems: the case of solar service ventures. Technovation, 39, 14-25
Ozalp, Cennamo, & Gawer. (2018). Disruption in platform-based ecosystems. Journal
of Management Studies, 55(7), 1203-1241
Ozcan, & Eisenhardt. (2009). Origin of alliance portfolios: Entrepreneurs, network strategies, and firm performance. Academy of Management Journal, 52(2), 246-279
Papaioannou, Wield, & Chataway. (2009). Knowledge ecologies and ecosystems? An empirically grounded reflection on recent developments in innovation systems theory. Environment and Planning C: Government and Policy, 27(2), 319-339
Park, Lee, Moon, Kim, & Kwon. (2018). Relation of R&D expense to turnover and number of listed companies in all industrial fields. Journal of Open Innovation:
Technology, Market, and Complexity, 4(1), 9
Parker, & Alstyne. (2008). Managing platform ecosystems. ICIS 2008 Proceedings, 53
Parker, & Van Alstyne. (2005). Two-sided network effects: A theory of information product design. Management science, 51(10), 1494-1504
Parker, van Alstyne, & Choudary. (2016a). Platform revolution: How networked
markets are transforming the economyand how to make them work for you. New York, NY: W. W. Norton & Company.
Parker, Van Alstyne, & Jiang. (2016b). Platform ecosystems: How developers invert the firm. Boston University Questrom School of Business Research Paper(2861574)
Peltoniemi. (2006). Preliminary theoretical framework for the study of business ecosystems. EMERGENCE-MAHWAH-LAWRENCE ERLBAUM-, 8(1), 10

137
Picken. (2017). From startup to scalable enterprise: Laying the foundation. Business
Horizons, 60(5), 587-595
Pickett, & Cadenasso. (2002). The ecosystem as a multidimensional concept: meaning, model, and metaphor. Ecosystems, 5(1), 1-10
Pitelis. (2012). Clusters, entrepreneurial ecosystem co-creation, and appropriability: a conceptual framework. Industrial and Corporate Change, 21(6), 1359-1388
Porter. (1980). Competitive strategy: Techniques for analyzing industries and
competitors. New York, NY: Free Press.
Porter. (1985). Competitive advantage: Creating and sustaining superior performance.
Powell. (1998). Learning from collaboration: Knowledge and networks in the biotechnology and pharmaceutical industries. California management review,
40(3), 228-240
Powell, Koput, & Smith-Doerr. (1996). Interorganizational collaboration and the locus of innovation: Networks of learning in biotechnology. Administrative Science
Quarterly, 41(1), 116-145
Powell, Packalen, & Whittington. (2012). Organizational and institutional genesis: The emergence of high-tech clusters in the life sciences, 434-465: The Emergence of Organization and Markets. Princeton: Princeton University Press.
Prahalad. (2009). The fortune at the bottom of the pyramid, revised and updated 5th
anniversary edition: Eradicating poverty through profits: FT Press.
Quinn, Anderson, & Finkelstein. (1998). Managing professional intellect: making the most of the best. The strategic Management of Intellectual capital, 87100
Radziwon, & Bogers. (2019). Open innovation in SMEs: Exploring inter-organizational relationships in an ecosystem. Technological Forecasting and Social Change,
146, 573-587
Richardson. (1972). The organisation of industry. The Economic Journal, 82(327), 883-896
Ritala, & Almpanopoulou. (2017). In defense of ‘eco’ in innovation ecosystem. Technovation, 60, 39-42
Rochet, & Tirole. (2003). Platform competition in two-sided markets. Journal of the
European Economic Association, 1(4), 990-1029
Rogers. (2010). Diffusion of innovations: Simon and Schuster.

138
Rohrbeck, Holzle, & Gemunden. (2009). Opening up for competitive advantage - How Deutsche Telekom creates an open innovation ecosystem.
Rong, Hu, Lin, Shi, & Guo. (2015a). Understanding business ecosystem using a 6C framework in Internet-of-Things-based sectors. International Journal of
Production Economics, 159, 41-55
Rong, & Shi. (2014). Business ecosystems: Constructs, configuration and sustaining
superior performance. London: Palgrave Macmillan.
Rong, Wu, Shi, & Guo. (2015b). Nurturing business ecosystems for growth in a foreign market: Incubating, identifying and integrating stakeholders. Journal of
International Management, 21(4), 293-308
Rosenkopf, & Nerkar. (2001). Beyond local search: Boundary-spanning, exploration, and impact in the optical disk industry. Strategic Management Journal, 22(4), 287-306
Schlaegel, & Koenig. (2014). Determinants of entrepreneurial intent: a meta‐analytic test and integration of competing models. Entrepreneurship Theory and Practice,
38(2), 291-332
Schoenecker, & Cooper. (1998). The role of firm resources and organizational attributes in determining entry timing: A cross-industry study. Strategic Management
Journal, 19(12), 1127-1143
Scholten, & Scholten. (2012). Platform-based innovation management: directing external innovational efforts in platform ecosystems. Journal of the Knowledge
Economy, 3(2), 164-184
Schot. (1998). The usefulness of evolutionary models for explaining innovation. The case of the Netherlands in the nineteenth century. History and Technology, an
International Journal, 14(3), 173-200
Shafer, Smith, & Linder. (2005). The power of business models. Business horizons,
48(3), 199-207
Shimizu. (2007). Prospect theory, behavioral theory, and the threat-rigidity thesis: Combinative effects on organizational decisions to divest formerly acquired units. Academy of Management Journal, 50(6), 1495-1514
Shipilov, & Gawer. (2020). Integrating Research on Interorganizational Networks and Ecosystems. Academy of Management Annals, 14(1), 92-121

139
Simchi-Levi. (2008). Designing and managing the supply chain: Concepts, strategies,
and case studies.
Simon. (1955). A behavioral model of rational choice. The quarterly journal of
economics, 69(1), 99-118
Skala. (2019). Characteristics of Startups Digital Startups in Transition Economies (pp. 41-91): Springer.
Stam. (2015). Entrepreneurial ecosystems and regional policy: a sympathetic critique. European Planning Studies, 23(9), 1759-1769
Stam, & Spigel. (2017). Entrepreneurial Ecosystems, forthcoming in: Blackburn. R., De
Clercq, D., Heinonen, J. and Wang, Z.(Eds) Handbook for Entrepreneurship and
Small Business. SAGE: London, UK
Strauss, & Corbin. (1998). Basics of qualitative research. techniques and procedures
for developing grounded theory. Anselm Strauss, Juliet Corbin (Second edition ed.): SAGE Publications.
Stuart, & Podolny. (1996). Local search and the evolution of technological capabilities. Strategic Management Journal, 17(S1), 21-38
Szarek, & Piecuch. (2018). The importance of startups for construction of innovative economies. International Entrepreneurship Review, 4(2), 69-78
Talmar, Walrave, Podoynitsyna, Holmström, & Romme. (2018). Mapping, analyzing and designing innovation ecosystems: The Ecosystem Pie Model. Long Range
Planning
Teece. (1986). Profiting from technological innovation: Implications for integration, collaboration, licensing and public policy. Research Policy, 15(6), 285-305
Teece. (2007). Explicating dynamic capabilities: The nature and microfoundations of (sustainable) enterprise performance. Strategic Management Journal, 28(13), 1319-1350
Teece. (2010). Business models, business strategy and innovation. Long Range
Planning, 43(2-3), 172-194
Teece. (2012). Next-generation competition: New concepts for understanding how innovation shapes competition and policy in the digital economy. Journal of Law,
Economics Policy, 9(1), 97-118

140
Teece. (2016). Business Ecosystem. In Augier & Teece (Eds.), The Palgrave
Encyclopedia of Strategic Management (pp. 1-4). London, UK: Palgrave Macmillan.
Teece. (2018a). Business models and dynamic capabilities. Long Range Planning,
51(1), 40-49
Teece. (2018b). Profiting from innovation in the digital economy: Enabling technologies, standards, and licensing models in the wireless world.
Thomas, & Autio. (2012). Modeling the ecosystem: a meta-synthesis of ecosystem and
related literatures.
Thomas, & Autio. (2020). Innovation ecosystems in management: An organizing typology Oxford Encyclopedia of Business and Management.
Thomas, Autio, & Gann. (2014). Architectural leverage: putting platforms in context. Academy of management perspectives, 28(2), 198-219
Thompson. (1967). Organizations in action. New York: McGraw-Hill. ThompsonOrganizations in Action1967
Tidd, & Bessant. (2018). Managing innovation: integrating technological, market and
organizational change: John Wiley & Sons.
Topkis. (1978). Minimizing a submodular function on a lattice.
Topkis. (1998). Supermodularity and complementarity. Donald M. Topkis: Princeton, NJ Princeton University Press, 1998.
Tsvetkova. (2015). Innovation, entrepreneurship, and metropolitan economic performance: empirical test of recent theoretical propositions. Economic
Development Quarterly, 29(4), 299-316
Uzzi. (1996). The sources and consequences of embeddedness for the economic performance of organizations: The network effect. American sociological review, 674-698
Valkokari. (2015). Business, innovation, and knowledge ecosystems: How they differ and how to survive and thrive within them. Technology Innovation Management
Review, 5(8)
van der Borgh, Cloodt, & Romme. (2012). Value creation by knowledge-based ecosystems: Evidence from a field study.
141
Veselovsky, Nikonorova, & Bitkina. (2017). The development of innovative startups in Russia: the regional aspect. Academy of Strategic Management Journal
Von Bertalanffy. (1956). General system theory. General systems, 1(1), 11-17
von Hippel. (2005). Democratizing innovation: The evolving phenomenon of user innovation. Journal für Betriebswirtschaft, 55(1), 63-78
Williamson, & de Meyer. (2012). Ecosystem Advantage: How to successfully harness the power of partners.
Xiaoren, Ling, & Xiangdong. (2014). Interaction of open innovation and business ecosystem. International Journal of u-and e-Service, Science and Technology,
7(1), 51-64
Yin. (1981). The case study as a serious research strategy. Knowledge, 3(1), 97-114
Yin. (2014). Case study research: Design and methods (5th ed.). Thousand Oaks, CA: Sage.
Zahra, & George. (2002). Absorptive capacity: A review, reconceptualization, and extension. Academy of Management Review, 27(2), 185-203
Zahra, & Nambisan. (2012). Entrepreneurship and strategic thinking in business ecosystems.
Zott, & Amit. (2010). Business model design: an activity system perspective. Long
Range Planning, 43(2-3), 216-226
Zott, & Amit. (2015a). Business model. Wiley Encyclopedia of Management, 1-4
Zott, & Amit. (2015b). Crafting business architecture: The antecedents of business model design. Strategic Entrepreneurship Journal, 9(4), 331-350
Zott, Amit, & Massa. (2011). The business model: recent developments and future research. Journal of management, 37(4), 1019-1042

142
Online Sources and Reports Axa. 2018. Building the future of insurance - Integrated Report 2018. Accessed
November 27, 2019. https://www-axa-com.cdn.axa-contento-118412.eu/www-axa-com%2F0a5e0bd9-78f2-4ef8-b32c-1d3d35ddce80_axa-ri2018-en-accessible.pdf
Allianz. 2018. Outperform, Transform, Rebalance - Annual Report 2018. Accessed November 27, 2019. https://www.allianz.com/content/dam/onemarketing/azcom/Allianz_com/investor-relations/en/results-reports/annual-report/ar-2018/en-AR-Group-2018.pdf
BCG. 2019. Accessed January 03, 2020. https://www.bcg.com/publications/2019/most-innovative-companies-collaborative-platforms-ecosystems-changing-nnovation.asp
European Commission. 2018. Accessed February 02, 2020. https://ec.europa.eu/growth/industry/policy/innovation/scoreboards_en
LVMH. 2018. Translation of the French Financial Documents. Accessed November 27, 2019. https://r.lvmh-static.com/uploads/2019/01/2018-financial-documents.pdf
McKinsey. 2019. Accessed January 03, 2020. https://www.mckinsey.com/~/media/mckinsey/industries/financial%20services/our%20insights/winning%20in%20a%20world%20of%20ecosystems/winning-in-a-world-of-ecosystems-vf.ashx
Nestle. 2018. Annual Review 2018. Accessed November 27, 2019. https://www.nestle.com/sites/default/files/asset-library/documents/library/documents/annual_reports/2018-annual-review-en.pdf
SAP. 2018. 2018 SAP Annual Report on Form 20-F. Accessed November 27, 2019. https://www.sap.com/docs/download/investors/2018/sap-2018-annual-report-form-20f.pdf
Siemens. 2018. Annual Report 2018. Accessed November 27, 2019. https://assets.new.siemens.com/siemens/assets/public.1552038192.4bfbab10-00d6-4a22-aad2-b50f3f232bfb.siemens-annual-report-2018.pdf
Stoxx.com. 2019. Accessed January 17, 2020. https://www.stoxx.com/index-details?symbol=SX5P

vii
7 Appendix
Study-related Appendices 7.1.1 Study I (Chapter 2)
Interview Questionnaire 1: Business Ecosystem Development
Presentation of the definition of business ecosystems/ presentation of results of initial interviews with the goal of creating equal understanding
1. Creation of timeline a. Temporal classification
i.From when to when was the ecosystem built? ii.What were the milestones?
b. Classification of the main construction steps in the timeline (inclusive intermediate steps)
i.Actors: When were and how were actors integrated into business ecosystems?
ii.Activities: What has been done to ensure that business ecosystems can offer a value proposition (operational work)?
iii.Position: When and how were the roles and tasks of the individual actors defined?
iv.Links: When and how was exchange between the actors defined? (information, material, money, influence)
v.Value Proposition: What was done when and how to define the value proposition of the business ecosystem?
c. Classification of the key steps for building the business model i.Value Capturing: How was it defined and determined?
ii.Value Creation: How was it defined and established? iii.Customer: How was the customer defined and acquired?
d. Internal Organization i.When and how were the strategy and objectives for business
ecosystem defined? ii.Was there an internal department for development? If so, who was
involved (number/function of employees)? iii.How has the organization changed over time (more/fewer employees/
distribution of tasks)?

viii
e. Contingencies i.What were the objectives when the Business Ecosystem was set up?
ii.How did the uncertainty about the timing develop? iii.What was the resource base for the construction and operation over
the timeline?
Interview Questionnaire 2: Complementors in Business Ecosystems
1. Was the business ecosystem rebuilt or did it already exist at the time of joining? a. Recognition
i.Do complementors recognize a business ecosystem? ii.Does awareness of participation in a business ecosystem
(complementor) change the relationship with the orchestrator or the negotiating position?
b. Partner search i.How were the individual complementors identified/found?
ii.If complementor: how did one become aware of business ecosystem? iii.How were roles defined in the business ecosystem? iv.If available: what was the initial contribution/benefit ratio?
c. Accession i.How has governance been dealt with? (Confidence versus contract
(hard or soft)) ii.If available (investment/ M&A): how was the bond structured, and to
what extent? iii.What time horizon was agreed?
d. Participation i.What is the relationship between the individual partners?
(cooperative versus competitive)? ii.How did the contribution/benefit ratio develop during the
cooperation? iii.What was the role of the individual complementors (participation
versus extension)? iv.Is there parallel participation in other business ecosystems? v.What is the relationship with the orchestrator?
e. Perspective/Modification i.In your opinion, what is the current perspective for the business
ecosystem?

ix
ii.What is the motivation for a possible modification of the business ecosystem?
iii.What are the other plans related to the business ecosystem? iv.What are exit conditions or what would exit conditions be?
Interview Questionnaire 2: Follow-Up Questions
1. Understanding Partners a. How do I understand partner pain points?
i.If I have no knowledge of this field myself? 2. Planned or Iterative / Satisfying or Maximizing
a. Was the selection of partners (according to partner 1) planned or was iteratively searched (problemistic)? b. Was the first available partner (satisfying) or the true BEST partner (maximizing) searched and selected?
3. Value Propositions a. Are value propositions mostly pain points which arise from cooperation with partners or own experience?
4. Partner Search a. How were partners convinced to participate in the business ecosystem? Value proposition? “Big Picture”? Opportunity? b. Are value proposition partners added to the ecosystem first and then sales partners? c. Why are sales partners integrated into the ecosystem last or late? If rather: Does a sales partner also contribute to the value proposition? d. Why is the customer not the focus of a business ecosystem (usually sales partner first)? Is there a presumption of superior Value Proposition that customers will accept?
5. Is the clock ticking after the conclusion of the contract with partner 1, because partners are at risk of jumping ship after a certain time? 6. If partner 1 is integrated, do I already need a plan for the other partners? 7. How do I search in distant search situations? 8. If I have a search partner: Do I have this permanently or do I learn by project progress and the search partner is eventually eliminated? 9. Is there a specific search partner path?

x
10. How are search partners remunerated/incentivized? Interested in value proposition? Money? Equity?
a. Is there a possible downside? 11. Big Picture
a. Can I only share the Big Picture of the business ecosystem if I contribute to the value proposition?
12. Attentional Capacity a. Since attentional capacity is limited:
i.What happens after Partner 1? ii.Are you searching and working in parallel?
iii.Is search done exclusively by you and work by the partners, or are you exclusively working?
iv.Is a hybrid form bad for success? v.If not, how can a hybrid form be successful? Through a good
plan/big picture?

vii
7.1.2 Study II (Chapter 3)
Interview Questionnaire 4: Startups as Orchestrators of Ecosystems
Let's choose together an ecosystem you are involved in. An ecosystem has the following characteristics:
• At least 3 partners who together provide a service to the customer that a single partner could not provide
• The partners jointly provide the service to the customer • Diverse interdependence between the partners
Goals - How do you achieve your goals in the ecosystem context?
1. What are your goals as a young company? (e.g. growth, financing, technology development, profitability, exit etc.)
2. How do you plan to achieve each of these goals? 3. Why are you doing this? What are the reasons for this due to the ecosystem?
Orchestrator - How a startup fulfills the role of an orchestrator
1. Why are you an orchestrator & why does none of the partners have this role? 2. What influence does your orchestrator role have on the goals?
Goals in general – What are your goals as a startup?
a. Scaling i. How and why has scaling been achieved so far?
ii. What role do the partners play in scaling? b. Financing
i. What type of financing has been chosen so far? ii. Why was this funding chosen? Does the ecosystem/partner have an
influence? c. Development of technology
i. What is the process of technology development? ii. What role do the partners play in technology development?
d. Exit i. What type of exit is intended (secondary, trade sale, IPO)
ii. Why this kind? iii. What role do Ecosystem partners play in an exit?

viii
Interview Questionnaire 5: Follow-Up Questions
Startup as Orchestrator
1. How does a Startup manage to orchestrate despite low resources? 2. What does the initial phase look like, where do I focus the greatest resources?
(after all partners have agreed) 3. What were the focal points you set? How has the focus changed over time?
à Challenge as startup through specifics (Corporates expect performance) 4. What are Pain Points? Startup-specific or business ecosystem topic? Question
statements by asking: What is the problem? Startup problem? Business ecosystem problem? Both of which are reinforced by business ecosystem?
5. Individual financing rounds? More or less financing through business ecosystems? Smart money or just cash?
6. More or less financing needs because of business ecosystems? 7. Query dimensions of the matrix (scale 0-3). 8. How generic were the modules? 9. Is a startup the orchestrator because modules are not generic? 10. Is a startup the orchestrator for competitive reasons (generic modules)?
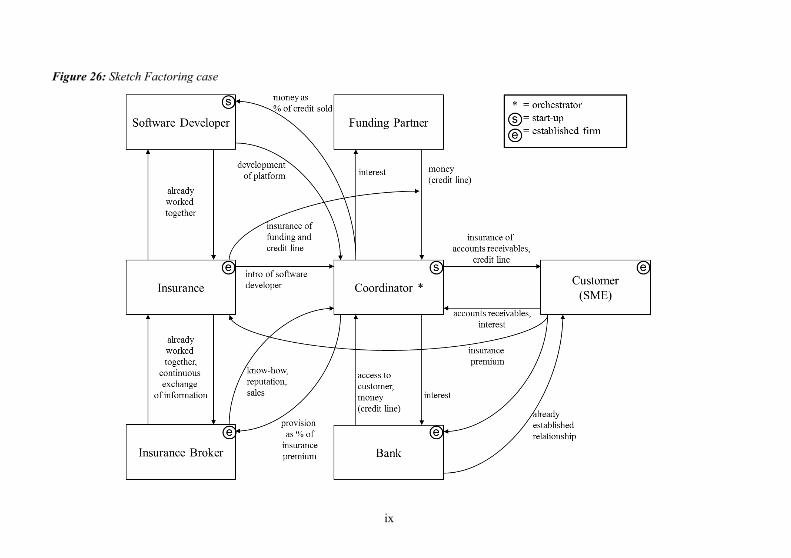
ix
Figure 26: Sketch Factoring case

x
Figure 27: Sketch Sports case

xi
Figure 28: Sketch InsurTech case

xii
Figure 29: Sketch Move case
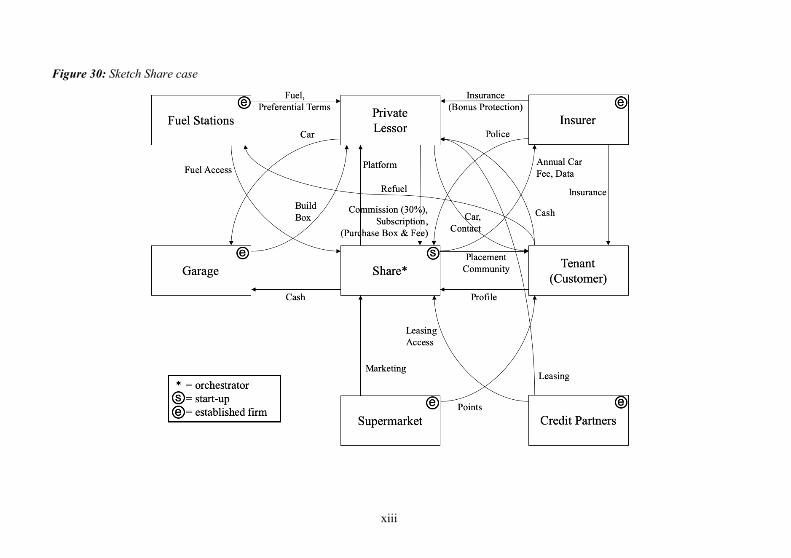
xiii
Figure 30: Sketch Share case

xiv
Figure 31: Sketch Maintenance Analytics case

xv
Figure 32: Sketch Smart Building case
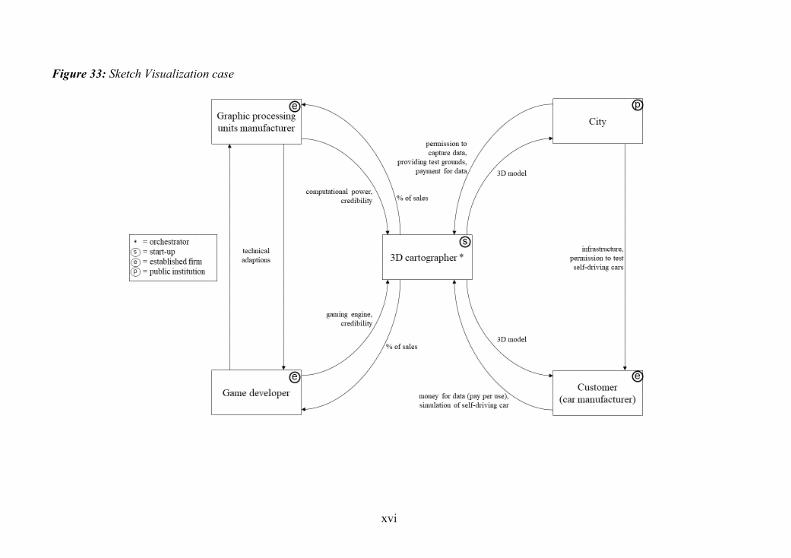
xvi
Figure 33: Sketch Visualization case

xvii
Figure 34: Sketch Access case

xviii
7.1.3 Study III (Chapter 4) Table 12: Data about R&D intensity
Revenues (Million) R&D Expenditures (Million) R&D Intensity
Name 2013 2014 2015 2016 2017 2018 CAGR 2013 2014 2015 2016 2017 2018 CAGR 2013 2014 2015 2016 2017 2018 CAGR
AB INBEV 43195 47063 43604 45517 56444 54619 4,81% 185 217 207 244 276 285 9,03% 0,43% 0,46% 0,47% 0,54% 0,49% 0,52% 4,03%
ABB 41848 39830 35481 33828 25196 27662 -7,95% 1470 1499 1406 1300 1013 1147 -4,84% 3,51% 3,76% 3,96% 3,84% 4,02% 4,15% 3,37%
ADIDAS 14203 14534 16915 19291 21218 21915 9,06% 124 126 139 164 187 153 4,29% 0,87% 0,87% 0,82% 0,85% 0,88% 0,70% -4,37%
AIR LIQUIDE 15225,2 15358 16379 18134,8 20349,3 21011 6,65% 264,8 215 191,1 202 184 277 0,90% 1,74% 1,40% 1,17% 1,11% 0,90% 1,32% -5,39%
AIRBUS 59256 60713 64450 66581 59022 63707 1,46% 3160 3391 3460 3000 2800 3200 0,25% 5,33% 5,59% 5,37% 4,51% 4,74% 5,02% -1,19%
ALLIANZ 98967 100399 107062 107718 107395 102958 0,79% na na na na na na na na na na na na na na
ASML HOLDING
5245,326
5856,277
6287,375
6794,752 8962,7 10944 15,85% 882,029 1074,03
5 710,161 718,793 898,9 1347 8,84% 16,82% 18,34% 11,30% 10,58% 10,03% 12,31% -6,05%
ASTRAZENECA 25711 26547 24708 23002 22465 22090 -2,99% 4821 5579 5997 5890 5757 5932 4,23% 18,75% 21,02% 24,27% 25,61% 25,63% 26,85% 7,45%
AXA 119829 117169 110424 121136 132592 106407 -2,35% na na na na na na na na na na na na na na
BANCO SANTANDER
72976 75046 74920 72578 74326 72849 -0,03% na na na na na 1468 na na na na na na 2,02% na
BASF 73973 74326 70449 57550 61223 62675 -3,26% 1849 1884 1953 1863 1843 2028 1,87% 2,50% 2,53% 2,77% 3,24% 3,01% 3,24% 5,30%
BAYER 40157 41339 46085 34943 35015 39586 -0,29% 3406 3537 4274 4405 4504 5246 9,02% 8,48% 8,56% 9,27% 12,61% 12,86% 13,25% 9,34%

xix
Revenues (Million) R&D Expenditures (Million) R&D Intensity
Name 2013 2014 2015 2016 2017 2018 CAGR 2013 2014 2015 2016 2017 2018 CAGR 2013 2014 2015 2016 2017 2018 CAGR
BNP PARIBAS 59846 62829 67486 67492 59049 60895 0,35% na na na na na na na na na na na na na na
BP 379136 353568 222894 183008 240208 298756 -4,65% 707 663 418 400 391 429 -9,51% 0,19% 0,19% 0,19% 0,22% 0,16% 0,14% -5,09%
BRITISH AMERICAN TOBACCO
15260 13971 13104 14751 19564 24492 9,92% 91 74 60 53 80 105 2,90% 0,60% 0,53% 0,46% 0,36% 0,41% 0,43% -6,39%
DAIMLER 117982 129872 149467 153261 164154 167362 7,24% 5489 5680 6564 7572 8711 9107 10,66% 4,65% 4,37% 4,39% 4,94% 5,31% 5,44% 3,18%
DEUTSCHE TELEKOM 60132 62658 69228 73095 74947 75656 4,70% 97 95,6 108,1 84,1 57,7 57,7 -9,87% 0,16% 0,15% 0,16% 0,12% 0,08% 0,08% -13,91%
DIAGEO 11303 10258 10813 10485 12050 12163 1,48% 21 24 26 28 33 36 11,38% 0,19% 0,23% 0,24% 0,27% 0,27% 0,30% 9,76%
ENEL 75427 73328 73076 68604 72664 73134 -0,62% na na na na na na na na na na na na na na
ENI 114697 93187 72286 55762 66919 75822 -7,94% 122 134 176 161 185 197 10,06% 0,11% 0,14% 0,24% 0,29% 0,28% 0,26% 19,56%
GLAXOSMITH 26505 23006 23923 27889 30186 30821 3,06% 3923 3450 3560 3628 4476 3893 -0,15% 14,80% 15,00% 14,88% 13,01% 14,83% 12,63% -3,12%
HSBC 83837 81086 77769 63459 67306 76324 -1,86% na na na na na na na na na na na na na na
IBERDROLA
31077,112
30032,27
31418,693
28759,148
31263,262
35075,873 2,45% 159 170 200 211 246 267 10,92% 0,51% 0,57% 0,64% 0,73% 0,79% 0,76% 8,27%
ING GROEP 55932 52285 51206 49492 48994 33326 -9,84% na na na na na na na na na na na na na na
INTESA SAN PAOLO
36545 44264
32933 37290 33430 -1,77% na na na na na na na na na na na na na na

xx
Revenues (Million) R&D Expenditures (Million) R&D Intensity
Name 2013 2014 2015 2016 2017 2018 CAGR 2013 2014 2015 2016 2017 2018 CAGR 2013 2014 2015 2016 2017 2018 CAGR
L'OREAL 22124,2 22532 24290,2 24916,3 26023,7 26937,4 4,02% 748,3 760,6 794,1 849,8 877,1 914,4 4,09% 3,38% 3,38% 3,27% 3,41% 3,37% 3,39% 0,07%
LINDE PLC 16655 17047 17944 16948 17113 14900 -2,20% 92 106 132 121 112 123 5,98% 0,55% 0,62% 0,74% 0,71% 0,65% 0,83% 8,37%
LLOYDS BANK 33645 26320 25163 25970 25129 22956 -7,36% na na na na na na na na na na na na na na
LVMH 29016 30638 35664 37600 42636 46826 10,04% 71 79 97 111 130 130 0,128592086 0,24% 0,26% 0,27% 0,30% 0,30% 0,28% 2,56%
NATIONAL GRID 14359 14809 15201 13212 15035 15250 1,21% 15 12 23 19 14 13 -2,82% 0,10% 0,08% 0,15% 0,14% 0,09% 0,09% -3,98%
NESTLE 92158 91612 88785 89469 89590 91439 -0,16% 1503 1628 1678 1736 1739 1687 2,34% 1,63% 1,78% 1,89% 1,94% 1,94% 1,84% 2,50%
NOVARTIS 52716 53634 50387 49436 50135 53166 0,17% 9071 9086 8935 9039 8972 9074 0,01% 17,21% 16,94% 17,73% 18,28% 17,90% 17,07% -0,16%
NOVO 83572 88806 107927 111780 111696 111831 6,00% 11733 13762 13608 14563 14014 14805 4,76% 14,04% 15,50% 12,61% 13,03% 12,55% 13,24% -1,17%
PRUDENTIAL 52375 60126 41305 71842 86562 26846 -12,51% na na na na na na na na na na na na na na
RECKITT 9266 8836 8874 9480 11449 12597 6,33% 152 146 140 149 187 223 7,97% 1,64% 1,65% 1,58% 1,57% 1,63% 1,77% 1,54%
RELX PLC 6035 5773 5971 6889 7341 7492 4,42% na na na na na na na na na na na na na na
RIO TINTO 51171 47664 34829 33781 40030 40522 -4,56% 231 112 104 60 58 45 -27,90% 0,45% 0,23% 0,30% 0,18% 0,14% 0,11% -24,46%
ROCHE 46780 47462 48145 50576 53299 56846 3,97% 9270 9895 9581 11532 11292 12092 5,46% 19,82% 20,85% 19,90% 22,80% 21,19% 21,27% 1,43%
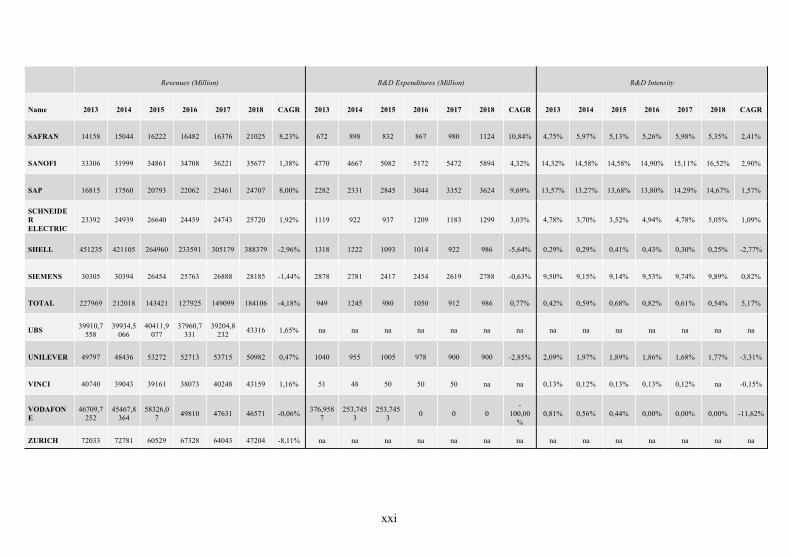
xxi
Revenues (Million) R&D Expenditures (Million) R&D Intensity
Name 2013 2014 2015 2016 2017 2018 CAGR 2013 2014 2015 2016 2017 2018 CAGR 2013 2014 2015 2016 2017 2018 CAGR
SAFRAN 14158 15044 16222 16482 16376 21025 8,23% 672 898 832 867 980 1124 10,84% 4,75% 5,97% 5,13% 5,26% 5,98% 5,35% 2,41%
SANOFI 33306 31999 34861 34708 36221 35677 1,38% 4770 4667 5082 5172 5472 5894 4,32% 14,32% 14,58% 14,58% 14,90% 15,11% 16,52% 2,90%
SAP 16815 17560 20793 22062 23461 24707 8,00% 2282 2331 2845 3044 3352 3624 9,69% 13,57% 13,27% 13,68% 13,80% 14,29% 14,67% 1,57%
SCHNEIDER ELECTRIC
23392 24939 26640 24459 24743 25720 1,92% 1119 922 937 1209 1183 1299 3,03% 4,78% 3,70% 3,52% 4,94% 4,78% 5,05% 1,09%
SHELL 451235 421105 264960 233591 305179 388379 -2,96% 1318 1222 1093 1014 922 986 -5,64% 0,29% 0,29% 0,41% 0,43% 0,30% 0,25% -2,77%
SIEMENS 30305 30394 26454 25763 26888 28185 -1,44% 2878 2781 2417 2454 2619 2788 -0,63% 9,50% 9,15% 9,14% 9,53% 9,74% 9,89% 0,82%
TOTAL 227969 212018 143421 127925 149099 184106 -4,18% 949 1245 980 1050 912 986 0,77% 0,42% 0,59% 0,68% 0,82% 0,61% 0,54% 5,17%
UBS 39910,7558
39934,5066
40411,9077
37960,7331
39204,8232 43316 1,65% na na na na na na na na na na na na na na
UNILEVER 49797 48436 53272 52713 53715 50982 0,47% 1040 955 1005 978 900 900 -2,85% 2,09% 1,97% 1,89% 1,86% 1,68% 1,77% -3,31%
VINCI 40740 39043 39161 38073 40248 43159 1,16% 51 48 50 50 50 na na 0,13% 0,12% 0,13% 0,13% 0,12% na -0,15%
VODAFONE
46709,7252
45467,8364
58326,07 49810 47631 46571 -0,06% 376,958
7 253,745
3 253,745
3 0 0 0 -
100,00%
0,81% 0,56% 0,44% 0,00% 0,00% 0,00% -11,62%
ZURICH 72033 72781 60529 67328 64043 47204 -8,11% na na na na na na na na na na na na na na

xxii
Table 13: Word count
Ecosystem R&D / Innovation
Firm Year Ecosystem Value Proposition Collaboration Partner Trend
ecosystem Technology Knowledge Patent Competencies Innovation Trend innovation
Consolidated trend word count
ABB 2013 0 2 10 11
34 9 3 0 11
ABB 2014 0 1 10 24
36 7 3 4 8
ABB 2015 1 2 12 28
44 10 2 1 39
ABB 2016 1 2 15 34
47 10 2 2 7
ABB 2017 0 1 5 19
38 5 2 0 7
ABB 2018 0 1 6 23
46 8 3 3 12
RGP -6,63485E-18 -0,142857143 -0,914285714 1,457142857
1,971428571 -0,314285714 -0,085714286 0,114285714 -0,857142857
Value 0,1 0,165714286 0,265714286
ADIDAS 2013 0 2 22 99
55 20 11 3 82
ADIDAS 2014 0 2 19 84
38 19 7 4 62
ADIDAS 2015 8 0 34 102
32 15 5 4 58
ADIDAS 2016 8 0 34 90
19 19 3 5 32
ADIDAS 2017 11 0 40 108
29 30 4 3 46
ADIDAS 2018 10 2 42 142
35 25 5 3 70
RGP 2,371428571 -0,171428571 4,657142857 7,857142857
-4 1,771428571 -1,171428571 -0,057142857 -3,828571429
Value 3,678571429 -1,457142857 2,221428571
AIRBUS 2013 0 0 0 3
0 2 0 0 0
AIRBUS 2014 0 0 0 5
2 3 0 0 0
AIRBUS 2015 1 0 5 51
44 10 4 3 39
AIRBUS 2016 1 1 7 47
40 10 2 2 24
AIRBUS 2017 6 1 5 60
32 15 1 3 33
AIRBUS 2018 2 2 5 68
36 14 1 3 35
RGP 0,8 0,4 1,2 13,88571429
7,6 2,742857143 0,171428571 0,657142857 7,4
Value 4,071428571 3,714285714 7,785714286

xxiii
Firm Year Ecosystem Value Proposition Collaboration Partner Trend
ecosystem Technology Knowledge Patent Competencies Innovation Trend innovation
Consolidated trend word count
AIRLIQUIDE 2013 7 0 3 46
26 23 34 2 66
AIRLIQUIDE 2014 12 1 4 46
33 21 34 4 75
AIRLIQUIDE 2015 8 0 7 50
41 31 31 3 73
AIRLIQUIDE 2016 10 0 5 53
52 28 30 3 91
AIRLIQUIDE 2017 13 0 7 59
39 30 25 4 74
AIRLIQUIDE 2018 14 0 3 53
34 32 21 3 67
RGP 1,142857143 -0,085714286 0,2 2,2
1,971428571 1,971428571 -2,657142857 0,142857143 0,571428571
Value 0,864285714 0,4 1,264285714
ALLIANZ 2013 0 1 1 18
6 15 0 1 5
ALLIANZ 2014 0 2 1 31
10 16 0 1 6
ALLIANZ 2015 0 0 0 19
8 13 0 1 6
ALLIANZ 2016 0 0 0 2
1 10 0 1 0
ALLIANZ 2017 0 0 1 6
3 10 0 0 2
ALLIANZ 2018 0 0 0 11
7 15 0 0 8
RGP 0 -0,314285714 -0,142857143 -3,628571429
-0,657142857 -0,6 0 -0,228571429 -0,085714286
-1,021428571 -0,314285714 -1,335714286
ASML 2013 0 0 0 20
100 7 30 0 3
ASML 2014 0 0 0 20
99 8 61 0 2
ASML 2015 0 0 1 31
109 10 64 0 4
ASML 2016 1 0 0 19
108 12 46 0 2
ASML 2017 2 1 8 30
155 34 46 7 39
ASML 2018 2 2 11 35
178 39 22 9 42
RGP 0,485714286 0,371428571 2,228571429 2,657142857
15,91428571 6,857142857 -2,942857143 1,885714286 8,685714286
Value 1,435714286 6,08 7,515714286

xxiv
Firm Year Ecosystem Value Proposition Collaboration Partner Trend
ecosystem Technology Knowledge Patent Competencies Innovation Trend innovation
Consolidated trend word count
AXA 2013 0 0 2 27
0 27 2 1 4
AXA 2014 0 1 2 37
2 25 2 1 5
AXA 2015 0 0 2 66
7 27 2 0 6
AXA 2016 1 0 1 65
13 32 3 1 11
AXA 2017 1 1 2 69
13 33 4 5 18
AXA 2018 2 3 5 104
13 33 4 6 22
RGP 0,4 0,428571429 0,4 13,71428571
2,971428571 1,685714286 0,485714286 1,085714286 3,828571429
Value 3,735714286 2,011428571 5,747142857
AZ 2013 0 0 81 57
42 17 210 0 57
AZ 2014 0 0 79 51
57 16 178 0 45
AZ 2015 0 0 113 53
49 13 200 0 42
AZ 2016 0 0 83 72
45 14 166 0 33
AZ 2017 0 0 94 73
45 20 184 0 34
AZ 2018 0 0 76 77
46 17 167 2 26
RGP 0 0 -0,285714286 5,285714286
-0,571428571 0,371428571 -6,6 0,285714286 -5,628571429
Value 1,25 -2,428571429 -1,178571429
BASF 2013 6 0 10 50
88 17 12 3 42
BASF 2014 6 0 9 69
76 22 11 4 42
BASF 2015 9 0 17 96
72 30 26 3 62
BASF 2016 4 1 15 72
49 27 22 6 49
BASF 2017 0 1 13 81
47 23 15 5 48
BASF 2018 0 1 10 77
51 23 17 7 70
RGP -1,514285714 0,257142857 0,285714286 4,2
-8,428571429 0,857142857 0,942857143 0,742857143 4,142857143
Value 0,807142857 -0,348571429 0,458571429

xxv
Firm Year Ecosystem Value Proposition Collaboration Partner Trend
ecosystem Technology Knowledge Patent Competencies Innovation trend innovation
Consolidated trend word count
BAT 2013 0 0 2 19
11 18 0 0 29
BAT 2014 0 1 1 11
8 19 0 0 22
BAT 2015 0 1 4 17
8 20 0 0 22
BAT 2016 0 0 2 9
10 14 0 0 21
BAT 2017 0 0 2 21
10 18 10 0 15
BAT 2018 0 0 3 29
16 30 10 0 34
RGP 0 -0,114285714 0,171428571 2,057142857
0,942857143 1,457142857 2,285714286 0 0,085714286
Value 0,528571429 0,954285714 1,482857143
BAYER 2013 1 0 40 77
61 20 78 4 52
BAYER 2014 0 0 59 67
46 16 69 4 41
BAYER 2015 3 0 47 72
28 15 64 5 64
BAYER 2016 3 0 40 72
23 17 57 3 68
BAYER 2017 3 0 35 74
30 16 63 3 75
BAYER 2018 1 0 48 58
35 13 73 3 80
RGP 0,257142857 0 -1,114285714 -2,114285714
-5,228571429 -0,942857143 -1,428571429 -0,285714286 7,028571429
Value -0,742857143 -0,171428571 -0,914285714
BMW 2013 0 0 4 25
23 8 0 0 19
BMW 2014 0 0 4 29
32 9 0 0 16
BMW 2015 0 0 3 33
26 11 0 0 17
BMW 2016 0 0 6 29
26 16 0 0 20
BMW 2017 0 0 5 31
21 22 0 0 19
BMW 2018 2 0 8 37
26 24 0 1 17
RGP 0,285714286 0 0,742857143 1,771428571
-0,514285714 3,542857143 0 0,142857143 0,057142857
Value 0,7 0,645714286 1,345714286

xxvi
Firm Year Ecosystem Value Proposition Collaboration Partner Trend
ecosystem Technology Knowledge Patent Competencies Innovation Trend innovation
Consolidated trend word count
BNP 2013 3 0 8 69
2 22 1 0 8
BNP 2014 2 4 7 75
4 26 1 0 15
BNP 2015 7 3 8 92
8 24 1 0 33
BNP 2016 6 3 4 106
8 29 1 1 31
BNP 2017 9 1 2 92
18 32 1 0 29
BNP 2018 11 0 8 80
25 37 1 0 31
RGP 1,714285714 -0,257142857 -0,542857143 3,428571429
4,485714286 2,8 0 0,028571429 4,428571429
Value 1,085714286 2,348571429 3,434285714
BP 2013 2 0 3 78
96 22 4 1 6
BP 2014 1 0 6 75
80 19 4 1 4
BP 2015 0 0 3 82
87 25 7 1 6
BP 2016 0 0 8 89
94 26 7 1 9
BP 2017 0 0 9 94
105 22 7 1 9
BP 2018 0 0 8 91
96 33 5 1 5
RGP -0,371428571 0 1,114285714 3,685714286
2,342857143 1,857142857 0,4 0 0,371428571
Value 1,107142857 0,994285714 2,101428571
DAIMLER 2013 0 0 0 67
66 9 5 0 22
DAIMLER 2014 0 0 1 71
67 15 5 0 29
DAIMLER 2015 0 0 0 60
70 12 9 1 39
DAIMLER 2016 5 0 1 71
64 13 10 1 43
DAIMLER 2017 15 0 2 93
74 26 7 2 43
DAIMLER 2018 8 0 0 98
66 26 4 1 38
RGP 2,571428571 0 0,114285714 6,628571429
0,428571429 3,4 0,057142857 0,314285714 3,6
Value 2,328571429 1,56 3,888571429

xxvii
Firm Year Ecosystem Value Proposition Collaboration Partner Trend
ecosystem Technology Knowledge Patent Competencies Innovation Trend innovation
Consolidated trend word count
DIAGEO 2013 0 0 5 50
10 7 2 0 67
DIAGEO 2014 0 0 3 58
2 8 0 0 34
DIAGEO 2015 0 0 2 35
4 10 0 0 41
DIAGEO 2016 1 0 4 46
5 9 0 0 32
DIAGEO 2017 1 0 6 56
3 10 0 0 29
DIAGEO 2018 2 0 5 52
12 14 0 0 20
RGP 0,4 0 0,314285714 0,428571429
0,4 1,142857143 -0,285714286 0 -7,4
Value 0,285714286 -1,228571429 -0,942857143
ENEL 2013 2 0 4 18
24 5 2 0 19
ENEL 2014 2 0 2 21
20 5 6 0 13
ENEL 2015 2 0 7 17
27 8 5 0 22
ENEL 2016 5 0 7 20
28 5 6 0 25
ENEL 2017 6 0 13 30
38 11 7 1 23
ENEL 2018 4 0 5 19
22 6 5 0 17
RGP 0,714285714 0 1,085714286 1
1,285714286 0,571428571 0,542857143 0,085714286 0,657142857
Value 0,7 0,628571429 1,328571429
ENI 2013 9 0 8 48
28 19 14 2 8
ENI 2014 3 0 5 33
23 2 21 0 6
ENI 2015 2 0 5 27
12 1 10 0 6
ENI 2016 2 0 1 26
11 2 2 0 8
ENI 2017 4 0 6 38
20 5 4 1 7
ENI 2018 15 0 11 73
16 7 9 0 7
RGP 0,942857143 0 0,4 3,971428571
-2 -1,428571429 -2,4 -0,2 0
Value 1,328571429 -1,205714286 0,122857143

xxviii
Firm Year Ecosystem Value Proposition Collaboration Partner Trend
ecosystem Technology Knowledge Patent Competencies Innovation trend innovation
Consolidated trend word count
GSK 2013 2 0 22 56
16 34 135 0 29
GSK 2014 0 0 15 42
15 41 111 0 27
GSK 2015 0 0 14 49
17 32 90 0 33
GSK 2016 0 0 20 44
25 36 119 0 38
GSK 2017 0 0 15 49
31 32 71 0 39
GSK 2018 0 0 26 73
37 28 53 0 50
RGP -0,285714286 0 0,742857143 2,885714286
4,6 -1,514285714 -14,31428571 0 4,171428571
Value 0,835714286 -1,411428571 -0,575714286
HSBC 2013 0 0 31 11
14 24 0 0 5
HSBC 2014 0 0 21 17
9 23 0 1 2
HSBC 2015 0 0 6 38
27 26 0 0 1
HSBC 2016 0 0 3 24
33 13 0 0 4
HSBC 2017 0 0 4 30
19 9 0 1 5
HSBC 2018 0 0 5 34
31 9 0 1 7
RGP 0 0 -5,257142857 4
3,457142857 -3,714285714 0 0,142857143 0,628571429
Value -0,314285714 0,102857143 -0,211428571
IBERDROLA 2013 1 0 2 0
7 1 0 0 5
IBERDROLA 2014 1 0 2 0
7 1 0 0 5
IBERDROLA 2015 2 0 2 1
10 4 0 0 7
IBERDROLA 2016 2 0 2 0
6 5 0 1 9
IBERDROLA 2017 3 0 3 1
10 6 0 1 17
IBERDROLA 2018 3 0 6 6
7 6 0 1 21
RGP 0,457142857 0 0,657142857 0,914285714
0,142857143 1,171428571 0 0,257142857 3,371428571
Value 0,507142857 0,988571429 1,495714286
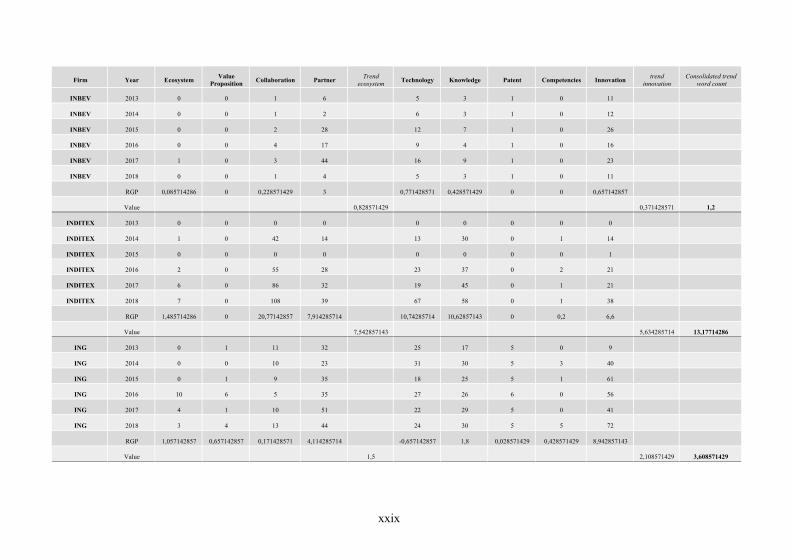
xxix
Firm Year Ecosystem Value Proposition Collaboration Partner Trend
ecosystem Technology Knowledge Patent Competencies Innovation trend innovation
Consolidated trend word count
INBEV 2013 0 0 1 6
5 3 1 0 11
INBEV 2014 0 0 1 2
6 3 1 0 12
INBEV 2015 0 0 2 28
12 7 1 0 26
INBEV 2016 0 0 4 17
9 4 1 0 16
INBEV 2017 1 0 3 44
16 9 1 0 23
INBEV 2018 0 0 1 4
5 3 1 0 11
RGP 0,085714286 0 0,228571429 3
0,771428571 0,428571429 0 0 0,657142857
Value 0,828571429 0,371428571 1,2
INDITEX 2013 0 0 0 0
0 0 0 0 0
INDITEX 2014 1 0 42 14
13 30 0 1 14
INDITEX 2015 0 0 0 0
0 0 0 0 1
INDITEX 2016 2 0 55 28
23 37 0 2 21
INDITEX 2017 6 0 86 32
19 45 0 1 21
INDITEX 2018 7 0 108 39
67 58 0 1 38
RGP 1,485714286 0 20,77142857 7,914285714
10,74285714 10,62857143 0 0,2 6,6
Value 7,542857143 5,634285714 13,17714286
ING 2013 0 1 11 32
25 17 5 0 9
ING 2014 0 0 10 23
31 30 5 3 40
ING 2015 0 1 9 35
18 25 5 1 61
ING 2016 10 6 5 35
27 26 6 0 56
ING 2017 4 1 10 51
22 29 5 0 41
ING 2018 3 4 13 44
24 30 5 5 72
RGP 1,057142857 0,657142857 0,171428571 4,114285714
-0,657142857 1,8 0,028571429 0,428571429 8,942857143
Value 1,5 2,108571429 3,608571429

xxx
Firm Year Ecosystem Value Proposition Collaboration Partner Trend
ecosystem Technology Knowledge Patent Competencies Innovation trend innovation
Consolidated trend word count
ISP 2013 1 0 17 37
18 14 1 2 17
ISP 2014 1 0 10 36
20 6 0 2 34
ISP 2015 1 0 16 23
15 6 0 2 29
ISP 2016 3 0 14 28
19 14 0 5 47
ISP 2017 3 0 8 26
23 18 1 5 43
ISP 2018 2 0 23 49
22 16 0 4 36
RGP 0,371428571 0 0,628571429 1
0,942857143 1,542857143 -0,057142857 0,628571429 4
Value 0,5 1,411428571 1,911428571
LINDE 2013 0 0 0 0
0 0 0 0 0
LINDE 2014 1 0 8 63
53 7 5 0 23
LINDE 2015 3 0 3 46
48 7 6 1 22
LINDE 2016 3 0 5 35
32 9 4 1 19
LINDE 2017 2 0 7 31
28 12 6 2 20
LINDE 2018 0 0 0 0
0 1 0 0 0
RGP 0,085714286 0 -0,028571429 -3,057142857
-2,6 0,628571429 0,028571429 0,171428571 -0,342857143
Value -0,75 -0,422857143 -1,172857143
LLOYDS 2013 0 1 0 35
11 27 0 0 5
LLOYDS 2014 1 0 2 30
7 27 0 0 2
LLOYDS 2015 0 0 3 29
31 29 0 0 4
LLOYDS 2016 0 0 5 39
21 24 0 0 4
LLOYDS 2017 0 0 5 39
30 30 0 2 13
LLOYDS 2018 0 0 7 55
43 37 0 0 18
RGP -0,085714286 -0,142857143 1,314285714 3,914285714
6,257142857 1,542857143 0 0,171428571 2,8
Value 1,25 2,154285714 3,404285714
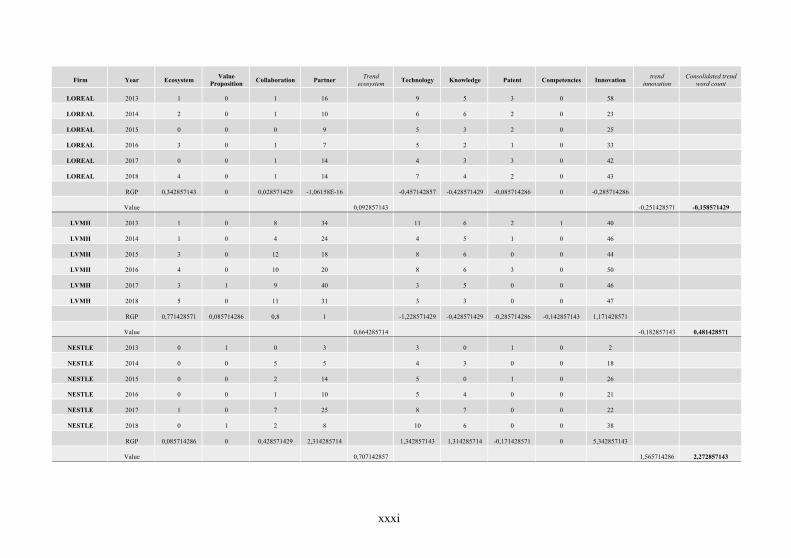
xxxi
Firm Year Ecosystem Value Proposition Collaboration Partner Trend
ecosystem Technology Knowledge Patent Competencies Innovation trend innovation
Consolidated trend word count
LOREAL 2013 1 0 1 16
9 5 3 0 58
LOREAL 2014 2 0 1 10
6 6 2 0 23
LOREAL 2015 0 0 0 9
5 3 2 0 25
LOREAL 2016 3 0 1 7
5 2 1 0 33
LOREAL 2017 0 0 1 14
4 3 3 0 42
LOREAL 2018 4 0 1 14
7 4 2 0 43
RGP 0,342857143 0 0,028571429 -1,06158E-16
-0,457142857 -0,428571429 -0,085714286 0 -0,285714286
Value 0,092857143 -0,251428571 -0,158571429
LVMH 2013 1 0 8 34
11 6 2 1 40
LVMH 2014 1 0 4 24
4 5 1 0 46
LVMH 2015 3 0 12 18
8 6 0 0 44
LVMH 2016 4 0 10 20
8 6 3 0 50
LVMH 2017 3 1 9 40
3 5 0 0 46
LVMH 2018 5 0 11 31
3 3 0 0 47
RGP 0,771428571 0,085714286 0,8 1
-1,228571429 -0,428571429 -0,285714286 -0,142857143 1,171428571
Value 0,664285714 -0,182857143 0,481428571
NESTLE 2013 0 1 0 3
3 0 1 0 2
NESTLE 2014 0 0 5 5
4 3 0 0 18
NESTLE 2015 0 0 2 14
5 0 1 0 26
NESTLE 2016 0 0 1 10
5 4 0 0 21
NESTLE 2017 1 0 7 25
8 7 0 0 22
NESTLE 2018 0 1 2 8
10 6 0 0 38
RGP 0,085714286 0 0,428571429 2,314285714
1,342857143 1,314285714 -0,171428571 0 5,342857143
Value 0,707142857 1,565714286 2,272857143
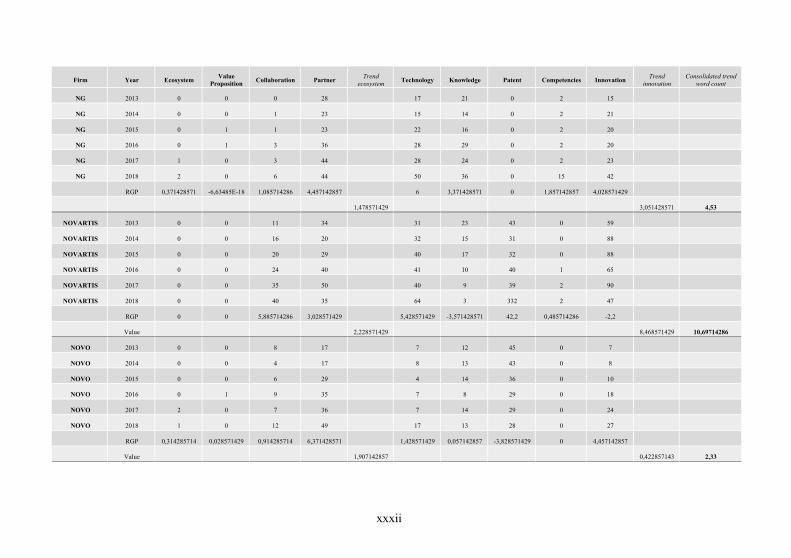
xxxii
Firm Year Ecosystem Value Proposition Collaboration Partner Trend
ecosystem Technology Knowledge Patent Competencies Innovation Trend innovation
Consolidated trend word count
NG 2013 0 0 0 28
17 21 0 2 15
NG 2014 0 0 1 23
15 14 0 2 21
NG 2015 0 1 1 23
22 16 0 2 20
NG 2016 0 1 3 36
28 29 0 2 20
NG 2017 1 0 3 44
28 24 0 2 23
NG 2018 2 0 6 44
50 36 0 15 42
RGP 0,371428571 -6,63485E-18 1,085714286 4,457142857
6 3,371428571 0 1,857142857 4,028571429
1,478571429 3,051428571 4,53
NOVARTIS 2013 0 0 11 34
31 23 43 0 59
NOVARTIS 2014 0 0 16 20
32 15 31 0 88
NOVARTIS 2015 0 0 20 29
40 17 32 0 88
NOVARTIS 2016 0 0 24 40
41 10 40 1 65
NOVARTIS 2017 0 0 35 50
40 9 39 2 90
NOVARTIS 2018 0 0 40 35
64 3 332 2 47
RGP 0 0 5,885714286 3,028571429
5,428571429 -3,571428571 42,2 0,485714286 -2,2
Value 2,228571429 8,468571429 10,69714286
NOVO 2013 0 0 8 17
7 12 45 0 7
NOVO 2014 0 0 4 17
8 13 43 0 8
NOVO 2015 0 0 6 29
4 14 36 0 10
NOVO 2016 0 1 9 35
7 8 29 0 18
NOVO 2017 2 0 7 36
7 14 29 0 24
NOVO 2018 1 0 12 49
17 13 28 0 27
RGP 0,314285714 0,028571429 0,914285714 6,371428571
1,428571429 0,057142857 -3,828571429 0 4,457142857
Value 1,907142857 0,422857143 2,33

xxxiii
Firm Year Ecosystem Value Proposition Collaboration Partner Trend
ecosystem Technology Knowledge Patent Competencies Innovation Trend innovation
Consolidated trend word count
PRUDENTIAL 2013 0 0 0 91
4 22 0 0 7
PRUDENTIAL 2014 0 0 1 106
9 22 0 0 10
PRUDENTIAL 2015 0 0 1 113
8 22 0 0 13
PRUDENTIAL 2016 0 0 1 138
13 15 0 0 6
PRUDENTIAL 2017 1 0 4 97
19 24 0 1 13
PRUDENTIAL 2018 3 1 19 205
30 39 0 0 15
RGP 0,514285714 0,142857143 2,971428571 16,22857143
4,714285714 2,4 0 0,085714286 1,2
Value 4,964285714 1,68 6,644285714
RECKITT 2013 0 0 19 15
8 12 24 0 27
RECKITT 2014 0 0 5 13
8 18 9 0 24
RECKITT 2015 0 0 4 17
7 21 9 0 44
RECKITT 2016 0 0 5 14
2 21 0 0 53
RECKITT 2017 2 0 1 10
3 16 0 1 38
RECKITT 2018 1 0 1 27
6 25 1 1 56
RGP 0,314285714 0 -2,885714286 1,371428571
-0,857142857 1,685714286 -4,314285714 0,228571429 5,6
Value -0,3 0,468571429 0,168571429
RELX 2013 0 1 10 19
44 18 1 0 19
RELX 2014 0 1 8 18
38 17 1 1 15
RELX 2015 0 1 9 28
48 20 1 0 12
RELX 2016 0 1 6 28
48 22 3 0 7
RELX 2017 0 2 7 31
60 23 6 0 11
RELX 2018 2 2 11 37
49 26 5 0 12
RGP 0,285714286 0,228571429 -0,028571429 3,685714286
2,6 1,714285714 1,057142857 -0,085714286 -1,485714286
Value 1,042857143 0,76 1,802857143

xxxiv
Firm Year Ecosystem Value Proposition Collaboration Partner Trend
ecosystem Technology Knowledge Patent Competencies Innovation Trend innovation
Consolidated trend word count
RIO 2013 1 0 2 40
25 22 7 0 9
RIO 2014 0 0 5 44
28 23 7 0 13
RIO 2015 1 0 2 45
21 25 7 1 11
RIO 2016 0 0 2 71
19 30 7 1 12
RIO 2017 0 1 4 113
29 32 7 0 15
RIO 2018 2 0 7 110
41 32 10 1 9
RGP 0,114285714 0,085714286 0,628571429 16,65714286
2,314285714 2,342857143 0,428571429 0,142857143 0,2
Value 4,371428571 1,085714286 5,457142857
ROCHE 2013 0 0 23 38
18 9 8 2 59
ROCHE 2014 0 0 26 64
38 16 2 0 40
ROCHE 2015 0 0 27 65
27 8 4 1 40
ROCHE 2016 3 0 27 80
25 7 1 1 41
ROCHE 2017 3 0 27 58
22 7 3 0 35
ROCHE 2018 4 0 16 65
17 16 1 0 37
RGP 0,914285714 0 -0,914285714 3,771428571
-1,571428571 0,2 -1 -0,285714286 -3,542857143
Value 0,942857143 -1,24 -0,297142857
SAFRAN 2013 0 0 4 140
68 21 10 0 39
SAFRAN 2014 0 0 6 150
70 23 12 0 43
SAFRAN 2015 0 0 7 143
64 43 12 0 52
SAFRAN 2016 0 0 6 146
66 41 13 0 51
SAFRAN 2017 1 0 2 117
64 37 16 1 45
SAFRAN 2018 0 0 2 135
64 33 17 1 55
RGP 0,085714286 0 -0,657142857 -3,457142857
-1,028571429 2,857142857 1,371428571 0,228571429 2,428571429
Value -1,007142857 1,171428571 0,164285714

xxxv
Firm Year Ecosystem Value Proposition Collaboration Partner Trend
ecosystem Technology Knowledge Patent Competencies Innovation Trend innovation
Consolidated trend word count
SANOFI 2013 1 0 67 43
42 11 230 3 16
SANOFI 2014 1 0 71 53
34 12 262 1 18
SANOFI 2015 1 0 87 52
40 11 283 1 24
SANOFI 2016 0 1 90 57
35 13 328 1 24
SANOFI 2017 0 1 101 67
39 14 319 11 17
SANOFI 2018 2 0 112 67
49 13 318 14 18
RGP 0,028571429 0,114285714 9,085714286 4,771428571
1,285714286 0,514285714 18,74285714 2,428571429 0,2
Value 3,5 4,634285714 8,134285714
SANTANDER 2013 0 5 0 2
23 23 0 0 4
SANTANDER 2014 0 0 2 7
47 26 0 2 30
SANTANDER 2015 0 6 2 4
60 36 0 1 30
SANTANDER 2016 0 2 8 3
68 34 0 1 39
SANTANDER 2017 6 6 9 8
72 34 0 1 42
SANTANDER 2018 6 8 22 30
81 57 0 21 49
RGP 1,371428571 0,828571429 3,914285714 4,057142857
10,65714286 5,485714286 0 2,914285714 7,714285714
Value 2,542857143 5,354285714 7,897142857
SAP 2013 33 0 13 154
115 16 27 2 116
SAP 2014 26 1 18 144
88 12 36 3 88
SAP 2015 23 2 17 151
92 11 21 2 84
SAP 2016 28 1 16 140
85 23 17 2 114
SAP 2017 26 1 16 142
93 23 13 1 102
SAP 2018 33 0 20 169
95 24 11 2 98
RGP 0,142857143 -0,028571429 0,8 1,657142857
-2,628571429 2,428571429 -4,371428571 -0,171428571 -0,514285714
Value 0,642857143 -1,051428571 -0,408571429
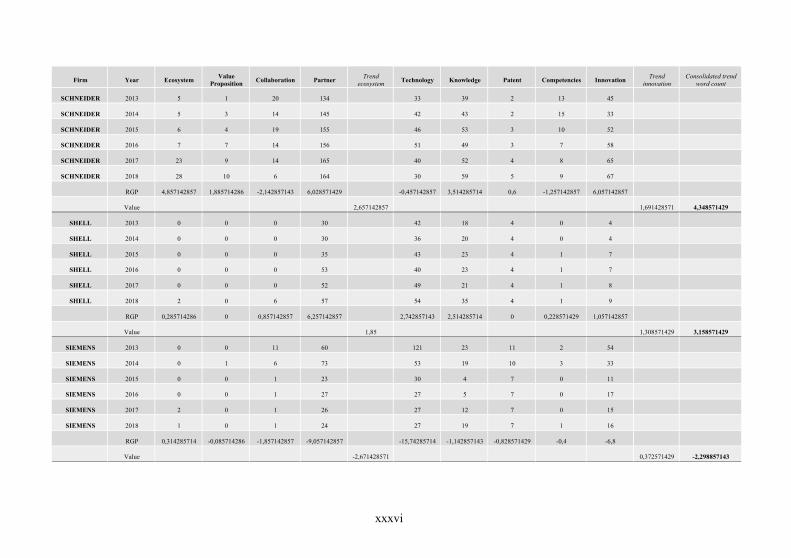
xxxvi
Firm Year Ecosystem Value Proposition Collaboration Partner Trend
ecosystem Technology Knowledge Patent Competencies Innovation Trend innovation
Consolidated trend word count
SCHNEIDER 2013 5 1 20 134
33 39 2 13 45
SCHNEIDER 2014 5 3 14 145
42 43 2 15 33
SCHNEIDER 2015 6 4 19 155
46 53 3 10 52
SCHNEIDER 2016 7 7 14 156
51 49 3 7 58
SCHNEIDER 2017 23 9 14 165
40 52 4 8 65
SCHNEIDER 2018 28 10 6 164
30 59 5 9 67
RGP 4,857142857 1,885714286 -2,142857143 6,028571429
-0,457142857 3,514285714 0,6 -1,257142857 6,057142857
Value 2,657142857 1,691428571 4,348571429
SHELL 2013 0 0 0 30
42 18 4 0 4
SHELL 2014 0 0 0 30
36 20 4 0 4
SHELL 2015 0 0 0 35
43 23 4 1 7
SHELL 2016 0 0 0 53
40 23 4 1 7
SHELL 2017 0 0 0 52
49 21 4 1 8
SHELL 2018 2 0 6 57
54 35 4 1 9
RGP 0,285714286 0 0,857142857 6,257142857
2,742857143 2,514285714 0 0,228571429 1,057142857
Value 1,85 1,308571429 3,158571429
SIEMENS 2013 0 0 11 60
121 23 11 2 54
SIEMENS 2014 0 1 6 73
53 19 10 3 33
SIEMENS 2015 0 0 1 23
30 4 7 0 11
SIEMENS 2016 0 0 1 27
27 5 7 0 17
SIEMENS 2017 2 0 1 26
27 12 7 0 15
SIEMENS 2018 1 0 1 24
27 19 7 1 16
RGP 0,314285714 -0,085714286 -1,857142857 -9,057142857
-15,74285714 -1,142857143 -0,828571429 -0,4 -6,8
Value -2,671428571 0,372571429 -2,298857143

xxxvii
Firm Year Ecosystem Value Proposition Collaboration Partner Trend
ecosystem Technology Knowledge Patent Competencies Innovation Trend innovation
Consolidated trend word count
TELEKOM 2013 0 3 12 144
101 13 5 1 82
TELEKOM 2014 2 1 28 119
102 19 2 1 88
TELEKOM 2015 10 1 33 128
85 23 9 1 199
TELEKOM 2016 11 0 20 94
67 20 2 1 85
TELEKOM 2017 9 0 30 210
148 38 4 2 162
TELEKOM 2018 9 0 42 151
158 39 12 2 146
RGP 1,914285714 -0,542857143 4,085714286 7,828571429
11,57142857 5,257142857 0,971428571 0,228571429 12,22857143
Value 3,321428571 6,051428571 9,372857143
TOTAL 2013 12 0 5 105
27 36 3 2 7
TOTAL 2014 17 0 9 139
19 46 3 3 7
TOTAL 2015 11 0 6 103
17 37 2 5 14
TOTAL 2016 11 0 5 111
21 26 6 2 15
TOTAL 2017 16 0 2 143
20 32 10 6 24
TOTAL 2018 16 0 5 142
27 29 11 4 23
RGP 0,485714286 0 -0,628571429 5,857142857
0,2 -2,514285714 1,857142857 0,457142857 3,771428571
Value 1,428571429 0,754285714 2,182857143
UBS 2013 0 0 0 11
0 0 1 0 1
UBS 2014 2 2 21 34
29 10 2 0 5
UBS 2015 0 3 21 30
34 10 2 0 20
UBS 2016 0 1 9 29
20 9 2 4 6
UBS 2017 0 1 12 41
32 11 2 6 9
UBS 2018 1 0 21 38
47 7 2 7 29
RGP -0,028571429 -0,142857143 1,885714286 4,428571429
6,571428571 1,057142857 0,142857143 1,628571429 3,942857143
Value 1,535714286 2,668571429 4,204285714

xxxviii
Firm Year Ecosystem Value Proposition Collaboration Partner Trend
ecosystem Technology Knowledge Patent Competencies Innovation Trend innovation
Consolidated trend word count
UNILEVER 2013 0 0 0 1
2 0 5 0 5
UNILEVER 2014 1 0 1 23
11 2 4 0 24
UNILEVER 2015 0 0 3 41
23 19 4 1 40
UNILEVER 2016 0 0 2 34
23 16 10 1 45
UNILEVER 2017 1 0 5 28
13 6 3 0 21
UNILEVER 2018 1 0 3 30
31 7 7 0 35
RGP 0,142857143 0 0,742857143 4,371428571
4,314285714 1,257142857 0,371428571 -6,63485E-18 4,171428571
Value 1,314285714 2,022857143 3,337142857
VINCI 2013 4 0 9 144
6 24 10 0 11
VINCI 2014 4 0 3 146
9 25 12 0 8
VINCI 2015 9 0 8 198
21 33 10 0 31
VINCI 2016 12 0 9 191
17 30 8 0 33
VINCI 2017 7 0 13 181
20 28 11 1 63
VINCI 2018 10 0 14 210
26 32 6 1 68
RGP 1,2 0 1,6 12,22857143
3,685714286 1,314285714 -0,714285714 0,228571429 12,91428571
Value 3,757142857 3,485714286 7,242857143
VODAFONE 2013 0 0 3 63
43 19 1 0 7
VODAFONE 2014 0 0 2 45
38 20 1 0 5
VODAFONE 2015 0 0 6 31
27 14 1 0 3
VODAFONE 2016 0 0 0 33
21 12 5 0 10
VODAFONE 2017 0 0 2 46
47 18 6 0 8
VODAFONE 2018 0 0 0 51
46 22 8 0 7
RGP 0 0 -0,6 -1,571428571
1,028571429 0,2 1,542857143 0 0,457142857
Value -0,542857143 0,645714286 0,102857143

xxxix
Firm Year Ecosystem Value Proposition Collaboration Partner Trend
ecosystem Technology Knowledge Patent Competencies Innovation Trend innovation
Consolidated trend word count
ZURICH 2013 0 0 0 4
1 0 0 0 0
ZURICH 2014 0 1 2 13
16 9 0 0 0
ZURICH 2015 0 0 3 14
12 10 0 0 1
ZURICH 2016 0 0 1 15
19 18 0 0 1
ZURICH 2017 0 1 3 14
16 18 0 1 3
ZURICH 2018 0 0 3 9
17 19 0 0 8
RGP 0 5,30788E-17 0,457142857 0,828571429
2,485714286 3,714285714 0 0,085714286 1,4
Value
0,321428571
1,537142857 1,858571429

xl
Curriculum Vitae
Personal Details
Date of birth June 5th, 1992
Place of birth Varel, Germany
Nationality German
Higher Education
Since 11/17 University of St. Gallen | St. Gallen, SUI
Research Associate and Ph.D. in Management
10/15 – 04/17 University of Vienna | Vienna, AUT
Master of Science in International Business Administration
10/12 – 06/15 University of Vienna | Vienna, AUT
Bachelor of Science in Business Administration
Working Experience
11/17 – 08/20 Institute of Technology Management – HSG | St. Gallen, SUI
Project Manager and Co-Lead Ecosystem Living Lab
09/14 – 10/17 updoon GmbH | Varel/Vienna, GER/AUT
Founder and Managing Director
10/15 – 12/2016 Airspott GmbH | Vienna, AUT
Co-Founder