ord-10 ordinarypiloting instructors: george crowl
TRANSCRIPT

ORD-10ORD-10
OrdinaryOrdinaryPilotingPiloting
Instructors: George Crowl

Course OutlineCourse Outline
a. Latitude / longitude. Plot positions.a. Latitude / longitude. Plot positions. b. Degree system of direction, variation, b. Degree system of direction, variation,
deviationdeviation c. Measuring speed and distancec. Measuring speed and distance d. 24 hour time systemd. 24 hour time system e. UTC / GMT / Zulu time and conversione. UTC / GMT / Zulu time and conversion f. DR table of headings / distancesf. DR table of headings / distances g. Use your Sea Scout Pocket Reference!g. Use your Sea Scout Pocket Reference!

ORD-10a.ORD-10a.
Demonstrate your understanding of latitude and Demonstrate your understanding of latitude and longitude. longitude.
Using a Mercator chart, demonstrate that you Using a Mercator chart, demonstrate that you can locate your position from given coordinates can locate your position from given coordinates and determine the coordinates of at least five and determine the coordinates of at least five aids to navigation.aids to navigation.

Latitude / LongitudeLatitude / Longitude
Houston is about Houston is about 30° north30° north of the equator, and of the equator, and 90° west90° west of of Greenwich. Numbers increase up and left in the US.Greenwich. Numbers increase up and left in the US.

60 Minutes per Degree60 Minutes per Degree
60 minutes per degree60 minutes per degree 1 minute = 1 nautical mile1 minute = 1 nautical mile (measured north / south)(measured north / south) 1 NM = 6080 ft1 NM = 6080 ft 60 seconds = 1 minute60 seconds = 1 minute 1 second = 101 feet1 second = 101 feet
In Java, latitude increases In Java, latitude increases south and longitude south and longitude increases east. Why?increases east. Why?

Plotting a PositionPlotting a Position
Determine the parallels on the chart that bracket the latitude.Determine the parallels on the chart that bracket the latitude. Place the pivot point of the compass on the closest line.Place the pivot point of the compass on the closest line. Spread the compass until the lead rests on the given latitude.Spread the compass until the lead rests on the given latitude. Move to the approximate longitude and swing an arc.Move to the approximate longitude and swing an arc.

Plotting a PositionPlotting a Position
The same process is repeated using the longitude scale and the given The same process is repeated using the longitude scale and the given longitude.longitude.
The desired position is the intersection of these two arcs.The desired position is the intersection of these two arcs. If plotted correctly, the intersection should occur at the crest of both arcs.If plotted correctly, the intersection should occur at the crest of both arcs.
Minutes / SecondsMinutes / SecondsMinutes / Tenths, HundredthsMinutes / Tenths, Hundredths
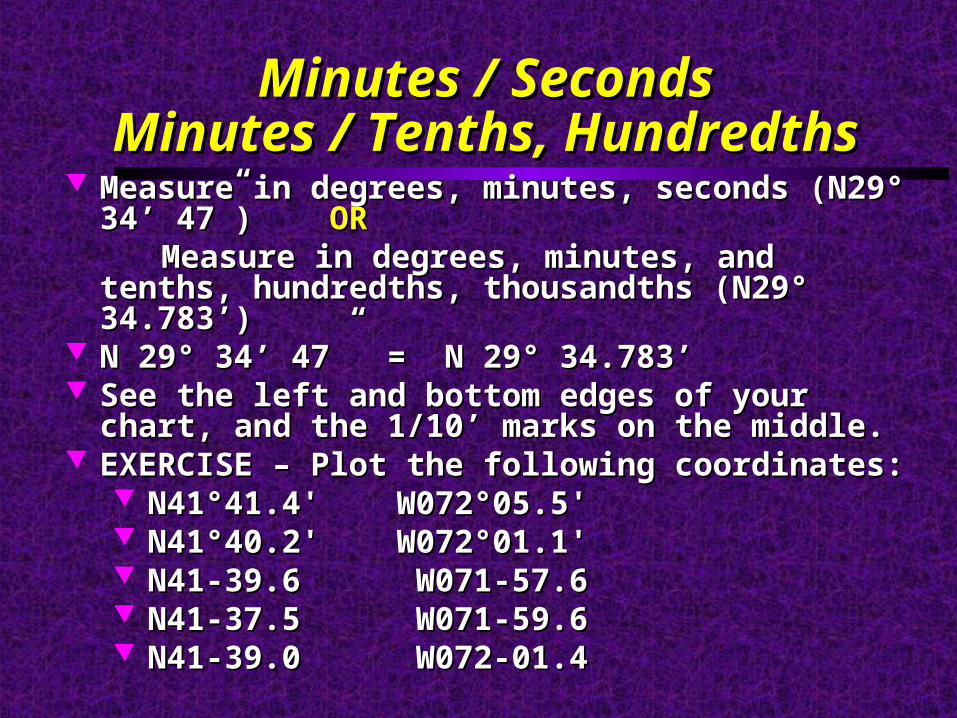
Measure in degrees, minutes, seconds (N29° 34’ 47”) Measure in degrees, minutes, seconds (N29° 34’ 47”) OROR Measure in degrees, minutes, and tenths, hundredths, Measure in degrees, minutes, and tenths, hundredths,
thousandths (N29° 34.783’)thousandths (N29° 34.783’) N 29° 34’ 47” = N 29° 34.783’N 29° 34’ 47” = N 29° 34.783’ See the left and bottom edges of your chart, and the 1/10’ marks See the left and bottom edges of your chart, and the 1/10’ marks
on the middle.on the middle. EXERCISE – Plot the following coordinates:EXERCISE – Plot the following coordinates:
N41°41.4' W072°05.5'N41°41.4' W072°05.5' N41°40.2' W072°01.1'N41°40.2' W072°01.1' N41-39.6 W071-57.6N41-39.6 W071-57.6 N41-37.5 W071-59.6N41-37.5 W071-59.6 N41-39.0 W072-01.4N41-39.0 W072-01.4
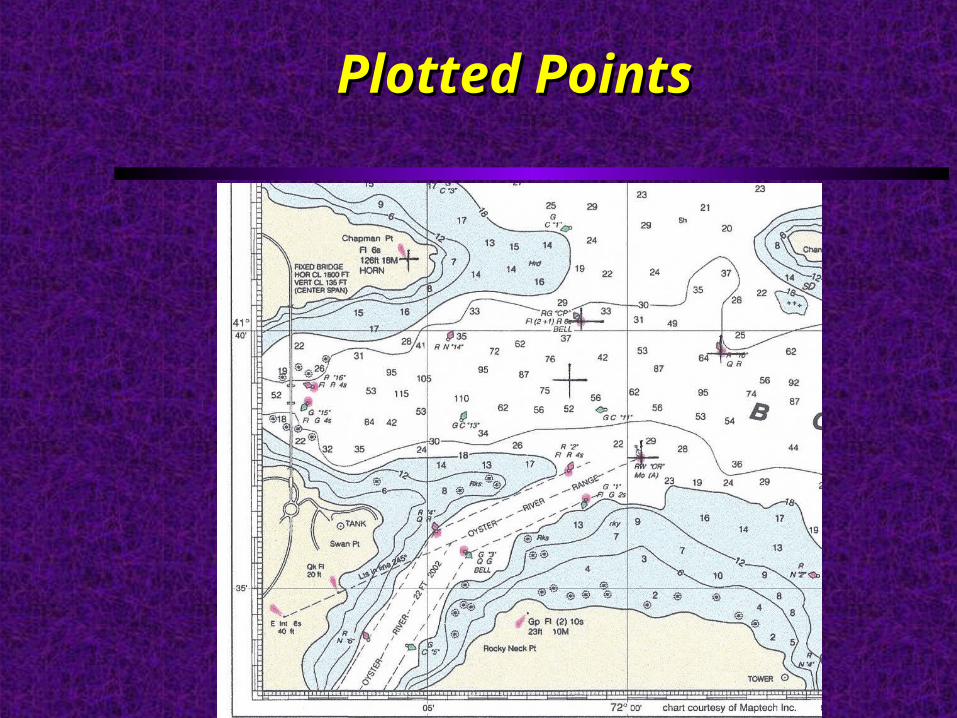
Plotted PointsPlotted Points

Determine Coordinates of…Determine Coordinates of… 1. Channel Island Light Fl 8s 20ft 5M1. Channel Island Light Fl 8s 20ft 5M 2. Bowditch Bay Light G9 Fl G 4s2. Bowditch Bay Light G9 Fl G 4s 3. Oyster River Light G1 Fl G 2s3. Oyster River Light G1 Fl G 2s 4. Bowditch Bay Buoy R N 144. Bowditch Bay Buoy R N 14 5. Bowditch Bay Light R16 Fl R 4s5. Bowditch Bay Light R16 Fl R 4s

Coordinates are:Coordinates are:
1. Channel Is Light N41°41.7' W071°53.7'1. Channel Is Light N41°41.7' W071°53.7' 2. BB G9 Fl G 4s N41-37.5 W071-55.02. BB G9 Fl G 4s N41-37.5 W071-55.0 3. OR G1 Fl G 2s N41-36.7 W072-01.03. OR G1 Fl G 2s N41-36.7 W072-01.0 4. BB R14 R N 14 N41-39.8 W072-04.54. BB R14 R N 14 N41-39.8 W072-04.5 5. BB R16 Fl R 4s N41-38.8 W072-07.95. BB R16 Fl R 4s N41-38.8 W072-07.9

ORD-10b.ORD-10b.
Explain the degree system of compass direction.Explain the degree system of compass direction. Explain variation and deviation, and how they Explain variation and deviation, and how they
are used to convert between true and compass are used to convert between true and compass headings and bearings.headings and bearings.

Degree System of Compass Degree System of Compass Direction (Outer Ring)Direction (Outer Ring)
360° in a circle, 0° and 360° at North (star)360° in a circle, 0° and 360° at North (star) 090° = East090° = East 180° = South180° = South 270° = West270° = West Any intermediateAny intermediate
direction measureddirection measuredby numbered angleby numbered angle

North Magnetic PoleNorth Magnetic Pole
Compass does Compass does not point Nnot point N
Changes Changes everywhereeverywhere
Points 3° E Points 3° E here, so (-) here, so (-)
subtract subtract from Truefrom True

Variation (Variation (inner circleinner circle))
Compass variation – same for all compassesCompass variation – same for all compasses Plotted on chartPlotted on chart
compass rosecompass rose Listed on bottomListed on bottom
of chart alsoof chart also Look at your chartLook at your chart

DeviationDeviation
Deflection of a compass needle caused by a magnetic influence

DeviationDeviation
Different on EVERY boatDifferent on EVERY heading for every boat!Also –E & +W
Defiant Compass Swing 4 NOV 06Motor on, under wayTRUE VAR MAG DEV COMP007 -4 003 -3 000035 -4 031 -1 030- - - - 060092 -4 088 +2 090120 -4 116 +4 120154 -4 150 0 150182 -4 178 +2 180213 -4 209 +1 210243 -4 239 +1 240274 -4 270 0 270305 -4 301 -1 300332 -4 328 +2 330007 -4 003 -3 360

Variation, Deviation & Compass Variation, Deviation & Compass CorrectionCorrection
TC VAR MC DEV COMP TC VAR MC DEV COMP
117 -3E 114 +2W 116117 -3E 114 +2W 116
T V Makes Dull Company -T V Makes Dull Company -
Add Whisky (+W)Add Whisky (+W)
Hand compasses = no deviation, because Hand compasses = no deviation, because
deviation depends on where you are on the boatdeviation depends on where you are on the boat

Sample Deck Log Sample Deck Log

Compass CorrectionCompass Correction
East is Least (-) “-3E”
West is Best (+) “+15W”

Compass CorrectionCompass Correction
T TrueV VariationM MagneticD DeviationC Compass
TV Makes Dull Company

ORD-10c.ORD-10c.
Describe three kinds of devices used aboard Describe three kinds of devices used aboard ship for measuring speed and/or distance ship for measuring speed and/or distance traveled and, if possible, demonstrate their use.traveled and, if possible, demonstrate their use.

Speed LogsSpeed Logs
Speed by RPMSpeed by RPM Dutchman’s log 5”/30’ = 3.56KTDutchman’s log 5”/30’ = 3.56KT Ground LogGround Log Chip LogChip Log Patent LogPatent Log
Taffrail LogTaffrail Log GPSGPS
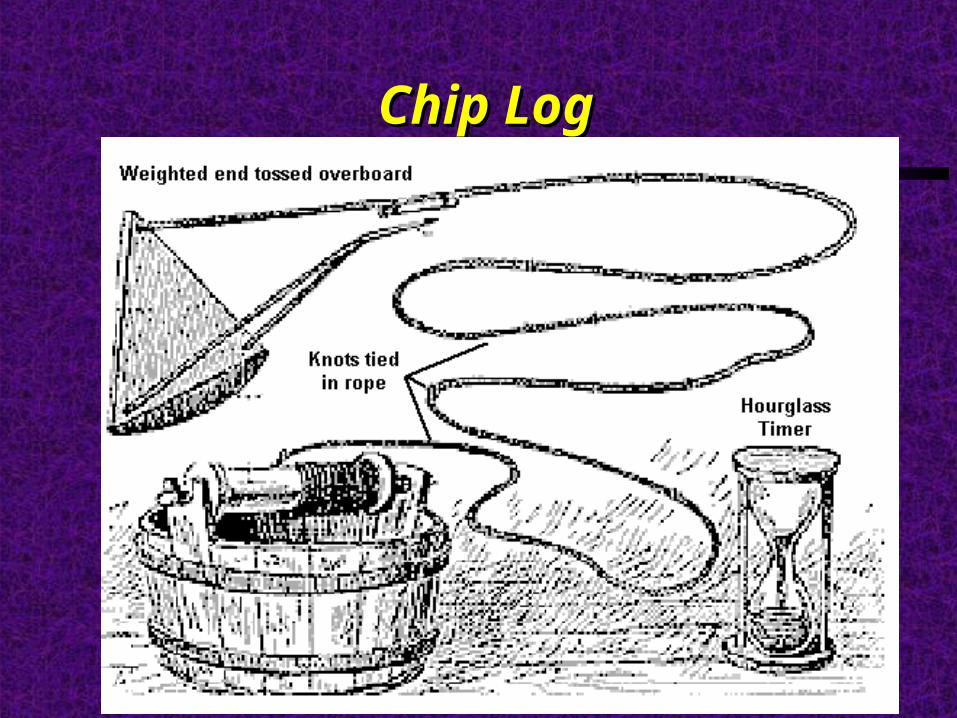
Chip LogChip Log

Patent / Taffrail LogPatent / Taffrail Log


10c. Measure Speed and Distance10c. Measure Speed and Distance
Distance is measured in Distance is measured in Nautical milesNautical miles = 6080 feet= 6080 feet
Speed is measured in Speed is measured in KnotsKnots (Nautical miles per hour)(Nautical miles per hour)
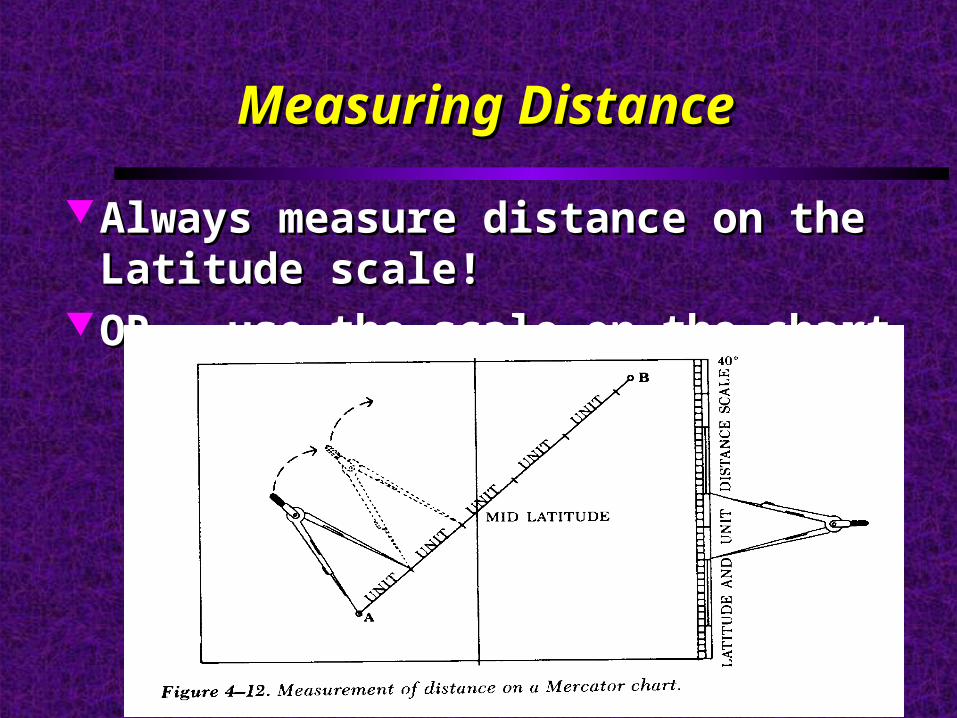
Measuring DistanceMeasuring Distance
Always measure distance on the Latitude scale!Always measure distance on the Latitude scale! OR – use the scale on the chart OR – use the scale on the chart

Why We Use Vertical ScaleWhy We Use Vertical Scale

Measuring Course – Parallel RulesMeasuring Course – Parallel Rules
• B
SSPRp. 22
AA
Using parallel rulesUsing parallel rules

Measuring Course – Plotter Measuring Course – Plotter
Plotter – align using your dividersPlotter – align using your dividers Grommet on longitude lineGrommet on longitude line


Start your deck log with true course and Start your deck log with true course and distance.distance.
Derive mag course and perhaps compass. Derive mag course and perhaps compass.
Deck Log PlanDeck Log Plan

Speed Time DistanceSpeed Time Distance
S (speed) D (distance)
T (time)=
60 (minutes)

Estimate Speed, Calculate TimeEstimate Speed, Calculate Time
6.0 = 9.3 60x9.3 = 558÷6.0 = 93 = 1+33 60 X

ORD-10e.ORD-10e.
Explain the 24-hour time system and Explain the 24-hour time system and demonstrate that you can convert between 12- demonstrate that you can convert between 12- and 24- hour time.and 24- hour time.

12- vs. 24-Hour Time12- vs. 24-Hour Time 12-Hour 24-Hour 12-Hour 24-Hour12-Hour 24-Hour 12-Hour 24-Hour 1:00 AM 0100 1:00 PM 13001:00 AM 0100 1:00 PM 1300 2:00 AM 0200 2:00 PM 14002:00 AM 0200 2:00 PM 1400 3:00 AM 0300 3:00 PM 15003:00 AM 0300 3:00 PM 1500 4:00 AM 0400 4:00 PM 16004:00 AM 0400 4:00 PM 1600 5:00 AM 0500 5:00 PM 17005:00 AM 0500 5:00 PM 1700 6:00 AM 0600 6:00 PM 18006:00 AM 0600 6:00 PM 1800 7:00 AM 0700 7:00 PM 19007:00 AM 0700 7:00 PM 1900 8:00 AM 0800 8:00 PM 20008:00 AM 0800 8:00 PM 2000 9:00 AM 0900 9:00 PM 21009:00 AM 0900 9:00 PM 2100 10:00 AM 1000 10:00 PM 220010:00 AM 1000 10:00 PM 2200 11:00 AM 1100 11:00 PM 230011:00 AM 1100 11:00 PM 2300 Noon 1200 Midnight 2400Noon 1200 Midnight 2400
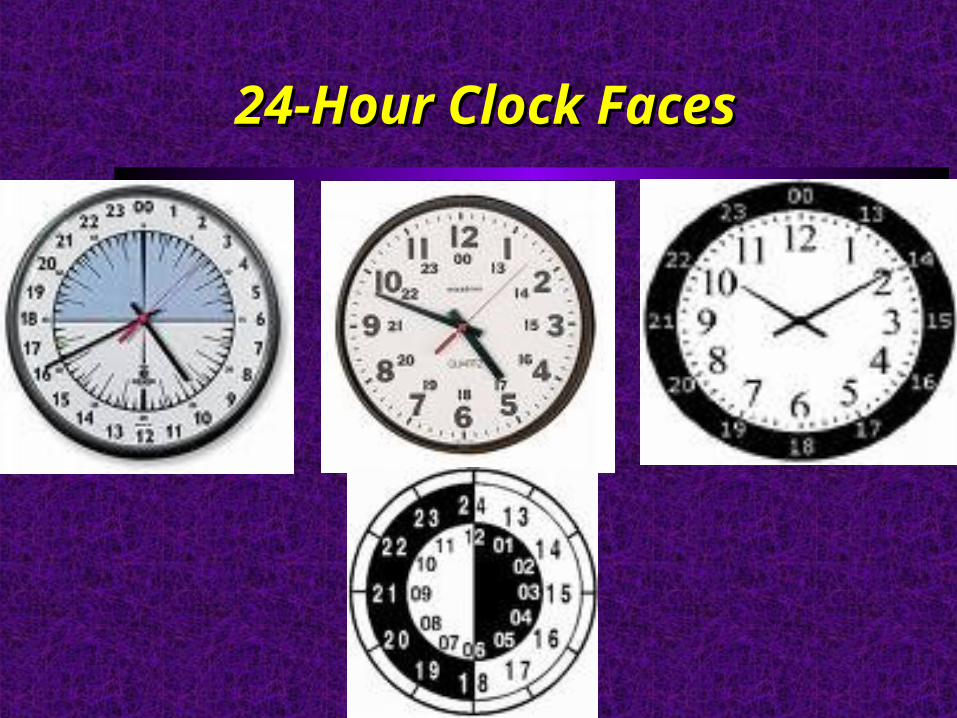
24-Hour Clock Faces24-Hour Clock Faces

ORD-10d.ORD-10d.
Understand Universal Coordinated Time Understand Universal Coordinated Time (Greenwich Mean Time or Zulu Time) and zone (Greenwich Mean Time or Zulu Time) and zone time. time.
Demonstrate your ability to convert from one to Demonstrate your ability to convert from one to the other for your local area.the other for your local area.

Zone TimeZone Time

UCT / GMT / ZuluUCT / GMT / Zulu
Zone Standard DST ZuluZone Standard DST Zulu Eastern 1000 1100 1500Eastern 1000 1100 1500 Central 0900 1000 1500Central 0900 1000 1500 Mountain 0800 0900 1500Mountain 0800 0900 1500 Pacific 0700 0800 1500Pacific 0700 0800 1500

ORD-10f.ORD-10f.
Make a dead reckoning table of compass and Make a dead reckoning table of compass and distances (minimum three legs) between two distances (minimum three legs) between two points, plot these on a chart, and determine the points, plot these on a chart, and determine the final position.final position.
NoteNote: Ideally this requirement should be met : Ideally this requirement should be met while under way. If this is not possible, it may while under way. If this is not possible, it may be simulated using charts.be simulated using charts.

Dead ReckoningDead Reckoning
Record of ships progress based onRecord of ships progress based on Course Speed Time traveled Known starting point (fix) Checked every hour, minimum Checked at every course or speed change

Dead Reckoning TermsDead Reckoning Terms
DR Dead Reckoning PositionDR Dead Reckoning Position EP Estimated PositionEP Estimated Position Fix Established position by any meansFix Established position by any means LOP Line of PositionLOP Line of Position C CourseC Course S SpeedS Speed

Dead Reckoning (DR)Dead Reckoning (DR)
Start from a fixStart from a fix
Label all lines on chartLabel all lines on chart
Numbers are rounded offNumbers are rounded off
Use Military timeUse Military time
Courses & bearings Courses & bearings
are 3 digits (045, 218)are 3 digits (045, 218)
Label course with C & Label course with C &
bearing with B (C045, B126)bearing with B (C045, B126)
• Speed in Knots (1/10 K) placed under the course line• Distance to nearest 1/10 NM place after speed• DR is marked by a dot and semicircle• Fix is marked by a dot and circle with the time • Estimated position marked by a dot and square [·] and time [·] and time

Chart LabelingChart Labeling
C083S8.4 D3.6
. . .FIXDR
Estimated Position
1600 1630
1650

DR ExerciseDR Exercise
Navigator cruising in Bowditch Bay.Plan the cruise with given data. We will then give you the instrument readings
to make that cruise.

Deck Log RW OR to DRDeck Log RW OR to DR

Bowditch Bay RW OR to DRBowditch Bay RW OR to DR

DR to BB R6DR to BB R6

BB R6 to RG DBB R6 to RG D

BB R6 to RG DBB R6 to RG D

RG D to RG CPRG D to RG CP

BB R6 to RG DBB R6 to RG D

SummarySummary
Make a planMake a plan Write it down (deck log, chart)Write it down (deck log, chart) Follow it if you canFollow it if you can Navigation requires times. Write them down!Navigation requires times. Write them down! DR ahead, it makes life easierDR ahead, it makes life easier The perfect is the enemy of the good. A decent The perfect is the enemy of the good. A decent
new heading on time is better than a perfect one new heading on time is better than a perfect one late.late.

Fair WindsFair Winds
And a following seaAnd a following sea

