ordabayeva chandon portion size perception ... - insead
TRANSCRIPT

lable at ScienceDirect
Appetite 103 (2016) 450e457
Contents lists avai
Appetite
journal homepage: www.elsevier .com/locate/appet
In the eye of the beholder: Visual biases in package and portion sizeperceptions
Nailya Ordabayeva a, *, Pierre Chandon b, c
a Carroll School of Management, Boston College, 140 Commonwealth Avenue, Chestnut Hill, MA 02467, USAb INSEAD, Boulevard de Constance, 77305 Fontainebleau, Francec Institute of Cardiometabolism and Nutrition, 91 Boulevard de l’Hopital, Paris 75013, France
a r t i c l e i n f o
Article history:Received 29 July 2015Received in revised form16 September 2015Accepted 12 October 2015Available online 23 October 2015
Keywords:Portion sizeSize estimationVisual perceptionVisual bias
* Corresponding author.E-mail addresses: [email protected] (N. O
insead.edu (P. Chandon).
http://dx.doi.org/10.1016/j.appet.2015.10.0140195-6663/© 2015 Elsevier Ltd. All rights reserved.
a b s t r a c t
As the sizes of food packages and portions have changed rapidly over the past decades, it has becomecrucial to understand how consumers perceive and respond to changes in size. Existing evidence sug-gests that consumers make errors when visually estimating package and portion sizes, and these errorssignificantly influence subsequent food choices and intake. We outline four visual biases (arising fromthe underestimation of increasing portion sizes, the dimensionality of the portion size change, labelingeffects, and consumer affect) that shape consumers' perceptions of package and portion sizes. We discussthe causes of these biases, review their impact on food consumption decisions, and suggest concretestrategies to reduce them and to promote healthier eating. We conclude with a discussion of importanttheoretical and practical issues that should be addressed in the future.
© 2015 Elsevier Ltd. All rights reserved.
1. Introduction
When making decisions about food, consumers tend to relymore on judgments of food quality than food quantity. For example,the vast majority of consumers think that to lose weight, it is moreimportant to monitor what they eat than how much they eat(Collins, 1996; Rozin, Ashmore, & Markwith, 1996). This focus onquality over quantity is reflected in many dietary guidelines andweight-loss programs which prioritize eliminating certain types offoods or nutrients (e.g., sodas, carbohydrates) over regulating thetotal food intake (Thompson & Veneman, 2005). As such, con-sumers may expect to gain more weight from eating very smallportions of a food perceived as “unhealthy” (e.g., one mini-Snickers® bar containing 47 calories) than from eating a very largequantity of “healthy” food (e.g., one cup of low-fat cottage cheese,three carrots and three pears, with a combined calorie count of569 calories) (Oakes, 2005).
In the meantime, the sizes of food packages and portions havechanged dramatically (Nestle, 2003; Rolls, Morris, & Roe, 2002).Portions grew by 60% for salty snacks and 52% for soft drinks in thecourse of just 20 years (Nielsen & Popkin, 2003). Due to public
rdabayeva), pierre.chandon@
concerns about the negative implications of supersized portions forconsumer health (Ledikwe, Ello-Martin, & Rolls, 2005; Young &Nestle, 2003), some marketers have attempted to downsize theirproducts, but with mixed results (Deutsch, 2007). A few downsiz-ing attempts have successfully attracted health and budget-conscious consumers (e.g., T. G. I. Friday's “Right Portion RightPrice”menu, Horovitz, 2007). However, other downsizing attemptshave tried to pass all the cost to consumers (e.g., by charging thesame price for a smaller size) or to conceal the size reductionthrough product packaging (e.g., by replacing some of the productin a package with air). These tactics have drawn strong criticism fordeceiving unsuspecting consumers who typically fail to checkquantity information (Grynbaum, 2014).
In view of these trends, it has become crucial to understand howconsumers perceive and respond to changes in package and portionsize. In this article, we review four systematic visual biases thatdrive consumers' perceptions of package and portion size, showhow these biases influence food consumption decisions, and sug-gest how they can be reduced. We conclude with a discussion ofpotential directions for future research.
2. Four types of biases and their remedies
Although information about food quantity is increasingly easy tofind, including in restaurants, consumers rarely consult quantity

Fig. 1. The underestimation bias is reduced with piecemeal estimation (observedgeometric means, 95% confidence intervals, and model predictions).
N. Ordabayeva, P. Chandon / Appetite 103 (2016) 450e457 451
labels (Wansink& Chandon, 2014). Instead, consumers tend to basetheir food purchase and consumption decisions on instant visualimpressions of package and portion size. This is because theyexpect the package to be a reliable proxy for the amount of foodinside (Lennard, Mitchell, McGoldrick, & Betts, 2001), and becausesome people find quantity information difficult to process, espe-cially when it is presented in non-metric units (Viswanathan, Rosa,& Harris, 2005).
Unfortunately, visual perception is not a reliable indicator offood portion or package size because of four types of visual biases,which pertain to the underestimation of package or portion size,dimensionality effects, labeling and affective biases. Below weoutline the consequences of these biases for consumption decisionsand discuss the effectiveness of various debiasing strategies.
2.1. Underestimation biases and their remedies
The first bias in perceptions of package and portion size is theunderestimation of the magnitude of the increase in the actual sizeof a package or a portion, whereby the perceived size grows moreslowly than the actual size. Essentially, when consumers encountera new supersized product (e.g., a new extra-large can of soda), theyunderestimate how much larger it is compared to the existingsmaller size that they remember from prior purchase or that isdisplayed next to the supersized product on store shelves or onrestaurant counters.
A stream of literature in psychophysics has established that theunderestimation bias arises because people's visual perceptions ofthe size of physical objects follow an inelastic power function ofactual size, as captured by the following mathematical expression(Stevens, 1986):
ESTSIZE ¼ a � ACTSIZEb,
where ESTSIZE is estimated object size, ACTSIZE is actual objectsize, a is a constant term and b is the power exponent denoting thesensitivity of size estimations to changes in actual size.
In the context of food packages and portions, marketing studieshave demonstrated that the power exponent b of consumers' sizeperceptions typically ranges between .5 and .8 (Krishna, 2007,2012), with values close to 1 observed only for one-dimensionalfigures such as lines which are rarely encountered in the fooddomain. This means that the sensitivity of consumers' size esti-mations to actual size diminishes as packages and portions growbigger, resulting in the underestimation of large sizes. In otherwords, consumers become increasingly desensitized to packageand portion size as packages and portions grow bigger, with theresult that they choose and consume larger portions withoutrealizing just how large these portions really are.
To test these predictions, Chandon and Wansink (2007a) askedthe customers of fast food restaurants in three US cities to estimatethe number of calories contained in meals that they had purchased.The results showed that consumers underestimated the size oftheir meals (the average estimated size was 546 calories comparedto the actual 744 calories, a 27% underestimation); more so for largemeals (estimated size was 687 calories vs. actual 1144 calories, a40% underestimation) than small meals (estimated size was433 calories vs. actual 484 calories, an 11% underestimation). Thisunderestimation bias was replicated for round and square shapes(e.g., pizzas, Krider, Raghubir, & Krishna, 2001), when quantityincreased or decreased (Chandon & Ordabayeva, 2009), as well asfor food kept in the pantry (Chandon & Wansink, 2006).
Importantly, the prevalence and the magnitude of the under-estimation bias did not depend on body mass or people's knowl-edge about nutrition and portion size. The same authors (Chandon
&Wansink, 2007a; Wansink & Chandon, 2006a) reported a similarpattern of underestimation among normal-weight and overweightindividuals, among people with a high or low interest in nutrition,and even among trained dieticians. These findings are consistentwith the prevailing view that visual biases are hardwired (Raghubir,2007), suggesting that information-, attention-, and motivation-based strategies directed at debiasing size perceptions havelimited effects. Accordingly, providing information about the un-derestimation bias does not improve the accuracy of consumers'size perceptions (Chandon & Wansink, 2007a; Ordabayeva &Chandon, 2013). Drawing attention to the product does notimprove estimation accuracy (Folkes & Matta, 2004), neither doesconsumers' motivation to produce accurate estimates, be itinherent or induced through financial incentives (Ordabayeva &Chandon, 2013; Raghubir, 2007).
Instead, studies have found that piecemeal estimation, consist-ing of breaking up a large meal into its individual components (e.g.,themain dish, the side dish, and the beverage) is an effectiveway toreduce the underestimation bias. This is because the individualcomponents of a meal have a smaller size than the total meal andtherefore the perception of their size is more accurate. Thuspiecemeal estimation of food portions improves consumers' per-ceptions of total meal size and, as a result, weakens preferences forlarge meals, even among dieticians (Chandon & Wansink, 2007a).To illustrate, in one study dieticians were asked to estimate thesizes of small, medium and large fast-food meals containing asandwich, chips, and a drink. They then indicated which of thethree meals they would choose to consume. Those dieticians whoestimated the size of individual meal components had more ac-curate size estimates and were more likely to choose a small mealthan those who estimated the size of the full meal directly. Fig. 1summarizes these findings.
Helping people realize just how large today's supersized por-tions really are may also enhance the sensory pleasure that peoplederive from the meal. Indeed, studies have shown that supersizedportions often yield lower sensory pleasure because of sensory-specific satiation (Cornil & Chandon, 2015a, 2015b; Garbinsky,Morewedge, & Shiv, 2014).

N. Ordabayeva, P. Chandon / Appetite 103 (2016) 450e457452
2.2. Dimensionality biases and their remedies
The second bias in consumers' size perceptions arises from theshape of the change in package or portion size, notably thedimensionality (whether the package or portion changes in one,two or three dimensions, and whether the dimensions change inthe same or in opposite directions). In short, the underestimationbias is lower when a package or a portion changes in one dimension(e.g., when a tube of Lay's Stax® potato chips increases only inheight) than in multiple dimensions (e.g., when a bag of Lay's po-tato chips increases in height, width and length). Size perception iseven less accurate when some dimensions change in opposite di-rections, such as when the base of a package decreases while theheight increases (elongation).
Reviewing the literature in psychophysics, Krishna (2007) re-ported that the elasticity of size estimations (i.e. the sensitivity ofconsumers' size estimations to changes in actual size, as denoted byexponent b in the power function in the previous section) dependson the dimensionality of an object. Specifically, the elasticity of sizeestimates is higher for one-dimensional objects such as lines(b ¼ 1.0) than for two-dimensional objects such as squares (b isbetween .7 and .8) or three-dimensional objects such as cubes(b¼ .6). A later study showed that this was not driven by the natureof the object itself, but by the dimensionality of the size change(Chandon & Ordabayeva, 2009). It is easier for individuals to trackvolume changes in packages or portions when the change happensin a single dimension (e.g., when a box of candy doubles in size bydoubling its length) than when the change is compounded acrossmultiple dimensions (e.g., when the box doubles in size byincreasing each dimension by 26%, since 26% � 26% � 26% ¼ 100%).For example, in one study Chandon and Ordabayeva (2009) askedpeople to estimate the sizes of six packages of detergent and woolthat doubled in size either through a change in one dimension (thedisplay of detergent increased in width, the display of woolincreased in length) or a change in three dimensions (the detergentbox increased in length, width and height, the wool increased indiameter). As shown in Fig. 2, the sensitivity (and accuracy) of sizeestimations was significantly lower for three-dimensional size in-creases (b ¼ .68) than for one-dimensional size increases (b ¼ .93).
The dimensionality bias also shapes consumers' price
Fig. 2. The dimensionality bias (observed geometric means, 95% confidence intervals,and model predictions).
expectations, product choices and usage behavior. Consumersexpect greater quantity discounts (by up to 57%) for packages su-persized along three dimensions, exhibit a weaker preference forsupersizedmeals and products (by up to 32%) when the supersizingoccurs along three dimensions, and are more likely to over-pourliquids (by up to 19%) into a conical container (which increases inheight and diameter) than a cylindrical one (which only increasesin height).
The dimensionality bias does not occur because people havemore difficulty tracking changes in multiple dimensions than inone; it arises because people have difficulty compounding thechanges along all three dimensions. In fact, other studies havefound that size perceptions behave as if people use an additiverather than a multiplicative rule to combine the changes alongindividual dimensions into a single estimate of volume change(Ordabayeva & Chandon, 2013). According to the additive changeheuristic, a package which doubles in size through a proportionate(26%) increase in all dimensions is perceived to have grown by just78% (because 26% þ 26% þ 26% ¼ 78%).
One of the implications of this linear (additive) heuristic is thatthe dimensionality bias can be reduced by linearizing the change involume frommultiple spatial dimensions to one. Accordingly, if thegoal is to boost consumers' preference and willingness-to-pay forsupersized packages and meals, while simultaneously reducingoverconsumption, then packages and meals that increase in onlyone dimension should be preferred and endorsed. If, however, thegoal is to boost consumers' acceptance of downsized packages andportions, then a three-dimensional change in volume should bepreferred because it is less likely to be detected than a one-dimensional change. For example, in one study, the acceptance ofa downsized soda pack increased by up to 21% when the packshrank in height and diameter as opposed to just height (Chandon& Ordabayeva, 2009).
Moreover, the use of the additive change heuristic implies thatproduct downsizing can go completely unnoticed if the product isdownsized through elongation. Prior research found that elongatedpackages appear to be larger than short, wide packages of the samevolume (Raghubir& Krishna,1999;Wansink& Van Ittersum, 2003).A more recent study found that the additive change heuristic canexplain the elongation effect by suggesting that people fail tocompound the reduction in the two dimensions of the base of theproduct (Ordabayeva & Chandon, 2013). Furthermore, the additivechange model can actually recommend specific changes in the in-dividual package or portion dimensions that can potentiallycompletely hide product downsizing. Ordabayeva and Chandon(2013) verified these model predictions in one study, in whichthey asked participants to estimate the sizes of objects thatdecreased by 8%, 16% and 24% in size from the reference through areduction in height only (1D downsizing) or through elongateddownsizing (achieved by elongating the object's height andshrinking its base, or by elongating its length and shrinking itsheight and width) which the additive change model predictedwould not be perceived. When people relied only on visual esti-mation of product size, they underestimated the magnitude of thedownsizing that occurred in 1D (a 24% reduction in actual size wasperceived as a 20% reduction), and hardly noticed the downsizingthat occurred through elongation (a 24% actual size reduction wasperceived as only a 2% reduction). Allowing people to feel theweight of the product (visual and haptic estimation) helped toeliminate the errors in estimations of elongated downsizing, butonly partly (a 24% actual size reduction was perceived as a 9%reduction). Elongated downsizing is so potent that, in a differentstudy, buyers of a known food brand were significantly more likelyto accept product downsizing when the package was downsizedthrough elongation (using less dramatic changes in shape so as to

Fig. 3. The labeling bias: health halos in the estimation of the size of fast-food meals(observed geometric means, 95% confidence intervals, and model predictions).
N. Ordabayeva, P. Chandon / Appetite 103 (2016) 450e457 453
respect design and shelving constraints) (Ordabayeva & Chandon,2013).
Other studies found that transparent packaging improved vol-ume estimation by facilitating the individual's ability to monitorproduct quantity inside the package as the product was beingconsumed (Deng & Srinivasan, 2013). However, this positive effectof transparent packages on consumers' ability to monitor product(and consumption) volume may be trumped by the detrimentaleffect of transparent packages on self-control due to the greatersalience of tempting foods inside the packaging. Consumers' desireto regulate food intake and a product's inherent ability to facilitate(or jeopardize) this goal may thus interfere with perceptions ofpackage and portion size. We consider these interactions in a latersection on affective biases in package and portion size perceptions.
2.3. Labeling biases and their remedies
The third bias that drives consumers' package and portion sizeperceptions arises from food size labels and front-of-pack labels.While various food labels have been linked to perceptions of taste(e.g., Levin & Gaeth, 1988; Raghunathan, Naylor, & Hoyer, 2006;Wansink & Park, 2002), the focus here is on size labels that havebeen shown to drive perceptions of package and portion sizebeyond simple considerations of taste.
First, labeling the sizes of food packages or portions as “small,”“medium,” or “large” significantly affects size perceptions. In a se-ries of studies, Aydıno�glu and Krishna (2011) found that consumersperceived the portions of snack foods (pretzels, nuts, small sand-wiches and cookies) to be smaller when they were labeled “small”rather than “medium,” or “medium” rather than “large.” This, again,encourages consumers to eat more while thinking that they areeating less, an important issue because the use of size labels is notstandardized and varies significantly across stores and restaurants(Young& Nestle, 1998). For example, the “medium” size of popcornsold at AMC theatres contains fewer calories (680 calories) than the“small” portion of popcorn available at Regal Cinemas (800 calo-ries). Similarly, a medium serving of French fries available atMcDonald's contains virtually the same amount of fries (117 grams)as a small serving available at Burger King (116 grams).
Health and nutrition-related labels also significantly bias calorieperceptions, which are typically construed as a measure of mealsize. For example, labeling a food “low-fat” creates an inference thatthe food contains fewer calories (Wansink & Chandon, 2006b),hence consumers eat more of it because they think a larger servingsize is appropriate and feel less guilty during consumption. Theeffect of “low-fat” labeling is particularly pronounced for hedonicfoods that induce guilt during consumption, and among over-weight individuals who are more susceptible to guilt-reductioncues. Providing information about the actual number of servingscontained in a portion can curb the effect of “low-fat” labeling onfood intake, but only among normal-weight individuals for whomthe serving-size effect of “low-fat” labels is dominant, and notamong overweight individuals for whom the guilt-reduction effectof “low-fat” labels is dominant.
Highlighting the presence of healthy ingredients in a meal alsobiases consumers' perceptions of the calories it contains. WhenChernev and Gal (2010) asked participants to estimate the caloriecontent of a hamburger with or without a side of broccoli, theyfound that consumers mentally averaged (instead of adding) thecalorie content of a hamburger and broccoli to compute the size ofthe combined meal. This resulted in lower (rather than higher)calorie estimations for the hamburger with broccoli (665 calories)than for the one without (761 calories). The averaging bias isparticularly pronounced when attention is drawn to the healthi-ness of meal ingredients, for example, by asking consumers to
compare the healthiness of the individual components of a com-bined meal prior to eliciting their estimations of meal size. Theaveraging bias is mitigated when attention is diverted away fromthe healthiness of individual ingredients to the size of the in-gredients, for example, by asking participants to compare the sizeof individual meal components prior to eliciting their estimationsof meal size.
Similar to highlighting the healthiness of meal ingredients,communicating the healthy positioning of the food or restaurantbrand significantly biases calorie perceptions. A series of studies onperceptions of meals served at McDonald's (which is perceived asrelatively unhealthy) and Subway (which advertises its healthypositioning) found that consumers, on average, thought that mealscontained fewer calories when served at Subway than at McDo-nald's (Chandon & Wansink, 2007b). Consumers were also lesssensitive to changes in actual portion sizes served at Subway thanat McDonald's, as shown in Fig. 3. For example, a 1000 calorie mealwould, on average, be perceived to contain 744 calories at McDo-nald's and only 585 calories at Subway. A follow-up study showedthat this “health halo” created by healthy positioning led diners toeat more at Subway than at McDonald's (1011 calories vs. 648 cal-ories, respectively), while thinking that they ate less (487 caloriesvs. 600 calories, respectively). As shown in Fig. 4, an effectivestrategy to reduce this labeling bias is to encourage consumers toconsider a counterfactual (“consider-the-opposite” condition);specifically, how the healthy positioning of a restaurant may notgeneralize to the healthiness of all the food items consumed at therestaurant (Chandon & Wansink, 2007b). Figs. 3 and 4 summarizethese results.
Finally, the design of the food label itself can influence con-sumers' perceptions of package size. Deng and Kahn (2009) re-ported that a cookie package was perceived to be heavier when theimage of cookies was located on the right (vs. left), on the bottom(vs. top), or on the bottom-right (vs. top-left) of the package facing.This image location bias could be reduced if the package was placednext to packs with a similar product location displayed on the storeshelf (such that a packagewith a product displayed in the “heavy” or“light” location would be assimilated to the surrounding packs thatdisplayed products in the same “heavy” or “light” location, respec-tively). These findings suggest that the pictorial information pro-vided on food labels should be considered in addition to the verbalinformation when predicting the effects of labels on package andportion size perceptions. Specifically, consumers may eat more out
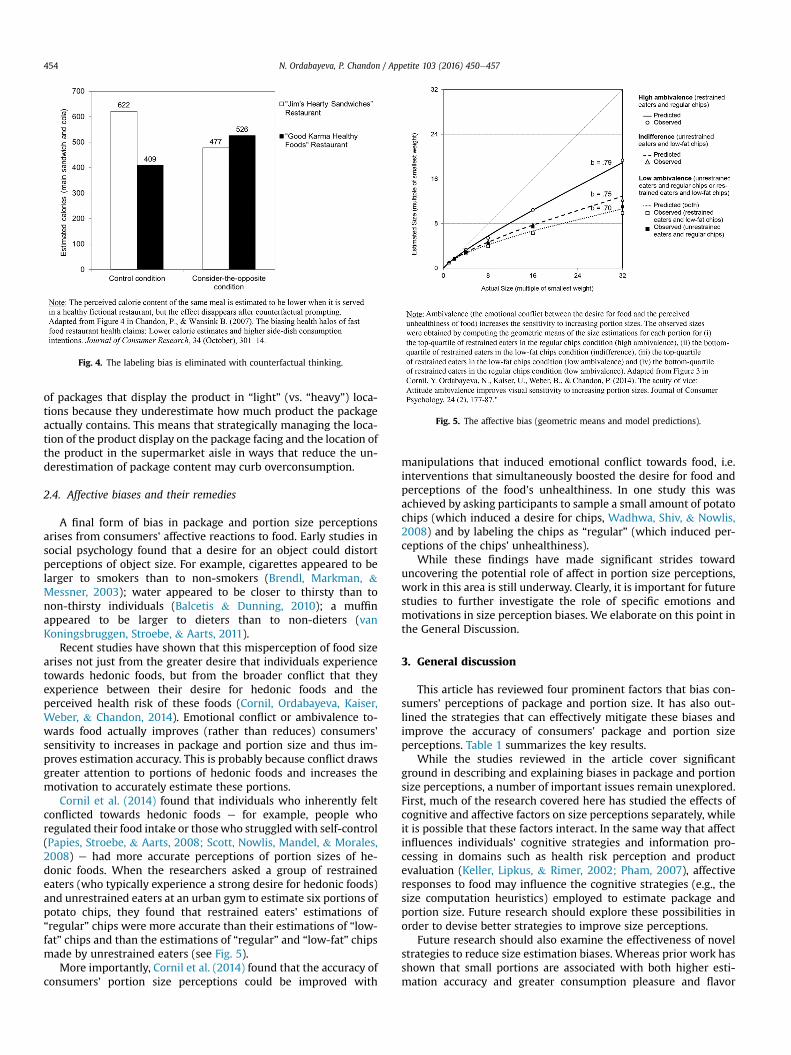
Fig. 4. The labeling bias is eliminated with counterfactual thinking.
Fig. 5. The affective bias (geometric means and model predictions).
N. Ordabayeva, P. Chandon / Appetite 103 (2016) 450e457454
of packages that display the product in “light” (vs. “heavy”) loca-tions because they underestimate how much product the packageactually contains. This means that strategically managing the loca-tion of the product display on the package facing and the location ofthe product in the supermarket aisle in ways that reduce the un-derestimation of package content may curb overconsumption.
2.4. Affective biases and their remedies
A final form of bias in package and portion size perceptionsarises from consumers' affective reactions to food. Early studies insocial psychology found that a desire for an object could distortperceptions of object size. For example, cigarettes appeared to belarger to smokers than to non-smokers (Brendl, Markman, &Messner, 2003); water appeared to be closer to thirsty than tonon-thirsty individuals (Balcetis & Dunning, 2010); a muffinappeared to be larger to dieters than to non-dieters (vanKoningsbruggen, Stroebe, & Aarts, 2011).
Recent studies have shown that this misperception of food sizearises not just from the greater desire that individuals experiencetowards hedonic foods, but from the broader conflict that theyexperience between their desire for hedonic foods and theperceived health risk of these foods (Cornil, Ordabayeva, Kaiser,Weber, & Chandon, 2014). Emotional conflict or ambivalence to-wards food actually improves (rather than reduces) consumers'sensitivity to increases in package and portion size and thus im-proves estimation accuracy. This is probably because conflict drawsgreater attention to portions of hedonic foods and increases themotivation to accurately estimate these portions.
Cornil et al. (2014) found that individuals who inherently feltconflicted towards hedonic foods e for example, people whoregulated their food intake or thosewho struggledwith self-control(Papies, Stroebe, & Aarts, 2008; Scott, Nowlis, Mandel, & Morales,2008) e had more accurate perceptions of portion sizes of he-donic foods. When the researchers asked a group of restrainedeaters (who typically experience a strong desire for hedonic foods)and unrestrained eaters at an urban gym to estimate six portions ofpotato chips, they found that restrained eaters' estimations of“regular” chips were more accurate than their estimations of “low-fat” chips and than the estimations of “regular” and “low-fat” chipsmade by unrestrained eaters (see Fig. 5).
More importantly, Cornil et al. (2014) found that the accuracy ofconsumers' portion size perceptions could be improved with
manipulations that induced emotional conflict towards food, i.e.interventions that simultaneously boosted the desire for food andperceptions of the food's unhealthiness. In one study this wasachieved by asking participants to sample a small amount of potatochips (which induced a desire for chips, Wadhwa, Shiv, & Nowlis,2008) and by labeling the chips as “regular” (which induced per-ceptions of the chips' unhealthiness).
While these findings have made significant strides towarduncovering the potential role of affect in portion size perceptions,work in this area is still underway. Clearly, it is important for futurestudies to further investigate the role of specific emotions andmotivations in size perception biases. We elaborate on this point inthe General Discussion.
3. General discussion
This article has reviewed four prominent factors that bias con-sumers' perceptions of package and portion size. It has also out-lined the strategies that can effectively mitigate these biases andimprove the accuracy of consumers' package and portion sizeperceptions. Table 1 summarizes the key results.
While the studies reviewed in the article cover significantground in describing and explaining biases in package and portionsize perceptions, a number of important issues remain unexplored.First, much of the research covered here has studied the effects ofcognitive and affective factors on size perceptions separately, whileit is possible that these factors interact. In the same way that affectinfluences individuals' cognitive strategies and information pro-cessing in domains such as health risk perception and productevaluation (Keller, Lipkus, & Rimer, 2002; Pham, 2007), affectiveresponses to food may influence the cognitive strategies (e.g., thesize computation heuristics) employed to estimate package andportion size. Future research should explore these possibilities inorder to devise better strategies to improve size perceptions.
Future research should also examine the effectiveness of novelstrategies to reduce size estimation biases. Whereas prior work hasshown that small portions are associated with both higher esti-mation accuracy and greater consumption pleasure and flavor

Table 1Summary of package and portion size estimation biases and remedies.
Bias Findings Remedies References
Underestimation Size estimations follow an inelastic power function of actual size,resulting in the general underestimation of package and portion sizes,more so for large sizes than for small ones.
- Information about size perception biases, attention toproduct, and incentives rewarding estimationaccuracy do not reduce the underestimation bias.
- Piecemeal estimation of individual meal componentsprior to estimation of total meal size reduces theunderestimation bias.
Chandon andWansink (2006,2007a)Cornil and Chandon(2015a, 2015b)Stevens (1986)Krider et al. (2001)Krishna (2007)Wansink andChandon (2006a)
Dimensionality Size estimations are less sensitive when packages or portions change inthree spatial dimensions than when they change in one dimension. Thishappens because people use an additive, instead of a multiplicative,model to compound changes in multiple dimensions.
- Changing packages or portions along one dimensionreduces the dimensionality bias and boostspreferences for product supersizing.
- Changing packages or portions along threedimensions, especially in opposite directions,increases acceptance of product downsizing.
- Facilitating visual package or portion evaluation withnon-visual information (e.g., weighing products byhand) reduces the dimensionality bias.
Chandon andOrdabayeva (2009)Krishna (2007)Ordabayeva andChandon (2013)
Labeling Estimations of package and portion size are lower when labelscommunicate the food's small size, healthy ingredients, healthypositioning or depict the product on the left, top, or top-left (vs. right,bottom, or bottom-right) of the package facing.
- Providing information about the food's actual servingsize reduces the effect of “low-fat” labels onestimations of normal-weight individuals, but not onestimations of overweight individuals.
- Directing attention to the size, rather than thehealthiness, of individual components of a combined(healthy and unhealthy) meal, improves the accuracyof size estimations for combined meals.
- Encouraging consumers to consider counterfactuals(why a meal is not unique to a particular restaurantor retailer) improves the accuracy of size estimationsfor meals served at restaurants and retailers withhealthy positioning.
- Positioning a package that depicts the product in the“heavy” location on the label (bottom, right, bottom-right) next to packs that depict products in the similar“heavy” locations (and vice versa) within the storeshelf display attenuates the bias created by the prod-uct's image location on the label.
Aydıno�glu andKrishna (2011)Chandon andWansink (2007a,2007b)Chernev and Gal(2010)Deng and Kahn(2009)Wansink andChandon (2006b)
Affective Size estimations are more sensitive to changes in package and portionsize when consumers experience an emotional conflict towards food (i.e.when the desire to eat delicious food conflicts with perceptions that thefood is unhealthy).
- Individuals who inherently feel more conflictedtowards food (restrained eaters evaluating hedonicfood) report more accurate estimations of package andportion size increases than individuals who do not feelconflicted towards food (unrestrained eatersevaluating hedonic food, restrained or unrestrainedeaters evaluating utilitarian food).
- Inducing conflict towards food (by simultaneouslyencouraging consumers to sample the food andhighlighting that the food is unhealthy) improves thesensitivity of size estimations.
Balcetis andDunning (2010)Cornil et al. (2014)vanKoningsbruggenet al. (2011)
N. Ordabayeva, P. Chandon / Appetite 103 (2016) 450e457 455
perceptions (Cornil & Chandon, 2015a, 2015b; Morewedge, Huh, &Vosgerau, 2010), it would be interesting to test whether focusing onthe hedonic pleasure or the rich flavor of a meal improves con-sumers' perceptual sensitivity to changes in food size. It could alsobe useful to identify tactics that enhance the predicted and actualpleasure derived from food consumption. One possibility may be toencourage the use of consumption rituals (e.g., simple gesturessuch deep breathing or closing eyes, Vohs, Wang, Gino, & Norton,2013), which have been shown to enhance the enjoyment of he-donic foods such as chocolate as well as utilitarian foods such ascarrots.
Similarly, it would be valuable to test the effectiveness ofadditional debiasing strategies that can be easily implemented inthe marketplace. One such tactic may be drawing attention tofoods' unit price in the retail environment.While the display of unitprice is not uniformly mandated, many retailers provide unit priceinformation in their stores voluntarily. Prior studies have suggestedthat perceptions of package size and unit price are linked (Nason &Della Bitta, 1983; Wansink, 1996), suggesting that available unit
price information may be used to infer package size. However,some consumers pay little attention to unit price information(Vanhuele & Dr�eze, 2002), and even when they do, they oftenmisunderstand price and quantity information. For example,Mohan, Chandon, and Riis (2015) reported that most people, evenhighly educated ones, believed that 50% more product for free is asvaluable as a 50% price reduction, whereas, in fact, 50% extraproduct volume reduces the unit price by only 33%. Althoughproviding unit price information could reduce such errors, a sig-nificant proportion of consumers fail to recognize that a givenpercentage cost discount is more valuable than a quantity bonus ofthe same nominal magnitude. Therefore, finding ways to make unitprice information more prominent and influential in the size esti-mation process would help consumers make healthier in-storedecisions.
More generally, price and cost-related issues have receivedlimited attention in the size perception literature.While biased sizeestimates influence consumers' price expectations (Chandon &Ordabayeva, 2009), less is known about how price informs the

N. Ordabayeva, P. Chandon / Appetite 103 (2016) 450e457456
size estimation process. In the meantime, changes in package andportion size are typically accompanied by changes in price (Mohanet al., 2015). It is important to understand how consumers combineand trade off package size information with price information tomake food decisions.
Much of the research to date has focused on the effects ofproduct-related factors on package and portion size perceptions,leaving the effects of non-food-related, environmental factorslargely untapped. Yet environmental cues play a significant role inhow consumers perceive and consume foods (Chandon&Wansink,2012), andmeal size perception is no exception. One study revealedthat perceptions of meal size served on a plate were subject to theDelboeuf illusion: the same portion looks smaller on a large platethan on a smaller plate (Van Ittersum & Wansink, 2012). Otherstudies have shown that various sensory modalities (for example,sound pitch, food color) influence a host of food perceptions(Spence & Piqueras-Fiszman, 2014), and may therefore influencesize perception as well.
Similarly, a more refined understanding of the influence of thesensory characteristics of the food itself on package and portionsize perceptions is needed. For example, a recent study reportedthat a food's texture influenced perceptions of its calorie content:foods with soft textures were perceived to be more caloric thanfoods with hard textures (Biswas, Szocs, Krishna, & Lehmann,2014). It would be interesting to study how the experience of thefood through other senses (e.g., smell, taste) influences visual es-timations of food size. In this context, examining the effect on sizeperceptions and consumption of novel food processing techniquessuch as the infusion of air into food (e.g., ice-cream) through a slow-churning process will be practically relevant.
Finally, the current understanding of how visual biases influencebehaviors other than size estimation including food choice, portionsize choice, ingestion, satiation and product usage remains rela-tively limited. Future research should more comprehensivelydelineate the behavioral outcomes of visual biases across lab andreal-world settings.
In addressing these various questions, future studies will needto go beyond the traditional methods to test the practical relevanceand implications of size perception biases and solutions in a naturalconsumption setting. This will entail expanding beyond the labo-ratory to environments in which food consumption actually takesplace, from undergraduate student samples to more representativeand larger populations, including vulnerable groups (e.g., children,individuals who are actively trying to lose weight or those who aretrying tomanageweight-related health issues), from estimations offood that is about to be consumed or has just been consumed toperceptions of food that is prepared (cooked) for oneself and others,food that is stored or stockpiled, and food that is wasted. Under-standing how one-shot judgments of food quantity and quality(which have been the subject of most of the existing studies)translate to repeat behaviors and habits, and how interventionsthat improve food perceptions suggested in the literature endureover time are another avenue to be explored. Such approacheswould enable a long-term perspective to emerge about the rootsand remedies of size perception biases and thus allow us to addresscrucial questions about the effectiveness and sustainability of cur-rent food packaging and portion strategies for consumer health andwellbeing.
References
Aydıno�glu, N., & Krishna, A. (2011). Guiltless gluttony: the asymmetric effect of sizelabels on size perceptions and consumption. Journal of Consumer Research,37(6), 1095e1112.
Balcetis, E., & Dunning, D. (2010). Wishful seeing: more desired objects are seen ascloser. Psychological Science, 21, 147e152.
Biswas, D., Szocs, C., Krishna, A., & Lehmann, D. R. (2014). Something to chew on:the effects of oral haptics on mastication, orosensory perception, and calorieestimation. Journal of Consumer Research, 41(2), 261e273.
Brendl, C. M., Markman, A. B., & Messner, C. (2003). The devaluation effect: acti-vating a need devalues unrelated objects. Journal of Consumer Research, 29,463e473.
Chandon, P., & Ordabayeva, N. (2009). Supersize in one dimension, downsize inthree dimensions: effects of spatial dimensionality on size perceptions andpreferences. Journal of Marketing Research, 46(6), 725e738.
Chandon, P., & Wansink, B. (2006). How biased household inventory estimatesdistort shopping and storage decisions. Journal of Marketing, 70, 118e135(October).
Chandon, P., & Wansink, B. (2007a). Is obesity caused by calorie underestimation? Apsychophysical model of meal size estimation. Journal of Marketing Research, 44,84e99 (February).
Chandon, P., & Wansink, B. (2007b). The biasing health halos of fast food restauranthealth claims: lower calorie estimates and higher side-dish consumption in-tentions. Journal of Consumer Research, 34, 301e314 (October).
Chandon, P., & Wansink, B. (2012). Does food marketing need to make us fat? Areview and solutions. Nutrition Reviews, 70, 571e593.
Chernev, A., & Gal, D. (2010). Categorization effects in value judgments: averagingbias in evaluating combinations of vices and virtues. Journal of MarketingResearch, 47(4), 738e747.
Collins, K. (1996). New survey on portion size: Americans still cleaning plates.Washington, DC: American Institute for Cancer Research.
Cornil, Y., & Chandon, P. (2015a). Pleasure as a substitute for size: how multisensoryimagery can make people happier with smaller food portions. Journal of Mar-keting Research. in press.
Cornil, Y., & Chandon, P. (2015b). Pleasure as an ally of healthy eating? Contrastingvisceral and Epicurean eating pleasure and their association with portion sizepreferences and wellbeing. Appetite. in press.
Cornil, Y., Ordabayeva, N., Kaiser, U., Weber, B., & Chandon, P. (2014). The acuity ofvice: attitude ambivalence improves visual sensitivity to increasing portionsizes. Journal of Consumer Psychology, 24(2), 177e187.
Deng, X., & Kahn, B. E. (2009). Is your product on the right side? The “locationeffect” on perceived product heaviness and package evaluation. Journal ofMarketing Research, 46(6), 725e738.
Deng, X., & Srinivasan, R. (2013). When do transparent packages increase (ordecrease) food consumption? Journal of Marketing, 77(4), 104e117.
Deutsch, C. H. (2007). Incredible shrinking packages. The New York Times (May 12),(accessed August 12, 2009). Available at: http://www.nytimes.com/2007/05/12/business/12package.html.
Folkes, V., & Matta, S. (2004). The effect of package shape on consumers' judgmentsof product volume: attention as a mental contaminant. Journal of ConsumerResearch, 31(2), 390e401.
Garbinsky, E. N., Morewedge, C. K., & Shiv, B. (2014). Interference of the end: whyrecency bias in memory determines when a food is consumed again. Psycho-logical Science, 25, 1466e1474.
Grynbaum, M. M. (2014). New York's ban on big sodas is rejected by final court. TheNew York Times. June 26.
Horovitz, B. (2007). Friday's, Subway tailor meals for health-conscious. USA Today.March 1.
Keller, P. A., Lipkus, I. M., & Rimer, B. K. (2002). Depressive realism and health riskaccuracy: the negative consequences of positive mood. Journal of ConsumerResearch, 29, 57e69.
van Koningsbruggen, G. M., Stroebe, W., & Aarts, H. (2011). Through the eyes ofdieters: biased size perception of food following tempting food primes. Journalof Experimental Social Psychology, 47, 293e299.
Krider, R. E., Raghubir, P., & Krishna, A. (2001). Pizzas: pi or square? Psychophysicalbiases in area comparisons. Marketing Science, 20(4), 405e425.
Krishna, A. (2007). Spatial perception research: an integrative review of length,area, volume, and number perception. In M. Wedel, & R. Pieters (Eds.), Visualmarketing: From attention to action (pp. 167e193). Mahwah, NJ: Lawrence Erl-baum Associates.
Krishna, A. (2012). An integrative review of sensory marketing: engaging the sensesto affect perception, judgment and behavior. Journal of Consumer Psychology,22(3), 333e351.
Ledikwe, J. H., Ello-Martin, J., & Rolls, B. J. (2005). Modifying the food environment:energy density, food costs, and portion size. Journal of Nutrition, 135(4),905e909.
Lennard, D., Mitchell, V. W., McGoldrick, P., & Betts, E. (2001). Why consumersunder-use food quantity indicators. International Review of Retail, Distribution &Consumer Research, 11(2), 177e199.
Levin, I. P., & Gaeth, G. J. (1988). How consumers are affected by the framing ofattribute information before and after consuming the product. Journal of Con-sumer Research, 15, 374e378.
Mohan, B., Chandon, P., & Riis, J. (2015). Percentage cost discounts always beatpercentage benefit bonuses: helping consumers evaluate nominally equivalentpercentage changes. Journal of Marketing Behavior, 1(1), 75e107.
Morewedge, C. K., Huh, Y. E., & Vosgerau, J. (2010). Thought for food: imaginedconsumption reduces actual consumption. Science, 303, 1530e1533.
Nason, R. W., & Della Bitta, A. J. (1983). The incidence and consumer perceptions ofquality surcharges. Journal of Retailing, 59(2), 40e54.
Nestle, M. (2003). Increasing portion sizes in American diets: more calories, moreobesity. Journal of the American Dietetic Association, 103, 39e40.

N. Ordabayeva, P. Chandon / Appetite 103 (2016) 450e457 457
Nielsen, S. J., & Popkin, B. M. (2003). Patterns and trends in food portion sizes, 1977-1998. Journal of American Medical Association, 289(4), 450e453.
Oakes, M. E. (2005). Stereotypical thinking about foods and perceived capacity topromote weight gain. Appetite, 44(3), 317e324.
Ordabayeva, N., & Chandon, P. (2013). Predicting and managing consumers' packagesize impressions. Journal of Marketing, 77, 123e137.
Papies, E. K., Stroebe, W., & Aarts, H. (2008). The allure of forbidden food: on the roleof attention in self-regulation. Journal of Experimental Social Psychology, 44,1283e1292.
Pham, M. (2007). Emotion and rationality: a critical review and interpretation ofempirical evidence. Review of General Psychology, 11(2), 155e178.
Raghubir, P. (2007). Are visual perception biases hard-wired? In M. Wedel, &R. Pieters (Eds.), Visual marketing: From attention to action (pp. 143e166).Mahwah, NJ: Lawrence Erlbaum Associates.
Raghubir, P., & Krishna, A. (1999). Vital dimensions in volume perception: can theeye fool the stomach? Journal of Marketing Research, 36, 313e326.
Raghunathan, R., Naylor, R. W., & Hoyer, W. D. (2006). The unhealthy ¼ tastyintuition and its effects on taste inferences, enjoyment, and choice of foodproducts. Journal of Marketing, 70, 170e184.
Rolls, B. J., Morris, E. L., & Roe, L. S. (2002). Portion size of food affects energy intakein normal-weight and overweight men and women. American Journal of ClinicalNutrition, 76(6), 1207e1213.
Rozin, P., Ashmore, M., & Markwith, M. (1996). Lay American conceptions ofnutrition: dose insensitivity, categorical thinking, contagion, and the monotonicmind. Health Psychology, 15(6), 438e447.
Scott, M. L., Nowlis, S. S., Mandel, N., & Morales, A. C. (2008). The effects of reducedfood size and package size on the consumption behavior of restrained andunrestrained eaters. Journal of Consumer Research, 35(3), 391e405.
Spence, C., & Piqueras-Fiszman, B. (2014). The perfect meal: the multisensory scienceof food and dining. Chichester, West Sussex, UK: John Wiley & Sons Inc.
Stevens, S. S. (1986). Psychophysics: Introduction to its perceptual, neural, and socialprospects. Oxford: Transaction Books.
Thompson, T. G., & Veneman, A. M. (2005). Dietary guidelines for Americans (6th ed.).
Washington DC: US Government Printing Office.Van Ittersum, K., & Wansink, B. (2012). Plate size and color suggestibility: the
Delboeuf illusion's bias on serving and eating behavior. Journal of ConsumerResearch, 39, 215e228.
Vanhuele, M., & Dr�eze, X. (2002). Measuring the price knowledge shoppers bring tothe store. Journal of Marketing, 66, 72.
Viswanathan, M., Rosa, J. A., & Harris, J. E. (2005). Decision making and coping offunctionally illiterate consumers and some implications for marketing man-agement. Journal of Marketing, 69, 15e31 (January).
Vohs, K. D., Wang, Y., Gino, F., & Norton, M. I. (2013). Rituals enhance consumption.Psychological Science, 24(9), 1714e1721.
Wadhwa, M., Shiv, B., & Nowlis, S. M. (2008). A bite to whet the reward appetite: theinfluence of sampling on reward-seeking behaviors. Journal of MarketingResearch, 45, 403e413.
Wansink, B. (1996). Can package size accelerate usage volume? Journal of Marketing,60, 1e14 (July).
Wansink, B., & Chandon, P. (2006a). Meal size, not body size, explains errors inestimating the calorie content of meals. Annals of Internal Medicine, 145,326e332.
Wansink, B., & Chandon, P. (2006b). Can ‘low-fat’ nutrition labels lead to obesity?Journal of Marketing Research, 43, 605e617 (November).
Wansink, B., & Chandon, P. (2014). Slim by design: redirecting the accidental driversof mindless overeating. Journal of Consumer Psychology, 24, 413e431.
Wansink, B., & Park, S. B. (2002). Sensory suggestiveness of labeling: do soy labelsbias taste? Journal of Sensory Studies, 17, 483e491.
Wansink, B., & Van Ittersum, K. (2003). Bottoms up! The influence of elongation onpouring and consumption volume. Journal of Consumer Research, 30, 455e463.
Young, L. R., & Nestle, M. (1998). Variation in perceptions of a ‘medium’ foodportion: implications for dietary guidance. The Journal of American Dietetic As-sociation, 98, 458e459 (April).
Young, L. R., & Nestle, M. (2003). Expanding portion sizes in the US marketplace:implications for nutrition counseling. The Journal of American Dietetic Associa-tion, 103, 231e234 (February).