ore geology reviews - university of california, santa cruzapaytan/publications/2016_articles... ·...
TRANSCRIPT

Ore Geology Reviews xxx (2016) xxx–xxx
OREGEO-01934; No of Pages 16
Contents lists available at ScienceDirect
Ore Geology Reviews
j ourna l homepage: www.e lsev ie r .com/ locate /oregeorev
Formation of Fe-Mn crusts within a continental margin environment
Tracey Conrad a,⁎, James R. Hein b, Adina Paytan a, David A. Clague c
a University California Santa Cruz, 1156 High Street, Santa Cruz, CA 95060, USAb U.S. Geological Survey, PCMSC, 2885 Mission St., Santa Cruz, CA 95060, USAc Monterey Bay Aquarium Research Institute, 7700 Sandholdt Rd., Moss Landing, CA 95039, USA
Abbreviations: Fe-Mn, ferromanganese; CCM, Califoexclusive economic zone; CCS, California Current SIntermediate Water; CFA, carbonate fluorapatite; OMZPacific prime crust zone; CCZ, Clarion Clipperton Zone; Pppb, parts per billion; ppm, parts per million; REE, rare eelements plus yttrium; HREY, heavy REY; CL, confidencevehicle; PAAS, post-Archean Australian Shale.⁎ Corresponding author.
E-mail address: [email protected] (T. Conrad).
http://dx.doi.org/10.1016/j.oregeorev.2016.09.0100169-1368/© 2016 Elsevier B.V. All rights reserved.
Please cite this article as: Conrad, T., et al., Fdx.doi.org/10.1016/j.oregeorev.2016.09.010
a b s t r a c t
a r t i c l e i n f oArticle history:Received 7 April 2016Accepted 8 September 2016Available online xxxx
This study examines Fe-Mncrusts that formon seamounts along theCalifornia continental-margin (CCM),withinthe United States 200 nautical mile exclusive economic zone. The study area extends from approximately 30° to38° North latitudes and from 117° to 126°West longitudes. The area of study is a tectonically active northeast Pa-cific plate boundary region and is also part of the North Pacific Subtropical Gyre with currents dominated by theCalifornia Current System. Upwelling of nutrient-rich water results in high primary productivity that produces apronounced oxygen minimum zone. Hydrogenetic Fe-Mn crusts forming along the CCM show distinct chemicaland mineral compositions compared to open-ocean crusts. On average, CCM crusts contain more Fe relative toMn than open-ocean Pacific crusts. The continental shelf and slope release both Fe and Mn under low-oxygenconditions. Silica is also enriched relative to Al compared to open-ocean crusts. This is due to the North Pacificsilica plume and enrichment of Si along the path of deep-water circulation, resulting in Si enrichment in bottomand intermediate waters of the eastern Pacific.The CCM Fe-Mn crusts have a higher percentage of birnessite than open-ocean crusts, reflecting lower dissolvedseawater oxygen that results from the intense coastal upwelling and proximity to zones of continental slopepore-water anoxia. Carbonatefluorapatite (CFA) is not present andCCMcrusts donot showevidence of phospha-tization, even in the older sections. The mineralogy indicates a suboxic environment under which birnessiteforms, but in which pH is not high enough to facilitate CFA deposition. Growth rates of CCM crusts generally in-crease with increasing water depth, likely due to deep-water Fe sources mobilized from reduced shelf and slopesediments.Many elements of economic interest including Mn, Co, Ni, Cu, W, and Te have slightly or significantly lower con-centrations in CCM crusts relative to crusts from the Pacific Prime Crust Zone and other open-ocean basins. How-ever, concentrations of total rare earth elements and yttrium average only slightly lower contents and in thefuture may be a strategic resource for the U.S.
© 2016 Elsevier B.V. All rights reserved.
Keywords:Ferromanganese crustsEastern PacificCalifornia marginStrategic metalsMarine mineral resources
1. Introduction
Hydrogenetic ferromanganese (Fe-Mn) crusts and nodules precipi-tate from seawater on elevated seafloor features devoid of sediment.Fe-Mn crusts have growth rates typically ranging from 1–5 mm/Myr(75% of analyzed open-ocean samples), with very high mean porosityof 60%, and extremely high mean specific surface area of 325 m2/g(Hein et al., 2000). Fe-Mn crusts up to 26 cm thick that accumulated
rnia continental margin; EEZ,ystem; NPIW, North Pacific, oxygen minimum zone; PCZ,GE, platinum group elements;arth elements; REY, rare earthlevel; ROV, remotely operated
ormation of Fe-Mn crusts wit
over 80 Ma have been found in the central Pacific Ocean (Hein et al.,2000; Hein and Koschinsky, 2014). The main manganese mineral inFe-Mn crusts is vernadite (δ-MnO2), which has a negative surfacecharge in seawater that can sorb positively charged ions from seawater(Koschinsky and Halbach, 1995; Koschinsky and Hein, 2003). The mainiron mineral is Fe oxyhydroxide (FeO(OH)) that has a slight positivesurface charge in seawater that is conducive to sorption of negativelycharged ions and neutral complexes from seawater (Koschinsky andHein, 2003). These properties of Fe-Mn crusts result in their enrichmentin many elements relative to the Earth's crustal abundance (Hein et al.,2000, 2010a; Koschinsky andHein, 2003). Themost notable of these areTe, Co, Mo, Bi, Pt, Nb, W, Zr, and rare earth elements plus yttrium (REY)(Hein et al., 2000; Hein and Koschinsky, 2014).
Much of the research on Fe-Mn crusts has focused on open-oceancrusts from the equatorial Pacific (Hein et al., 2009). Fe-Mn crustsfrom the Pacific prime crust zone (PCZ) in the north-equatorial Pacifichave the greatest economic potential and four exploration contracts
hin a continental margin environment, Ore Geol. Rev. (2016), http://
2 T. Conrad et al. / Ore Geology Reviews xxx (2016) xxx–xxx
have been signed through the International Seabed Authority in that re-gion (Hein et al., 2013, 2016). One exploration contract for Fe-Mn crustsfrom the Rio Grande Rise in the Atlantic Ocean has also been signed.There are fewer detailed studies of Fe-Mn crusts from the Atlantic andIndianOceanswith the exception of the northeast and northwest Atlan-tic Ocean (Koschinsky and Halbach, 1995; Muiños et al., 2013) and theIndian Ocean Afanasiy-Nikitin seamount complex (Banakar et al.,2007; Rajani et al., 2005) and Ninetyeast Ridge (Hein et al., 2016).Only a few studies have focused solely on continent-proximal Fe-Mncrusts from the east Pacific off southern California and within the Bor-derland (Hein et al., 2005, 2010a).
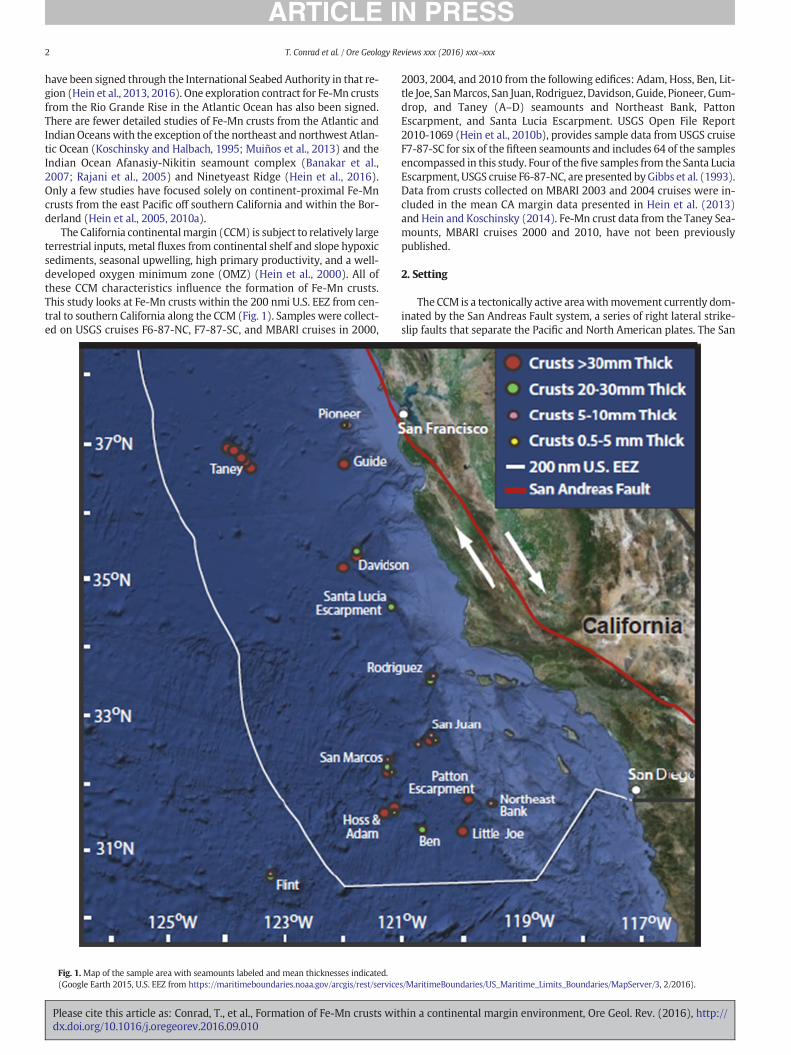
The California continentalmargin (CCM) is subject to relatively largeterrestrial inputs, metal fluxes from continental shelf and slope hypoxicsediments, seasonal upwelling, high primary productivity, and a well-developed oxygen minimum zone (OMZ) (Hein et al., 2000). All ofthese CCM characteristics influence the formation of Fe-Mn crusts.This study looks at Fe-Mn crusts within the 200 nmi U.S. EEZ from cen-tral to southern California along the CCM (Fig. 1). Samples were collect-ed on USGS cruises F6-87-NC, F7-87-SC, and MBARI cruises in 2000,
Fig. 1.Map of the sample area with seamounts labeled and mean thicknesses indicated.(Google Earth 2015, U.S. EEZ from https://maritimeboundaries.noaa.gov/arcgis/rest/service
Please cite this article as: Conrad, T., et al., Formation of Fe-Mn crusts witdx.doi.org/10.1016/j.oregeorev.2016.09.010
2003, 2004, and 2010 from the following edifices: Adam, Hoss, Ben, Lit-tle Joe, SanMarcos, San Juan, Rodriguez, Davidson, Guide, Pioneer, Gum-drop, and Taney (A–D) seamounts and Northeast Bank, PattonEscarpment, and Santa Lucia Escarpment. USGS Open File Report2010-1069 (Hein et al., 2010b), provides sample data from USGS cruiseF7-87-SC for six of the fifteen seamounts and includes 64 of the samplesencompassed in this study. Four of thefive samples from the Santa LuciaEscarpment, USGS cruise F6-87-NC, are presented byGibbs et al. (1993).Data from crusts collected on MBARI 2003 and 2004 cruises were in-cluded in the mean CA margin data presented in Hein et al. (2013)and Hein and Koschinsky (2014). Fe-Mn crust data from the Taney Sea-mounts, MBARI cruises 2000 and 2010, have not been previouslypublished.
2. Setting
The CCM is a tectonically active areawithmovement currently dom-inated by the San Andreas Fault system, a series of right lateral strike-slip faults that separate the Pacific and North American plates. The San
s/MaritimeBoundaries/US_Maritime_Limits_Boundaries/MapServer/3, 2/2016).
hin a continental margin environment, Ore Geol. Rev. (2016), http://

3T. Conrad et al. / Ore Geology Reviews xxx (2016) xxx–xxx
Andreas is currently moving at a rate of approximately 35 mm/yr(Powell and Weldon, 1992). The total movement northward of the Pa-cific Plate relative to the North American Plate is approximately600 kmover 20Ma (Powell andWeldon, 1992). Basin and Range exten-sion began around 17Ma and continues today. Paleo-tectonic events in-clude the opening of the Gulf of California between 7.7 and 5.8 Ma, anduplift of the Coast Ranges and Sierra Nevada approximately 5 Ma (Holtet al., 2000; Oskin and Stock, 2003). The oceanic crust age for the sam-pled region ranges from approximately 30 to 20 Ma based on magneticanomalies (Atwater and Severinghaus, 1989; Cande and Kent, 1995;Davis et al., 2002).
The California Current System (CCS) is the eastern boundary regionof the North Pacific Subtropical Gyre and exhibits strong upwelling ofcold, nutrient-rich water with upwelling velocities between 10 and 20m d−1 during the spring and summer seasons due to northwesterlywinds and Ekman transport (Biller and Bruland, 2013; Carr, 2001;Checkley and Barth, 2009). Increasing element concentrations alongthe path of deep-water circulation are controlled by biogeochemical cy-cles and residence times and enrichment from continental margin sed-iments to the benthic boundary layer. Upwelled water contains highconcentrations of macronutrients (nitrate, phosphate, silicic acid) andmicronutrients (Fe, Mn, Co, Ni, Cu, Zn, Cd) promoting phytoplanktongrowth (Biller and Bruland, 2013). The upwelled water is transportedoff shore and nutrient distributions are affected by mixing, biologicdrawdown, and particulate scavenging (Biller and Bruland, 2013).
The dominant water masses along the CCM are the North Pacific In-termediateWater (NPIW) (~300–600m), Antarctic IntermediateWatermixed with NPIW (~600–1300 m), Pacific Deep Water mixed withUpper Circumpolar Deep Water (~1300–3800 m), and Lower Circum-polar deep Water (below 3800 m) (Conway and John, 2015; Talley,2008). A pronounced OMZ is present in waters of the CCM, the depthofwhich varies seasonally but averages ~550–2000mwith oxygen con-centrations b75 nmol kg−1 (Conway and John, 2015).
Seamounts and escarpments along the CCM are primarily composedof basalt and frequently show pillow structures. Edifice summits rangefrom 516 m (NE Bank) to over 3700 m (Taney D) (Supplemental TableS1). The basement age for the sample region ranges from ~30 to20 Ma based on magnetic stratigraphy with seamounts ranging in agefrom ~20 to 7 Ma (Atwater and Severinghaus, 1989; Cande and Kent,1995; Davis et al., 2002).
The Taney Seamount chain consists of five submarine volcanoes (Athrough E from north to south) and is 53 km long (Clague et al., 2000;Coumans et al., 2015). Remotely operated vehicle (ROV) and dredgesamples collected from Taney Seamounts consist of enriched mid-ocean ridge basalt and slightly alkalic and tholeiitic (Taney A) basaltsand have high Al2O3 and low SiO2 contents; with somepillow structuresindicating emplacement in a submarine environment (Clague et al.,2000; Coumans et al., 2015). Submarine imaging surveys found littlesediment accumulation, making the Taney Seamounts an ideal locationfor Fe-Mn crust formation (Clague et al., 2000). The Taney Seamountchain has several edifices with very flat tops resulting from caldera col-lapse and infilling of earlier large calderas, rather than wave erosionfrom subsidence after subaerial exposure (Clague et al., 2000;Coumans et al., 2015).
Pioneer, Gumdrop, Guide, and Davidson Seamounts are com-posed of similar rock types, ranging from alkalic basalts to trachyteand have the northeast-southwest orientation that is common inthis region (Davis et al., 2002, 2010). These seamounts consist of aseries of parallel ridges and aligned cones separated by sedimentfilled troughs and lack summit craters or calderas (Davis et al.,2002). The most common rocks on all of these seamounts are alkalibasalt, hawaiite, and mugearite (Davis et al., 2002). Davidson andGuide Seamounts formed above a fossil spreading center and David-son is intersected at its southwest end by a fossil transform fault, theMorro Fracture Zone (Clague et al., 2009; Davis et al., 2002, 2010).Davidson Seamount is part of the Monterey Bay National Marine
Please cite this article as: Conrad, T., et al., Formation of Fe-Mn crusts witdx.doi.org/10.1016/j.oregeorev.2016.09.010
Sanctuary and is considered a pristine habitat for a variety of speciesincluding deep sea corals.
Rodriguez, San Juan, andNorth East Bank all have features consistentwith subaerial exposure including graded sand, gravel, and cobble beds(Paduan et al., 2009). They also have volcanic glass with lower sulfurconcentrations than found on other CCM seamounts; this is consistentwith subaerial degassing of the lava (Paduan et al., 2009). Lavas fromthe summits of these three seamounts do not have pillow structuresor glassy rinds, which also indicate subaerial flows (Paduan et al.,2009). The shallowest pillow structures on Rodriguez, San Juan, andNorth East Bankwere found at 925, 1282, and 560m below sea level re-spectively (Paduan et al., 2009). These seamounts are thought to havesubsided due to thermal contraction of the oceanic crust from 11 to7 Ma (Paduan et al., 2009). Based on the modern water depths of theseamount summits and the extent of terrestrial deposits, Paduan et al.(2009) proposed that Rodriguez and San Juan subsided approximately700 m while North East Bank subsided 500 m since their formation.
The Patton Escarpment is a relict accretionary wedge that lies at theedge of the continental shelf (Marsaglia et al., 2006). It is thought that atrench-ridge-trench triple junction was present at the Patton Escarp-ment 18 to 16 Ma (Marsaglia et al., 2006). The Santa Lucia Escarpmentlies near the intersection of the continental shelf and theMorro FractureZone, south-east of Davidson Seamount (Gibbs et al., 1993). Spreadingcenters were active near the Santa Lucia Escarpment in the early Mio-cene (Gibbs et al., 1993).
Adam and Hoss Seamounts are small adjacent edifices with Fe-Mnencrustations on most dredge samples recovered. On USGS cruise F7-87-SC, fewer than 15% of samples collected by dredging on San MarcosSeamount were coatedwith Fe-Mn crusts (Hein et al., 2010b). All of thesamples collected from Little Joe had some Fe-Mn encrustation, most ofmoderate thickness, from 10 to 35 mm, with some crusts up to 65 mmthick (Hein et al., 2010b). Ben Seamount has little sediment cover, butsediment deposits exist next to the north flank (Hein et al., 2010b).
3. Methods
Fe-Mn crust samples were selected for chemical analysis based onlocation. A range of water depths and sample thicknesses were selectedto represent the different sites, if possible. Samples influenced by hydro-thermal inputs, identifiable by chemical signatures, were excluded.Hydrogenetic samples are considered to be those with Fe/Mn ratios be-tween 0.5 and 3.0 (Hein et al., 1993). The concentrations of minor ele-ments were also considered in sample selection; samples with Co, Ni,and Cu concentrationsmultiplied by 10 that are less than 5% are consid-ered to be hydrothermal based on the traditional discrimination ternarydiagram (Bonatti et al., 1972; Hein et al., 1993) and excluded fromcomparisons.
Chemical analyses of major and minor elements in the crusts wereperformed by SGS Canada analytical laboratory. Analyses of major ele-ments were run using borate-fused disk X-ray florescence as oxides.Minor elements were analyzed by inductively coupled plasma massspectrometry (ICP-MS) after a 4-acid (HCl, HF, HNO3, and HClO4) digest,the resulting solutionwas dried and dissolved in 1ml aqua regia and di-luted to 10 g with 1% HNO3. Rare earth elements plus yttrium (REY)were analyzed using Li-metaborate fused disk dissolved in weak HNO3
and analyzed by ICP-MS. Tellurium and Se concentrations were deter-mined following the same 4-acid digest and hydride generation with amodifiedflow-injection and analyzed using atomic absorption spectros-copy. Analytical precision is 1.5% or better for all elements. Sorbed (hy-groscopic) water wasmeasured by heating the sample to 110 °C for onehour and calculating the difference in wet vs dry sample weight to de-termine the water weight. Samples were measured dry within 10 minof removal from oven. Platinum group elements (PGE) were analyzedby Intertek Genalysis, Australia, using nickel sulfide fire assay and runon an ICP-MS with analytical precision better than 10%. Proceduralblanks are less than 1 ppb for Au, Ru, Rh, Pd, Re, and Pt, 0.1 ppb for Ir,
hin a continental margin environment, Ore Geol. Rev. (2016), http://

4 T. Conrad et al. / Ore Geology Reviews xxx (2016) xxx–xxx
and 3 ppb for Os. Chemical data arewater normalized to 0% hygroscopicwater (0% H2O−) so that minor elements can be more accurately com-pared. This is consistent with open-ocean data reported previously(Hein and Koschinsky, 2014).
Selected crusts were split into layers based on visually distinct tex-tural or compositional differences. Compositional differences wereidentified based on color variations reflecting greater Mn (black) or Fe(red-brown) layers. All depths within Fe-Mn crusts are provided inmm from the top of the crust (the surface that was in contact withseawater).
The age and growth rates of Fe-Mn crusts were calculated using thecobalt chronometer, an empirically derived formula where growth rate(GR)= 0.68 / (Con)1.67, Con= Co× (50 / Fe+Mn), withmetals in wt.%(Manheim and Lane-Bostwick, 1988). The growth ratemodel assumes aconstantfluxof Co into the crusts of at least oneorder ofmagnitude overthe growth rate (Halbach et al., 1983). This formula does not account forgrowth hiatuses, erosional or dissolution events, and is considered aminimumage estimate (Klemmet al., 2005). It is also not possible to ex-clude changes in growth rate within a bulk sample or on a scale finerthan the chemically analyzed layers.
Mineralogical compositions were determined by X-ray diffraction(XRD) using a Philips diffractometer with Cu Kα radiation and a graph-ite monochromator. PANalytical software packages and inorganic min-erals data base were used to interpret the XRD spectra.
Plots of REY were normalized to Post-Archean Australian Shale(PAAS) values (Bau, 1996; Bau et al., 2014; McLennan, 1989). Discrimi-nation plots used PAAS normalized REY data with Cesn* =0.5Lasn + 0.5Prsn or if Pr data were unavailable Ce* =0.67La + 0.33Nd; plots are Cesn/Cesn* vs Nd and Cesn/Cesn* vs Ysn/Hosn(Bau et al., 2014) to further confirm that the samples used for compar-ison are hydrogenetic. This plot did not exclude any additional samples.
The Pearson product correlation coefficient was used to calculatecorrelation coefficient matrices for the chemical data. The presentedmatrix included 141 bulk and 17 mean bulk crust samples, collectedby ROV on MBARI cruises for which exact location and water depthsare known (Supplemental Table S2).Meanbulk samples are theweight-ed percent averages of two to five continuous layers collected through acrust. The 158 samples used for the correlationmatrix were also used ina Q-mode factor analysis to determine groupings of elements (Hein etal., 2012; Klovan and Imbrie, 1971). Q-mode factor analysis calculationswere run in MatLab (Pisias et al., 2013). These groupings (factors) areinterpreted so that each factor represents a particularmineral or miner-al group in which elements associated with the factor are contained.This interpretation uses the mineralogy data and element correlationslinking the mineralogy related to environmental conditions to elementconcentrations that represent sources.
4. Results
4.1. Samples
Samples from USGS cruises F7-87-SC and F6-87-NC were collectedby chain-bag dredge and have only approximate water depths basedon the length of the dredge line, tensiometer readings, and wire angle.Samples collected on MBARI cruises were obtained by ROV and haveprecise water depths and locations. Samples collected on the MBARI2003, 2004, and 2010 cruises have accompanying seawater data, suchas oxygen probe measurements. Unpublished water-normalized bulkand mean bulk crust data used in this study are presented in Supple-mental Table S3 and statistics of the data by seamount are presentedin Supplemental Table S4.
Over the entire study area, water depths of samples ranged from570.5m (Patton Escarpment) to 3934m (Taney D).Water depth rangeson individual seamounts are much more limited (Supplemental TableS1). A wide range of crust thicknesses was observed ranging from avery thin b0.1 mm patina to 84 mm. Surface textures are variable and
Please cite this article as: Conrad, T., et al., Formation of Fe-Mn crusts witdx.doi.org/10.1016/j.oregeorev.2016.09.010
include large botryoids, microbotryoids, granular to micro-granular(dendritic), with abraded and polished areas on some of the crust sur-faces. The microbotryoidal to granular surface texture was the mostcommon. Thick CCM Fe-Mn crusts can be massive, laminar, columnar,or botryoidal laminar. Some of the thick crusts contain visually distinctlayers while others do not. Thin dendritic layers also occur in some ofthe crust samples. Detrital grains generally from fine silt to coursesand size, including some embedded cobbles are present in some ofthe CCM Fe-Mn crust samples, particularly those close to shore. Manyof the Fe-Mn crusts had encrusted worm tubes on their upper surfacewith a few also having sea sponge encrustations. A few hydrogeneticseamount nodules were also found on Santa Lucia Escarpment andAdam seamount.
4.2. Mineralogy
XRD analysis of CCM Fe-Mn crusts show δ-MnO2 to be the dominantmineral along with an X-ray amorphous FeO(OH) which crystallized togoethite in about 9% of the crusts (Supplemental Table S7; Hein et al.,2010b). While δ-MnO2 is common in open-ocean crusts, goethite isless common and has been recorded in the oldest sections of only 6%of open-ocean Pacific crusts (Hein et al., 2000). Todorokite is presentin approximately 35% of CCM Fe-Mn crusts and is slightly more com-mon in the southern section of the sample region. Birnessite is presentin approximately 5% of CCM samples; this is significant as todorokiteand birnessite occur in less than 2% of open-ocean crusts if all CCMcrust are excluded (Hein et al., 2000, 2010b). Detrital quartz, plagio-clase, andK-feldspar are commonminorminerals, and phillipsite, smec-tite, and illite are present in some samples. Some CCM crust samples,particularly those with very high Ba, contain minor barite. Carbonate-fluorapatite (CFA) was not detected in the CCM crusts (SupplementalTable S7; Hein et al., 2010b).
4.3. Chemistry
One hundred and fifty-five bulk Fe-Mn crust samples and 22 meanbulk samples (compiled asweighted averages from layer data)were an-alyzed for major andminor elements and REY (Supplemental Table S3).Layers with 2–4 subsamples per curst were also analyzed for 32 Fe-Mncrusts totaling 74 subsamples (Supplemental Table S5). Surface scrapesof the upper 0.5 to 1 mm were analyzed for an additional 63 samples(Supplemental Table S6). When a bulk crust has a thickness of 1 mmor less it was reported in the bulk data table and not in the surfacescrape table. In crusts where a surface scrape was used for the upperlayer of a sample, that subsample is recorded in both the layer and thesurface scrape data tables with a note added in the layer table; this oc-curs for 6 crusts. The new bulk and mean bulk data were added to thepublished data from Hein et al. (2010a,b) and Gibbs et al. (1993) to cal-culate the CCM mean for comparison to open-ocean samples (Table 1)and to determine statistics for each seamount (Supplemental TableS4). All data are presented on a hygroscopic water-free basis (0%H2O−).
4.4. Comparison to open-ocean Fe-Mn crust chemistry
When comparing bulk and mean bulk CCM Fe-Mn crusts to open-ocean crusts, Si is enriched in CCM crusts with an average concentrationof 10.8% (n = 225) compared to 5.21% (n = 43), 6.82% (n = 23), and4.05% (n = 303) for Atlantic Ocean, Indian Ocean, and PCZ crusts, re-spectively (Table 1). The Si/Al ratio is also higher for CCM Fe-Mn crusts(6.18) than in Fe-Mn crust samples from open-ocean locations; the PCZhas the second highest Si/Al ratio (4.00). Elements typically hosted inthe aluminosilicate phase of crusts, K and Na are also higher in CCMFe-Mn crusts (0.85%, 1.97%, respectively, n = 225) compared to PCZcrusts, 0.55% and 1.64%, respectively (n=303). The IndianOcean crustsaverage 0.63% K (n = 23). The mean K and Na concentrations in CCM
hin a continental margin environment, Ore Geol. Rev. (2016), http://

Table 1Compiled mean composition of Fe-Mn crusts and nodules from the global oceanmodified fromHein et al. (2000) and Hein and Koschinsky (2014); CCM updated with data presented inthis paper.
Element
Atlantic Ocean Indian Ocean Prime Crust ZoneSouth PacificOcean CA margin CCZ nodules
Mean N Mean N Mean N Mean N Mean N Mean N
Fe (wt.%) 20.9 43 22.3 23 16.9 362 18.1 286 23.8 225 6.16 66Mn 14.5 43 17.0 23 22.8 362 21.7 321 19.5 225 28.4 66Fe/Mn 1.44 43 1.31 23 0.74 362 0.83 286 1.33 225 – 0Si 5.21 43 6.82 23 4.05 303 4.75 255 10.8 225 6.55 12Al 2.20 43 1.83 23 1.01 351 1.28 241 1.79 225 2.36 65Si/Al 2.37 43 3.73 23 4.00 303 3.72 241 6.18 225 – 0Mg 1.58 43 1.25 23 1.10 328 1.32 192 1.26 225 1.89 66Ca 4.03 43 2.27 23 4.03 328 3.53 256 2.25 225 1.70 66Na 1.26 43 1.55 23 1.64 303 1.52 88 1.97 225 1.99 66K 0.54 43 0.63 23 0.55 303 0.63 156 0.85 225 0.99 66Ti 0.92 43 0.88 23 1.16 345 1.12 230 0.67 225 0.32 66P 0.75 43 0.38 23 0.96 328 0.78 265 0.57 225 0.21 66Cl N0.74 31 N1.00 19 0.92 43 N1.08 40 0.74 14 0.27 12LOI 26.0 43 26.6 23 32.0 185 18.5 55 16.4 172 26.5 12H2O− 10.6 43 14.1 23 19.5 303 19.8 53 18.3 224 11.6 12H2O+ – 0 – 0 7.99 263 10.2 7 – 0 8.80 7CO2 – 0 – 0 0.74 263 0.83 7 – 0 – 0ST 0.25 31 0.15 9 0.26 43 0.12 40 0.01 40 0.17 12Ag (ppm) 0.20 18 0.37 9 – 0 0.97 13 0.90 169 0.17 12As 308 42 207 19 393 328 287 84 257 225 67 12B (ppm) 257 13 287 10 178 43 197 40 235 13 – 0Ba 1556 43 1533 23 1934 328 1705 143 1838 225 3500 66Be 8.98 43 6.93 23 6.07 43 5.38 59 3.99 181 1.9 12Bi 19.3 38 30.2 22 42.9 34 22.4 46 16.2 182 8.8 12Br 36.5 10 54.0 6 28.1 34 29.5 72 34.3 14 – –Cd 4.07 34 3.47 18 3.59 285 4.14 62 3.70 223 16 12Co 3608 43 3291 23 6662 362 6167 321 3131 223 2098 66Cr 46.8 40 22.3 18 27.9 272 35.0 79 51.9 225 17 12Cs – 0 5.00 1 3.71 1 1.90 18 0.66 155 1.5 61Cu 861 43 1105 23 976 362 1082 321 383 223 10714 66Ga 15.5 39 16.2 23 18.8 33 28.5 27 18.2 97 36 12Ge 0.66 18 0.64 9 0.0 0 2.40 11 0.87 149 – 0Hf 8.71 30 9.78 15 9.43 43 9.15 81 6.12 184 4.7 66In 0.18 19 0.26 10 0.62 1 0.87 6 0.14 170 0.27 12Li 33.1 42 8.34 22 2.92 33 3.46 36 16.6 33 131 66Mo 409 43 392 23 461 328 418 67 385 223 590 66Nb (ppm) 50.9 43 61.3 23 51.6 43 59.2 46 31.5 184 22 66Ni 2581 43 2563 23 4209 362 4643 321 2269 223 13002 66Pb 1238 43 1371 23 1641 326 1057 113 1565 223 338 66Rb 15.0 24 15.8 17 17.0 12 10.6 27 14.6 184 23 66Sb 51.1 30 39.9 15 39.3 43 35.4 73 36.9 184 41 12Sc 16.4 43 12.5 23 6.55 43 9.29 82 9.36 182 11 66Se 0.44 10 1.73 10 14.8 1 5.06 14 2.00 175 0.72 12Sn 8.34 28 9.68 17 10.0 10 10.91 34 4.27 171 5.3 12Sr 1262 43 1201 23 1510 303 1483 67 1302 202 645 66Ta 1.34 17 0.91 10 2.36 2 1.23 47 0.59 176 0.33 66Te 43 37 31 22 60 43 38 38 13 184 3.6 66Tl 104 38 95.4 22 155 34 154 46 49 182 199 12Th 52 42 56 18 11 40 15 67 48 177 15 66U 10.9 35 10.3 18 12.4 38 12.0 67 11.7 177 4.2 66V 849 43 634 23 641 328 660 177 628 223 445 66W 79 35 80 18 89 36 97 56 66 184 62 66Y 181 43 178 23 221 294 177 49 172 223 96 66Zn 614 43 531 23 668 325 698 181 554 223 1366 66Zr 362 38 535 22 548 43 754 46 464 184 307 66La 272 42 290 21 339 83 204 75 270 187 114 66Ce 1392 42 1469 21 1322 83 818 75 1264 223 284 66Pr 63.8 20 66.2 12 61.3 83 40.8 31 60.3 187 33.4 66Nd 243 42 259 21 258 83 184 67 253 187 140 66Sm 55.5 20 60.8 12 51.5 83 38.1 67 53.5 187 34 66Eu 11.5 42 12.5 21 12.5 83 17.5 75 12.7 187 8.03 66Gd 57.9 20 67.2 12 56.2 83 43.9 31 55.5 187 31.8 66Tb 9.17 20 9.99 12 8.79 82 5.98 53 8.92 187 4.98 66Dy 47.1 20 55.6 12 60.0 83 40.7 30 49.6 187 28.5 66Ho 9.61 41 10.6 13 10.9 82 8.45 17 10.0 187 5.35 66Er 28.0 20 29.3 12 31.0 83 26.5 31 27.9 187 14.6 66Tm 3.91 20 4.03 12 4.55 82 3.6 17 3.9 187 2.11 66Yb 23.9 42 24.8 21 28.5 83 21.9 75 25.3 187 13.7 66Lu 3.74 20 4.05 12 4.29 40 3.33 75 3.81 186 2.05 66Au (ppb) 5.99 2 20.7 2 99.7 7 33.1 38 7.8 17 4.5 9Hg 85.9 37 37.8 18 9.28 12 31.8 33 11.4 161 18 3
(continued on next page)
5T. Conrad et al. / Ore Geology Reviews xxx (2016) xxx–xxx
Please cite this article as: Conrad, T., et al., Formation of Fe-Mn crusts within a continental margin environment, Ore Geol. Rev. (2016), http://dx.doi.org/10.1016/j.oregeorev.2016.09.010

Table 1 (continued)
Element
Atlantic Ocean Indian Ocean Prime Crust ZoneSouth PacificOcean CA margin CCZ nodules
Mean N Mean N Mean N Mean N Mean N Mean N
Ir 4.8 2 6.8 5 13 56 2.5 3 1.8 9 2 11Os 2.4 1 4.0 3 2.4 4 2.5 1 3.5 11 – 0Pd 6.0 2 15 6 3.8 54 7.0 14 4.1 28 8 12Pt 567 2 211 6 470 60 465 15 70 30 128 12Rh 37 2 20 6 23 59 33 15 6 29 9 12Ru 18 2 20 6 17 58 13 6 9 15 12 12
A B
6 T. Conrad et al. / Ore Geology Reviews xxx (2016) xxx–xxx
Fe-Mn crusts approximate those of the Clarion Clipperton Zone (CCZ)nodules at 0.99 (n = 66) and 1.99% (n = 66), respectively. Rubidiumis also hosted in the aluminosilicate minerals but has a slightly lowerconcentration in CCM crusts with a mean of 14.6 ppm (n = 184) com-pared to 15.0 ppm (n= 24), 15.8 ppm (n= 17), 17.0 ppm (n= 12) forthe Atlantic Ocean, Indian Ocean, PCZ respectively.
Iron is enriched in CCMFe-Mn crusts relative to open-ocean sampleswith a mean concentration of 23.8% (n = 225), which is 1.5% (n= 23)greater than Indian Ocean crusts which have the second highest con-centration and 6.9% (n = 362) more than PCZ crusts which have thelowest mean concentration. Iron enrichment is also apparent in the ter-nary diagram where the plotted bulk CCM data trend towards Fe fromthe hydrogenetic field defined by open-ocean Fe-Mn crust samples(Fig. 2). The mean Mn concentration in CCM Fe-Mn crusts 19.5% (n =225) is slightly lower than in crusts from the PCZ 22.8% (n = 362) andS. Pacific 21.7% (n=321), and slightly higher than in crusts from theAt-lantic 14.5 (n= 43) and Indian 17.0 (n= 23) Oceans. The mean Fe/Mnratio is higher in CCM crusts 1.33 (n = 225) than in the PCZ 0.74 (n =362) and S. Pacific 0.83 (n = 286), and is more comparable to the Fe/Mn ratios of the Atlantic and Indian Ocean crusts, 1.44 (n = 43) and1.31 (n = 23), respectively (Hein and Koschinsky, 2014).
Thorium has a higher mean concentration in CCM crusts 48 ppm(n= 177) than in PCZ or S. Pacific Fe-Mn crusts which have concentra-tions of 11 ppm (n=40) and 15 ppm (n=67) respectively. Like Fe, themean Th concentration in CCM Fe-Mn crusts is more comparable to theIndian and Atlantic Fe-Mn crust means, 56 ppm (n = 18) and 52 ppm(n = 42) respectively. Chromium is enriched in CCM Fe-Mn crusts52 ppm (n = 225) compared to open-ocean samples: 47 (n = 40),
Fig. 2. Ternary diagram showing the criteria for exclusion of crust samples withsamples plotted by seamount. The bottom, outlined region demarcates thehydrothermal region, the shaded Mn corner is the diagenetic field, and the light oval isthe open-ocean hydrogenetic crust field (n = 300). California continental crusts trendfrom the hydrogenetic region towards Fe enrichment (Bonatti et al., 1972; Hein et al.,1993).
Please cite this article as: Conrad, T., et al., Formation of Fe-Mn crusts witdx.doi.org/10.1016/j.oregeorev.2016.09.010
22 ppm (n = 18), 28 ppm (n = 272) for the Atlantic, Indian, and PCZ,respectively.
Other elements of potential economic interest in Fe-Mn crusts in-cluding Te, Co, Cu, Mo, Ni, W, and Pt, all have a lower mean concentra-tion in CCM Fe-Mn crusts than in open-ocean Fe-Mn crusts from all ofthe other study regions. Tellurium has a significantly lower mean con-centration of 13 ppm (n = 184) in CCM crusts while the AtlanticOcean, Indian Ocean, PCZ, and S. Pacific have mean concentrations of43 ppm (n = 37), 31 ppm (n = 22), 60 ppm (n = 43), 38 ppm (n =38), respectively. Cobalt has a mean concentration of 3131 ppm (n =223) in CCM crusts with the second lowest mean concentration occur-ring in Indian Ocean crusts, 3291 ppm (n = 23), while the PCZ has thehighest, 6662 ppm (n = 362). Copper in CCM Fe-Mn crusts has amean of 383 ppm (n = 223) with the next lowest in Atlantic Oceancrusts, 861 ppm (n = 43) and the highest in Indian Ocean crusts 1105(n = 23). Platinum has significantly lower mean concentrations inCCM crusts, 70 ppb (n = 30), with 567 (n = 2), 211 (n = 6), 470(n = 60), and 465 (n = 15) for the Atlantic Ocean, Indian Ocean, PCZ,and S. Pacific crusts, respectively.
4.5. Rare-earth elements in CCM Fe-Mn crusts
Hydrogenetic Fe-Mn crusts from the CCM have concentrations ofREY comparable to open-ocean Fe-Mn crusts for both light (La, Ce, Pr,Nd, Sm) and heavy (Eu, Gd, Tb, Dy, Y, Ho, Er, Tm, Yb, Lu) REY. Plots of
A
B
Fig. 3. Rare earth element discrimination plots after Bau et al. (2014). Californiacontinental margin Fe-Mn crusts plot in the hydrogenetic field.
hin a continental margin environment, Ore Geol. Rev. (2016), http://

7T. Conrad et al. / Ore Geology Reviews xxx (2016) xxx–xxx
the CCM Fe-Mn crust REY data normalized to PAAS are consistent withtypical hydrogenetic Fe-Mn crust plots (Bau et al., 2014; McLennan,1989). This characteristic hydrogenetic pattern shows a large positiveCe andnegative Y anomalywith somesamples showing smaller positiveanomalies for Eu, La, and Gd (Bau et al., 2014). The REY pattern can beused to differentiate between hydrothermal Mn deposits, diageneticFe-Mn nodules, hydrogenetic Fe-Mn nodules and crusts (Bau et al.,2014). Patterns from 191 CCM Fe-Mn crust samples with REY data aregenerally consistent with hydrogenetic Fe-Mn crust profiles, with onesample each from Little Joe (T668-R13A) and San Juan Seamounts(T665-R17A) less REY enriched relative to PAAS, consistent with diage-netic Fe-Mn nodules (Bau et al., 2014; Taylor and McLennan, 1985)(Supplemental Fig. S1). San Juan Fe-Mn crust sample (T665-R17A)also plots in the diagenetic region of the ternary discrimination diagram.Those samples might have a diagenetic influence from a localized sea-mount sediment deposit. Hydrothermal Mn samples would also beless REY enriched relative to PAAS than typical crusts, but would havea very different profilewith a negative Ce anomaly and positive Y anom-aly (Bau et al., 2014), which are not observed in these two samples. TheCCMFe-Mn crusts also plot in the hydrogenetic region on PAAS normal-ized Ce/Ce* vs Nd (ppm) and Ce/Ce* vs Y/Ho REY discrimination plots(Bau et al., 2014) (Fig. 3).
4.6. Comparison within the CCM
Santa Lucia Escarpment Fe-Mn crusts have the highest mean Si con-centration 13.9% (n = 5) and Davidson Seamount crusts have thehighest mean Al concentration 2.36% (n = 3). Fe-Mn crusts from BenSeamount have the lowest mean Si and Al concentrations at 6.41% and1.11% respectively (n = 6) (Supplemental Table S4). The Fe-Mn crustwith the highest Fe concentration is T627-R7 from the Pioneer Sea-mountwith 33.2%. Pioneer Seamount also has the highestmean Fe con-centration out of the CCMseamounts at 30.2% (n=6). The lowestmeanFe and Mn concentrations are found on the Santa Lucia Escarpment at16.5% and 13.7% (n = 5), respectively (Supplemental Table S4). Thehighest mean Mn concentration is from the Patton Escarpment at25.1% (n = 24). The crust with the lowest Fe and Mn concentration isD6-1A from San Marcos Seamount with concentrations of 10.3% and4.40%; that crust also has the highest Si and Al concentrations out ofall CCM Fe-Mn crust samples at 25.0% and 4.89%, respectively.
Element concentrations in Fe-Mn crusts from seamounts in thenorthern sector of the study region, Pioneer (near shore, n = 11) andTaney Seamount Chain (off shore, n = 14) were compared to sea-mounts from the southern end of the study region; North East Bankand Patton Escarpment (near shore, n = 24) and Adam and Hoss Sea-mounts (off shore, n= 25) (Fig. 1). The near shore samples have higherFe concentrations although the trend is slightly less apparent in crustsfrom the southern seamounts. When comparing the near shore sam-ples, thenorthern crusts fromPioneer Seamounthave higher Fe concen-trations than all but three of the southern samples. There is no distinctdifference in Mn, Si, Al, or K concentrations between near shore andoff shore or northern and southern Fe-Mn crusts. Both P and Pb showhigher concentrations in near shore crusts with slightly more overlapin Pb concentrations in the southern samples (Supplemental TableS4). Thorium also shows higher concentrations in near shore crusts forthe northern sample region; there is insufficient data for southern offshore samples to make a determination. Copper shows the oppositetrend with near shore data clustering below 400 ppm while the offshore data ranges up to 2088 ppm; only six of the off shore crustshave concentrations below 400 ppm.
Barium concentrations show no noticeable differences with latitudefor off-shore or near-shore crusts. Off-shore Fe-Mn crust samples showa wide range of Ba from 1183 to 24323 ppm. The highest concentrationof 24323 ppm (D10-4A) is an outlier with the next highest concentra-tion at 9458 (D10-6) and the third highest is 6780 (D11-11A) all fromHoss Seamount (Hein et al., 2010b). The highest Ba concentrations
Please cite this article as: Conrad, T., et al., Formation of Fe-Mn crusts witdx.doi.org/10.1016/j.oregeorev.2016.09.010
measured in crusts from Taney and Adam seamounts are 6367 and5536 ppm, respectively (Supplemental Table S4). While the lowest Baconcentrations measured in crusts from off shore seamounts are 1715,1235, and 1183 ppm for Hoss, Adam, and Taney Seamounts, respective-ly. The near shore samples have a narrower range of concentrationswith the highest Ba concentration of 5211 ppm on the Patton Escarp-ment and 1299 ppm from North East Bank and lowest concentrationson those edifices of 920 ppm and 993 ppm, respectively.
Layer and surface scrape data were used to evaluate older layersfrom the northern seamounts compared to the youngest layers of thesouthern seamounts to determine if element concentrations in Fe-Mncrusts have changed as the Pacific Plate moved northward relative tothe North American Plate. Off shore seamounts Taney, San Marcos,Adam, and Hoss and near shore edifices Santa Lucia Escarpment,Rodriguez Seamount, Patton Escarpment, and Little Joe Seamountwere evaluated as two separate groups. Neither group showed obvioustrends for Fe, Mn, Si, Al, or P. The limited number of older layer samplesfrom the northern edifices Taney (n = 4) and Santa Lucia Escarpment(n= 5) did not provide sufficient data for robust analysis (Supplemen-tal Table S5).
4.7. Element correlations and associations in CCM crusts
A Pearson's product correlation coefficient matrix was used to eval-uate element trends in 158 bulk Fe-Mn crust sampleswith knownwaterdepth, latitude and longitude, and dissolved oxygen and temperaturemeasurements at the time of collection. Themost interesting statistical-ly significant (at the 99% confidence level (CL), p=0.01) positive corre-lations are: Fe: Ag, Be, Nb, Pb, Ta, Th, Zr, and all REE; Mn:Mg, Ba, Cd, Co,Cu, Ni, W, Zn, and Te; both Fe and Mn: Ca, P, Ti, Bi, U, V, and HREE notincluding Eu and Gd; Si and Al both correlate with Na, K, Cr, Rb, andSc; Si also correlates with Hf while Al correlates with Zr (SupplementalTable S2). A separate correlation coefficient matrix of 160 samplesshows similar correlations and included distance from the coast, age,and growth rate. Iron increases towards shore and with decreasingwater depth, while Mn only increases with decreasing water depth.Phosphorus, As, Cr, Pb, V, and Ce contents also increase towards shore.In addition to Fe and Mn, Ca, Mg, P, As, Bi, Co, Cr, Mo, Pb, Te, U, V, W,and Ce contents increase with decreasingwater depth. Copper contentsshow the opposite trend, increasing in deeper water.
Manganese in the CCM Fe-Mn crusts shows a negative correlationwith latitude at the 99% CL for both the entire data set and when evalu-ating only near-shore samples. Many of the elements enriched in CCMFe-Mn crusts relative to open-ocean Pacific Fe-Mn crusts including Si,Na, K, Th, and Cr have a negative correlationwithMn at the 99% CL (Sup-plemental Table S2). Elements with a strong positive correlation withMn including Ni, Te, Co, Ti, Cd, Cu, Mo, Ca, and Tl have lower mean con-centrations in CCM Fe-Mn crusts than Central Pacific crusts (Supple-mental Table S2 and Table 1). Element correlations with Fe are lesslikely to predict element enrichment or depletion in CCM crusts relativeto open-ocean samples. This is likely due to the distribution of Fe in all ofthe major Fe-Mn crust phases.
Q-mode statistical analysis was run for three factors on the samedata set, which accounted for 95.2% of variance. The three factors areinterpreted to behydrogeneticMn; detrital Si, K, Al and Fe; andmore re-duced Mn phases. The third factor is thought to be birnessite- andtodorokite-hosted Mn due to the high correlation coefficients with Cu,Ni, and Zn but that does not completely account for the correlationwith Ba, K, and Al.
4.8. Growth rates of CCM crusts
The empirical Co-chronometer of Manheim and Lane-Bostwick(1988) was used to calculate growth rates for bulk hydrogenetic CCMFe-Mn crust samples with seamount ages used to constrain the maxi-mum ages (Fig. 4). CCM Fe-Mn crusts show a mean growth rate for all
hin a continental margin environment, Ore Geol. Rev. (2016), http://

Fig. 4. Photo of hydrogenetic Fe-Mn crust T667-R32 collected from the Patton Escarpment at 1337m water depth. White lines demark intervals sampled for stratigraphic layers withthe approximate age for that depth in the crust calculated using the Co-chronometer (Manheim and Lane-Bostwick, 1988).
8 T. Conrad et al. / Ore Geology Reviews xxx (2016) xxx–xxx
samples (n=210) of 4.92mm/Myr. The fastest growth rate is 21.9mm/Myr from Taney D (T121-R6A). The crusts with the four fastest growthrates were all from Taney D, ranging from 17.1 to 21.9 mm/Myr withone crust from that seamount showing a more typical growth rate of4.7 mm/Myr. Guide seamount has the next fastest growth rate of 19.7mm/Myr (T123-R5A). Several other samples from Taney D, C, Guide,and Gumdrop have growth rates greater than 10 mm/Myr. When theseven samples with the fastest growth rates are excluded from thedata set the mean growth rate drops to 4.51 mm/Myr (n = 203), all ofthe remaining samples have growth rates from 1 to 10 mm/Myr. Thisis slightly faster than growth rates for crusts from the global open-ocean, 75% of which range from 1-5 mm/Myr (Hein et al., 2000). Theslowest growth rate is 1.0 mm/Myr (D17-6B) from Ben seamount. Theoldest sample is fromHoss seamount (D11-11) at 27.7Mawith the sec-ond oldest from Taney A (D176-R12) at 21.5 Ma.
A subset of 144 samples collected by ROV with exact water depthdata was used to determine mean growth rate for 250 m water depthintervals and shows that growth rate increases with water depth (Fig.5). A disproportionately large number of crust samples analyzed werecollected from 1320 to 2570 m water depths.
Surface scrapes and thin bulk Fe-Mn crust samples between 0.5 and1.0 mm thick from 67 crusts with exact water depth, temperature, anddissolved oxygen data measured in situ at the time of crust collectionare used to show growth rate trends for individual seamounts (Fig. 6).Data from San Juan, Rodriguez, and combined data (all) show growthrates increasing with water depth. That trend is statistically significantat the 99% CL for San Juan and the combined data, while Rodriguez is
Fig. 5. Left panel: Co-chronometer growth rates and water depths for 144 California continwith growth rate indicated (Manheim and Lane-Bostwick, 1988).
Please cite this article as: Conrad, T., et al., Formation of Fe-Mn crusts witdx.doi.org/10.1016/j.oregeorev.2016.09.010
statistically significant at the 95% CL. Little Joe, the Patton Escarpment,and Pioneer only have 6, 9, and 5 samples respectively, not enough forstatistical analysis.
While growth rate does show a general increasewith increasing dis-solved oxygen at greater water depth that trend is only statistically sig-nificant at the 95% CL in samples from Rodriguez. Growth rate alsoincreases with decreasing temperature, which is statistically significantfor the combined data at the 99% CL and for samples from Rodriguez atthe 95% CL. The difference in time scales between Fe-Mn crust growthrates and temperature and dissolved oxygen measurements must bekept in mind while evaluating trends in the data. Growth rates in thissubset of data range from 1.11 to 9.13 mm/Myr and sample agesrange from 0.05 Ma to 0.87 Ma, whereas O2 and T data are for a singlepoint in time.
5. Discussion
5.1. Mineralogy
The todorokite and birnessite present in CCM crusts could beinterpreted to indicate a suboxic diagenetic input into CCM crusts. How-ever, this interpretation is not consistent with the ternary or REY dis-crimination plots (Figs. 2 and 3). It is more likely that lower oxidationpotential seawater conditions under which CCM crusts formed allowedfor the precipitation of these Mn minerals that are less oxic than δ-MnO2, the mineral that typifies open-ocean crusts.
ental margin Fe-Mn crusts. Right panel: Number of samples collected at each water depth
hin a continental margin environment, Ore Geol. Rev. (2016), http://

Fig. 6. Co-chronometer growth rates relative to water depth (A), dissolved oxygen (B), and temperature (C) for the upper 0.5 to 1.0 mmof 67 Fe-Mn crust samples collected byMBARIROV.
9T. Conrad et al. / Ore Geology Reviews xxx (2016) xxx–xxx
Open-ocean Fe-Mn crusts are phosphatized by carbonatefluorapatite (CFA) impregnation of the older layers (Hein et al., 1993;Koschinsky et al., 1997). CFA deposition occurs by preferential replace-ment of calcium carbonate and partial replacement of Fe oxyhydroxidesby CFA, and precipitation of CFA in pore space (Hein et al., 1993; Hyeonget al., 2013; Koschinsky et al., 1997; Puteanus and Halbach, 1988). Inphosphatized Fe-Mn crusts Si, Fe, Al, Ti, Co, Mn, and Pb are depleted inthat order with Si in particular showing up to a 45% decrease, whereasNi, Cu, Zn, and REY are enriched, with Ni showing up to a 30% increase(Koschinsky et al., 1997). Phosphatization occurred in suboxic environ-ments from nutrient-rich water in extended and intensified OMZs(Halbach et al., 1989; Hein et al., 1993; Koschinsky et al., 1997). Phos-phate could also be supplied by upwelling into the OMZ of phosphateenriched deep water, where nutrients accumulated during stable cli-matic times (Hein et al., 1993). Open-ocean Fe-Mn crusts from the cen-tral Pacific show that two major phases of phosphatization occurredduring climatic transitions at the Eocene/Oligocene (39–34 Ma), andthe Oligocene/Miocene boundaries (27–21 Ma) (Hein et al., 1993). Aminor phase of phosphatization may have occurred during the middleMiocene (Hein et al., 1993). Open-ocean Pacific crusts do not show ev-idence of phosphatization past the middle Miocene.
Fe-Mn crusts from CCM seamounts do not contain detectable CFAand show no evidence of phosphatization. The paucity of phosphatiza-tion in CCM Fe-Mn crusts is curious, as there are extensive formationsof authigenic CFA phosphorites on the shelf, slope, and banks adjacentto CCM low-oxygen basins (Berndmeyer et al., 2012; Filippelli et al.,1994; Laurent et al., 2015). The Miocene Monterey Formation is one ofthe best-studied examples of CCM phosphate deposition, which out-crops along the CCMbetween San Francisco and Los Angeles. Phosphateoccurs as a phosphate-rich carbonaceous member deposited from 14.5to 14.1Ma (during a period of cooling climate) and interstratified phos-phatic laminae and lenses deposited from 11.05 to 7.85 Ma(Berndmeyer et al., 2012; Laurent et al., 2015). Based on the occurrenceof phosphatized layers in open-ocean Fe-Mn crusts as recent as 10 Maand phosphorite deposition in the study area along the CCM up to7.85Ma, the lack of phosphatization in CCMFe-Mn crusts is unexpected.Approximately 19% of CCM bulk crusts and crust layers are older than7.85 Ma and the older sections of those samples do not show elementtrends consistent with phosphatization. In addition, calcium carbonateminerals are scarce in CCM Fe-Mn crusts eliminating the possibility ofphosphatization through the replacement of carbonates.
Please cite this article as: Conrad, T., et al., Formation of Fe-Mn crusts witdx.doi.org/10.1016/j.oregeorev.2016.09.010
Suboxic environments have occurred around the CCM seamountsduringmuch of their history, as evidenced by theMnmineralogy. How-ever, the seawater around the offshore seamounts may not have beendepleted enough in oxygen and consequently enriched enough in phos-phate to form CFA in these Fe-Mn crusts. Fluorine is also a necessarycomponent in CFA but as a conservative element in seawater, F deple-tion sufficient to hinder CFA deposition is unlikely. More likely, primaryproductivity due to upwellingmay not have been intense enough abovethe seamounts to provide the organic matter, and associated phospho-rous, necessary to establish phosphatization. Despite the occurrence ofthe OMZ, upwelling and primary productivity were likely not intenseenough to form organic matter-rich sediments leading to organic mat-ter-poor depositional environments since the middle Miocene.
5.2. Sources and distribution of Fe and Mn
Flux of Fe and Mn were calculated for 62 Fe-Mn crust surface sam-ples up to 1mmthickwith exactwater depth and location data (Supple-mental Table S6). The equation used to calculate flux is (F (μg cm−2
kyr−1) = CeGrD) where F is flux (μg cm−2 kyr−1), Ce is the dry elemen-tal concentration, Gr (mm/Myr) is growth rate (calculated from the co-balt chronometer), and D (1.3 g/cm−3) is dry bulk density (Hein et al.,2009; Halbach et al., 1983). Since cobalt chronometer growth rateswere used in the calculation Fe and Mn fluxes are not completely inde-pendent. Iron flux ranges from 31 to 575 (μg cm−2 kyr−1), while Mnflux ranges from 47 to 285 (μg cm−2 kyr−1). Pioneer Seamount hadthe largest Fe and Mn fluxes while the smallest Fe flux was from SanJuan and Mn flux was from the Patton Escarpment (SupplementalTable S6). The flux of Fe in CCM Fe-Mn crusts is much greater than theMn flux and shows greater variation, which is consistent with the com-plex nature of Fe in a continental-margin environment.
Terrestrial sources deliver trace metals to the surface ocean, specifi-cally fluvial particulatematter delivered duringwinter precipitation is asignificant source of Fe, Mn, and other trace metals to the continentalshelf (Biller and Bruland, 2013). Eolian sources also contribute to thetrace metal budget of the surface ocean (Mackey et al., 2002). In addi-tion to aeolian and fluvial input of Fe into the surface waters, remobili-zation from shelf/slope sediments, and input of hydrothermal vents canalso release Fe into intermediate and deep-water masses (Horner et al.,2015). Earth's continental crust contains more Fe (~4%) than Mn(~0.08%) (Rudnick and Gao, 2014), but has a lower Fe/Mn ratio than
hin a continental margin environment, Ore Geol. Rev. (2016), http://

10 T. Conrad et al. / Ore Geology Reviews xxx (2016) xxx–xxx
the average oceanic crust (Fe/Mn 69.8) (White and Klein, 2014), mid-ocean ridge basalt (Fe/Mn=54) (Qin andHumayun, 2008), andHawaiiocean island basalt (Fe/Mn = 67) (Humayun, 2004). These ratios arenot reflected in seawater, where Fe has a nutrient-type profile withlow surface water concentrations of about 0.05 nmol Fe/L due to assim-ilation by primary producers in surface waters (Boyd and Ellwood,2010). Iron is then regenerated with a maximum concentration ataround 1000m of approximately 0.7 nmol Fe/L, before being scavengedat depth with slight seawater concentration decrease (Biller andBruland, 2013; Boyd and Ellwood, 2010; Bruland and Lohan, 2003).Conversely, Mn has a scavenged seawater profile; with higher surfacewater concentrations and decreasing concentrations with depth (Billerand Bruland, 2013).
Remobilization of shelf sediment provides a significant source forscavenged and hybrid type elements including Fe and Mn (Biller andBruland, 2013). Iron is a critical trace metal used in photosynthesisand nitrate assimilation and regions along the CCM show evidence forFe limitation (Biller et al., 2013; Morel et al., 2014). Leachable particu-late and dissolved Fe along the CCS is related to both upwelling intensityand thewidth of continental shelf mud belts between 50-90m isobaths(Biller et al., 2013). Leachable particulate Fe concentrations are highestin coastal areas with the widest mid-self-mud belts and with a hypoxicbenthic boundary layer; this has a greater influence on Fe concentra-tions than the overall shelf width (Biller et al., 2013). Iron isotopesfrom open-ocean Pacific crust CD29-2 from 20 Myr to the presentshow that seawater (δ56/54Fe ~ +0.4‰) is offset from dust end mem-bers (δ56/54Fe ~+0.7‰) by−0.3‰ (Horner et al., 2015). The secondarysource of Fe is isotopically light and is likely due to reductive sedimentmobilization of metals (Horner et al., 2015). Under low-oxygen
Fig. 7.Geneticmodel showing sources of elements into theCCMand regional influences on FPOM= particulate organic matter.
Please cite this article as: Conrad, T., et al., Formation of Fe-Mn crusts witdx.doi.org/10.1016/j.oregeorev.2016.09.010
conditions, such as those associated with the high primary productivityalong the CCM, reduced, bioavailable, isotopically light Fe is releasedfrom shelf sediments (Horner et al., 2015). Seawater measurementshave shown that isotopically light dissolved δ56Fe from reduced shelfsediments is laterally transported at least 1900 km off shore from theCalifornia Margin between ~550 and 2000 m water depths in the OMZ(Conway and John, 2015).
Further support for continental shelf and slope sediments as a sourceof Fe can be gleaned by comparison of Fe-Mn crusts fromnear shore (Pi-oneer and Gumdrop Seamounts) and offshore (Taney Seamounts) inthe northern sector, and offshore (Adam and Hoss Seamounts) andnear shore (Patton Escarpment and Northeast Bank) in the southernsector shows that Fe is typically higher in samples closer to the conti-nental margin (Supplemental Table S4). Iron is consistently highernear shore when comparing Fe-Mn crust samples off a narrower shelfin thenorthern sectorwhere Fe is over 29.2% in all samples fromPioneerand Grumdrop Seamounts (n= 7) and under 20.2% from all Taney Sea-mount Chain crusts (n=14). In the southern sector, Patton Escarpmentand Northeast Bank (n = 27) are much closer to the coast than Adamand Hoss seamounts (n = 22) and typically have higher Fe concentra-tions, with a few exceptions. When comparing the northern and south-ern seamounts, Pioneer, the seamount closest to shore, has the highestFe concentration. No difference in Fe concentration exists betweencrust samples from the Taney Seamount Chain compared to the Adamand Hoss seamounts when reviewing Fe concentrations off shore andparallel to the coastline from the northern and southern ends of thestudy area. This shows that Fe released fromcontinental shelf/slope sed-iments is themost likely source of Fe to CCM Fe-Mn crusts, and proxim-ity to that source accounts for the Fe enrichment in CCM Fe-Mn crusts
e-Mn crust formation. DOM=dissolved organicmatter, DIC=dissolved inorganic carbon,
hin a continental margin environment, Ore Geol. Rev. (2016), http://

11T. Conrad et al. / Ore Geology Reviews xxx (2016) xxx–xxx
relative to open-ocean crusts. A simplified genetic model showingsources and regional influences on seawater and therefore CCM Fe-Mncrusts is presented in Fig. 7.
Manganese is also influenced by these processes and reduced Mn isremobilized from shelf sediments (McManus et al., 2012). However, un-like Fe, Mn in CCM crusts does not show a concentration increase to-wards the continental shelf. Manganese does show a negativecorrelation with increasing water depth as expected since dissolvedMn is enriched in seawater in the OMZ. Mn concentrations in Fe-Mncrusts are controlled by the redox potential of seawater from whichthe crust formed.
5.3. 4.3 Thorium enrichment
The most common Th isotope in seawater is 232Th, typically hostedby detrital material from aeolian sources; 232Th has a conservative dis-tribution in seawater down to the benthic boundary layer where thereis a concentration increase (Chen et al., 1986; Hsieh et al., 2011). Dis-solved and particulate 230Th have profiles with a linear concentrationincrease with water depth and that show concentration increasesalong the path of circumpolar deep-water circulation (Mangini andKey, 1983; Roy-Barman et al., 1996). Decay of 238U produces 234Th,which has a short half-life of 24.1 days and is generally in equilibriumwith its parent with a conservative seawater profile (Coale andBruland, 1987). However, in surfacewater with high particulate organiccarbon, 234Th is scavenged and removed to the sediments at a faster ratethan 238U (Coale and Bruland, 1987).
Thorium is enriched in CCM Fe-Mn crusts relative to open-ocean Pa-cific crusts, with contents comparable to crusts from the Atlantic and In-dian Oceans. The enrichment of 230Th in older water masses, andincreased input of 232Th due to proximity to the continental margin isthe most likely cause of Th enrichment in CCM Fe-Mn crusts. DissolvedTh has a residence time in seawater of b100 years because it is very par-ticle reactive (Hein et al., 2012; Nozaki et al., 1987). Thorium positivelycorrelates with Fe and Si and negatively correlates with Mn at the 99%CL in CCM crusts indicating that the higher Fe concentration may alsohelp to account for the increased Th concentration observed in CCMFe-Mn crusts relative to open-ocean crusts. Dissolution of biogenic silicais thought to be an additional seabed source for Th, as is biogenic calcite,both of which adsorb Th from the water column (Hein et al., 2012).There is also no correlation between Th and water depth in CCM crusts,unlike samples from Shatsky Rise in the NW Pacific and the NinetyeastRidge in the Indian Ocean where Th correlates with increasing waterdepth (Hein et al., 2012, 2016).
5.4. Element relationships with primary productivity
The Si/Al ratio is significantly higher in CCM crust samples, 6.2 forn = 225 relative to a mean value of 3.7 n = 610 for all other globalopen-ocean deposits (Hein and Koschinsky, 2014). In CCM crusts nei-ther Si nor Al show an increase towards the continental shelf, whencomparing concentrations from off shore and near shore seamounts. Ifthe Si enrichment in CCM crusts was due to terrestrial input, or dis-solved biosilica from surfacewater diatom primary productivity, Si con-tents in CCM Fe-Mn crusts would be expected to increase towardsshore. Since this relationship is not found, the high Si concentrationsin CCMcrusts is likely due to thehigh Si concentrations inNEPacific sea-water. Dissolved Si in seawater ranges from 10 to 40 μmol/kg in the At-lantic, and up to 180 μmol/kg in the NE Pacific (Johnson et al., 2006;Talley and Joyce, 1992). Evidence of the high Si in the waters alongthe CCM area is also present in several basins along the California bor-derland; this is shown in the Monterey Formation, which has an in-crease in biosilica from ~9.3 Ma onwards (Laurent et al., 2015).
The high concentration of dissolved Si in the Pacific is due in part tothe North Pacific silica plume. The North Pacific silica plume originatesin the NE Pacific, extends across the North Pacific from 50°N to 20°N,
Please cite this article as: Conrad, T., et al., Formation of Fe-Mn crusts witdx.doi.org/10.1016/j.oregeorev.2016.09.010
and is centered around 2300 m water depth (Johnson et al., 2006;Talley and Joyce, 1992 and references therein). Themaximum concentra-tions of Si in the plume reach approximately 164 Tmol above the averagebackground of 165 μmol/L (Johnson et al., 2006). Possible sources of dis-solved silica in the North Pacific silica plume include; hydrothermalventing, remineralization of biosilica in thewater column from surface di-atoms, dissolution of bottom sediments, and accumulation of bottomwater silica along the path of deep water circulation (Talley and Joyce,1992). Additionally sediment compression and thermal advectionthrough faults during the formationof the accretionarymarginmight pro-vide an additional source of Si to the region (Johnson et al., 2006).
Other trace metals, Ni, Zn, and Cd with nutrient-type seawater pro-files also show enrichment in bottom-waters along the path of deep-water circulation (Bruland and Lohan, 2003). However, these elementsare not noticeably enriched in CCM crusts relative to open-ocean crusts.Barium and P both have nutrient-type profiles in seawater and can beused as tracers of primary productivity (Broecker et al., 1982; Chan etal., 1976; Paytan and Griffith, 2007). However, Ba and P are also notenriched in CCM Fe-Mn crusts relative to open-ocean crusts. With theexception of a few outliers, P shows higher concentrations in nearshore CCM crusts relative to off shore samples, which probably reflectsthe strong upwelling and primary productivity.
CCM crust samples with high Ba contain minor barite, this is ob-served on Hoss Seamount (D10-3 and D10-4A) and Little Joe Seamount(D13-2C) (Hein et al., 2010b). However, overall CCM Fe-Mn crusts havesomewhat lower Ba concentrations than crusts from the PCZ, 1838 ppm(n= 225) and 1934 ppm (n= 328), respectively. In contrast, the CCMcrusts do have higher Ba concentrations than the Fe-Mn crust meanfrom the Atlantic and Indian Oceans, 1556 ppm (n = 43) and1533 ppm (n = 23), respectively. Barium in near shore CCM Fe-Mncrusts partially overlaps with the lower concentration in off shore sam-ples. That indicates that Ba is not consistently higher in crusts closer tothe shelf or continental margin.
Marine barite can form in a number of ways, for example authigenicprocesses occurring in sulfate reducing sediments during diagenesis,cold-seep fluids along the seafloor, low-temperature hydrothermalfluids b120 °C, intermediate-temperature fluids (150–250 °C), and pre-cipitation in the water column typically in the presence of organic mat-ter (Hein et al., 2007; Paytan et al., 2002). Fe-Mn crust samples with Baconcentrations significantly higher than the regional Fe-Mn crust meanmay have been exposed to localized cold-seep or low temperature, dif-fuse-flow hydrothermal fluids, despite the overall hydrogenetic originof the crusts.
5.5. Growth rate
Increasing growth rate with increasing water depth is an expectedtrend and is likely due to increasing dissolved oxygen concentrations inseawater below the oxygen minimum zone (Halbach et al., 1983; Heinet al., 2016). The correlation of Fe-Mn crust growth rate and waterdepth is not due to a relationship between Fe or Mn concentrationswith water depth. Plots of these elements in Fe-Mn crusts versus waterdepth for the same data set do not show a significant correlation. Thetrend is also not due to continental proximity as growth rates continueto trend with water depth in Fe-Mn crusts from individual seamounts.Dissolved Mn concentrations in seawater correlates with the strength ofthe OMZ which provides a reservoir of dissolved Mn; with advectiveand diffusive transport Mn moves out of the OMZ and is oxidized(Dickens and Owen, 1994; Halbach and Puteanus, 1984; Hein et al.,2016). It is significant that CCM crusts continue to grow in a region witha well-developed OMZ, and that growth rates are slower in the OMZthan below the OMZ. This correlation has not yet been determined else-where in the global ocean and needs to be resolved for open-ocean set-tings where the OMZ is weaker. However, this does assume that theOMZ has been present since crust formation began. It also assumes thatsufficient supplies of Fe andMn,with residence times in seawater of around
hin a continental margin environment, Ore Geol. Rev. (2016), http://
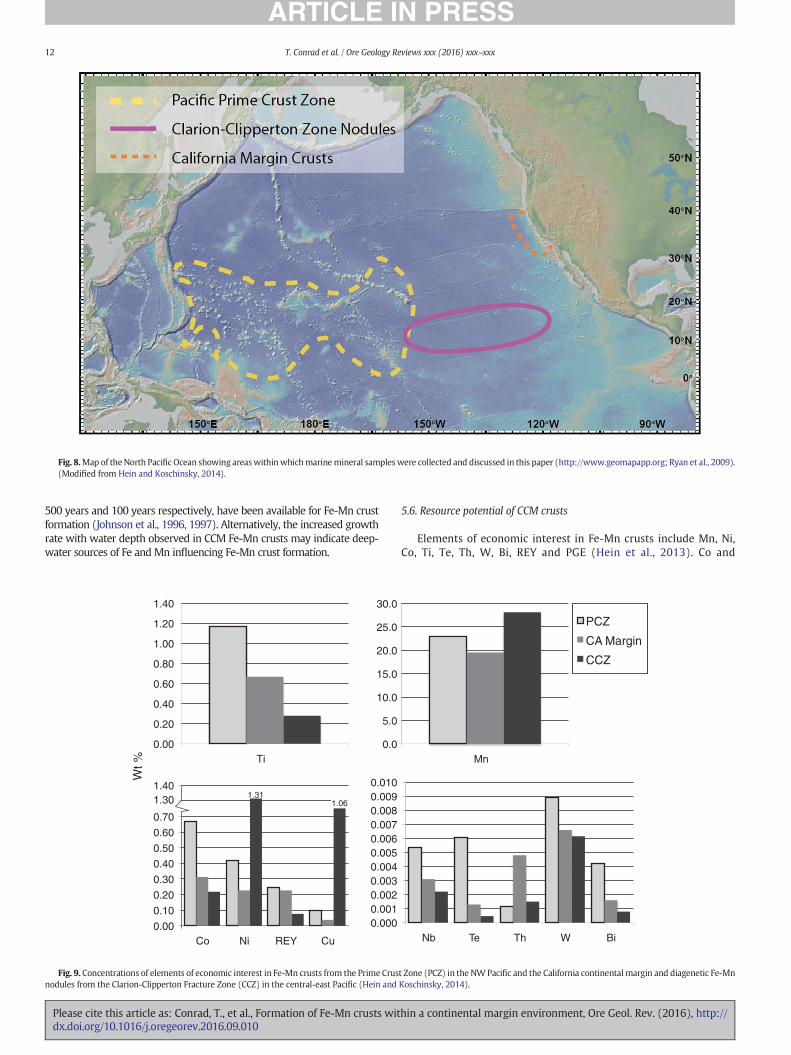
Fig. 8.Map of theNorth Pacific Ocean showing areaswithinwhichmarinemineral samples were collected and discussed in this paper (http://www.geomapapp.org; Ryan et al., 2009).(Modified from Hein and Koschinsky, 2014).
12 T. Conrad et al. / Ore Geology Reviews xxx (2016) xxx–xxx
500 years and 100 years respectively, have been available for Fe-Mn crustformation (Johnson et al., 1996, 1997). Alternatively, the increased growthrate with water depth observed in CCM Fe-Mn crusts may indicate deep-water sources of Fe and Mn influencing Fe-Mn crust formation.
0.00
0.20
0.40
0.60
0.80
1.00
1.20
1.40
Ti 0.0
5.0
10.0
15.0
20.0
25.0
30.0
0.00
0.10
0.20
0.30
0.40
0.50
0.60
0.70
1.40
Co Ni REY Cu
0.000 0.001 0.002 0.003 0.004 0.005 0.006 0.007 0.008 0.009 0.010 W
t %
1.30 1.311.06
Fig. 9. Concentrations of elements of economic interest in Fe-Mn crusts from the Prime Crusnodules from the Clarion-Clipperton Fracture Zone (CCZ) in the central-east Pacific (Hein and
Please cite this article as: Conrad, T., et al., Formation of Fe-Mn crusts witdx.doi.org/10.1016/j.oregeorev.2016.09.010
5.6. Resource potential of CCM crusts
Elements of economic interest in Fe-Mn crusts include Mn, Ni,Co, Ti, Te, Th, W, Bi, REY and PGE (Hein et al., 2013). Co and
Mn
Nb Te Th W Bi
PCZ
CA Margin
CCZ
t Zone (PCZ) in the NWPacific and the California continentalmargin and diagenetic Fe-MnKoschinsky, 2014).
hin a continental margin environment, Ore Geol. Rev. (2016), http://
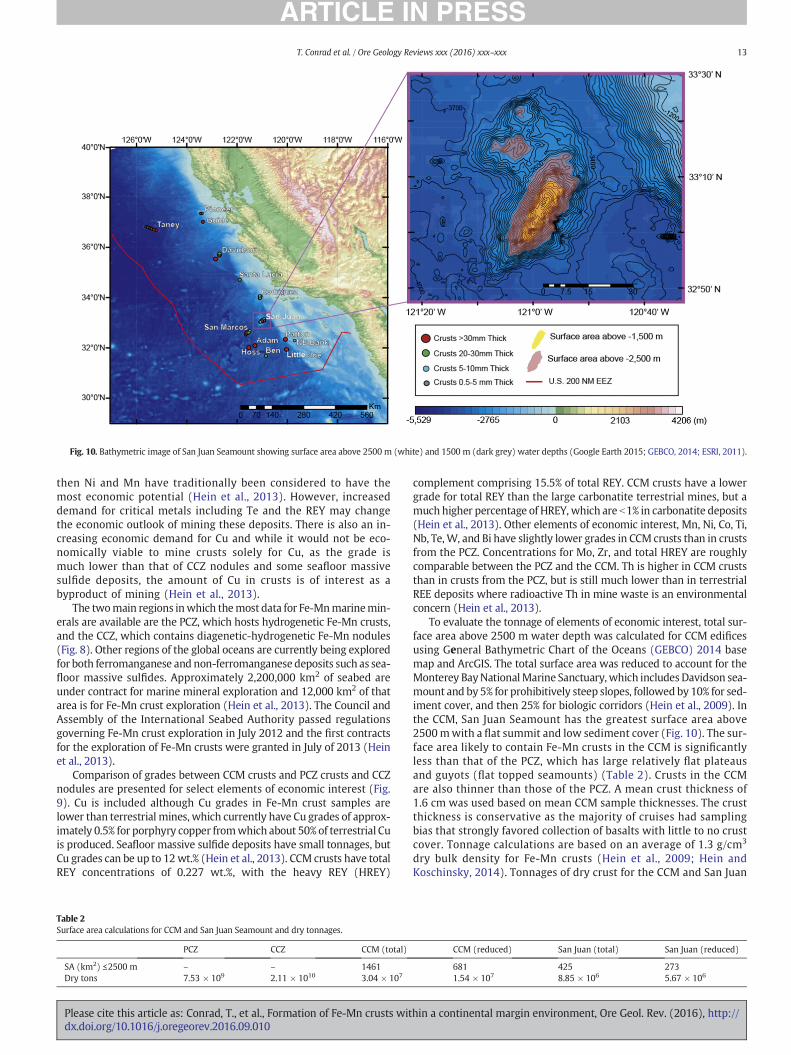
Fig. 10. Bathymetric image of San Juan Seamount showing surface area above 2500 m (white) and 1500 m (dark grey) water depths (Google Earth 2015; GEBCO, 2014; ESRI, 2011).
13T. Conrad et al. / Ore Geology Reviews xxx (2016) xxx–xxx
then Ni and Mn have traditionally been considered to have themost economic potential (Hein et al., 2013). However, increaseddemand for critical metals including Te and the REY may changethe economic outlook of mining these deposits. There is also an in-creasing economic demand for Cu and while it would not be eco-nomically viable to mine crusts solely for Cu, as the grade ismuch lower than that of CCZ nodules and some seafloor massivesulfide deposits, the amount of Cu in crusts is of interest as abyproduct of mining (Hein et al., 2013).
The twomain regions inwhich themost data for Fe-Mnmarinemin-erals are available are the PCZ, which hosts hydrogenetic Fe-Mn crusts,and the CCZ, which contains diagenetic-hydrogenetic Fe-Mn nodules(Fig. 8). Other regions of the global oceans are currently being exploredfor both ferromanganese and non-ferromanganese deposits such as sea-floor massive sulfides. Approximately 2,200,000 km2 of seabed areunder contract for marine mineral exploration and 12,000 km2 of thatarea is for Fe-Mn crust exploration (Hein et al., 2013). The Council andAssembly of the International Seabed Authority passed regulationsgoverning Fe-Mn crust exploration in July 2012 and the first contractsfor the exploration of Fe-Mn crusts were granted in July of 2013 (Heinet al., 2013).
Comparison of grades between CCM crusts and PCZ crusts and CCZnodules are presented for select elements of economic interest (Fig.9). Cu is included although Cu grades in Fe-Mn crust samples arelower than terrestrial mines, which currently have Cu grades of approx-imately 0.5% for porphyry copper fromwhich about 50% of terrestrial Cuis produced. Seafloor massive sulfide deposits have small tonnages, butCu grades can be up to 12wt.% (Hein et al., 2013). CCM crusts have totalREY concentrations of 0.227 wt.%, with the heavy REY (HREY)
Table 2Surface area calculations for CCM and San Juan Seamount and dry tonnages.
PCZ CCZ CCM (total)
SA (km2) ≤2500 m – – 1461Dry tons 7.53 × 10⁹ 2.11 × 10¹⁰ 3.04 × 10⁷
Please cite this article as: Conrad, T., et al., Formation of Fe-Mn crusts witdx.doi.org/10.1016/j.oregeorev.2016.09.010
complement comprising 15.5% of total REY. CCM crusts have a lowergrade for total REY than the large carbonatite terrestrial mines, but amuch higher percentage of HREY, which are b1% in carbonatite deposits(Hein et al., 2013). Other elements of economic interest, Mn, Ni, Co, Ti,Nb, Te,W, and Bi have slightly lower grades in CCM crusts than in crustsfrom the PCZ. Concentrations for Mo, Zr, and total HREY are roughlycomparable between the PCZ and the CCM. Th is higher in CCM cruststhan in crusts from the PCZ, but is still much lower than in terrestrialREE deposits where radioactive Th in mine waste is an environmentalconcern (Hein et al., 2013).
To evaluate the tonnage of elements of economic interest, total sur-face area above 2500 m water depth was calculated for CCM edificesusing General Bathymetric Chart of the Oceans (GEBCO) 2014 basemap and ArcGIS. The total surface area was reduced to account for theMonterey BayNationalMarine Sanctuary, which includes Davidson sea-mount and by 5% for prohibitively steep slopes, followed by 10% for sed-iment cover, and then 25% for biologic corridors (Hein et al., 2009). Inthe CCM, San Juan Seamount has the greatest surface area above2500mwith a flat summit and low sediment cover (Fig. 10). The sur-face area likely to contain Fe-Mn crusts in the CCM is significantlyless than that of the PCZ, which has large relatively flat plateausand guyots (flat topped seamounts) (Table 2). Crusts in the CCMare also thinner than those of the PCZ. A mean crust thickness of1.6 cm was used based on mean CCM sample thicknesses. The crustthickness is conservative as the majority of cruises had samplingbias that strongly favored collection of basalts with little to no crustcover. Tonnage calculations are based on an average of 1.3 g/cm3
dry bulk density for Fe-Mn crusts (Hein et al., 2009; Hein andKoschinsky, 2014). Tonnages of dry crust for the CCM and San Juan
CCM (reduced) San Juan (total) San Juan (reduced)
681 425 2731.54 × 107 8.85 × 10⁶ 5.67 × 10⁶
hin a continental margin environment, Ore Geol. Rev. (2016), http://
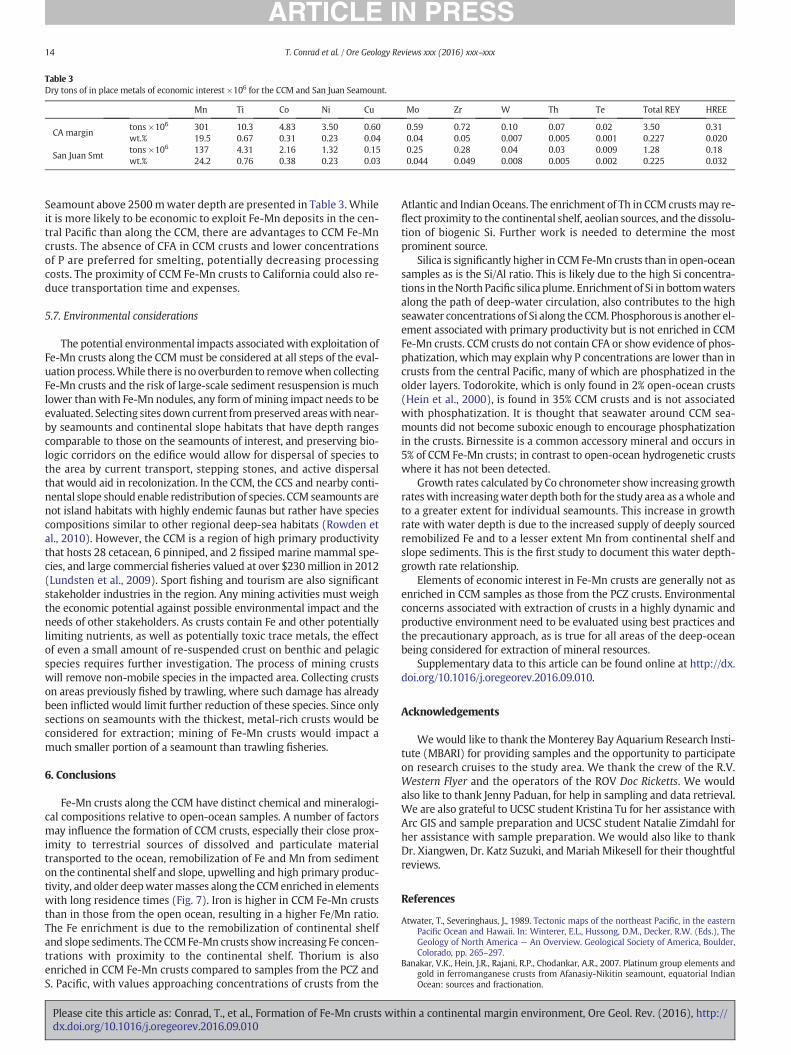
Table 3Dry tons of in place metals of economic interest ×106 for the CCM and San Juan Seamount.
Mn Ti Co Ni Cu Mo Zr W Th Te Total REY HREE
CA margintons ×106 301 10.3 4.83 3.50 0.60 0.59 0.72 0.10 0.07 0.02 3.50 0.31wt.% 19.5 0.67 0.31 0.23 0.04 0.04 0.05 0.007 0.005 0.001 0.227 0.020
San Juan Smttons ×106 137 4.31 2.16 1.32 0.15 0.25 0.28 0.04 0.03 0.009 1.28 0.18wt.% 24.2 0.76 0.38 0.23 0.03 0.044 0.049 0.008 0.005 0.002 0.225 0.032
14 T. Conrad et al. / Ore Geology Reviews xxx (2016) xxx–xxx
Seamount above 2500mwater depth are presented in Table 3.Whileit is more likely to be economic to exploit Fe-Mn deposits in the cen-tral Pacific than along the CCM, there are advantages to CCM Fe-Mncrusts. The absence of CFA in CCM crusts and lower concentrationsof P are preferred for smelting, potentially decreasing processingcosts. The proximity of CCM Fe-Mn crusts to California could also re-duce transportation time and expenses.
5.7. Environmental considerations
The potential environmental impacts associatedwith exploitation ofFe-Mn crusts along the CCMmust be considered at all steps of the eval-uation process.While there is no overburden to removewhen collectingFe-Mn crusts and the risk of large-scale sediment resuspension is muchlower thanwith Fe-Mn nodules, any form of mining impact needs to beevaluated. Selecting sites down current frompreserved areaswith near-by seamounts and continental slope habitats that have depth rangescomparable to those on the seamounts of interest, and preserving bio-logic corridors on the edifice would allow for dispersal of species tothe area by current transport, stepping stones, and active dispersalthat would aid in recolonization. In the CCM, the CCS and nearby conti-nental slope should enable redistribution of species. CCM seamounts arenot island habitats with highly endemic faunas but rather have speciescompositions similar to other regional deep-sea habitats (Rowden etal., 2010). However, the CCM is a region of high primary productivitythat hosts 28 cetacean, 6 pinniped, and 2 fissiped marine mammal spe-cies, and large commercial fisheries valued at over $230million in 2012(Lundsten et al., 2009). Sport fishing and tourism are also significantstakeholder industries in the region. Any mining activities must weighthe economic potential against possible environmental impact and theneeds of other stakeholders. As crusts contain Fe and other potentiallylimiting nutrients, as well as potentially toxic trace metals, the effectof even a small amount of re-suspended crust on benthic and pelagicspecies requires further investigation. The process of mining crustswill remove non-mobile species in the impacted area. Collecting crustson areas previously fished by trawling, where such damage has alreadybeen inflicted would limit further reduction of these species. Since onlysections on seamounts with the thickest, metal-rich crusts would beconsidered for extraction; mining of Fe-Mn crusts would impact amuch smaller portion of a seamount than trawling fisheries.
6. Conclusions
Fe-Mn crusts along the CCM have distinct chemical and mineralogi-cal compositions relative to open-ocean samples. A number of factorsmay influence the formation of CCM crusts, especially their close prox-imity to terrestrial sources of dissolved and particulate materialtransported to the ocean, remobilization of Fe and Mn from sedimenton the continental shelf and slope, upwelling and high primary produc-tivity, and older deepwatermasses along the CCMenriched in elementswith long residence times (Fig. 7). Iron is higher in CCM Fe-Mn cruststhan in those from the open ocean, resulting in a higher Fe/Mn ratio.The Fe enrichment is due to the remobilization of continental shelfand slope sediments. The CCMFe-Mn crusts show increasing Fe concen-trations with proximity to the continental shelf. Thorium is alsoenriched in CCM Fe-Mn crusts compared to samples from the PCZ andS. Pacific, with values approaching concentrations of crusts from the
Please cite this article as: Conrad, T., et al., Formation of Fe-Mn crusts witdx.doi.org/10.1016/j.oregeorev.2016.09.010
Atlantic and Indian Oceans. The enrichment of Th in CCM crusts may re-flect proximity to the continental shelf, aeolian sources, and the dissolu-tion of biogenic Si. Further work is needed to determine the mostprominent source.
Silica is significantly higher in CCM Fe-Mn crusts than in open-oceansamples as is the Si/Al ratio. This is likely due to the high Si concentra-tions in theNorth Pacific silica plume. Enrichment of Si in bottomwatersalong the path of deep-water circulation, also contributes to the highseawater concentrations of Si along the CCM. Phosphorous is another el-ement associated with primary productivity but is not enriched in CCMFe-Mn crusts. CCM crusts do not contain CFA or show evidence of phos-phatization, whichmay explain why P concentrations are lower than incrusts from the central Pacific, many of which are phosphatized in theolder layers. Todorokite, which is only found in 2% open-ocean crusts(Hein et al., 2000), is found in 35% CCM crusts and is not associatedwith phosphatization. It is thought that seawater around CCM sea-mounts did not become suboxic enough to encourage phosphatizationin the crusts. Birnessite is a common accessory mineral and occurs in5% of CCM Fe-Mn crusts; in contrast to open-ocean hydrogenetic crustswhere it has not been detected.
Growth rates calculated by Co chronometer show increasing growthrateswith increasingwater depth both for the study area as awhole andto a greater extent for individual seamounts. This increase in growthrate with water depth is due to the increased supply of deeply sourcedremobilized Fe and to a lesser extent Mn from continental shelf andslope sediments. This is the first study to document this water depth-growth rate relationship.
Elements of economic interest in Fe-Mn crusts are generally not asenriched in CCM samples as those from the PCZ crusts. Environmentalconcerns associated with extraction of crusts in a highly dynamic andproductive environment need to be evaluated using best practices andthe precautionary approach, as is true for all areas of the deep-oceanbeing considered for extraction of mineral resources.
Supplementary data to this article can be found online at http://dx.doi.org/10.1016/j.oregeorev.2016.09.010.
Acknowledgements
Wewould like to thank the Monterey Bay Aquarium Research Insti-tute (MBARI) for providing samples and the opportunity to participateon research cruises to the study area. We thank the crew of the R.V.Western Flyer and the operators of the ROV Doc Ricketts. We wouldalso like to thank Jenny Paduan, for help in sampling and data retrieval.We are also grateful to UCSC student Kristina Tu for her assistance withArc GIS and sample preparation and UCSC student Natalie Zimdahl forher assistance with sample preparation. We would also like to thankDr. Xiangwen, Dr. Katz Suzuki, and Mariah Mikesell for their thoughtfulreviews.
References
Atwater, T., Severinghaus, J., 1989. Tectonic maps of the northeast Pacific, in the easternPacific Ocean and Hawaii. In: Winterer, E.L., Hussong, D.M., Decker, R.W. (Eds.), TheGeology of North America — An Overview. Geological Society of America, Boulder,Colorado, pp. 265–297.
Banakar, V.K., Hein, J.R., Rajani, R.P., Chodankar, A.R., 2007. Platinum group elements andgold in ferromanganese crusts from Afanasiy-Nikitin seamount, equatorial IndianOcean: sources and fractionation.
hin a continental margin environment, Ore Geol. Rev. (2016), http://

15T. Conrad et al. / Ore Geology Reviews xxx (2016) xxx–xxx
Bau, M., 1996. Controls on the fractionation of isovalent trace elements in magmatic andaqueous systems: evidence from Y/Ho, Zr/Hf, and lanthanide tetrad effect. Contrib.Mineral. Petrol. 123, 323–333. http://dx.doi.org/10.1007/s004100050159.
Bau, M., Schmidt, K., Koschinsky, A., Hein, J., Kuhn, T., Usui, A., 2014. Discriminating be-tween different genetic types of marine ferro-manganese crusts and nodules basedon rare earth elements and yttrium. Chem. Geol. 381, 1–9. http://dx.doi.org/10.1016/j.chemgeo.2014.05.004.
Berndmeyer, C., Birgel, D., Brunner, B., Wehrmann, L.M., Jöns, N., Bach, W., Arning, E.T.,Föllmi, K.B., Peckmann, J., 2012. The influence of bacterial activity on phosphorite for-mation in the Miocene Monterey Formation. California. Palaeogeogr. Palaeoclimatol.Palaeoecol. 317–318, 171–181. http://dx.doi.org/10.1016/j.palaeo.2012.01.004.
Biller, D.V., Bruland, K.W., 2013. Sources and distributions of Mn, Fe, Co, Ni, Cu, Zn, and Cdrelative to macronutrients along the central California coast during the spring andsummer upwelling season. Mar. Chem. 155, 50–70. http://dx.doi.org/10.1016/j.marchem.2013.06.003.
Biller, D.V., Coale, T.H., Till, R.C., Smith, G.J., Bruland, K.W., 2013. Coastal iron and nitratedistributions during the spring and summer upwelling season in the central Califor-nia Current upwelling regime. Cont. Shelf Res. 66, 58–72. http://dx.doi.org/10.1016/j.csr.2013.07.003.
Bonatti, E., Kraemer, T., Abdulla, H.A.N., 1972. Classification and genesis of submarineiron-manganese deposits. In: Horn, D.R. (Ed.), Ferromanganese Deposits on theOcean Floor. National Science Foundation, Washington, D.C. USA, pp. 149–166.
Boyd, P.W., Ellwood, M.J., 2010. The biogeochemical cycle of iron in the ocean. Nat. Geosci.3, 675–682. http://dx.doi.org/10.1038/ngeo964.
Broecker,W.S., Peng, T., Lamont-Doherty Geological Observatory, 1982. Tracers in the Sea.Eldigio Press, Palisades, N.Y.
Bruland, K.W., Lohan, M.C., 2003. Controls of trace metals in seawater. Treatise on Geo-chemistry. Elsevier, pp. 23–47.
Cande, S.C., Kent, D.V., 1995. Revised calibration of the geomagnetic polarity timescale forthe Late Cretaceous and Cenozoic. J. Geophys. Res Solid Earth 100, 6093–6095. http://dx.doi.org/10.1029/94JB03098.
Carr, M.-E., 2001. Estimation of potential productivity in Eastern Boundary Currents usingremote sensing. Deep Sea Res. Part II Top. Stud. Oceanogr. 49, 59–80. http://dx.doi.org/10.1016/S0967-0645(01)00094-7.
Chan, L.H., Edmond, J.M., Stallard, R.F., Broecker, W.S., Chung, Y.C., Weiss, R.F., Ku, T.L.,1976. Radium and barium at GEOSECS stations in the Atlantic and Pacific. Earth Plan-et. Sci. Lett. 32, 258–267. http://dx.doi.org/10.1016/0012-821X(76)90066-2.
Checkley, D.M., Barth, J.A., 2009. Patterns and processes in the California Current System.Prog. Oceanogr. 83, 49–64. http://dx.doi.org/10.1016/j.pocean.2009.07.028.
Chen, J.H., Lawrence Edwards, R., Wasserburg, G.J., 1986. 238U, 234U and 232Th in seawater.Earth Planet. Sci. Lett. 80, 241–251. http://dx.doi.org/10.1016/0012-821X(86)90108-1.
Clague, D.A., Reynolds, J.R., Davis, A.S., 2000. Near-ridge seamount chains in the northeast-ern Pacific Ocean. J. Geophys. Res. Solid Earth 105, 16541–16561.
Clague, D.A., Paduan, J.B., Duncan, R.A., Huard, J.J., Davis, A.S., Castillo, P.R., Lonsdale, P.,DeVogelaere, A., 2009. Five million years of compositionally diverse, episodic volca-nism: construction of Davidson Seamount atop an abandoned spreading center: Da-vidson Seamount ages and glass chemistry. Geochem. Geophys. Geosyst. 10. http://dx.doi.org/10.1029/2009GC002665 n/a-n/a.
Coale, K.H., Bruland, K.W., 1987. Oceanic stratified euphotic zone as elucidated by234Th:238U disequilibria. Limnol. Oceanogr. 32, 189–200. http://dx.doi.org/10.4319/lo.1987.32.1.0189.
Conway, T.M., John, S.G., 2015. The cycling of iron, zinc and cadmium in the North EastPacific Ocean — insights from stable isotopes. Geochim. Cosmochim. Acta 164,262–283. http://dx.doi.org/10.1016/j.gca.2015.05.023.
Coumans, J.P., Stix, J., Clague, D.A., Minarik, W.G., 2015. The magmatic architecture ofTaney Seamount-A, NE Pacific Ocean. J. Petrol. 56, 1037–1067. http://dx.doi.org/10.1093/petrology/egv027.
Davis, A.S., Gray, L.B., Clague, D.A., Hein, J.R., 2002. The Line Islands revisited: new40Ar/39Ar geochronologic evidence for episodes of volcanism due to lithospheric ex-tension: Line Islands revisited. Geochem. Geophys. Geosystems 3, 1–28. http://dx.doi.org/10.1029/2001GC000190.
Davis, A.S., Clague, D.A., Paduan, J.B., Cousens, B.L., Huard, J., 2010. Origin of volcanic sea-mounts at the continental margin of California related to changes in plate margins:origin of seamounts offshore California. Geochem. Geophys. Geosyst. 11. http://dx.doi.org/10.1029/2010GC003064 n/a-n/a.
Dickens, G.R., Owen, R.M., 1994. Late Miocene-Early Pliocene manganese redirection inthe central Indian Ocean: Expansion of the Intermediate Water oxygen minimumzone. Paleoceanography 9, 169–181. http://dx.doi.org/10.1029/93PA02699.
ESRI, 2011. ArcGIS Desktop: Release 10. CA Environmental Systems Research Institute,Redlands.
Filippelli, G.M., Delaney, M.L., Garrison, R.E., Omarzai, S.K., Behl, R.J., 1994. Phosphorus ac-cumulation rates in a Miocene low oxygen basin: the Monterey Formation (PismoBasin), California. Mar. Geol. 116, 419–430. http://dx.doi.org/10.1016/0025-3227(94)90055-8.
GEBCO, 2014. The GEBCO 2014 Grid, version 20150318. www.gebco.net.Gibbs, A.E., Hein, J.R., Lewis, S.D., McCulloch, D.S., 1993. Hydrothermal palygorskite and
ferromanganese mineralization at a central California margin fracture zone. Mar.Geol. 115, 19.
Halbach, P., Puteanus, D., 1984. The influence of the carbonate dissolution rate on thegrowth and composition of Co-rich ferromanganese crusts from Central Pacific sea-mount areas. Earth Planet. Sci. Lett. 68, 73–87. http://dx.doi.org/10.1016/0012-821X(84)90141-9.
Halbach, P., Segl, M., Puteanus, D., Mangini, A., 1983. Co-fluxes and growth rates in ferro-manganese deposits from central Pacific seamount areas. Nature 304, 716–719.http://dx.doi.org/10.1038/304716a0.
Please cite this article as: Conrad, T., et al., Formation of Fe-Mn crusts witdx.doi.org/10.1016/j.oregeorev.2016.09.010
Halbach, P.E., Sattler, C.-D., Teichmann, F., Wahsner, M., 1989. Cobalt rich and platinumbearing manganese crust deposits on seamounts: Nature, formation metal potential.Mar. Miner. 8, 23–39.
Hein, J.R., Koschinsky, A., 2014. Deep-ocean ferromanganese crusts and nodules. Treatiseon Geochemistry. Elsevier, pp. 273–291.
Hein, J.R., Yeh, H.-W., Gunn, S.H., Sliter, W.V., Benninger, L.M., Wang, C.-H., 1993. Twomajor Cenozoic episodes of phosphogenesis recorded in equatorial Pacific seamountdeposits. Paleoceanography 8, 293–311. http://dx.doi.org/10.1029/93PA00320.
Hein, J.R., Koschinsky, A., Bau, M., Manheim, F.T., Kang, J.-K., Roberts, L., 2000. Cobalt-richferromanganese crusts in the Pacific: chapter 9. Handbook of Marine Mineral De-posits. CRC Press, Boca Raton, Florida, pp. 239–279.
Hein, J.R., Koschinsky, A., McIntyre, B.R., 2005. Mercury- and silver-rich ferromanganeseoxides, Southern California Borderland: deposit model and environmental implica-tions. Econ. Geol. 100, 1151–1168. http://dx.doi.org/10.2113/gsecongeo.100.6.1151.
Hein, J.R., Zierenberg, R.A., Maynard, J.B., Hannington, M.D., 2007. Barite-forming environ-ments along a rifted continental margin, Southern California Boderland. Deep SeaRes. Part II Top. Stud. Oceanogr. 54, 1327–1349. http://dx.doi.org/10.1016/j.dsr2.2007.04.011.
Hein, J.R., Conrad, T.A., Dunham, R.E., 2009. Seamount characteristics andmine-site modelapplied to exploration- and mining-lease-block selection for cobalt-rich ferromanga-nese crusts. Mar. Georesour. Geotechnol. 27, 160–176. http://dx.doi.org/10.1080/10641190902852485.
Hein, J.R., Conrad, T., Staudigel, H., 2010a. Seamount mineral deposits: a source of raremetals for high-technology industries. Oceanography 23, 184–189. http://dx.doi.org/10.5670/oceanog.2010.70.
Hein, J.R., Reid, J.A., Conrad, T.A., Dunham, R.E., Clague, D.A., Schulz, M.S., Davis, A.S.,2010b. Seamounts and ferromanganese crusts within and near the U.S. EEZ off Cali-fornia— data for RV Farnella cruise F7-87-SC (No. 2010-1069). U.S. Geological Survey.
Hein, J.R., Conrad, T.A., Frank, M., Christl, M., Sager, W.W., 2012. Copper-nickel-rich, amal-gamated ferromanganese crust-nodule deposits from Shatsky Rise, NW Pacific:Shatsky Rise Cu-rich Fe-Mn crusts. Geochem. Geophys. Geosyst. 13. http://dx.doi.org/10.1029/2012GC004286 n/a-n/a.
Hein, J.R., Mizell, K., Koschinsky, A., Conrad, T.A., 2013. Deep-ocean mineral deposits as asource of critical metals for high- and green-technology applications: comparisonwith land-based resources. Ore Geol. Rev. 51, 1–14. http://dx.doi.org/10.1016/j.oregeorev.2012.12.001.
Hein, J.R., Conrad, T., Mizell, K., Banakar, V.K., Frey, F.A., Sager,W.W., 2016. Controls on fer-romanganese crust composition and reconnaissance resource potential, NinetyeastRidge, Indian Ocean. Deep Sea Res. Part Oceanogr. Res. Pap. 110, 1–19. http://dx.doi.org/10.1016/j.dsr.2015.11.006.
Holt, J.W., Holt, E.W., Stock, J.M., 2000. An age constraint on Gulf of California rifting fromthe Santa Rosalia basin, Baja California Sur, Mexico. Geol. Soc. Am. Bull. 112, 540–549.http://dx.doi.org/10.1130/0016-7606(2000)112b540:AACOGON2.0.CO;2.
Horner, T.J., Williams, H.M., Hein, J.R., Saito, M.A., Burton, K.W., Halliday, A.N., Nielsen, S.G.,2015. Persistence of deeply sourced iron in the Pacific Ocean. Proc. Natl. Acad. Sci.112, 1292–1297. http://dx.doi.org/10.1073/pnas.1420188112.
Hsieh, Y.-T., Henderson, G.M., Thomas, A.L., 2011. Combining seawater 232Th and 230Thconcentrations to determine dust fluxes to the surface ocean. Earth Planet. Sci. Lett.312, 280–290. http://dx.doi.org/10.1016/j.epsl.2011.10.022.
Humayun, M., 2004. Geochemical evidence for excess iron in the mantle beneath Hawaii.Science 306, 91–94. http://dx.doi.org/10.1126/science.1101050.
Hyeong, K., Kim, J., Yoo, C.M., Moon, J.-W., Seo, I., 2013. Cenozoic history ofphosphogenesis recorded in the ferromanganese crusts of central and western Pacificseamounts: Implications for deepwater circulation and phosphorus budgets.Palaeogeogr. Palaeoclimatol. Palaeoecol. 392, 293–301. http://dx.doi.org/10.1016/j.palaeo.2013.09.012.
Johnson, K.S., Coale, K.H., Berelson, W.M., Gordon, R.M., 1996. On the formation of themanganese maximum in the oxygen minimum. Geochim. Cosmochim. Acta 60,1291–1299. http://dx.doi.org/10.1016/0016-7037(96)00005-1.
Johnson, K.S., Gordon, R.M., Coale, K.H., 1997. What controls dissolved iron concentrationsin the world ocean? Mar. Chem. 57, 137–161. http://dx.doi.org/10.1016/S0304-4203(97)00043-1.
Johnson, H.P., Hautala, S.L., Bjorklund, T.A., Zarnetske, M.R., 2006. Quantifying the NorthPacific silica plume: North Pacific silica plume. Geochem. Geophys. Geosyst. 7.http://dx.doi.org/10.1029/2005GC001065 n/a-n/a.
Klemm, V., Levasseur, S., Frank, M., Hein, J., Halliday, A., 2005. Osmium isotope stratigra-phy of a marine ferromanganese crust. Earth Planet. Sci. Lett. 238, 42–48. http://dx.doi.org/10.1016/j.epsl.2005.07.016.
Klovan, J.E., Imbrie, J., 1971. An algorithm and FORTRAN-IV program for large-scale Q-mode factor analysis and calculation of factor scores. J. Int. Assoc. Math. Geol. 3,61–77. http://dx.doi.org/10.1007/BF02047433.
Koschinsky, A., Halbach, P., 1995. Sequential leaching of marine ferromanganese precipi-tates: genetic implications. Geochim. Cosmochim. Acta 59, 5113–5132. http://dx.doi.org/10.1016/0016-7037(95)00358-4.
Koschinsky, A., Hein, J.R., 2003. Uptake of elements from seawater by ferromanganesecrusts: solid-phase associations and seawater speciation. Mar. Geol. 198, 331–351.http://dx.doi.org/10.1016/S0025-3227(03)00122-1.
Koschinsky, A., Stascheit, A., Bau, M., Halbach, P., 1997. Effects of phosphatization on thegeochemical and mineralogical composition of marine ferromanganese crusts.Geochim. Cosmochim. Acta 61, 4079–4094. http://dx.doi.org/10.1016/S0016-7037(97)00231-7.
Laurent, D., de Kaenel, E., Spangenberg, J.E., Föllmi, K.B., 2015. A sedimentological modelof organic-matter preservation and phosphogenesis in theMioceneMonterey Forma-tion at Haskells Beach, Goleta (central California). Sediment. Geol. 326, 16–32. http://dx.doi.org/10.1016/j.sedgeo.2015.06.008.
hin a continental margin environment, Ore Geol. Rev. (2016), http://

16 T. Conrad et al. / Ore Geology Reviews xxx (2016) xxx–xxx
Lundsten, L., McClain, C., Barry, J., Cailliet, G., Clague, D., DeVogelaere, A., 2009. Ichthyofau-na on three seamounts off southern and central California, USA. Mar. Ecol. Prog. Ser.389, 223–232. http://dx.doi.org/10.3354/meps08181.
Mackey, D.J., O'Sullivan, J.E., Watson, R.J., Dal Pont, G., 2002. Trace metals in the WesternPacific: temporal and spatial variability in the concentrations of Cd, Cu, Mn and Ni.Deep Sea Res. Part Oceanogr. Res. Pap. 49, 2241–2259. http://dx.doi.org/10.1016/S0967-0637(02)00124-3.
Mangini, A., Key, R., 1983. A 230Th profile in the Atlantic Ocean. Earth Planet. Sci. Lett. 62,377–384. http://dx.doi.org/10.1016/0012-821X(83)90008-0.
Manheim, F.T., Lane-Bostwick, C.M., 1988. Cobalt in ferromanganese crusts as amonitor ofhydrothermal discharge on the Pacific sea floor. Nature 335, 59–62. http://dx.doi.org/10.1038/335059a0.
Marsaglia, K.M., Davis, A.S., Rimkus, K., Clague, D.A., 2006. Evidence for interaction of aspreading ridge with the outer California borderland. Mar. Geol. 229, 259–272.http://dx.doi.org/10.1016/j.margeo.2006.02.006.
McLennan, S.M., 1989. Rare earth elements in sedimentary rocks; influence of provenanceand sedimentary processes. In: Lipin, B.R., McKay, G.A. (Eds.), Geochemistry and Min-eralogy of Rare Earth ElementsRev. in Mineralogy. Mineralogical Society of America,Washington, D.C., USA, pp. 169–200.
McManus, J., Berelson, W.M., Severmann, S., Johnson, K.S., Hammond, D.E., Roy, M., Coale,K.H., 2012. Benthic manganese fluxes along the Oregon–California continental shelfand slope. Cont. Shelf Res. 43, 71–85. http://dx.doi.org/10.1016/j.csr.2012.04.016.
Morel, F.M.M., Milligan, A.J., Saito, M.A., 2014. Marine bioinorganic chemistry: the role oftrace metals in the oceanic cycles of major nutrients. Treatise on Geochemistry.Elsevier, pp. 123–150.
Muiños, S.B., Hein, J.R., Frank, M., Monteiro, J.H., Gaspar, L., Conrad, T., Pereira, H.G.,Abrantes, F., 2013. Deep-sea Fe-Mn crusts from the northeast Atlantic Ocean: compo-sition and resource considerations. Mar. Georesources Geotechnol. 31, 40–70. http://dx.doi.org/10.1080/1064119X.2012.661215.
Nozaki, Y., Yang, H.-S., Yamada, M., 1987. Scavenging of thorium in the ocean. J. Geophys.Res. 92, 772. http://dx.doi.org/10.1029/JC092iC01p00772.
Oskin, M., Stock, J., 2003. Pacific–North America plate motion and opening of the UpperDelfín basin, northern Gulf of California. Mexico. Geol. Soc. Am. Bull. 115, 1173.http://dx.doi.org/10.1130/B25154.1.
Paduan, J.B., Clague, D.A., Davis, A.S., 2009. Evidence that three seamounts off southernCalifornia were ancient islands. Mar. Geol. 265, 146–156. http://dx.doi.org/10.1016/j.margeo.2009.07.003.
Paytan, A., Griffith, E.M., 2007. Marine barite: recorder of variations in ocean export pro-ductivity. Deep Sea Res. Part II Top. Stud. Oceanogr. 54, 687–705. http://dx.doi.org/10.1016/j.dsr2.2007.01.007.
Please cite this article as: Conrad, T., et al., Formation of Fe-Mn crusts witdx.doi.org/10.1016/j.oregeorev.2016.09.010
Paytan, A., Mearon, S., Cobb, K., Kastner, M., 2002. Origin of marine barite deposits: Sr andS isotope characterization. Geology 30, 747. http://dx.doi.org/10.1130/0091-7613(2002)030b0747:OOMBDSN2.0.CO;2.
Pisias, N.G., Murray, R.W., Scudder, R.P., 2013. Multivariate statistical analysis andpartitioning of sedimentary geochemical data sets: general principles and specificMATLAB scripts: technical brief. Geochem. Geophys. Geosystems 14, 4015–4020.http://dx.doi.org/10.1002/ggge.20247.
Powell, R.E., Weldon, R.J., 1992. Evolution of the San Andreas Fault. Annu. Rev. Earth Plan-et. Sci. 20, 431–468. http://dx.doi.org/10.1146/annurev.ea.20.050192.002243.
Puteanus, D., Halbach, P., 1988. Correlation of Co concentration and growth rate — amethod for age determination of ferromanganese crusts. Chem. Geol. 69, 73–85.http://dx.doi.org/10.1016/0009-2541(88)90159-3.
Qin, L., Humayun, M., 2008. The Fe/Mn ratio in MORB and OIB determined by ICP-MS.Geochim. Cosmochim. Acta 72, 1660–1677. http://dx.doi.org/10.1016/j.gca.2008.01.012.
Rajani, R.P., Banakar, V.K., Parthiban, G., Mudholkar, A.V., Chodankar, A.R., 2005. Composi-tional variation and genesis of ferromanganese crusts of the Afanasiy–Nikitin Sea-mount, Equatorial Indian Ocean. J. Earth Syst. Sci. 114, 51–61. http://dx.doi.org/10.1007/BF02702008.
Rowden, A.A., Dower, J.F., Schlacher, T.A., Consalvey, M., Clark, M.R., 2010. Paradigms inseamount ecology: fact, fiction and future: paradigms in seamount ecology. Mar.Ecol. 31, 226–241. http://dx.doi.org/10.1111/j.1439-0485.2010.00400.x.
Roy-Barman, M., Chen, J.H., Wasserburg, G.J., 1996. 230Th\\232Th systematics in the centralPacific Ocean: the sources and the fates of thorium. Earth Planet. Sci. Lett. 139,351–363. http://dx.doi.org/10.1016/0012-821X(96)00017-9.
Rudnick, R.L., Gao, S., 2014. Composition of the continental crust. Treatise on Geochemis-try. Elsevier, pp. 1–51.
Ryan, W.B.F., Carbotte, S.M., Coplan, J.O., O'Hara, S., Melkonian, A., Arko, R., Weissel, R.A.,Ferrini, V., Goodwillie, A., Nitsche, F., Bonczkowski, J., Zemsky, R., 2009. GlobalMulti-Resolution Topography synthesis. Geochem. Geophys. Geosyst. 10, Q03014.http://dx.doi.org/10.1029/2008GC002332.
Talley, L.D., 2008. Freshwater transport estimates and the global overturning circulation:shallow, deep and throughflow components. Prog. Oceanogr. 78, 257–303. http://dx.doi.org/10.1016/j.pocean.2008.05.001.
Talley, L.D., Joyce, T.M., 1992. The double silica maximum in the North Pacific. J. Geophys.Res. 97, 5465. http://dx.doi.org/10.1029/92JC00037.
Taylor, S.R., McLennan, S.M., 1985. The continental crust: its composition and evolution.Geol. Mag. 122, 673. http://dx.doi.org/10.1017/S0016756800032167.
White, W.M., Klein, E.M., 2014. Composition of the oceanic crust. Treatise on Geochemis-try. Elsevier, pp. 457–496.
hin a continental margin environment, Ore Geol. Rev. (2016), http://