oregon agriculture a quick · pdf file10/15/2010 · oregon agriculture. a quick...
TRANSCRIPT
Jim JohnsonLand Use and Water Planning CoordinatorOregon Department of Agriculturehttp://www.oregon.gov/ODA/
Oregon AgricultureA Quick Overview

Talk about sustainable!Talk about sustainable!
1,100 farms in Oregon 1,100 farms in Oregon have been operated in have been operated in the same family for over 100+ the same family for over 100+ years!years!
20 farms for 150 years!20 farms for 150 years!
No other industry sector in this state No other industry sector in this state can compare to that number of oncan compare to that number of on-- going business entities.going business entities.
QuickTime™ and a decompressor
are needed to see this picture.
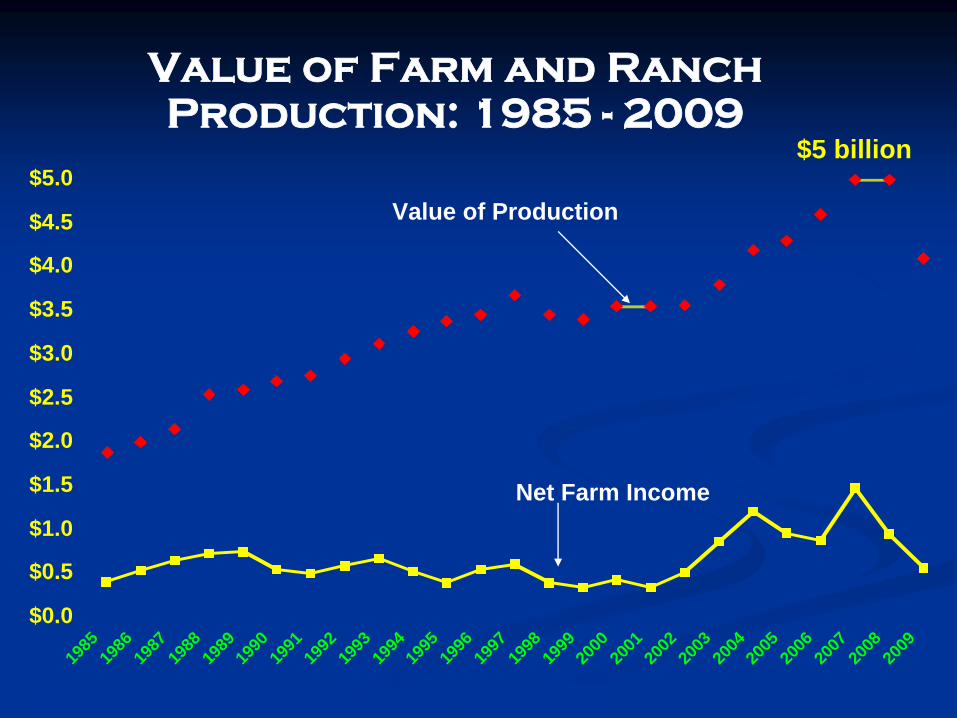
Value of Farm and Ranch Production: 1985 -
2009
$5 billion
$0.0
$0.5
$1.0
$1.5
$2.0
$2.5
$3.0
$3.5
$4.0
$4.5
$5.0
1985
1986
1987
1988
1989
1990
1991
1992
1993
1994
1995
1996
1997
1998
1999
2000
2001
2002
2003
2004
2005
2006
2007
2008
2009
Source: Oregon Agricultural Statistics Service. Nominal Dollars.
Value of Production
Net Farm Income
$1.5 $1.8 $2.0 $2.3 $2.5 $2.8 $3.0 $3.3 $3.5 $3.8 $4.0 $4.3 $4.5 $4.8 $5.0 $5.3
1985
1987
1989
1991
1993
1995
1997
1999
2001
2003
2005
2007
2009
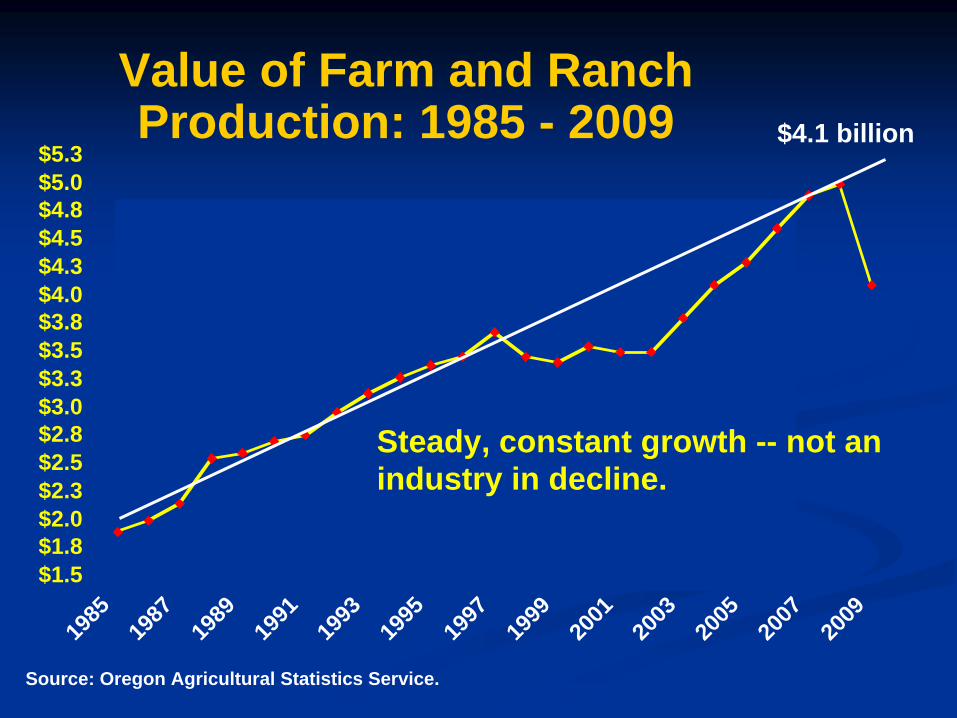
Value of Farm and Ranch Production: 1985 - 2009
Source: Oregon Agricultural Statistics Service.
$4.1 billion
Steady, constant growth -- not an industry in decline.

Oregon’s Top 10 Agricultural Producing Counties
2009Marion $493 millionUmatilla $369.5 millionMorrow $345.4 millionClackamas $302.4 millionKlamath $241.3 millionWashington $238.9 millionLinn $237.2 millionMalheur $228 millionYamhill $222.6 millionPolk $162.1 million
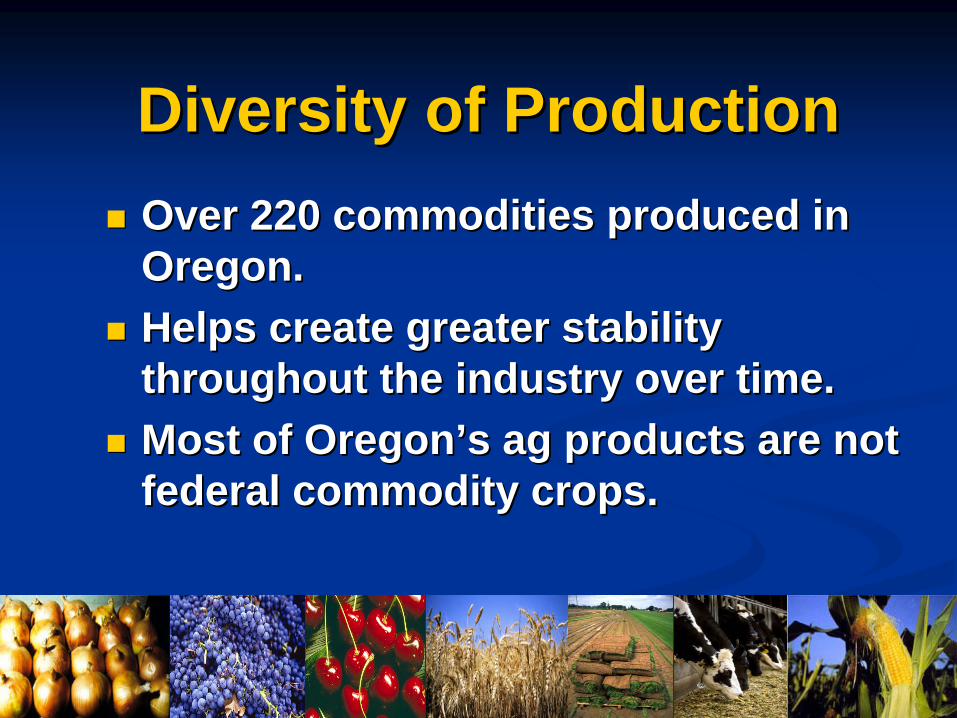
Diversity of ProductionDiversity of Production
Over 220 commodities produced in Over 220 commodities produced in Oregon. Oregon.
Helps create greater stability Helps create greater stability throughout the industry over time.throughout the industry over time.
Most of OregonMost of Oregon’’s ag products are not s ag products are not federal commodity crops.federal commodity crops.

Oregon Leads the Nation Oregon Leads the Nation in the Production of:in the Production of:
Grass SeedGrass Seed
HazelnutsHazelnuts
Christmas TreesChristmas Trees
Dungeness CrabDungeness Crab
CaneberriesCaneberries
Sugar beets for seedSugar beets for seed
Clover seedClover seed
Dried HerbsDried Herbs
Potted Florist AzaleasPotted Florist Azaleas
Carrot SeedCarrot Seed
Parsley SeedParsley Seed
QuickTime™ and a
decompressor
are needed to see this picture.
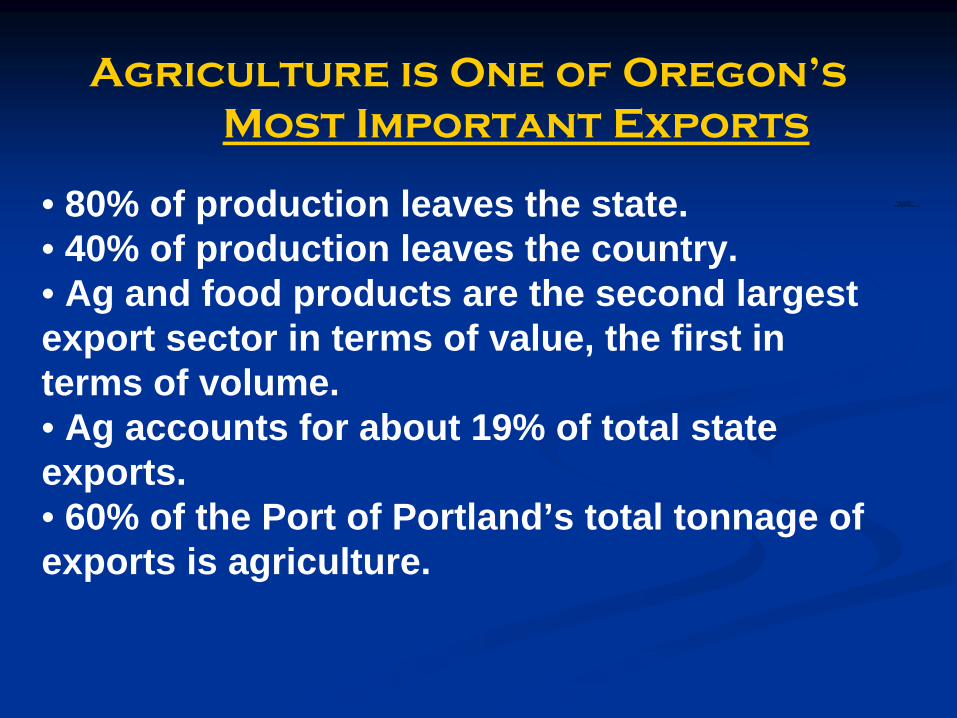
Agriculture is One of Oregon’s Most Important Exports
• 80% of production leaves the state.• 40% of production leaves the country.• Ag and food products are the second largest export sector in terms of value, the first in terms of volume.• Ag accounts for about 19% of total state exports. • 60% of the Port of Portland’s total tonnage of exports is agriculture.

OregonOregon’’s Top 10 s Top 10 Agricultural Producing Counties Agricultural Producing Counties
(2009)(2009)
Marion $493 millionUmatilla $369.5 millionMorrow $345.4 millionClackamas $302.4 millionKlamath $241.3 millionWashington $238.9 millionLinn $237.2 millionMalheur $228 millionYamhill $222.6 millionPolk $162.1 million
QuickTime™ and aTIFF (LZW) decompressor
are needed to see this picture.
QuickTime™ and a decompressor
are needed to see this picture.
Components of OR Ag by land useComponents of OR Ag by land use 17 million acres17 million acres
Cattle make use of land not usable for other forms of agriculture
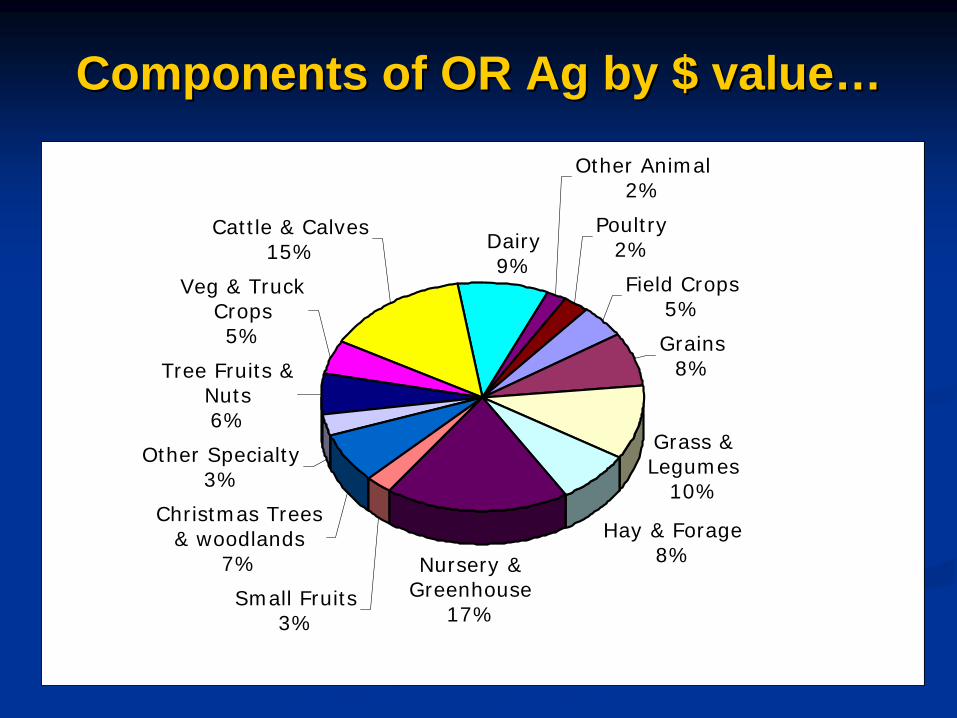
Components of OR Ag by $ valueComponents of OR Ag by $ value……
Field Crops5%
Grains8%
Grass & Legumes
10%
Hay & Forage8%Nursery &
Greenhouse17%
Small Fruits3%
Christmas Trees & woodlands
7%
Other Specialty3%
Tree Fruits & Nuts6%
Veg & Truck Crops5%
Cattle & Calves15% Dairy
9%
Other Animal2%
Poultry2%

OregonOregon’’s Top 10 Products:s Top 10 Products: Commodities Ranked by Value of Production to the Commodities Ranked by Value of Production to the
Grower (2009)Grower (2009)
Nursery/GreenhouseNursery/Greenhouse $732.6 million$732.6 million
Hay, all Hay, all $420.8 million$420.8 million
Cattle and calvesCattle and calves $420.6 million$420.6 million
Grass seedGrass seed $322.9 million$322.9 million
MilkMilk $308 $308 millionmillion
WheatWheat $223.6 million$223.6 million
PotatoesPotatoes $151.3 million$151.3 million
OnionsOnions $102.2 million$102.2 million
Christmas treesChristmas trees $100.9 million$100.9 million
PearsPears $84.3 million$84.3 million
Sources: Oregon Agricultural Statistics Service and OSU Extension Service
Economic FootprintEconomic Footprint
Agriculture generates $25.8 billion to OregonAgriculture generates $25.8 billion to Oregon’’s economy.s economy.
Over 214,000 jobs tied to Oregon agriculture.Over 214,000 jobs tied to Oregon agriculture.
Agriculture accounts to 10% of the stateAgriculture accounts to 10% of the state’’s economy.s economy.
QuickTime™ and a decompressor
are needed to see this picture.
“Oregon Agriculture and the Economy,” OSU Rural Studies Special Report 1080, February 2008,

Oregon Agricultural Land BaseOregon Agricultural Land Base Land in FarmsLand in Farms
17 million acres in FARM USE 17 million acres in FARM USE of which 14.7 are in of which 14.7 are in commercial farm use.commercial farm use.
15.5 million acres are ZONED 15.5 million acres are ZONED as agricultural land.as agricultural land.
13.1 million acres receive 13.1 million acres receive special farm value special farm value assessment as EFU land.assessment as EFU land.
2.4 million acres receive farm 2.4 million acres receive farm value assessment based on value assessment based on application.application.

Oregon Agricultural Land BaseOregon Agricultural Land Base SoilsSoils
Over 4.6 million acres Over 4.6 million acres of highof high--value farmland value farmland soils; 40% in the soils; 40% in the Willamette Valley.Willamette Valley.
About 3.4 million acres of About 3.4 million acres of those HVF soils are those HVF soils are located outside UGBs and located outside UGBs and zoned for agriculture.zoned for agriculture.
About 1.2 million acres About 1.2 million acres of prime farmland; 78% of prime farmland; 78% in the Willamette Valley, in the Willamette Valley, nearly 20% in Metro nearly 20% in Metro counties.counties.

Irrigated Agricultural LandsIrrigated Agricultural Lands
45% of all Oregon farms do 45% of all Oregon farms do some irrigation.some irrigation.
62% of harvested cropland 62% of harvested cropland acres are irrigated.acres are irrigated.
Irrigated farms produced Irrigated farms produced 77% of the total value of 77% of the total value of OregonOregon’’s harvested crops.s harvested crops.
Source: Census of Agriculture, Farm and RanchSource: Census of Agriculture, Farm and RanchIrrigation SurveyIrrigation Survey
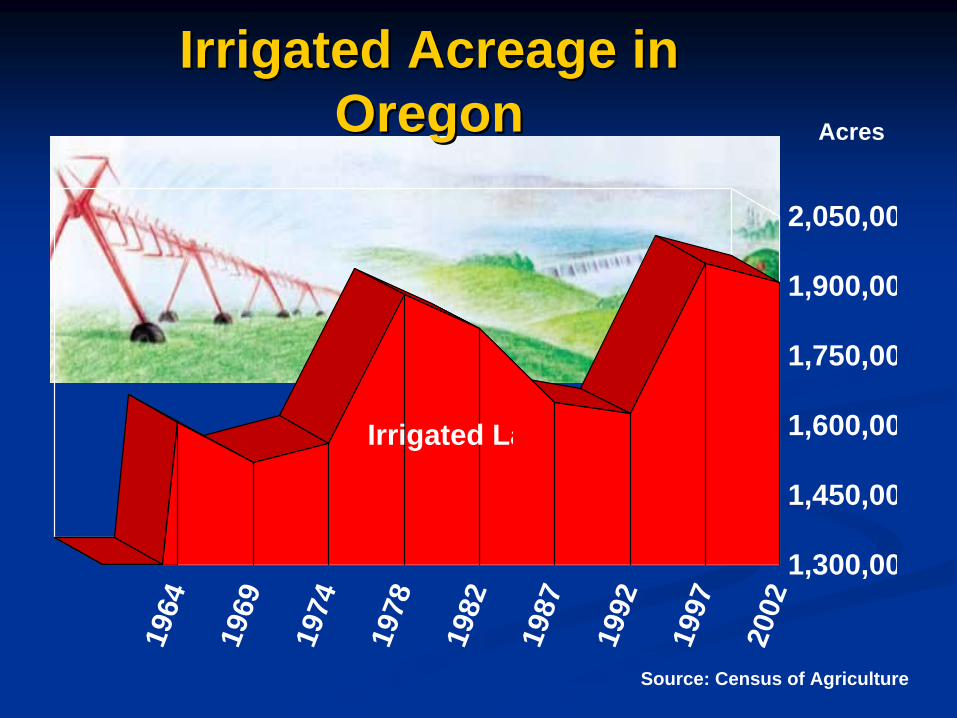
Irrigated La
1,300,00
1,450,00
1,600,00
1,750,00
1,900,00
2,050,00
2002
1997
1992
1987
1982
1978
1974
1969
1964
Irrigated Acreage in Irrigated Acreage in OregonOregon
Source: Census of Agriculture
Acres
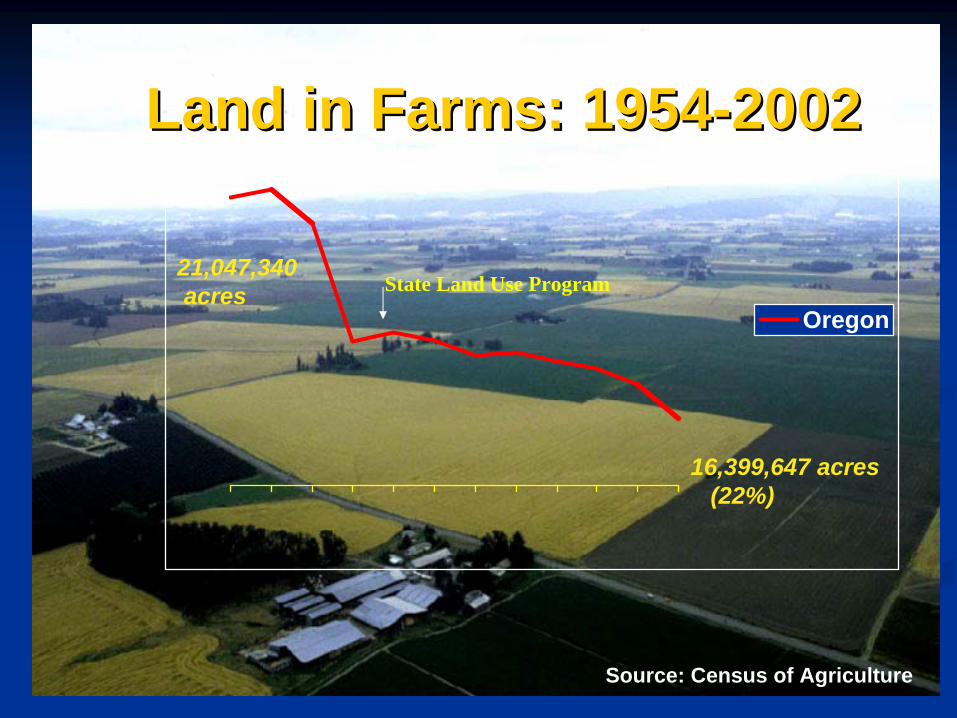
Land in Farms: 1954Land in Farms: 1954--20022002
Oregon
21,047,340acres
16,399,647 acres(22%)
Source: Census of Agriculture
State Land Use Program


Sustainability of the ag land base?Sustainability of the ag land base?
Population Growth and Ag Land in Oregon
0
500,000
1,000,000
1,500,000
2,000,000
2,500,000
3,000,000
3,500,000
4,000,000
1960 1970 1980 1990 2000 2004 2010
Popu
latio
n
15,000,000
16,000,000
17,000,000
18,000,000
19,000,000
20,000,000
21,000,000
Acr
es in
Far
m U
se
population Land in Ag Use
1 million acres of ag land is lost to development every year in the US. Oregon’s land use system helps slow the loss of farmland.

Costs drive trends in farm sizeCosts drive trends in farm size
19851985: a farm could support a family with : a farm could support a family with gross sales of about gross sales of about $80,000$80,000
20052005: a farmer must generate a : a farmer must generate a minimum of minimum of $250,000$250,000 in sales to support in sales to support one household and meet all production one household and meet all production expenses.expenses.
Source: USDA Economic Research ServiceSource: USDA Economic Research Service

Who are OregonWho are Oregon’’s Producers? s Producers? (They are all Family Farms)(They are all Family Farms)
Sales of less than $10,000.Sales of less than $10,000. 69% of Oregon farms. 69% of Oregon farms.
62% of farms are less than 50 acres. Lots of 62% of farms are less than 50 acres. Lots of partpart--time, hobby, and lifetime, hobby, and life--style farms. style farms. Produce less than 2% of total output.Produce less than 2% of total output. Control about 13% of farm acres. Control about 13% of farm acres.
PartPart--timers/Lifetimers/Life--style style -- 27,600 operations27,600 operations

Who are OregonWho are Oregon’’s Producers? s Producers? (They are all Family Farms)(They are all Family Farms)
Sales between $10,000 Sales between $10,000 -- $250,000. $250,000.
Work offWork off--farm to support household. Squeezed farm to support household. Squeezed by costs and not enough volume. by costs and not enough volume. 25% of farms.25% of farms. Control 45% of acres.Control 45% of acres. Produce 18% of output.Produce 18% of output.
Straddlers Straddlers -- 10,000 operations10,000 operations
QuickTime™ and aTIFF (LZW) decompressor
are needed to see this picture.

Who are OregonWho are Oregon’’s Producers? s Producers? (They are all Family Farms)(They are all Family Farms)
Sales of $250,000 or more.Sales of $250,000 or more. 6% of all farms.6% of all farms. Manage 42% of all farm acreage.Manage 42% of all farm acreage.
Produce 80% of OregonProduce 80% of Oregon’’s agricultural s agricultural production.production.
FullFull--time Operators time Operators -- 2,250 operations2,250 operations
Does Farm Size Matter?Does Farm Size Matter?
QuickTime™ and aTIFF (LZW) decompressor
are needed to see this picture.
•Total number of farms in 2006 decreases from 40,000 to 39,300.
• From a high of 26,800 operations in 2003, the number of Oregon micro-farms with annual sales less than $10,000 has decreased to 25,200 this past year (64%).
• The number of mid-size operations with annual sales between $10,000 and $250,000 increased by 400 to 11,300 (29%).
• The number of larger operations with annual sales over $250,000 has increased by 500 to 2800 (7%).


Protection: RegulationsProtection: Regulations Key Tools Key Tools
Exclusive Farm Use Exclusive Farm Use ZoningZoning
Urban Growth BoundariesUrban Growth Boundaries
Rural Level of ServicesRural Level of Services
Special Taxation ProgramSpecial Taxation Program
““Right to FarmRight to Farm”” lawslaws

Exclusive Farm Use ZoningExclusive Farm Use Zoning
Dwelling standardsDwelling standards
Number of nonfarm usesNumber of nonfarm uses
““Conditional useConditional use”” criteriacriteria
Siting standardsSiting standards
Issues
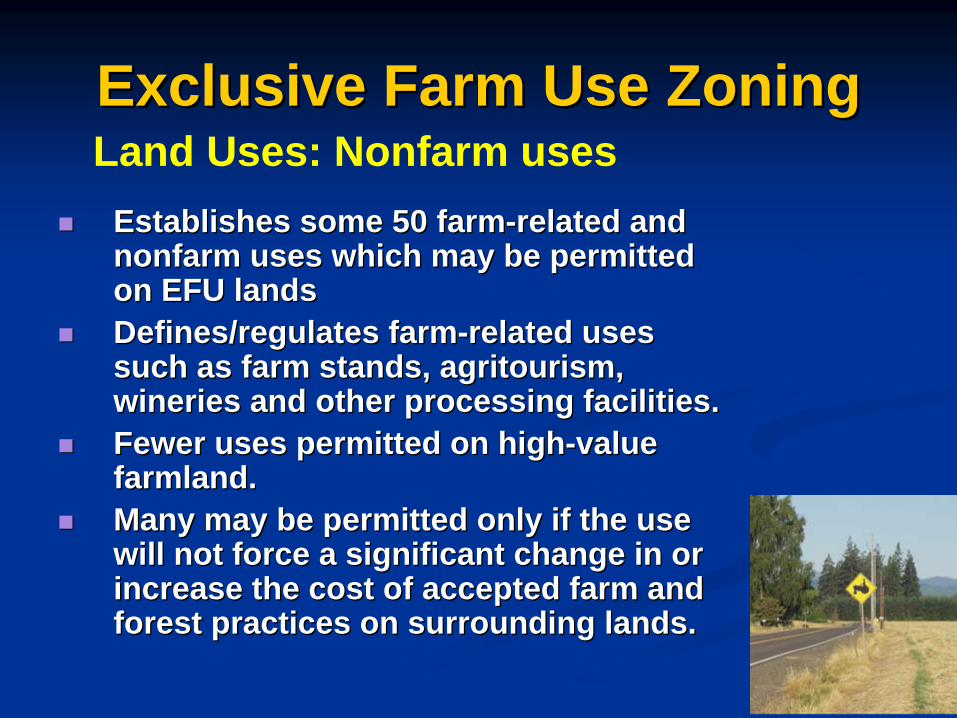
Exclusive Farm Use ZoningExclusive Farm Use Zoning
Establishes some 50 farmEstablishes some 50 farm--related and related and nonfarm uses which may be permitted nonfarm uses which may be permitted on EFU landson EFU lands
Defines/regulates farmDefines/regulates farm--related uses related uses such as farm stands, agritourism, such as farm stands, agritourism, wineries and other processing facilities. wineries and other processing facilities.
Fewer uses permitted on highFewer uses permitted on high--value value farmland.farmland.
Many may be permitted only if the use Many may be permitted only if the use will not force a significant change in or will not force a significant change in or increase the cost of accepted farm and increase the cost of accepted farm and forest practices on surrounding lands.forest practices on surrounding lands.
Land Uses: Nonfarm uses
Property TaxationProperty Taxation
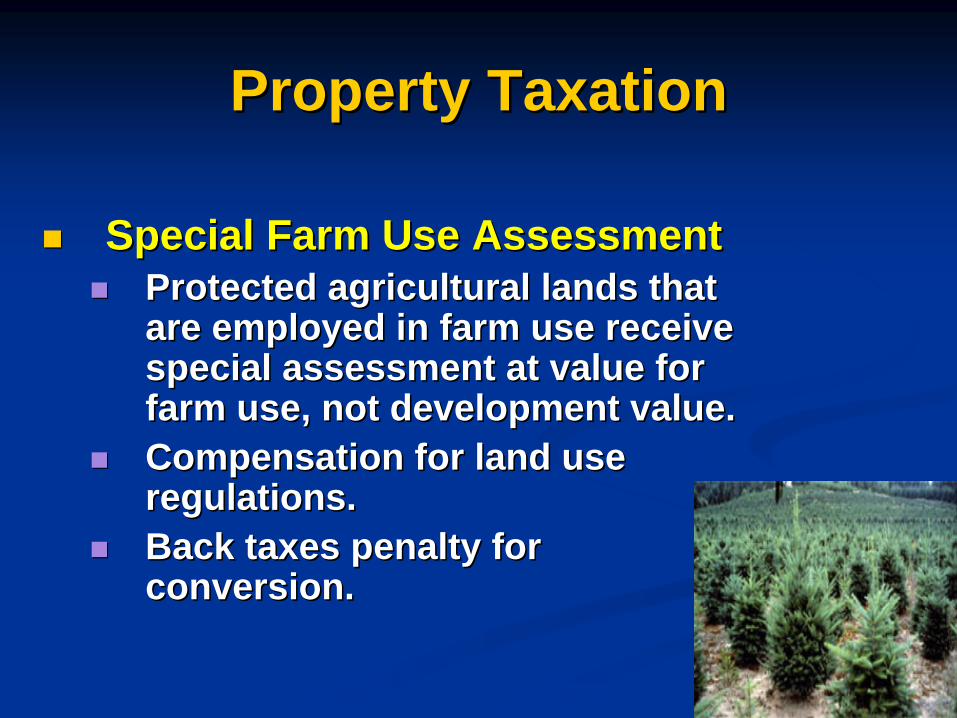
Special Farm Use AssessmentSpecial Farm Use Assessment
Protected agricultural lands that Protected agricultural lands that are employed in farm use receive are employed in farm use receive special assessment at value for special assessment at value for farm use, not development value.farm use, not development value.
Compensation for land use Compensation for land use regulations.regulations.
Back taxes penalty for Back taxes penalty for conversion.conversion.
““Right to FarmRight to Farm””
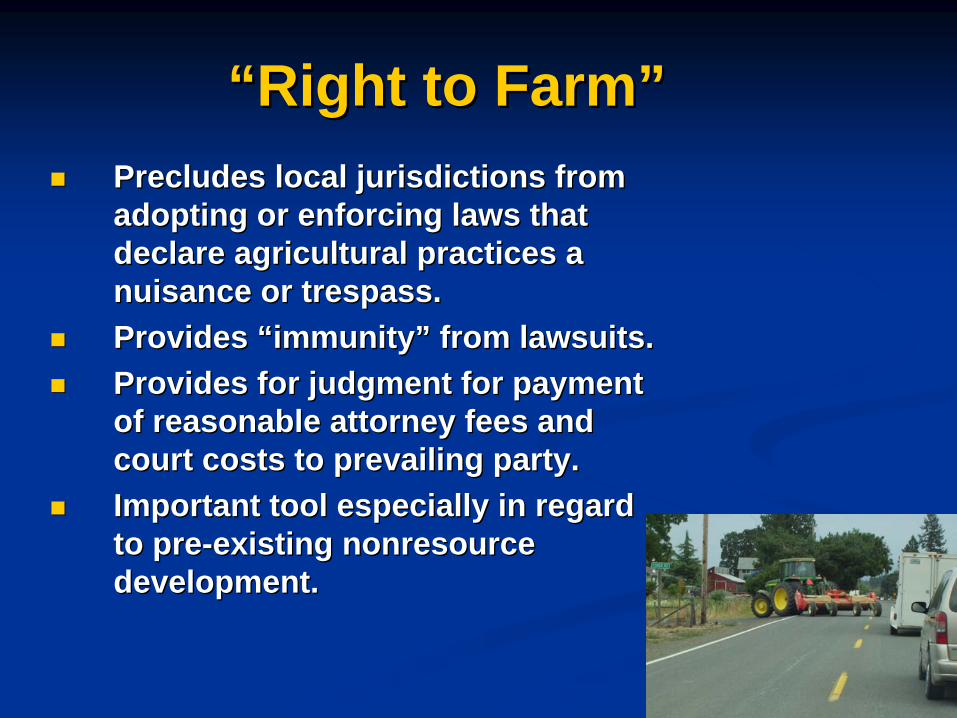
Precludes local jurisdictions from Precludes local jurisdictions from adopting or enforcing laws that adopting or enforcing laws that declare agricultural practices a declare agricultural practices a nuisance or trespass.nuisance or trespass.
Provides Provides ““immunityimmunity”” from lawsuits.from lawsuits.
Provides for judgment for payment Provides for judgment for payment of reasonable attorney fees and of reasonable attorney fees and court costs to prevailing party. court costs to prevailing party.
Important tool especially in regard Important tool especially in regard to preto pre--existing nonresource existing nonresource development.development.

Right to Farm: ApplicabilityRight to Farm: Applicability
Lands zoned for farm or forest use.Lands zoned for farm or forest use.
Preexisting/nonconforming uses.Preexisting/nonconforming uses.
Commercial production.Commercial production.
Is or may be used on a farm of a similar Is or may be used on a farm of a similar nature.nature.
Generally accepted, reason and prudent Generally accepted, reason and prudent practice.practice.
Complies with applicable laws.Complies with applicable laws.
Specifically discusses the transport or Specifically discusses the transport or movement of equipment, vehicle, movement of equipment, vehicle, livestock, etc. on a public road as farm livestock, etc. on a public road as farm use protected.use protected.

Right to Farm IssuesRight to Farm Issues
Does not prevent a suit from being filed.Does not prevent a suit from being filed.
Does not preclude a jurisdiction from Does not preclude a jurisdiction from regulating farm use.regulating farm use.
Involves interpretation.Involves interpretation.
Does not protect from offDoes not protect from off--site conflicts.site conflicts.
LegalityLegality

Agricultural Land Agricultural Land ConversionConversion 19821982--19971997
OregonOregon 144,300 acres144,300 acres
Willamette BasinWillamette Basin 72,400 acres72,400 acres 50%50%
S. Oregon/CoastalS. Oregon/Coastal 22,400 acres22,400 acres 16%16%
Middle ColumbiaMiddle Columbia 17,000 acres17,000 acres 12%12%
Deschutes BasinDeschutes Basin 13,300 acres13,300 acres 9%9%
Rest of stateRest of state 19,200 acres19,200 acres 13%13%
Metro AreaMetro Area 31,400 acres31,400 acres 21.8%21.8%43.4% of Willamette Basin total43.4% of Willamette Basin total
Source: National Resources InventorySource: National Resources InventoryUSDA Natural Resources Conservation ServiceUSDA Natural Resources Conservation Service

Conversion of Agricultural Lands: Conversion of Agricultural Lands: ““PlannedPlanned”” 19821982--19971997
Oregon: 144,300 acresOregon: 144,300 acres
60,900 acres within UGBs60,900 acres within UGBs
35,000 acres within rural 35,000 acres within rural development zones.development zones.
48,400 acres in resource 48,400 acres in resource land zonesland zones
67% of total conversions 67% of total conversions involve areas planned for involve areas planned for development. development.
Source: National Resources Inventory, USDA Natural Resources Conservation Service
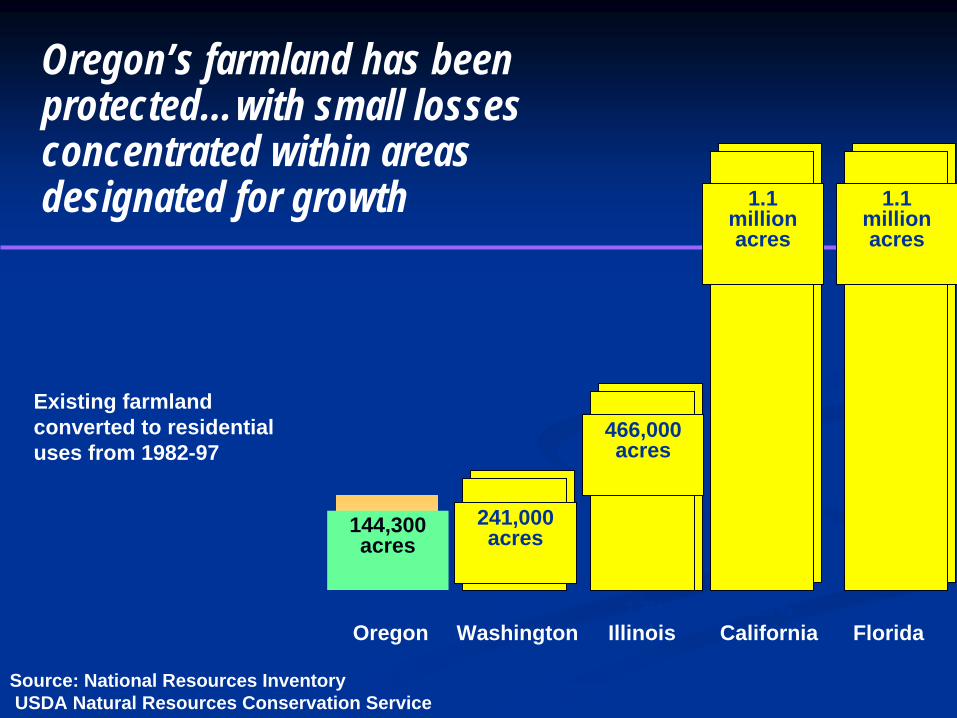
Oregon’s farmland has been protected…with small losses concentrated within areas designated for growth
1.0% 1.6% 3.7%1.7% 8.6%Oregon Washington CaliforniaIllinois Florida
144,300acres
241,000acres
466,000acres
1.1 millionacres
Existing farmland converted to residential uses from 1982-97
1.1 millionacres
Source: National Resources InventoryUSDA Natural Resources Conservation Service
