oregon tim quarterly performance measures report...tim training in 2018; if each of our tim trainers...
TRANSCRIPT
1
Oregon TIM Quarterly Performance Measures Report
Performance Measures for 2017
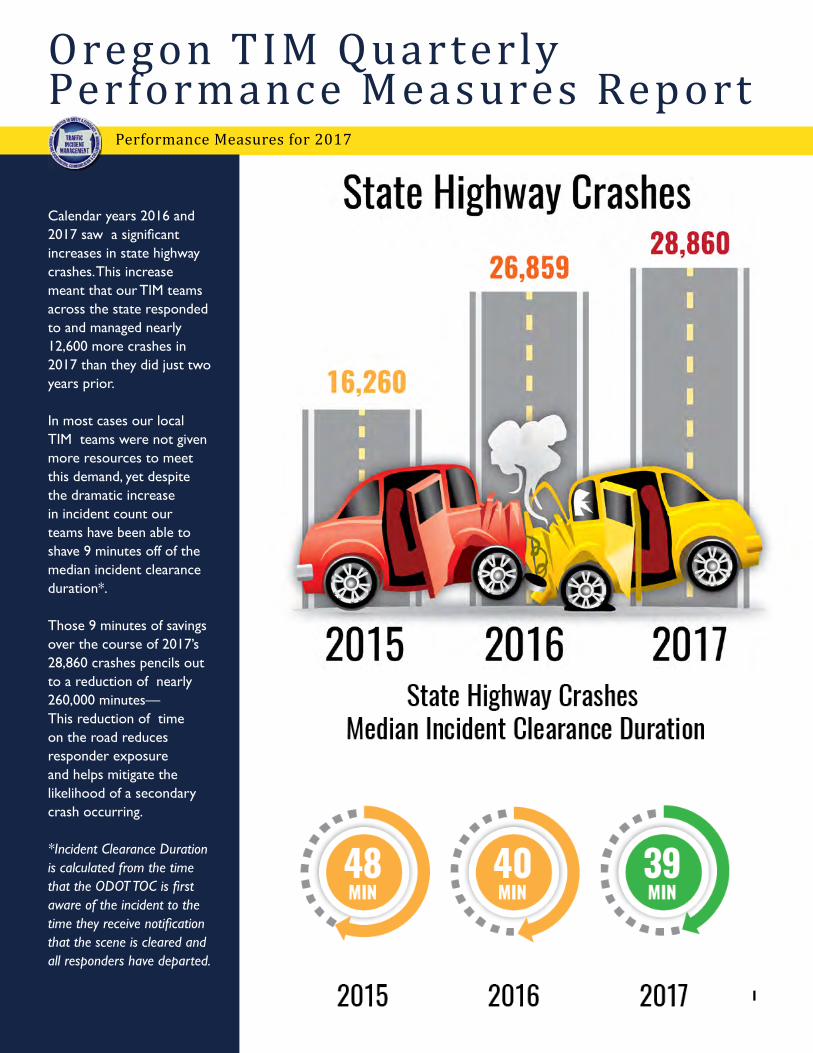
Calendar years 2016 and 2017 saw a significant increases in state highway crashes. This increase meant that our TIM teams across the state responded to and managed nearly 12,600 more crashes in 2017 than they did just two years prior.
In most cases our local TIM teams were not given more resources to meet this demand, yet despite the dramatic increase in incident count our teams have been able to shave 9 minutes off of the median incident clearance duration*.
Those 9 minutes of savings over the course of 2017’s 28,860 crashes pencils out to a reduction of nearly 260,000 minutes—This reduction of time on the road reduces responder exposure and helps mitigate the likelihood of a secondary crash occurring.
*Incident Clearance Duration is calculated from the time that the ODOT TOC is first aware of the incident to the time they receive notification that the scene is cleared and all responders have departed.
2
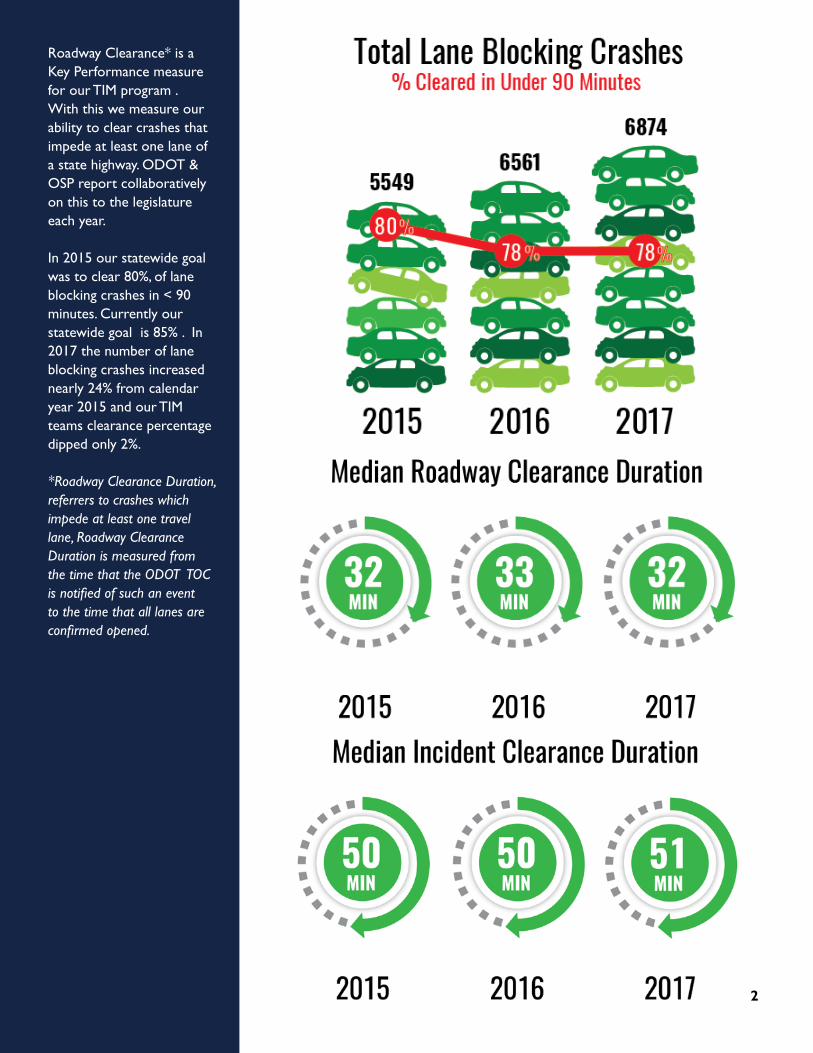
Roadway Clearance* is a Key Performance measure for our TIM program . With this we measure our ability to clear crashes that impede at least one lane of a state highway. ODOT & OSP report collaboratively on this to the legislature each year.
In 2015 our statewide goal was to clear 80%, of lane blocking crashes in < 90 minutes. Currently our statewide goal is 85% . In 2017 the number of lane blocking crashes increased nearly 24% from calendar year 2015 and our TIM teams clearance percentage dipped only 2%.
*Roadway Clearance Duration, referrers to crashes which impede at least one travel lane, Roadway Clearance Duration is measured from the time that the ODOT TOC is notified of such an event to the time that all lanes are confirmed opened.
3
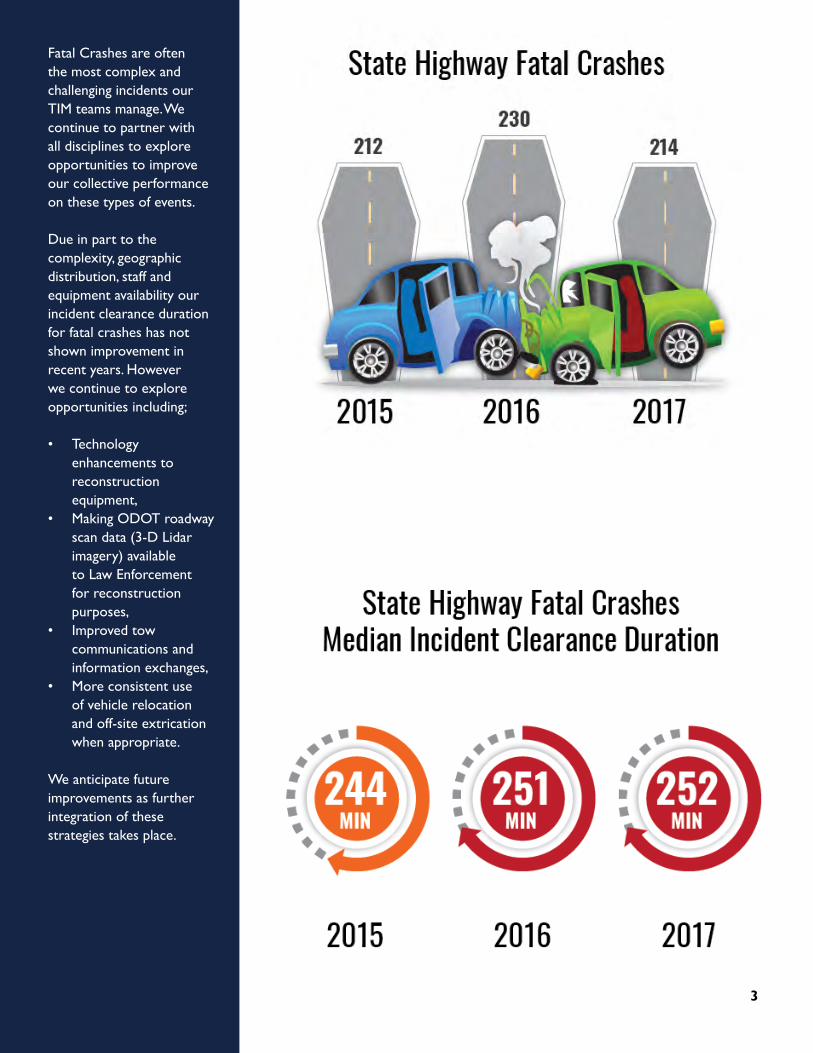
Fatal Crashes are often the most complex and challenging incidents our TIM teams manage. We continue to partner with all disciplines to explore opportunities to improve our collective performance on these types of events.
Due in part to the complexity, geographic distribution, staff and equipment availability our incident clearance duration for fatal crashes has not shown improvement in recent years. However we continue to explore opportunities including;
• Technology enhancements to reconstruction equipment,
• Making ODOT roadway scan data (3-D Lidar imagery) available to Law Enforcement for reconstruction purposes,
• Improved tow communications and information exchanges,
• More consistent use of vehicle relocation and off-site extrication when appropriate.
We anticipate future improvements as further integration of these strategies takes place.
4
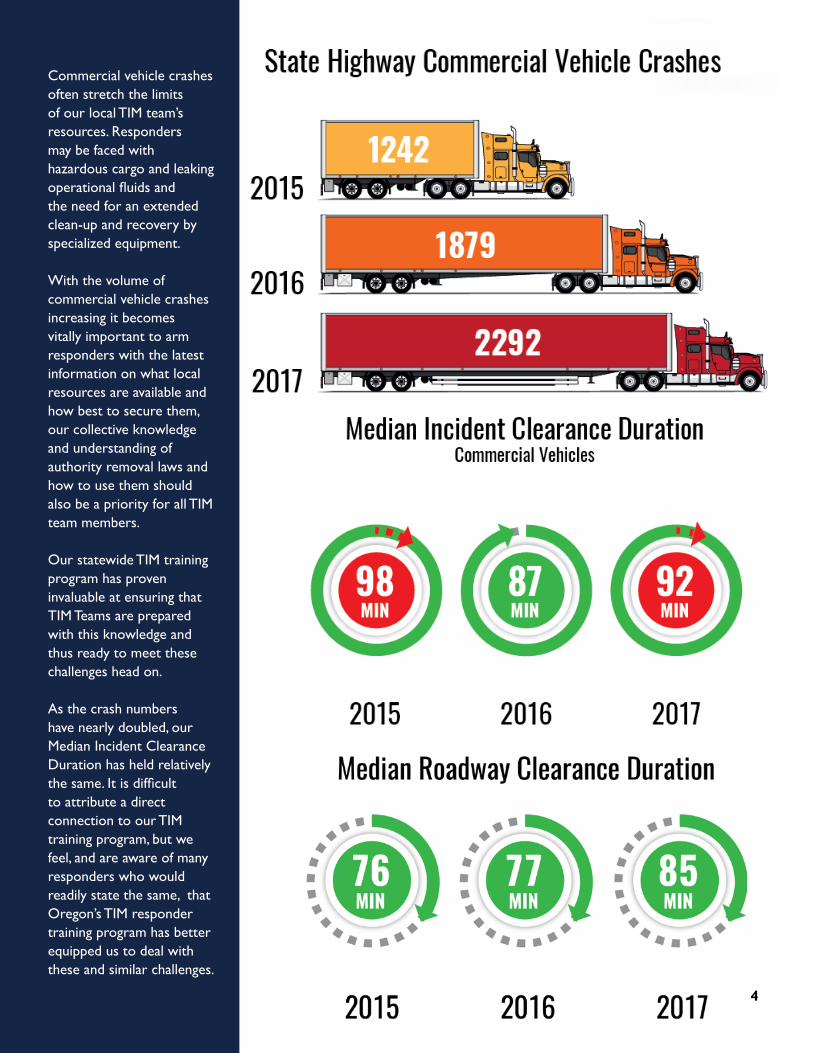
Commercial vehicle crashes often stretch the limits of our local TIM team’s resources. Responders may be faced with hazardous cargo and leaking operational fluids and the need for an extended clean-up and recovery by specialized equipment.
With the volume of commercial vehicle crashes increasing it becomes vitally important to arm responders with the latest information on what local resources are available and how best to secure them, our collective knowledge and understanding of authority removal laws and how to use them should also be a priority for all TIM team members.
Our statewide TIM training program has proven invaluable at ensuring that TIM Teams are prepared with this knowledge and thus ready to meet these challenges head on.
As the crash numbers have nearly doubled, our Median Incident Clearance Duration has held relatively the same. It is difficult to attribute a direct connection to our TIM training program, but we feel, and are aware of many responders who would readily state the same, that Oregon’s TIM responder training program has better equipped us to deal with these and similar challenges.
5
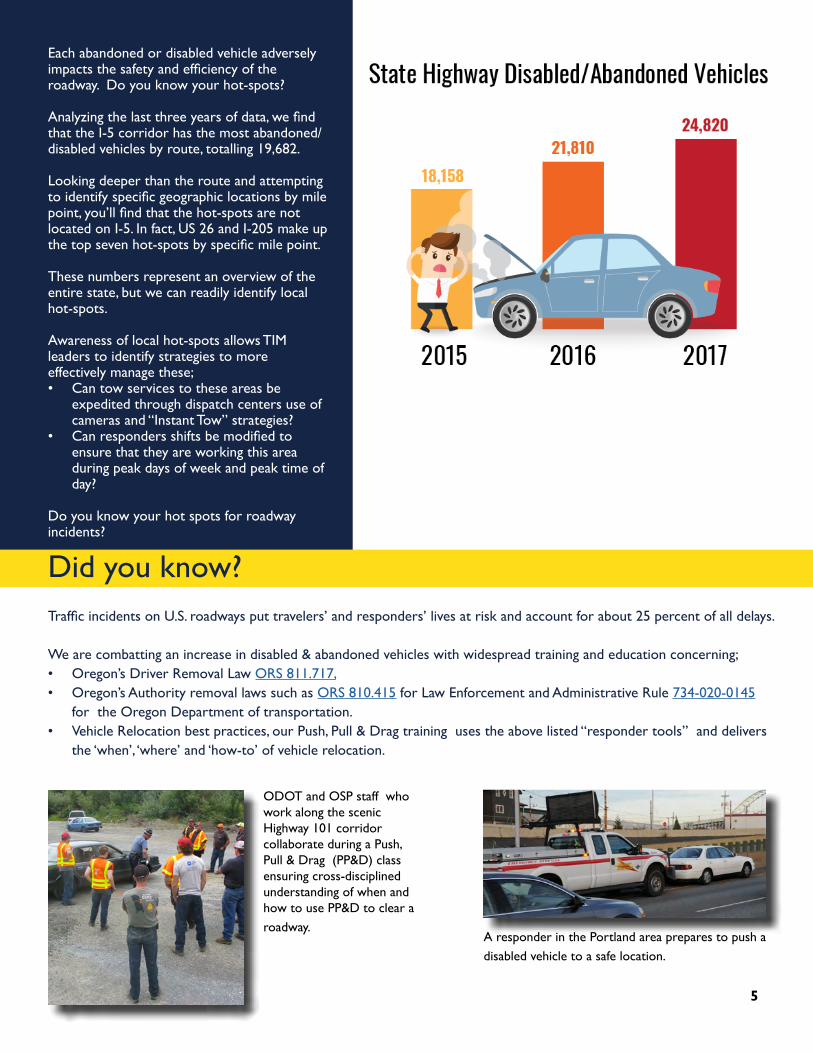
Each abandoned or disabled vehicle adversely impacts the safety and efficiency of the roadway. Do you know your hot-spots?
Analyzing the last three years of data, we find that the I-5 corridor has the most abandoned/disabled vehicles by route, totalling 19,682.
Looking deeper than the route and attempting to identify specific geographic locations by mile point, you’ll find that the hot-spots are not located on I-5. In fact, US 26 and I-205 make up the top seven hot-spots by specific mile point.
These numbers represent an overview of the entire state, but we can readily identify local hot-spots.
Awareness of local hot-spots allows TIM leaders to identify strategies to more effectively manage these; • Can tow services to these areas be
expedited through dispatch centers use of cameras and “Instant Tow” strategies?
• Can responders shifts be modified to ensure that they are working this area during peak days of week and peak time of day?
Do you know your hot spots for roadway incidents?
ODOT and OSP staff who work along the scenic Highway 101 corridor collaborate during a Push, Pull & Drag (PP&D) class ensuring cross-disciplined understanding of when and how to use PP&D to clear a roadway.
A responder in the Portland area prepares to push a disabled vehicle to a safe location.
Did you know?
Traffic incidents on U.S. roadways put travelers’ and responders’ lives at risk and account for about 25 percent of all delays.
We are combatting an increase in disabled & abandoned vehicles with widespread training and education concerning;• Oregon’s Driver Removal Law ORS 811.717, • Oregon’s Authority removal laws such as ORS 810.415 for Law Enforcement and Administrative Rule 734-020-0145
for the Oregon Department of transportation.• Vehicle Relocation best practices, our Push, Pull & Drag training uses the above listed “responder tools” and delivers
the ‘when’, ‘where’ and ‘how-to’ of vehicle relocation.
6
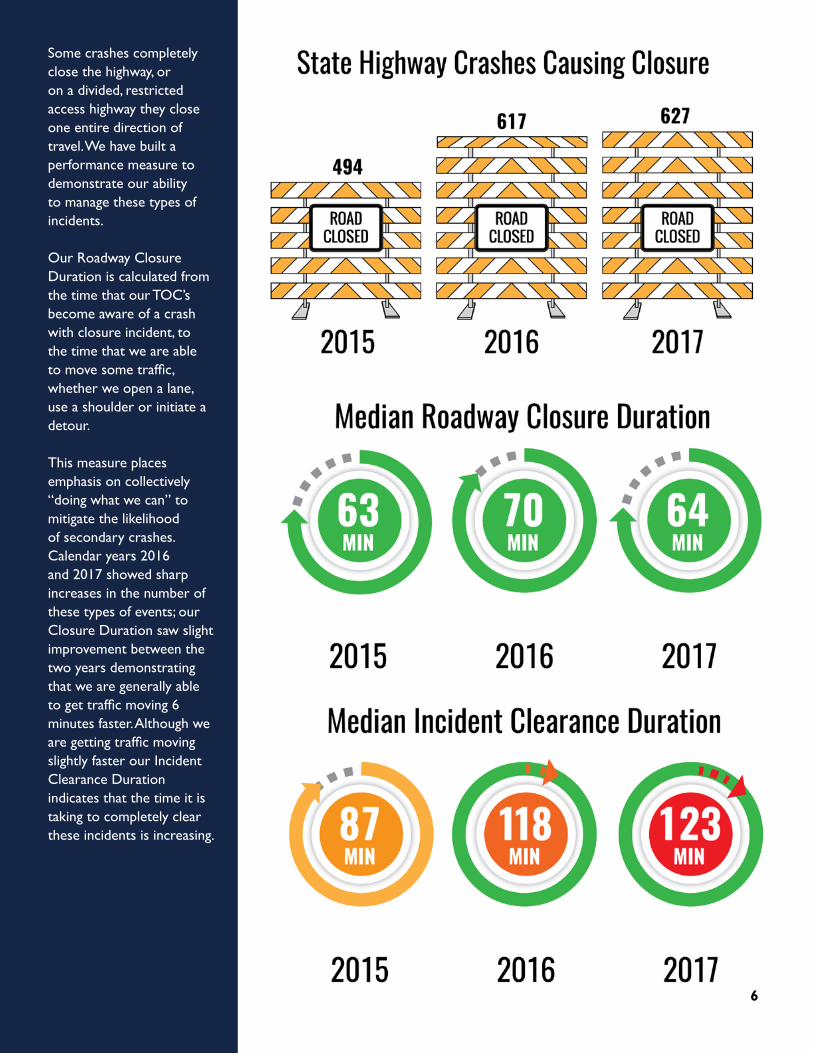
Some crashes completely close the highway, or on a divided, restricted access highway they close one entire direction of travel. We have built a performance measure to demonstrate our ability to manage these types of incidents.
Our Roadway Closure Duration is calculated from the time that our TOC’s become aware of a crash with closure incident, to the time that we are able to move some traffic, whether we open a lane, use a shoulder or initiate a detour.
This measure places emphasis on collectively “doing what we can” to mitigate the likelihood of secondary crashes. Calendar years 2016 and 2017 showed sharp increases in the number of these types of events; our Closure Duration saw slight improvement between the two years demonstrating that we are generally able to get traffic moving 6 minutes faster. Although we are getting traffic moving slightly faster our Incident Clearance Duration indicates that the time it is taking to completely clear these incidents is increasing.
7
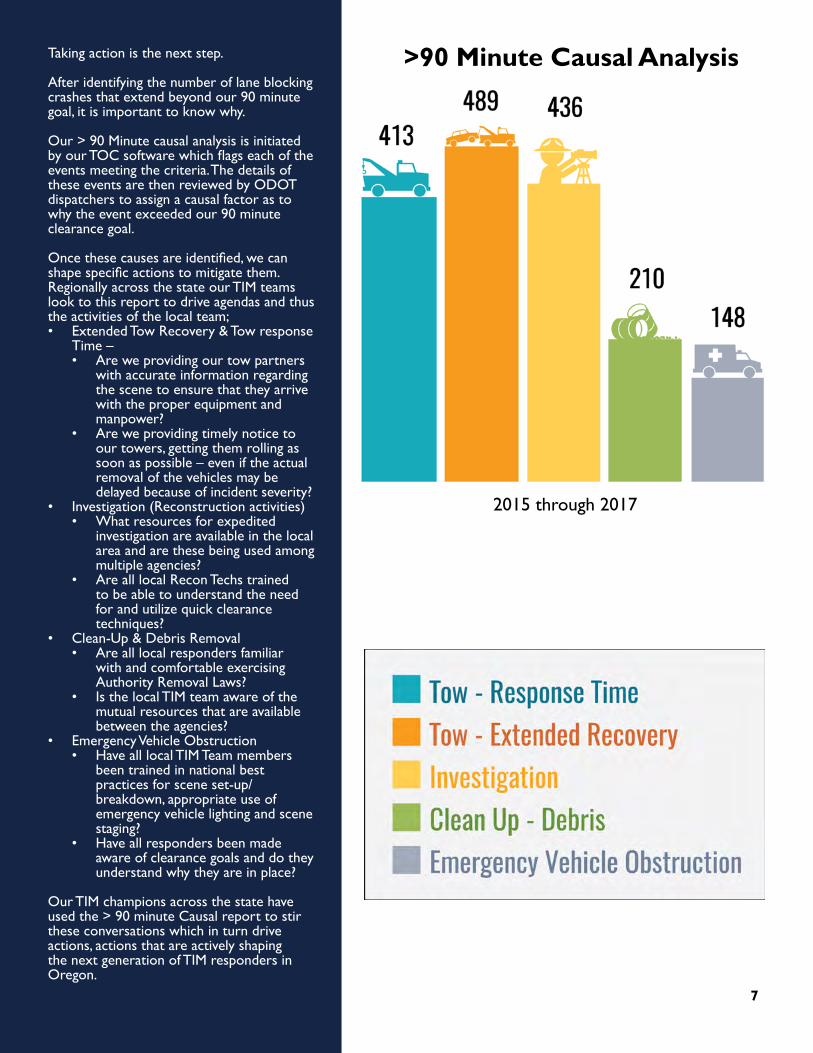
Taking action is the next step.
After identifying the number of lane blocking crashes that extend beyond our 90 minute goal, it is important to know why.
Our > 90 Minute causal analysis is initiated by our TOC software which flags each of the events meeting the criteria. The details of these events are then reviewed by ODOT dispatchers to assign a causal factor as to why the event exceeded our 90 minute clearance goal.
Once these causes are identified, we can shape specific actions to mitigate them. Regionally across the state our TIM teams look to this report to drive agendas and thus the activities of the local team; • Extended Tow Recovery & Tow response
Time – • Are we providing our tow partners
with accurate information regarding the scene to ensure that they arrive with the proper equipment and manpower?
• Are we providing timely notice to our towers, getting them rolling as soon as possible – even if the actual removal of the vehicles may be delayed because of incident severity?
• Investigation (Reconstruction activities)• What resources for expedited
investigation are available in the local area and are these being used among multiple agencies?
• Are all local Recon Techs trained to be able to understand the need for and utilize quick clearance techniques?
• Clean-Up & Debris Removal• Are all local responders familiar
with and comfortable exercising Authority Removal Laws?
• Is the local TIM team aware of the mutual resources that are available between the agencies?
• Emergency Vehicle Obstruction• Have all local TIM Team members
been trained in national best practices for scene set-up/breakdown, appropriate use of emergency vehicle lighting and scene staging?
• Have all responders been made aware of clearance goals and do they understand why they are in place?
Our TIM champions across the state have used the > 90 minute Causal report to stir these conversations which in turn drive actions, actions that are actively shaping the next generation of TIM responders in Oregon.
2015 through 2017
>90 Minute Causal Analysis
8
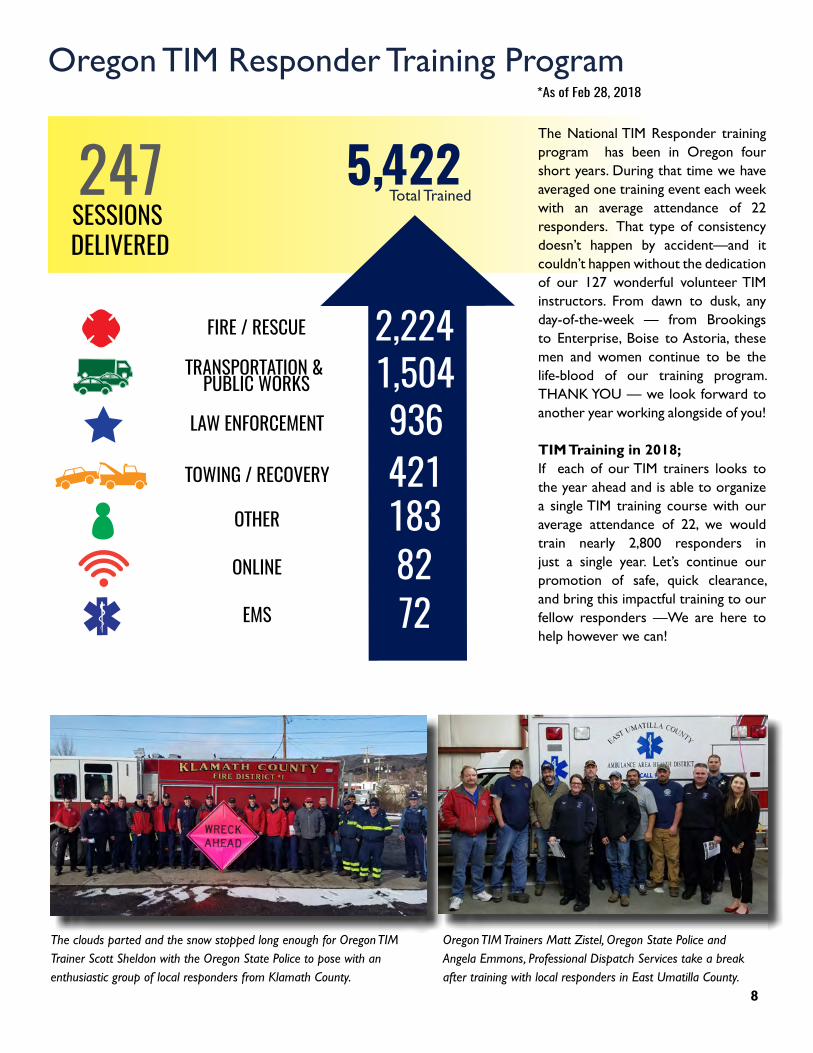
72EMS
82ONLINE
183OTHER
421TOWING / RECOVERY
936LAW ENFORCEMENT
1,504TRANSPORTATION &PUBLIC WORKS
2,224FIRE / RESCUE
247SESSIONS DELIVERED
*As of Feb 28, 2018
5,422
Oregon TIM Trainers Matt Zistel, Oregon State Police and Angela Emmons, Professional Dispatch Services take a break after training with local responders in East Umatilla County.
The clouds parted and the snow stopped long enough for Oregon TIM Trainer Scott Sheldon with the Oregon State Police to pose with an enthusiastic group of local responders from Klamath County.
The National TIM Responder training program has been in Oregon four short years. During that time we have averaged one training event each week with an average attendance of 22 responders. That type of consistency doesn’t happen by accident—and it couldn’t happen without the dedication of our 127 wonderful volunteer TIM instructors. From dawn to dusk, any day-of-the-week — from Brookings to Enterprise, Boise to Astoria, these men and women continue to be the life-blood of our training program. THANK YOU — we look forward to another year working alongside of you!
TIM Training in 2018;If each of our TIM trainers looks to the year ahead and is able to organize a single TIM training course with our average attendance of 22, we would train nearly 2,800 responders in just a single year. Let’s continue our promotion of safe, quick clearance, and bring this impactful training to our fellow responders —We are here to help however we can!
Total Trained
Oregon TIM Responder Training Program