oregon traffic safety performance plan€¦ · administration (fhwa) priority areas such as...
TRANSCRIPT

OREGON TRAFFIC SAFETY
PERFORMANCE PLAN
Fiscal Year 2017
Federal Version Report

ODOT/TSD is an Equal Employment Opportunity and Affirmative Action Employer. We do not discriminate on the basis of disability in admission or access to our programs, services, activities. This publication can be made available in alternate format on request by calling (503) 946-4190 or via the Oregon Relay Service at 7-1-1 or e-mail: [email protected].

OREGON TRAFFIC SAFETY
PERFORMANCE PLAN
Fiscal Year 2017
Federal Version Report
Produced: May 2016
Transportation Safety Division Oregon Department of Transportation 4040 Fairview Industrial Dr. SE, MS 3
Salem, Oregon 97302

Table of Contents Foreword ......................................................................... 1 Document Purpose ......................................................... 3 Process Description ........................................................ 5 Overview of Highway Safety Planning Process ............... 9 Performance Goals ........................................................ 11 Acronyms and Definitions .............................................. 19 Statewide ...................................................................... 21 Bicyclist Safety .............................................................. 25 Community Traffic Safety .............................................. 29 Driver Education ........................................................... 35 Emergency Medical Services (EMS) ............................. 39 Equipment Safety Standards ......................................... 43 Highway Safety Improvement Program (HSIP) ............. 47 Impaired Driving – Alcohol ............................................. 51 Impaired Driving – Drugs................................................ 55 Judicial Outreach .......................................................... 59 Motorcycle Safety.......................................................... 61 Occupant Protection ...................................................... 65 Pedestrian Safety .......................................................... 69 Police Traffic Services ................................................... 73
Evidence Based Traffic Safety Enforcement Plan ................... 74 Region 1 ....................................................................... 77 Region 2 ....................................................................... 83 Region 3 ....................................................................... 87 Region 4 ....................................................................... 93 Region 5 ....................................................................... 97 Roadway Safety .......................................................... 103 Safe & Courteous Driving ............................................ 107 Safe Routes to School ................................................. 111 Speed ......................................................................... 115 Traffic Records ............................................................ 119 Work Zone Safety ....................................................... 123 2017 Anticipated Revenues Summary ........................ 126 2017 Anticipated Revenues by Program Area ............. 127 2017 Project Funding Narratives ................................. 129 Highway Safety Plan ................................................... 153


1
Foreword This report has been prepared to satisfy federal reporting and provide documentation for the 2017 federal grant year.
The 2017 Performance Plan will be presented for approval by the Oregon Transportation Safety Committee (OTSC) on May 10, 2016 and subsequent approval by the Oregon Transportation Commission (OTC) on June 16, 2016. The majority of the projects will occur from October 2016 through September 2017.
The process for identification of problems, establishing performance goals, developing programs and projects is detailed on page 5. A detailed flow chart of the grant program planning process is offered on page 9, Overview of Highway Safety Planning Process.
Each program area page consists of five different parts.
1. A link to the Transportation Safety Action Plan which shows how we are addressing the long range strategies for Oregon.
2. Problem statements are presented for each topical area.
3. Data tables reflect the latest information available and provide previous years’ averages where possible.
4. Goal statements are aimed for the year 2020 and performance measures for 2017.
5. Project summaries are at the end of the document and listed by individual funding source. The dollar amounts provided are federal dollars, with the state/other funding sources contained in brackets.
Throughout the 2017 fiscal year the following funds are expected (financial figures represent the latest grant and match revenues available through April 22, 2016):
Federal funds: $14,256,054 State/local match: [$ 8,555,330] Grand Total $22,811,384
Copies of this report are available and may be requested by contacting the Transportation Safety Division at (503) 986-4190.

2
3
Document Purpose
The purpose of this document is to show the effectiveness of the broad collaboration that takes place in Oregon’s highway safety community. We are also able to show the significant impact our funds, time, and programs will have on the safety of the traveling public.
The plan represents a one-year look at the 2017 program including all of the highway safety funds controlled by the Transportation Safety Division. In addition, every year an Annual Evaluation report is completed that explains what funds were spent and how we fared on our annual performance measures.
We are looking forward to a successful 2017 program where many injuries are avoided and the fatality toll is dramatically reduced. Each and every day our goal is zero fatalities.

4

5
Process Description The following is a summary of the current process by the Transportation Safety Division (TSD) for the planning and implementation of its grant program. The program is based on a complete and detailed problem analysis prior to the selection of projects. A broad spectrum of agencies at state and local levels and special interest groups are involved in project selection and implementation. In addition, grants are awarded to TSD so we can, in turn award contracts to private agencies or, manage multiple mini-grants. Self-awarded TSD grants help us supplement our basic program to provide more effective statewide services involving a variety of agencies and groups working with traffic safety programs that are not eligible for direct grants. Process for Identifying Problems Problem analysis is completed by Transportation Safety Division staff, the Oregon Transportation Safety Committee (OTSC), and involved agencies and groups on January 20 and 21, 2016. HSP development process Organizations and Committees AMR/Safe Kids Association Oregon Counties Bicycle Transportation Alliance City of Lincoln City Clackamas County Dept. of Public Safety Standards and
Training Driver Education Advisory
Committee GAC on DUII
GAC on Motorcycle Safety Multnomah County Circuit Court ODOT DMV ODOT Government Relations ODOT Motor Carrier ODOT Region 2 ODOT Region 3 ODOT Traffic - Roadway ODOT Transportation Data Oregon Association Chiefs of Police Oregon State Police Oregon State Sheriff’s Association Oregon State University Oregon Transportation Safety
Committee Safe Routes to School National
Partnership Washington Traffic Safety Commission

6
A state-level analysis is completed, using the most recent data available (currently 2014 data), to certify that Oregon has the potential to fund projects in various program areas. Motor vehicle crash data, survey results (belt use, helmet use, public perception), and other data on traffic safety problems are analyzed. Program level analysis is included with each of the National Highway Traffic Safety Administration (NHTSA) and Federal Highway Administration (FHWA) priority areas such as impaired driving, safety belts, and police traffic services. This data is directly linked to performance goals and proposed projects for the coming year, and is included in project objectives. Not all of the reviewed data is published in the Performance Plan. A higher number of injury crashes have been reported for the 2011 data file compared to previous years and result from a change to an internal departmental process that allows the Crash Analysis and Reporting Unit to add previously unavailable, non-fatal crash reports to the annual data file. Please be aware, the 2011-13 data will reflect an increase of approximately 15 percent more injury crashes when comparing pre-2011 injury crash statistics. Process for Establishing Performance Goals Performance goals for each program are established by TSD staff, taking into consideration data sources that are reliable, readily available, and reasonable as representing outcomes of the program. Performance measures incorporate elements of the Oregon Benchmarks, Oregon Transportation Safety Action Plan, the Safety Management System, and nationally recognized measures. Both long-range (by the year 2020) and short-range (current year) measures are utilized and updated annually. Oregon uses a minimum of 3, 5, or 8 year history average, then a change rate of 3 percent, plus or minus, to initially propose performance measures. If the 3 percent performance change is deemed unreasonable based on crash data, partner input during planning workshop, and legislative and environmental changes (i.e. legalization of recreational use of marijuana), the 3 percent may be adjusted in the target. This level of change has proven to be effective in prior Highway Safety Plans and is an easy way to forecast what can be expected. This level of change is generally representative of one standard deviation, meaning that the actions taken had an influence on the result outside of just pure chance. The Oregon highway safety community has also embraced this formula and supports the use of 3 percent.
7
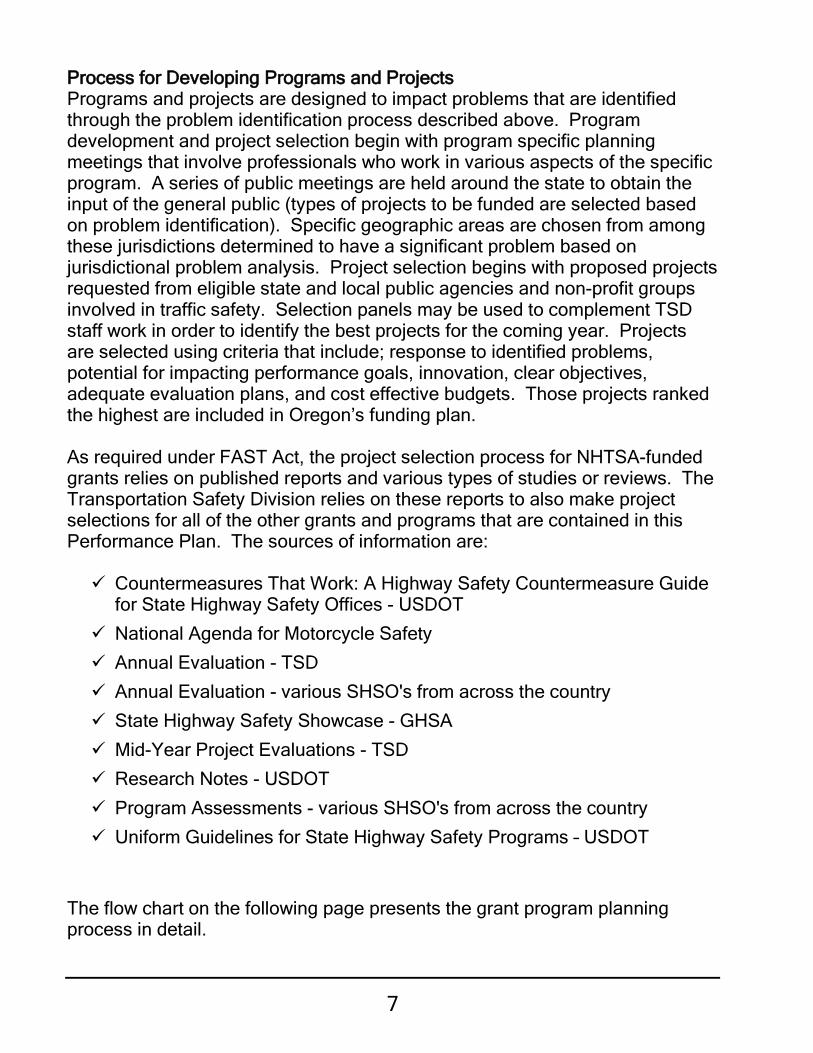
Process for Developing Programs and Projects Programs and projects are designed to impact problems that are identified through the problem identification process described above. Program development and project selection begin with program specific planning meetings that involve professionals who work in various aspects of the specific program. A series of public meetings are held around the state to obtain the input of the general public (types of projects to be funded are selected based on problem identification). Specific geographic areas are chosen from among these jurisdictions determined to have a significant problem based on jurisdictional problem analysis. Project selection begins with proposed projects requested from eligible state and local public agencies and non-profit groups involved in traffic safety. Selection panels may be used to complement TSD staff work in order to identify the best projects for the coming year. Projects are selected using criteria that include; response to identified problems, potential for impacting performance goals, innovation, clear objectives, adequate evaluation plans, and cost effective budgets. Those projects ranked the highest are included in Oregon’s funding plan. As required under FAST Act, the project selection process for NHTSA-funded grants relies on published reports and various types of studies or reviews. The Transportation Safety Division relies on these reports to also make project selections for all of the other grants and programs that are contained in this Performance Plan. The sources of information are: Countermeasures That Work: A Highway Safety Countermeasure Guide
for State Highway Safety Offices - USDOT
National Agenda for Motorcycle Safety
Annual Evaluation - TSD
Annual Evaluation - various SHSO's from across the country
State Highway Safety Showcase - GHSA
Mid-Year Project Evaluations - TSD
Research Notes - USDOT
Program Assessments - various SHSO's from across the country
Uniform Guidelines for State Highway Safety Programs – USDOT
The flow chart on the following page presents the grant program planning process in detail.

8

9
Overview of Highway Safety Planning Process
Time Purpose January Annual Planning Conference to
determine funding distribution and overall direction of program.
February OTSC approval of revenue and multiple committee advice on direction of programs.
March Program area sessions to create specific plans and projects within each program area. Community forums to gather public input.
April Draft Performance Plan created and distributed for review by ODOT, OTSC, GAC MC, GAC DUII, NHTSA, FHWA, and program area experts.
May OTSC (GAC MC and GAC DUII) final review of Performance Plan.
May Final Performance Plan printed and submitted for approvals.
June OTC approval for grants and contracts.
July Final Performance Plan due to NHTSA and FHWA. Formal acknowledgement for NHTSA and FHWA, through Governor.
October Field implementation of grants and contracts.
December Staff debrief of current year’s programs to determine benchmarks.

10

11
Performance Goals This report highlights traffic safety activities during the upcoming federal fiscal year 2017. The data contained in this report reflects the most current data available.
The following performance measures satisfy NHTSA’s required core outcome, behavior and activity measures. This document was approved by the Oregon Transportation Safety Committee, endorsed by the Governor’s Advisory Committees, and these measures were reviewed in January 2016 as part of the 2017 planning process.
Performance Goals and Trends, 2010-2014
2010 2011 2012 2013 2014 3-Year
Average 5-Year
Average Goal
2017 Fatalities 317 331 337 313 357 336 331 306 Serious Traffic Injuries 1,382 1,541 1,619 1,418 1,496 1,511 1,491 1,379 Fatalities/100M VMT 0.94 0.99 1.02 0.93 1.03 0.99 0.98 0.91 Rural Road Fatalities/100M VMT* 1.45 1.48 1.58 1.33 1.76 1.56 1.52 1.34 Urban Road Fatalities/100M VMT* 0.54 0.61 0.58 0.61 0.57 0.59 0.58 0.54 Unrestrained Passenger Vehicle
Occupant
Fatalities, All Seat Positions 52 63 61 54 61 59 58 54 Alcohol Impaired Driving Fatalities
Involving a Driver or Motorcycle Operator with a BAC of .08 and Above 70 96 88 103 100 97 91 77
Speeding-Related Fatalities 97 105 103 95 105 101 101 115 Motorcyclist Fatalities 38 40 51 34 46 44 42 38 Unhelmeted Motorcyclist Fatalities 4 5 4 2 4 3 4 2
Drivers Age 20 or Younger in Fatal Crashes 37 35 40 35 33 36 36 33
Pedestrian Fatalities 56 46 55 48 57 53 52 51 Bicycle Fatalities 7 15 10 3 7 7 8 6 Statewide Observed Seat Belt Use,
Passenger Vehicles, Front Seat Outboard Occupants 97.0% 97.0% 97.0% 98.2% 97.8% 97.7% 97.5% 99.0%
Sources: Crash Analysis and Reporting, Oregon Department of Transportation Fatality Analysis Reporting System, U.S. Department of Transportation Oregon Occupant Protection Observation Study, Intercept Research Corporation
*http://www-nrd.nhtsa.dot.gov/departments/nrd-30/ncsa/STSI/USA%20WEB%20REPORT.HTM
Grant Funded Enforcement, 2011-2015
FFY
2011 FFY
2012 FFY
2013 FFY
2014 FFY
2015
FFY 5-Year
Average Seat Belt Citations Issued During Grant Funded
Enforcement 15,829 10,116 5,096 7,429 5,411 8,776
Impaired Driving Arrests During Grant Funded Enforcement 2,144 1,881 1,390 1,646 1,385 1,689
Speeding Citations Issued During Grant Funded Enforcement 18,902 17,217 12,376 21,732 4,143* 14,874
Sources: TSD Grant files, 2011 - 2015 Note: *Previous years counted all TSD grant program overtime activities (not just speed grant overtime). Starting with 2015, the number
reported counts only speed enforcement grant overtime citation activity.

12
Core Outcome Measures
Traffic Fatalities (C-1) Decrease traffic fatalities from the 2012-2014 average of 336 to 306 by December 31, 2017. (NHTSA)
Serious Traffic Injuries (C-2) Decrease serious traffic injuries from the 2012-2014 average of 1,511 to 1,379 by December 31, 2017.1 (NHTSA)
Fatalities/VMT (C-3) Decrease fatalities per 100 million VMT from the 2012-2014 average of 0.99 to 0.91 by December 31, 2017. (NHTSA)
Rural Fatalities/VMT (C-3) Decrease rural fatalities per 100 million VMT from the 2012-2014 average of 1.56 to 1.42 by December 31, 2017. (NHTSA)
Urban Fatalities/VMT (C-3) Decrease urban fatalities per 100 million VMT from the 2012-2014 average of 0.59 to 0.54 by December 31, 2017. (NHTSA)
Unrestrained Passenger Vehicle Occupant Fatalities (C-4) Decrease unrestrained passenger vehicle occupant fatalities in all seating positions from the 2012-2014 average of 59 to 54 by December 31, 2017. (NHTSA)
Alcohol Impaired Driving Fatalities (C-5) Decrease alcohol impaired driving fatalities from the 2012-2014 average of 97 to 89 by December 31, 2017. (NHTSA) *Note: Alcohol-impaired driving fatalities are all fatalities in crashes involving a driver or motorcycle operator with a BAC of .08 or greater. Speeding Related Fatalities (C-6) Reduce fatalities in speed-related crashes from the 2012-2014 average of 101 to 92 by December 31, 2017. (NHTSA)
Motorcyclist Fatalities (C-7) Decrease motorcyclist fatalities from the 2012-2014 average of 44 to 40 by December 31, 2017. (NHTSA)
Unhelmeted Motorcyclist Fatalities (C-8) Decrease unhelmeted motorcyclist fatalities from the 2012-2014 average of 3 to 2 by December 31, 2017. (NHTSA)
Drivers Age 20 or Younger Involved in Fatal Crashes (C-9) Reduce the number of drivers; age 15-20, involved in fatal crashes from the 2012-2014 average of 36 to 33 by December 31, 2017. (NHTSA)
Pedestrian Fatalities (C-10) Reduce pedestrian fatalities from the 2012-2014 average of 53 to 49 by December 31, 2017. (NHTSA)
Bicycle Fatalities (C-11) Reduce bicyclist fatalities from the 2012-2014 average of 7 to 6 by December 31, 2017. (NHTSA) 1 In 2011 the number of injury and property damage crashes increased due to improved reporting procedures and improved data capture.

13
Core Behavior Measure
Seat Belt Use Rate (B-1) Increase statewide observed seat belt use among front seat outboard occupants in passenger vehicles, as determined by the NHTSA compliant survey, from the 2015 usage rate of 95 percent to 97 percent by December 31, 2017. (NHTSA)
Activity Measures
Seat Belt Citations (A-1) Number of Seat Belt citations issued during grant-funded enforcement activities. (NHTSA)
Impaired Driving Arrests (A-2) Number of Impaired Driving arrests during grant-funded enforcement activities. (NHTSA)
Speeding Citations (A-3) Number of Speeding citations issued during grant-funded enforcement activities. (NHTSA)
2017 Performance Report
The following is a performance report outlining ODOT-TSD’s progress on the current NHTSA tagets.
Core Measure Description
2015 Target* Status Comments
C-1 Number of Fatalities
306
The 2014 number of traffic fatalities is: 357
The 2012-2014 average is: 336
C-2 Number of Serious Injuries
1,382 The 2014 preliminary number of Serious Injuries is:
1,496
The preliminary 2012-2014 average is:
1,511
C-3 Fatalities/VMT 0.91 The 2014 Fatality Rate is: 1.03
The 2012-2014 average is: 0.99
C-4 Unrestrained Passenger Vehicle Fatalities
54 The 2014 number of Unrestrained Passenger Vehicle Fatalities is:
61
The 2012-2014 average is: 59
C-5 Alcohol-Impaired Fatalities
89 The 2014 number of Alcohol-Related Fatalities is:
100
The 2012-2014 average is: 97
C-6 Speed-Related Fatalities
92 The 2014 number of Speed-Related Fatalities is:
105
The 2012-2014 average is: 101
C-7 Motorcyclist Fatalities
40 The 2014 number of Motorcyclist Fatalities is:
46
The 2012-2014 average is: 44
C-8 Un-helmeted MC Fatalities
2 The 2014 number of Un-helmeted MC Fatalities is:
4
The 2012-2014 average is: 3
C-9 Drivers Age 20 or Younger Involved in Fatal Crashes
33 The 2014 number of Drivers Age 20 or Younger Involved in Fatal Crashes is:
33
The 2012-2014 average is: 36
C-10 Pedestrian Fatalities
49 The 2014 number of Pedestrian Fatalities is:
57
The 2012-2014 average is: 53
C-11 Bicycle Fatalities 6 The 2014 number Bicycle Fatalities is: The 2012-2014 average is:
14
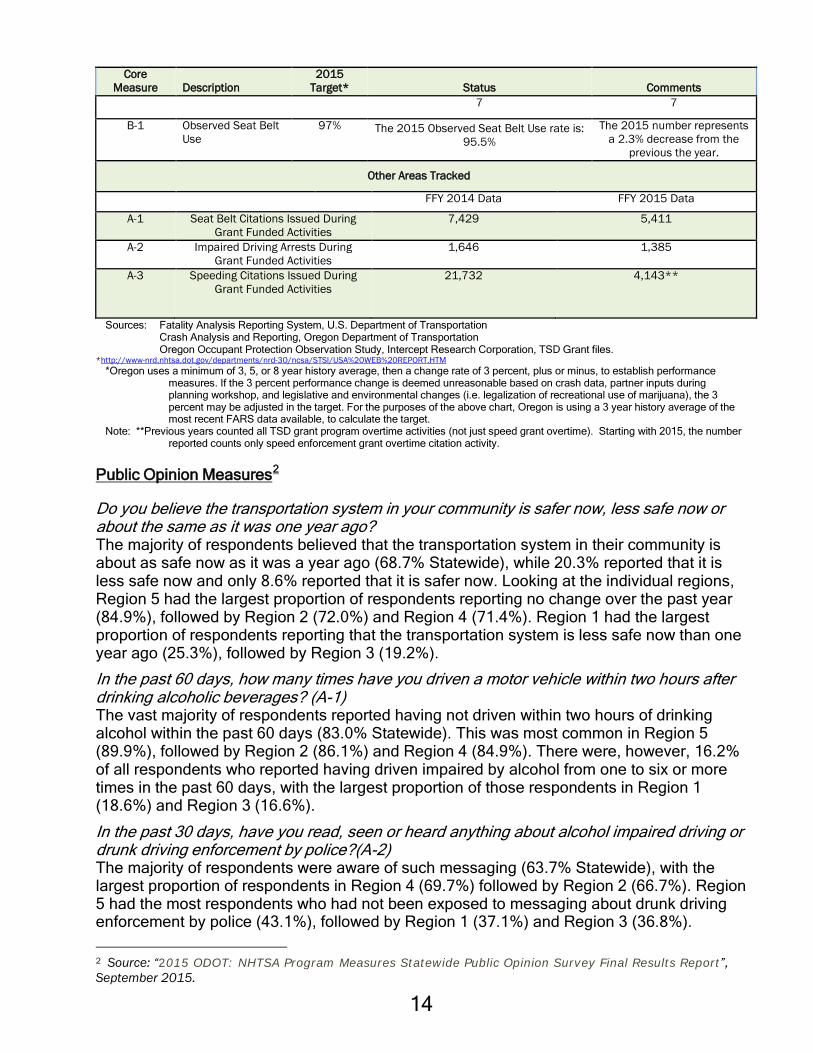
Core Measure Description
2015 Target* Status Comments
7 7
B-1 Observed Seat Belt Use
97% The 2015 Observed Seat Belt Use rate is: 95.5%
The 2015 number represents a 2.3% decrease from the
previous the year.
Other Areas Tracked
FFY 2014 Data FFY 2015 Data
A-1 Seat Belt Citations Issued During Grant Funded Activities
7,429 5,411
A-2 Impaired Driving Arrests During Grant Funded Activities
1,646 1,385
A-3 Speeding Citations Issued During Grant Funded Activities
21,732 4,143**
Sources: Fatality Analysis Reporting System, U.S. Department of Transportation Crash Analysis and Reporting, Oregon Department of Transportation Oregon Occupant Protection Observation Study, Intercept Research Corporation, TSD Grant files.
*http://www-nrd.nhtsa.dot.gov/departments/nrd-30/ncsa/STSI/USA%20WEB%20REPORT.HTM *Oregon uses a minimum of 3, 5, or 8 year history average, then a change rate of 3 percent, plus or minus, to establish performance
measures. If the 3 percent performance change is deemed unreasonable based on crash data, partner inputs during planning workshop, and legislative and environmental changes (i.e. legalization of recreational use of marijuana), the 3 percent may be adjusted in the target. For the purposes of the above chart, Oregon is using a 3 year history average of the most recent FARS data available, to calculate the target.
Note: **Previous years counted all TSD grant program overtime activities (not just speed grant overtime). Starting with 2015, the number reported counts only speed enforcement grant overtime citation activity.
Public Opinion Measures2
Do you believe the transportation system in your community is safer now, less safe now or about the same as it was one year ago? The majority of respondents believed that the transportation system in their community is about as safe now as it was a year ago (68.7% Statewide), while 20.3% reported that it is less safe now and only 8.6% reported that it is safer now. Looking at the individual regions, Region 5 had the largest proportion of respondents reporting no change over the past year (84.9%), followed by Region 2 (72.0%) and Region 4 (71.4%). Region 1 had the largest proportion of respondents reporting that the transportation system is less safe now than one year ago (25.3%), followed by Region 3 (19.2%).
In the past 60 days, how many times have you driven a motor vehicle within two hours after drinking alcoholic beverages? (A-1) The vast majority of respondents reported having not driven within two hours of drinking alcohol within the past 60 days (83.0% Statewide). This was most common in Region 5 (89.9%), followed by Region 2 (86.1%) and Region 4 (84.9%). There were, however, 16.2% of all respondents who reported having driven impaired by alcohol from one to six or more times in the past 60 days, with the largest proportion of those respondents in Region 1 (18.6%) and Region 3 (16.6%).
In the past 30 days, have you read, seen or heard anything about alcohol impaired driving or drunk driving enforcement by police?(A-2) The majority of respondents were aware of such messaging (63.7% Statewide), with the largest proportion of respondents in Region 4 (69.7%) followed by Region 2 (66.7%). Region 5 had the most respondents who had not been exposed to messaging about drunk driving enforcement by police (43.1%), followed by Region 1 (37.1%) and Region 3 (36.8%). 2 Source: “2015 ODOT: NHTSA Program Measures Statewide Public Opinion Survey Final Results Report”, September 2015.

15
Where did you see or hear these messages? Of the respondents who reported having recently read, seen, or heard anything about alcohol-impaired driving or drunk driving enforcement by police, the most common source of those messages was TV, both Statewide (63.8%) and across all five regions (53.7% to 69.0%). The second most common source of drunk driving enforcement messaging varied from radio Statewide (21.7%) and in Region 4 (38.0%), to newspapers in Region 2 (23.2%), Region 3 (25.8%) and Region 5 (40.2%), to billboards and outdoor signs in Region 1 (20.8%).
Based on anything you know or may have heard, what do you think the chances are of someone getting arrested if they drive after drinking - that is, how many times out of 100 would someone be arrested?(A-3) The largest proportion of Statewide respondents (41.2%) believe there is a 51% to 100% chance of getting arrested for drunk driving, followed by a 21% to 50% chance (26.7%) and a 6% to 20% chance (14.1%). Region 5 had the largest proportion of respondents believing there is a 51% to 100% chance of getting arrested (53.6%), followed by Region 4 (44.8%). Again, it is interesting to note that that when looking at the individual responses provided, 17.4% of all respondents reported that there is a 100% chance of getting arrested for drunk driving, with Region 5 having the largest proportion of respondents (33.1%), followed by Region 4 (19.1%).
How often do you use safety belts when you drive or ride in a car, van, sport utility vehicle or pickup - always, almost always, sometimes, seldom or never?(B-1) The vast majority of respondents reported using their safety belts when driving or riding in a passenger vehicle, with 94.4% Statewide, as well as across all five regions (90.9% to 95.6%).
In the past 60 days, have you read, seen or heard anything about seat belt law enforcement by police?(B-2) The majority of respondents were not aware of any seat belt law enforcement messaging, both Statewide (67.1%), as well as across all five regions (61.0% to 69.8%). Of the respondents who had recently been exposed to seat belt law enforcement messaging (32.3% Statewide), the largest proportion of respondents were in Region 5 (37.1%) followed by Region 2 (35.6%) and Region 3 (34.2%).
Where did you see or hear these messages? Of the respondents who reported having recently read, seen, or heard anything about seat belt law enforcement by police, the most common statewide source of those messages was television (40.6%), followed by billboards or outdoor signs (30.9%), and roadway signs (29.4%). Television was also the most common source of seat belt law enforcement messaging for Regions 1, 2, 3 and 4. However, for Region 5, a much larger proportion of respondents reported seeing billboards or outdoor signs (70.7%) than all four of the other regions. Also, the second most common source for Region 1 was billboards or outdoor signs (36.7%), for Region 2 it was roadway signs (33.1%), and for Regions 3 and 4 it was radio 37.3% and 34.6%, respectively).

16
Based on anything you know or may have heard, what do you think the chances are of getting a ticket if you don't wear your safety belt - that is, how many times out of 100 would you be ticketed?(B-3) The largest proportion of Statewide respondents believe there is a 51% to 100% chance of getting a ticket for not wearing a safety belt (27.2%), followed by a 21% to 50% chance of getting a ticket (20.3%) and a 6% to 20% chance (16.7%). Region 5 had the largest proportion of respondents believing there is a 51% to 100% chance of getting a ticket (39.2%), followed by Region 3 (33.1%). It is interesting to note that when looking at the individual responses provided, 13.6% of all respondents reported that there is a 100% chance of getting a ticket for not wearing a seat belt, with Region 5 having the largest proportion of respondents reporting a 100% chance of getting a ticket (19.1%).
On a local road with a speed limit of 30 miles per hour, how often do you drive faster than 35 miles per hour – most of the time, half of the time, rarely, or never?(S-1a) Statewide respondents reported that they rarely drive that fast (47.3%). Region 5 had the largest proportion of respondents reporting that they either rarely (52.0%) or never (26.3%) drive that fast. Respondents in Region 4 were most likely to report that they drive that fast most of the time (22.3%), followed by Region 3 (18.5%) and Region 1 (17.2%).
On a road with a speed limit of 65 miles per hour, how often do you drive faster than 70 miles per hour – most of the time, half of the time, rarely, or never?(S-1b) Statewide respondents reported that they rarely (38.9%) or never (28.0%) drive that fast. Region 1 had the largest proportion of respondents reporting that they rarely drive that fast (41.1%) and respondents in Region 4 were most likely to report never driving that fast (37.6%). Respondents across all five regions were almost equally likely to report driving faster than 70 miles per hour on a 65 mile per hour road most of the time (15.1% to 18.5%).
In the past 30 days, have you read, seen or heard anything about speed enforcement by police?(S-2) The majority of respondents were not aware of such messaging (71.9% Statewide), with the largest proportion of respondents in Region 1 (75.5%) followed by Region 2 (71.3%). Region 4 had the most respondents who had been exposed to messaging about speeding enforcement by police (36.0%), followed by Region 5 (33.4%) and Region 3 (32.1%).
Where did you see or hear these messages? Of the respondents who reported having recently read, seen, or heard anything about speeding enforcement by police, the most common source of those messages was roadway signs Statewide (29.3%) and for Region 1 (36.1%) and Region 5 (50.1%). For Regions 2, 3, and 4, the most common source of speeding enforcement messaging was television (28.4%, 33.5% and 33.2%, respectively). The second most common source of speeding enforcement messaging varied from television Statewide (27.4%) and in Region 1 (26.3%), to roadway signs in Region 2 (26.3%), to billboards and outdoor signs in Region 3 (22.8%) and Region 4 (22.8%), to having been pulled over by or seen police on the roads in Region 5 (27.1%).

17
What do you think the chances are of getting a ticket if you drive over the speed limit - that is, how many times out of 100 would you be ticketed?(S-3) The largest proportion of statewide respondents (33.6%) believed there is a 21% to 50% chance of getting a ticket for speeding, followed by a 51% to 100% chance (23.4%), and a 6% to 20% chance (17.8%). Region 5 had the largest proportion of respondents believing there is a 21% to 50% chance of getting a ticket (44.3%), followed by Region 3 (39.4%). The proportion of respondents who reported that there is a 100% chance of getting a ticket for speeding was much lower than for the other similar items in this survey, with percentages ranging from only 1.9% in Region 4 to 9.5% in Region 3.

18

19
Acronyms and Definitions AASHTO American Association of State Highway and Transportation Officials ACTS Alliance for Community Traffic Safety AGC Associated General Contractors AMHD Addictions and Mental Health Division AMR American Medical Response ARIDE Advanced Roadside Impaired Driving Enforcement ARTS All Roads Transportation Safety ATV All-Terrain Vehicles BAC Blood Alcohol Concentration CARS Crash Analysis Reporting System CCF Commission on Children and Families CLTSG County/Local Traffic Safety Group: An advisory or decision body
recognized by one or more local governments and tasked with addressing traffic safety within the geographic area including one or more cities.
CTSP Community Traffic Safety Program DHS Oregon Department of Human Services DMV Driver and Motor Vehicle Services, Oregon Department of Transportation DPSST Department of Public Safety Standards and Training DRE Drug Recognition Expert DUII Driving Under the Influence of Intoxicants (sometimes DUI is used) EMS Emergency Medical Services F & A Fatalities and Serious Injuries F & I Fatal and Injury FARS Fatality Analysis Reporting System, U.S. Department of Transportation FAST Act Fixing America’s Surface Transportation Act, (P.L. 114-94), was signed into
law by President Obama on December 4, 2015. FHWA Federal Highway Administration FMCSA Federal Motor Carrier Safety Administration GR Governor’s Representative GAC-DUII Governor’s Advisory Committee on DUII GAC-Motorcycle Governor’s Advisory Committee on Motorcycle Safety GHSA Governors Highway Safety Association HSM Highway Safety Manual HSP Highway Safety Plan, the grant application submitted for federal section
402 and similar funds. Funds are provided by the National Highway Traffic Safety Administration and the Federal Highway Administration.
HSIP Highway Safety Improvement Program IACP International Association of Chiefs of Police ICS Incident Command System IID Ignition Interlock Device IRIS Integrated Road Information System LTSG Local Traffic Safety Group: An advisory or decision body recognized by a
local government and tasked with addressing traffic safety. Limited to one geographic area, and may not include cities or other governmental areas within the boundaries.
MADD Mothers Against Drunk Driving
20
MAP-21 Moving Ahead for Progress in the 21st Century Act (P.L. 112-141), was signed into law by President Obama on July 6, 2012.
MPO Metropolitan Planning Organization: MPOs are designated by the governor to coordinate transportation planning in an urbanized area of the state. MPOs exist in the Portland, Salem, Eugene-Springfield, and Medford areas.
NHTSA National Highway Traffic Safety Administration OAR Oregon Administrative Rules OACP Oregon Association Chiefs of Police OASIS Oregon Adjustable Safety Index System ODAA Oregon District Attorneys Association ODE Oregon Department of Education ODOT Oregon Department of Transportation OHA Oregon Health Authority OJD Oregon Judicial Department OJIN Oregon Judicial Information Network OLCC Oregon Liquor Control Commission ORS Oregon Revised Statute OSP Oregon State Police OSSA Oregon State Sheriffs’ Association OTC Oregon Transportation Commission OTP Oregon Transportation Plan OTSAP Oregon Transportation Safety Action Plan OTSC Oregon Transportation Safety Committee PAM Police Allocation Model PUC Oregon Public Utility Commission SAFETEA-LU Safe, Accountable, Flexible, Efficient Transportation Equity Act: A Legacy
for Users SCG Safe Communities Group: A coalition of representatives from private and/or
public sector entities who generally use a data driven approach to focus on community safety issues. Includes all age groups and may not be limited to traffic safety issues.
SFST Standardized Field Sobriety Testing SHSP Strategic Highway Safety Plan SMS Safety Management System or Highway Safety Management System SPF Safety Performance Functions SPIS Safety Priority Index System STIP Statewide Transportation Improvement Program TRCC Traffic Records Coordinating Committee TSD Transportation Safety Division, Oregon Department of Transportation TSRP Traffic Safety Resource Prosecutor VMT Vehicle Miles Traveled “4-E” Education, Engineering, Enforcement and Emergency Medical Services

21
Statewide Links to the Transportation Safety Action Plan:
The Oregon Transportation Safety Action Plan “envisions a future where Oregon’s transportation-related death and injury rate continues to decline. We envision a time when days, then weeks and months pass with not a single fatal or debilitating injury occurs. Someday, we see a level of zero annual fatalities and few injuries as the norm.”
The Oregon Transportation Safety Action Plan calls for comprehensive, data-driven and cost-effective programs and strategies to identify measures to reduce fatal and serious injury crashes. Cornerstones of these programs are continuous evaluation and improvement, enhanced data sharing, timely and effective solutions to identified safety problems, and creating a unified statewide approach towards the mutual goal of roadway safety.
The Problem
• In 2014, 357 people were killed and 35,054 were injured in traffic crashes in Oregon.
• In 2014, 16 percent of Oregon’s citizens believe the transportation system is less safe than it was the prior year.
• Crash data increased 12-15 percent from 2011 forward due to improvements in internal procedures for DMV and CARS.

22
Oregon Traffic Crash Data and Measures of Exposure, 2010-2014
2005-2009
Average 2010 2011* 2012 2013 2014 2010-2014
Average
Total Crashes 43,505 44,094 49,053 49,798 49,495 51,245 48,737 Fatal Crashes 394 292 310 305 292 321 304 Injury Crashes 18,849 20,879 23,887 24,456 22,975 24,208 23,281 Fatalities and Serious Injuries 2,099 1,699 1,872 1,956 1,729 1,852 1,822 Property Damage Crashes 24,285 22,923 24,856 25,036 26,228 26,716 25,152 Fatalities 459 317 331 337 313 357 331 Fatalities per 100 Million VMT 1.31 0.94 0.99 1.02 0.93 1.03 0.98 Fatalities per Population (in thousands) 0.15 0.08 0.09 0.09 0.08 0.09 0.10 Injuries 28,177 30,493 35,031 36,085 33,149 35,054 33,962 Serious Injuries per Population (in
thousands) 0.52 0.36 0.40 0.42 0.36 0.37 0.38 Injuries per 100 Million VMT 80.69 90.29 104.96 108.78 98.35 101.28 100.73 Injuries per Population (in thousands) 7.64 7.93 9.08 9.29 8.46 8.73 8.70 Population (in thousands) 3,688 3,844 3,858 3,884 3,919 4,014 3,904 Vehicle Miles Traveled (in millions) 34,916 33,774 33,376 33,173 33,706 34,610 33,728 No. Licensed Drivers (in thousands) 3,017 2,920 2,930 2,926 2,924 2,930 2,926 No. Registered Vehicles (in thousands) 4,067 4,046 4,022 4,028 4,128 4,193 4,083 % Who Think Transportation System is as
Safe or Safer than Last Year 71% 77% 83% 83% 81% 73% 79% Sources: Crash Analysis and Reporting, Oregon Department of Transportation Fatality Analysis Reporting System, U.S. Department of Transportation Center for Population Research and Census, School of Urban and Public Affairs, Portland State University Public Opinion Survey, Executive Summary; Intercept Research Corporation *In 2011 the number of injury and property damage crashes increased due to improved reporting procedures and better data capture.
Fatal and Injury Crash Involvement by Age of Driver, 2014
Age of Driver # of Drivers in F&I Crashes
% of Total F&I Crashes
# of Licensed Drivers % of Total Drivers
Over/Under Representation*
14 & Younger 5 0.01% 0 0.00% 0.00 15 39 0.09% 13,643 0.45% 0.19 16 496 1.09% 25,266 0.84% 1.30 17 780 1.71% 31,097 1.03% 1.66 18 1,073 2.35% 36,604 1.22% 1.94 19 1,120 2.46% 39,484 1.31% 1.87 20 1,136 2.49% 41,398 1.38% 1.81 21 1,139 2.50% 43,534 1.45% 1.73 22-24 3,292 7.22% 146,710 4.88% 1.48 25-34 9,216 20.22% 546,784 18.17% 1.11 35-44 7,667 16.82% 517,715 17.20% 0.98 45-54 6,760 14.83% 498,839 16.58% 0.89 55-64 5,888 12.92% 479,238 15.92% 0.81 65-74 3,171 6.96% 370,484 12.31% 0.57 75 & Older 1,722 3.78% 218,609 7.26% 0.52 Unknown 2,071 4.54% 20 0.00% 0.00 Total 45,575 100.00% 3,009,425 100.00% n/a
Sources: Crash Analysis and Reporting, Oregon Department of Transportation, Fatality Analysis Reporting System, U.S. Department of Transportation, Driver and Motor Vehicle Services, Oregon Department of Transportation
*Representation is percent of fatal and injury crashes divided by percent of licensed drivers.

23
Goals
• Reduce the traffic fatality rate from the 2010-2014 average of 0.98 to 0.82 per hundred million vehicle miles traveled by 2020.
Performance Measures
• Increase zero fatality days from the 2012-2014 average of 156 to 170 by December 31, 2017.
• Reduce the fatality rate from the 2012-2014 average of 0.99 to 0.91, through December 31, 2017.
• Reduce the traffic injury rate from the 2012-2014 average of 102.08 per hundred million miles traveled to 93.82, through December 31, 2017.
• Decrease traffic fatalities from the 2012-2014 average of 336 to 306 by December 31, 2017. (NHTSA)
• Decrease traffic fatalities from the 2013-2015 average of 373 to 336 by December 31, 2017. (TSAP – Vision of Zero by 2035)
• Decrease traffic fatalities from the 2013-2015 average of 373 to 351 by December 31, 2017.
• Decrease serious traffic injuries from the 2012-2014 average of 1,511 to 1,379 by December 31, 2017.1 (NHTSA)
• Decrease rural fatalities per 100 million VMT from the 2011-2013 average of 1.56 to 1.42 by December 31, 2017. (NHTSA)
• Decrease urban fatalities per 100 million VMT from the 2011-2013 average of 0.59 to 0.54 by December 31, 2017. (NHTSA)

24
Oregon Average Traffic Fatalities per Year, 2012 – 2014, Select Crash Factors The following Venn diagram shows the relationship between driver behavior factors in Oregon fatal crashes. *These three represent 63 percent average of the fatal crashes for 2012 - 2014.
Source: Fatality Analysis Reporting System, U.S. Department of Transportation.
Total Speed 126*
Total Alcohol
124*
Total No Safety Belts
62*
56
38 11
21
11 19 54
Speed is the only factor
Alcohol is the only factor
Alcohol and Speed are factors
No Safety Belt and Speed are factors
No Safety Belt is the only factor
No Safety Belt, Speed, and Alcohol
are factors
No Safety Belt and Alcohol are factors

25
Bicyclist Safety Link to the Transportation Safety Action Plan:
Action # 99 – Increase emphasis on programs that will encourage bicycle travel Increase emphasis on programs that will encourage bicycle and other alternative mode travel and improve safety for these modes. The following actions should be undertaken: • Support implementation of the Oregon Bicycle and Pedestrian Plan guidelines and goals.
• Support the Bicyclist and Pedestrian Safety Program annual performance plan process, including allocating sufficient funding for achieving those goals.
• Establish a stable funding source to implement and institutionalize bicyclist and alternative mode safety education in the schools with a curriculum that includes supervised on-street training.
• Increase funding for maintenance of bikeways and for programs that make walking and bicycling safe and attractive to children.
• Provide consistent funding for a comprehensive bicyclist and alternative mode safety campaign for all users. Include information to encourage helmet use.
• Raise law enforcement awareness of alternative mode safety issues. Increase enforcement efforts focused on motorist actions that endanger bicyclists, and on illegal bicyclist behaviors.
The Background
• The use of the bicycle as a transportation mode has increased. According to the 2009 National Household Travel Survey (NHTS), biking makes up 1 percent of all trips made in the U.S., up 25 percent from 0.8 percent in 2001.
• According to a U.S. Census Bureau report, nationwide the number of people who traveled to work by bike increased roughly 60 percent over the last decade (from about 488,000 to about 786,000 during the 2008-2012 period).
• Oregon is ranked sixth for Bike Friendly State by the League of American Bicyclists in 2015, with over five awarded bicycle friendly communities.
• In Oregon, bicycles are vehicles and subject to vehicle laws except for those that by their nature cannot have application, or when otherwise specifically provided under vehicle code. “Share the road” means the same road, the same rights, and the same responsibilities for vehicles operating on the roadway.

26
The Problem
• The 955 bicyclist injuries in 2014 accounted for 2.7 percent of all Oregon traffic injuries during the year. The seven bicyclist fatalities in 2014 accounted for 2 percent of all Oregon traffic fatalities.
• Bicyclist fatal and injury crashes from 2010 through 2014 accounted for 4 percent of all Oregon fatal and injury traffic crashes in that same five year period.
• For the five year period of 2010-2014 for the bicyclist-involved fatal and serious injury (F&A) crashes, an average of 50.9 percent of the F&A crashes were coded as having Driver Error and 56.8 percent were coded as having Bicyclist Error.
• In 2014, there were 147 crashes involving a bicyclist who was riding in the wrong direction, or 15% of all bicyclist-involved crashes.
• A review of bicyclist crash data 2007-2011 by Kittelson & Associates, Inc. found the following trends:
The majority of severe crashes on roadway segments occur at driveways, and many of those are in locations with bicycle facilities.
Right-hook and angle crashes are the primary crash types at intersections. • The most common bicyclist errors from the ODOT 2014 Motor Vehicle Traffic Crashes
Quick Facts:
Failed to yield right-of-way Disregarded traffic signal Bicycling on shoulder facing highway (bicyclist riding the wrong way)
• The most common driver error in Fatal and Serious Injury pedalcycle crashes, 2010-2014:
Failed to yield right-of-way to pedalcyclist Bicyclists in Motor Vehicle Crashes on Oregon Roadways, 2010-2014
2010 2011 2012 2013 2014 2010-2014
Average Injuries: Number 877 928 1,026 922 955 942 Percent of total Oregon injuries 2.9% 2.6% 2.8% 2.8% 2.7% 2.8% Serious Injuries 37 64 69 61 65 59 Fatalities: Number 7 15 10 3 7 8 Percent of total Oregon fatalities 2.2% 4.5% 3.0% 1.0% 2.0% 2.5% Percent Helmet Use (children) 57% 58% 60% 68% n/a n/a Crashes: Number 910 962 1,064 957 1,001 979 Percent of total Oregon crashes 2.1% 2.0% 2.1% 1.9% 2.0% 2.0% Fatal and Serious Injury Crashes: Number 44 79 79 64 72 68 Source: Crash Analysis and Reporting, Oregon Department of Transportation, Fatality Analysis Reporting System, U.S. Department of
Transportation. Bicycle Helmet Observation Study, Intercept Research Corporation

27
Goals
• Reduce bicyclist-involved fatal and serious injury motor vehicle crashes from the 2010-2014 average of 68 to 57 by 2020.
• Reduce bicyclist involved motor vehicle crashes from the 2010-2014 average of 979 to 815 by 2020.
Performance Measures
• Reduce bicyclist fatal and serious injury crashes from the 2012-2014 average of 72 to 66 by December 31, 2017.
• Reduce bicyclist involved motor vehicle crashes from the 2012-2014 average of 1,001 to 914 by December 31, 2017.
• Reduce crashes involving a cyclist who was “Riding the Wrong Direction,” from the 2012-2014 average of 176 crashes to 161 crashes by December 31, 2017.
• Reduce the percentage of crashes where the driver failed to yield to a cyclist from the 2012-2014 average of 525 to 479 by December 31, 2017.
• Reduce bicyclist fatalities from the 2012-2014 average of 7 to 6 by December 31, 2017. (NHTSA)
Strategies
• Work to continue the “Safe Passing” media campaign with corresponding messages to bicyclists and drivers promoting sharing the road.
• Work to create educational materials that support the media campaign.
• Work with Region Traffic Safety Coordinators to develop and distribute bicycle safety educational materials.
• Work in exploring potential bicycle safety education programs for riders over 18 years of age.
• Continue to provide bicyclist safety educational materials for statewide distribution.

28

29
Community Traffic Safety Link to the Transportation Safety Action Plan:
Action # 17 – Establish a network to disseminate information to local governments Continue to support the expansion and increase in stature of local transportation safety programs. Support measures may include the provision of technical assistance, mentor programs, legislative coordination, training, and provision of other resources to local transportation safety programs, groups and committees statewide. Encourage communities to use the Safe Communities process and approach to addressing injury control. Establish a network to disseminate information to local governments. Evaluate current delivery methodologies for efficiency and effectiveness. Evaluate the practicality of establishing a “traffic safety academy” or course of study that prepares individuals of all ages to engage in safety projects and activities at the local level. Implement academy if practicable. Identify mechanisms to assist groups in maintaining and improving collaboration within their communities.
The Problem
• While a volunteer work force may exist, often there is no local mechanism for mobilizing and motivating these volunteers.
• More than 50 percent of fatal and injury crashes occur in the north Willamette Valley in just four counties. These counties significantly impact state crash statistics. Two counties, Gilliam and Sherman, have experienced an average fatal and injury crash rate above 7 per 1,000 population for the past decade. These counties have minimal local resources to address their highway safety issues.
• While safety is a stated priority for many organizations and governments, when confronted with financial difficulties, safety is often an area for reductions in effort. Few local governments in Oregon have developed a business plan for reducing vehicle related death and injury either as a standalone plan, or part of a transportation system plan; even fewer have undertaken to develop a more comprehensive “4E” approach to the problem.
• A traffic safety academy or other systematic approach to training local volunteers is not in place. Efforts to train local government employees, while offered, are not always coordinated.
• No MPO has published the long-standing required Strategic Highway Safety Plan.

30
Jurisdictional Data for Oregon Counties, 2014
County Population Fatalities Alcohol Involved
Fatalities Fatal and Injury
Crashes F&I Crashes /1,000 Pop.
Nighttime Fatal and Injury Crashes
Baker * 16,425 5 0 99 6.03 10 Benton 90,005 5 2 399 4.43 51 Clackamas ! 397,385 38 9 2,461 6.19 320 Clatsop 37,750 3 0 261 6.91 30 Columbia * 50,390 3 2 211 4.19 35 Coos 62,990 11 6 329 5.22 49 Crook 21,085 1 0 116 5.50 15 Curry 22,470 4 2 88 3.92 17 Deschutes 170,740 13 7 800 4.69 111 Douglas * 109,910 27 6 565 5.14 84 Gilliam 1,975 0 0 30 15.19 4 Grant ! 7,430 0 0 26 3.50 2 Harney ! 7,295 5 3 33 4.52 8 Hood River 24,245 1 0 121 4.99 20 Jackson ! 210,975 17 9 1,111 5.27 156 Jefferson 22,445 10 1 117 5.21 16 Josephine * 83,720 13 6 458 5.47 67 Klamath * 67,110 11 5 380 5.66 66 Lake * 8,010 0 0 45 5.62 7 Lane 362,150 45 10 1,805 4.98 270 Lincoln 47,225 8 2 304 6.44 39 Linn 120,860 16 5 730 6.04 117 Malheur ! 31,480 3 0 226 7.18 38 Marion 329,770 24 7 2,208 6.70 315 Morrow 11,630 3 2 48 4.13 8 Multnomah 777,490 28 12 6,317 8.12 912 Polk 78,570 10 2 352 4.48 45 Sherman * 1,790 1 1 50 27.93 10 Tillamook * 25,690 5 2 162 6.31 30 Umatilla ! 79,155 12 5 455 5.75 87 Union ! 26,625 1 1 130 4.88 30 Wallowa * 7,100 5 4 35 4.93 7 Wasco * 26,370 5 0 142 5.38 27 Washington # 570,510 16 0 3,358 5.89 374 Wheeler 1,445 0 6 15 10.38 1 Yamhill 103,630 7 3 542 5.23 77
Statewide Total 4,013,845 356 120 24,529 6.11 3,455 Sources: Crash Analysis and Reporting, Oregon Department of Transportation; Fatality Analysis Reporting System, U.S. Department of Transportation; Center for Population Research and Census, School of Urban and Public Affairs, Portland State University, Text in italics based on urban boundary changes per national census. *= Local Traffic Safety Group #= County/Local Traffic Safety Group != Safe Communities Group *Nighttime F&I Crashes are those fatal and injury crashes that occur between 8 p.m. and 4:59 a.m.
31
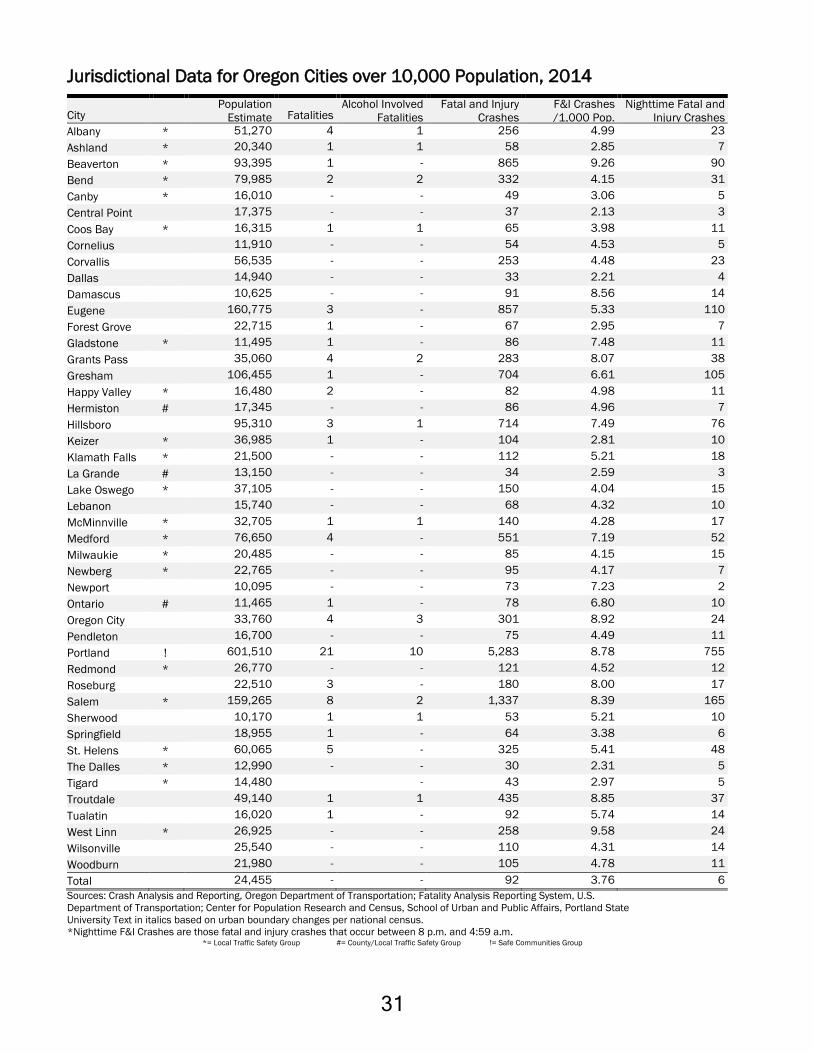
Jurisdictional Data for Oregon Cities over 10,000 Population, 2014
City Population
Estimate Fatalities Alcohol Involved
Fatalities Fatal and Injury
Crashes F&I Crashes /1,000 Pop.
Nighttime Fatal and Injury Crashes
Albany * 51,270 4 1 256 4.99 23 Ashland * 20,340 1 1 58 2.85 7 Beaverton * 93,395 1 - 865 9.26 90 Bend * 79,985 2 2 332 4.15 31 Canby * 16,010 - - 49 3.06 5 Central Point 17,375 - - 37 2.13 3 Coos Bay * 16,315 1 1 65 3.98 11 Cornelius 11,910 - - 54 4.53 5 Corvallis 56,535 - - 253 4.48 23 Dallas 14,940 - - 33 2.21 4 Damascus 10,625 - - 91 8.56 14 Eugene 160,775 3 - 857 5.33 110 Forest Grove 22,715 1 - 67 2.95 7 Gladstone * 11,495 1 - 86 7.48 11 Grants Pass 35,060 4 2 283 8.07 38 Gresham 106,455 1 - 704 6.61 105 Happy Valley * 16,480 2 - 82 4.98 11 Hermiston # 17,345 - - 86 4.96 7 Hillsboro 95,310 3 1 714 7.49 76 Keizer * 36,985 1 - 104 2.81 10 Klamath Falls * 21,500 - - 112 5.21 18 La Grande # 13,150 - - 34 2.59 3 Lake Oswego * 37,105 - - 150 4.04 15 Lebanon 15,740 - - 68 4.32 10 McMinnville * 32,705 1 1 140 4.28 17 Medford * 76,650 4 - 551 7.19 52 Milwaukie * 20,485 - - 85 4.15 15 Newberg * 22,765 - - 95 4.17 7 Newport 10,095 - - 73 7.23 2 Ontario # 11,465 1 - 78 6.80 10 Oregon City 33,760 4 3 301 8.92 24 Pendleton 16,700 - - 75 4.49 11 Portland ! 601,510 21 10 5,283 8.78 755 Redmond * 26,770 - - 121 4.52 12 Roseburg 22,510 3 - 180 8.00 17 Salem * 159,265 8 2 1,337 8.39 165 Sherwood 10,170 1 1 53 5.21 10 Springfield 18,955 1 - 64 3.38 6 St. Helens * 60,065 5 - 325 5.41 48 The Dalles * 12,990 - - 30 2.31 5 Tigard * 14,480 - 43 2.97 5 Troutdale 49,140 1 1 435 8.85 37 Tualatin 16,020 1 - 92 5.74 14 West Linn * 26,925 - - 258 9.58 24 Wilsonville 25,540 - - 110 4.31 14 Woodburn 21,980 - - 105 4.78 11 Total 24,455 - - 92 3.76 6 Sources: Crash Analysis and Reporting, Oregon Department of Transportation; Fatality Analysis Reporting System, U.S. Department of Transportation; Center for Population Research and Census, School of Urban and Public Affairs, Portland State University Text in italics based on urban boundary changes per national census. *Nighttime F&I Crashes are those fatal and injury crashes that occur between 8 p.m. and 4:59 a.m.
*= Local Traffic Safety Group #= County/Local Traffic Safety Group != Safe Communities Group

32
Goal
• Increase the number of represented Oregonians living in cities with a population over 10,000 or counties, with a community-level transportation safety group from the 2012-2014 average of 61 percent to 77 percent by 2020.
Performance Measures
• Increase the number of active3 traffic safety groups from the 2010-2014 average of 47 to 52 by 2017.
• Increase the number of communities that have a “four E” based transportation safety action plan or business plan from 1 in 2012 to 4 in 2017.
• Increase the number of educational opportunities coordinated designed for, and offered to both government and non-profit organizations in Oregon from 10 the 2015 level to 12, or increased by two courses by December 31, 2017.
Strategies
• Continue comprehensive community traffic safety group support, emphasizing projects in targeted communities, assist with the development and maintenance of Safe Communities Groups and programs which address both fatal and injury crash prevention and associated cost issues in targeted communities.
• Expand the number of Oregonians who participate in transportation injury prevention at the community level, through projects that create innovative opportunities for citizens to become involved. Find ways to improve tracking of the activity levels of these individuals by increasing the number of documented traffic safety groups.
• Provide sample or example print materials and technical tools designed to foster community-level approaches to traffic safety issues.
• Encourage local level partnerships that cross traditional program, group, and topical divisions through training and hands-on technical assistance provided by both region representatives and centralized offerings. Develop activities that act as a catalyst for expanded safety activity.
• Encourage local innovative approaches to traffic safety that fosters long term local initiatives.
• Encourage the development of local transportation safety plans by providing assistance, training, and guidance to local governments and communities. Identify and implement ways to improve coordination of safety efforts among local land use and transportation.
3 An “active” local traffic safety committee or group is defined as meeting twice a year or more; to address transportation safety issues.
33
• Help communities develop a positive framework for sharing the value of local groups and plans, and for keeping initiatives going when the problem is not urgent, help them learn to use reactionary events to illustrate the need to maintain ongoing efforts. Do this concurrent with positive community norm style communications.
• Work with traffic records experts to assist communities with gaining access to, understanding, and sharing data that is important to their transportation safety efforts.

34
35
Driver Education Link to the Transportation Safety Action Plan:
Action # 72 – Improve and expand the delivery system for driver education in Oregon Improve and expand the delivery system for driver education in Oregon. Consider the following in designing a model program: • Consider legislation to make driver education mandatory for new drivers under age 18. • Consider raising the provisional licensing age to 21 from the current 18; also evaluate
extending provisional licensing for all new drivers for the first two years, regardless of age.
• Evaluate the possibility of funding the increased cost of providing this additional training by raising learning permit fees.
• If feasible, by the year 2020, extend the driver education requirement to all persons seeking their first driver license.
• Establish new and improved standards to support quality driver and traffic safety education programs.
• Continue to evaluate and update the definition of what a model driver is in terms of knowledge, skill, behavior and habits. Continue to offer a curriculum that is aligned with the expectations of a model driver. The curricula should continue to address content, methods, and student assessments.
• Improve and expand standards for teacher preparation programs that fully prepare instructors to model and teach the knowledge, skill behavior and habits needed. These standards should include specific requirements for ongoing professional development.
• Evaluate the possibility of establishing a licensing process that measures driver readiness as defined by the model driver, and employs a process that facilitates the safety means to merge the learning driver into mainstream driving, regardless of age.
• Establish uniform program standards that apply to every driver education training program and school.
• Develop additional oversight and management standards that hold the driver education system accountable for performance. These new and existing standards should encourage quality and compel adherence to program standards.
• Identify and promote strategies that establish a complete driver and traffic safety education system. This complete system should promote lifelong driver learning, and foster a commitment to improve driver performance throughout the driver’s life span.
• Create partnerships to support driver education. Identify and promote best practices for teaching and learning among and between parents, educators, students and other citizens. Consider making driver education a part of the school day and convenient.
• Consider the use of on-line, and on-line interactive education as a way to expand driver education, raising the amount of overall training time a student receives. In frontier areas, seek creative delivery systems.

36
The Problem
• In 2014, drivers age 15-20 represented 6.2 percent of total licensed drivers, but also represented 9.6 percent of drivers involved in crashes. There is a need to increase the number of teens who participate in an approved program.
• There is a need to continually eliminate inconsistencies in the various driver education public/private providers by enforcing a model statewide program with standards proven to reduce the risk factors of teen driver crashes.
• There is a statewide need for more qualified and updated driver education instructors. Additionally, a refresher course needs to be provided for those instructors out in the field four or more years.
• There is a statewide need for more exposure of novice driver training outside of the Willamette Valley.
• There is a need to measure citations, crashes and convictions of students that have completed approved driver education to compare against those teens that do not complete a course; and a need to be able to identify the approved provider in cases of repeated deficiencies.
• There is a need to revise the Playbook® and DVD Instructor interface in the curriculum guide, and continue to compare to the national curriculum standards.
• There is a need to evaluate Oregon driver education instructors and compare the evaluation programming to the national standards.
• There are currently 25 Commercial Drive Schools certified by Oregon DMV, operating in the state of Oregon. Of these, ten also participate in ODOT-Approved Driver Education Program. The need continues for incorporating DMV certified schools into the TSD Approved status.
Youth Drivers on Oregon Roadways, 2010-2014
2010 2011
2012 2013 2014 2010-2014
Average
Age 15-20, % of Total Licensed Drivers 6.31% 6.13% 6.03% 6.11% 6.23% 6.16%
Overrepresentation of Drivers Age 15-20** 1.86 1.79 1.68 1.65 1.54 1.71
Total 15-20 Drivers in Fatal Crashes 37 35 40 35 33 36
Total 15-20 Drivers Alcohol Involved 6 5 7 10 6 7
Percent Alcohol Involved 16.2% 14.3% 17.5% 28.6% 18.2% 19.0%
15-20 Auto Occupant Fatalities 24 26 18 25 27 24
15-20 Unrestrained Auto Occupant Fatalities 8 4 7 8 3 6
Sources: Crash Analysis and Reporting, Oregon Department of Transportation, Fatality Analysis Reporting System, U.S. Department of Transportation, Driver and Motor Vehicle Services, Oregon Department of Transportation, Law Enforcement Data System
**Representation is the percent of fatal and injury crashes divided by percent of licensed drivers.
37
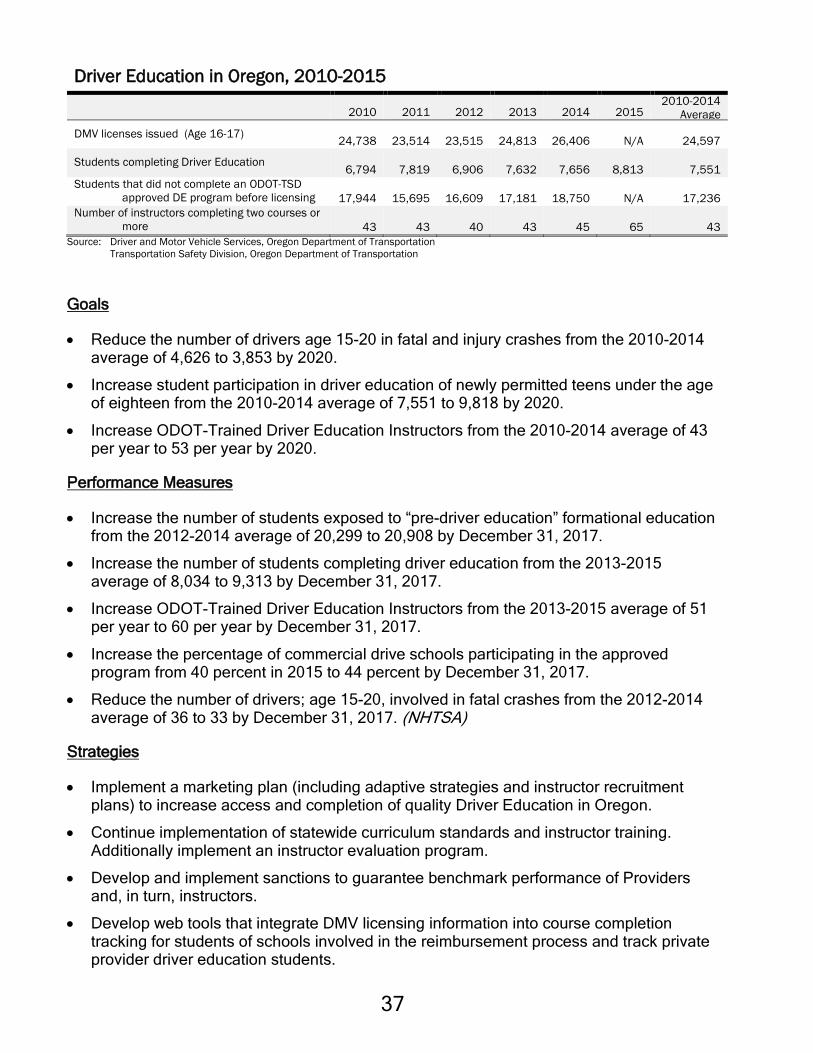
Driver Education in Oregon, 2010-2015
2010 2011 2012 2013 2014 2015
2010-2014 Average
DMV licenses issued (Age 16-17) 24,738 23,514 23,515 24,813 26,406 N/A 24,597
Students completing Driver Education 6,794 7,819 6,906 7,632 7,656 8,813 7,551 Students that did not complete an ODOT-TSD
approved DE program before licensing 17,944 15,695 16,609 17,181 18,750 N/A 17,236 Number of instructors completing two courses or
more 43 43 40 43 45 65 43 Source: Driver and Motor Vehicle Services, Oregon Department of Transportation Transportation Safety Division, Oregon Department of Transportation
Goals
• Reduce the number of drivers age 15-20 in fatal and injury crashes from the 2010-2014 average of 4,626 to 3,853 by 2020.
• Increase student participation in driver education of newly permitted teens under the age of eighteen from the 2010-2014 average of 7,551 to 9,818 by 2020.
• Increase ODOT-Trained Driver Education Instructors from the 2010-2014 average of 43 per year to 53 per year by 2020.
Performance Measures
• Increase the number of students exposed to “pre-driver education” formational education from the 2012-2014 average of 20,299 to 20,908 by December 31, 2017.
• Increase the number of students completing driver education from the 2013-2015 average of 8,034 to 9,313 by December 31, 2017.
• Increase ODOT-Trained Driver Education Instructors from the 2013-2015 average of 51 per year to 60 per year by December 31, 2017.
• Increase the percentage of commercial drive schools participating in the approved program from 40 percent in 2015 to 44 percent by December 31, 2017.
• Reduce the number of drivers; age 15-20, involved in fatal crashes from the 2012-2014 average of 36 to 33 by December 31, 2017. (NHTSA)
Strategies
• Implement a marketing plan (including adaptive strategies and instructor recruitment plans) to increase access and completion of quality Driver Education in Oregon.
• Continue implementation of statewide curriculum standards and instructor training. Additionally implement an instructor evaluation program.
• Develop and implement sanctions to guarantee benchmark performance of Providers and, in turn, instructors.
• Develop web tools that integrate DMV licensing information into course completion tracking for students of schools involved in the reimbursement process and track private provider driver education students.

38
• Continue to work with NHTSA, ODOT Research Division and other research groups to evaluate the elements of the Oregon Driver Education program.
• Implement revision (R2) of the state curriculum guide (Playbook®) and related Instructor DVD Interface (D2) by December 31, 2017.
• Maintain the centralized instructor certification process and continue to improve the system for which student certification is accomplished and secured.
39
Emergency Medical Services (EMS) Link to the Transportation Safety Action Plan:
Action #109 – Transportations Safety Action Plan - PRIORITY 1 Develop strategies to assure the recruitment and retention of EMS volunteers Work to place a state focus on volunteer creation and development. Develop strategies to assure the recruitment and retention of EMS and fire volunteers. Work to assure that the EMS education standards are attainable to volunteers in terms of time, costs and resource demands. Develop easy, effective entry points for EMS and fire volunteers. Work with affected agencies and local governments to identify existing and emerging barriers to volunteer participation in the EMS and fire systems. Action #106 - Work with partner agencies to position Oregon’s EMS system as world class and affordable for the average Oregonian Work with partner EMS agencies, providers, committees, volunteers and concerned citizens to position Oregon’s EMS system as world class. Raise awareness of the life-saving importance of EMS personnel and equipment to encourage statewide support and involvement. Increase emphasis on the need for well-trained personnel and equipment in rural and volunteer agencies. Create and fund affordable, local and accessible EMS training statewide for pre-hospital and hospital personnel responding to motor vehicle crashes, to aid in reaching and sustaining this goal. Continue work towards meeting and exceeding national standards.
The Problem
• Traffic crashes contribute heavily to the patient load of Oregon hospitals and EMS agencies. The Oregon economy has caused many larger hospitals to make cuts and their foundations have reduced support as well. Smaller and rural community hospitals often face even more severe budgetary constraints, impacting their ability to get the required training and equipment. This is further problematic due to the Oregon Administrative Rules governing the continuing education and recertification requirements for EMTs of all levels.
• A cohesive EMS system is essential to ensuring positive patient outcomes. The stabilization and long-distance transport of motor vehicle crash patients to facilities that can provide the appropriate level of trauma care is critical to reducing the health and financial impact of these injuries. Rural crashes are often the worst of crashes because they often involve higher rates of speed and longer response times.
• Trauma remains the leading cause of morbidity and mortality among pediatric patients within the state of Oregon and nationwide. Highway motor vehicle crashes are the single most common mechanism of death and serious injury among children after the first year of life.

40
• Pre-hospital providers are often inadequately prepared to deal with the unique medical needs of pediatric trauma victims from these and other motorized crashes. A lack of pediatric specific training and education as well as appropriately sized equipment contribute to the less than optimal care of children outside of pediatric trauma centers. Pediatric trauma patients are of particular concern for rural counties where motor vehicle crash patients can require a higher level of care than what the rural hospital or trauma facility can provide. In Oregon, EMTs are also required to receive specific pediatric continuing education hours.
Oregon's EMS Workforce 2014-2015
EMS Level 2014 2015 Difference
Emergency Medical Responders (EMR) 1,596 1,932 +336 Emergency Medical Technician (EMT) 5,366 4,407 -959 Advance/Emergency Medical Technician (A/EMT) 60 83 +23 Emergency Medical Technicians-Intermediate (EMT-I) 918 795 -123 Paramedics 3,617 3,347 -270 Total 11,557 10,564 -993 Data according to Oregon Health Authority. All EMT’s are expected to renew their license once in two years.
Oregon’s Average Response Times 2014-2015
2014 2015 Difference
Response time 7 7 0 Time on Scene to stabilize and prepare for transport 7 14 -7 Transport time to medical facility 23 13 -10 Total Incident time 37 34 -3 Data according to Oregon Health Authority. 2015 reported in median minutes.
Goals
• Improve transportation safety related medical care and associated EMS/Trauma programs throughout Oregon through participation from 14 EMS statewide and national meetings in 2015 to 16 by 2020.
• Increase knowledge of EMS personnel by providing EMS conference scholarships awarded from 110 in 2015 to 128 by 2020.
• Decrease response, scene and transport times from the statewide average of 34 minutes in 2014-2015 to 29 minutes by 2020, through training and appropriate equipment, not by increasing speeds.
• Maintain attendance of one OTSC member at the quarterly EMS Advisory Committee meetings by 2020.

41
Performance Measures
• Increase TSD attendance at EMS meetings statewide and nationally from 14 in 2015 to 15 by December 31, 2017.
• Increase the number of scholarships for individual rural EMS personnel from 110 in 2015 to 113 by December 31, 2017.
• Decrease response, scene and transport times from the statewide average of 35 minutes in 2014-2015 to 31 minutes by December 31, 2017.
• Maintain the 2015 attendance of one OTSC members that are a formal part of the state's EMS Advisory Committee through December 31, 2017.
Strategies
• Work in coordination through EMS meetings statewide to collaborate and improve transportation safety related medical care and associated EMS/Trauma programs throughout Oregon.
• Increase scholarships awarded to rural EMS professionals responsible for responding to both paid and volunteer motor vehicle crashes, to attend EMS conferences to receive EMS training.
• Provide training opportunities to decrease response, scene and transport times.
• Stay involved and be available for EMS and Transportation Safety collaboration opportunities as they arise.
• Require attendance of one OTSC member at quarterly EMS Advisory Committee Meetings.

42

43
Equipment Safety Standards Link to the Transportation Safety Action Plan:
Action # 59 – Improve public knowledge of vehicle safety equipment Continue to improve public knowledge of vehicle safety equipment, and its role in safe vehicle operation. Improve current mechanisms to raise awareness of common vehicle equipment maintenance and use errors, and seek new or more effective ways to raise awareness and increase compliance with proper use and maintenance guidelines. Develop improved mechanisms to educate the public about Antilock Braking System (ABS) use.
The Problem
• Oregon drivers are not well-informed about vehicle equipment laws. This lack of knowledge presents safety hazards as drivers violate equipment statutes.
• Oregon does not have a trailer brake requirement. ORS 815.125 (7) only addresses that a combination of vehicles must be able to stop within a certain distance at a certain speed.
• Vehicle equipment defects are not consistently reported in crashes.
• Equipment retailers sell and/or modify vehicles that are not in compliance with the Federal Motor Vehicle Safety Standards (FMVSS), Oregon Revised Statutes or Oregon Administrative Rules.
• Law enforcement lacks the resources to consistently pursue vehicle equipment violators.

44
Automobile Vehicle Defect Crashes , Fatalities, and Injuries, 2010-2014
2010 2011 2012 2013 2014 2010-2014
Average Total Number of Vehicle Defect Crashes 601 690 605 604 707 641
Total Number of Fatal, Vehicle Defect Crashes 3 5 3 3 4 4
Total Number of Non-Fatal, Vehicle Defect Crashes 300 335 262 273 318 298
Crashes due to tire failure* 219 231 216 206 264 227
Crashes due to defective brakes 177 202 187 162 192 184
Crashes due to mechanical defects 163 194 178 123 146 161
Fatalities due to Vehicle Defect 3 5 4 4 4 4
Injuries due to Vehicle Defect 445 535 421 406 443 450
Fatalities due to tire failure 0 0 1 1 1 1
Injuries due to tire failure 128 138 122 125 148 132
Fatalities due to defective brakes 1 1 3 0 1 1
Injuries due to defective brakes 168 171 173 129 152 159
Fatalities due to mechanical defects 2 3 1 3 1 2
Injuries due to mechanical defects 119 175 143 84 99 124
Convictions for unlawful use of or failure to use lights (ORS 811.520) 1,144 1,170 1,170 953 676 1,023
Source: Crash Analysis and Reporting, Oregon Department of Transportation, DMV, Fatality Analysis Reporting System, U.S. Department of Transportation.
*Note: More than one type of mechanical problem may occur in any given vehicle or crash Includes: Autos, Pickups, Vans, SUVs, Motorhomes, Motorcycles and Mopeds. Types of defects: trailer connection broken, steering,
brakes, wheel came off, hood flew up, lost load, tire failure, other. (Trucks, buses and semi vehicle safety and equipment standards are administered and enforced by the Motor Carrier Division of ODOT.)
Goals
• Reduce total vehicle defect-related crashes from the 2010-2014 average of 641 to 534 by 2020.
Performance Measures (PM)
• Reduce the number of people killed or injured due to tire-failure from the 2012-2014 average of 133 to 121 by December 31, 2017.
• Reduce the number of people killed or injured due to defective brakes from the 2012-2014 average of 153 to 139 by December 31, 2017.
• Reduce the number of people killed or injured due to mechanical defects from the 2012-2014 average of 110 to 101 by December 31, 2017.

45
Strategies
• Disseminate information about safety equipment standards to auto dealers, RV dealers, auto parts retailers, trailer manufacturers, Oregon Vehicle Dealer Association, and driver education schools
• Promote NHTSA Safer Car Vehicle Recall Campaigns
• Disseminate information about proper tire pressure monitoring to tire retailers and the general public. Partner with tire dealers and wholesalers to promote National Tire Safety Week (last week in May).
• Update Administrative Rules on equipment to reflect current federal law or clarify current federal or state law through consultation with Assistant Attorney General assigned to ODOT
• Educate the public, law enforcement and judicial officials about vehicle equipment standards through the use of TSD’s website, flyers, news releases, verbal communications and publications.
• Continue to monitor the feasibility of Oregon requiring a trailer brake law.
• Continue to collaborate with operators of emergency vehicle lighting to insure vehicles are properly equipped, operators are adequately trained and use of emergency lighting is clearly defined.
• Encourage public awareness of the need to secure loads through partnerships with vehicle/trailer dealerships, recycling centers, reclamation/refuse collection groups, law enforcement, website updates, seasonal press releases, association newsletters, partnership with ODOT Motor Carrier, and yard product companies.

46

47
Highway Safety Improvement Program (HSIP) Link to the Transportation Safety Action Plan:
Action # 23 – Safety areas of interest should include intersection crashes, roadway departure, and pedestrian/bicycle Continue to focus on improving key infrastructure safety emphasis areas through improved effort, communication, and training. Work on these emphasis areas may include, but should not be limited to the following: • Intersection Crashes – Investigate the usefulness of advance signing, roundabouts,
access management techniques, advance technology and features, and improvements to signal timing to smooth traffic flow in various settings. Implement effective solutions.
• Roadway Departure Crashes (Lane departure crashes include run off the road crashes and head-on crashes) – For highways, rural roads and other higher speed roadways investigate the application and usefulness of rumble strips, shoulder widening, median widening, cable barrier, durable marking, fixed object removal, roadside improvements, safety edge and other countermeasures and safety treatments of centerline and shoulder areas for lane departure crashes in various settings. Implement effective solutions.
• Pedestrian and Bicycle Crashes – Investigate the usefulness of curb bulb-outs, refuge islands, warning signage improvements and other countermeasures for pedestrian crashes, investigate improvements in traffic controls for bicycles and improvements at intersections to better accommodate crossing pedestrians and bicycles such as bicycle signals, bicycle-activated warning light/sign systems, colored pavements and rectangular rapid flashing beacons for pedestrian crossings and rectangular rapid flashing beacons. Consider changes to roadway design standards for urban area roadways that encourage vehicle operators to travel at the posted speed. Implement effective solutions.
• Further develop, enhance and institutionalize the ODOT Safety Corridor and Roadway Safety Audit Programs within ODOT. Each should further the program and embrace the blending of the “4 E” approach to transportation safety as is described in FHWA’s Office of Safety Mission Statement. (Education, Engineering, EMS and Enforcement.)
The Problem
• The purpose of the Highway Safety Improvement Program (HSIP) is to achieve a significant reduction in fatalities and serious injuries on public roads. HSIP requires a data-driven, strategic approach to improving highway safety on all public roads that focuses on performance. The problem is how to achieve the best results with limited funds.
• City and county roads account for half of the fatal and serious injury crashes in the state, but these crashes are spread over 43,000 miles of roadway.
• State highways have the highest rate of fatal and serious injury crashes per mile and city streets and county roads have the highest rates per Vehicle Mile Traveled (VMT).
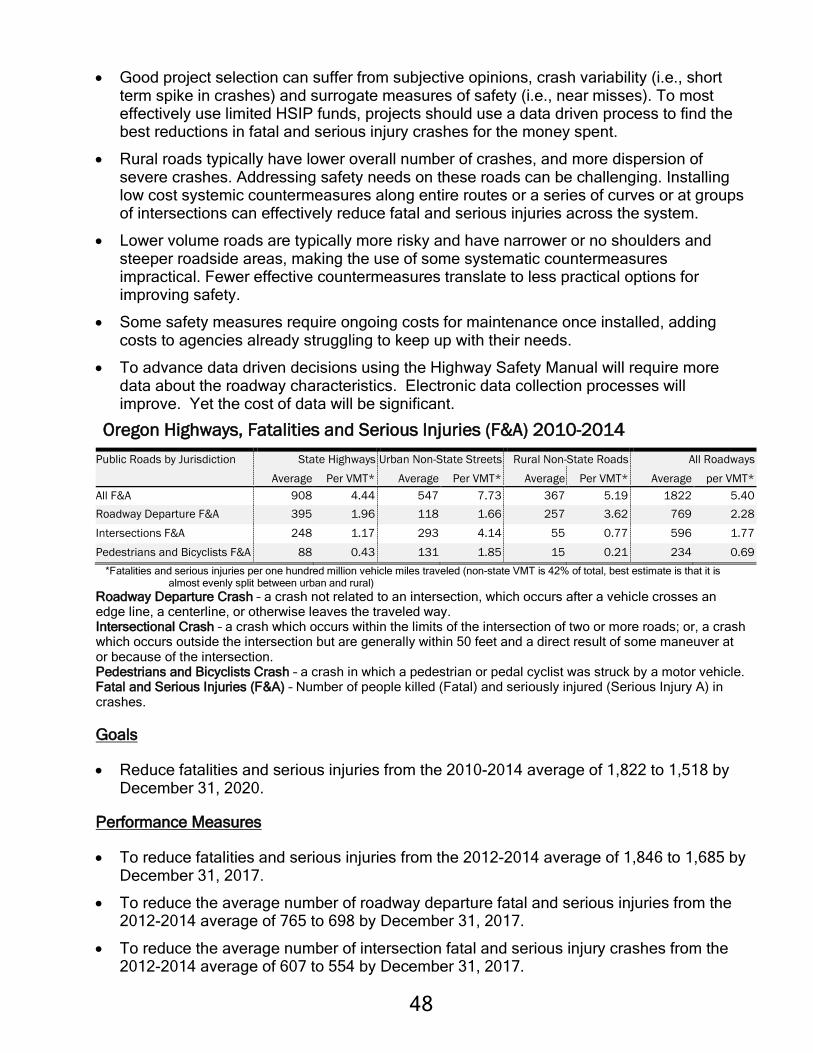
48
• Good project selection can suffer from subjective opinions, crash variability (i.e., short term spike in crashes) and surrogate measures of safety (i.e., near misses). To most effectively use limited HSIP funds, projects should use a data driven process to find the best reductions in fatal and serious injury crashes for the money spent.
• Rural roads typically have lower overall number of crashes, and more dispersion of severe crashes. Addressing safety needs on these roads can be challenging. Installing low cost systemic countermeasures along entire routes or a series of curves or at groups of intersections can effectively reduce fatal and serious injuries across the system.
• Lower volume roads are typically more risky and have narrower or no shoulders and steeper roadside areas, making the use of some systematic countermeasures impractical. Fewer effective countermeasures translate to less practical options for improving safety.
• Some safety measures require ongoing costs for maintenance once installed, adding costs to agencies already struggling to keep up with their needs.
• To advance data driven decisions using the Highway Safety Manual will require more data about the roadway characteristics. Electronic data collection processes will improve. Yet the cost of data will be significant.
Oregon Highways, Fatalities and Serious Injuries (F&A) 2010-2014
Public Roads by Jurisdiction State Highways Urban Non-State Streets Rural Non-State Roads All Roadways Average Per VMT* Average Per VMT* Average Per VMT* Average per VMT*
All F&A 908 4.44 547 7.73 367 5.19 1822 5.40 Roadway Departure F&A 395 1.96 118 1.66 257 3.62 769 2.28 Intersections F&A 248 1.17 293 4.14 55 0.77 596 1.77 Pedestrians and Bicyclists F&A 88 0.43 131 1.85 15 0.21 234 0.69
*Fatalities and serious injuries per one hundred million vehicle miles traveled (non-state VMT is 42% of total, best estimate is that it is almost evenly split between urban and rural)
Roadway Departure Crash – a crash not related to an intersection, which occurs after a vehicle crosses an edge line, a centerline, or otherwise leaves the traveled way. Intersectional Crash – a crash which occurs within the limits of the intersection of two or more roads; or, a crash which occurs outside the intersection but are generally within 50 feet and a direct result of some maneuver at or because of the intersection. Pedestrians and Bicyclists Crash – a crash in which a pedestrian or pedal cyclist was struck by a motor vehicle. Fatal and Serious Injuries (F&A) – Number of people killed (Fatal) and seriously injured (Serious Injury A) in crashes.
Goals
• Reduce fatalities and serious injuries from the 2010-2014 average of 1,822 to 1,518 by December 31, 2020.
Performance Measures
• To reduce fatalities and serious injuries from the 2012-2014 average of 1,846 to 1,685 by December 31, 2017.
• To reduce the average number of roadway departure fatal and serious injuries from the 2012-2014 average of 765 to 698 by December 31, 2017.
• To reduce the average number of intersection fatal and serious injury crashes from the 2012-2014 average of 607 to 554 by December 31, 2017.

49
• To reduce the average number of pedestrian and bicycle fatal and serious injuries from the 2012-2014 average of 238 to 217 by December 31, 2017.
Strategies
• Improve the reporting, accuracy, and usefulness of the Project Safety Management System. Continue development and refinement of the Safety Tools, including:
Investigate new SPIS for all public roads using buffering protocols for including relevant crashes and to make the processing more timely each year.
Update Roadway Departure Implementation Plan. Update Intersection Implementation Plan Investigate usefulness of GIS in crash reporting. Evaluate and implement a Speed Management Plan Evaluate developing an Older Driver Safety plan.
• Develop a pilot of a Wrong Way Driving Implementation plan
• Research risks of pedestrian and bicycle crashes to further explore improving project selection for bike and pedestrian safety projects.
• Evaluate how to update systemic plans on a regular basis possibly utilizing a SPIS for all public roads.
• Work with Transportation Development Division to incorporate locations from the Roadway Departure Plan, Intersection Plans and Pedestrian/Bicycle Plan into TransGIS.
• Continue to develop a safety tracking mechanism/performance measuring to enable ODOT to track effectiveness of ODOT safety projects.
• Evaluate Older Driver and High Risk Rural Roads measures to determine if penalties occur.
• Evaluate implementation of Transition program (local roads) and ARTS program for 2017-2021 STIP years
• Revise Safety program guidance to include ARTS documentation for next STIP implementation.
• Implement the Highway Safety Manual (HSM) and related Safety Analyst software in ODOT (this is anticipated to take 2 to 5 years), including:
Develop a plan for collecting MAP 21 Fundamental Data Elements. Provide or obtain training on the Highway Safety Manual procedures. Provide or obtain training on Human Factors Implement Signalized Intersection HSM pilot project to determine data needs. Develop more Oregon specific SPFs for, including for Freeways.
• Improve coordination and communication between and within ODOT and local agencies responsible for safety, including:
Provide training for local agency staff on Safety process, data analysis and the use of new SPIS for all public roads.
Continue to improve coordination and communication with local agencies responsible for safety.
Work with TSD to develop local Safety plans for cities and counties Expand reporting capabilities to enhance usefulness of crash data to local
agencies.

50
• Continue to investigate new technologies and expand the use of proven engineering measures for improving safety, including:
Develop a plan and Implement recommendations of red clearance extension research to reduce red light running.
Evaluate and implement variable speed systems to reduce weather related incidents.
Update Signal Detection Guidance to include latest technology and detection methods for motorcycles and bicycles.
Develop new guidance to encourage use of roundabouts and separation of turning movements at rural intersections.
Evaluate the use of profiled durables as an alternative to rumble strips. Evaluate the use of low noise rumble strips. Develop new criteria and policy for expanding the use of Rumble Strips in Oregon. Develop a method of force account work for local agencies using Federal funds. Update SIM worksheet using more recent and statewide crash data. Participate in national pooled fund study of low cost countermeasures

51
Impaired Driving – Alcohol Links to the Transportation Safety Action Plan:
Action # 55 – Encourage enforcement organizations to partner with advocacy groups to conduct high visibility enforcement Encourage enforcement organizations to partner with advocacy and interest groups to conduct high visibility enforcement targeted at enhancing the safety of vulnerable road users. These efforts should use data to identify behaviors leading to crashes. Enforcement actions may affect those who place vulnerable users at risk, but may also address the actions of vulnerable users who place themselves at significant risk. Enforcement actions should include a significant media outreach component. Action # 63 – Require IID for all convictions and diversions Require ignition interlock devices (IID) use for all those convicted for DUII or diversion. Ensure existing system requires monitoring.
The Problem
• Data from the Fatality Analysis Reporting System (FARS), which is based on police, medical, and other information, show that in 2014, 33.6 percent of all traffic fatalities were alcohol-related. Eighty-nine of the fatalities involved only alcohol; and 31 were a combination of both alcohol and other drugs.
• Due to lack of monitoring methodology, there are a high number of required ignition interlock devices that are not installed as required. With new legislation passed in 2012, an additional estimated 10,000 new ignition interlock devices will be required for diversions. There is no coordinating oversight for the qualifications of the sellers or installers for neither the IID, nor standards for the technology used in the various IID’s or how frequently the IID’s report back to the courts for offender accountability. This problem of oversight will be addressed during the 2017 Legislative Session based on an interim workgroup from the House Judiciary Committee. In 2015, the Legislature passed SB397, which clarified how IID information was to flow between IID providers, courts and treatment providers, along with penalties and incentives for offender compliance with the IID requirements.
• Budget cutbacks at the local level have led to lowered participation in grant-funded overtime activities when smaller agencies do not have adequate staffing to fill straight time shifts and existing officers are over-worked. Moreover, federal requirements have discouraged smaller agency participation which may not have dedicated public information officers and budget managers to meet the non-enforcement requirements.
• The IID for Diversion statute has recently come under criticism as being excessive and legislative changes to make IID’s optional for drug-only impairment, or for blows under a 0.08 BAC were made in 2016. Additionally, administrative changes need to be made to how courts, DMV and IID providers communicate and report data to accurately track those IID’s installed for diversion. These circumstances will have a significant impact on the viability of this particular goal.

52
Impaired Driving in Oregon - Alcohol, 2010-2014
2010 2011 2012 2013 2014 2010-2014
Average Fatal & Injury Crashes 21,171 24,197 24,762 23,276 24,529 23,585 Fatalities 317 331 337 313 357 331 Alcohol Only Fatalities 90 104 95 100 89 96 Combination Alcohol & Other Drugs 17 19 28 28 31 25 Alcohol Involved Fatalities 107 123 123 128 120 120 Percent Alcohol Involved Fatalities 33.8% 37.2% 36.5% 40.9% 33.6% 36.4% Alcohol Involved Fatalities per 100 Million VMT 0.32 0.37 0.37 0.38 0.35 0.36 Drivers in Fatal Crashes with BAC .08 & above 51 81 67 85 100 77
Sources: Crash Analysis and Reporting, Oregon Department of Transportation, Fatality Analysis Reporting System, U.S. Department of Transportation.
Impaired Driving Arrests During Grant Funded Activities, FFY 2011–2015
FFY 2011 FFY 2012 FFY 2013 FFY 2014 FFY 2015 2011-2015
Average
Impaired Driving Arrests 2,144 1,881 1,390 1,646 1,385 1,689
Sources: TSD Grant files, 2011 – 2015
Impaired Driving in Oregon - Alcohol, 2010-2014
2010 2011 2012 2013 2014 2010-2014
Average Number of Confirmed Installed IID 2,816 3,037 3,756 3,597 n/a n/a DUII Offenses 22,500 21,534 20,042 17,342 n/a n/a
All Fatal & Injury Crashes 21,171 24,197 24,762 23,276 24,529 23,585 All Nighttime F&I Crashes 2,970 3,530 3,646 3,415 3,455 3,403 % Nighttime F&I Crashes 14.0% 14.6% 14.7% 14.7% 14.1% 14.4% All Fatalities 317 331 337 313 357 331
Sources: Driver and Motor Vehicle Services, Oregon Department of Transportation, Fatality Analysis Reporting System, U.S. Department of Transportation. Law Enforcement Data System, Transportation Safety Survey, Executive Summary; Intercept Research Corporation.
*Nighttime F&I Crashes are those fatal and injury crashes that occur between 8 p.m. and 4:59 a.m. Use of crash data occurring 8 p.m. and 4:59 a.m. as a proxy measure for alcohol involved crashes is generally accepted nationally and suggested by the National Highway Traffic Safety Administration.
Goals
• Reduce alcohol-related fatalities from the 2010-2014 average of 120 to 100 by 2020.
• Increase the number of Oregon municipal police agencies participating in NHTSA sponsored High Visibility Enforcement (HVE) events from the 2015 number of 43 to 56 by 2020.
• Increase the number of Oregon County Sheriff’s Offices participating in NHTSA sponsored High Visibility Enforcement (HVE) events from the 2015 number of 17 to 27 by 2020.
• Increase the number of required Ignition Interlock Devices (IID) installed on vehicles for a DUII diversion from the 2009-2013 average of 32 percent to 75 percent by 2020.

53
Performance Measures
• Reduce alcohol-related* traffic fatalities from the 2012-2014 average of 124 to 113 by December 31, 2017. *Note: Alcohol-related driving fatalities are all fatalities in crashes involving a driver or motorcycle operator with a BAC of .01 or greater.
• Decrease alcohol impaired* driving fatalities from the 2012-2014 average of 97 to 89 by December 31, 2017. (NHTSA) *Note: Alcohol-impaired driving fatalities are all fatalities in crashes involving a driver or motorcycle operator with a BAC of .08 or greater.
• Maintain the number of Oregon municipal police agencies participating in NHTSA sponsored High Visibility Enforcement (HVE) events at the 2012-2014 average of 56 (42%) without losing any net population representation by December 31, 2017.
• Increase the number of Oregon County Sheriff’s Offices participating in NHTSA sponsored High Visibility Enforcement (HVE) events from the 2015 level of 15 offices to 19 offices by December 31, 2017.
Strategies
• Target public opinion research to help guide legislative and public education efforts regarding DUII.
• Expand resources available for HVE events in prioritized areas and promote local flexibility in targeting significant events with a specific or implied alcohol focus.
• Study DUII offense/offender patterns statewide and look for incident commonalties and ways to better prioritize efforts for maximized return in the form of lowered recidivism.
• Support Law Enforcement agency media and local public safety education efforts on DUII, especially with smaller agencies that may not have dedicated public affairs staff.
• Develop and refine a standardized, on-line method to report HVE statistics compatible across state, county and city agencies to reduce administrative burden and increase participation.
• Work to develop and support key community groups that can speak as surrogates on the DUII issue throughout the state.
• Continue to study the nexus between Treatments, Prevention and Enforcement efforts to better target resources and provide solid policy advice and data-driven prioritization.
• Work with Law Enforcement, Courts and Prosecutors to examine ways to streamline the DUII process to reduce paperwork and officer failure-to-appear at administrative suspension hearings, and strengthen DUII cases overall.
• Work to replicate effective best practices for DUII specialty courts in Oregon for those communities that can support this tool locally.
• Continue support for increased judicial and prosecutorial education on DUII issues.
54
• Continue collaboration with Health and Hospital systems in Oregon to educate their staff and develop (if necessary) Memorandums of Understanding for local law enforcement agencies that can eliminate problems for hospital reporting and warrant services.
• Promote improved IID technology standards to prosecutors and courts that have resulted from the administrative rule process.
• Work across program areas within ODOT-Transportation Safety Division to find common touch points and gaps with Impaired Driving: Motorcycles, Youth, Driver Education, Judicial Programs, etc.
• Continue participation and support with the Law Enforcement Traffic Safety Advisory Committee to promote cross-jurisdictional collaboration and coordination for addressing impaired driving across the state.
• Maintain collaboration with the Governor’s Advisory Committee on DUII and promote cooperative efforts at public education, stakeholder partnerships and advancement of policy.
• Promote and support continued SFST training (and trainer) opportunities around the state.
• Promote “No Refusal” training, awareness and events in every ODOT region with the cooperation with local enforcement, prosecution and courts.
55
Impaired Driving – Drugs Links to the Transportation Safety Action Plan:
Action # 44 – Revise driving under the influence of intoxicants statutes Continue to recognize the prevalence of driving under the influence of drugs and revise DUII statutes to address the following: • Maintain, strengthen and support ARIDE and DRE training. • Support prosecution of impaired drivers through training for prosecutors regarding
alcohol and other impairing substances. • Address the legal and information issues around sobriety check points. • Expand the definition of DUII to any impairing substances. • To support implementation of these revisions, develop and offer a comprehensive
statewide DRE training program. • Pursue allowing court testimony of certified DRE even in an incomplete evaluation. Action # 50 – Expand legislation to allow hospital records of blood tests to be admitted into evidence Expand legislation that allows hospital records of toxicology tests obtained as a result of a vehicle crash to be admitted into evidence to show the presence of impairing substances to be reported within six hours to law enforcement agencies.
The Problem
• Data from the Fatality Analysis Reporting System (FARS), which is based on police, medical, and other information, shows that in 2014, 22.4 percent of all traffic fatalities were drug-related (80 deaths). Eighty-nine of the fatalities involved only alcohol; 49 involved only other drugs; and 31 were a combination of both alcohol and other drugs.
• Since the inception of the Drug Recognition Expert (DRE) program in January 1995, Oregon has experienced an increase in drug-impaired driving arrests, from 428 in 1995, to 906 in 2013. Impairment, due to drugs other than alcohol, continues to have a negative impact on transportation safety.
• Due to current Oregon law, drivers impaired solely by over-the-counter and/or non-controlled prescription drugs cannot be prosecuted for DUIIs and are therefore not referred to treatment.
• In November 2014, Oregon voted to legalize recreational marijuana, joining Colorado, Washington and Alaska. This new law took effect July of 2015 and includes possession limits larger than any other state, as well as home-grow provisions and allowances for hash oil and other potent concentrates. It is widely anticipated this new law will lead to an increase of impaired driving and marijuana involvement in fatal crashes as seen in Washington and Colorado. There is no set standard in Oregon for per se impairment as in Colorado and Washington (5 ng/ml THC) and the 2017 Legislative Session will be working to implement this law with special attention given to the implications of Impaired Driving.

56
• Anecdotal evidence from Oregon and Colorado is showing that a successful prosecution for drug-impaired driving is significantly harder to achieve because of the lack of understanding and case law about drug impairment and the lack of a per se limit for marijuana. This will prove challenging to offer a policy solution, as a per se limit can be equally problematic in gathering rapidly dissipating evidence.
• A recent U.S. Supreme Court decision (Missouri v. McNeely) in April 2013 has affected the interpretation of exigency when obtaining a blood draw in the case of DUII. Missouri v. McNeely affirms that loss of evidence (dissipation of blood alcohol levels) is not in itself an exigent circumstance that would otherwise not require a search warrant to facilitate a blood draw. Blood draws are currently the most efficient and accurate way to prove impairment at the time of arrest in the case of drugs, in particular, impairment by substances that remain in the body for a long period of time, such as marijuana.
• On December 13, 2013, the Oregon Supreme Court ruled in State v. Moore that reading the Implied Consent rights and possible administrative consequences is not unconstitutionally coercive towards a person arrested for DUII. This means that officers are now able to read Implied Consent and perhaps gain a higher level of compliance and avoid delays associated with obtaining a search warrant for further BAC analysis. However, this ruling means a rapid education effort needs to take place across the law enforcement and prosecution continuum of DUII to inform individuals of this significant change. This new information needs to be incorporated into Standardized Field Sobriety Testing, Advanced Roadside Impaired Driving Enforcement (ARIDE), Drug Recognition Expert (DRE) training, and DUII prosecutor training around the state to ensure consistent and appropriate use of this ruling at every step of the DUII process.
Impaired Driving in Oregon – Other Drugs, 2010-2014
2010 2011 2012 2013 2014 2010-2014
Average Other Drug Only Fatalities 31 27 42 46 49 39 Combination Other Drug and Alcohol 17 19 28 28 31 25 Total Other Drug Only & Combination 48 46 70 74 80 64 Percent Other Drug-Involved Fatalities 15.1% 13.9% 20.8% 23.3% 22.4% 19.2% DUII Arrests (Drugs other than Alcohol) 1,437 1,083 900 906 n/a n/a
Sources: Crash Analysis and Reporting, Oregon Department of Transportation, Fatality Analysis Reporting System, U.S. Department of Transportation, Law Enforcement Data System
57
Goals
• Maintain the total number of Impaired Driving drug-related fatalities at the 2010-2014 average of 64 by 2020.
• Increase the number of active certified Drug Recognition Experts in Oregon from the 2012-2014 average of 180 to 225 by 2020.
Performance Measures
• Maintain the total number of Impaired Driving drug-related fatalities from the 2012-2014 average at 75 by December 31, 2017.
• Maintain the number of active certified DREs at the current number of 198 by December 31, 2017.
Strategies
• Continue support for increased judicial and prosecutorial education on DUII-Drug issues.
• Collaborate with Health and Hospital systems in Oregon to educate their staff and develop (if necessary) Memorandums of Understanding for local law enforcement agencies that can eliminate problems for hospital reporting and warrant services.
• Continue support for DRE training and education programs and support a second DRE school.
• Expand ARIDE training in efforts to increase awareness and to recruit potential DRE officers from within the classes.
• Target revised public opinion research to help guide legislative and public education efforts, specifically related to the impacts of marijuana legalization related to impaired driving.
• Work with OHA to track DUII-Drugs offender patterns, recidivism rates, treatment methodology, effectiveness and overall impacts to the DUII system.
• Work with Oregon Liquor Control Commission as standards are developed for Impaired Driving as it relates to the legalization of marijuana.
• Support policy movement to include an administrative penalty for a blood test refusal under implied consent.
• Work to expand capabilities at the Oregon State Police Crime Lab in regards to blood toxicology and internally promote the lowering of the THC threshold from 20 ng/ml.
• Target creative media to educate the public on the dangers of driving impaired from now-legal marijuana, as well as a focus on Oregon's high rate of prescription drug abuse.
• Continue to closely monitor the legalization of marijuana and all aspects of this policy direction for potential impacts to Impaired Driving.
58
• Continue to educate stakeholders, community members and policy makers on the dangers and complications of a statutorily established per se limit on marijuana impairment. Maintain and promote using DRE’s whenever possible and reimbursing agencies when a DRE is called out to conduct an evaluation.

59
Judicial Outreach Link to the Transportation Safety Action Plan:
Action # 43 – Establish processes to train enforcement personnel, attorneys, judges and DMV Continue efforts to establish processes to train enforcement personnel, deputy district attorneys, judges, DMV personnel, treatment providers, corrections personnel and others. An annual training program could include information about changes in laws and procedures help increase the stature of traffic enforcement, and gain support for implementing changes.
The Problem
• There is limited outreach and training available for judges, district attorneys and court clerks/administrators relating to transportation safety issues.
• There are numerous issues of inconsistent adjudication of transportation safety laws from jurisdiction to jurisdiction which provides citizens with inconsistent and mixed messages.
• Lack of education regarding driving under the influence of any intoxicating substance, whether controlled or uncontrolled. Additionally, issues such as current DUII case law, ignition interlock device monitoring, impaired driving, and implied consent processes need to be addressed.
• Lack of education regarding impaired driving under the influence of marijuana and the new marijuana laws related to traffic safety.
• Lack of participation by Oregon Judicial Department in Transportation Safety facilitated trainings.
Judicial Outreach, 2011-2015
2011 2012 2013 2014 2015 2011-2015
Average No. of Judges trained during offered training sessions 78 70 81 77 67 75 No. of Court Staff/Administrators trained 85 28 24 25 20 36 No. of Prosecutors trained 132 135 109 97 113 117 Combined total of CLE Credits Approved 63 61 65 64.5 53.75 61.45
Sources: TSD Judicial Training Grant Reports (Impaired Driving and Judicial Education Program)

60
Goals
• Increase the number of justice and municipal court judges participating in transportation safety related judicial education programs hosted by TSD from the 2011-2015 average of 75 annually to 86 annually by 2020.
• Maintain the number of prosecutors participating in transportation safety related judicial education programs funded by TSD at the 2011-2015 average of 117 annually by 2020.
• Increase the number of training opportunities delivered by TSD for judges relating to impaired driving from the 2016 number of 1 to 2 annually.
Performance Measures
• Maintain the number of prosecutors participating in education programs at the 2013-2015 average of 106 annually by December 31, 2017.
• Increase the number of judges attending a one day judicial workshop on impaired driving from the 2016 calendar base of 0 to 30 by December 31, 2017.
• Increase the number of circuit court judges attending trainings facilitated by TSD from the 2016 calendar base of 1 to 15 by December 31, 2017.
*CLE is short for MCLE which means Minimum Continuing Legal Education activities. For judges that are active members of the Oregon State Bar, there is a minimum number of continuing legal education credits required to maintain certification as a licensed attorney.
The MCLE rules require that all regular active members complete forty-five (45) hours of approved continuing legal education activities in
each three (3) year reporting period. Of those forty-five (45) hours, nine (9) must be on the subject of professional responsibility; five (5) of the nine (9) must be legal ethics credits, one of the nine (9) professional responsibility hours must be on lawyers’ child abuse reporting obligations. Three (3) of the nine (9) professional responsibility hours must be on “elimination of bias,” which is defined as an activity “directly related to the practice of law and designed to educate attorneys to identify and eliminate from the legal profession and from the practice of law biases against persons because of race, gender, economic status, creed, color, religion, national origin, disability, age or sexual orientation.” MCLE Rule 3.2 and 5.5. http://www.osbar.org/_docs/rulesregs/mclerules.pdf.
Strategies
• Coordinate and deliver an annual Traffic Safety Education Conference for Oregon judges. Invite court administrators to attend.
• Coordinate and deliver a one day Judicial Education Workshop specific to Impaired Driving.
• Work with Oregon District Attorney’s Association to coordinate and deliver a Traffic Safety Education Conference for prosecutors.

61
Motorcycle Safety Link to the Transportation Safety Action Plan:
Action # 29 – Reduce the instance of unendorsed riders Evaluate ways to reduce the instance of unendorsed riders. Identify and implement ways to reduce the crashes of individuals in this group. Specific actions may include public awareness, additional penalties, impoundment, and other actions. Evaluate the current instruction permit in relation to training and formal endorsement. (Note: Poll to identify how dealers, motorcyclists, and the public would feel about requiring endorsement before sale, or ride-away sale.)
The Problem
• Fatal motorcyclist crashes represented 13.4 percent of the fatal crashes in 2014 while only representing 3.2 percent of the total vehicles registered in 2014.
• Alcohol and/or drugs were involved in at least 22.7 percent of motorcyclist fatalities in 2014.
• Non-endorsed motorcyclists were involved in 25 percent of motorcyclist fatalities in 2014.
• Riding too fast for conditions, exceeding posted speed and riding impaired continue to be leading rider errors in motorcyclist fatalities.
• The average age of the fatally involved rider was 44 in 2014.
Motorcycles on Oregon Roads, 2010-2014
2010 2011 2012 2013 2014 2010-2014
Average Fatal Crashes 38 38 47 32 43 40 Percent of fatal crashes 13.0% 12.3% 15.4% 11.0% 13.4% 13.0% Motorcyclists killed 38 39 49 31 44 40 Single-vehicle fatal crashes1 23 19 23 17 22 21 Multi-vehicle motorcycle vs. auto fatal crashes1 6 12 12 6 13 10 Multi-vehicle auto vs. motorcycle fatal crashes1 9 6 9 8 6 8
Fatalities Percent alcohol involved fatalities 21.1% 41.0% 28.6% 32.3% 22.7% 29.1% Percent non-endorsed fatalities 18.4% 33.3% 16.3% 25.8% 25.0% 22.4% Percent unhelmeted fatalities 7.9% 10.5% 6.4% 0.0% 16.3% 8.2%
Injury Crashes 768 919 1,028 953 874 908 Percent of injury crashes 3.7% 3.8% 4.2% 4.1% 3.6% 3.9%
Source: Crash Analysis and Reporting, Oregon Department of Transportation, Fatality Analysis Reporting System, U.S. Department of Transportation. TSD files1.

62
Motorcycles on Oregon Highways, 2010-2014 (continued)
2010 2011 2012 2013 2014 2010-2014
Average Registered Motorcycles 131,652 131,427 130,885 131,464 132,123 131,510 Percent of registered vehicles 3.3% 3.3% 3.2% 3.2% 3.2% 3.2% Motorcycle fatalities per registered motorcycle (in thousands) 0.29 0.30 0.37 0.24 0.33 0.31
Observation Data Percent Helmet Use 96% 98% 97% 100% n/a n/a
Percent Motorcyclists wearing non-DOT helmet 4% 2% 3% 3% n/a n/a
TEAM Oregon Students Trained 8,779 10,286 11,805 11,230 11,279 10,676 Source: Crash Analysis and Reporting, Oregon Department of Transportation, Fatality Analysis Reporting System, U.S. Department
of Transportation. NHTSA Shoulder Harness and Motorcycle Helmet Usage Study, Intercept Research Corporation. TEAM Oregon Motorcycle Safety Program; TSD files.
Goal
• Reduce the number of people killed or seriously injured in motorcycle crashes from the 2010-2014 average of 289 to 241 by 2020.
Performance Measures
• Reduce fatal motorcycle crashes when the rider was alcohol impaired and/or involve other drugs from the 2012-2014 average of 10 to 9 by December 31, 2017.
• Reduce fatal motorcycle crashes when the rider was not properly endorsed from the 2012-2014 average of 9 to 8 by December 31, 2017.
• Reduce speed-related motorcycle crashes from the 2012-2014 average of 263 to 240 by December 31, 2017.
• Reduce fatal motorcycle crashes that occurred while negotiating a curve from the 2012-2014 average of 26 to 23 by December 31, 2017.
• Decrease motorcyclist fatalities from the 2012-2014 year average of 44 to 40 by December 31, 2017. (NHTSA)
• Decrease unhelmeted motorcyclist fatalities from the 2012-2014 average of 3 to 2 by December 31, 2017. (NHTSA)
Strategies
• Collaborate with the Governor’s Advisory Committee on Motorcycle Safety, law enforcement and motorcycle groups to educate riders on the effects of riding under the influence of intoxicants, speeding and the consequences, and other motorcycle related topics
• Continue the implementation of the recommendations described in the 2015 NHTSA / Oregon Motorcycle Safety Program Assessment.
• Begin developing/implementing new TSAP/HSP Action Items into Oregon Motorcycle Safety Program.
• Work with the Assistant Attorney General assigned to ODOT to develop rules applicable to motorcycle safety program.

63
• Continue proportional funding of the TEAM OREGON basic rider training, intermediate rider training, rider skills practice and advanced rider training courses at strategic locations throughout the state.
• Assess the potential of partnering with health care groups and rider training providers to promote ongoing learning and training for riders that complete their health engagement model questionnaire.
• Assess data needs and available resources for strategic focus on locations, riders, skill levels, and demographics to address high risk areas, high risk behavior, low enforcement locations, and Oregon specific causative factors related to severe injury and fatality crashes.
• Continue the motorcycle campaigns in the Transportation Safety Division’s Public Information and Education Program, focusing on motorist awareness of motorcyclists, separating drinking/drug use and riding, correct licensing, proper protective riding gear, ongoing rider training and speed related issues.
• Work with internal and external partners to leverage messaging efforts for consistency, timeliness, and customer relevancy.
• Ensure that media products are designed to target the majority of Oregon motorcyclists, with a focus on the demographic(s) most represented in the crash statistics.
• Ensure motorcycle training courses are located within reasonable travel distance of Oregon’s motorcycle population and courses are offered within a maximum of 60 days at all locations.

64

65
Occupant Protection Link to the Transportation Safety Action Plan:
Action # 75 – Continue public education efforts aimed at proper use of child safety seats Continue public education efforts aimed at increasing proper use of safety belts and child restraint systems.
The Problem
• Non-use of Restraints: According to the 2015 Oregon observed use survey, 4.5 percent of front seat passenger vehicle occupants did not use restraints. During 2013, Oregon crash reports (FARS) indicate 25 percent of motor vehicle occupant fatalities were unrestrained and 7 percent were of unknown restraint use status.
• Improper Use of Safety Belts: Oregon law requires “proper” use of safety belt and child restraint systems. Some adult occupants inadvertently compromise the effectiveness of their belt systems and put themselves or other occupants at severe risk of unnecessary injury by using safety belts improperly. This is most often accomplished by placing the shoulder belt under the arm or behind the back, securing more than one passenger in a single belt system, or using only the automatic shoulder portion of a two-part belt system (where the lap belt portion is manual).
• Improper Use of Child Restraint Systems: Data collected through child seat fitting stations indicate the majority of child restraints are used incorrectly – up to 73 percent in 2014, according to Safe Kids Worldwide. Drivers are confused by frequently changing laws, national “best practice” recommendations, and constantly evolving child seat technology.
• Premature Graduation of Children to Adult Belt Systems: Current crash data from 2014 indicates that 43 percent of injured children under age twelve were reporting not using a child restraint system. . And although Oregon law requires use of child restraints to age eight or four feet nine inches in height, Safe Kids Worldwide indicates many children will be eight to twelve years of age before they meet this height requirement and can fit properly in an adult belt system.
• Affordability of Child Restraint Systems: Caregivers may have difficulty affording the purchase of child safety seats or booster seats, particularly when they need to accommodate multiple children. This contributes to non-use or to reuse of second-hand seats which may be unsafe for various reasons.

66
NHTSA Observed Use Survey, 2011–2015
Front Seat Outboard Use 06-10 Average 2011 2012 2013 2014 2015
2011-2015 Average
Passenger car 97% 97% 97% 98% 98% 96% 97% Source: NHTSA Seatbelt Usage Study Post-Mobilization Findings, Intercept Research Corporation and Portland State University, This
Study employs trained surveyors to examine, from outside the vehicle, use or non-use of a shoulder harness by the driver and right front outboard occupant of passenger vehicles.
*Not reported under NHTSA methodology changes made for 2013.
Occupant Use Reported in Crashes, 2010–2014
2010 2011 2012 2013 2014
2010-2014 Average
Total Occupant Fatals 194 215 199 216 232 211 Number Unrestrained 50 61 61 54 61 57 Percent Unrestrained 25.8% 28.4% 30.7% 25.0% 26.3% 27.2% Number Unrestrained, Night Time 40 55 52 55 38 48 Percent Unrestrained, Night Time 44.0% 51.4% 45.6% 48.2% 54.3% 48.7% Total Occupants Injured 27,584 31,787 32,512 29,955 31,809 30,729 Percent Injured Restrained 89.3% 87.3% 87.4% 88.2% 96.1% 89.7% Total Injured Occupants Under Age Twelve 1,288 1,662 1,476 1,555 1,558 1,508 Percent of Injured in Child Restraint 46.6% 42.8% 47.2% 42.4% 42.7% 44.4%
Source: Crash Analysis and Reporting, Oregon Department of Transportation, Fatality Analysis Reporting System, U.S. Department of Transportation. I: Restrained” figures include only those coded as “Belt Used” or “Child Restraint Used.” “Unrestrained” figures include only those coded as “None Used”. “Nighttime” figures are from crashes that occurred between the hours of 6 p.m. and 6 a.m.
Belt Enforcement Citations During Grant Funded Activities, 2011–2015
FFY 2011 FFY 2012 FFY 2013 FFY 2014 FFY 2015 2011-2015
Average Seat belt citations issued 15,829 10,116 5,096 7,429 5,411 8,776
Source: TSD Grant files, 2011 - 2015, Oregon Department of Transportation (note: includes belt and child restraint)
Goals
• To increase proper safety belt use from the 2015 usage rate of 96 to 99 percent, among passenger vehicle front seat outboard occupants, as reported by the NHTSA post-mobilization observed use survey, by 2020.
• To increase percentage of reported proper child restraint use among injured occupants under twelve years old from the 2010-2014 average of 44 percent to 53 percent by 2020.
• To reduce the percentage of unrestrained occupant fatalities from the 2010-2014 average of 27 to 23 percent, as reported by FARS, by 2020.

67
Performance Measures
• Increase statewide observed seat belt use among front seat outboard occupants in passenger vehicles, as determined by the NHTSA compliant survey, from the 2015 usage rate of 95 percent to 97 percent by December 31, 2017. (NHTSA)
• Decrease unrestrained passenger vehicle occupant fatalities in all seating positions from the 2012-2014 average of 59 to 54 by December 31, 2017. (NHTSA)
• Decrease unrestrained nighttime passenger vehicle occupant fatalities from 2012-2014 average of 48 to 44 by December 31, 2017. (NHTSA)
• Increase percentage of reported proper child restraint use among injured occupants under twelve years old from the 2012-2014 average of 44 percent to 48 percent by 2017.
Strategies
• Conduct public education activities to explain why vehicle restraints are needed, how to properly use them, and how to meet requirements of Oregon law.
• Provide educational materials access to general public, parents, child care providers, health professionals, emergency medical personnel, law enforcement officers, and the court system.
• Provide funding for overtime enforcement of safety belt/child restraint laws.
• Maximize enforcement visibility by encouraging multi-agency campaigns, and coordinating campaigns with the timing of news releases, PSA postings, and nationwide events such as “Click It or Ticket” and National Child Passenger Safety Week.
• Target marketing and enforcement campaigns to high-risk and low-use rate occupants.
• Provide funding for statewide coordination of child passenger safety technician training, and to strengthen service capacities of local child seat fitting station/seat distribution programs.
• Subsidize purchase of restraints for no or low-income families.
• Support and promote nationally recognized “best practice” recommendations for motor vehicle restraint use.

68

69
Pedestrian Safety Link to the Transportation Safety Action Plan:
Action # 97 – Increase emphasis on programs that will encourage pedestrian travel Increase emphasis on programs that will encourage pedestrian travel and improve pedestrian safety. The following efforts should be undertaken. Provide a consistent and comprehensive program for the Pedestrian Safety Program to: • Expand public education efforts that focus on driver distraction and driver behavior near
schools. • Expand public education efforts relating to pedestrian awareness and responsibilities. • Encourage more aggressive enforcement of pedestrian traffic laws, particularly near
schools, parks and other pedestrian intensive locations. • Consider legislative approaches to improving safety for the disabled and elderly
communities. • Assist communities to establish pedestrian safety efforts by providing technical
assistance and materials. • Address and resolve the widespread reluctance to install marked crosswalks; establish
where they are appropriate and where other safety enhancing measures are needed. • Require walkways and safe pedestrian crossings on all appropriate road projects. • The lack of walkways and safe crossing opportunities contribute to pedestrian crashes. • Increase funding for pedestrian system deficiencies including walkways and crossings.
Funds should be allocated to serve schools, transit, business and commercial uses, and medium to high-density housing.
• Work with local and state transit authorities to review policies determining siting of transit stops and revise as needed to enhance safe access.
• Consider legislation requiring that police officials must investigate all pedestrian automobile crashes leading to injury.
• Support research to increase walking and promote pedestrian safety.
The Problem
• In Oregon in 2013, there were 52 pedestrian fatalities, or 16.6 percent of the total Oregon motor vehicle fatalities. This is a decrease from 2012, where 60 pedestrians were killed, or 17.9 percent of the total Oregon fatalities.
• In 2013, 26.9 percent of the pedestrians killed (14 of 52) were crossing at intersections or in a crosswalk. Of the fatal crashes at an intersection, 79 percent involved a vehicle traveling straight through an intersection.
• In 2013, 65.7 percent of the non-fatal pedestrian crashes (499 of 759) occurred at an intersection. Of these crashes, 41.5 percent involved a vehicle turning left through the intersection (207 of 499).
• In 2013, visibility continued to have a negative influence on Pedestrian deaths (wore dark clothing in the dark with or without lighting, etc.).
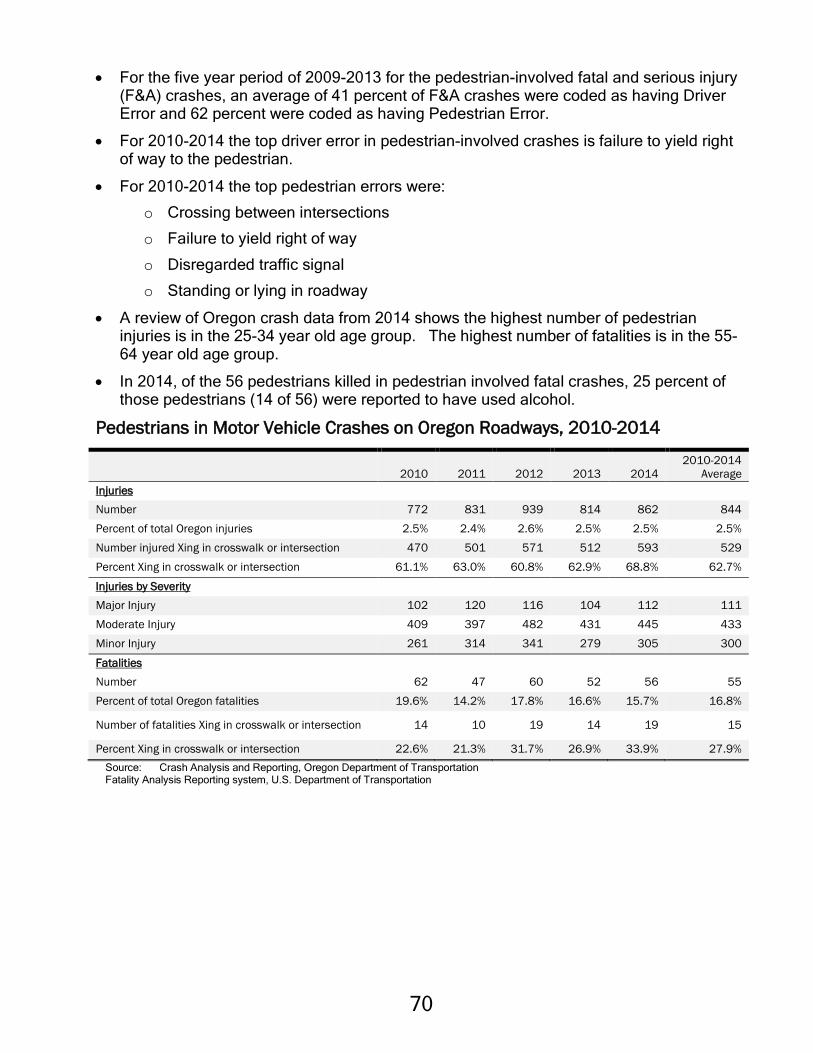
70
• For the five year period of 2009-2013 for the pedestrian-involved fatal and serious injury (F&A) crashes, an average of 41 percent of F&A crashes were coded as having Driver Error and 62 percent were coded as having Pedestrian Error.
• For 2010-2014 the top driver error in pedestrian-involved crashes is failure to yield right of way to the pedestrian.
• For 2010-2014 the top pedestrian errors were:
o Crossing between intersections
o Failure to yield right of way
o Disregarded traffic signal
o Standing or lying in roadway
• A review of Oregon crash data from 2014 shows the highest number of pedestrian injuries is in the 25-34 year old age group. The highest number of fatalities is in the 55-64 year old age group.
• In 2014, of the 56 pedestrians killed in pedestrian involved fatal crashes, 25 percent of those pedestrians (14 of 56) were reported to have used alcohol.
Pedestrians in Motor Vehicle Crashes on Oregon Roadways, 2010-2014
2010 2011 2012 2013 2014 2010-2014
Average Injuries Number 772 831 939 814 862 844 Percent of total Oregon injuries 2.5% 2.4% 2.6% 2.5% 2.5% 2.5% Number injured Xing in crosswalk or intersection 470 501 571 512 593 529 Percent Xing in crosswalk or intersection 61.1% 63.0% 60.8% 62.9% 68.8% 62.7%
Injuries by Severity Major Injury 102 120 116 104 112 111 Moderate Injury 409 397 482 431 445 433 Minor Injury 261 314 341 279 305 300
Fatalities Number 62 47 60 52 56 55 Percent of total Oregon fatalities 19.6% 14.2% 17.8% 16.6% 15.7% 16.8%
Number of fatalities Xing in crosswalk or intersection 14 10 19 14 19 15
Percent Xing in crosswalk or intersection 22.6% 21.3% 31.7% 26.9% 33.9% 27.9% Source: Crash Analysis and Reporting, Oregon Department of Transportation Fatality Analysis Reporting system, U.S. Department of Transportation
71
Goals
• Reduce pedestrian fatal and serious injuries from the 2010-2014 average of 166 to 138 by December 31, 2020.
Performance Measures
• Reduce pedestrian fatal and serious injuries from the 2012-2014 average of 167 to 152 by December 31, 2017.
• Reduce pedestrian fatalities from the 2012-2014 average of 53 to 49 by December 31, 2017. (NHTSA)
• Reduce fatal and serious injury crashes for the primary driver error of "failed to yield right-of-way to pedestrian", from the 2012-2014 average of 41to 37 by December 31, 2017.
Strategies
• Work with Gard Communications to develop a media campaign with corresponding safety messages to pedestrians and drivers promoting sharing the road.
• Continue outreach to pedestrians and drivers promoting core messages that every intersection is a crosswalk, look out for each other, be visible, the first step to safety is yours, and heads up for safety.
• Continue working with Oregon Impact in providing pedestrian safety enforcement operations statewide with local enforcement agencies.
• Continue to update pedestrian safety educational materials and develop Spanish translation versions for statewide distribution.
• Work with Region Traffic Safety Coordinators to coordinate with interested communities the promotion of pedestrian safety messages and corresponding safety materials. Continue to work with ODOT: Active Transportation Unit in providing brochures on pedestrian/driver signals like HAWK; DMV in providing information on recently passed pedestrian legislation.

72

73
Police Traffic Services Link to the Transportation Safety Action Plan:
Action # 35 – Develop a Traffic Law Enforcement Strategic Plan Develop a Traffic Law Enforcement Strategic Plan which addresses the needs and specialties of the Oregon State Police, county sheriffs and city police departments. The plan should be developed with assistance from a high level, broadly based task force that includes representatives of all types of enforcement agencies, as well as non-enforcement agencies impacted by enforcement activities. Specifically, the plan should develop strategies to address the following: • Speed Issues (enforcement, laws, legislative needs, equipment, public information and
education.) Targeted analysis of enforcement of laws that would address corner and “run off the road” crashes.
• Aggressive driving and hazardous violation issues.
• Crash investigations curriculum for an expanded police academy.
• Rail trespass issues and highway rail crossing crashes.
• Identify and seek enabling legislation for the best methods of providing secure, stable funding for traffic law-enforcement.
• Staffing needs; training; use of specialized equipment such as in-car video cameras, mobile data terminals, computerized citations (paperless), statewide citation tracking system, lasers and improved investigation tools; handling of cases by courts, information needs, and financing should be included in the strategic plan.
• Development of automated forms to increase law enforcement efficiency, and increase the number of police traffic crash forms completed and submitted.
• Maintenance of traffic teams and identify incentives to persuade law enforcement to establish teams locally.
• Seek mechanisms to automate enforcement activities.
• Identify strategies that encourage voluntary compliance, negating the need for enforcement activities.
• As specific elements of the plan are developed and finalized, begin implementation of those elements.

74
Oregon’s Traffic Safety Enforcement Program assists the Transportation Safety Division in preventing traffic violations, crashes, fatalities and injuries in areas most at risk for such incidents. Oregon’s Performance Plan provides an analysis of data for crashes, crash fatalities and injuries in areas of highest risk. Based on the analysis Oregon employs our resources with continuous follow-up and adjustment of our plan throughout the year. Additional funding allows for DUII overtime enforcement in local jurisdictions throughout the state and to increase awareness and compliance with impaired driving laws.
Evidence Based Traffic Safety Enforcement Plan The Oregon Department of Transportation, in conjunction with its law enforcement partners, provides for an evidence based traffic safety enforcement program designed to prevent traffic safety violations, crashes, and crash fatalities and injuries. The State works with its partners to identify willing law enforcement partners with which to conduct enforcement projects. Each is designed to coordinate with national mobilizations and efforts for maximized visibility and effectiveness. The State works with agencies to provide for a continuous follow-up to the efforts, adjusting plans in response to condition changes. At the end of each funding cycle, a program area performance report is developed to evaluate the State’s performance in meeting the goals, which includes regional performance and needs, cost-effective analysis of the deployed strategies , and offering suggestions for improved performance in future cycles, or a shifting of resources.
In 2017, the Oregon State Police, Oregon State Sheriff’s Association, and local city police departments involved in our enforcement grants (High Visibility Enforcement), are required to participate in:
Thanksgiving and Christmas/New Year’s DUII enforcement activities February 6 - 19 blitz for occupant protection May 22 through June 4 blitz and emphasize Nighttime/daytime Belt Use,
Prohibition of Minors in Pickup Truck beds - to complement nationwide "Click It or Ticket" mobilization
August 18 through September 3 blitz and emphasize Child Seats/Fitting Station Referrals to complement National Child Passenger Safety Week
Agencies are also allowed to use grant funding for: Super Bowl Memorial Day 4th of July Labor Day Specific local activities during which overtime enforcement would be beneficial to
the local area, such as games, festivals, fairs, etc. Overtime enforcement activity data is compiled from individual offices to include hours worked, number and type of enforcement contacts made on overtime, and educational activities and copies of media releases/news articles. Participating agencies participate in enforcement blitzes and coordinate with media coverage of the projects.

75
The Problem
• The need for increased enforcement resources is not generally recognized outside the law enforcement community.
• There is a need for increased training for police officers in the use of speed measurement equipment (radar/lidar), Crash Investigation Training, and traffic law and other changes from the recent legislative sessions (legalization of marijuana and its impact on impaired driving).
• There is a need to increase the available training to certified motorcycle officers in Oregon.
• Decreasing budgets and inadequate personnel prevent most enforcement agencies from responding to crashes that are non-injury and non-blocking.
• Many county and city police department’s lack the resources necessary to dedicate officers to traffic teams thus would benefit from additional enforcement training and overtime grants.
• Many agencies are struggling to even maintain traffic enforcement full-time employment (traffic teams/motor units) and don’t have the resources to increase traffic enforcement.
Police Traffic Services, 2010-2014
2010 2011 2012 2013 2014 2010-2014
Average Total Fatal Traffic Crashes 292 310 305 292 321 304 Total Injury Crashes 20,879 23,887 24,457 22,975 24,208 23,281 Total Fatalities 317 331 337 313 357 331 Total Injuries 30,493 35,031 36,083 33,149 35,054 33,962 Top 10 Driver Errors in Total Crashes: Failed to avoid stopped or parked vehicle ahead other than school bus 12,782 14,611 15,104 14,276 14,738 14,302 Did not have right-of-way 7,984 8,972 9,124 8,761 9,533 8,875 Ran off the Road 4,882 6,209 6,427 5,969 6,176 5,933 Failed to maintain lane 5,546 7,652 7,568 6,771 5,767 6,661 Driving too fast for conditions 4,589 5,229 4,720 4,250 4,627 4,683 Inattention 2,385 2,425 2,451 2,681 3,521 2,693 Following too closely 2,264 2,761 2,749 2,933 3,141 2,770 Improper change of traffic lanes 2,162 2,241 2,233 2,533 2,669 2,368 Left turn in front of oncoming traffic 2,112 2,304 2,286 2,026 2,377 2,221 Failed to decrease speed for slower moving - - - - 2,343 n/a
Number of Speed Involved Convictions 149,493 139,554 132,483 130,305 113,950 133,157 Total number of all entered traffic convictions 426,566 430,555 413,569 n/a n/a n/a No. of Law Enforcement Officers 5,658 5,610 5,480 5,435 5,430 5,523 Officers per 1,000 Population 1.47 1.47 1.41 1.25 n/a n/a Number of Speed eCitations Issued 24,103 80,190 93,080 117,826 136,700 90,380 Total Number of eCitations Issued 70,000 180,039 223,189 272,993 326,970 214,638 Number of eCrash Reports Completed 1,198 3,942 8,063 9,296 12,200 6,944
Source: Crash Analysis and Reporting, Oregon Department of Transportation, Fatality Analysis Reporting System, U.S. Department of Transportation, Department of Public Safety Standards and Training, Driver and Motor Vehicle Services, Oregon Department of Transportation, Oregon State Police Forensic Services, Transportation Safety Survey, Executive Summary; Intercept Research Corporation, eCitation/eCrash data warehouse
Note: Speed- involved offenses and convictions count the following statutes: ORS 811.100, 811.111, and 811.125.
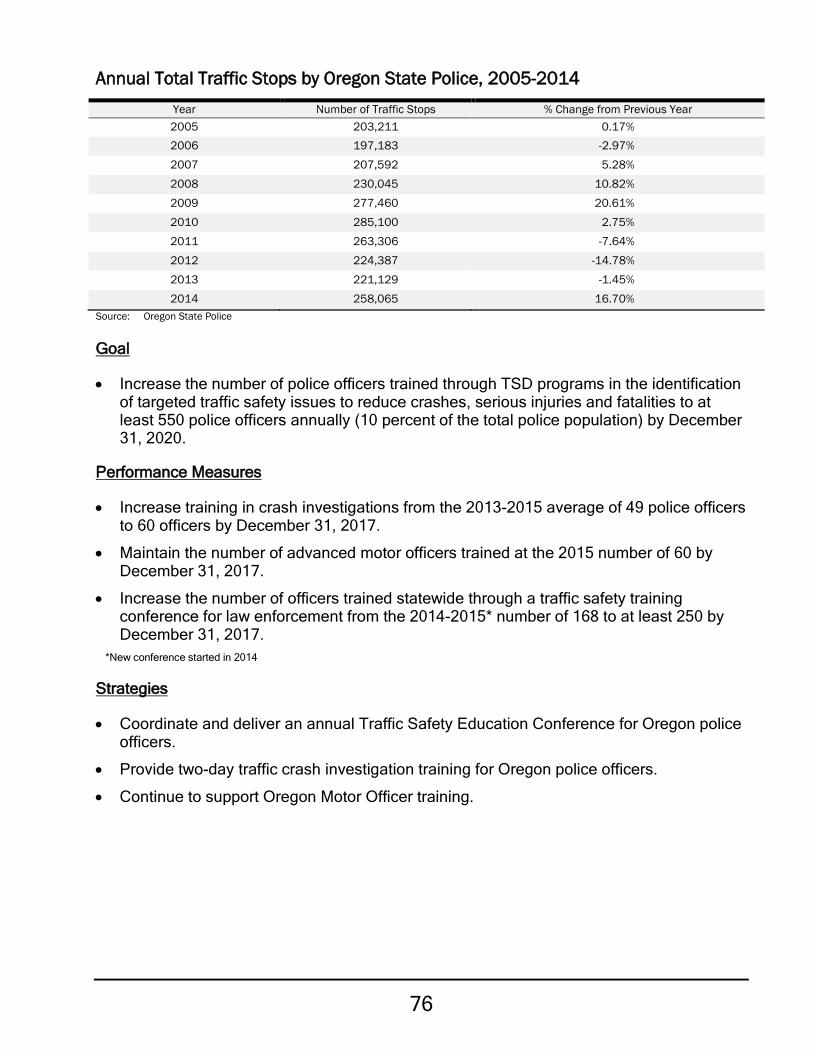
76
Annual Total Traffic Stops by Oregon State Police, 2005-2014
Year Number of Traffic Stops % Change from Previous Year 2005 203,211 0.17% 2006 197,183 -2.97% 2007 207,592 5.28% 2008 230,045 10.82% 2009 277,460 20.61% 2010 285,100 2.75% 2011 263,306 -7.64% 2012 224,387 -14.78% 2013 221,129 -1.45% 2014 258,065 16.70%
Source: Oregon State Police
Goal
• Increase the number of police officers trained through TSD programs in the identification of targeted traffic safety issues to reduce crashes, serious injuries and fatalities to at least 550 police officers annually (10 percent of the total police population) by December 31, 2020.
Performance Measures
• Increase training in crash investigations from the 2013-2015 average of 49 police officers to 60 officers by December 31, 2017.
• Maintain the number of advanced motor officers trained at the 2015 number of 60 by December 31, 2017.
• Increase the number of officers trained statewide through a traffic safety training conference for law enforcement from the 2014-2015* number of 168 to at least 250 by December 31, 2017.
*New conference started in 2014
Strategies
• Coordinate and deliver an annual Traffic Safety Education Conference for Oregon police officers.
• Provide two-day traffic crash investigation training for Oregon police officers.
• Continue to support Oregon Motor Officer training.

77
Region 1 Link to the Transportation Safety Action Plan:
Action # 19 – Provide a transportation safety specialist position in each of the ODOT regions Continue to provide for and enhance the transportation safety specialist positions in each of five regions, providing a safety perspective to all operations as well as direct communication between ODOT and local transportation safety agencies and programs. Action # 108 - Continue efforts to enhance communications between engineering, enforcement, education and EMS Continue efforts to enhance communication between engineering, enforcement, education, and EMS.
Region 1 Overview
Region 1 oversees the public’s transportation investments in Clackamas, Hood River, and Multnomah counties and a portion of Washington County. Motorists, truckers, buses, and bicyclists travel more than 17 million miles on Region 1 highways every day. Region 1 is responsible for: • 879 miles of highway • 231 miles of urban bike facilities;
428 rural miles with shoulders bicyclists can use
• 194 miles of sidewalks and 136 enhanced crossings
• 1081 state owned bridges • 803 traffic signals • 142 ramp meters
• Over 100 highway cameras • Over 3,500 major signs • Thousands of smaller signs, lights,
variable signs, etc. • Nine cities and two counties, with
established local traffic safety committees or similar action groups
• Two safety corridors are within the Region
The Problem
• More than 99 percent of the fatal and serious injury crashes in Region 1 involve human factors, as opposed to vehicle or roadway issues. Building a positive safety culture to change human behaviors is needed to continue to reduce fatal and serious injury crashes, with emphasis on positive messages, community building, and developing partnerships not only in traffic engineering, EMS, and enforcement; but looking more broadly to work with health and prevention programs and community groups.
• Intersection crashes continue to rise in Region and statewide, with fatal and serious injury crashes holding steady. Roadway departure is a major factor in Region 1 crash fatalities and serious injuries. HSIP funds are being used through the ARTS program to help address engineering solutions for intersections, and for roadway departure with curve warning signs and rumble strips.

78
• Speed, impaired driving, and young drivers continue to be top contributing factors in crashes resulting in fatalities and serious injuries on the roads in Region 1.
Speed fatalities rose in 2013, but were lower again in 2015while serious injuries have been dropping from their 2010-2011 level.
Fatal and serious injury crashes involving Drivers 15-20 have declined from a 2011 high, but are still fluctuating.
Alcohol impaired crash fatalities and serious injuries declined more than ten percent in Region 1 in 2014.
Legalized recreational marijuana use in Oregon state law as of July 2015 raises concerns that impaired driving due to drugs will increase; intensifying the continued need to work on human factors, and getting safety messages to resonate with drivers to be effective at changing behaviors.
• Pedestrian fatalities in Region 1 increased 7 percent in 2014 compared to the 2011-2013 average of 23. Distracted driving is becoming a greater safety threat to all modes of transportation, and is suspected to be under reported. Distraction includes use of cell-phones, GPS, computer devices as well as reading, eating, and conversation.
• With the MAP-21 and now the FAST-Act emphasizing reduction of fatal and serious injury crashes on all facilities, ODOT is transitioning to assess all roads for safety projects. Through the ARTS (All Roads Traffic Safety) program, ODOT is apportioning some of the funds to hot spots, such as identified by SPIS; and funds to systemic low cost, high benefit countermeasures applied systematically for roadway departure, intersections, and bicycle and pedestrian issues. ARTS presents new opportunities for partnerships with local governments.
• Media attention and political interest dedicated to specific locations or problems is often not related to the statistical injury potential of the actual crash problem. It’s important to continue to work in a data driven process, providing information to inform development of strategies.

79
Region 1, Transportation Safety Information
Fatalities - Region 1
2010 2011 2012 2013 2014 2010-2014
Average Clackamas County 21 32 20 16 38 25 Hood River County 2 5 5 2 1 3 Multnomah County 31 38 45 52 28 39 Washington County 11 13 19 21 16 16 Region 1 Fatalities Total 65 88 89 91 83 83 Statewide Fatalities 317 331 337 313 356 331 Region 1 Fatalities Percent of State 20.50% 26.59% 26.41% 29.07% 23.31% 25.18% Region 1 Fatalities per 100k Population 3.90 5.24 5.25 5.30 4.69 4.88 Fatalities & Serious Injuries - Region 1
2010 2011 2012 2013 2014 2010-2014
Average Region 1 Fatalities & Serious Injuries 583 579 548 555 595 612 Statewide Fatalities & Serious Injuries 1,699 1,872 1,956 1,731 1,852 1,822
Speed Involved Fatalities – Region 1
2010 2011 2012 2013 2014 2010-2014
Average Clackamas County 5 15 5 9 13 9 Hood River County 0 1 1 2 0 1 Multnomah County 10 11 15 22 12 14 Washington County 4 5 6 5 4 5 Region 1 Speed Involved Fatalities 19 32 27 38 29 29 Statewide Total Speed Involved Fatalities 116 127 114 120 144 124 Region 1 Speed Involved Fatalities Percent of State 16.38% 25.20% 23.68% 31.67% 20.14% 23.41% Region 1 Speed Involved Fatalities per 100k Population 1.14 1.91 1.59 2.21 1.64 1.70
Speed Involved Fatalities & Serious Injuries - Region 1
2010 2011 2012 2013 2014 2010-2014
Average Region 1 Speed Involved F&A Total 144 147 125 115 117 130 Statewide Total Speed Involved F&A Total 519 557 519 484 502 516

80
Alcohol Involved Fatalities – Region 1
2010 2011 2012 2013 2014 2010-2014
Average Clackamas County 7 12 9 10 9 9 Hood River County 1 1 2 0 0 1 Multnomah County 15 17 24 27 12 19 Washington County 6 3 8 6 6 6
Region 1 Alcohol Involved Fatalities 29 33 43 43 27 35
Statewide Total Alcohol Involved Fatalities 107 123 123 128 120 120
Region 1 Alcohol Involved Fatalities Percent of State 27.10% 26.83% 34.96% 33.59% 22.50% 29.00%
Region 1 Alcohol Involved Fatalities per 100k Population 1.74 1.96 2.54 2.50 1.53 2.05
Alcohol Involved Fatalities & Serious Injuries – Region 1
2010 2011 2012 2013 2014 2010-2014
Average Region 1 Alcohol Involved F&A Total 98 112 152 106 90 112 Statewide Total Alcohol Involved F&A Total 283 368 413 346 307 343
Population - Region 1
County 2010 2011 2012 2013 2014 2010-2014
Average Clackamas County 381,775 378,480 381,680 386,080 397,385 384,081 Hood River County 21,850 22,625 22,875 23,295 24,245 23,085 Multnomah County 730,140 741,925 748,445 756,530 777,490 752,235 Washington County 532,620 536,370 542,845 550,990 570,510 546,357
Region 1 Total 1,666,385 1,679,400 1,695,845 1,716,895 1,769,630 1,705,758
Bicyclist and Pedestrian Involved Fatalities & Serious Injuries – Region 1
2010 2011 2012 2013 2014 2010-2014
Average Clackamas County 17 29 17 15 25 21 Hood River County 0 2 1 0 2 1 Multnomah County 58 60 85 70 84 71 Washington County 19 23 31 22 19 23 Region 1 Total 94 114 134 107 130 116 Statewide Total 261 246 255 220 240 234

81
Distracted Driver Involved Fatalities & Serious Injuries – Region 1
2010 2011 2012 2013 2014 2010-2014
Average Clackamas County 8 9 4 7 4 6 Hood River County 1 2 0 0 5 2 Multnomah County 4 8 7 4 14 7 Washington County 10 16 8 15 11 12
Region 1 Total 23 35 19 26 34 27
Statewide Total 114 123 138 111 154 129 Sources: Crash Analysis and Reporting, Oregon Department of Transportation, Fatality Analysis Reporting System, U.S. Department
of Transportation, Center for Population Research and Census, School of Urban and Public Affairs, Portland State University Note: Distracted driving involved fatalities include the following behaviors: passenger interfered with the driver, driver’s attention was
distracted, an active participant was using a cell phone, or driver inattention.
Goals
• Decrease fatalities in Region 1 from the 2010-2014 average of 83 to 69 by 2020.
• Decrease serious injuries in Region 1 from the 2010-2014 average of 529 to 440 by 2020.
Performance Measures
• Decrease speed involved fatalities and serious injuries in Region 1 from the 2012-2014 average of 119 to 109 by December 31, 2017.
• Decrease alcohol fatalities and serious injuries in Region 1 from the 2012-2014 average of 116 to 106 by December 31, 2017.
• Decrease roadway departure fatalities and serious injuries in Region 1 from the 2012-2014 average of 165 to 151 by December 31, 2017.
• Decrease fatalities and serious injuries in bicycle and pedestrian crashes in Region 1 from the 2012-2014 average of 124 to 113 by December 31, 2017.
• Decrease fatalities and serious injuries in crashes where the driver was age 15-20 in Region 1 from the 2012-2014 average of 80 to 73 by December 31, 2017.
• Decrease fatalities and serious injuries in motorcycle crashes in Region 1 from the 2012-2014 average of 79 to 72 by December 31, 2017.
• Decrease fatalities and serious injuries related to driver distraction in Region 1 from the 2012-2014 average of 26 to 24 by December 31, 2017.
Strategies
• Advocate for transportation safety in Region 1 by providing information and education on all aspects of traffic safety to community organizations, local agencies, ODOT staff and traffic safety committees.
• Build and maintain partner contacts in all four counties in Region 1, with partners including law enforcement, health educators, traffic engineering, health programs, and injury prevention specialists.

82
• Build contacts and work within the ODOT Region to keep safety at the forefront across business lines and divisions within the agency in maintenance, analysis, planning, project selection, design, and execution of projects.
• Provide leadership to develop a safety culture throughout Region 1 focused on reducing fatal and serious injury crashes through addressing behavioral issues. Encourage multi-disciplinary teams to collaborate and leverage efforts on strategic actions to increase the effectiveness of education, outreach, and law enforcement efforts region wide.
• Work with Region 1 Traffic Engineering on hot spot as well as systemic approaches to improving roadway safety: oversee the Region 1 SPIS report review of high crash locations and potential remedies at the expected 200+ SPIS sites in Region 1; and support HSIP planning and implementation for ARTS (All Roads Traffic Safety) hot spot and systemic engineering approaches to highway safety.
• Analyze emerging crash problem areas: develop methodology to identify problem areas in Region 1, establish efforts aimed at reducing crashes in these categories; including roadway departure, young drivers, speed, impaired driving, pedestrian and bicycle crashes, distracted driving, and motorcyclists.
• Promote and encourage attendance at available traffic safety related training offered to ODOT non-safety personnel, local jurisdiction enforcement, engineers and managers, and community volunteers. Consider additional training needs, and support development of new training opportunities; for example evaluation, data analysis, “leading edge” programs, and partnering with the media.
• Continue 4 E’s effort (engineering, education, enforcement, and EMS) on at least one corridor in Region 1. Assess results to improve other corridors.
• Encourage local and regional governments to consider a TSAP (Transportation Safety Action Plan) style approach to traffic safety. Provide state data (like crash, health, economic loss, etc.) to them as needed to help support traffic safety efforts.

83
Region 2 Link to the Transportation Safety Action Plan:
Action # 108 - Continue efforts to enhance communications between engineering, enforcement, education and EMS Continue efforts to enhance communication between engineering, enforcement, education, and EMS.
Region 2 Overview
ODOT’s Northwest Region provides transportation facilities and services for nearly one-third of Oregon’s population. Region 2 comprises Benton, Clatsop, Columbia, Lane, Lincoln, Linn, Marion, Polk, Tillamook, Yamhill, southwestern Clackamas, and western Washington counties. Region 2 has over 4,615 lane miles of state highways, with 868 bridges, including five movable bridges, and four tunnels, comprising 25 percent of the State's total highway miles. Region 2 also has 860 miles of railroads, seven deep-water ports and two major Cascade mountain passes (Santiam and Willamette).
The Problem
• Despite sustained reductions in traffic fatalities over the last decade, speed, alcohol, and safety belt use continue to be major factors contributing to deaths and injuries on all roads in Region 2.
• Roadway departure fatalities and serious injuries continue to be a priority in Region 2. These types of crashes are common and preventable. During 2010-2014, there was an average of 259 roadway departure involved fatalities and serious injuries per year.
• According to the CDC, motor vehicle fatalities continue to be the leading cause of accidental death among teenagers, representing over one-third of all deaths to teenagers. During 2010-2014, there was an average of 118 fatalities and serious injuries per year in crashes where the driver was age 15-20 in Region 2.
• Motorcycle fatalities and serious injuries continue to be an issue. During 2010-2014, there was an average of 79 fatalities and serious injuries per year in motorcycle crashes in Region 2.
• Distracted driving crashes make up a significant portion of the deaths and serious injuries in the Region. During 2010-2014, there was an average of 61 distracted driving related fatalities and serious injuries in Region 2 per year.
• There continues to be a need to provide education and resources to local traffic safety committees on the “4-E” (education, engineering, enforcement and emergency medical services) approach to transportation safety.
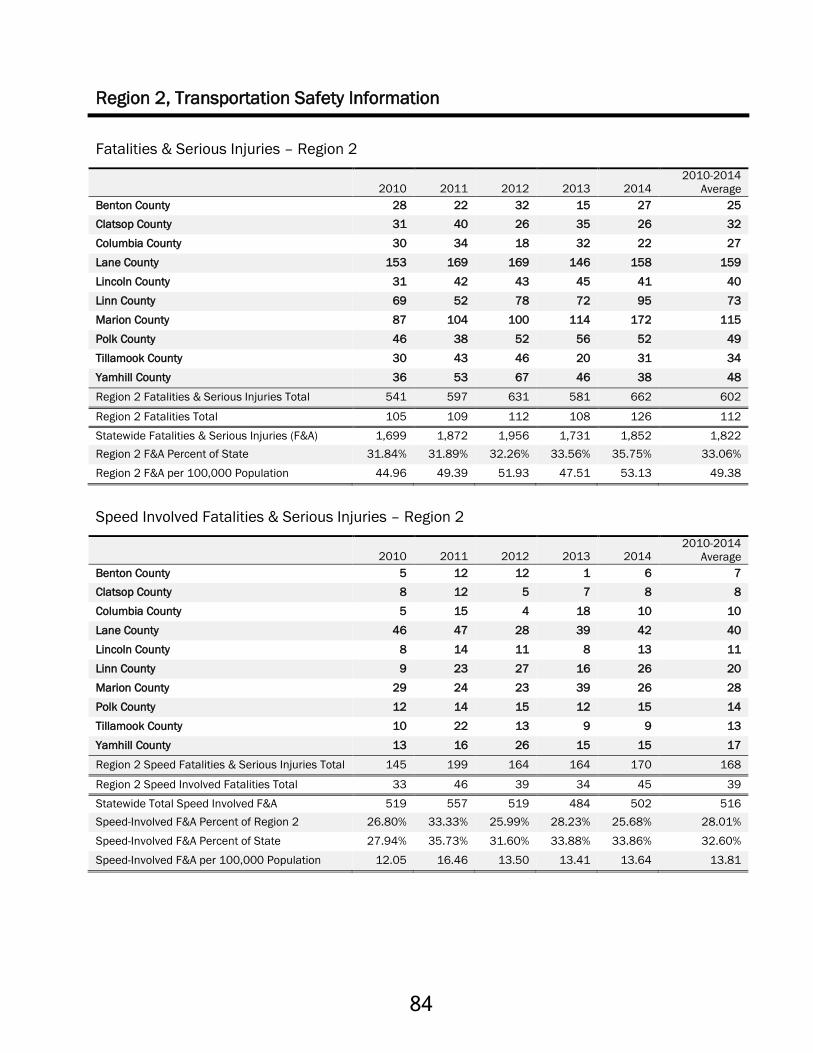
84
Region 2, Transportation Safety Information Fatalities & Serious Injuries – Region 2
2010 2011 2012 2013 2014 2010-2014
Average Benton County 28 22 32 15 27 25 Clatsop County 31 40 26 35 26 32 Columbia County 30 34 18 32 22 27 Lane County 153 169 169 146 158 159 Lincoln County 31 42 43 45 41 40 Linn County 69 52 78 72 95 73 Marion County 87 104 100 114 172 115 Polk County 46 38 52 56 52 49 Tillamook County 30 43 46 20 31 34 Yamhill County 36 53 67 46 38 48
Region 2 Fatalities & Serious Injuries Total 541 597 631 581 662 602
Region 2 Fatalities Total 105 109 112 108 126 112 Statewide Fatalities & Serious Injuries (F&A) 1,699 1,872 1,956 1,731 1,852 1,822 Region 2 F&A Percent of State 31.84% 31.89% 32.26% 33.56% 35.75% 33.06% Region 2 F&A per 100,000 Population 44.96 49.39 51.93 47.51 53.13 49.38
Speed Involved Fatalities & Serious Injuries – Region 2
2010 2011 2012 2013 2014 2010-2014
Average Benton County 5 12 12 1 6 7 Clatsop County 8 12 5 7 8 8 Columbia County 5 15 4 18 10 10 Lane County 46 47 28 39 42 40 Lincoln County 8 14 11 8 13 11 Linn County 9 23 27 16 26 20 Marion County 29 24 23 39 26 28 Polk County 12 14 15 12 15 14 Tillamook County 10 22 13 9 9 13 Yamhill County 13 16 26 15 15 17
Region 2 Speed Fatalities & Serious Injuries Total 145 199 164 164 170 168
Region 2 Speed Involved Fatalities Total 33 46 39 34 45 39 Statewide Total Speed Involved F&A 519 557 519 484 502 516 Speed-Involved F&A Percent of Region 2 26.80% 33.33% 25.99% 28.23% 25.68% 28.01% Speed-Involved F&A Percent of State 27.94% 35.73% 31.60% 33.88% 33.86% 32.60% Speed-Involved F&A per 100,000 Population 12.05 16.46 13.50 13.41 13.64 13.81

85
Alcohol Involved Fatalities & Serious Injuries – Region 2
2010 2011 2012 2013 2014 2010-2014
Average Benton County 3 4 8 1 4 4 Clatsop County 1 9 4 4 5 5 Columbia County 2 10 2 4 4 4 Lane County 25 30 23 29 29 27 Lincoln County 0 11 7 6 3 5 Linn County 9 10 15 13 14 12 Marion County 19 27 42 32 25 29 Polk County 6 7 5 12 9 8 Tillamook County 0 7 14 6 6 7 Yamhill County 5 9 10 5 5 7
Region 2 Fatalities & Serious Injuries Total 70 124 130 112 104 108
Region 2 Alcohol Involved Fatalities Total 31 41 39 36 35 36 Statewide Total Alcohol Involved F&A 283 368 413 346 307 343 Alcohol-Involved F&A Percent of Region 2 12.94% 20.77% 20.60% 19.28% 15.71% 17.86% Alcohol -Involved F&A Percent of State 24.73% 33.70% 31.48% 32.37% 33.88% 31.23% Alcohol -Involved F&A per 100,000 Population 5.88 10.26 10.70 9.16 8.35 8.86
2014 Fatal and Injury Crash Data – Region 2
Population Fatalities Alcohol Involved
Fatalities Fatal and Injury
Crashes F&I Crashes /1,000 Pop.
Nighttime Fatal & Injury Crashes
Benton County 90,005 5 2 399 4.43 51 Clatsop County 37,750 3 0 261 6.91 30 Columbia County 50,390 3 2 211 4.19 35 Lane County 362,150 45 10 1,805 4.98 270 Lincoln County 47,225 8 2 304 6.44 39 Linn County 120,860 16 5 730 6.04 117 Marion County 329,770 24 7 2,208 6.70 315 Polk County 78,570 10 2 352 4.48 45 Tillamook County 25,690 5 2 162 6.31 30 Yamhill County 103,630 7 3 542 5.23 77
Region 2 Total 1,246,040 126 35 6,974 5.60 1,009
Statewide Total 3,919,020 314 120 24,529 6.11 3,455 Percent of State 31.20% 40.13% 29.17% 28.43% N/A 29.20%
Sources: Crash Analysis and Reporting, Oregon Department of Transportation, Fatality Analysis Reporting System, U.S. Department of Transportation, Center for Population Research and Census, School of Urban and Public Affairs, Portland State University

86
Goals
• Decrease fatalities in Region 2 from the 2010-2014 average of 112 to 93 by 2020.
• Decrease serious injuries in Region 2 from the 2010-2014 average of 490 to 408 by 2020.
Performance Measures
• Decrease speed related fatalities and serious injuries in Region 2 from the 2012-2014 average of 166 to 152 by 2017.
• Decrease alcohol related fatalities and serious injuries in Region 2 from the 2012-2014 average of 115 to 105 by 2017.
• Decrease roadway departure fatalities and serious injuries in Region 2 from the 2012-2014 average of 261 to 238 by 2017.
• Decrease fatalities and serious injuries in crashes where the driver was age 15-20 in Region 2 from the 2012-2014 average of 126 to 115 by 2017.
• Decrease fatalities and serious injuries in motorcycle crashes in Region 2 from the 2012-2014 average of 88 to 80 by 2017.
• Decrease distracted driving related fatalities and serious injuries in Region 2 from the 2012-2014 average of 65 to 59 by 2017.
• Decrease pedestrian involved fatalities and serious injuries in Region 2 from the 2012-2014 average of 53 to 49 by 2017.
Strategies
• Employ deterrence countermeasures, including enforcement and education campaigns, to reduce speeding, impaired driving, distracted driving, and safety belt use violations. Work with local law enforcement to increase patrols at top SPIS sites within Region 2.
• Apply “4-E” safety countermeasures within active Safety Corridor sites, develop and implement Safety Corridor Plans, meet with active stakeholder groups, and decommission sites that no longer meet the criteria.
• Identify corridors that have high frequencies of roadway departure crashes and implement low-cost engineering, education, and enforcement initiatives to improve safety at those locations.
• Continue to increase the number and effectiveness of partnerships. Current efforts like Safe Kids and local traffic safety committees include hospitals, EMS providers, fire services, health educators, health programs, enforcement, engineering, etc. Attempt to tie specific efforts of these partnerships to crash reductions in target populations.
• Identify and increase the opportunities to provide state data (crash, health, economic loss, etc.) to local jurisdictions and safety organizations. Work with multi-disciplinary teams to identify traffic safety problems, detect emerging trends, and draft possible safety responses to those conditions.
87
Region 3 Link to the Transportation Safety Action Plan:
Action # 108 - Continue efforts to enhance communications between engineering, enforcement, education and EMS Continue efforts to enhance communication between engineering, enforcement, education, and EMS. Action # 19 – Provide a transportation safety specialist in each of the ODOT regions. Continue to provide for and enhance the transportation safety specialist positions in each of the five regions, providing a safety perspective to all operations as well as direct communication between ODOT and local transportation safety agencies and programs.
Region 3 Overview
The Oregon Department of Transportation, Region 3 encompasses the five southwestern Oregon counties: Coos, Curry, Douglas, Jackson, and Josephine. The region is primarily rural in nature however; Interstate 5 and Hwy 101 run the entire length of the region from top to bottom. The financial condition of the five counties in Region 3 indicates that they are at a higher risk of distress than most other Oregon counties.
The Problem
• Traffic fatalities are over-represented with 22.93 percent of total state traffic fatalities compared with 13.6 percent of the state’s driving population. Despite sustained reductions in traffic fatalities over the last decade, speed, alcohol, and safety belt use continue to be major factors contributing to deaths and injuries on all roads in Region 3.
• In 2014, total occupant safety belt use and child safety seat use in Region 3 included in the statewide survey closely reflect the statewide figures; however, there continues to be a need for public education – particularly on the importance of child passenger safety and proper use of restraint systems.
• There continues to be a need to provide education and resources to the 8 existing traffic safety committees in Region 3 (Ashland, Eagle Point, Medford, North Bend, Reedsport, Talent, Douglas County, and Jackson County).
• Roadway departure fatalities and serious injuries decreased from 179 in 2013 to 131 in 2014 in Region 3. These types of crashes are common and preventable and there continues to be a number of crashes that occur during periods of inclement weather.
• Motorcycle fatalities and serious injuries decreased from 43 in 2013 to 34 in 2014 in Region 3 but continued work is needed to further reduce fatal and serious injury.

88
Region 3, Transportation Safety Information Fatalities – Region 3
2010 2011 2012 2013 2014 2010-2014
Average Coos County 10 15 5 6 11 9 Curry County 8 3 0 3 4 4 Douglas County 21 12 15 13 27 18 Jackson County 16 21 14 15 17 17 Josephine County 12 13 18 12 13 14 Region 3 Total 67 64 52 49 72 61 Statewide Fatalities 317 331 337 313 356 331 Region 3 Fatalities Percent of State 21.14% 19.34% 15.43% 15.65% 22.93% 19% Region 3 Fatalities per 100,000 Population 13.94 13.34 10.82 10.14 14.69 12.59
Fatalities & Serious Injuries – Region 3
2010 2011 2012 2013 2014 2010-2014
Average Region 3 Fatalities & Serious Injuries 273 288 313 306 269 290 Statewide Fatalities & Serious Injuries 1,699 1,872 1,956 1,731 1,852 1,822
Speed Involved Fatalities – Region 3
2010 2011 2012 2013 2014 2010-2014
Average Coos County 5 8 2 2 6 5 Curry County 1 1 0 2 1 1 Douglas County 8 3 5 3 10 6 Jackson County 6 8 8 8 9 8 Josephine County 4 2 6 3 8 5 Region 3 Speed Involved Fatalities 24 22 21 18 34 24
Statewide Total Fatalities Speed Involved 116 127 114 120 144 124 Region 3 Speed Involved Fatalities Percent of State 20.69% 17.32% 18.42% 15.00% 23.61% 19.01% Region 3 Speed Involved Fatalities per 100k Population 4.99 4.58 4.37 3.73 6.94 4.92
Speed Involved Fatalities & Serious Injuries – Region 3
2010 2011 2012 2013 2014 2010-2014
Average Region 3 Speed Involved F&A Total 94 79 81 95 82 86 Statewide Speed Involved F&A Total 519 557 519 484 502 516

89
Alcohol Involved Fatalities – Region 3
2010 2011 2012 2013 2014 2010-2014
Average Coos County 5 9 2 0 6 4 Curry County 0 1 0 2 2 1 Douglas County 5 4 2 7 6 5 Jackson County 3 3 4 7 9 5 Josephine County 7 8 7 8 6 7 Region 3 Alcohol Involved Fatalities 20 25 15 24 29 23 Statewide Total Fatalities Alcohol Involved 107 123 123 128 120 120 Region 3 Alcohol Involved Fatalities Percent of State 18.69% 20.33% 12.20% 18.75% 24.17% 18.83% Region 3 Alcohol Involved Fatalities per 100k Population 4.16 5.21 3.12 4.97 5.92 4.68
Alcohol Involved Fatalities & Serious Injuries – Region 3
2010 2011 2012 2013 2014 2010-2014
Average
Region 3 Alcohol Involved F&A Total 53 68 61 62 52 59
Statewide Total Alcohol Involved F&A Total 283 368 413 346 307 343
Populations – Region 3
County 2010 2011 2012 2013 2014 2010-2014
Average Coos County 63,035 62,960 62,890 62,860 62,990 62,947 Curry County 22,355 22,335 22,295 22,300 22,470 22,351 Douglas County 107,690 107,795 108,195 108,850 109,910 108,488 Jackson County 203,340 203,950 204,630 206,310 210,975 205,841 Josephine County 82,775 82,820 82,775 82,815 83,720 82,981
Region 3 Total 479,195 479,860 480,785 483,135 490,065 482,608 Sources: Crash Analysis and Reporting, Oregon Department of Transportation, Fatality Analysis Reporting System, U.S. Department
of Transportation, Center for Population Research and Census, School of Urban and Public Affairs, Portland State University

90
Goals
• Decrease fatalities in Region 3 from the 2010-2014 average of 61 to 51 or below by 2020.
• Decrease serious injuries in Region 3 from the 2010-2014 average of 229 to 191 by 2020.
Performance Measures
• Decrease speed related fatalities and serious injuries in Region 3 from the 2012-2014 average of 86 to 78 by December 31, 2017.
• Decrease alcohol related fatalities and serious injuries in Region 3 from the 2012-2014 average of 58 to 53 by December 31, 2017.
• Decrease fatalities and serious injuries in motorcycle crashes in Region 3 from the 2012-2014 average of 29 to 26 by December 31, 2017.
• Reduce crashes associated with inclement weather on state highways in Region 3 from the 2012-2014 average of 578 to 528 by December 31, 2017.
Strategies
• Serve as a resource to all of Region 3 for all of the transportation safety programs. Attend safety meetings, both internally and externally, as a resource to the safety programs. Attend event planning meetings as the coordinator or agency partner for transportation safety related events, programs, or safety fairs.
• Coordinate and/or provide resources for traffic safety events. Advocate transportation safety programs and awareness to all agency partners and to all of the communities in Region 3.
• Collaborate and work to enhance partnerships with local agencies/groups to raise awareness around transportation safety issues and plan appropriate measure to impact identified problems within Region 3.
• Provide mini-grants to local jurisdictions for DUII community education, speed enforcement and/or equipment, and for child passenger safety equipment, supplies, or training.
• Provide education as often as possible on all transportation safety programs with an emphasis on Impaired Driving (Drugs and Alcohol); Speed; Occupant Protection; Distracted Driving; Pedestrian and Motorcycle safety.
• Work with existing traffic safety committees to enhance programs and to provide resources and information. Work to stabilize struggling committees and work with communities that have a need, or have expressed interest in forming new traffic safety committees.

91
• Coordinate the Child Passenger Safety (CPS) coalitions in Region 3. Oversee CPS trainings and provide mini-grants to local jurisdictions to enhance their support of CPS events, distribution clinics, and trainings. Coordinate quarterly meetings with certified CPS Technicians to help them grow their programs and stay current on CPS recertification requirements, paperwork, and reporting requirements.
• Utilize existing VMS boards to warn public of adverse weather and roadway conditions.
• Implement a Salt Use Pilot program on the Siskiyou Pass. Monitor for reductions in adverse weather crashes.
• Implement tree removal program on select Region highways where vegetation causes shading and contributes to ice on the roadway.
• Implement Region-wide projects to increase visibility on highways, including pavement markers, roadside delineation, and curve signage.
• Implement a Region-wide rumble strip project to address roadway departure crashes.

92

93
Region 4 Link to the Transportation Safety Action Plan:
Action # 108 - Continue efforts to enhance communications between engineering, enforcement, education and EMS. Continue efforts to enhance communication between engineering, enforcement, education, and EMS.
Region 4 Overview
Region 4 encompasses Crook, Deschutes, Gilliam, Jefferson, Klamath, Lake, Sherman, Wasco, and Wheeler counties. Region 4 is rural in nature and has an estimated 2015 total population of 320,970. Region 4 has 1,972 state highway centerline miles (4,144 lane miles), three maintenance districts and one active Safe Kids Chapter (Safe Kids Columbia Gorge). Region 4 has one safety corridor on Highway 270 (OR Route 140 W) Lake of the Woods from MP 29 to MP 47.
The Problem
• In 2014, Region 4 traffic crash fatalities totaled 41, with a majority of those having speed, alcohol and roadway departure as a contributing factor.
• Alcohol as a contributing factor in a fatality accounted for an increase of 20 in 2014 from 12 in 2013. Based on 2014 data, 49 percent of all fatalities in Region 4 were alcohol involved. There are 35 alcohol involved fatal and serious injuries (Injury A) in 2014, down from 38 in 2013. Highest counties for alcohol involved fatalities were Deschutes (17), Klamath (8) and Jefferson (4) in Region 4 in 2014. Any fatality with alcohol as a contributing factor is unacceptable.
• Speed as a contributing factor accounted for 19 fatalities in 2014 or 46 percent of all fatalities in Region 4. 2014 data shows 73 fatal and serious injuries (Injury A) which is an increase from 59 in 2013. Highest counties for fatalities were Deschutes (8), , Klamath (5) and Jefferson (3).
• Roadway Departure as a contributing factor makes up a large percentage of fatalities and serious injuries (Injury A) in Region 4. In 2014, there was a decrease to 76 Fatal and Injury A’s in Region 4 from 83 in 2013. Out of the fatalities, they accounted for 51 percent of all fatalities in Region 4 in 2014. During 2010-2014, the average was 105 for fatalities and serious injuries (Injury A).

94
Region 4, Transportation Safety Information
Fatalities & Serious Injuries – Region 4
2010 2011 2012 2013 2014 2010-2014
Average Crook County 16 10 16 16 16 15 Deschutes County 55 74 80 64 64 67 Gilliam County 3 2 4 1 1 2 Jefferson County 22 17 23 13 35 22 Klamath County 44 37 65 37 44 45 Lake County 11 8 6 13 5 9 Sherman County 11 8 4 2 3 6 Wasco County 16 35 19 20 18 22 Wheeler County 5 2 1 2 1 2 Region 4 Fatalities & Serious Injuries Total 183 193 218 168 187 190 Region 4 Fatalities Total 317 331 337 313 357 331 Statewide Fatalities & Serious Injuries (F&A) 1,699 1,872 1,956 1,731 1,852 1,822 Region 4 Percent of State 10.77% 10.31% 11.15% 9.71% 10.10% 10.41% Region 4 F&A per 100,000 Population 56.17 62.99 70.79 54.02 58.26
61.20
Speed Involved Fatalities & Serious Injuries – Region 4
2010 2011 2012 2013 2014 2010-2014
Average Crook County 7 7 7 4 9 7 Deschutes County 16 24 25 20 23 22 Gilliam County 0 1 3 0 0 1 Jefferson County 15 4 10 3 12 9 Klamath County 20 12 16 12 15 15 Lake County 5 3 4 9 2 5 Sherman County 4 3 2 2 1 2 Wasco County 8 20 12 8 11 12 Wheeler County 5 1 0 1 0 1
Region 4 Fatalities & Serious Injuries Total 80 75 79 59 73 73
Region 4 Speed Involved Fatalities Total 22 14 13 12 19 16 Statewide Total Speed Involved F&A 519 557 519 484 502 516 Speed-Involved F&A Percent of Region 4 43.72% 38.86% 36.24% 35.12% 39.04% 38.59% Speed-Involved F&A Percent of State 15.41% 13.46% 15.22% 12.19% 14.54% 14.17% Speed-Involved F&A per 100,000 Population 26.20 24.48 25.65 18.97 22.74 23.61

95
Alcohol Involved Fatalities & Serious Injuries – Region 4
2010 2011 2012 2013 2014 2010-2014
Average Crook County 6 1 4 0 2 3
Deschutes County 6 20 19 15 17 15 Gilliam County 0 0 1 1 0 0 Jefferson County 7 4 6 2 4 5 Klamath County 15 12 10 12 8 11 Lake County 2 3 2 3 2 2 Sherman County 3 2 2 0 1 2 Wasco County 2 3 5 5 1 3 Wheeler County 0 0 1 0 0 0
Region 4 Fatalities & Serious Injuries Total 41 45 50 38 35 42
Region 4 Alcohol Involved Fatalities Total 107 123 123 128 120 120 Statewide Total Alcohol Involved F&A 283 368 413 346 307 343 Alcohol-Involved F&A Percent of Region 4 22.40% 23.32% 22.94% 22.62% 18.72% 22.00% Alcohol -Involved F&A Percent of State 14.49% 12.23% 12.11% 10.98% 11.40% 12.24% Alcohol -Involved F&A per 100,000 Population 12.58 14.69 16.24 12.22 10.90 13.49
2014 Fatal and Injury Crash Data – Region 4
Population Fatalities Alcohol Involved
Fatalities Fatal and
Injury Crashes F&I Crashes /1,000 Pop.
Nighttime Fatal and Injury Crashes
Crook County 21,085 1 0 116 5.50 15 Deschutes County 170,740 13 7 800 4.69 111 Gilliam County 1,975 0 0 30 15.19 4 Jefferson County 22,445 10 1 117 5.21 16 Klamath County 67,110 11 5 380 5.66 66 Lake County 8,010 0 0 45 5.62 7 Sherman County 1,790 1 1 50 27.93 10 Wasco County 26,370 5 0 142 5.38 27 Wheeler County 1,445 0 6 15 10.38 1
Region 4 Total 320,970 41 20 1,695 5.28 257
Statewide Total 4,013,845 356 120 24,529 6.11 3,455 Percent of State 8.00% 11.52% 16.67% 6.91% N/A 7.44%
Sources: Crash Analysis and Reporting, Oregon Department of Transportation, Fatality Analysis Reporting System, U.S. Department of Transportation, Center for Population Research and Census, School of Urban and Public Affairs, Portland State University

96
Goals
• Decrease fatalities in Region 4 from the 2010-2014 average of 41 to 34 by 2020.
• Decrease serious injuries in Region 4 from the 2010-2014 average of 155 to 129 by 2020.
Performance Measures
• Decrease speed involved fatalities and serious injuries in Region 4 from the 2012-2014 average of 70 to 65 by December 31, 2017.
• Decrease alcohol involved fatalities and serious injuries in Region 4 from the 2012-2014 average of 41 to 37 by December 31, 2017.
• Decrease the number of roadway departure fatalities and serious injuries from the 2012-2014 average of 99 to 90 by December 31, 2017.
Strategies
• Reduce speed involved fatalities and serious injuries in Region 4 by working with local agencies (law enforcement and community groups).
• Reduce alcohol involved fatalities and serious injuries in Region 4 by working with local
agencies (law enforcement, OLCC, and community groups). • Educate parents/caregivers on the importance of proper use of child passenger safety
seats through work with local child passenger safety advocates and community groups.
• Work with ODOT, Oregon State Police and local communities on safety efforts for the safety corridor established in April 2005 on Highway 270 (Oregon Route 140 W) Lake of the Woods from mile point 29 to mile point 47.
• Advocate for transportation safety in Region 4 by providing information and education on all aspects of traffic safety, coordinating traffic safety activities, and work with community organizations, schools and local traffic safety committees.

97
Region 5 Link to the Transportation Safety Action Plan:
Action # 108 – Continue efforts to enhance communications between engineering, enforcement, and EMS Action # 19 – Provide a transportation safety specialist position in each of the ODOT regions Continue to provide for and enhance the transportation safety specialist positions in each of five regions, providing a safety perspective to all operations as well as direct communication between ODOT and local transportation safety agencies and programs.
Region 5 Overview
Region 5 includes Baker, Grant, Harney, Malheur, Morrow, Umatilla, Union and Wallowa counties. The total population for the eight counties is 183,310 encompassing 2,108 State Highway, 8,101 county and 790 city miles of roadway, with no active safety corridors. All eight counties in Region 5 have established local traffic safety committees or similar organizations.
The Problem
• As of March 1, 2016, several of rural highways in Region 5 will have speed limit increases from 55mph to 65mph. I-84 from The Dalles to the Idaho border will be increased from 65mph to 70mph as well as HWY 95 in Malheur County.
• In 2014, traffic fatalities continued to be a major issue in Region 5 with 34 deaths.
• In 2014, serious injuries due to traffic crashes totaled 105.
• In 2014, alcohol was involved in 15 deaths and serious injuries in Region 5, up from 13 in 2013.
• In 2014, 43 percent of all Region 5 fatalities and serious injuries were speed involved, totaling 60.
• Traditionally, a large percentage of fatalities and serious injuries are caused by roadway departures due to the rural nature of the region. 2014 was no exception, with 82 fatalities and serious injuries. This represents 59 percent of the total F&A’s in Region 5 for 2014.
• In 2014, 7 percent of all Region 5 fatalities and serious injuries (Injury A) were due to motorcycle crashes.
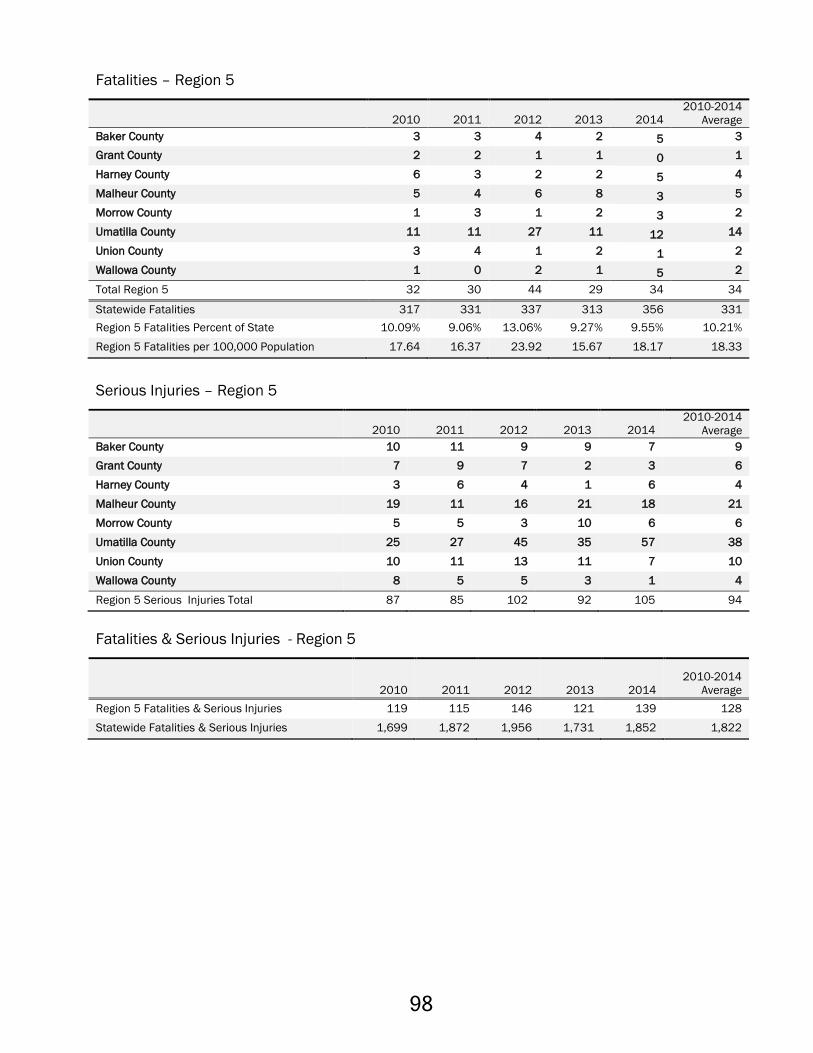
98
Fatalities – Region 5
2010 2011 2012 2013 2014 2010-2014
Average Baker County 3 3 4 2 5 3 Grant County 2 2 1 1 0 1 Harney County 6 3 2 2 5 4 Malheur County 5 4 6 8 3 5 Morrow County 1 3 1 2 3 2 Umatilla County 11 11 27 11 12 14 Union County 3 4 1 2 1 2 Wallowa County 1 0 2 1 5 2
Total Region 5 32 30 44 29 34 34
Statewide Fatalities 317 331 337 313 356 331 Region 5 Fatalities Percent of State 10.09% 9.06% 13.06% 9.27% 9.55% 10.21% Region 5 Fatalities per 100,000 Population 17.64 16.37 23.92 15.67 18.17 18.33
Serious Injuries – Region 5
2010 2011 2012 2013 2014 2010-2014
Average Baker County 10 11 9 9 7 9 Grant County 7 9 7 2 3 6 Harney County 3 6 4 1 6 4 Malheur County 19 11 16 21 18 21 Morrow County 5 5 3 10 6 6 Umatilla County 25 27 45 35 57 38 Union County 10 11 13 11 7 10 Wallowa County 8 5 5 3 1 4
Region 5 Serious Injuries Total 87 85 102 92 105 94
Fatalities & Serious Injuries - Region 5
2010 2011 2012 2013 2014
2010-2014 Average
Region 5 Fatalities & Serious Injuries 119 115 146 121 139 128 Statewide Fatalities & Serious Injuries 1,699 1,872 1,956 1,731 1,852 1,822

99
Speed Involved Fatalities –Region 5
2010 2011 2012 2013 2014 2010-2014
Average Baker County 2 2 3 1 2 2 Grant County 2 2 1 1 0 1 Harney County 3 2 0 1 1 1 Malheur County 4 0 1 3 2 2 Morrow County 0 2 0 1 2 1 Umatilla County 6 4 16 4 5 7 Union County 1 1 0 1 1 1 Wallowa County 0 0 0 1 4 1
Region 5 Speed Involved Fatalities 18 13 21 13 17 16
Statewide Total Speed Involved Fatalities 116 127 114 120 144 124 Region 5 Speed Involved Fatalities Percent of State 15.52% 10.24% 18.42% 10.83% 11.81% 13.36% Region 5 Speed Involved Fatalities per 100k Population 9.87 7.09 11.41 7.02 9.08 8.90
Speed Involved Fatalities & Serious Injuries - Region 5
2010 2011 2012 2013 2014 2010-2014
Average Region 5 Speed Involved F&A Total 56 57 70 51 60 58 Statewide Speed Involved F&A Total 519 557 519 484 502 516
Alcohol Involved Fatalities – Region 5
2010 2011 2012 2013 2014 2010-2014
Average Baker County 0 1 0 1 0 0 Grant County 0 0 0 1 0 0 Harney County 0 1 1 1 3 1 Malheur County 2 2 3 3 0 2 Morrow County 0 1 0 1 2 1 Umatilla County 5 4 3 5 5 4 Union County 1 1 0 0 1 1 Wallowa County 0 0 1 1 4 1
Region 5 Alcohol Involved Fatalities 8 10 8 13 15 11
Statewide Total Alcohol Involved Fatalities 107 123 123 128 120 120 Region 5 Alcohol Involved Fatalities Percent of State 7.48% 8.13% 6.50% 10.16% 12.50% 8.95% Region 5 Alcohol Involved Fatalities per 100k Population 4.39 5.46 4.35 7.02 8.02 5.85
Alcohol Involved Fatalities & Serious Injuries - Region 5
2010 2011 2012 2013 2014 2010-2014
Average Region 5 Alcohol Involved F&A Total 21 19 20 28 26 23 Statewide Total Alcohol Involved F&A Total 283 368 413 346 307 343

100
Populations – Region 5
County 2010 2011 2012 2013 2014 2010-2014
Average Baker County 16,185 16,215 16,210 16,280 16,425 16,263 Grant County 7,460 7,450 7,450 7,435 7,430 7,445 Harney County 7,445 7,375 7,315 7,260 7,295 7,338 Malheur County 31,345 31,445 31,395 31,440 31,480 31,421 Morrow County 11,175 11,270 11,300 11,425 11,630 11,360 Umatilla County 76,000 76,580 77,120 77,895 79,155 77,350 Union County 25,810 25,980 26,175 26,325 26,625 26,183 Wallowa County 7,005 6,995 7,015 7,045 7,100 7,032
Region 5 Total 182,425 183,310 183,980 185,105 187,140 184,392 Sources: Crash Analysis and Reporting, Oregon Department of Transportation, Fatality Analysis Reporting System, U.S. Department of
Transportation, Center for Population Research and Census, School of Urban and Public Affairs, Portland State University
Goals
• Decrease traffic related fatalities in Region 5 from the 2010-2014 average of 34 to 28 by 2020.
• Decrease serious injuries in Region 5 from the 2010-2014 average of 94 to 78 by 2020.
Performance Measures
• Decrease speed involved fatalities and serious injuries in Region 5 from the 2012-2014 average of 60 to 55 by December 31, 2017.
• Decrease alcohol involved fatalities and serious injuries in Region 5 from the 2012-2014 average of 25 to 23 by December 31, 2017.
• Decrease roadway departure fatalities and serious injuries in Region 5 from the 2012-2014 average of 82 to 75 by December 31, 2017.
• Decrease fatalities and serious injuries in motorcycle crashes in Region 5 from the 2012-2014 average of 16 to 14 by December 31, 2017.

101
Strategies
• Coordinate and/or provide resources for transportation safety events with a focus on speed, impaired driving, distracted driving, road departures/winter driving, motorcycle safety and occupant protection.
• Enhance programs by providing resources and information to existing local transportation safety committees.
• Provide mini-grants to local jurisdictions for DUII community education, speed enforcement and/or equipment, and for child passenger safety equipment, supplies, and/or training.
• Identify areas with speed related crashes specifically around road departure and/or winter conditions to reduce the violations and crashes through increased enforcement and education.
• Hold public clinics/fitting stations, trainings or educational presentations throughout Region 5. Retain the CPS Technicians that are already certified and ensure that they feel knowledgeable and confident about their skills.
• Identify areas of Region 5 that may be underrepresented by DRE Officers and/or Officers certified in ARIDE to increase and/or enhance the capacity for DUII enforcement. Recruit officers for these specialized training opportunities in rural and frontier areas in Eastern Oregon to reduce DUII crashes through enforcement and education.

102

103
Roadway Safety Link to the Transportation Safety Action Plan:
Action # 24 – ODOT should maintain responsibility of the SMS ODOT should maintain responsibility for the continued implementation, enhancement, and monitoring of the SMS that serves the needs of all state and local agencies and interest groups involved in transportation safety programs. The following are some, but not all, of the potential improvement elements to be included: Oregon’s SMS should be further improved to serve the needs of state and local agencies and MPOs. Oregon’s SMS should seek ways to improve the current highway safety improvement process, including the following: • Improve the Safety Priority Index System (SPIS) reports with added information from the
roadway inventory files.
• Update ODOT’s crash reduction factors.
• Modify the SPIS to allow variable segment lengths and specific types of crashes and roadway types.
• Update the SMS to be able to process local crashes (off state highway) and calculates SPIS for all public roads possibly through geospatial referencing systems.
• Determine a method for reporting the top 5 percent of locations statewide which exhibit
• Develop a performance tracking system for ODOT’s safety projects similar to that required for evaluating highway safety improvement projects in Section 148 of SAFETEA-LU.
• ODOT must develop a statewide committee with members from various universities, ODOT, local public works agencies, etc. to discuss, plan and implement the Highway Safety Manual methodologies for all roads in Oregon. Data must be gathered and high crash causalities identified for all roads and reported annually for Oregon stakeholders. The initial task for this group will be development of tracking mechanisms.
• The “4 E” approach should be embraced within ODOT and within local partner agencies to further advance safety. ODOT should have a multidivisional approach to promote and further the “4 E approach to transportation safety” as is described in FHWA’s Office of Safety Mission Statement. (Education, Engineering, EMS and Enforcement.)
• There are many engineering related problem statements within the HSIP chapter thus the Roadway Safety chapter will focus on non-engineering.
• The SMS should continue to be designed to help monitor implementation of the OTSAP and to assist with evaluating the effectiveness of individual actions and overall system performance.

104
The Problem
• There is a lack of a blended “4 E” (Education, Enforcement, Engineering and EMS) approach to transportation safety statewide.
• There is not a general acceptance of the Highway Safety Manual or an identified set of trainings for its potential implementation statewide.
• Evaluation of the Oregon Safety Corridor Program has identified that existing corridors continue to not be decommissioned within one year of meeting the decommissioning criteria.
• Non-state road authorities do not program safety as a stand-alone priority for their transportation dollars in a consistent manner. Training and awareness are lacking on their flexibility, legal requirements, and identification of safety projects.
• There is a need for a statewide comprehensive roadway safety engineering related training program. The program must address continuing and enhanced education on a variety of roadway safety engineering related topics. The trainings must include elementary to advanced courses and cover various disciplines. The trainings must be provided at low to no cost.
• Roadway safety engineering related trainings do not cover the identified need.
• Road authorities find it difficult to attend necessary highway safety training.
• There is a growing need to conduct jurisdictional traffic control device assessments, only some are covered through services provided by Oregon State University.
Traffic Rates in Oregon, 2010-2014
2010 2011 2012 2013 2014 2010-2014
Average National Traffic Fatality Rate1 1.09 1.09 1.13 1.10 1.07 1.10 Oregon Traffic Fatality Rate1 0.94 0.99 1.02 0.93 1.03 0.98 Highway System, Non-freeway Crash Rate2 1.31 1.48 1.51 1.45 1.53 1.46 Highway System Rural Non-freeway Crash Rate 0.80 0.80 0.81 0.76 0.81 0.80 Highway System, Freeway Crash Rate 0.41 0.44 0.46 0.47 0.51 0.46 County Roads/City Streets Crash Rate 1.82 2.04 2.08 2.00 2.11 2.01
Source: Crash Analysis and Reporting, Oregon Department of Transportation, Fatality Analysis Reporting System, U.S. Department of Transportation
1 Deaths per 100 million vehicle miles traveled 2 Crashes per million vehicle miles traveled

105
Goals
• Increase the number of trainings and local workshops for state and local public works; and law enforcement staff on various roadway safety related topics from the 2010-2014 average of 30 to 36 by 2020.
• Increase the number of state and local public works and law enforcement staff trained on various engineering, enforcement and transportation safety related topics from the 2010-2014 average of 612 to 731 by 2020.
Performance Measures
• Increase the number of trainings and local workshops for state and local public works; and law enforcement staff on various roadway safety related topics including human factors engineering from the 2012-2014 average of 30 to 33 by December 31, 2017.
• Increase the number of state and local public works and law enforcement staff trained on various engineering, enforcement and transportation safety related topics from the 2012-2014 average of 612 to 669 by December 31, 2017.
Strategies
• Participate on the following ODOT efforts in order to continue the enhancement of roadway safety:
Highway Safety Engineering Committee (HSEC) Statewide Pavement Committee Research projects and Expert Task Group(s) Informal Safety Committee
• Provide overtime enforcement, annually, on the worst ranked safety corridors.
• Update the Safety Corridor Guidelines to include the use of the Highway Safety Manual methods.
• Advocate for the proper implementation of the Safety Corridor Guidelines within ODOT.
• Coordinate discussions and input on training topics to be provided within the state. Seek comments and input from local agencies, FHWA and ODOT staff.
• Continue to promote the Highway Safety Manual in an effort to identify its benefits to the state.
• Advance the adoption of the “4 E” approach to traffic safety (e.g., education, enforcement, engineering and emergency medical services).

106

107
Safe & Courteous Driving Link to the Transportation Safety Action Plan:
Action #26 - Seek legislation that would prohibit cell phone and texting activities Seek legislation that would prohibit cell phone and texting activities by all motor vehicle operators, with no exception groups. Action #86 - Implement program to address the problem of fatigued driving Implement a program to address the problem of fatigued driving. The program should follow national progress toward identifying data sources, and developing countermeasures for fatigued driving. As part of the program, implement a public information and education program to address fatigued driving. Action #87 - Develop program to address the issue of distracted driving Continue development of a program to address the issue of distracted driving. Use nationally available materials and information on the problem. Continue to progress in addressing the problem through: • Identify sources of rider or driver distraction including in/on-vehicle equipment and
distracting driver, rider, and passenger behaviors.
• Provide public information and education about distractions and their relationship to crashes, paying special attention to distractions identified as significant crash causes.
• Raise vehicle operator, law enforcement and judicial awareness of the role of distraction in crashes; encourage application of existing statutes as an appropriate response to the problem.
The Problem
• There is strong evidence, in Oregon and in other states, that laws and enforcement efforts are only effective if they are effectively and continuously publicized. According to the National Highway Traffic Safety Administration public information programs should be comprehensive, seasonally focused, and sustained.
• Passing a law or putting in place a new program does not make the law or program a success. The public needs to be informed about the law and take it seriously. If people perceive the risk of apprehension as small, they tend to disregard laws they consider to be overly harsh or rigid or just not all that important. Since 1982 the Transportation Safety Division has been carrying out comprehensive traffic safety public education programs. Research has been utilized to evaluate the success of the program and to assist with targeting the messages. Surveys of Oregon's driving population indicate that Transportation Safety Division's public information program is widely recognized.
• Safe Following Distance is also a component of the program as, following-too-close related crashes rate as the seventh most common driver error in Oregon for 2014, according to Oregon’s Crash Analysis Unit.

108
• “Red Light Running” is a significant cause of death and serious injury in Oregon. Importantly, red light running is also a significant cause of debilitating brain injury and death due to the type of crash that typically occurs. It is essential that every driver in Oregon heed the warning to stop on yellow.
• “Lights and Swipes”: The Oregon legislature felt so strongly about the need to raise citizen awareness of the need for using your headlights in inclement weather that they passed a special law requiring an awareness campaign. Studies show that headlights help your vehicle to be seen more easily.
• “Drowsy Driving”: Every year Oregon loses citizens to suspected or confirmed incidences of drivers falling asleep at the wheel. Sometimes the loss of life is the driver, all too often it is a child passenger or passing motorist who had the misfortune to be in the wrong place at the wrong time. In Oregon from 2010-2014, 54 people died and 4,143 were injured in drowsy driving crashes.
• “Distracted Driving” is a behavior dangerous to drivers, passengers, and non-occupants alike. Distraction is a specific type of inattention that occurs when drivers divert their attention from the driving task to focus on some other activity instead (per NHTSA).
• In Oregon, from 2010-2014 there were 58 fatal crashes, 58 fatalities and 14,186 injuries that were caused by crashes involving a distracted driver.
• From 2010-2014 there were 15 fatal crashes, 15 fatalities and 1,175 injuries that were caused by drivers reported to have been using a cell phone at the time of the crash. These crashes are underreported, convictions for this offense during the same time period totaled 88,626 in Oregon.
• A recent Appellate case changed the definition in Oregon of what law enforcement is allowed to site for, related to hand held communication. Drivers can only be cited if they are witnessed talking or texting on their hand-held device. It is likely that this law will be clarified and improved during the 2017 legislative session.
• Not only is distracted driving a problem, but distracted pedestrians and bicyclists seem to be on the rise, this is a problem that Oregon is taking on.

109
Oregon Driver reported to have used Cell Phone, Fatalities and Injuries 2010-2014
Year Fatalities Injuries
2010 3 161
2011 4 238
2012 1 296
2013 4 235
2014 3 245
Total 15 1,175 Source: Crash Analysis and Reporting, Oregon Department of Transportation, Fatality Analysis Reporting System, U.S. Department of
Transportation
Oregon Cell Phone Use Convictions 2010-2014
Year Convictions
2010 9,848 2011 16,643 2012 22,892 2013 21,520 2014 17,723
Total 88,626 Source: Oregon Driver and Motor Vehicle Services Note: Oregon’s first cell phone legislation was passed into law in 2007. In 2009, new cell phone legislation passed and became effective
January 2010, making it a primary offense to use a hand-held mobile device while driving in Oregon. A number of qualifying statements were added to the law in January 2012 and may be confusing to the general public. 2013 legislation increased the penalty for the offense from a Class D traffic violation ($250 maximum fine) to a Class C traffic violation ($500 maximum fine).
Goals
• Decrease drowsy driving fatalities from the 2010-2014 average of 11 to 8 by 2020.
• Decrease drowsy driving injuries from the 2010-2014 average of 829 to 691 by 2020.
• Decrease distracted driving fatalities related to driver use of a cell phone from the 2010-2014 average of 3 to 2 by 2020.
• Decrease distracted driving injuries related to driver use of a cell phone from the 2010-2014 average of 235 to 196 by 2020.
Performance Measures
• Decrease drowsy driving fatalities from the 2012-2014 average of 9 to 8 by 2017.
• Decrease drowsy driving injuries from the 2012-2014 average of 854 to 779 by 2017.
• Decrease distracted driving fatalities related to driver use of a cell phone from 2010-2014 average of 3 to 2 by December 31, 2017.
• Decrease distracted driving injuries related to driver use of a cell phone from the 2010-2014 average of 259 to 236 by December 31, 2017.

110
Strategies
• Continue to seek ways to limit or prohibit cell phone usage and texting activities by all motor vehicle drivers, with only an exception for EMS while performing EMS duties and calling for emergencies.
• Use free media and partnerships for public information and education to raise awareness of Safe and Courteous Programs, especially Distracted Driving.
• Analyze data, the public opinion survey and other research to target campaigns for public information and education for all Safe and Courteous efforts.
• Conduct a high visibility enforcement campaign project for Distracted Driving during April in coordination with National Distracted Driving Month.
• Form a Distracted Driving Task Force to identify and recommend ways to reduce distracted driving by focusing on education, policy, enforcement and data/reporting.

111
Safe Routes to School Link to the Transportation Safety Action Plan:
Action # 1 – Implement Statewide Safe Communities Develop ways to implement those aspects of the Safe Communities model that can apply at the statewide level. Develop interconnected groups and working relationships that build stronger bonds between and among the various government bodies, agencies, organizations and citizens with a role in transportation safety through working groups, partnerships, and cross disciplinary efforts.
Safe Routes to School Overview
The purposes of a SRTS Program are to increase the ability and opportunity for children to walk and bicycle safely to and from school; to make bicycling and walking appealing travel alternatives and influence a healthy and active lifestyle; and facilitate the planning, development and implementation of projects and activities that improve safety and reduce traffic, fuel consumption and air pollution in the vicinity of schools. In Oregon, completion of the Safe Routes to School (SRTS) Action Plan is the initial step of a SRTS Program at a school. The plan requires forming a school SRTS team to collect student travel data, along with other pertinent data and policy information, leading to the identification of the barriers and hazards to students walking and biking to/from school based on the 5 E’s of Education, Encouragement, Enforcement Engineering and Evaluation. With the conclusions drawn from the collected information, the team recommends priority projects and activities that the school, municipality and community can advance to promote safe walking and bicycling to school. These priorities are the basis for the school or school district’s Safe Routes to School Program. Non-infrastructure application for Oregon SRTS funding for grades K-8 remains under the Transportation Safety Division direction. School or school district projects addressing Education, Encouragement, Enforcement and Evaluation must have either a completed SRTS Action Plan for benefiting schools, or a project that leads to the completion of the SRTS Action Plan. Awards of non-infrastructure projects address regional equity, potential to increase walking and bicycling to and from school, pedestrian and bicycling safety education among K-8 students, project readiness, and benefit to the community.

112
Infrastructure proposals that address Engineering improvements on the routes to schools are now managed under the ODOT STIP Enhance Program in the Active Transportation Section. Enhance program funds are applied for through a single competitive application process and allocated by the Oregon Transportation Commission (OTC). Eligible activities enhance, expand, or improve the transportation system and Safe Routes to School (infrastructure projects) is one of 11 eligible project categories. The OTC will select Enhance projects based on recommendations developed by governments, public agencies and citizen representatives through a process conducted by the Metropolitan Planning Organizations (MPOs) where applicable, and the Area Commissions on Transportation (ACT). It should be noted that the Enhance application process does not require submission of a SRTS Action Plan, but the community process and documented conclusions of a SRTS Action Plan effectively tell the story and support the need to improve the safety of students on the route to school.
The Problem
• In Oregon in 2013-14, school-aged children (5-14 years old) were 6.5 percent of the total population in households. (surburbanstats.org)
• In Oregon in 2014, the 5-19 age group had 4 pedestrian fatalities which accounted for 7.1 percent of the state’s pedestrian fatalities (56). The same age group had 209 injuries and accounted for 6.5 percent of the state's pedestrian injuries (862).
• In Oregon in 2014, the 5-14 age group had no bicyclist fatalities. The same age group had 165 bicyclist injuries which accounted for 17.3 percent of the state’s bicyclist injuries.
• In the August 2014 Public Opinion Survey for ODOT-TSD, when participants were asked “What do you believe is the most important traffic safety message that should be taught to children in grade schools?” twenty-eight percent (28%) of those surveyed mention “Stop, Look and Listen”/look both ways before crossing the street. This continues to be the most important traffic safety message for grade school children yet pedestrian and bicycle safety education are not regularly taught in Oregon schools. .
• A Safe Routes to School Action Plan evaluates the travel modes of students to a specific school site and identifies the barriers and hazards to students walking and biking to the school. The conclusions drawn from the collected information lead to priority projects and activities that the school, municipality and community can advance to promote safe walking and bicycling to school. Pedestrian safety and bicycle safety education are typically components of a Safe Routes to School program.
• In 2015, there are 197 school districts, 721 public elementary schools and 188 middle schools. TSD-SRTS program is aware of 175 completed school Action Plans.
• Action Plans are not required to apply for Infrastructure funding but are required for education and encouragement grants unless the applicant is applying for funding to do the Action Plan work. While the community process and conclusions of a SRTS Action Plan lead to an effective work plan, communities often see them as extra effort if they're only focused on infrastructure improvements.

113
Methods of Traveling to School in Oregon 2012-2015 Children Living within One Mile of the School, Grades K-8
Mode 2012 2013 2014 2015 Car 35% 46% 43% 42% School Bus 33% 26% 28% 34% Walk 28% 21% 21% 17% Bike 2% 4% 2% 1% Public transit - 1% 1% 0.3% Other - - - 6% Don’t’ know 1% - 2% 0.2%
Source: Intercept Research Corporation, Public Opinion Survey, Summary and Technical Report, May 2014 Portland State University Survey Research Lab: 2015 ODOT NHTSA Program Measures Statewide Public Opinion Survey Note: Respondents who indicated there is a child in the household who lives within 1 mile of the school they attend were asked to
estimate frequency with which child used various modes of commute. Categories were not presented as mutually exclusive and results do not necessarily total 100%.
“Other” category was identified in the 2015 PSU survey, with the three types of responses found being homeschooled, bike and school bus equally, and car and school bus equally.
Goals
• Increase the number of completed Oregon SRTS Action Plans from 160 in 2012 to 200 by 2020.
Performance Measures
• To increase the number of schools that have a SRTS Action Plan from 160 in 2013 to 195 by December 31, 2017.
Strategies
• Promote and update the OregonSafeRoutes.org website to enhance website as a tool for communities interested in learning about and implementing Safe Routes to School programs and activities by working with Commute Options as the Technical Service Provider grantee.
• Promoting the desire and enthusiasm for walking, biking and rolling safely to/from school
through a SRTS media campaign by working with state contractor Gard Communications on effective messaging.
• Providing SRTS Action Plan training in all five ODOT Regions through partnership with
the ODOT Region Traffic Safety Coordinators. • Collect travel mode data from schools by promoting use of the School Travel Tally and
data collection through the National Center for SRTS database. • Continue to provide educational materials for statewide distribution promoting safe
walking, biking and rolling to/from school.
• Continue to provide educational materials for statewide distribution promoting safe walking and biking to/from school.

114

115
Speed Link to the Transportation Safety Action Plan:
Action # 35 – Develop a Traffic Law Enforcement Strategic Plan Develop a Traffic Law Enforcement Strategic Plan which addresses the needs and specialties of the Oregon State Police, county sheriffs and city police departments. The plan should be developed with assistance from a high level, broadly based task force that includes representatives of all types of enforcement agencies, as well as non-enforcement agencies impacted by enforcement activities. Specifically, the plan should develop strategies to address the following: • Speed Issues (enforcement, laws, legislative needs, equipment, public information and
education.) Targeted analysis of enforcement of laws that would address corner and “run off the road” crashes.
• Aggressive driving and hazardous violation issues.
• Crash investigations curriculum for an expanded police academy.
• Rail trespass issues and highway rail crossing crashes.
• Identify and seek enabling legislation for the best methods of providing secure, stable funding for traffic law-enforcement.
• Staffing needs; training; use of specialized equipment such as in-car video cameras, mobile data terminals, computerized citations (paperless), statewide citation tracking system, lasers and improved investigation tools; handling of cases by courts, information needs, and financing should be included in the strategic plan.
• Development of automated forms to increase law enforcement efficiency, and increase the number of police traffic crash forms completed and submitted.
• Maintenance of traffic teams, and identify incentives to persuade law enforcement to establish teams locally.
• Seek mechanisms to automate enforcement activities.
• Identify strategies that encourage voluntary compliance, negating the need for enforcement activities.
• As specific elements of the plan are developed and finalized, begin implementation of those elements.
The Problem
• In 2014, 40.3 percent of all traffic fatalities in Oregon involved speeding (traffic deaths). Data reflects excessive speed or driving too fast for present conditions as the number two contributing factor to fatal traffic crashes on Oregon roads in the year 2013.

116
• Twenty-one percent of all 2014 speed related traffic deaths in Oregon occurred on the State Highway System. The Oregon State Police do not have the staffing levels needed to appropriately address and make significant death and injury reductions given current and known future staffing levels. Multi-agency partnerships will be required to address this problem.
• Following are facts relative to increased speed:
The chances of dying or being seriously injured in a traffic crash doubles for every 10 mph over 50 mph - this equates to a 400 percent greater chance at 70 mph than 50 mph.
Crash forces increase exponentially with speed increases (i.e., 50 mph increased to 70 mph is a 40 percent increase in speed, while kinetic energy increases 96 percent).
The stopping distance for a passenger car on dry asphalt increases from 229 feet at 50 mph to 387 feet at 70 mph - a 69 percent increase in stopping distance.
Safety equipment in vehicles is tested at 35 mph - that same equipment loses the ability to work effectively at higher speeds.
• Police agencies, large and small, do not have adequate funding to allow for the purchase of needed enforcement equipment such as radar and laser devices to assist them with traffic enforcement duties.
Speed in Oregon, 2010-2014
2010 2011 2012 2013 2014 2010-2014
Average Total Number of Fatalities Statewide 317 331 337 313 357 331 Number of People Killed Involving Speed 116 127 113 120 144 124 Percent Involving Speed 36.6% 38.4% 33.5% 38.3% 40.3% 37.5% Total Number of Injuries Statewide 30,493 35,031 36,083 33,149 35,054 33,962
Number of People Injured Involving Speed 5,909 4,921 5,149 5,759 5,760 5,500
Percent Involving Speed 19.4% 14.0% 14.3% 17.4% 16.4% 16.3% Number of Speed Involved Convictions 149,493 139,554 132,483 130,305 133,950 133,157 Number of Speed eCitations Issued 24,103 80,190 93,080 117,826 136,700 90,380 Total Number of eCitations Issued 70,000 180,039 223,189 272,993 326,970 214,638 Number of eCrash Reports Completed 1,198 3,942 8,063 9,296 12,220 6,944
Sources: Driver and Motor Vehicle Services, Oregon Department of Transportation, Crash Analysis and Reporting, Oregon Department of Transportation, Fatality Analysis Reporting System, U.S. Department of Transportation
Note: Speed- involved offenses and convictions count the following statutes: ORS 811.100, 811.111, and 811.125.
Speeding Citations During Grant Funded Activities, 2011–2015
FFY 2011 FFY 2012 FFY 2013 FFY 2014 FFY 2015 2011-2015
Average Speeding citations issued 18,902 17,217 12,376 21,732 4,143 14,874
Sources: TSD Grant files, 2011 - 2015 Note: Previous years counted all TSD grant program overtime activities (not just speed grant overtime). Starting with 2015, the number
reported counts only speed enforcement grant overtime citation activity.
117
Goals
• Reduce fatalities in speed-related crashes from the 2010-2014 average of 124 to 103 by 2020.
• Reduce the number of people injured in speed-related crashes from the 2010-2014 average of 5,301 to 4,416* by 2020. (*Note: This includes a predicted 15 percent for pre 2011 injury numbers due to improved reporting procedures and better data capture.)
Performance Measures
• Reduce fatalities in speed-related crashes from the 2012-2014 average of 101 to 92 by December 31, 2017. (NHTSA)
• Reduce the number of people injured in speed-related crashes from the 2012-2014 average of 5,225 to 4,769* by December 31, 2017.
• Increase the number of eCitations issued statewide from the 2012-2014 average of 274,384 to 299,827 by December 31, 2017.
• Increase the number of eCrash reports issued statewide from the 2012-2014 average of 9,860 to 10,774 by December 31, 2017.
• Increase the number of speed related eCitations issued from the 2012-2014 average of 115,869 to 126,613 by December 31, 2017.
Strategies
• Provide annual public information and education on the issue of speed via media contractor, ODOT public information officers and other media outlets.
• Utilize traffic safety and Law Enforcement Traffic Safety Advisory committees to address speed issues.
• Ensure that speed enforcement overtime dollars are used on the types of roadways in which the largest percentages of death and injuries are occurring. Priority order is: Rural State Highways, County Roads, City Streets and Interstate System.
• Provide comprehensive statewide analysis of speed involved crashes by region annually. Work with Region Safety Coordinators to address specific problems in their areas. Provide funding if available.
• Work toward elevating the seriousness of the potential consequences of speeding behavior in the public eye as Oregon’s number two contributing factor to traffic death and injury severity.
• Monitor the number of eCitations and eCrash data to that which TSD has access.

118

119
Traffic Records Link to the Transportation Safety Action Plan:
Action #112 – Better, more effective traffic records Develop and implement an effective traffic records program to improve the timeliness, accuracy, completeness, uniformity, integration, and accessibility of the safety data needed to identify priorities for national, state and local highway and traffic safety programs. Key elements include: • Methods to improve reporting of traffic crashes by police and citizens.
• Better integration of the various crash records systems that are currently maintained by separate state and local agencies or the development of one crash data system.
• Wider, timelier distribution of crash and related data, including distribution of available data.
• Evaluation of new technology to improve quality and timeliness of reporting crash and other data.
• Improved coordination among state and regional criminal justice system information systems and other traffic records systems.
• Utilization of geospatial referencing systems to locate and code crashes.
• Link the state data systems, including traffic records, with other data systems within Oregon, such as systems that contain medical, roadway, and economic data.
The Problem
• The use of automation especially for field data collection is lagging in Oregon. Collection of crash, citation, roadway, and EMS data all have been reviewed for the benefits that electronic collection would provide. To date, only minimal use of automation for data collection has been implemented for citations, crash reports, and EMS. There is no web based tool for reporting of crashes by involved drivers.
• Limited access to crash data online with user-friendly analytic tools supporting GIS mapping and non-spatial (e.g., cross-tabulated data aggregation) analysis through a single point of access.
• There is not a fully deployed standardized, unique identifier system that follows patients across multiple incidents which allows for later linkage with crash and other data.
• There is a need for crash report training to be delivered at the enforcement conferences, as well as targeted training for engineers, prosecutors, judges, and EMS providers to promote improved crash data collection.
• Roadway information is not available for all public roads in the state whether under state or local jurisdiction. ODOT does not have a clear, consistent linear referencing system for highways in Oregon; the same road may have multiple numbers and duplicate milepost numbers, causing confusion for emergency responders.

120
Traffic Records in Oregon, 2010-2014
2010 2011 2012 2013 2014 2010-2014
Average Total Crashes 44,094 49,053 49,798 49,495 51,245 48,737 Fatal Crashes 292 310 305 292 321 304 Injury Crashes 20,879 23,887 24,457 22,975 24,208 23,281 Property Damage Crashes 22,923 24,856 25,036 26,228 26,685 25,151 Fatal Crashes Police Reported 100% 98% 97% 98% 89% 96% Serious Injury Crashes Police Reported 84% 83% 84% 81% 79% 82% Moderate Injury Crashes Police Reported 72% 74% 72% 73% 73% 73% Minor Injury Crashes Police Reported 47% 49% 49% 50% 51% 49% Fatalities 317 331 337 313 357 331 Fatalities per 100 Million VMT 0.94 0.99 1.02 0.93 1.03 0.98 Injuries 30,493 35,031 36,083 33,149 35,054 33,963 Injuries per 100 Million VMT 90.29 104.96 108.78 98.38 101.28 100.73 Number of Speed eCitations Issued 24,103 80,190 93,080 117,826 136,700 90,380 Total Number of eCitations Issued 70,000 180,039 223,189 272,993 326,970 214,638 Number of eCrash Reports Completed 1,198 3,942 8,063 9,296 12,220 6,944
Source: Crash Analysis and Reporting, Oregon Department of Transportation Fatality Analysis Reporting System, U.S. Department of Transportation eCitation/eCrash data warehouse
Goals
• Continue to improve the timeliness, accuracy, completeness, uniformity, integration, and accessibility of transportation safety data by 2020.
• Identify and implement one or more ways to improve the links between the state traffic records data systems with other data systems within the state, such as systems that contain crash, vehicle, driver, enforcement/adjudication, and injury surveillance data by 2020.
Performance Measures
• Increase the percentage of fatal and injury crash reports (no property damage only) submitted by law enforcement officers from the 2012-2014 average of 59 percent to 64 percent by December 31, 2017.
• Increase the percentage of crash reports submitted by law enforcement officers in Oregon from the 2012-2014 average of 48 percent to 52 percent by December 31, 2017.
• Increase the percentage of Pre-Hospital Admission reporting agencies and sub agencies in the pre-hospital admission reporting system from 80 percent in 2015 to 85 percent by December 31, 2017.

121
Strategies
• Develop a new traffic records strategic plan that responds to recommendations and issues identified in the newly completed Traffic Records Assessment.
• Identify law enforcement agencies ready to pursue electronic field data collection for traffic citations and crash reports using software that allows the secure transfer of data from law enforcement agencies to local courts.
• Implement web-based crash reporting for both operator reports and law enforcement reports. This will help agencies with no automation to submit their reports electronically and reduce the amount of data entry and delay in both DMV and the CAR Unit.
• Implement electronic data transfer of crash data from law enforcement.
• Expand the existing Safety Priority Index System (SPIS).
• Revise and improve the Strategic Plan for Traffic Records Improvement through more targeted planning and continued cooperation among the data stakeholders.
• Continue crash report training delivered at law enforcement conferences and DPSST to improve the collection and error rate of crash reports.
• Create a single resource that lists the traffic records system components and contacts for each. Make this resource available on the TSD Traffic Records web page.
• Continue the development of the TransGIS system to support detailed analyses as needed by users.
• Expand the TransViewer Internet Crash Reporting program and add query capabilities to meet the safety needs of ODOT’s external customers.
• Continue progress toward implementing a statewide EMS Patient Encounter Database for ambulance service data tracking that conforms to NEMSIS guidelines.
• Resume production of the annual trauma registry report.

122

123
Work Zone Safety Link to the Transportation Safety Action Plan:
Action # 67 – Expand efforts to reduce traffic-related deaths and injuries in work zones Continue and expand efforts to reduce traffic-related deaths and injuries in roadway work zones. Continue the work zone enforcement program and enhance public information programs. Conduct periodic reviews of ODOT policies and procedures relating to crew activity in work zones. Conduct periodic review of road construction contract specifications dealing with placement and condition of traffic control devices. Consider legislative action to further develop photo radar in work zones.
The Problem
• Work zones are not engineered to the same standards as permanent facilities, thus there’s a higher risk for crashes in work zones.
• Work zones make up a very small percentage of the entire roadway system during a very limited time of the year, thus comparing work zone fatal, injuries, and crashes to all roadway data or other traffic safety issues is not possible. This comparison would only be possible if all roadways had an active work zone all year long.
• Inattentiveness continues to be the number one cause of work zone crashes. Driving too fast for conditions/Speed is a compounding factor.
• Lack of awareness that more drivers and their passengers are injured and killed than construction workers.
• Most work zone crashes involve male drivers.
• Most work zone crashes occur with the local area of the residence of the driver, within 25 miles of their residence.
• According to national studies, work zone crashes tend to be more severe than other crashes.
• Over 40 percent of national work zone crashes occur in the transition zone before the work area.
Work Zones in Oregon, 2010-2014
2010 2011 2012 2013 2014 2010-2014
Average Work Zone Fatal/Serious Injury Crashes 24 25 22 14 14 20
Work Zone Injury Crashes 252 280 244 211 271 252
All Work Zone Crashes 490 528 429 427 512 477
Work Zone Fatalities 9 11 6 6 4 7
Work Zone Fatal/Serious Injuries 28 36 25 18 16 25
Work Zone Injuries 409 466 375 326 439 403
Sources: Crash Analysis and Reporting, Oregon Department of Transportation Fatality Analysis Reporting System, U.S. Department of Transportation

124
Goals
• Reduce work zone fatalities from 7, the average for 2010-2014, to 6 or below by 2020.
• Reduce work zone fatal crashes from 6, the average for 2010-2014, to 5 or below by 2020.
• Reduce work zone serious injuries from 16, the average for 2010-2014, to 13* or below by 2020.
• Reduce work zone serious injury crashes from 13, the average for 2010-2014, to 11* or below by 2020.
• Reduce work zone injury crashes from 252, the average for 2010-2014, to 210* or below by 2020.
• Reduce work zone total crashes from 477 the average for 2010-2014 to 397* or below by 2020.(*This includes a predicted 15% for pre 2011 injury numbers due to improved reporting procedures and better data capture.)
Performance Measure
• Reduce work zone fatalities from 5, the average for 2012-2014, to 4* or below by December 31, 2017.
• Reduce work zone fatal crashes from 5, the average for 2012-2014, to 4* or below by December 31, 2017.
• Reduce work zone serious injuries from 15, the average for 2012-2014, to 13 or below by December 31, 2017.
• Reduce work zone serious injury crashes from 12, the average for 2012-2014, to 11 or below by December 31, 2017.
• Reduce work zone injury crashes from 242, the average for 2012-2014, to 221 or below by December 31, 2017.
• Reduce work zone total crashes from 456, the average for 2012-2014 to 416 or below by December 31, 2017

125
Strategies
• Participate in the statewide identification, development and promotion of new and existing work zone safety related countermeasures.
• Advance the adoption of the “4 E” approach to work zone traffic safety (e.g., education, enforcement, engineering and emergency medical services).
• Provide Work Zone overtime to fifteen state and local police agencies.
• Identify best practices for work zone enforcement and implement through ODOT partners as possible.
• Staff statewide Work Zone Safety Executive Steering Committee and implement coordinate/implement initiatives.
• Further implement Statewide Work Zone Photo Radar legislative initiative.

126
2017 Anticipated Revenues Summary
AnticipatedFY 2017
USDOT Block GrantsFHWA Section 164 AL Impaired Driving $ 2,420,000
FHWA HSIP Roadway Safety $ 690,000FHWA HSIP Highway Safety Improvement Project $ 1,495,054NHTSA Section 402 Discretionary Highway Safety $ 2,909,000NHTSA 405b - OP Occupant Protection $ 591,000NHTSA 405c – Traffic Records Traffic Records $ 1,475,000NHTSA 405d – Impaired Impaired Driving $ 4,123,000
NHSTA 405f - Motorcycle Motorcycle Safety $ 53,000FHWA – Flex Safe Routes Safe Routes to School $ 500,000
Subtotal $ 14,256,054
Other RevenuesODOT Youth Programs - TOF $ 95,000ODOT - DMV School Zones $ 46,330
ODOT Work Zone Enforcement/Education $ 1,884,000$28 per MC Endorsement Motorcycle Safety $ 1,125,000$6 per License Driver Education (SDTF) $ 4,280,000ODOT DMV - Flat State Match (Program Management) $ 675,000Highway Fund Regional Match (Program Management) $ 450,000
Subtotal $ 8,555,330
FY 2016Federal Revenues $ 14,256,054State/Other Revenues $ 8,555,330Total $ 22,811,384
Fund Sources Area
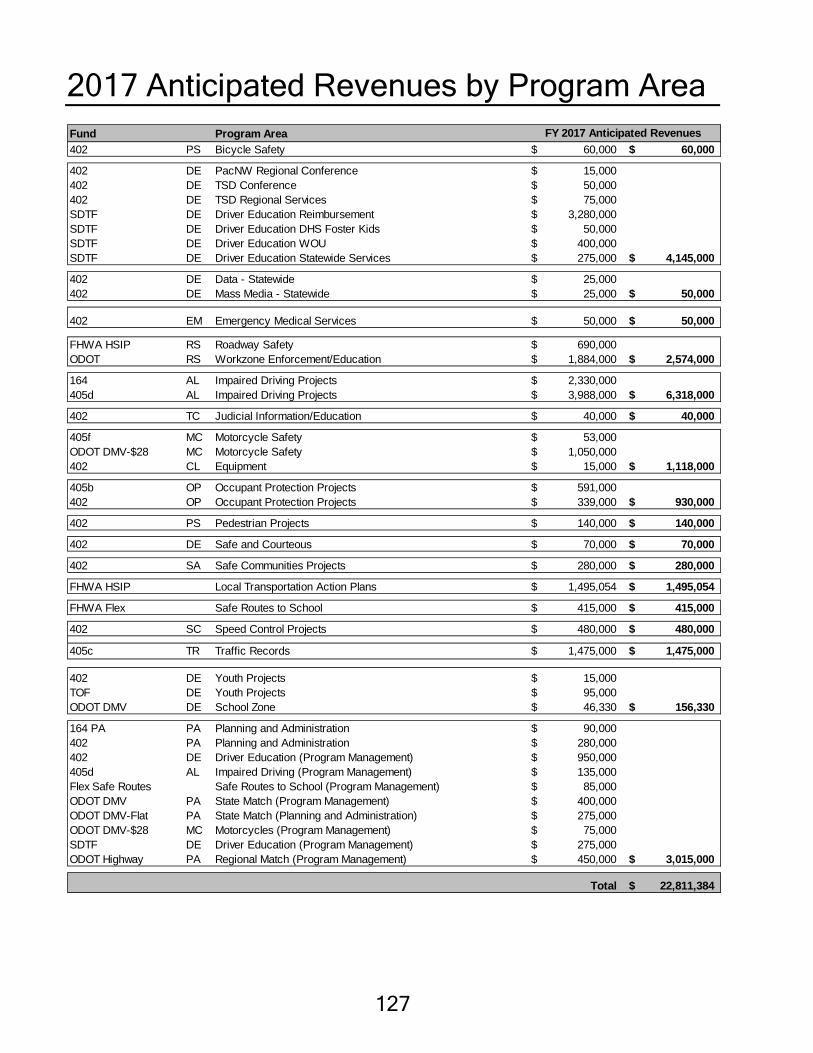
127
2017 Anticipated Revenues by Program Area
Fund Program Area402 PS Bicycle Safety 60,000$ 60,000$
402 DE PacNW Regional Conference 15,000$ 402 DE TSD Conference 50,000$ 402 DE TSD Regional Services 75,000$ SDTF DE Driver Education Reimbursement 3,280,000$ SDTF DE Driver Education DHS Foster Kids 50,000$ SDTF DE Driver Education WOU 400,000$ SDTF DE Driver Education Statewide Services 275,000$ 4,145,000$
402 DE Data - Statewide 25,000$ 402 DE Mass Media - Statewide 25,000$ 50,000$
402 EM Emergency Medical Services 50,000$ 50,000$
FHWA HSIP RS Roadway Safety 690,000$ ODOT RS Workzone Enforcement/Education 1,884,000$ 2,574,000$
164 AL Impaired Driving Projects 2,330,000$ 405d AL Impaired Driving Projects 3,988,000$ 6,318,000$
402 TC Judicial Information/Education 40,000$ 40,000$
405f MC Motorcycle Safety 53,000$ ODOT DMV-$28 MC Motorcycle Safety 1,050,000$ 402 CL Equipment 15,000$ 1,118,000$
405b OP Occupant Protection Projects 591,000$ 402 OP Occupant Protection Projects 339,000$ 930,000$
402 PS Pedestrian Projects 140,000$ 140,000$
402 DE Safe and Courteous 70,000$ 70,000$
402 SA Safe Communities Projects 280,000$ 280,000$
FHWA HSIP Local Transportation Action Plans 1,495,054$ 1,495,054$
FHWA Flex Safe Routes to School 415,000$ 415,000$
402 SC Speed Control Projects 480,000$ 480,000$
405c TR Traffic Records 1,475,000$ 1,475,000$
402 DE Youth Projects 15,000$ TOF DE Youth Projects 95,000$ ODOT DMV DE School Zone 46,330$ 156,330$
164 PA PA Planning and Administration 90,000$ 402 PA Planning and Administration 280,000$ 402 DE Driver Education (Program Management) 950,000$ 405d AL Impaired Driving (Program Management) 135,000$ Flex Safe Routes Safe Routes to School (Program Management) 85,000$ ODOT DMV PA State Match (Program Management) 400,000$ ODOT DMV-Flat PA State Match (Planning and Administration) 275,000$ ODOT DMV-$28 MC Motorcycles (Program Management) 75,000$ SDTF DE Driver Education (Program Management) 275,000$ ODOT Highway PA Regional Match (Program Management) 450,000$ 3,015,000$
Total 22,811,384$
FY 2017 Anticipated Revenues

128

129
2017 Project Funding Narratives As required under FAST Act, the project selection processes for NHTSA-funded grants rely on published reports and various types of studies or reviews. The Transportation Safety Division relies on these reports to also make project selections for all of the other grants and programs that are contained in this Performance Plan. The sources of information are: Countermeasures That Work: A Highway Safety Countermeasure Guide for State
Highway Safety Offices - USDOT State On-Highway Motorcycle Equipment Requirements - MSF Annual Evaluation - TSD Annual Evaluation - various SHSO's from across the country State Highway Safety Showcase - GHSA Mid-Year Project Evaluations - TSD Research Notes - USDOT Program Assessments - various SHSO's from across the country Uniform Guidelines for State Highway Safety Programs – USDOT
Federal Revenue
Section 164 (Current and Prior Year)
Impaired Driving
DUII Statewide Services $1,467,500
A comprehensive traffic safety public information program will be implemented. Materials and supplies developed through this project provide the general population with safe driving messages relevant to alcohol and other intoxicating substances. DUII related PSAs in the form of billboards, print, water closet, television and radio will be aired. Surveys will be conducted to measure public perception, awareness, message saturation and levels of support for DUII laws.
DUII Court 1 - City of Beaverton $125,000
Funds for this project will support a program coordinator for the municipal DUII for the City of Beaverton. This position is critical to the oversight, organization and tracking of offenders while they are participating in the B-SOBR program.
130
DUII Overtime Enforcement Program - OSP $150,000
Oregon State Police continue to participate in the High Visibility Enforcement events throughout the year, designated at high-incidence windows for DUII. This grant will provide overtime funds for troopers working in coordinated statewide DUII-specific patrols.
DISP – Portland Police Bureau $37,500
This grant will provide funds in order for the Portland Police Bureau Traffic Division (the Bureau) to assist the Multnomah County DUII Intensive Supervision Program (DISP). The Bureau's Traffic Division will provide direct law enforcement capability to the court-based probation program. The function of Bureau personnel will be to:
• Conduct warrant sweeps for offenders who have not reported to court, • Conduct home visits to DISP probationers to reinforce probation compliance as
requested by DISP case managers and judges, • PPB officer to attend DISP weekly staffing meeting with team.
Law Enforcement Spokesperson – DPSST $100,000
This project provides funding for the management and training of all DUII related law enforcement training in the State of Oregon. Training is held at various locations, to increase the number of Standardized Field Sobriety Test (SFST) certified trainers, provided mobile video training and conduct a survey of police agencies.
Municipal Agencies Overtime Grants $450,000
This grant is for DUII overtime enforcement to city police departments throughout the state. Approximately 55 cities will receive overtime funds for 2017. Cities participating in the High Visibility Enforcement events will provide DUII-specific patrols at designated high-incidence windows for impaired driving in addition to targeting local events with an alcohol focus.
Planning and Administration
Planning and Administration $90,000
Salaries, benefits, travel, services and supplies and office equipment will be funded for administrative personnel.
Total Section 164 $2,420,000

131
Section 402
Bicycle Safety
Statewide Services - Bicyclist Safety $30,000
Update, reprint and translation of existing informational resources available to the public; development of new material; contribute to the public information and education contract to continue a campaign around motorist awareness of bicyclists and bicyclist safety awareness in an effort to encourage roadway users to share the road.
Bicyclist Safety Education Training $30,000
Provide funding to the Bicycle Transportation Alliance (BTA of Portland, Oregon) to continue bicycle safety education in Oregon schools statewide. The program has well over 50 percent in match funds and provides train-the-trainer instruction and technical advice and assistance to communities implementing bike safety in schools. It is in the fourth year of providing the JumpStart Bicycle Fleet program to a community demonstrating readiness to establish a bike safety program in local schools.
Trauma Nurses Talk Tough – Train the Trainer $15,000
This project provides funding to continue statewide training of trauma care providers to teach the TNTT program. TNTT’s effective presentations address bicycle safety and other wheeled sport safety (skateboards, rollerblades, and scooters), high-risk drivers, seat belt use, impaired driving, cell phone use while driving (including texting/talking on cell phones, and speed). TNTT also contacts Network members every quarter to provide support and offer assistance, sends updated information and statistics in the form of a newsletter and conducts trainings for schools and other community groups on how to hold helmet sales and 8-hour trainings for child safety seat clinics.
Driver Education
Statewide Services – Supplement for Non-ODOT Providers to attend the PacNW Regional Conference
$15,000
These funds are to provide support for both out-of-state and non-ODOT instructors to attend the annual Pacific Northwest Regional Driver and Traffic Safety Conference in March each year.

132
EMS
EMS Statewide Services $50,000
This funding will assist in strengthening Oregon’s EMS statewide. It will be used for scholarships for rural emergency medical services personnel; both paid and volunteer, to attend one of three statewide emergency medical services conferences. Funding will also be used to deliver EMS training and equipment for rural emergency medical service agencies through additional partnerships.
Equipment
Statewide Services – Equipment $15,000
This project will contribute to the annual division telephone survey that includes questions about equipment safety; update and reprint brochures, flyers and other resources materials; contribute to the public information and education media contract to continue to educate motorists and motorcyclists about equipment safety issues. This includes concepts related to towing safety; securing loads; vehicle maintenance; window tinting regulations; vehicle customization regulations, and general equipment laws.
Judicial
Judicial Education $40,000
Provide traffic safety related education to Oregon Municipal, Justice, and Circuit Court Judges. Work with State Circuit Courts, Court Administrators, and District Attorneys by providing traffic law training, materials, or topical experts to assist in education delivery.
Occupant Protection
Statewide Services – Occupant Protection $196,000
Contractor costs for educational materials production/distribution, paid and unpaid media, public attitude and observed restraint use survey, and for direct purchase, reproduction and/or distribution of educational materials.

133
Statewide Instructor Development, Tech Training, & Region 1 Fitting $85,000
Funds administration, instructor services, and equipment & supplies necessary to train CPS technicians & develop instructors; may include instructor fees, facility rentals, training materials/supplies, and scholarships for technician and instructor candidates (per diem travel costs, certification fees, and conference registration). Also provides mini-grants to community fitting stations and/or alternative sentencing programs to cover costs of equipment and supplies.
Local PD Safety Belt Overtime Mini-Grants, TSD $58,000
Officer overtime for traffic enforcement and educational activities that facilitate compliance with Oregon motor vehicle restraint laws, including participation in three, two-week high-visibility enforcement “waves”. Expenses to undergo initial child passenger safety certification training may also be covered (certification fee & lodging/travel/meals per diems.)
Pedestrian
Statewide Services - Pedestrian Safety $50,000
Contribute to the Public Information and Education contract to continue a campaign around motorist awareness of pedestrians and pedestrian safety awareness. Provide year-round safety messaging on Bend Area Transit. Work with ODOT Regions and Safe Communities Program to provide pedestrian safety education and coordinated safety messages. Work with Oregon Impact to provide meaningful pedestrian fatality and serious injury data and safety materials to law enforcement agencies conducting overtime pedestrian safety enforcement. Work with ODOT to provide needed materials on traffic control devices (HAWK) and recently passed pedestrian legislation.
Pedestrian Safety Enforcement and Training $90,000
Fund the pedestrian safety enforcement (PSE) mini-grant program to include operations, training and evaluation, and diversion classes, to be administered by Oregon Impact.
Police Traffic Services
DPSST Law Enforcement Training Grant $87,000
This project will be used to certify Oregon Law Enforcement officers in the use of radar and lidar, provide crash investigation training, and support motor officer training outreach. The project co-funds a full-time DPSST employee to manage the program and deliver/coordinate the training in cooperation with TSD. Additionally, this position will begin monitoring the statewide movement to eCitation and eCrash programs and its’ marriage with data-based policing.
134
Region Services
Regional Services $75,000
This project provides funding that can be used for transportation safety education, outreach, enforcement, and services to a wide variety of community based traffic safety programs. Each Region will develop strategies for targeted crash reduction. Information and education will be provided on priority transportation safety program areas. Mini-grants may be provided to local jurisdictions and traffic safety organizations to address identified transportation safety problems.
Safe & Courteous
Statewide Services – Driver Education $70,000
Provides for specific research; public information; media; education, and enforcement activities for all Safe and Courteous programs: Red light running; Drowsy driving; Following too close; Lights and swipes, and Distracted Driving. A media campaign specifically for youth will be done to raise awareness and compliance in regard to distracted driving. A public service announcement will be created and aired statewide. Two distracted driving messages will be put on each side of a bus in Bend to spread the messages throughout Bend. Place a distracted driving ad on page 3 of the 101 Things To Do Coastal and Western Oregon, which distributes 125,000 copies throughout Tillamook, Clatsop, Clackamas, Yamhill, Marion, Polk, Benton, Linn, Lincoln, Lane, Coos and Douglas counties. Distributed to hotels, motels, RV resorts, chambers of commerce, visitor centers, high traffic attractions, and the Eugene airport.
Safe Communities
Transportation Safety Conference $50,000
Provide for a statewide conference, or a series of regional conferences. The conference will provide a forum for sharing information and data of statewide significance in reducing transportation related deaths and debilitating injuries, and allow participants to connect programs and ideas. The grant will provide for speakers, facilities costs, and incidental materials.
Statewide Community Transportation Safety $1,000
This project will provide for statewide support of local and regional efforts to promote safety efforts. Project will result in the development of materials and resources to assist specific projects, training event(s) that promote crash reduction strategies, and promote driving crash related deaths and injuries to zero. The project will provide for support materials and educational efforts to share and promote the Transportation Safety Action Plan, the state of Oregon’s Strategic Highway Safety Plan.

135
Rural County Coordinator $1,000
This project will implement countermeasures designed to reduce death and injury using NHTSA’s “Countermeasures That Work” as inspiration to pursue the current county business plan created in the prior year, and continue to update the plan as a living document for future year(s) – eventually leading to the development of a countywide Transportation Safety Action Plan. This project will provide funds for a part time local safe community coordinator in a rural County to enhance the existing active Safe Community coalition youth traffic safety coalition in pursuing countermeasures to reduce death and injury, with a focus on assisting with projects in their business plan.
Suburban Safe Community $45,000
The project will work with local governments to establish and or maintain a Safe Communities coalition and to refine an aggressive 4E approach to reducing death and injury. The project will adapt strategies from NHTSA’s “Countermeasures That Work” and FHWA’s “Proven Safety Strategies” along with the safety program principles of the Safe Community model to address these specific problem stretches of roadway in cooperation with affected jurisdictions such as ODOT and city governments.
Suburban Safe Community $20,000
The project will implement portions of a county level Transportation Safety Action Plan. This project will continue to integrate the elements of the Safe Community concept within a suburban county, and will specifically encourage partnerships within the county government, and with cities within the county. The project will specifically implement actions to initiate culture changes inside and outside county government, moving the community to a zero acceptable death approach to managing motor vehicle traffic. This project will provide for additional interaction with other counties and cities within the state.
Safe Community Services $105,000
The project will provide exciting and innovate webinar and direct training, mentoring, technical assistance to promote traffic safety volunteer efforts that mirror NHTSA’s “Countermeasures That Work” and other proven or promising efforts. The project will provide access to a statewide community traffic safety specialist to every traffic safety group in Oregon. This project will offer local traffic safety advocates access to additional technical assistance via weekday 1-800 “warm” line, and a minimum of 12 electronic newsletters featuring traffic safety ideas and recognition for successful programs. This project will make at minimum phone contact with 100% of the recognized local traffic safety communities in the fiscal year, and work with ODOT region staff to insure that 100% of the recognized communities receive at least one in-person visit during the time. The project will be responsible to increase the number of citizens who volunteer to assist for traffic safety projects, and promote volunteerism by a measurable level. The project may allow for the award of at minimum $5,000 in very small contracts (under $1,000) with local governments designed to stimulate volunteer efforts.

136
Rural County Coordinator $38,000
This project will implement countermeasures designed to reduce death and injury using NHTSA’s “Countermeasures That Work”. The project will provide for staff to aide in the development of a county level Transportation Safety Action Plan. The project will provide funds for a part time local safe community coordinator for the a rural county. The coordinator position will complement the existing volunteer efforts, and provide further organization allowing greater output from the existing coalitions.
Suburban Safe Community $40,000
This project will implement countermeasures designed to reduce death and injury using NHTSA’s “Countermeasures That Work”. The project will provide for staff to aide in the development of a county level Transportation Safety Action Plan. The project will provide funds for a part time local safe community coordinator for the a rural county. The coordinator position will complement the existing volunteer efforts, and provide further organization allowing greater output from the existing coalitions.
Rural County Coordinator $30,000
This project will implement countermeasures designed to reduce death and injury using NHTSA’s “Countermeasures That Work”. The project will provide for staff to aide in the development of a county level Transportation Safety Action Plan. The project will provide funds for a part time local safe community coordinator for a rural county. The coordinator position will complement the existing volunteer efforts, and provide further organization allowing greater output from the existing coalitions.
Speed
Speed Enforcement, Public Information and Equipment $193,000
This project will be used to fund police speed overtime in areas with a high incidence of speed-related problems. Additional funds for speed overtime enforcement and some equipment will be provided to each of the five Region Coordinators. This project will also be used to fund focused police motorcycle training.
OSP Rural State Highway Speed Enforcement $100,000
This project will be used to purchase overtime speed enforcement for the Oregon State Police to be used on rural state highways in areas that through statistical crash analysis coupled with local OSP office expertise and knowledge of problem areas within each command show a high incidence of speed-related crashes, injuries and fatalities.

137
Region Speed Grants $100,000
Provide funds to Region 1 to allow for Speed Equipment, overtime to Region 1 law enforcement or other Speed-related outreach to Region 1 residents.
Statewide Services
Statewide Services – Division wide Media (TSD) $25,000
This project provides funding for Public Information and Education Media Services annual report on the level of use received by the Transportation Safety PSAs and their retail value.
Statewide Services – Data/Observation Study/Telephone Research $25,000
This project contributes funding to the TSD opinion surveys conducted, as they related to transportation safety programs.
Planning and Administration
Planning and Administration $280,000
[$275,000]
Salaries, benefits, travel, services and supplies and office equipment will be funded for administrative personnel.
Program Management
Program Management $950,000
[$400,000]
Salaries, benefits, travel, services and supplies and office equipment will be funded for program coordination.
Total 402 $2,909,000
[$625,000]

138
405b
405b – Occupant Protection
County Safety Belt Overtime Enforcement, OSSA $255,000
Administrative & officer overtime for traffic enforcement and educational activities that facilitate compliance with Oregon motor vehicle restraint laws, including participation in three, two-week high-visibility enforcement “waves”. Expenses to undergo initial child passenger safety certification training may also be covered (certification fee & lodging/travel/meals per diems.)
Statewide Safety Belt Overtime Enforcement, OSP $85,000
Administrative & trooper overtime for traffic enforcement and educational activities that facilitate compliance with Oregon motor vehicle restraint laws, including participation in three, two-week high-visibility enforcement “waves”. Expenses to undergo initial child passenger safety certification training may also be covered (certification fee & lodging/travel/meals per diems.)
CPS Fitting Station Support, ODOT Regions $23,600
Funds mini-grants to fitting stations and/or alternative sentencing programs to cover costs for purchase of equipment, supplies, child car seats, boosters, and scholarships for technician and instructor candidates (per diem travel costs, certification fees).
Local PD Safety Belt Overtime Mini-Grants, TSD $227,400
Officer overtime for traffic enforcement and educational activities that facilitate compliance with Oregon motor vehicle restraint laws, including participation in three, two-week high-visibility enforcement “waves”. Expenses to undergo initial child passenger safety certification training may also be covered (certification fee & lodging/travel/meals per diems.)
Total 405b $649,000

139
405c
Traffic Records
Traffic Records Grant $1,050,000
Develop and implement an effective traffic records program to improve the timeliness, accuracy, completeness, uniformity, integration, and accessibility of the safety data needed to identify priorities for national, state and local highway and traffic safety programs. Evaluate the effectiveness of efforts to make such improvements. Link the state data systems, including traffic records, with other data systems within Oregon, such as systems that contain medical, roadway, and economic data. The Traffic Records Coordinating Committee (TRCC) will be selecting high priority projects that fit these criteria during FY2017.
Pre-Hospital Admission Data System Expansion $225,000
This project will allow the Oregon Health Division to provide for training and improvements needed to allow local governments to participate in submitting data to the Oregon Health Division’s prehospital data system, resulting in likely improvements in data uniformity, integration, timeliness, accuracy, and completeness of the medical data file. It is anticipated that there may also be some improvement in local accessibility to the database as well.
Data Linkage $200,000
This project will allow the Oregon Health Division to provide for technical efforts needed to explore data system linkage between pre and post hospital admission data within the Oregon Health Division’s data system, resulting in likely improvements in data integration of the medical data file. It is anticipated that there may also be some improvement in local accessibility to the database, as well opportunities to enter into deeper analysis of the data.
Total 405c $1,475,000
405d
405d - Impaired Driving (Alcohol)
DUII Enforcement – OSSA Departments $400,000
The Oregon State Sheriffs Association will provide mini-grants for overtime hours to county sheriff’s offices for DUII saturation patrols during the High Visibility Enforcement events throughout the year, designated as high-incidence windows for DUII.

140
NHTSA HVE Paid Media $200,000
This is a quarterly HVE paid public information announcement regarding saturation patrols equally divided among four quarters, $50,000 each quarter.
DUII Multi-Disciplinary Task Force Training Conference $130,000
This project provides funding for an annual training conference, specifically focused on DUII issues, which includes participating disciplines such as law enforcement, prosecutors, prevention and treatment professionals and others across the DUII spectrum of involvement. The DUII Multidisciplinary Task Force Conference will reach well over 300 people within the State of Oregon, working in the DUII subject area.
DUII Resource Prosecutor I $231,543
This project provides an expert DUII prosecutor who serves as a resource to municipal, county and state prosecutors in handling complex DUII laws, including new marijuana DUII cases. The DUII Prosecutor will travel throughout Oregon to assist with DUII cases, participate as a trainer for prosecutors and law enforcement relating to DUII law and procedures.
DUII Resource Prosecutor II $231,543
This project provides a second expert DUII prosecutor who serves as a resource to municipal, county and state prosecutors in handling complex DUII laws. This position will assist with DUII cases, develop and maintain DUII case law resources, list-serves and databases for local prosecutors working on DUII cases. This position will also be based within the Criminal Justice Division of the Department of Justice and will work with the other TSRP to increase capacity, training and services for prosecutors across the state. This grant is cost-shared with the DOJ and will last for three years before being absorbed by DOJ completely.
Region Impaired Driving Programs $25,000
This grant is to go to each of the five regions to assist with impaired driving training programs as needed for each of the regions.
Statewide Services Program – DUII $2,124,964
A comprehensive traffic safety public information program will be implemented. Materials and supplies developed through this project provide the general population with safe driving messages relevant to alcohol and other intoxicating substances. DUII related PSAs in the form of billboards, print, water closet, television and radio will be aired. Public opinion surveys will be conducted.

141
Beaverton PD – No Refusal $14,400
The goal of the “No Refusal” Program is to deter people from driving under the influence and prevent impaired driving crashes. The program provides a tool for law enforcement to collect and preserve time-sensitive evidence. The BPD will work with prosecutors and judges to quickly obtain blood draw warrants for drivers who refuse Blood Alcohol Content (BAC) testing. Individuals suspected of impaired driving who unlawfully refuse to provide a breath test will be subject to blood testing, generally conducted at the Beaverton Police Department.
Impaired Driving (Drugs)
Drug Recognition Expert – Blood Testing $60,000
This project is designed to encourage state and local law enforcement agencies to pursue the collection and analysis of blood evidence for drugs in DUII cases, for the purposes of improved prosecution, more complete data gathering, and as a tool for improving DRE evaluation accuracy.
ODAA - “Protecting Lives Saving Futures” $73,680
This project funds training for prosecutors in the specific processes and techniques involved in a DUII arrests and convictions and encourages partnerships in dealing with the crime of alcohol and drug-impaired driving.
Drug Recognition Expert Training (DRE) $180,000
Provide training and coordination of the Oregon Drug Evaluation and Classification (DEC) program and other related impaired driving programs in accordance with the International Association of Chiefs of Police (IACP) and NHTSA guidelines and recommendations. This grant provides for two complete DRE schools to be conducted in FY2017.
Drug Recognition Expert Overtime Enforcement Project $125,000
Provides statewide overtime enforcement by DREs (Drug Recognition Experts) representing multiple law enforcement agencies.
CLEAR Alliance Prevention Education to Reduce Impaired Driving $191,870
This project develops and provides educational materials and training for schools related to marijuana and impaired driving. This project will also develop and place media messages targeted to youth that are focused on the dangers of marijuana and impaired driving.
142
Program Management $135,000
Salaries, benefits, travel, services and supplies and office equipment will be funded for administrative personnel.
Total 405d $4,123,000
405f
Motorcycle Safety Training Enhancement $40,000
This project will provide funding for new training locations by purchase or lease of land, buildings and improvements. The project may also fund curriculum improvement and development, development and enhancement of instructor recruitment and retention efforts, development and purchase of instructional materials, purchase of mobile training units and purchase or repair of training motorcycles.
Motorist Awareness $13,000
This project will provide funding for the Motorcycle Program Public Information and Education campaign to address motorist awareness of motorcycles in traffic. Potential partnerships with non-profit and for-profit organizations for media campaigns and informational presentations.
Total 405f $53,000
FHWA/Highway Safety Improvement Program
Human Factors Engineering $50,000
Provide safety engineering human factors training(s) for traffic engineering analysts, transportation safety advocates internally and potentially externally to ODOT. Anticipated training will cover methods within the latest version of the Human Factors Guide.
Engineering Safety Short Courses and Distance Learning $250,000
Provide safety engineering training to traffic engineers, analysts, transportation safety coordinators, enforcement personnel and public works staff and officials. Anticipated training will consist of safety trainings similar to the following Traffic Engineering Fundamentals; Uniform Traffic Control Devices; Roundabout Design and Control; Materials and Retro-Reflectivity for Signs and Markings; ADA for Bike and Peds, and Multimodal Intersections. Jurisdictions will receive on-site traffic control device and safety engineering reviews by several safety engineering specialists to be documented within individual reports.

143
Safety Features for Local Roads and Streets $150,000
Provide traffic safety engineering and related police enforcement training to local officials, public works staff and local traffic safety committees by holding free workshops at various locations around the state. Develop and enhance local agency guidance documents and provide additional local agency services to enhance safety knowledge and application in their jurisdiction.
Safety Corridor Education and Enforcement $60,000
Provide state and local police agency overtime enforcement and education materials for priority safety corridors statewide.
Roadway Departure Enforcement $180,000
Provide state police overtime enforcement for priority roadway departure locations.
Local Jurisdictional Assistance $1,190,000
This project will allow for the development of local government level Transportation Safety Action Plans in communities statewide and allow for some minor facility improvements as identified in the planning processes, and within the jurisdictions. Targeted communities will include those that show promise for implementation of the safety actions identified, or are high fatality and serious injury jurisdictions either by rate or volume.
Lane County Regional Safety Plan $60,054
This project will allow for the development of a Lane County Transportation Safety Action Plan that addresses the Four E approach to transportation safety. The plan will coordinate with ODOT’s TSAP, the local ODOT Region and Area Commission on Transportation, the local MPO and other local governments where practicable. The resulting plan will identify data driven safety actions that address fatality and serious injury within the jurisdiction.
City of Portland Regional Safety Plan $150,000
This project will allow for the development of a City of Portland Transportation Safety Action Plan that addresses the Four E approach to transportation safety. The plan will coordinate with ODOT’s TSAP, the local ODOT Region, the local MPO, and Multnomah County where practicable. The resulting plan will identify data driven safety actions that address fatality and serious injury within the jurisdiction.

144
Washington County Regional Safety Plan $95,000
This project will allow for the development of a Washington County Transportation Safety Action Plan that addresses the Four E approach to transportation safety. The plan will coordinate with ODOT’s TSAP, the local ODOT Region and Area Commission on Transportation, the local MPO and other local governments where practicable. The resulting plan will identify data driven safety actions that address fatality and serious injury within the jurisdiction.
Total FHWA/HSIP $2,185,054
Other Revenue
Highway Fund
Region Program Management
Region Program Management [$450,000]
Salaries; benefits; travel; services and supplies; and office equipment will be funded for region program personnel.
Total Highway [$450,000]
Statewide Transportation Improvement Program (STIP)
SRTS
Safe Routes to School Non-infrastructure Grant Program [$340,000]
Funding for reimbursement to communities based on a competitive award process for the creation of Oregon SRTS Action Plans and implementation of the Action Plans addressing education and encouragement, enforcement, and evaluation.
Safe Routes to School Statewide Services Program [$30,000]
Providing statewide support to communities in development of Safe Routes to School programs and creation of Action Plans; assisting schools in gathering student and parent data on walking and biking to/from schools; creating public information and outreach support materials; providing and developing educational tools that promote safe walking and bicycling for grades K-8; supporting Safe Routes Advisory Committee with travel and meeting expenses.

145
Statewide Walk + Bike Program [$45,000]
Provide statewide support for October Walk+Bike to School Day and May Walk + Bike Challenge Month, by providing registration, technical support for over 200 Oregon schools.
Safe Routes to School Program Management [$85,000]
Salaries, benefits, travel, services and supplies and office equipment will be funded for Safe Routes to School program coordination.
Work Zone
Work Zone Education & Equipment Program [$200,000]
Provide design, printing and distribution of promotional materials. Contractual services for development and distribution of work zone safety messages, posting of billboards, transit, radio, television, and internet ads. Contractual services for portions of the annual TSD Telephone Survey and law enforcement training services. Equipment purchases consisting of work zone related patrol equipment needed by state and local agencies providing work zone enforcement, work zone data tracking information system software enhancement and maintenance agreement(s), and Department of Justice advice.
Work Zone Enforcement to OSP [$1,000,000]
Provide year-round work zone enforcement patrols that meet federal design criteria for construction projects managed by ODOT. Enforcement will be provided by OSP. Photo radar enforcement in work zones as an ODOT project may also be included.
Work Zone Enforcement to Local Police Agencies [$684,000]
Provide year-round work zone enforcement patrols that meet federal design criteria for construction projects managed by ODOT. Enforcement will be provided by various local police agencies statewide. Photo radar enforcement in work zones as an ODOT project may also be included.
Total STIP [$2,384,000]

146
Student Driver Training Fund (STDF)
Driver Education Program Reimbursement [$3,280,000]
These funds reimburse public and private providers for their cost in providing driver education to students. Reimbursement is made to each public or private provider based on the number of students completing the driver education course, not to exceed $210 per student, the maximum allowed by law. Additionally, a low/no cost subsidy is available, not to exceed $75 per qualified student. Curriculum standards and delivery practices are met before reimbursement dollars are provided. Adaptive Strategies Program allows TSD DE to fund “project specific” activities that increase access to “Frontier” Oregon teens.
GDL Implementation - Information and Education [$400,000]
These funds pay for a grant to Western Oregon University to train beginning instructors completing the instructor preparation courses and provide for trainer of trainers’ development and workshops, additionally these funds provide for the Instructor Certification program. Funds also provide for the Pacific Northwest Driver and Traffic Safety Conference and curriculum update projects for ODOT-TSD through Western Oregon University.
Statewide Services – Driver Education [$275,000]
This grant supports the driver education advisory committee quarterly meetings and activities promoting “best practices” in driver education.
Driver Education DHS Foster Kids [$50,000]
These funds reimburse DHS for their parent cost in providing driver education to eligible foster teens. Reimbursement is made to DHS based on the number of students completing the driver education course. Eligibility standards and course completion are managed by the DHS Foster Care Program.
Student Driver Training Fund Program Management [$275,000]
Salaries, benefits, travel, services and supplies and office equipment will be funded for Driver Education staff.
Total SDTF [$4,280,000]

147
Transportation Operating Fund (TOF)
Think First [$47,500]
This project addresses the high incidence of brain and spinal cord injuries suffered by Oregon’s youth through Think Injury Prevention programs. Program goals are accomplished by providing relevant information and tools so Oregon youth can make wise decisions to prevent injury and death. Project goals are accomplished by providing family education events, injury prevention resources for parents, teachers and youth, injury prevention curriculum for schools and community members, school presentations for grades 1 through 12, and community injury prevention activities at outreach events. This program has been proven effective to address the acceptance of risk in pre-driver education children; therefore the presence of the program throughout the state will be maintained.
Trauma Nurses Talk Tough [$47,500]
This funding supports the ongoing and expanding work of TNTT. TNTT conducts safety education programs for kindergarten through college, helps develop and participate in statewide safety promotional events, participates in research and data collection about traumatic injuries, promotes proper use of bicycle helmets, safety belts and car seats and works with other partners to provide safety information to high risk youth, including parents whenever possible. This program has been proven effective to address the acceptance of risk in pre-driver education children; therefore the presence of the program throughout the state will be maintained.
Total TOF [$95,000]
Motorcycle Funds
Oregon State University TEAM OREGON [$850,000]
This project will provide funding for training sites and daily operation of statewide motorcycle safety project. Daily operation includes: Mobile Program courses, instructor training, instructor update workshops, instructor and training location monitoring, public information and education activities by staff and instructors (public awareness presentations, fairs, mall shows, Sober Graduation presentations, motorcycle events, etc.) and daily operational functions. Training sites include site assistance, statewide liability insurance, equipment, printing and materials.

148
Motorcycle Safety Improvements [$120,000]
This project will provide funding for motorcycle safety training infrastructure by purchase of motorcycles, purchase or lease of land, buildings and improvements.
Statewide Services Motorcycle Safety [$80,000]
This project will provide funding for membership in the National Association of State Motorcycle Safety Administrators, implementation of some of the recommendations from the 2015 Oregon Motorcycle Safety Program Assessment, ongoing work with the Assistant Attorney General assigned to ODOT for Oregon Administrative Rule development and revision, public information and educational campaigns, and various motorcycle safety surveys. This project also supports projects prioritized by the Governor’s Advisory Committee on Motorcycle Safety (GAC-MS) and includes committee member travel, meeting expenses, publication expenses, and implementation of the GAC-MS Strategic Plan 2016 – 2021. Past GAC-MS projects have included a survey of motorcycle ridership and cross-check mailing to motorcycle owners who were not endorsed.
Motorcycle Safety Program Management [$75,000]
Salaries; benefits, travel; services and supplies; and office equipment will be funded for the Motorcycle program manager.
Total Motorcycle [$1,125,000]
State Funds
School Bus Safety Education [$46,330]
This funding will be granted to the Oregon Department of Education for the purpose of School Bus Safety Education. Funding will be used for training students on how to travel to and from school safely and may also be used for maintaining and/or replacing “Buster” and “Barney” buses as presentation tools for student safety training.
Total State Funds [$46,330]

149
U.S. Department of Transportation National Highway Traffic Safety Administration
State: Oregon Highway Safety Plan Cost Summary Page: 1
2017-HSP-1 Report Date: 04/22/2016 For Approval
Program
Area Project Description Prior Approved Program Funds State Funds Previous Bal. Incre/(Decre) Current
Balance Share to
Local NHTSA NHTSA 402 Planning and Administration
PA-2017-91-90-00 $.00 $280,000.00 $.00 $280,000.00 $280,000.00 $.00 Planning and
Administration Total $.00 $280,000.00 $.00 $280,000.00 $280,000.00 $.00
Emergency Medical Services
EM-2017-00-00-00 $.00 $.00 $.00 $50,000.00 $50,000.00 $.00 Emergency Medical Services
Total $.00 $.00 $.00 $50,000.00 $50,000.00 $.00
Motorcycle Safety
MC-2017-00-00-00 $.00 $1,200,000.00 $.00 $.00 $.00 $.00 Motorcycle Safety Total $.00 $1,200,000.00 $.00 $.00 $.00 $.00
Occupant Protection
OP-2017-00-00-00 $.00 $.00 $339,000.00 $339,000.00 $.00 Occupant Protection Total $.00 $.00 $339,000.00 $339,000.00 $.00
Pedestrian/Bicycle Safety
PS-2017-60-00-00 $.00 $.00 $.00 $75,000.00 $75,000.00 $.00 PS-2017-68-00-00 $.00 $.00 $.00 $140,000.00 $140,000.00 $.00
Pedestrian/Bicycle Safety Total
$.00 $.00 $.00 $215,000.00 $215,000.00 $.00
Codes and Laws
CL-2017-00-00-00 $.00 $.00 $.00 $15,000.00 $15,000.00 $.00 Codes and Laws Total $.00 $.00 $.00 $15,000.00 $15,000.00 $.00
Driver Education

150
DE-2017-00-00-00 $.00 $450,000.00 $.00 $260,000.00 $260,000.00 $.00 DE-2017-20-90-00 $.00 $400,000.00 $950,000.00 $950,000.00 $.00
U.S. Department of Transportation National Highway Traffic Safety Administration
State: Oregon Highway Safety Plan Cost Summary Page: 2
2017-HSP-1 Report Date: 04/22/2016 For Approval
Program
Area Project Description Prior Approved Program Funds State Funds Previous Bal. Incre/(Decre) Current Balance
Share to
Local
DE-2017-21-00-00 $.00 $.00 $.00 $15,000.00 $15,000.00 $.00 Driver Education Total $.00 $850,000.00 $.00 $1,225,000.00 $1,225,000.00 $.00
Safe Communities
SA-2017-00-00-00 $.00 $.00 $50,000.00 $230,000.00 $280,000.00 $.00 Safe Communities Total $.00 $.00 $50,000.00 $230,000.00 $280,000.00 $.00
Speed Management
SC-2017-00-00-00 $.00 $.00 $30,000.00 $450,000.00 $480,000.00 $.00 Speed Management Total $.00 $.00 $30,000.00 $450,000.00 $480,000.00 $.00
Traffic Courts
TC-2017-00-00-00 $.00 $.00 $.00 $40,000.00 $40,000.00 $.00 Traffic Courts Total $.00 $.00 $.00 $40,000.00 $40,000.00 $.00
NHTSA 402 Total $.00 $2,330,000.00 $1,369,000.00 $1,555,000.00 $2,924,000.00 $.00 164 Transfer Funds 164 Planning and Administration
164PA-2017-00-00-00 $.00 $.00 $.00 $90,000.00 $90,000.00 $.00 164 Planning and
Administration Total $.00 $.00 $.00 $90,000.00 $90,000.00 $.00
164 Alcohol
164AL-2017-00-00-00 $.00 $.00 $1,592,825.00 $737,175.00 $2,330,000.00 $.00 164 Alcohol Total $.00 $.00 $1,592,825.00 $737,175.00 $2,330,000.00 $.00
164 Transfer Funds Total $.00 $.00 $1,592,825.00 $827,175.00 $2,420,000.00 $.00 MAP 21 405b OP High
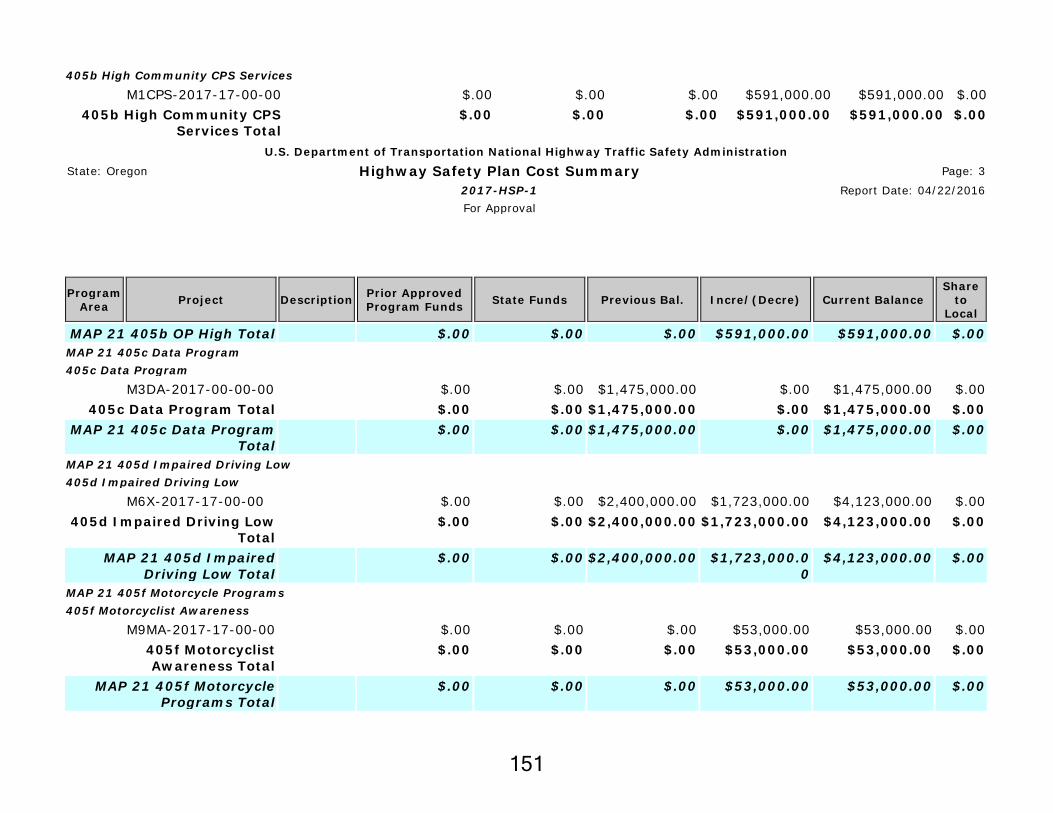
151
405b High Community CPS Services
M1CPS-2017-17-00-00 $.00 $.00 $.00 $591,000.00 $591,000.00 $.00 405b High Community CPS
Services Total $.00 $.00 $.00 $591,000.00 $591,000.00 $.00
U.S. Department of Transportation National Highway Traffic Safety Administration
State: Oregon Highway Safety Plan Cost Summary Page: 3
2017-HSP-1 Report Date: 04/22/2016 For Approval
Program
Area Project Description Prior Approved Program Funds State Funds Previous Bal. Incre/(Decre) Current Balance
Share to
Local
MAP 21 405b OP High Total $.00 $.00 $.00 $591,000.00 $591,000.00 $.00 MAP 21 405c Data Program 405c Data Program
M3DA-2017-00-00-00 $.00 $.00 $1,475,000.00 $.00 $1,475,000.00 $.00 405c Data Program Total $.00 $.00 $1,475,000.00 $.00 $1,475,000.00 $.00
MAP 21 405c Data Program Total
$.00 $.00 $1,475,000.00 $.00 $1,475,000.00 $.00
MAP 21 405d Impaired Driving Low 405d Impaired Driving Low
M6X-2017-17-00-00 $.00 $.00 $2,400,000.00 $1,723,000.00 $4,123,000.00 $.00 405d Impaired Driving Low
Total $.00 $.00 $2,400,000.00 $1,723,000.00 $4,123,000.00 $.00
MAP 21 405d Impaired Driving Low Total
$.00 $.00 $2,400,000.00 $1,723,000.00
$4,123,000.00 $.00
MAP 21 405f Motorcycle Programs 405f Motorcyclist Awareness
M9MA-2017-17-00-00 $.00 $.00 $.00 $53,000.00 $53,000.00 $.00 405f Motorcyclist Awareness Total
$.00 $.00 $.00 $53,000.00 $53,000.00 $.00
MAP 21 405f Motorcycle Programs Total
$.00 $.00 $.00 $53,000.00 $53,000.00 $.00
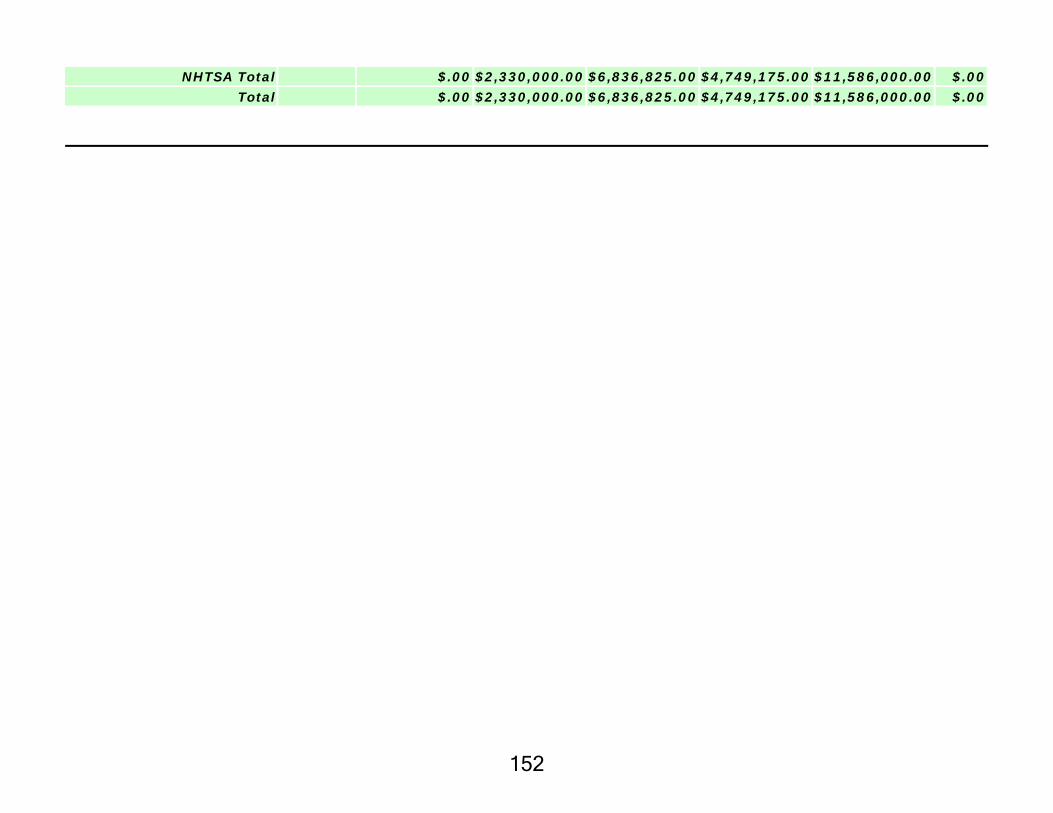
152
NHTSA Total $.00 $2,330,000.00 $6,836,825.00 $4,749,175.00 $11,586,000.00 $.00 Total $.00 $2,330,000.00 $6,836,825.00 $4,749,175.00 $11,586,000.00 $.00

153
Highway Safety Plan Oregon’s federal grant funds will be used to implement projects that are designed to respond to identified problems and impact performance goals. Federal funds will be used consistent with federal program guidelines, priority areas, and other federal funding requirements.
Since strategies designed to impact individual program areas are intimately related to specific problems and performance goals for that program, they are not included here. See specific program areas for the strategies planned for individual programs.
This Performance Plan has been formally approved and adopted by the Governor’s Representative for Highway Safety.
_______________________ ______________________________________________ Date Troy E. Costales, Administrator
Governor’s Representative for Highway Safety Transportation Safety Division Oregon Department of Transportation


Drive Safely. The Way to Go.