organic market memo - organic denmark baner...
TRANSCRIPT
ORGANICMARKET MEMO
JUNE 2015
Organic Denmark · Silkeborgvej 260 · 8230 Åbyhøj · organicdenmark.dk · 87 32 27 00
» Organic market development 4
» Organic Market Share of Product Groups 6
» Organic sales 8
» Sales by sales channels 12
» Sales by retail chains 13
» Organic potential of chains 14
» Organic consumers 15
TABLE OF CONTENTS
”Denmark is the world leading
organic nation with an organic market
share of 7,6%”
ØKOLOGISK MARKEDSNOTAT 2015
4
In 1982, the first organic carrots were sold in the Danish retail sector. The organic production was limited at the time, and consumer interest was not exactly overwhel-ming.
The first actual legislation governing organic production was not implemented until 1987, and 1989 saw the introduction of the Danish state-controlled organic inspec-tion label, the red Ø-label.
At the turn of the year 1992/1993, demand for organic products was still so low that it was only possible to sell half of the organic milk as organic. The summer of 1993, however, marked a turning point when the retail chain SuperBrugsen offered massive price reductions combined with considerable marketing efforts on TV, in shopping newspapers and advertisements. Other chains followed suit with similar sales-pro-moting initiatives, making sales skyrocket, and already during the first year, the mar-ket situation saw a total change. Suddenly, there was a shortage of organic products.
The initiatives of the retail sector in 1993 were subsequently followed up by a 5% membership bonus on organic products in the Dagli’Brugsen and SuperBrugsen retail chains in 1996 and 1997, and in 1997, the retail chain Netto produced a shopping newspaper that only advertised organic products.
The Danish state has also supported organic production by earmarking state budget funds for marketing and subsidies for farmers switching to organic production. In 1995 and 1999, the state also prepared an action plan to promote organic food pro-duction in Denmark.
ORGANIC MARKET DEVELOPMENT
ØKOLOGISK MARKEDSNOTAT 2015
5
8
7
6
5
4
3
2
1
0
%
1992
20
00
1996
20
04
20
10
1994
20
02
20
08
1998
20
06
20
12
1993
20
01
1997
20
05
20
11
1995
20
03
20
09
1999
20
07
20
13
20
14
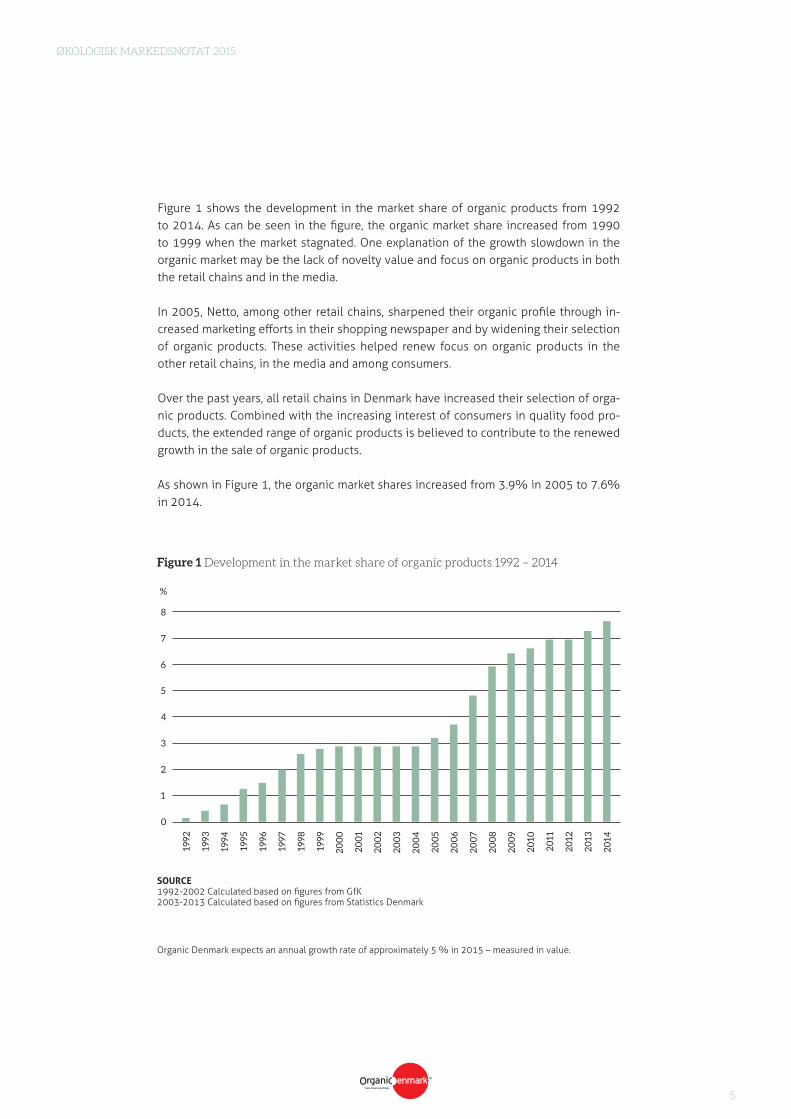
Figure 1 shows the development in the market share of organic products from 1992 to 2014. As can be seen in the figure, the organic market share increased from 1990 to 1999 when the market stagnated. One explanation of the growth slowdown in the organic market may be the lack of novelty value and focus on organic products in both the retail chains and in the media.
In 2005, Netto, among other retail chains, sharpened their organic profile through in-creased marketing efforts in their shopping newspaper and by widening their selection of organic products. These activities helped renew focus on organic products in the other retail chains, in the media and among consumers.
Over the past years, all retail chains in Denmark have increased their selection of orga-nic products. Combined with the increasing interest of consumers in quality food pro-ducts, the extended range of organic products is believed to contribute to the renewed growth in the sale of organic products.
As shown in Figure 1, the organic market shares increased from 3.9% in 2005 to 7.6% in 2014.
SOURCE 1992-2002 Calculated based on figures from GfK2003-2013 Calculated based on figures from Statistics Denmark
Figure 1 Development in the market share of organic products 1992 – 2014
Organic Denmark expects an annual growth rate of approximately 5 % in 2015 – measured in value.
ØKOLOGISK MARKEDSNOTAT 2015
6
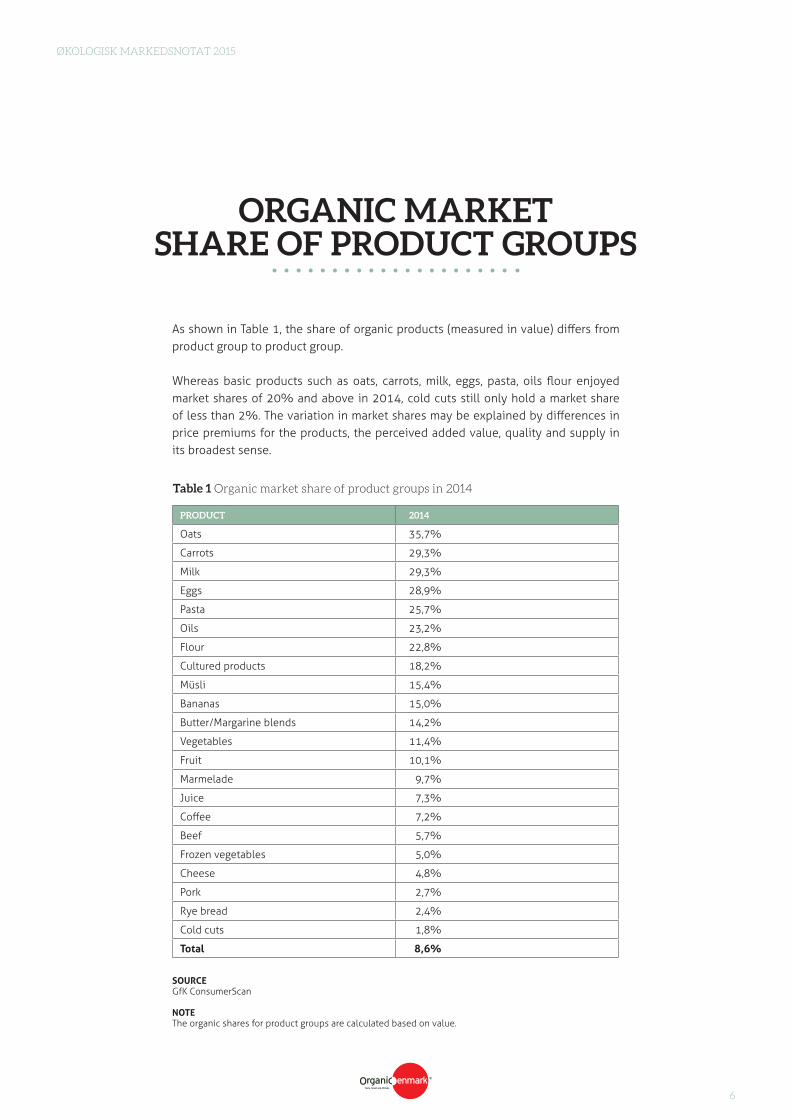
As shown in Table 1, the share of organic products (measured in value) differs from product group to product group.
Whereas basic products such as oats, carrots, milk, eggs, pasta, oils flour enjoyed market shares of 20% and above in 2014, cold cuts still only hold a market share of less than 2%. The variation in market shares may be explained by differences in price premiums for the products, the perceived added value, quality and supply in its broadest sense.
ORGANIC MARKET SHARE OF PRODUCT GROUPS
PRODUCT 2014
Oats 35,7%
Carrots 29,3%
Milk 29,3%
Eggs 28,9%
Pasta 25,7%
Oils 23,2%
Flour 22,8%
Cultured products 18,2%
Müsli 15,4%
Bananas 15,0%
Butter/Margarine blends 14,2%
Vegetables 11,4%
Fruit 10,1%
Marmelade 9,7%
Juice 7,3%
Coffee 7,2%
Beef 5,7%
Frozen vegetables 5,0%
Cheese 4,8%
Pork 2,7%
Rye bread 2,4%
Cold cuts 1,8%
Total 8,6%
SOURCEGfK ConsumerScan
NOTEThe organic shares for product groups are calculated based on value.
Table 1 Organic market share of product groups in 2014
”Organic oatmeal has a market
share of 35.7% ”
ØKOLOGISK MARKEDSNOTAT 2015
8
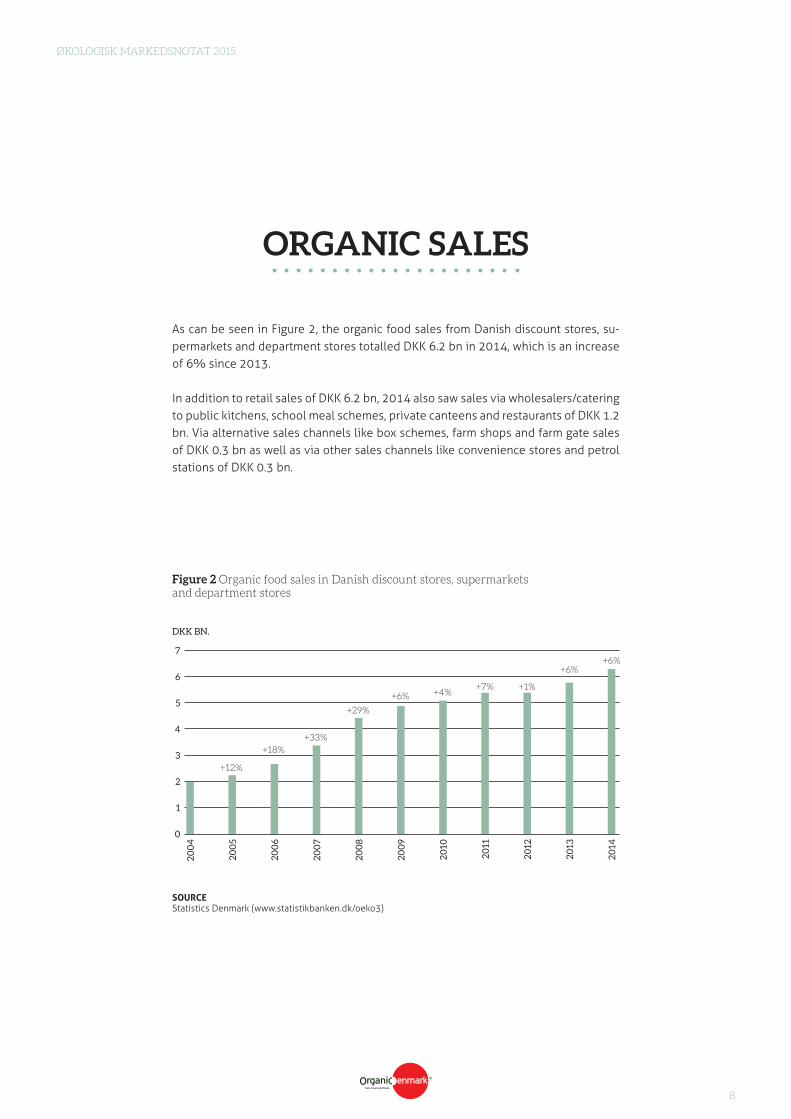
As can be seen in Figure 2, the organic food sales from Danish discount stores, su-permarkets and department stores totalled DKK 6.2 bn in 2014, which is an increase of 6% since 2013.
In addition to retail sales of DKK 6.2 bn, 2014 also saw sales via wholesalers/catering to public kitchens, school meal schemes, private canteens and restaurants of DKK 1.2 bn. Via alternative sales channels like box schemes, farm shops and farm gate sales of DKK 0.3 bn as well as via other sales channels like convenience stores and petrol stations of DKK 0.3 bn.
ORGANIC SALES
SOURCE Statistics Denmark (www.statistikbanken.dk/oeko3)
7
6
5
4
3
2
1
0
DKK BN.
20
04
+12%
+18%+33%
+29%
+6% +4%+7% +1%
+6%+6%
20
06
20
11
20
08
20
13
20
05
20
10
20
07
20
12
20
09
20
14
Figure 2 Organic food sales in Danish discount stores, supermarkets and department stores
ØKOLOGISK MARKEDSNOTAT 2015
9
2011 2012 2013 2014
Total sales 5 464 421 5 488 067 5 833 170 6 191 252
Rice, bread, pasta, flour, grains, cakes 806 215 765 852 777 269 765 413
Rye bread 61 014 45 259 50 711 51 331
Pasta 127 117 123 811 139 060 120 825
Flour 113 962 113 077 134 772 137 292
Oats, cornflakes, muesli etc. 210 180 211 862 214 231 201 234
Meat, cold cuts, entrails 369 923 359 970 420 644 507 705
Beef and veal 138 765 127 256 142 556 168 578
Pork 48 824 51 058 60 440 81 939
Poultry and meat cold cuts 120 872 124 247 137 976 152 706
Milk, cheese, eggs 1 927 087 1 883 249 2 152 155 2 142 023
Low fat/semi.skimmed milk 571 428 512 078 547 149 540 590
Skimmed milk 290 081 263 170 252 467 244 942
Cultured products 247 895 222 545 335 573 354 557
Cheese 210 663 233 466 260 580 227 793
Eggs 330 443 358 014 443 466 436 704
Fat, oils 273 471 305 207 307 853 318 997
Butter, margarine blends 192 834 226 520 209 316 218 312
Fruit 427 532 452 798 466 766 557 193
Citrus fruit, fresh 83 319 91 743 96 191 128 337
Bananas, fresh 78 345 73 287 83 166 106 104
Apples, fresh 53 464 54 472 37 127 63 047
Dried fruit, bars/slices 81 307 92 845 95 394 100 644
Nuts, almonds 52 562 64 432 70 454 68 557
Vegetables 771 348 824 868 783 265 882 491
Salad, chinese cabbage, spinach 41 785 47 008 42950 54 213
Tomatoes, fresh 83 591 73 375 70 714 83 141
Cucumbers, fresh 57 199 60 629 49 332 63 668
Carrots, fresh 167 915 142 238 144 040 132 208
Potatoes, fresh 54 433 46 977 43 228 42 050
Onions, fresh 31 565 32 852 36 167 42 361
Frozen vegetables, potatoes, etc. 51 812 65 096 68 094 76 195
Sugar, jam, chocolate, sweets, ice cream, etc. 223 934 223 782 238 480 271 728
Sugar 32 769 34 997 38 125 47 434
Syrup, honey, cake decorations 35 499 31 687 51 270 47 667
Jam, marmalade, etc 49 096 43 612 37 437 41 774
Chocolate 55 908 66 236 72 972 84 846
Spices, stock cubes etc 242 472 209 245 217 480 240 488
Ketchup, dressing, mayonaise 79 755 61 244 72 039 72 369
Spices 70 124 62 154 68 419 73 252
Babyfood, jarred 60 752 55 371 37 792 50 474
Coffee, tea, cocoa etc. 190 366 211 448 209 341 200 014
Juice, fruit juice, wine, cider, beer etc. 226 404 246 177 251 866 281 405
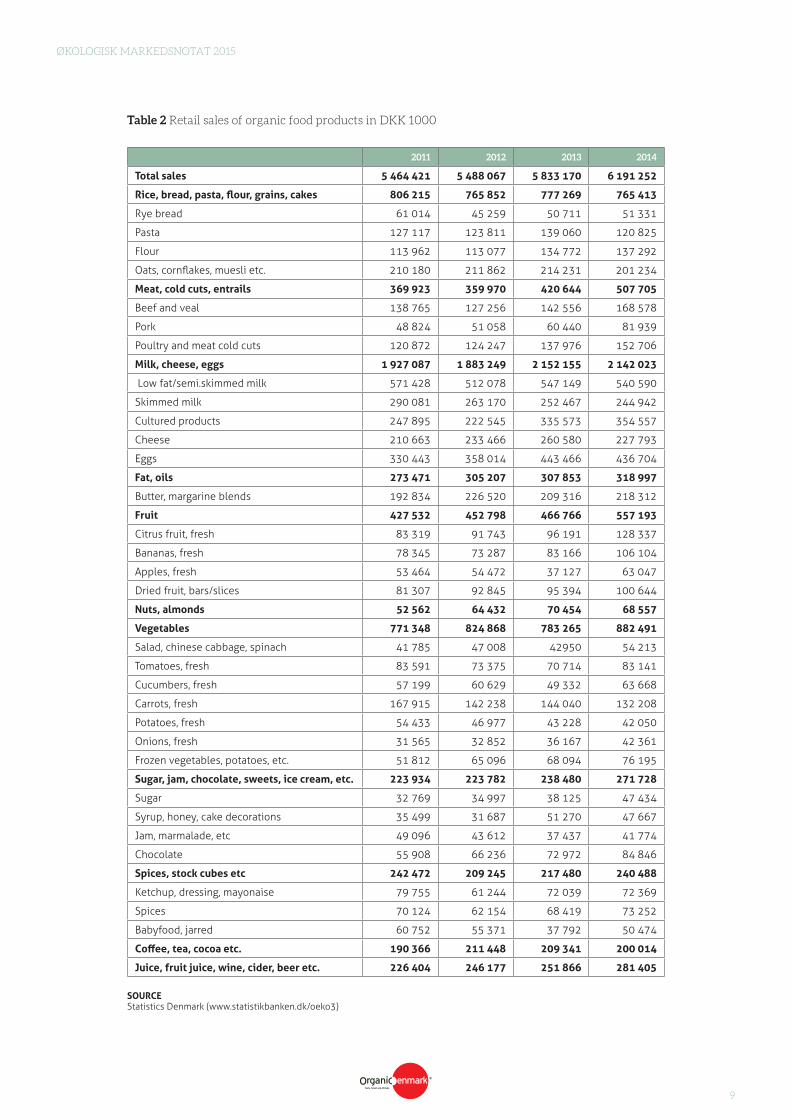
Table 2 Retail sales of organic food products in DKK 1000
SOURCE Statistics Denmark (www.statistikbanken.dk/oeko3)
ØKOLOGISK MARKEDSNOTAT 2015
10
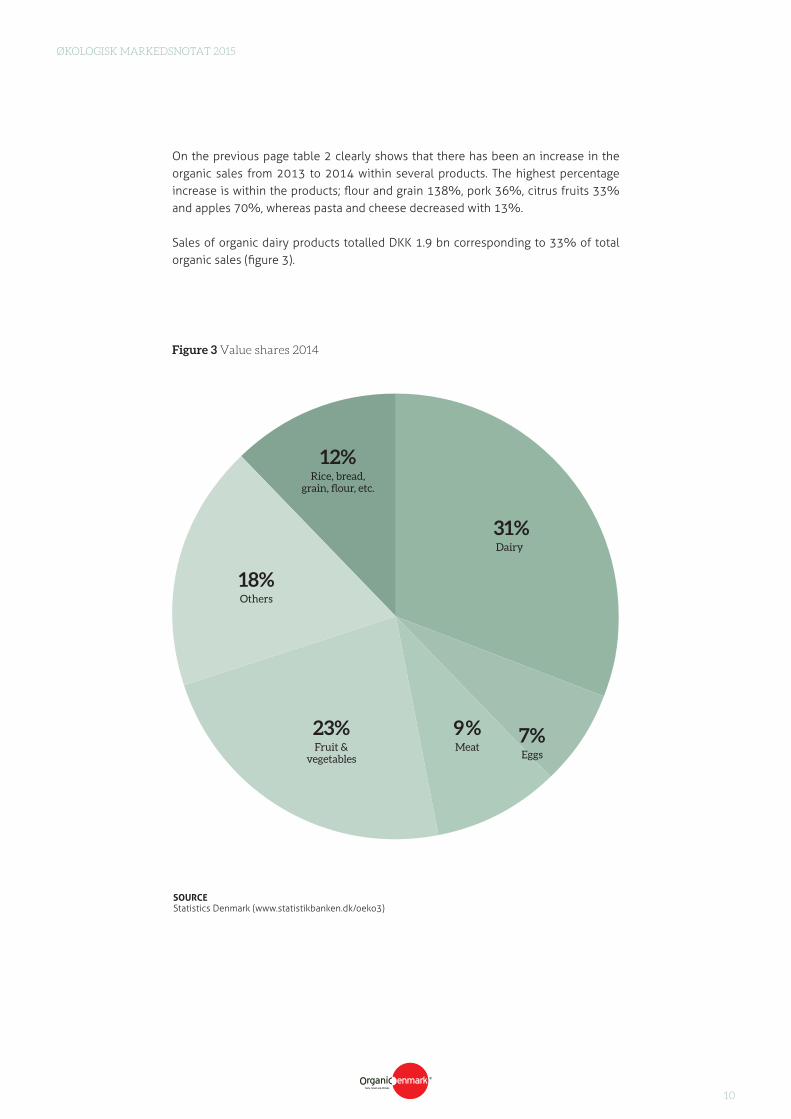
On the previous page table 2 clearly shows that there has been an increase in the organic sales from 2013 to 2014 within several products. The highest percentage increase is within the products; flour and grain 138%, pork 36%, citrus fruits 33% and apples 70%, whereas pasta and cheese decreased with 13%.
Sales of organic dairy products totalled DKK 1.9 bn corresponding to 33% of total organic sales (figure 3).
Figure 3 Value shares 2014
Rice, bread, grain, flour, etc.
12%
Meat
9%Fruit &
vegetables
23%
Others
18%
Dairy
31%
Eggs
7%
SOURCE Statistics Denmark (www.statistikbanken.dk/oeko3)
”On average, Danes spend
DKK 1429 annually on
organic food”
ØKOLOGISK MARKEDSNOTAT 2015
12
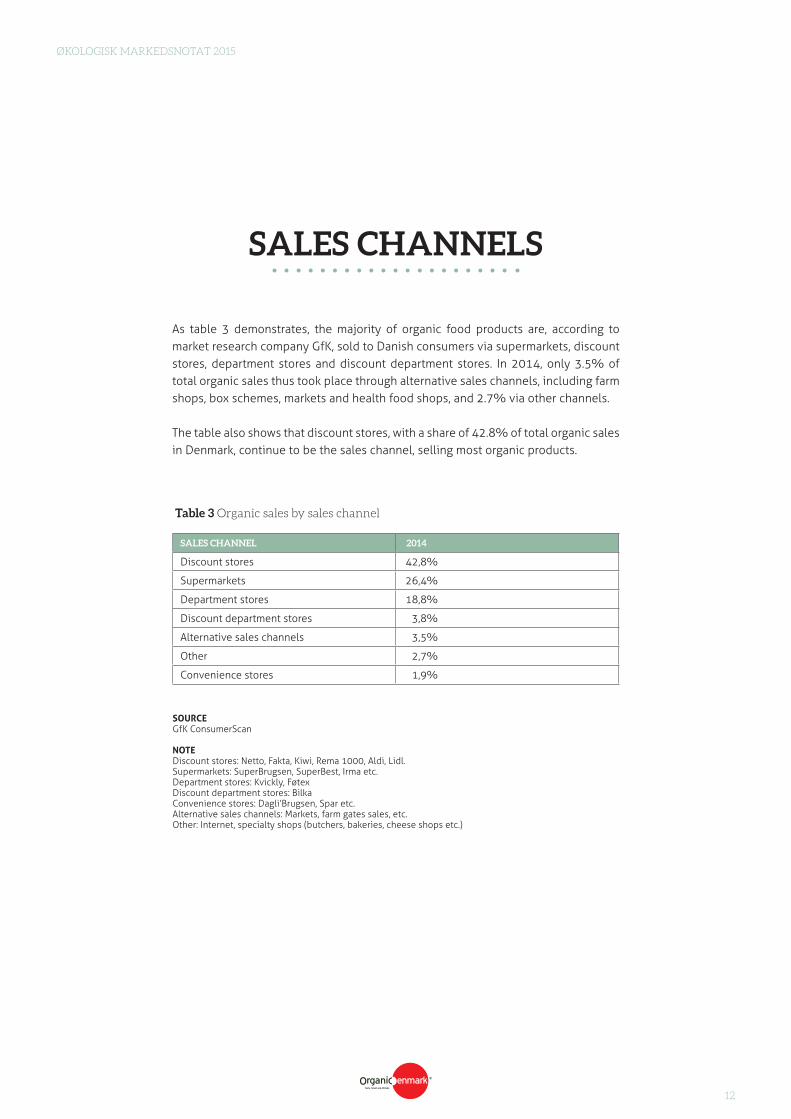
As table 3 demonstrates, the majority of organic food products are, according to market research company GfK, sold to Danish consumers via supermarkets, discount stores, department stores and discount department stores. In 2014, only 3.5% of total organic sales thus took place through alternative sales channels, including farm shops, box schemes, markets and health food shops, and 2.7% via other channels.
The table also shows that discount stores, with a share of 42.8% of total organic sales in Denmark, continue to be the sales channel, selling most organic products.
SALES CHANNELS
SALES CHANNEL 2014
Discount stores 42,8%
Supermarkets 26,4%
Department stores 18,8%
Discount department stores 3,8%
Alternative sales channels 3,5%
Other 2,7%
Convenience stores 1,9%
Table 3 Organic sales by sales channel
SOURCEGfK ConsumerScan
NOTEDiscount stores: Netto, Fakta, Kiwi, Rema 1000, Aldi, Lidl.Supermarkets: SuperBrugsen, SuperBest, Irma etc.Department stores: Kvickly, FøtexDiscount department stores: BilkaConvenience stores: Dagli’Brugsen, Spar etc.Alternative sales channels: Markets, farm gates sales, etc.Other: Internet, specialty shops (butchers, bakeries, cheese shops etc.)
ØKOLOGISK MARKEDSNOTAT 2015
13
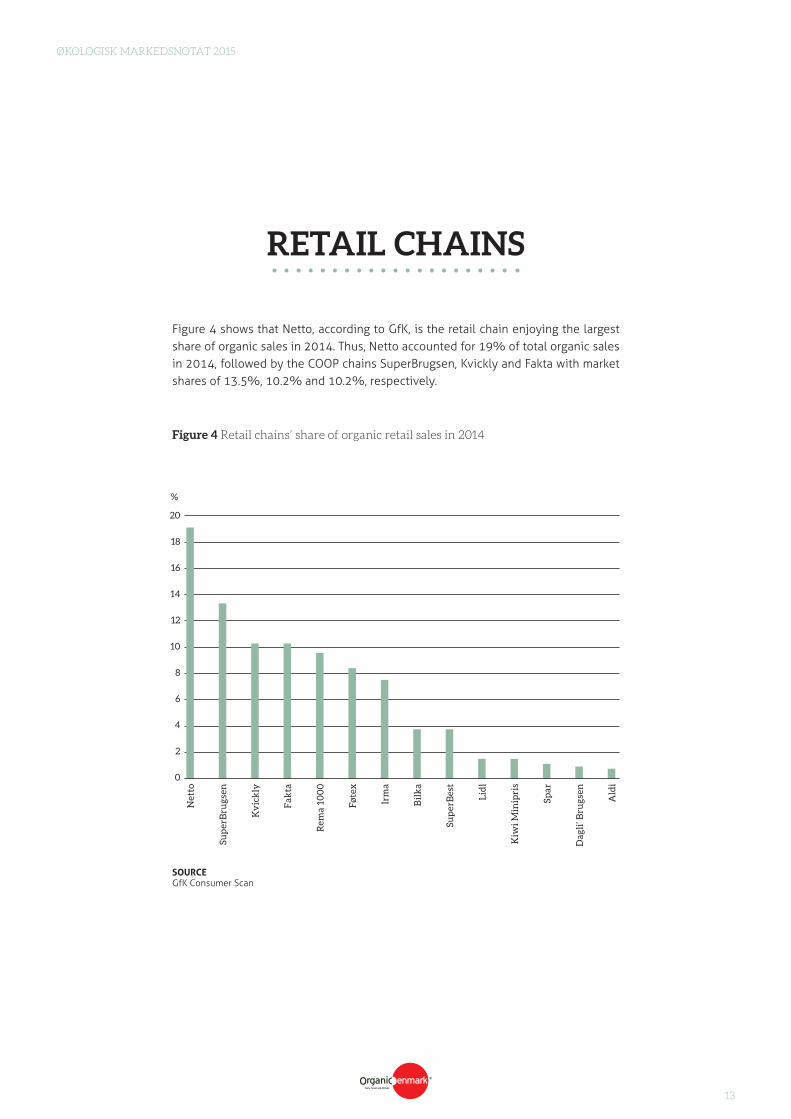
Figure 4 shows that Netto, according to GfK, is the retail chain enjoying the largest share of organic sales in 2014. Thus, Netto accounted for 19% of total organic sales in 2014, followed by the COOP chains SuperBrugsen, Kvickly and Fakta with market shares of 13.5%, 10.2% and 10.2%, respectively.
RETAIL CHAINS
SOURCEGfK Consumer Scan
20
18
16
14
12
10
8
6
4
2
0
%
Net
to
Kv
ick
ly
Bil
ka
Rem
a 10
00
Lid
l
Sp
ar
Sup
erB
rugs
en
Irm
a
Fak
ta
Sup
erB
est
Fø
tex
Kiw
i Min
ipri
s
Dag
li’ B
rugs
en
Ald
i
Figure 4 Retail chains’ share of organic retail sales in 2014
ØKOLOGISK MARKEDSNOTAT 2015
14
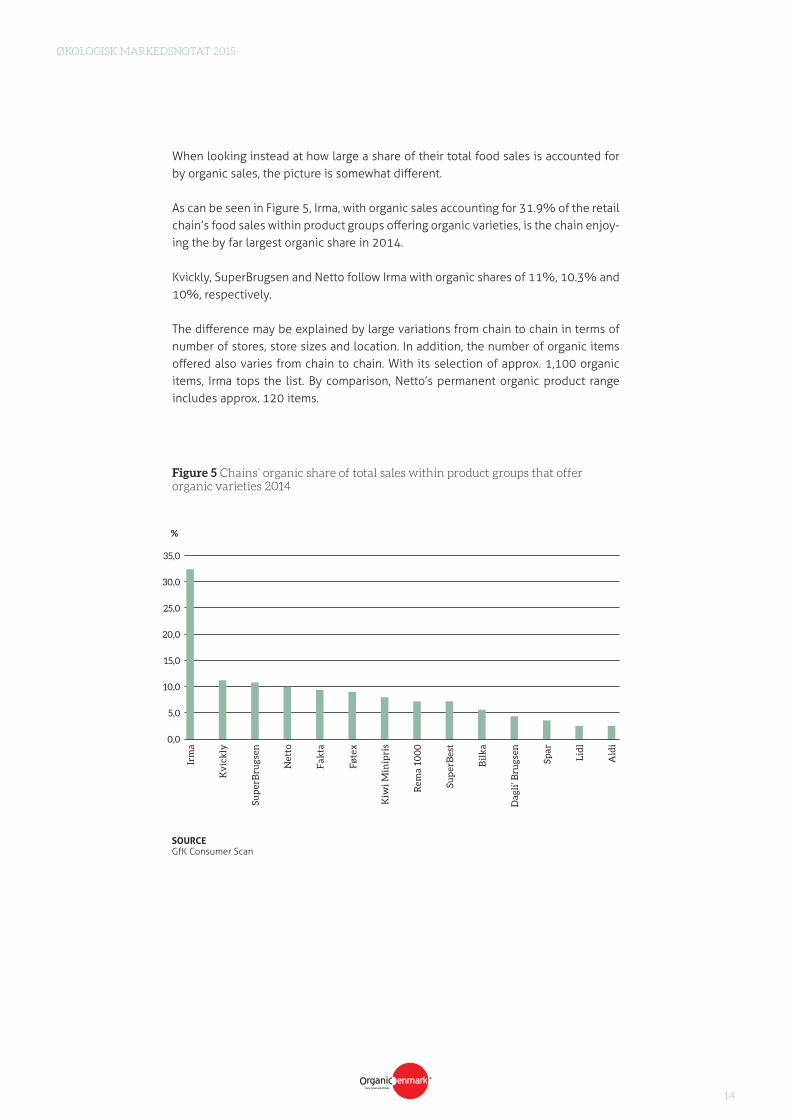
When looking instead at how large a share of their total food sales is accounted for by organic sales, the picture is somewhat different.
As can be seen in Figure 5, Irma, with organic sales accounting for 31.9% of the retail chain’s food sales within product groups offering organic varieties, is the chain enjoy-ing the by far largest organic share in 2014.
Kvickly, SuperBrugsen and Netto follow Irma with organic shares of 11%, 10.3% and 10%, respectively.
The difference may be explained by large variations from chain to chain in terms of number of stores, store sizes and location. In addition, the number of organic items offered also varies from chain to chain. With its selection of approx. 1,100 organic items, Irma tops the list. By comparison, Netto’s permanent organic product range includes approx. 120 items.
SOURCE GfK Consumer Scan
35,0
30,0
25,0
20,0
15,0
10,0
5,0
0,0
%
Irm
a
Sup
erB
rugs
en
Sup
erB
est
Fak
ta
Sp
ar
Kv
ick
ly
Rem
a 10
00
Net
to
Bil
ka
Kiw
i Min
ipri
s
Fø
tex
Dag
li’ B
rugs
en
Lid
l
Ald
i
Figure 5 Chains’ organic share of total sales within product groups that offer organic varieties 2014
”Discount stores account for 42.8% of the organic sale
in Denmark ”
ØKOLOGISK MARKEDSNOTAT 2015
16
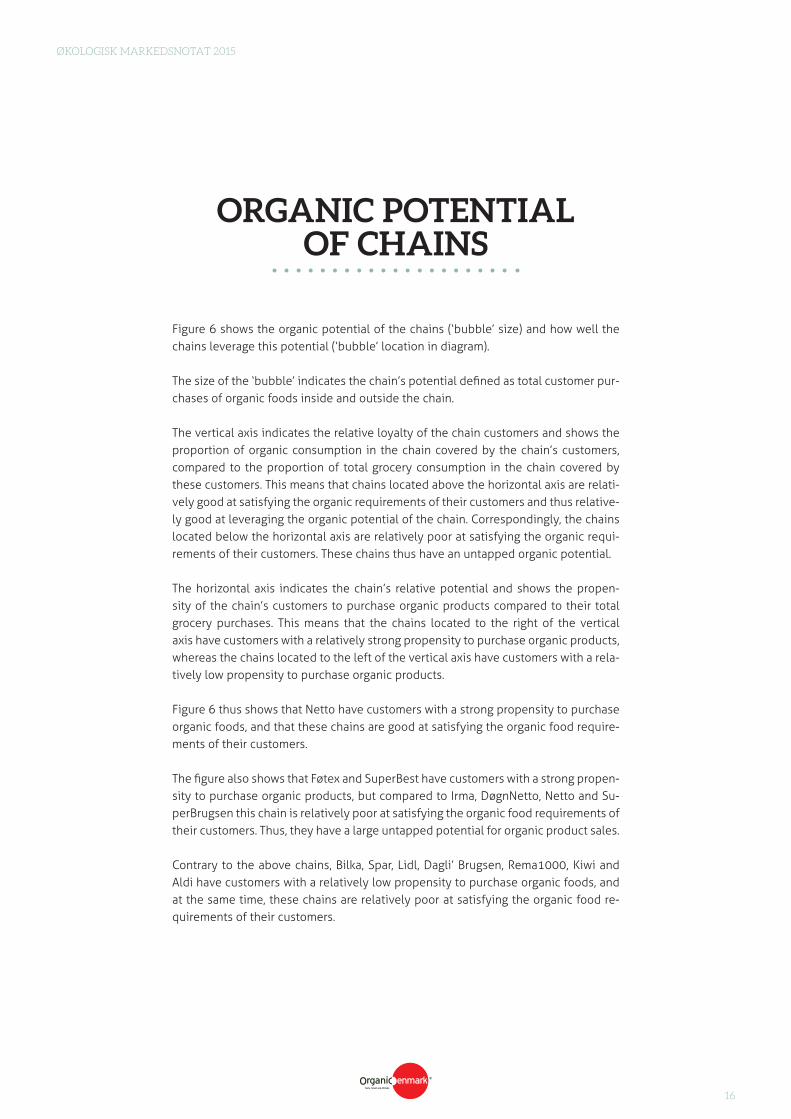
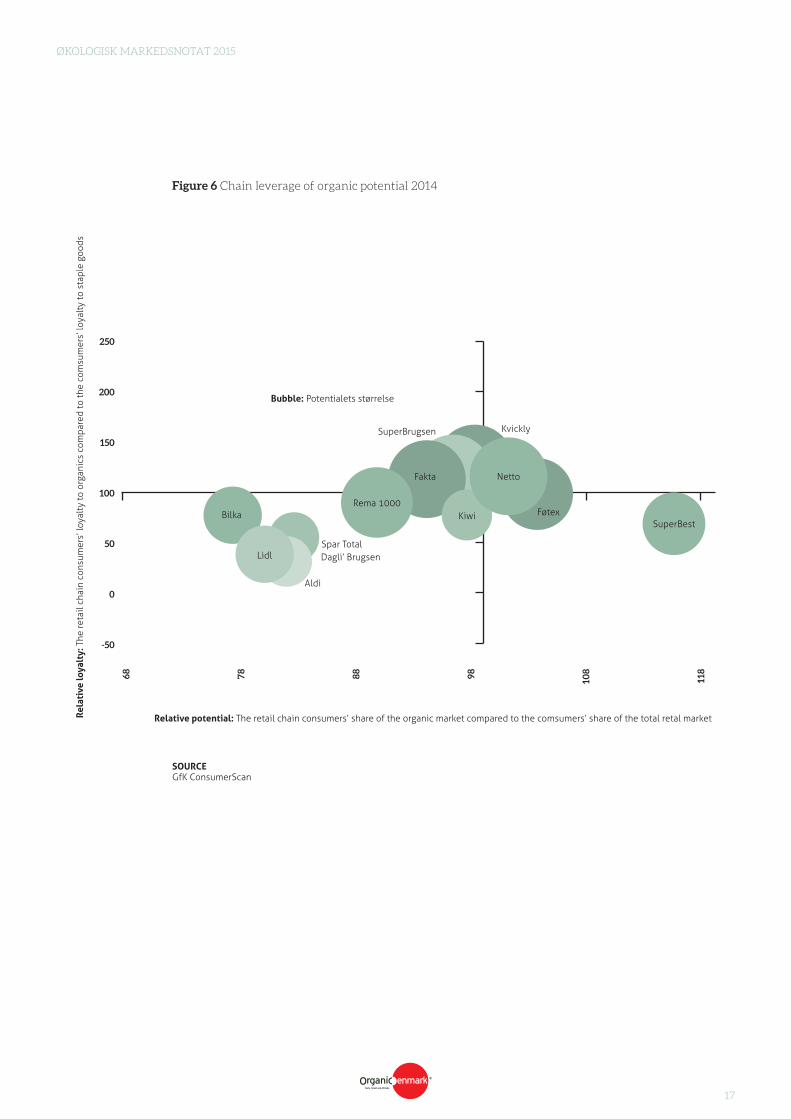
Figure 6 shows the organic potential of the chains (‘bubble’ size) and how well the chains leverage this potential (‘bubble’ location in diagram).
The size of the ‘bubble’ indicates the chain’s potential defined as total customer pur-chases of organic foods inside and outside the chain.
The vertical axis indicates the relative loyalty of the chain customers and shows the proportion of organic consumption in the chain covered by the chain’s customers, compared to the proportion of total grocery consumption in the chain covered by these customers. This means that chains located above the horizontal axis are relati-vely good at satisfying the organic requirements of their customers and thus relative-ly good at leveraging the organic potential of the chain. Correspondingly, the chains located below the horizontal axis are relatively poor at satisfying the organic requi-rements of their customers. These chains thus have an untapped organic potential.
The horizontal axis indicates the chain’s relative potential and shows the propen-sity of the chain’s customers to purchase organic products compared to their total grocery purchases. This means that the chains located to the right of the vertical axis have customers with a relatively strong propensity to purchase organic products, whereas the chains located to the left of the vertical axis have customers with a rela-tively low propensity to purchase organic products.
Figure 6 thus shows that Netto have customers with a strong propensity to purchase organic foods, and that these chains are good at satisfying the organic food require-ments of their customers.
The figure also shows that Føtex and SuperBest have customers with a strong propen-sity to purchase organic products, but compared to Irma, DøgnNetto, Netto and Su-perBrugsen this chain is relatively poor at satisfying the organic food requirements of their customers. Thus, they have a large untapped potential for organic product sales.
Contrary to the above chains, Bilka, Spar, Lidl, Dagli’ Brugsen, Rema1000, Kiwi and Aldi have customers with a relatively low propensity to purchase organic foods, and at the same time, these chains are relatively poor at satisfying the organic food re-quirements of their customers.
ORGANIC POTENTIAL OF CHAINS
ØKOLOGISK MARKEDSNOTAT 2015
17
Figure 6 Chain leverage of organic potential 2014
SOURCEGfK ConsumerScan
SuperBrugsen
Dagli’ Brugsen
Kvickly
68 78 88 98 108
118
Lidl
Rema 1000
SuperBest
Netto
Kiwi
Fakta
Bilka
Spar Total
Aldi
Føtex
250
200
150
100
50
0
-50
Rela
tive
loya
lty:
The
reta
il ch
ain
cons
umer
s’ lo
yalt
y to
org
anic
s co
mpa
red
to th
e co
msu
mer
s’ lo
yalt
y to
sta
ple
good
s
Relative potential: The retail chain consumers’ share of the organic market compared to the comsumers’ share of the total retal market
Bubble: Potentialets størrelse
ØKOLOGISK MARKEDSNOTAT 2015
18
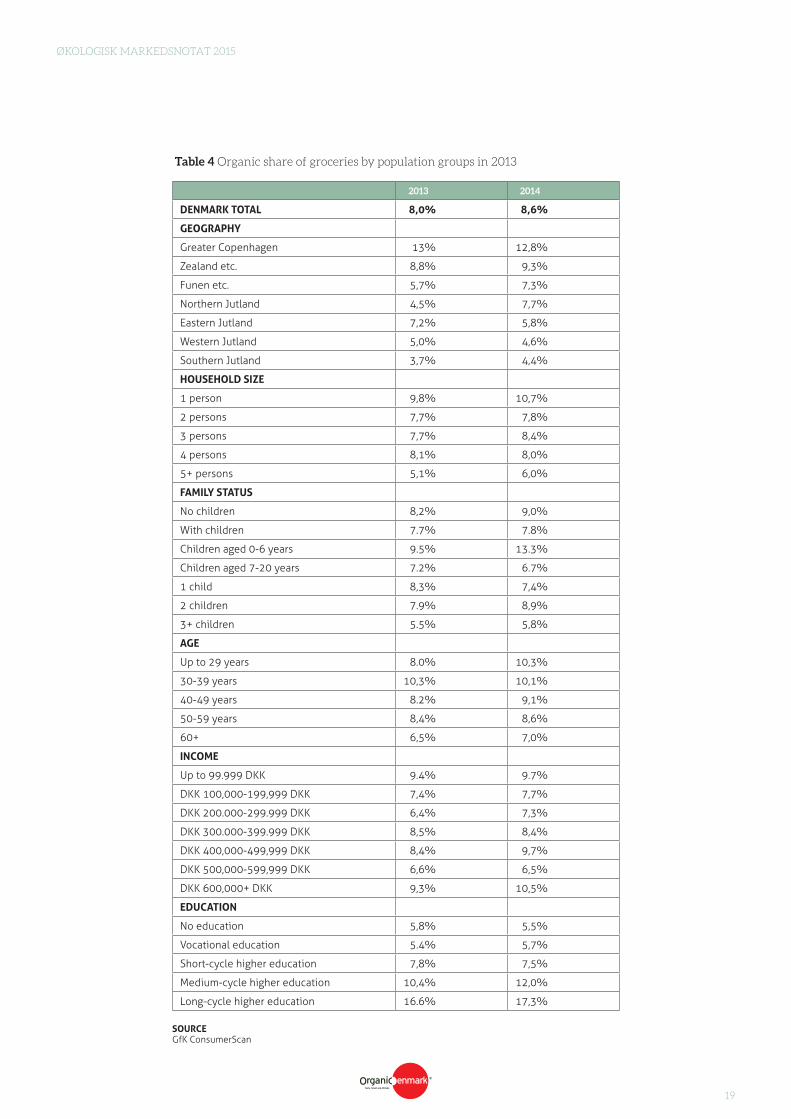
As shown in Table 4, there is a clear trend that households in Greater Copenhagen buy relatively more organic products. The organic share of total household grocery purchases in the capital area thus accounted for 12.8% in 2014 compared to the national average with 8.6%.
The consumers in Zealand are placed second in terms of the organic share of total grocery purchases in Denmark with 9.3%.
When looking at family status, the highest organic share of total grocery purchases is seen among families with children aged 0-6 years and single households with respe-ctively 13.3% and 10.7% in 2014. As regards age groups, those aged up to 29 years have the highest organic share of total grocery purchases with 10.3%.
As is clearly illustrated in Table 4, consumers with a long-cycle higher education also have the highest organic share of total grocery purchases with 17.3% in 2014.
ORGANIC CONSUMERS
ØKOLOGISK MARKEDSNOTAT 2015
19
2013 2014
DENMARK TOTAL 8,0% 8,6%
GEOGRAPHY
Greater Copenhagen 13% 12,8%
Zealand etc. 8,8% 9,3%
Funen etc. 5,7% 7,3%
Northern Jutland 4,5% 7,7%
Eastern Jutland 7,2% 5,8%
Western Jutland 5,0% 4,6%
Southern Jutland 3,7% 4,4%
HOUSEHOLD SIZE
1 person 9,8% 10,7%
2 persons 7,7% 7,8%
3 persons 7,7% 8,4%
4 persons 8,1% 8,0%
5+ persons 5,1% 6,0%
FAMILY STATUS
No children 8,2% 9,0%
With children 7.7% 7.8%
Children aged 0-6 years 9.5% 13.3%
Children aged 7-20 years 7.2% 6.7%
1 child 8,3% 7,4%
2 children 7.9% 8,9%
3+ children 5.5% 5,8%
AGE
Up to 29 years 8.0% 10,3%
30-39 years 10,3% 10,1%
40-49 years 8.2% 9,1%
50-59 years 8,4% 8,6%
60+ 6,5% 7,0%
INCOME
Up to 99.999 DKK 9.4% 9.7%
DKK 100,000-199,999 DKK 7,4% 7,7%
DKK 200.000-299.999 DKK 6,4% 7,3%
DKK 300.000-399.999 DKK 8,5% 8,4%
DKK 400,000-499,999 DKK 8,4% 9,7%
DKK 500,000-599,999 DKK 6,6% 6,5%
DKK 600,000+ DKK 9,3% 10,5%
EDUCATION
No education 5,8% 5,5%
Vocational education 5.4% 5,7%
Short-cycle higher education 7,8% 7,5%
Medium-cycle higher education 10,4% 12,0%
Long-cycle higher education 16.6% 17,3%
SOURCE GfK ConsumerScan
Table 4 Organic share of groceries by population groups in 2013