organisers - ruđer bošković institute
TRANSCRIPT

ORGANISERS
UNIVERSITY OF ZAGREB - FACULTY OF FORESTRY
WOOD SCIENCE AND TECHNOLOGY DEPARTMENT, BIOTECHNICAL FACULTY, UNIVERSITY OF LJUBLJANA
FACULTY OF FORESTRY AND WOOD SCIENCES, CZECH UNIVERSITY OF LIFE
SCIENCES PRAGUE
FOREST PRODUCTS SOCIETY
INNOVAWOOD
IN COLLABORATION WITH
ACADEMY OF FORESTRY
CROATIAN ACADEMY OF ENGINEERING
THE SCIENTIFIC COUNCIL FOR AGRICULTURE AND FORESTRY – CROATIAN ACADEMY OF SCIENCES AND ARTS
ASSOCIATION OF ENGINEERS OF WOOD TECHNOLOGY
ZAGREB FAIR
SUPPORTED BY
MINISTRY OF SCIENCE AND EDUCATION
MINISTRY OF ECONOMY, ENTREPRENEURSHIP AND CRAFTS
MINISTRY OF AGRICULTURE
CROATIAN CHAMBER OF ENGINEERS OF FORESTRY AND WOOD TECHNOLOGY
CROATIAN CHAMBER OF ECONOMY
ZAGREB COUNTY


UNIVERSITY OF ZAGREB - FACULTY OF FORESTRY
WOOD SCIENCE AND TECHNOLOGY DEPARTMENT, BIOTECHNICAL FACULTY, UNIVERSITY OF
LJUBLJANA
FACULTY OF FORESTRY AND WOOD SCIENCES, CZECH UNIVERSITY OF LIFE SCIENCES PRAGUE
FOREST PRODUCTS SOCIETY
INNOVAWOOD
28th International Conference on Wood Science and Technology (ICWST)
IMPLEMENTATION OF WOOD SCIENCE IN WOODWORKING SECTOR
PROCEEDINGS
Zagreb 7th – 8th of December 2017

Disclaimer:
This book of papers compiles the papers and posters presented at the 28th International Conference on Wood Science and Technology (ICWST) Implementation of wood science in woodworking sector held in Zagreb, Croatia on 7th and 8th December, 2017. The opinions expressed within are those of the authors and not necessarily represent those of the host, the editors and or any institution included in organisation of this conference.
Although all reasonable efforts were made by the organising team to ensure the scientific quality of the contents of these abstracts, the final responsibility for the content therein and in the final conference proceeding remains with the respective authors. The editors accept no responsibility for the information contained in the proceedings. The editors are not responsible for the contents of external websites referred to in this publication.
A CIP catalogue record for this book is available in the Online Catalogue of the National and University Library in Zagreb as 000979682

Publisher: UNIVERSITY OF ZAGREB - FACULTY OF FORESTRY
Organizers:
UNIVERSITY OF ZAGREB - FACULTY OF FORESTRY WOOD SCIENCE AND TECHNOLOGY DEPARTMENT, BIOTECHNICAL FACULTY, UNIVERSITY OF
LJUBLJANA FACULTY OF FORESTRY AND WOOD SCIENCES, CZECH UNIVERSITY OF LIFE SCIENCES PRAGUE
FOREST PRODUCTS SOCIETY INNOVAWOOD
In collaboration with:
ACADEMY OF FORESTRY CROATIAN ACADEMY OF ENGINEERING
THE SCIENTIFIC COUNCIL FOR AGRICULTURE AND FORESTRY – CROATIAN ACADEMY OF SCIENCES AND ARTS
ASSOCIATION OF ENGINEERS OF WOOD TECHNOLOGY ZAGREB FAIR
Organizing committee:
Professor Vladimir Andročec, PhD (Croatia), Academic Igor Anić, PhD (Croatia), Professor Marian Babiak, PhD (Slovakia), Nada Banek, BSc (Croatia), Professor Mario Božić, PhD (Croatia), Luka Burilović, BSc (Croatia), Mariano Perez Campos, PhD (Spain), Associated Professor Beata Fabisiak, PhD (Poland), Ivica Francetić, MSc (Croatia), Professor Milan Gaff, PhD (Czech Republic), Professor Ivica Grbac, PhD (Croatia), Associated Professor Miha Humar, PhD (Slovenia), Professor Borche Iliev, PhD (Macedonia), Iva Ištok, PhD (Croatia), Professor Vladimir Jambreković, PhD (Croatia), Associated Professor Vassil Jivkov, PhD (Bulgaria), Academic Slavko Matić, PhD (Croatia), Professor Sergej Medved, PhD (Slovenia), Professor Milan Oršanić, PhD (Croatia), Ivana Perić, PhD (Croatia), Assistant Professor Andreja Pirc Barčić, PhD (Croatia), Professor Tomislav Poršinsky, PhD (Croatia), Scott Springmier (SAD), Dina Tomšić, PhD (Croatia), Silvija Zec, BSc (Croatia), Assistant Professor Vjekoslav Živković, PhD (Croatia), Assistant Professor Ivica Župčić, PhD (Croatia)
Editors: Assistant Professor Ivica Župčić, PhD
Assistant Professor Vjekoslav Živković, PhD Josip Miklečić, PhD
Technical editor:
Josip Miklečić, PhD
Assistant to Technical editor: Ms Dubravka Cvetan
Cover photo:
Assistant Professor Danijela Domljan, PhD
Programme committee and reviewers: Assistant Professor Christian Brischke, PhD (Germany), Professor Andrija Bogner, PhD (Croatia), Assistant Professor Danijela Domljan, PhD (Croatia), Professor Milan Gaff, PhD (Czech Republic), Professor Ivica Grbac, PhD (Croatia), Assistant Professor Marin Hasan, PhD (Croatia), Associated Professor Miha Humar, PhD (Slovenia), Professor Mark Irle, PhD (Belgium), Professor Vladimir Jambreković, PhD (Croatia), Professor Vlatka Jirouš-Rajković, PhD (Croatia), Professor Boris Ljuljka, PhD (Croatia), Josip Miklečić, PhD (Croatia), Professor Stjepan Pervan, PhD (Croatia), Peter Rademacher, PhD (Hungary), Professor Andreas Rapp, PhD (Germany), Professor Milan Šernek, PhD (Slovenia), Nikola Španić, PhD (Croatia), Assistant Professor Vjekoslav Živković, PhD (Croatia), Assistant Professor Ivica Župčić, PhD (Croatia)
EDITION 300 copies
ISBN: 978-953-292-053-6

FOREWORD
Continuous changes on international market open up new horizons and opportunities, and the new strategies adopted by Europe and the world bring new concepts that need to be adapted and followed. This concept seeks increased social cohesion, striking with the harmful effects of climate change, nature preservation and the creation of a healthy environment. At the same time, creative potentials are open to new knowledge and innovative processes whose primary objective is to adapt to the needs of customers and the environment.
One of the activities carried out in recent years in order to preserve and stimulate rational utilization of raw material is certainly the traditional international scientific conference AMBIENTA. During its continuous sequence in the last 27 years it has become a platform for meeting and networking among scientists, teachers, researchers, students and professionals. In the year 2015 this conference has grown into an international conference on wood science and technology (ICWST), and from last year it became a two-day event, hosted by the Faculty of Forestry of the University in Zagreb.
This year's conference, the second in a row held under the title "The implementation of science in the woodworking sector" aims to ensure a multidisciplinary forum where all the participants have the opportunity to present and discuss innovations, trends and practical challenges they have faced in the world of wood science and technology, but also in relation to other materials, technologies, design and other related topics whose aim is to upgrade the wood industry.
We hope that this year's conference will contribute to awareness raising about the significance of wood as an irreplaceable natural raw material, and that the application of scientific research has a positive impact on the wood sector as well as any user of wood.
Assistant Professor Ivica Župčić, PhD


CONTENTS 1. Timothy Young
INDUSTRY 4.0 – Pragmatic Algorithms, Information Quality and Relational Databases 1
2. Tetsuya Inagaki; Moe Kashima; Satoru Tsuchikawa Estimation of Wood Density, Moisture Content and Fiber Orientation by THz Time Domain Spectroscopy
3
3. Hikaru Kobori; Sakura Ichijo; Naoki Okano; Yoichi Kojima; Shigehiko Suzuki The Effect of Dry Thermal Treatment on the Vibrational Characteristics of Wood
7
4. V. Sierra Sánchez; M. de Luque Ripoll; M. Álvarez San Millán; S. Pérez Mazarío; P. García Espina; Luis de Luque Ripoll NIRWOOD: an EU Innovation Project to Determine Species and Geographical Origin of Timber using NIR Spectrometry
15
5. Ahmet Can; İsmail Özlüsoylu; Wojcıech Grzeskowıak; Eser Sözen Improvement of Fire Performance of Impregnated Wood with Copper Based Chemicals
21
6. Miljenko Klarić; Velimir Nikić; Stjepan Pervan Subfossil Waterlogged Oak-wood (Abonos) Moisture Content Estimation by Electrical Resistance Method
29
7. Hajri Haska; Bajram Kullolli; Hajri Ismaili; Eneida Haska Traditional Ways Using of Wood and Forest Products in Housings and in Daily Livelihoods in Albania Populations/Communities
37
8. Ivan Žulj; Ivica Župčić; Kristijan Radmanović; Ivica Grbac; Valentino Slivar Temperature as an Important Factor in Rotary Welding of Wood
43
9. Nikola Španić; Vladimir Jambreković; Kristijan Radmanović; Goran Mihulja; Jaroslav Kljak Effect of Tartaric Acid Addition to Catalyst on Curing Behaviour of Urea-Formaldehyde Resin
51
10. Ivana Perić, Tomislav Grladinović, Jože Kropivšek, Krešimir Greger Relationship between Entrepreneurial Competencies and Firm Performance: A Study on Furniture Manufacturing SMEs in Croatia
59
11. Fabiana Chipaia; Claudia Urbinati; Patricia Dos Santos; Alisson Reis Identification of Diagnostic Anatomical Features in Ten Species of Sapindales Occurring in the Brazilian Amazon
65
12. Ignacio Urbán Martínez; Ernesto Gutiérrez Tejón; Oscar Santaclara Estévez; Esther Merlo Sánchez Optimization of Juglans sp. Wood Processing from Sustainable Plantations' thinning, Wood Profitability and Final Product Quality
79
13. Branimir Šafran; Matija Jug; Kristijan Radmanović; Igor Đukić; Daniel Kramar; Stjepan Risović Analysis of the Raw Material Properties in the Agro-wood Pellets Production
81
14. Tomislav Sedlar; Tomislav Sinković; Jelena Trajković; Bogoslav Šefc; Branimir Jambreković; Iva Ištok Relationship between Strength and Density as an Indicator of Sycamore Maple (Acer pseudoplatanus L.) Wood Quality
93
15. Tomislav Sinković; Branimir Jambreković; Bogoslav Šefc; Iva Ištok; Filip Veselčić; Tomislav Sedlar Some Physical and Mechanical Properties of White Poplar (Populus alba L.) Wood Grown in Varaždin Region
101
16. Anka Ozana Čavlović; Matija Jug; Andrija Novosel The Efficiency of Exhaust System in the Wooden Floor Production: A Case study
107
17. Ahmet Can; Cengiz Temiz; Hüseyin Sivrikaya Surface Characterization of some Woods Exposed to Accelerated Weathering
115
18. Ahmet Can; Hüseyin Sivrikaya Effect of Water Repellents on the Surface Characterisation of Scots pine (Pinus sylvestris) Exposed to Accelerated and Outdoor Weathering
125
19. Marin Hasan; Adriana Hasan; Gordana Orešković; Branimir Jambreković; Suzana Antolović Contribution to the Optimisation of Esterification of Beech Wood by Citric Acid
135
20. Milan Gaff; Marián Babiak; František Kačík; Veronika Vondrova; Danijela Domljan Bendability of Thermally Modified Oak (Quercus robur F.)
143

21. Reza Hosseinpourpia; Stergios Adamopoulos; Carsten Mai; Venla Hemmilä Effect of Bio-Based Additives on Physico-Mechanical Properties of Medium Density Fibreboards
153
22. Sergej Medved; Jože Resnik; Vladimir Jambreković; Nikola Španić; Alan Antonović Image and FT-IR Analysis of Blended Particles
159
23. Marina Jajcinovic; Wolfgang Johann Fischer; Ulrich Hirn; Wolfgang Bauer Influence of Relative Humidity on the Strength of Hardwood and Softwood Pulp Fibres and Fibre to Fibre Joints
165
24 Juraj Stanešić; Tomislav Podvorec; Alan Antonović Influence of Black Poplar Wood Particle Size (Populus nigra L.) on Content and Properties of Bio-oil
175
25. Liubov Kozak; Pavlo Bekhta; Ján Sedliačik; Ján Iždinský Influence of Veneering on the Properties of Lightweight Particleboards with Expanded Polystyrene
183
26. Łukasz Krzyżaniak; Jerzy Smardzewski Modeling of Externally Invisible Cabinet Furniture Joints
191
27. Jiří Tauber; Zdeněk Holouš; Miroslav Kozák; Sarah Szökeová Trends in the Production and Design of Upholstered Furniture
199
28. Boris Iliev; Danijela Domljan Comparison between Preschool Tables used in Kindergartens in Croatia, Macedonia and Bulgaria
207
29. Zoran Vlaović; Karla Seleš; Ivica Grbac; Ivan Žulj; Danijela Domljan Comfort of Cervical Pillow with Polyurethane Coil Springs
215
30. Alena Sobotková; Milan Šimek; Danijela Domljan Furniture Design for the Entrance Hall
223
31. Sarah Szökeová; Miroslav Kozák; Milan Šimek Product Line Safari
229
32. Roy Damary; Natalia Pryadilina; Sergey Zalesov; Anton Opletaev Outdoor Wooden Furniture as a Component of an overall Municipal Project: “Green City
237
33. Franciska Klanfar; Jerzy Smardzewski; Danijela Domljan Management of the Project of Traditional Estate Adaptation into Object of Village Tourism
243
34. Marko Dušak Improvements to the Production Management System of Wood-processing in Small and Medium Enterprises
251

28th International Conference on Wood Science and Technology 2017 IMPLEMENTATION OF WOOD SCIENCE IN WOODWORKING SECTOR
1
Industry 4.0 – Pragmatic Algorithms, Information Quality and Relational
Databases
Timothy Young Professor | Graduate Director University of Tennessee, Center for Renewable Carbon 2506 Jacob Drive
Knoxville, TN 37996-4542 [email protected]
ABSTRACT
Industry 4.0’ is the latest term given to the next significant improvement in manufacturing technologies that is supposed to represent the next great revolution in manufacturing. It has also been called the ‘smart factory,’ in which cyber-physical systems monitor the physical processes of the factory and make decentralized decisions. This includes a system of advanced communication networks of PLCs, robotics, and cyber physical visualization and interaction by operations personnel and machines. This will lead to the optimization of manufacturing systems given the changing dynamics of feedstocks, chemical-additives and machines. The goal in this optimization process is a lower variance of process inputs and product quality attributes; that also lead to lower costs of manufactured product. The literature available related to ‘Industry 4.0’ addresses the advancements in sensors, robotics, and computational hardware/software systems. However, there is a ‘gap’ in the literature in the discussion of information quality and advanced database systems that are relational to the sensors and the data from the testing of product attributes. This paper is conceptual and is intended to advance the discussion about the importance of advanced database systems that are relational, and will allow for the development of pragmatic algorithms that are predictive. Key words: Industry 4.0, Pragmatic algorithms, Barriers, Relational databases

28th International Conference on Wood Science and Technology 2017 IMPLEMENTATION OF WOOD SCIENCE IN WOODWORKING SECTOR
2

28th International Conference on Wood Science and Technology 2017 IMPLEMENTATION OF WOOD SCIENCE IN WOODWORKING SECTOR
3
Estimation of Wood Density, Moisture Content and Fiber Orientation by THz Time Domain Spectroscopy
Inagaki, Tetsuya1; Kashima, Moe1; Tsuchikawa, Satoru1*
1 Graduate School of Bioagricultural Sciences, Nagoya University, Nagoya, Japan *Corresponding author: [email protected]
ABSTRACT
Terahertz (THz) radiation has the potential to be a useful tool for sensing and imaging of wood because wood is relatively transparent at these frequencies (below about 1 THz). In this study, demonstration of simultaneous prediction of solid wood density, moisture content and fiber orientation, all of which are critical in manufacturing operations, of 14 species including softwood and hard wood was accomplished using terahertz time-domain spectroscopy (THz-TDS). THz measurements of wood at various moisture contents were taken for 19 orientations of the THz field (0-180o with 10o step) with respect to the visible grain. The real part of refractive index value and absorption cosfficient had strong correlation with density and moisture content of the wood. A strong correlation between measured and predicted values for density and moisture content were observed. The possibility for the estimation of fiber orientation using the birefringence property of wood were shown. Key words: Birefringence, Effective medium theory, THz time domain spectroscopy 1. INTRODUCTION
THz radiation has the potential to be a useful tool for sensing and imaging of wood because wood is relatively transparent at these frequencies (below about 1 THz), the wavelengths are sub-mm which offers good spatial resolution for imaging, and THz can probe the gross fiber structure of wood. There have been several reports on the interaction of THz radiation with wood, which have highlighted applications of THz radiation to the wood products industry, including density mapping, defect detection, properties of paper and wood-plastic composites, dendrochronology, and sensitivity to internal moisture suitable for imaging of MC.
Here, we show the prediction accuracy is retained over a range of moisture contents below the fiber saturation point, and also demonstrate the possibility for simultaneous extraction of MC, density and fiber orientation. 2. MATERIAL AND METHOD
THz time domain measurement for 14 species including softwood and hard wood (dimensions 20×20×2mm [thickness]) were accomplished using terahertz time-domain spectroscopy (THz-TDS: Tera Prospector-Kit model: NIPPO PRECISION Co., Ltd., Japan) at the various MC under fiber saturation point. THz measurements of wood at various moisture contents were taken for 19 orientations of the THz field (0-180o with 10o step) with respect to the visible grain. The dimensions, weight were measured soon after the THz measurement and MC and density were calulated. 3. RESULT AND DISCUSSION
Time-domain waves were collected for the different orientations of the THz polarization with respect to the grain by rotating the wood sample (Figure 1). The birefringence of wood

28th International Conference on Wood Science and Technology 2017 IMPLEMENTATION OF WOOD SCIENCE IN WOODWORKING SECTOR
4
introduces a phase shift between orthogonal polarization components and a corresponding propagation delay in the time domain. We simpley calculated the real part of reflective index value and absorption coefficient from the time delay and amplitude of peaks. The MC and density were predicted by multiple linear regression analysis from real part of reflective index value and absorption coefficient. Figure 2 shows the relation between measured and predicted value from THz complex reflective index values for (a) density and (b) MC. The prediction accuracy for the density were better than MC because of stable measurement of real part of index refraction value corresponding to time delay of peak. The change of THz peak due to THz diffraction by wood gave significant bad effect on the MC prediction. Figure 3(a) shows the relation between real part of reflective index value with the orientation angle between polarization and fiber grain angle for agathis. Rectangular wave relation were observed because the variance of the pulses parallel to the grain and perpendicular to the grain were small. We suggest to use the time delay defined by equation below in order to get the sine wave relation of index refraction value. � =
�⊥×�⊥�⊥+�‖ +�⊥×�‖�⊥+�‖ (1)
where t⊥ is the time delay of pulse perpendicular to the grain, t// shows the time delay of pulse parallel to grain, I⊥ is the intensity of pulse perpendicular to the grain and I// is the intensity pulse parallel to grain. Implementation of equation (1) enable us to get sin wave relation implying the possibility of estimation of grain angle as shown in Figure 3(b).
Figure 1. Reference and transmitted THz waveforms transmitted through samples of wood measured with the
terahertz polarization making angles of 0° and 180° with respect to the visible grain direction.
Figure 2. Relation between measured and predicted value from THz complex reflective index values for (a) density and (b) MC
Measured MC((%)
Pre
dic
ted
MC
((%
)
Measured density (g/cm3)
Pre
dic
ted
de
nsi
ty (
g/c
m3)
(a) (b)

28th International Conference on Wood Science and Technology 2017 IMPLEMENTATION OF WOOD SCIENCE IN WOODWORKING SECTOR
5
Figure 3. Change of real part of reflective index value with the orientation angle between polarization and fibre grain angle.
Acknowledgements: The authors would like to acknowledge the financial support from JSPS (KAKENHI, No. 16H02559 ).
(a)
(b)
Angle between polarization and fiber grain
Re
fle
ctiv
e i
nd
ex
valu
e

28th International Conference on Wood Science and Technology 2017 IMPLEMENTATION OF WOOD SCIENCE IN WOODWORKING SECTOR
6

28th International Conference on Wood Science and Technology 2017 IMPLEMENTATION OF WOOD SCIENCE IN WOODWORKING SECTOR
7
The Effect of Dry Thermal Treatment on the Vibrational Characteristics of Wood
Kobori Hikaru1*; Ichijo Sakura1; Okano Naoki1; Kojima Yoichi1; Suzuki Shigehiko1
1Department of Environment and Forest Resources Science, Faculty of Agriculture, Shizuoka University, Shizuoka, Japan
*Corresponding author: [email protected]
ABSTRACT Thermal treatment is one of the eco-friendly treatment for wood to change several properties such as dimensional stability, water resistance etc. Since thermal treatment gives darker appearance on wood surface, it has a potential to replace some tropical species with other wood species. In this study, the effect of dry thermal treatment on the vibrational characteristics was investigated. Japanese cedar (Cryptomeria japonica) was subjected to dry thermal treatment with several conditions (190, 220 °C with 40, 80, 160 min). Fundamental resonant frequency for lateral vibration and its loss tangent were measured before and after treatment. Resonant frequency was increased after 190 °C of treatment, however it was decreased with longer treatment for 220 °C. Loss tangent after 190 °C treatment was smaller than initial, however after 220 °C treatment loss tangent increased. Near infrared spectra were obtained from the surface of the specimen to investigate the chemical change due to thermal treatment. From the observation of the change in NIR spectra, changes in vibration characteristics at lower temperature was mainly due to water. In the case of 220 °C, change in vibrational characteristics was associated with both moisture and change in chemical composition including lignin, hemicellulose and cellulose. Key words: Near infrared spectroscopy, Thermal treatment, Vibrational characteristics 1. INTRODUCTION
Several tropical wood species have been widely used as furniture, musical instruments etc. due to their specific mechanical properties and unique appearance. Recently, the distribution of several wood species is limited in the context of the protection of tropical forests and biodiversity management. Therefore, exploring new resources which are interchangeable with these tropical wood species is urgent issue. For the furniture and musical instruments, colour and grain are one of the most important factors. Thermal treatment is easy way to improve several properties of wood (Esteves and Pereira, 2008). Degradation of lignin and phenolic extractives due to thermal treatment change the colour of the wood surface. Thermal treatment with higher temperature and longer duration gives darker in colour (Bekhta and Niemz, 2003; Johansson and Moren, 2006). Also, degradation of hemicellulose and esterification of cellulose improves decay resistance of wood (Boonstra, 2008; Boonstra et al., 2007; Weiland and Guyonnet, 2003). Furthermore, thermal treatment decreases equilibrium moisture content which results in the improvement of dimensional stability. On the other hand, mechanical properties decrease under several treatment conditions (Inoue et al., 1993). Besides, changes in equilibrium moisture content and cellulose crystallinity influence the vibrational characteristics of wood (Kubojima et al., 1998).
The aim of this study is to evaluate the change of vibrational characteristics of wood due to thermal treatment and to investigate the relationship between chemical composition and vibrational characteristics. Changes in resonant frequency and it loss tangent due to thermal treatment was obtained by lateral vibration tests, and Near infrared diffuse reflectance spectra was obtained from the surface of the specimen. Multivariate analysis was applied to evaluate the relationship between vibrational parameter and spectroscopic information.

28th International Conference on Wood Science and Technology 2017 IMPLEMENTATION OF WOOD SCIENCE IN WOODWORKING SECTOR
8
2. EXPERIMENTAL
2.1. Sample preparation
60 air dried Cryptomeria japonica specimens with 300 mm (L) x 10 mm (R) x 50 mm (T) mm were used. All specimens were oven dried at 105 °C for 48 h, then placed under 20 °C and 60% RH condition over 10 days. 2.2. Dry thermal treatment
Dry thermal treatment was conducted by thermostatic chamber (SOFW-450S, ASONE Co. Ltd.). Two treatment temperatures (190 and 220 ºC) and 3 treatment durations (40, 80 and 160 min after the chamber reaches treatment temperature) were set indicating a total of 6 treatment conditions. 10 replications were prepared for each treatment condition. Specimens were again placed under 20 °C and 60 % RH condition over 10 days. 2.3. NIR spectral acquisition
Vis-NIR measurement was performed before and after thermal treatment. Diffuse reflectance spectra ranging from 350 through 2,500 nm with 1 nm interval was obtained from the surface of each specimen by using portable Vis – NIR spectrophotometer (FieldSpec, ASD Inc.). Spectra was acquired from 3 points of each specimen and averaged. Gap-segment 2nd derivative (gap = 1 point, segment = 19 point) was performed for the raw spectra. In order to extract the spectral changes due to thermal treatment, 2nd derivative spectra of before thermal treatment were subtracted from that of after thermal treatment. 2.4. Lateral vibration test
Change in vibrational characteristics due to thermal treatment were evaluated by the lateral vibration tests. The vibration test was performed before and after thermal treatment. Specimen was supported by urethane foam and lateral vibration was generated by tapping the one side of specimen with hammer. Tapping sound was recorded by the sound level meter (LA-1410, Ono Sokki Co. Ltd.) which was placed on the opposite side of the specimen. Fast Fourier Transform (FFT) was performed to determine the fundamental resonant frequency. Also Hilbert transform was performed to calculate the loss tangent (tanδ) of fundamental resonant frequency. Tanδ was calculated as follows; ���� =
��
(1) where λ is the logarithmic decrement of the resonance amplitude. Data was processed by using Matlab R2014a (Mathworks Inc.). 2.5. Multivariate analysis
Partial least squares regression analysis (PLSR) was performed to predict the vibrational characteristics from NIR difference spectra. Mean cantering was applied as a pretreatment and maximum number of latent variable (LV) was fixed to 10. Leave-one-out full cross validation was used to determine the optimal number of LV. R2, root mean squared error for cross validation (RMSECV) and ratio of performance to deviation (RPD) were used for the evaluation of prediction model.

28th International Conference on Wood Science and Technology 2017 IMPLEMENTATION OF WOOD SCIENCE IN WOODWORKING SECTOR
9
3. RESULTS and DISCUSSION
3.1. NIR spectra
Figure 1 shows the difference spectra of each treatment condition. Difference spectra of 10 replications were averaged. Positive value in the difference means the increase of absorption after thermal treatment. The largest change was observed around 1,920 nm which is assigned to the combination of O-H stretching and deformation due to water (Schwanninger et al., 2011). Absorption at 984 nm which is assigned to the 2nd overtone of O-H stretching vibration also decreased. Absorption around 1,433 nm due to the amorphous region of cellulose and water decreased after treatment. On the other hand, absorption around 2,080 nm clearly increased after treatment. This absorption is assigned to crystalline and semi-crystalline region of cellulose.
Figure 1. Difference NIR spectra for Cryptomeria japonica
3.2. Vibrational Characteristics
Changes in fundamental resonant frequency for each treatment condition is shown in Figure 2. In the case of 190 °C, resonant frequency slightly increased after treatment. No difference was observed among treatment duration. Normally resonant frequency increases with decreasing moisture content. This increment is suggested to be caused by the decrease of equilibrium moisture content after thermal treatment. On the other hand, resonant frequency after 220 °C treatment decreased as increasing treatment duration except for 40 min. Decrement after longer treatment at 220 °C might be caused by thermal denaturation other than the change of moisture content.
Changes in tanδ at fundamental resonant frequency for each treatment condition is summarized in Figure 3. Tanδ showed the opposite trend; 190 °C and 220 °C with 40 min treatment decreased tanδ, while longer treatment duration at 220 °C increased tanδ. As same as in the case of resonant frequency, tanδ change after 190 °C and 220 °C with 40 min treatment might be mainly due to the decrease of moisture content. Besides, increment after longer treatment at 220 °C is caused by thermal denaturation.

28th International Conference on Wood Science and Technology 2017 IMPLEMENTATION OF WOOD SCIENCE IN WOODWORKING SECTOR
10
Figure 2. Change in fundamental resonant frequency due to the thermal treatment
Figure 3. Change in tan tanδ due to thermal treatment
3.3. Relationship between vibrational characteristics and NIR spectra
3.3.1. Resonant frequency
Cross validation result indicates that NIR difference spectra could predict resonant frequency changes with high accuracy (at LV=7, R2, RMSECV and RPD were 0.88, 0.4 % and 3.05, respectively). PLS loadings for the resonant frequency changes are shown in Figure 4. LV1 loading showed notable peaks at 984 nm, 1,432 nm and 1,932 nm. These wavelength regions are all assigned to water (2nd overtone of O-H stretching vibration, 1st overtone of O-H stretching vibration and the combination of O-H stretching and deformation, respectively). Therefore, LV1 is suggested to express the change in water due to the thermal treatment. There are several different notable peaks on LV3 loading; 976 nm, 1,409 nm and 1,909 nm. These wavelength regions corresponded with the absorption peaks on NIR spectra, which are assigned to 2nd overtone of O-H stretching vibration, combination of C-H stretching and deformation due to lignin and extractives, and 2nd overtone of C=O stretching vibration due to hemicellulose, respectively. Therefore, LV3 is suggested to express the change in various chemical component due to the thermal denaturation. Relationship between PLS score for LV1 and LV3 is shown in Figure 5. LV1 score decreased with increasing treatment duration. Furthermore, LV1 score for 220 °C treatment is lower than that for 190 °C treatment. In other words, more severe treatment condition resulted in lower LV1 score. At 190 °C treatment, LV3 score increased with increasing treatment duration. On the other hand, LV3 score decreased with increasing treatment duration. From the observation of PLS score and loadings, it is concluded that the

28th International Conference on Wood Science and Technology 2017 IMPLEMENTATION OF WOOD SCIENCE IN WOODWORKING SECTOR
11
influence of thermal treatment condition on water and chemical composition is different, and resonant frequency due to thermal treatment related to both water and thermal denaturation.
Figure 4. PLS loading vector for fundamental resonant frequency
Figure 5. Scatter plot of LV1 score v.s LV3 score for fundamental resonant frequency
3.3.2. Loss tangent
Cross validation result indicates that NIR difference spectra could roughly predict tanδ changes with (at LV=8, R2, RMSECV and RPD were 0.54, 2% and 1.60, respectively). PLS loadings for the resonant frequency changes are shown in Figure 6. LV1 loading showed same notable peaks as that for the calibration of resonant frequency. Therefore, LV1 is suggested to express the change in water due to the thermal treatment. On LV2, there are several different notable peaks; 1,368 nm, 1,464 nm, 1,648 nm and 1,918 nm. They corresponded with cellulose, hemicellulose and water. Absorption at 1,368 nm and 1,648 nm are due to acetyl groups and microcrystalline cellulose, respectively (Schwanninger et al., 2011). Therefore, LV2 is suggested to express the change in various chemical component due to the thermal denaturation, especially in relation with acetylation and crystallinity. Relationship between PLS score for LV1 and LV2 is shown in Figure 7. LV1 score increased with increasing treatment duration.

28th International Conference on Wood Science and Technology 2017 IMPLEMENTATION OF WOOD SCIENCE IN WOODWORKING SECTOR
12
Furthermore, LV1 score for 220 °C treatment is higher than that for 190 °C treatment. More severe treatment condition resulted in higher LV1 score. At 190 °C treatment, LV2 score slightly decreased with increasing treatment duration. However, in the case of 220 °C, LV2 score increased at 160 min treatment duration. These results related tanδ change during thermal treatment to the change in moisture and chemical component due to the thermal denaturation, such as acetylation and crystallinity of cellulose.
Figure 6. PLS loading vector for tanδ
Figure 7. Scatter plot of LV1 score v.s LV2 score for tanδ
4. CONCLUSION
Lateral vibration test and NIR measurement were performed to evaluate the effect of dry thermal treatment on Cryptomeria japonica. In the case of 190 °C treatment, resonant frequency slightly increased while tanδ slightly increased. Treatment duration did not influence these changes. In the case of 220 °C treatment, resonant frequency decreased and as the treatment duration increased. Difference NIR spectra could predict the change of resonant frequency very

28th International Conference on Wood Science and Technology 2017 IMPLEMENTATION OF WOOD SCIENCE IN WOODWORKING SECTOR
13
well, and various absorption bands due to water, hemicellulose and lignin related to the prediction. Though the calibration model for tanδ change was not precise as that for resonant frequency, it is suggested that the change in moisture and chemical component due to the thermal denaturation, such as acetylation and crystallinity of cellulose related to the tanδ change. Acknowledgements: A part of this research is supported by LIXIL JS Foundation. REFERENCES Esteves, B.; Pereira, H. (2008): Wood modification by heat treatment: A review. BioResources 4 (1): pp.
370-404. Bekhta, P.; Niemz, P. (2003): Effect of high temperature on the change in color, dimensional stability
and mechanical properties of spruce wood. Holzhorschung 37(5): pp. 539-546. Johansson, D.; Moren, T. (2006): The potential of colour measurement for strength prediction of
thermally treated wood. Holz als Roh und Werkstoff 64(2): pp. 104-110. Boonstra, M. (2008): A two-stage thermal modification of wood. DOI: 1854/10505 Boonstra, MJ.; van Acker, J.; Kegel, E.; Stevens, M. (2007): Optimisation of a two-stage heat treatment
process. Wood Science Thecnology 41(1): pp. 31-57. Weiland, J.; Guyonnet, R. (2003): Study of chemical modifications and fungi degradation of thermally
modified wood using DRIFT spectroscopy. Holz als Roh und Werkstoff 61(3): pp. 216-220. Inoue, M.; Norimoto, M.; Tanahashi, M.; Rowell, RM. (1993): Steam or heat fixation of compressed
wood. Wood Fiber Science 25(3): pp. 224-235. Kubojima, Y.; Okano, T.; Ohta, M. (1998): Vibrational properties of Sitka spruce heat-treated in
nitrogen gas. Journal of Wood Science 44: pp. 73-77. Schwanninger, M.; Rodrigues, JC.; Fackler, K. (2011): A review of band assignments in near infrared
spectra of wood and wood components. Journal of Near Infrared Spectroscopy, 19(5): pp. 287-308.

28th International Conference on Wood Science and Technology 2017 IMPLEMENTATION OF WOOD SCIENCE IN WOODWORKING SECTOR
14

28th International Conference on Wood Science and Technology 2017 IMPLEMENTATION OF WOOD SCIENCE IN WOODWORKING SECTOR
15
NIRWOOD: an EU Innovation Project to Determine Species and Geographical Origin of Timber Using NIR Spectrometry
Sierra, V.1; De Luque, M.2; Álvarez-San Millán, M.1; Pérez, S.2; García, E.1; Luque, L.2
1 Spectrapply, Polígono Industrial Puente Nora, Calle E, 2, 2ª planta, 33420 Lugones, Asturias, Spain, www.spectrapply.com
2 GEA Forestal, Tercio, 20, Bajo D, 28019 Madrid, Spain, www.geaforestal.com *Corresponding author: [email protected]
ABSTRACT
Near Infrared Spectrometry (NIR) will be a revolutionary innovation for the wood sector. The ability of this analytical technique to determine chemical and physical properties of wood has been positively tested. But NIR has also been proved to be an useful tool to determine other indirect data such as the botanical species or its geographical origin, because environmental features give a unique fingerprint to any timber sample. To extract this information from infrared spectra it is necessary to carry out a complex statistical treatment (chemometrics) and to compare every new wood sample with a representative database of wood spectra. To achieve this goal, the Spanish companies GEA Forestal and Spectrapply have joined together in a project partially funded by the European Union (Horizon 2020 Program) called NIRWOOD. In this work we show our first results carried out with three commercial spectrometers. The results obtained from timber of 16 commercial species in 25 localities in Spain are evaluated, reaching percentages of correct identification always over 80%, as well as discovering key methodological questions. NIR technology could be very useful to improve the wood traceability and to comply with the European regulations on timber trade. Key words: EUTR, Near-infrared, Traceability, Wood
1. INTRODUCTION
Wood from illegal logging accounts for around 15% of the total imports in the European
Union. Illegal logging causes significant global economic losses (around 15 billion $/year, according to the World Bank), and heavy environmental and social damages. The European Union regulation on timber trade (EUTR, since 2010) aims to tackle the illegal timber entering its territory. But nowadays, the timber traceability methods mainly consist in documentary control, that can be easily falsified, and more rarely slow and expensive laboratory analyses of DNA or Isotopes. Nirwood is an innovation project, partially financed by the European Union through its program Horizon 2020, SME Instrument that will incorporate Near Infrared (NIR) Spectrometry as a technological solution to determine botanical species and geographical origin of the wood in a simple, fast and affordable way. The aim of the project is to create a huge reference wood database of those species more commonly commercialized in the European Union and to develop a NIR device adapted to timber analysis.
NIR spectroscopy analyses the absorption or transmission of light in the range of the electromagnetic spectrum of the near infrared radiation, from 780 to 2500 nm. Depending on the chemical composition and physical structure of each analysed material, a specific absorbance spectrum will be obtained, and it will behave as the "fingerprint" of the material. The information behind the spectra directly obtained by the spectrometer has to be extracted through complex chemometrical treatments. NIR spectrometry applied to timber provides information about chemical composition and structure (moisture, lignin content, extractive content, sugars, etc.), and physical and mechanical properties (strength, density, etc.). There are also a number of works testing NIR technology on solid wood, leaves, needles or charcoal that demonstrate the great potential of this technique to discriminate between botanical species. NIR

28th International Conference on Wood Science and Technology 2017 IMPLEMENTATION OF WOOD SCIENCE IN WOODWORKING SECTOR
16
spectrometry is also sensitive enough to determine phenotypical differences in timber due to the influence of local conditions in the tree growing places (soil, altitude, climate, silvicultural treatments, and others) allowing to group specimens by its geographical origin. For more information about these applications, see the special issues dedicated to wood and derivatives of the Journal of Near Infrared Spectroscopy of 2010 and 2011 and other recent reviews such as Tsuchikawa and Kobori (2015) or Tsuchikawa and Schwanninger (2013). Some authors already have noticed the potential of this technology to fight against illegal logging (Pastore et al., 2011; Sandak et al., 2011; Dormontt et al., 2015; Nisgoski et al., 2016).
In this work we show the results of our preliminary sampling session of timber carried out in 25 Spanish sawmills working with well controlled timber species and its origin. The aim of this work is to test three commercial NIR devices with the aim of determine the most appropriate sampling methodology, to check their ability to discriminate both botanical species and geographical origin and to determine the minimum specifications needed to develop the Nirwood prototype before to start the compilation of a representative international reference database.
2. METHODOLOGY
Sampling has focused in eight of the most commercial species in Spain, but also some
tropical species to introduce some variability. Spectra from a total of 16 species have been collected in 25 sawmills at two different ecoregions (Atlantic and Mediterranean). We have worked with small local sawmills to ensure that the timber was obtained within a maximum radius of 100 km. We have taken 69 pairs species/origin: 8 temperate species coming from 54 localities (22 provinces) and eight tropical species coming from 10 different sources (taken the importing sawmill as an origin due to the uncertainty of the real timber source). We have taken a minimum of 20 samples per pair species/locality. We took samples in both logs and boards and both in tangential and transversal sections. In some cases, we previously sanded the wood. The species are: Castanea sativa, Eucaliptus globulus, Eucaliptus nitens, Pinus nigra, Pinus pinaster, Pinus radiata, Pinus sylvestris, Quercus robur, Chlorophora excelsa (Iroko), Entandrophragma cylindricum (Sapelli), Didelotia africana (Gombé), Cedrella odorata (Cedar of Brazil), Triplochiton scleroxylon (Ayous), Millettia laurentii (Wengue), Erythrophleum ivorense (Elondo), and Hymenaea courbaril (Jatoba).
2.1. NIR Devices
Three commercial devices were used for this preliminary study: LABSPEC®PRO (Analytical Spectral Device-ASD) working in reflectance mode from 350-2500 nm (1nm spectral interval); the handheld NIR spectrometer MICROPHAZIR (Thermofisher) that measures in reflectance mode form 1600-2400nm range (pixel resolution 8 nm, optical resolution 12 nm); and the portable spectrophotometer MICRONIR 1700 (VIAVI) that measures in reflectance from 950 to 1650nm (spectral resolution of 10 nm).
2.2. Chemometrics
Identification of wood or any other material by spectral data depends on classification and pattern recognition techniques. The Unscrambler X chemometric program (version 10.4, from CAMO Software AS) was used to analyse the data. Spectral data from each device were averaged, analysed and outliers were removed. The final spectral population was divided by random selection in two sets: the calibration data set (training set) and the validation data set.

28th International Conference on Wood Science and Technology 2017 IMPLEMENTATION OF WOOD SCIENCE IN WOODWORKING SECTOR
17
2.2.1. Pre-processing
Pre-processing eliminates noise and removes physical phenomena in the spectra. The most commonly used pre-treatments were: Standard Normal Variate (SNV), Detrend (D); multiplicative Scatter correction (MSC), Savitzky-Golay first order derivative (SG1), Savitzky-Golay second order derivative (SG2) and different combinations of them.
2.2.2. Exploratory Analysis
Principal Component Analysis (PCA) is an unsupervised pattern recognition technique. The computation of PC’s for the PCAs was developed using nonlinear iterative partial least squares (NIPALS) algorithm, over the training set data. The optimal number of PC’s was determined based on the cumulative variance percent of PC’s.
2.2.3. Pattern Recognition Methods
Individual models were based on the NIPALS algorithm and validated with cross validation for model development. SIMCA, PCA-LDA and PLS-DA classifications were applied over the row (without any treatment) training set and also over the training set after being transformed with different pre-treatments such as, first (polynomial order = 1, smoothing point = 4) and second (polynomial order = 2, smoothing point = 5) derivatives of Savitzky-Golay and Standard Normal Variate and Detrend (SNVD) and Multiplicative Scatter Correction (MSC) to obtain predictive models. All the different models created were used to classify samples of the validation data set. Recognition and prediction ability of the models were evaluated by the percentage of samples from the validation data set (rate prediction) classified correctly on their corresponding category.
3. RESULTS
3.1. Timber sections
In a previous work (De Luque et al., 2017) we already observed differences in absorbance depending on the orientation of the fibres, being greater in tangential and radial sections than in transversal ones. In this case, spectral signatures of roundwood and sawnwood from the same species (Quercus robur) were tested again, showing clear spectral differences between them. For this reason, we consider that they should be treated independently for modelling development. In addition, the edges of logs and boards of tropical timber are usually labelled with paint and treated with parfine which prevent sampling on it.
3.2. Sapwood and heartwood
Our results showed a clear spectral difference between the sapwood and the heartwood, showing sapwood higher dispersion and lower repeatability. For this reason, the main part of the sampling was done on the heartwood.
3.3. Surface preparation
Sampling before and after hand-sanding the surface of the transversal sections of sapelli boards showed surprising results, because dispersion of the samples was bigger after manual sanding than before. It is probably due changes in the intensity of the sanding by the worker.
3.4. Samples classification
Comparison between pattern recognition methods after pre-processing:

28th International Conference on Wood Science and Technology 2017 IMPLEMENTATION OF WOOD SCIENCE IN WOODWORKING SECTOR
18
- Discrimination between temperate vs tropical species (boards, transverse sections): the best results for all three devices were obtained by PLS-DA (100% correct classification).
- Discrimination between temperate species (Pinus pinaster, Pinus radiata and Quercus robur, boards transverse sections) tested on boards gave good results in PCA analysis (85% of the cumulative variance explained by the two first PC’s). It allowed us to use classification methods based on PC’s, and then LDA, SIMCA and PLS-DA methods were performed. The best results for all the devices were obtained by PLS-DA models were all the samples of the validation data set were correctly classified, but only in the case of LABSPEC all the models (LDA, PLS-DA and SIMCA) achieved the 100% of correct classification.
- Discrimination about origin of the samples (5 pairs species/origin, boards and transverse sections). Again, the good results of PCA allows to use LDA, SIMCA and PLS-DA methods and again PLS-DA allowed correct classifications by category (pair specie/origin) of all the validation samples. LABSPEC was the device that showed the best results (100% of correct classification) but MICRONIR showed also very good percentages over 90%.
- Discrimination between tropical species (boards, transverse sections). Exploratory analysis showed well defined groups of spectral data depending on the species and the best results were obtained by PLS-DA models with percentages of correct classification over 90%. The best results were again achieved with LABSPEC models that reached 95% of correct specie identification. SIMCA did not report good results.
- Discrimination between sources of tropical species (boards, transverse sections). Again, good results (over 93%) were reported for the three devices in the case of LDA and PLS-DA models. Results for SIMCA were poorer.
- Discrimination between temperate species (70 pairs species/origin) in logs (transverse sections). Results for LDA and PLS-DA showed a percentage of success in species classification over 77%, independently of the NIR device considered. This species discrimination was slightly lower than the ones reported for sawnwood (which were over 90%). SIMCA models did not reported good results for species classification of temperate roundwood for any of the commercial devices, showing low percentages of success, between 45 and 53%. It is important to note that percentages of correct classification differ depending on the species that have been tested. We could see how the percentages were higher (over 80%) for C. sativa, P. pinaster, P. radiata and P. sylvestris, independent of the device used, and lower percentages of correct classification were found for E. globulus, E. nitens, and P. nigra with percentages that in some cases decreased to 50% (random classification).
4. DISCUSSION
The good percentages of correct classification obtained in all the cases during this sampling
test, confirm the great potential of NIR technology as a useful tool to discriminate between timber botanical species and geographical origin both in temperate and tropical species, both in sawnwood and logs, and both in transversal and tangential/radial sections. We also confirmed that 20 samples are sufficient to characterize a pair species/origin, and that 5 spots per sample makes the sampling statistically robust.
Due to natural weathering, decay and chemical changes are common processes on the timber surface. Other authors suggest the utility of previous cleaning and sanding of the samples, extracting core samples, cutting out slices from logs or collecting chain-saw chips (Cooper et al., 2011; Sandak et al., 2011). However, while desirable, after taking into consideration a number of factors (such as simplicity, low cost and fast in situ sampling) and looking at our good discrimination results on raw surfaces without chemically treated sections (paint, or parafine), we consider acceptable to work on raw materials in our future sampling campaigns, but always avoiding especially dirty areas or resin spots on the surface.

28th International Conference on Wood Science and Technology 2017 IMPLEMENTATION OF WOOD SCIENCE IN WOODWORKING SECTOR
19
Despite the good results obtained after sampling in transverse sections of logs and boards (results exposed in this work), the better absorbance of tangential and radial sections lead us to consider these longitudinal sections as a better source of information for the future sampling campaigns. In any case, models must be built independently. Some authors have found the same influence of the timber face in the quality of the results (Braga et al., 2011; Cooper et al., 2011) while others didn’t find significative differences (Da Silva et al., 2016).
One of the objectives of this test was to determine the most useful NIR wavelength range to characterize wood. Schwanninger et al. (2011) already did a band assignment of wood components, emphasizing the importance of the underlying chemistry. Our best correlations were obtained using the whole NIR spectral range (LABSPEC), as Adedipe et al. (2008) did when comparing similar devices. Other authors have found more useful spectral regions to distinguish species. Some examples are: 1400-2500nm (Asner et al., 2014), visible region (Belmonte et al., 2014), 1000-1600nm (Bolzón de Muñiz et al., 2016), and 1850-2500nm (Espinoza et al., 2012). Nisgoski et al, (2016) point that this most useful range varies depending on the species. In our case, even obtaining the best results with LABSPEC device (350-2500 nm), we consider that both MICRONIR (950-1650nm) and specially MICROPHAZIR (1600-2400nm), covering less than the half of the NIR spectral range, offered enough good results of correct classification. That is the case of similar tests carried out by Da Silva et al. (2016).
Heartwood and sapwood have different structural and chemical composition and these differences can be recorded by NIR spectrometers. Our most homogeneous results were those taken on heartwood, especially in the case of coniferous samples. For this reason we consider it is better to take samples not far from the core of the log or its equivalent in boards.
About chemometrics, it looks clear that PCA analysis gives good results and it allowed us to use classification methods based on PC’s: LDA, SIMCA and PLS-DA. LDA. PLS-DA model has always produced the highest percentages of correct classification, usually over 90%, while SIMCA results were poorer. PLS-DA method has been widely used by other researchers to discriminate between species and origins with positive results (Braga et al., 2011; Cooper et al., 2011; Pastore et al,. 2011, Prades et al., 2013; Bergo et al., 2016). SIMCA model has been successfully used by other researchers (p.e. Adedipe et al., 2008; Bolzón de Muñiz et al., 2016) but it gave us worst results. Other authors did correct discrimination using just PCA pattern recognition method (p.e. Nisgoski et al., 2016).
Our results show different percentages of correct classification depending on the species. It has also been observed by other authors (Espinoza et al., 2012) and could be attributed to different genetical relationship between species or to methodological questions (p.e. the different number of samples taken for each one of them). In this sense, Asner et al. (2014) pointed that the spectra were dominated more by phylogeny than by abiotic filtering.
5. CONCLUSIONS
This work allowed us to clarify some of the requirements that have to be taken into
consideration for the development of the NIRWOOD project (sampling collection, NIR device and chemometrics). Results from raw surfaces are good enough to discriminate species and geographical origins. Tangential/radial sections give better results than transverse ones, so sawnwood and roundwood have to be treated as independent populations for modelling purposes. Heartwood spectra are more homogeneous than sapwood ones. Correct discrimination is higher in boards than in logs. A minimum of 20 samples (individual logs or boards) per pair specie/origin have to be measured to properly describe each category. The best results for classification in validation were normally obtained by PLS-DA models, LDA models reported were also acceptable while SIMCA showed a problem of overlapping between species in most cases. Full NIR range gives the most reliable results but partial ranges also offered enough good results usually above 90% (particularly 1600-2400nm range) to make a correct classification.

28th International Conference on Wood Science and Technology 2017 IMPLEMENTATION OF WOOD SCIENCE IN WOODWORKING SECTOR
20
Acknowledgements: This work has been partially funded by the EU, NIRWOOD Project. We appreciate the support of the selfless people who allowed us to sample in these 25 sawmills. REFERENCES Asner, G.P.; Martin, R.E.; Carranza-Jiménez, L.; Sinca, F.; Tupayachi, R.; Anderson, C.B.; Martinez,
P. (2014): Functional and biological diversity of foliar spectra in tree canopies throughout the Andes to Amazon region. New Phytologist 204: pp. 127–139.
Belmonte, D.; Paim. A.C.; Soares, R.; Sabadi, M.; Mesquita, M.; Kervald, L. (2014) Spectroradiometry of commercial wood veneers in the visible and near infrared spectra. Floresta, Curitibia 44 (1): pp. 125-132.
Bergo, M.C.J.; Pastore, T.C.M.; Coradin, V.T.R.; Wiedenhoeft, A.C.; Braga, J.W.B. (2016): NIRS Identification of Swietenia macrophylla is robust across specimens from 27 countries. IAWA Journal, 37 (3): pp. 420-430.
Bolzon de Muñiz, G.E.; Carneiro, M.E.; Rodrigues, F.; Zatt, F.; Nisgoski, S. (2016): Wood and charcoal identification of five species from the miscellaneous group known in Brazil as “Angelim” by Near-IR and wood anatomy. Maderas. Ciencia y tecnología 18 (3): pp. 505-522.
Braga, J.W.B.; Monteiro Pastore, T.C.; Rauber, V.T.; Alves, J.A.; Ribeiro da Silva, A. (2011): The use of Near Infrared spectroscopy to identify solid wood specimens of Swietenia macrophylla (CITES Appendix II). IAWA Journal, Vol. 32 (2): pp. 285–296.
Cooper, P.A.; Jeremic, D.; Radivojevic, S.; Ung, Y.T.; Leblon, B. (2011): Potential of near-infrared spectroscopy to characterize wood products. Can. J. For. Res. 41: pp. 2150–2157.
Da Silva, D.C.; Braga, J.W.C.; Soares, L.F.; Bergo, M.C.J.; Teixeira, N.C.; Gontijo, A.B.; Da Costa, N.R.; Coradin, V.T.R.; Wiedenhoeft, A.C.; Pastore, T.C.M. (2016) Identification of the origin of Big-leaf mahogany Word from five Latin American countries via NIRS and PLS-DA. 2nd Workshop “NIR spectroscopy for wood science and technology research”, Italy. pp. 28-30.
De Luque, M.; Álvarez San Millám, M.; Pérez, S.; Sierra, V.; Luque, L.; García, E. (2017): Desarrollo de una aplicación basada en la Espectroscopia de Infrarrojo Cercano (NIR) para la identificación de la especie y el origen geográfico de la madera. VII Congreso Forestal Español, Plasencia, Spain.
Dormontt, E.E; Boner, M.; Braun, B.; Breulmann, G.; Degen, B.; Espinoza, E.; Gardner, S.; Guillery, P.; Hermanson, M.J.C.; Koch, G.; Lee, S.L.; Rimbawanto, M.A.; Thomas, D.; Wiedemhoeft, A.C.; Yin, Y.; Zahnen, J.; Lote, A.J. (2015): Forensic timber identification: It’s time to integrate disciplines to combat illegal logging. Biol Cons. 191: pp. 790-798.
Espinoza J. A:, Hodge, G. R. and Dvorak, S. 2012. The potential use of near infrared spectroscopy to discriminate between different pine species and their hybrids. J. Near. Infrared Spectrosc., 18: 437-447.
Pastore, T.C.M.; Braga, J.W.B.; Coradin; V.T.R.; Esteves, W.L.; Arakaki, E.Y.; Alves, J.A.; Bolzón de Muñiz, G.I.; Bressan, O.A.; Davrieux, F. (2011): Near infrared spectroscopy (NIRS) as a potential tool for monitoring trade of similar woods: Discrimination of true mahogany, cedar, andiroba, and curupix. Holzforschung 65: pp. 73-80.
Nisgoski, S.; Schardosin, F.Z.; Batista, F.R.R.; Bolzón de Muñiz, G.I.; Carneiro, M.E. (2016) : Potential use of NIR spectroscopy to identify Cryptomeria japonica varieties from southern Brazil. Wood Sci. Technol. 50: pp. 71-80.
Prades López, C.; Gómez, I.; García Olmo, J.; González Adrados, J.R. (2013): Análisis discriminante de la procedencia geográfica de planchas y tapones de corcho natural mediante espectroscopia en el infrarrojo cercano. VIº Congreso Forestal Español, Vitoria. pp. 1-13.
Sandak, A.; Sandak, J.; Negri, M. (2011): Relationship between near-infrared (NIR) spectra and the geographical provenance of timber. Wood Sci. Technol. 45 (1): pp. 35-48.
Schwanninger, M.; Rodrigues, J.C.; Fackler, K. (2011): A review of band assignments in near infrared spectra of wood and wood components. J. Near Infrared Spectr. 19: pp. 287-308.
Tsuchikawa, S.; Schwanninger, M. (2013): A review of recent near-infrared research for wood and paper (Part 2). Applied Spectroscopy Reviews 48: pp. 560-587.
Tsuchikawa, S.; Kobori, H. (2015): A review of recent application of near infrared spectroscopy to wood science and technology. J. Wood Sci. 61: pp. 213-220.

28th International Conference on Wood Science and Technology 2017 IMPLEMENTATION OF WOOD SCIENCE IN WOODWORKING SECTOR
21
Improvement of Fire Performance of Impregnated Wood with Copper Based Chemicals
Can, Ahmet1; Özlüsoylu, İsmail*1; Grzeskowıak, Wojcıech2; Sözen, Eser1
1Forest Industry Engineering, Faculty of Forest, Bartin University, Bartın, Turkey 2Faculty of Wood Technology, Poznan University of Life Sciences, Poznan, Poland
*Corresponding author: [email protected]
ABSTRACT
Copper is among the most commonly used substances in impregnating industry due to its high toxicity against fungi at last 50 years. Copper-azole (CuA) and ammonical copper quaternary (ACQ) are the most widely used, because it is highly effective against fungi and insects. However, their fire resistance properties are not good. The aim of this work is to examine and improve the resistance of CuA and ACQ against fire. For this purpose CuA and ACQ were prepared with 2.4% solution by Firetex. These prepared solutions were impregnated with the full cell method. According to Mini Fire Tube (MFT) test results, 99,99% weight loss was observed in the control samples, while 17,15% and 16,63% weight loss were observed in CuA and ACQ prepared with FireTex, respectively. CuA impregnated samples maximum temperature increased to 479.88 ºC, while the maximum temperature in the solution CuA with firetex was 97.78 ºC. Keywords: Copper azole, Ammonical copper quaternary, Ffire test, Firetex 1. INTRODUCTION
Nowadays, reducing environmental pollution and the idea of better protection of human health are increasing the demand for biodegradable materials. In this context, the use of wood and wood based materials is increasing day by day comparing to alternative materials (Öztürk 2003). Wood material has very good physical and mechanical properties and is a renewable resource (Salca and Hiziroglu, 2014). Wooden material is widely used in many areas because of its important advantages. Mainly, wooden material is used for the structural applications and used in the indoor environment for the aesthetic and furniture purposes.
Since wood is an organic material and exposed to many harmful biotic and abiotic factors such as fungi, insects, termites, outdoor conditions (water damage, UV radiation) and fire. In order to protect the wood material from these harmful effects and to increase the period of use, some applications require that wood is additionally protected (Baysal et al., 2017; Le Van and Winandy, 1990). The most common way of preserving wood from deterioration is by treatment with protective chemicals that penetrate into the wood and thereby prolong the service life of wood and wood products (Poncsák et al., 2006; Ajuong and Pinion 2010; Ahmed and Moren, 2012).
Many protective preservatives contain copper as an active component against fungal attack, and copper compounds are very effective against many fungi species (Mourant et al., 2008). It is also relatively easy to form copper-based water solutions, and to determine and analyze their penetration into the wood (Archer and Preston, 2006).
Except for impregnated materials with fire retardant properties such as boron compounds, many preservatives with flame-burning properties such as copper and chromium can adversely affect the burning performance of the wood material. It has been pointed out in different studies that the flammability of wood materials is increased when it is impregnated with paraffin, styrene, methyl methacrylate and isocyanate, materials that increase dimensional stability and improve water repellent efficiency (Baysal, 1994 and Atar and Peker, 1998). There are not enough studies that thoroughly examine the burning performance of the impregnated wood

28th International Conference on Wood Science and Technology 2017 IMPLEMENTATION OF WOOD SCIENCE IN WOODWORKING SECTOR
22
material. However, impregnated wood is widely used in the interior of buildings and creates a potential hazard to humans in case of fire (Gao et al. 2005). So it is important to have knowledge of the thermal degradation and combustion performance of the impregnated wood material and to take the necessary precautions (White and Dietenberger, 2001; Lowden and Hull, 2013; Jiang et al, 2015).
Different studies have shown that fire retardant chemicals have some negative effects on the physical and mechanical properties of wood materials (Laufenberg, et al., 1986; Laks and Palardy, 1990; Baysal, et al., 2006; Ustaömer, 2008 et al., 2017). Fire retardants should improve their fire properties without harming the properties of the material to be produced in use. An effective fire retardant must have a low ignition speed, reduce the intensity of burning, cause low-speed and high-quality smoke, and not to be toxic. Features and appearance must be acceptable for a given area of use, and should not significantly affect product cost (Aydin et al., 2016).
Firetex, obtained by converting limestone-bearing rocks into water, is an industrial additive or chemical-free compound (Kesik, et al., 2015).
In this work we investigated the influence of Firetex is on improvement of the resistance of copper impregnated materials to fire. For this purpose ACQ and CuA impregnated materials prepared with Firetex and it is investigated. 2. MATERIAL AND METHOD
2.1. Materials Fir (Abies nordmanniana subsp. bornmulleriana) specimens were prepared from sapwood
blocks with dimensions of 5x10x100 mm (height x width x longitudinal). These well-selected specimens were nondeficient, proper, knot-free, normally grown wood material (without reaction wood and without decay, insect and fungal attack) according to the principles of TS 2470.
The samples were treated with copper azole (Tanalith E-3492) and ammonium copper quate (ACQ) at concentration of 2.4 % and Firetex (FT) at concentration of 100%. In this study, according to the report of Istanbul University Department of Pharmacology and Toxicology, Firetex that is natural, not harmful for human health and environment; in the test results of Gazi University Faculty of Technical Education, it is applicable for short period, medium period and vacuum impregnated methods; it has been also reported in the test results of Balıkesir University Basic Sciences Application and Research Center that Firetex which is not including any industrial additive or chemical is acquired transformation to water of rocks having the feature of limestone in nature, in addition it has been the standard of raw water according to the ICP AES analysis (Kesik et al., 2015). The ICP AES analysis results of Firetex made by Balıkesir University were shown in Table 1 below. Table 1. ICP AES analysis results of Firetex (Kesik et al., 2015)
Parameters Ba Cd Ni Mg Fe Pb Cu Zn Mn Cr Co Hg As Results 0,368
mg/L
<1 μg/L
0,012 mg/L
4,25 mg/L
<5 μg/L
<5 μg/L
<1 μg/L
<10 μg/L
<1 μg/L
<2 μg/L
<0,5 μg/L
<5 μg/L
<0,5 μg/L
2.2. Methods
5 control samples, 5 test samples impregnated with CuA, ACQ and Firetex, totally 30 samples were prepared. Before the experiment, the test samples were dried until they were stable at 20±2◦C, 60±5% relative humidity and 12% moisture gradient in climate room.

28th International Conference on Wood Science and Technology 2017 IMPLEMENTATION OF WOOD SCIENCE IN WOODWORKING SECTOR
23
2.2.1. Impregnation of Wood
Five different solutions were used for impregnation of wood. For this purpose, CuA and ACQ was dissolved in the 2.4 % and 2.4 % of water and Firetex, whereas 100% Firetex was used. Table 2. Variation and short naming
Name Content C Control samples
FT Impregnated with Firetex DWACQ ACQ dissolved in water FTACQ ACQ dissolved in Firetex DWCuA CuA dissolved in water FTCuA CuA dissolved in Firetex
Wood samples were dried in an oven at the temperature of 103 ºC until the constant weight.
Oven dried samples were treated with dilute solutions in an impregnation chamber according to full cell process. In this process, first samples left under vacuum at 650 mm/Hg for 30 min, then 6 bar pressure for 60 min. After impregnation, retention and weight percent gain (WPG) of the treated samples was determined by Eq.1 and Eq.2.: R(kg/m3)=((GxC)/V)x10 (1) Where; G is the difference between sample weight after impregnation and sample weight before impregnation (kg), C is the concentration (%), and V is the sample volume (m3). WPG(%)=((M2-M1)/M1)x100 (2) Where; M2 is the weight after treatment, and M1 is the weight before treatment 2.2.2. MFT – Mini Fire Tube Method
The MFT (Mini Fire Tube) method is an adopted and a modified ASTM E69 method. Profile tube made of aluminium (2 x 2 cm) with stand is placed on the laboratory weight. The source of heat is a gas burner with adjustable flame height (preferred height is 1 cm), mounted on a tripod. Measurement of exhausted gases temperature at the outlet of the pipe was made by using a type K thermocouple display for the temperature range 50-1200 0C.
The samples left loosely arranged after the protection procedure for a period of 7 days in order to dry. Before the test, the samples should be pre-drilled with the holes for suspension in the tube.
The performance test of the effect of protective system carried out according to the methods similar to the ASTM E69 method. After the placing the sample in the tube, on the hook and placing it on a laboratory balance, the balance was tarred. During sample combustion the display show the result of proper mass loss. A burner was placed with the height of the flame ca. 1 cm under a suspended sample. The duration of the flame on the sample was regulated and should amount to 6 minutes. The mass loss and the value of action gas temperature at the outlet of pipe shall be recorded at intervals of 2 seconds.

28th International Conference on Wood Science and Technology 2017 IMPLEMENTATION OF WOOD SCIENCE IN WOODWORKING SECTOR
24
Figure 1. The appearance of test machine and the sample burning Mass loss The main evaluation criterion was the mass loss of the test samples which was calculated according to Eq. 3, Δm=((m1-m2)/m1)x100 (3) Where; Δm: mass loss (%), m1: sample's weight before the test (g), m2: sample's weight after the test (g),
3. RESULTS AND DISCUSSION
The weight percent gain (WPG%) and retention (kg/m3) values in the wood samples after
impregnation were given in Figure 2. The weight percent gain of Firetex treated samples after impregnation process was determined as 124.86% and for the samples treated with Firetex added ACQ and CuA materials also had a weight gain of 122.37% and 124.67% respectively. The use of vacuum and pressure in the impregnation process increased the gain. When the retention values of the copper treated specimens were examined, it was found as 17.92 kg/m3 for ACQ prepared with pure water, 18.30 kg/m3 for ACQ prepared with Firetex, 17.69 kg / m3 for CuA prepared with pure water, and 20.67 kg/m3 CuA prepared with Firetex. Thus, the use of Firetex has increased the retention values of the examples. This is due to the fact that Firetex material increases the weight of the samples more than pure water after the impregnation process. In the study done by Ozcan et al. (2016) retention was obtained at a rate of 36.1 kg/m3 with a 24 hour immersion process using 100% Firetex and 52.8 kg/m3 with a 7 day perforation process.

28th International Conference on Wood Science and Technology 2017 IMPLEMENTATION OF WOOD SCIENCE IN WOODWORKING SECTOR
25
Figure 2.Retentions (kg/m3) and weight per cent gain (%) of samples
The weight loss values of the samples after the combustion test are shown in Figure 3 and
the maximum temperature values reached in the test case are given in Figure 4.
Figure 3. Mass loss course during the test
When the weight loss values measured in 2 seconds during the testing are examined, it is
seen that the control, ACQ and CuA impregnated samples have weight loss values as 100%. The samples impregnated with ACQ reached 100% weight loss at 106 seconds, the samples impregnated with CuA reached at 110 seconds, and the control samples reached at 170 seconds. The ACQ and CuA preservatives showed no resistance to burning, on the contrary they seem to facilitate the burning of the wood and reach a maximum loss of weight in a short time. However, with Firetex usage, resistance to burning has increased at a significant level. At the end of 360 seconds, Firetex impregnated specimens presented 18% weight loss. The use of Firetex in the preparation of ACQ and CuA increased resistance to burning of these materials. In previous studies, Firetex has shown to be an effective substance against burning (Kesik et al., 2015; Ozcan et al., 2016). In the control experiments made by Kesik et al. (2016), they achieved a loss of up to 40% in the impregnated samples with Firetex while burning completely with a loss of 98% weight after 600 seconds of testing. In addition, while 159.60 ppm CO emission was occurred in control samples, 80.17 ppm CO emulsion was measured in Firetex impregnated samples.
17,92 18,30 17,69 20,67
124,86 122,37 124,67
0,00
20,00
40,00
60,00
80,00
100,00
120,00
140,00
FT DEACQ FTACQ DWCuA FTCuA
Retention (kg/m3) WPG (%)
0,00
20,00
40,00
60,00
80,00
100,00
0
18
36
54
72
90
108
126
144
162
180
198
216
234
252
270
288
306
324
342
360
Time (s.)
Ma
ss
los
s (
%)
Control
FT
DWACQ
FTACQ
DWCuA
FTCuA

28th International Conference on Wood Science and Technology 2017 IMPLEMENTATION OF WOOD SCIENCE IN WOODWORKING SECTOR
26
Figure 4. Maximum temperature of wood during the test
Figure 4 shows the maximum temperature values reached during the testing. The loss of weight values given in Figure 3 related to the maximum temperatures of the samples. That is, the maximum temperature was reached during burning in ACQ and CuA impregnated samples with reaching maximum loss of weight in a short time. The specimens impregnated with CuA were removed after 78 seconds from the start of combustion and reached maximum temperature to 479.63 °C. The samples impregnated with ACQ reached 437.03 °C after 94 seconds and the control samples reached maximum temperature of 310.73 °C after 182 seconds. Firetex treated samples presented minimum weight losses and the maximum temperature reached remained below 100 °C. The similar situation is valid for the three variants prepared with Firetex. 4. CONCLUSION
According to results, after taking the flame source from the fire tube, the highest mass reduction (100 %) was observed in the non-impregnated control and impregnated with ACQ, CuA samples, the lowest in the impregnated with Firetex (17.15 %).
According to Figure 4, the highest temperature was observed in the impregnated with CuA samples (479.63 0C). It been has observed that impregnated by full cell method fir samples impregnated with Firetex samples decreases 0C consumption values 80 % in average. REFERENCES Ahmed, S.A.; Morén, T. (2012): Moisture properties of heat-treated Scots pine and Norway spruce
sapwood impregnated with wood preservatives. Wood and Fiber Science 44(1): 85-93. Ajuong, E.; Pinion, L.C. (2010): Corrosion and degradation of engineering materials. In Shreir’s
Corrosion, Editor-in-Chief: Tony J.A. Richardson, Elsevier Science Ltd, pp. 2439-2446. Archer, K.; Preston, A. (2006). An overview of copper based wood preservatives. Wood
protection2006.[online]<http://www.forestprod.org/woodprotection06archer.pdf>[cited ] ASTM E 69-02, Standard Test Method for Combustible Properties of Treated Wood by the Fire-Tube
Apparatus, ASTM International, West Conshohocken, PA. Aydın, D.; Gürü, M.; Ayar, B.; Çakanyıldırım, Ç. (2016): Bor bileşiklerinin alev geciktirici ve yüksek
sıcaklığa dayanıklı pigment olarak uygulanabilirliği. Journal of Boron, 1(1), pp.33-39 Ayrilmis, N.; Kartal, S.N.; Laufenberg, T.; Winandy J. E.; White. R.H. (2005): Physical and mechanical
properties and fire, decay, and termite resistance of treated oriented strandboard.” Forest Products Journal 55(5), pp.74–81
,00
100,00
200,00
300,00
400,00
500,00
0
18
36
54
72
90
108
126
144
162
180
198
216
234
252
270
288
306
324
342
360
Time (s.)
Te
mp
era
ture
( C
)
Control
FT
DWACQ
FTACQ
DWCuA
FTCuA

28th International Conference on Wood Science and Technology 2017 IMPLEMENTATION OF WOOD SCIENCE IN WOODWORKING SECTOR
27
Baysal, E.; Şimşek, H.; Toker, M.; Çolak, M.; Yiğitbaşı, N.O. (2006): Hygroscopicty levels of wood treated with boron compounds. In: Proceedings of the III. International Symposium on Boron, Proceeding Book Vol. 1, Ankara, pp. 51–54.
Baysal, E. (1994): Çesitli Borlu ve WR Bilesiklerinin Kızılçam Odununun Bazı Fiziksel Özellillerine Etkisi. KTÜ Fen Bil. Enst., Yüksek Lisans Tezi, Trabzon
Baysal, E.; Deveci, I., Turkoglu, T., Toker, H. (2017): Thermal analysis of oriental beech sawdust treated with some commercial wood preservatives. Maderas. Ciencia y tecnología, 19(3), 329-338.
Gao, M.; Ling, B.; Yang, S.; Zhao, M. (2005): Flame retardance of wood treated with guanidine compounds characterized by thermal degradation behavior. Journal of Analytical and Applied Pyrolysis 73(1): 151-156.
İstek, A.; Yalcınkaya, G.; Özlüsoylu, İ. (2017): The Effect of Some Boron Compounds on Physical and Mechanical Properties of Particle Board ICACOF 2017
Jiang, J. Li; J. Gao, Q. (2015): Effect of flame retardant treatment on dimensional stability and thermal degradation of wood. Construction and Building Materials 75: 74-81.
Kesik, H.İ.; Aydoğan, H.; Çağatay, K.; Özkan, O.E.; Maraz, E. (2015): Fire Properties of Scots Pine Impregnated with Firetex. ICOEST International Conference on Environmental Science and Technology, Sarajevo, BH
Laks, P.E.; Palardy, R.D. (1990): The development of borate-containing flakeboard.” In: Proceedings of the first international conference on wood protection with diffusible preservatives. Forest Products Society, p. 76–79.
Laufenberg, T.; Levan, S.L.; Bruci, V. (1986): Investigation of fire-retardant treatments for flakeboards. Drvna Industrija 36(3–4), pp.65–70.
Levan, S.L.; Winandy, J.E. (1990): Effects of Fire Retardant Treatments on Wood Strenght: A Rewiew, Wood and Fiber Science, 22, 1, 113-131
Lowden, L.A.; Hull, T.R. (2013): Flammability behaviour of wood and a review of the methods for its reduction. Fire Science Reviews 2(1): 1-19.
Ozcan, C., Kurt, S.; Esen, R.; Korkmaz, M. (2016): The determinated combustion properties of Fir wood impregnated with fire reterdants. The Online Journal of Science and Technology - July 2016 Volume 6, Issue 3
Örs, Y.; Atar, M.; Peker, H. (1999): Sarıçam Odununun Yanma Özelliklerine Bazı Borlu Bileşikler ve Su İtici Maddelerin Etkileri. Tr. J. of Agriculture and Forestry, 23, 501-509.
Öztürk, O. (2003): Fiber levha kompozitlerinin fiziksel ve mekanik özelliklerinin polimerlerle iyileştirilmesi için alternatif yöntemler, Yüksek Lisans Tezi, Hacettepe Üniversitesi Fen Bilimleri Enstitüsü, 89 s. Ankara. 2003.
Poncsák, S.; Kocaefe, D.; Bouazara, M.; Pichette, A. (2006): Effect of high temperature treatment on the mechanical properties of birch (Betula papyrifera). Wood Science and Technology 40(8): 647-663.
Salca, E.A.; Hiziroglu, S. (2014): Evaluation of hardness and surface quality of different wood species as function of heat treatment. Materials and Design 62: 416-423.
TS-2470 (1976): Wood - Sampling Methods and General Requirements for Physical and Mechanical Tests, Turkish Standards Institution, Ankara.
Ustaömer, D. (2008): Çeşitli yanmayı geciktirici kimyasal maddelerle muamele edilerek orta yoğunluklu lif levhaların (MDF) özelliklerindeki değişimlerin belirlenmesi, Doktora Tezi, KTÜ, Fen Bilimleri Enstitüsü, 244 s. Trabzon.
White, R.H.; Dietenberger, M.A. (2001): Wood products: thermal degradation and fire. In Encyclopedia of Materials: Science and Technology, Editors-in-Chief: K.H. Jürgen Buschow, Robert W. Cahn, Merton C. Flemings, Bernard Ilschner, Edward J. Kramer, Subhash Mahajan, and Patrick Veyssière, Elsevier Science Ltd, pp. 9712-9716.

28th International Conference on Wood Science and Technology 2017 IMPLEMENTATION OF WOOD SCIENCE IN WOODWORKING SECTOR
28

28th International Conference on Wood Science and Technology 2017 IMPLEMENTATION OF WOOD SCIENCE IN WOODWORKING SECTOR
29
Subfossil Waterlogged Oak-wood (Abonos) Moisture Content Estimation by Electrical Resistance Method
Klarić, Miljenko1*; Nikić, Velimir2; Pervan, Stjepan1
1 Wood Technology Department, Faculty of Forestry, University of Zagreb, Zagreb, Republic of Croatia 2 Student at Wood Technology Department, Faculty of Forestry, University of Zagreb, Zagreb,
Republic of Croatia *Corresponding author: [email protected]
ABSTRACT
Subfossil waterlogged oak-wood (Abonos) is very rare, expensive, and it is difficult to work with, with special emphasis on its drying. Additionally, information about correct procedures for moisture content estimation and monitoring of abonos is mostly scarce. In this research paper, investigation on how to conduct moisture content measurement and estimation correctly on subfossil waterlogged oak-wood from two different locations has been conducted, analyzed and discussed. Key words: Subfossil oak-wood, Abonos, Moisture content estimation, Electrical resistance method 1. INTRODUCTION 1.1. Subfossil waterlogged oak-wood (Abonos)
Subfossil waterlogged oak-wood (in Croatian: Abonos) is an oak-wood (Quercus spp.) that has been submerged in river bottom/riverside or in wetlands, under low oxygen and high water level conditions, over a longer period of time (mostly >1000 years). Under such conditions, oak-wood degradation is minimized and wood acquires (to a greater or lesser extent) black or dark brown colour, by chemical reactions due to inorganic substances precipitation within a wood matrix. Tannins in oaks are precursors of colour formation.
Figure 1. Abonos logs (photo: Klarić) Figure 2. Abonos (left) and present-day oak (right) (Sinković et al., 2009)
Figure 3. Abonos colour difference due to its age (Franjić, 2017)

28th International Conference on Wood Science and Technology 2017 IMPLEMENTATION OF WOOD SCIENCE IN WOODWORKING SECTOR
30
As compared to present-day (recent) oak-wood, abonos has a somewhat higher density and much higher shrinkage that is almost the double than at present day oak-wood (Sinković et al., 2009).
Table 1. Density and shrinkage comparison (Sinković et al., 2009)
Property Abonos
Present-day oak
mean ± SD ρ0 [g/cm3] 0.704 ± 0.04483 0.608 ± 0.06489 βr max [%] 10.5 ± 1.266 5.1 ± 1.026 βt max [%] 18.6 ± 1.963 9.1 ± 1.382 βv max [%] 27.6 ± 2.033 13.7 ± 2.014
Note: ρ0 – density in absolutely dry state; βr max – total radial shrinkage; βt max – total tangential shrinkage; βv max – total volume shrinkage.
Figure 4. Abonos shrinkage and cracks (photo:
Klarić)
Abonos is very valuable raw material, and it is usually used for the production of high value
added products, such as furniture, ornaments, tobacco pipes, or fine decorative goods.
Figure 5. Abonos products store (Franjić, 2017) Figure 6. Abonos electric guitar (Franjić, 2017)
1.2. Problematics
Abonos is very rare, expensive and it is difficult to work with, with special emphasis on its drying. Abonos is very difficult to dry without defects and it has to be dried very slowly, it is often air dried for several years. During long lasting drying procedure and during the production, a moisture content of wood has to be controlled frequently. Oven-dry method for determination of moisture content of wood should be the most suitable and most precise method for abonos among three existing standardized methods in the European Union. However, oven-dry method is time consuming, non-practical, while part of lumber has to be destroyed during the measurement. The most practical moisture content estimation method would be electrical resistance method, but the wood species code number for abonos does not exist for these type moisture meters (it is not provided by manufacturers of the moisture meters). When measuring the moisture content of abonos, people often use species code number for regular, present-day oak and such a measurement is certainly not correct. In this research paper, moisture content of four different abonos samples from two different locations (river basins) has been determined by oven-dry method (reference method) and compared to six different species group code numbers provided by a manufacturer of one electrical resistance type moisture meter. The research was conducted to find out, how big the deviation from oven-dry results is for each species code number and can some other species code of electrical resistance moisture meter be used for estimation of abonos moisture content, or the differences between different samples are too big to generally always use one species code.

28th International Conference on Wood Science and Technology 2017 IMPLEMENTATION OF WOOD SCIENCE IN WOODWORKING SECTOR
31
2. MATERIAL AND METHODS 2.1. Material
In this research, four different groups of abonos wood samples from two different locations (river basins) were acquired. The wood samples were dried differently. Information about each group of samples is listed in Table 2.
Table 2. Information about groups of abonos samples used in this research
Group of abonos samples
Type and duration of drying Finding site
A Naturally air dried mainly in form of
log (~5-6 years) The surrounding area of Zagreb city
(the river Sava basin)
B Naturally air dried mainly in form of
lumber (~5-6 years) The surrounding area of Zagreb city
(the river Sava basin)
C Naturally air dried mainly in form of
lumber (~1 year) The surrounding area of Varaždin city
(the river Drava basin)
D Naturally air dried mainly in form of
lumber (~2 years), then dried in vacuum dryer
The surrounding area of Varaždin city (the river Drava basin)
From sawn abonos wood, radial surface elements were cut with following dimensions: cross section 6 × 2 cm, and length from 37 to 63 centimetres. The elements were immediately vacuum-sealed to prevent uncontrolled drying or moistening. Then the vacuum-sealed elements were heated in Memmert UF 110 ventilated oven at 23 ºC for 48 hours before measurement, in order to equalize its temperature.
Figure 7. Sawing the elements (photo: Klarić) Figure 8. Vacuum-sealed elements (photo: Klarić)
2.2. Methods
2.2.1. Electrical resistance moisture content estimation
In this research GANN Hydromette M 4050 electrical resistance type moisture meter was used, together with test plug for checking wood moisture readings, and infrared surface temperature probe IR 40 EL. Teflon insulated pins M18 (45 mm) for ram-in electrode were used to ensure the correct measurement positioning. The measurements were performed in the middle of the thickness of the sample perpendicular to the wood fibres direction. Thirty measurements (different samples) were conducted for A, B and C groups of abonos and 15 measurements (different samples) were conducted for D group of abonos. During the measurement six different wood species codes available in GANN Hydromette M 4050 were tested. The codes of wood species groups (351, 352, 353, and 354), code for oak (166) and code for African ebony (161) were used. Within elements, samples were marked with graphite pencil and after conducted measurement, elements were cut according to graphite pen marks on samples 3 cm (longitudinal direction) × 6 cm (radial direction) × 2 cm (tangential direction) on

28th International Conference on Wood Science and Technology 2017 IMPLEMENTATION OF WOOD SCIENCE IN WOODWORKING SECTOR
32
METABO BAS 260 Swift table band saw. During the measurement, a temperature in the laboratory was set to 23 ºC.
GANN wood species codes in the order listed: 351, 352, 353 and 354 of used moisture meter (Hydromette M 4050) corresponds to the codes of other similar GANN types of moisture meters in order as listed: 1, 2, 3, and 4 (Ege, 2017).
Figure 9. GANN Hydromette M 4050
(photo: Klarić) Figure 10. Measurement with moisture meter
(photo: Klarić) 2.2.2. Oven-dry moisture content determination
Within the scope of implementation of oven-dry method, a special procedure was used to ensure comparable data between electrical resistance method and oven-dry method. Professor Hrvoje Turkulin, PhD (Turkulin, 2017) developed the used procedure within LDG laboratory. According to the aforementioned procedure, first the moisture content was measured by electrical resistance method in the middle of the sample, than the outer four sides/layer of the sample were cut off with the axe (Figure 11 and 12). Then from the central piece of the sample, dust was brushed and loose splinters were removed and the central piece was used for oven-dry measurement. The essence of the procedure is that the moisture content is measured with both methods on the same place of the sample, and to avoid the negative influence of the moisture content gradient, especially on the oven-dry measurement. As well, by usage of the axe, occurrence of excessive heat and subsequently water evaporation is avoided. During the gravimetric analysis the samples were weighed (Sartorius CP4202-0CE), oven dried (Memmert UF 110) until the constant mass was reached, cooled in a glass desiccator and weighed again. Moisture content was calculated according to the formula (1). � =
�1− �0�0 × 100 (1)
Where: ω – moisture content [%] m1 – the mass of the test slice before drying [g] m0 – the mass of the oven dry test slice [g]
Figure 11. Slicing samples (photo: Klarić) Figure 12. Sliced sample (photo: Klarić)

28th International Conference on Wood Science and Technology 2017 IMPLEMENTATION OF WOOD SCIENCE IN WOODWORKING SECTOR
33
3. RESULTS AND DISCUSSION
On the following figures (Figures 13 to 16) measured values in percentage of moisture content (MC) for each group of abonos samples (A to D, see Table 2) are presented. Lines in graphs shows measured values by oven-dry method (as a reference value) and measured values for each used wood species code (166, 161, 351, 352, 353, and 354) from GANN electrical resistance moisture meter. All values are expressed in percentage of moisture content in relation to absolutely dry wood.
Figure 13. Measured values of abonos samples - group A
Figure 14. Measured values of abonos samples - group B
Figure 15. Measured values of Abonos samples - group C
579
111315171921
1 2 3 4 5 6 7 8 9 10 11 12 13 14 15 16 17 18 19 20 21 22 23 24 25 26 27 28 29 30
Moi
stur
e co
nten
t [%
]
Abonos test sample
166 (Oak) 161 (Ebony) 351 352 353 354 Oven-dry
5
7
9
11
13
15
17
1 2 3 4 5 6 7 8 9 10 11 12 13 14 15 16 17 18 19 20 21 22 23 24 25 26 27 28 29 30
Moi
stur
e co
nten
t [%
]
Abonos test sample
166 (Oak) 161 (Ebony) 351 352 353 354 Oven-dry
1214161820222426283032
1 2 3 4 5 6 7 8 9 10 11 12 13 14 15 16 17 18 19 20 21 22 23 24 25 26 27 28 29 30
Moi
stur
e co
nten
t [%
]
Abonos test sample
166 (Oak) 161 (Ebony) 351 352 353 354 Oven-dry

28th International Conference on Wood Science and Technology 2017 IMPLEMENTATION OF WOOD SCIENCE IN WOODWORKING SECTOR
34
Figure 16. Measured values of Abonos samples - group D
On previous Figures 13 and 14 it can be seen that as concerns abonos samples which
originates from Sava river basin (groups A and B) the best matching with oven-dry (reference) results is obtained with GANN code for group of wood species 353. The biggest deviation is obtained with the GANN code for the group of wood species 351.
As can be seen in previous Figures 15 and 16 the best matching with oven-dry (reference) results is obtained with GANN code for the group of wood species 354 (for groups C and D). As concerns abonos which originate from Drava river basin (groups C and D) the biggest deviation is obtained with the GANN code for group of wood species 351.
Table 3. Difference between oven-dry method and electrical resistance method, in absolute values [% of MC]
Group of abonos samples
Wood species code
N MAE RMSE Prevailing tendency
[+ or -] MAD
A
166
30
2.2 2.3 - 0.5 161 4.4 4.5 - 0.8 351 5.6 5.6 - 0.7 352 3.2 3.3 - 0.6 353 0.7 0.9 Predominantly - 0.5 354 1.7 1.8 + 0.5
B
166
30
1.6 1.6 - 0.1 161 3.2 3.2 - 0.1 351 4.7 4.7 - 0.1 352 2.5 2.6 - 0.1 353 0.2 0.3 Predominantly - 0.1 354 2.0 2.0 + 0.1
C
166
30
4.9 4.9 - 0.4 161 10.2 10.2 - 0.4 351 10.9 10.9 - 0.3 352 7.5 7.5 - 0.4 353 4.3 4.3 - 0.4 354 1.0 1.1 Predominantly - 0.4
D
166
15
1.8 1.8 - 0.2 161 2.8 2.8 - 0.2 351 5.0 5.0 - 0.2 352 3.1 3.1 - 0.2 353 1.2 1.3 - 0.2 354 0.8 1.1 Predominantly + 0.4
NOTE: N – number of samples; MAE – Mean Absolute Error; RMSE – Root Mean Square Error; MAD – Mean Absolute Deviation.
In Table 3, the obtained differences of measured values between oven-dry method, as
reference method and electrical resistance method are presented. The smallest MAE (Mean Absolute Error) (< 1 % MC) for abonos groups A and B (river Sava basin) is obtained with
2
4
6
8
10
12
14
1 2 3 4 5 6 7 8 9 10 11 12 13 14 15
Moi
stur
e co
nten
t [%
]
Abonos test sample
166 (Oak) 161 (Ebony) 351 352 353 354 Oven-dry

28th International Conference on Wood Science and Technology 2017 IMPLEMENTATION OF WOOD SCIENCE IN WOODWORKING SECTOR
35
GANN electrical moisture meter wood species code 353. However, there is some difference between obtained values for abonos groups A and B (ΔMAE = 0.5). While the smallest MAE (≤ 1 % MC) for abonos groups C and D (river Drava basin) is obtained with GANN electrical moisture meter wood species code 354. There is a smaller difference between abonos groups C and D (ΔMAE = 0.2) than between abonos groups A and B. It is clearly visible from the presented results that the smaller MEA is, the measured values with electrical moisture meter have a tendency to be both negative and positive in respect to the corresponding oven-dry reference value. Clearly, many factors influence the measurement with electrical resistance method. Some of those factors are the location of finding site of abonos logs, soil and water chemical composition, duration of log submersion/age, possible degradation of abonos wood, probably even the method and duration of drying and possible microorganisms degradation during storage and drying, etc. In the case of studied logs, the most suitable of the tested wood species codes of moisture meter are determined, but for each new abonos log, the correlation between oven-dry and electrical resistance method should be determined to avoid false results readings, and to exclude erroneous measurement with electrical resistance moisture meter. Additionally, groups of abonos samples A and B were mutually similar in colour, they were black, while abonos groups C and D were mutually similar in colour, and they were dark brown. Therefore, abonos colour is certainly an approximate indicator of similarity if the logs are from the same finding site. This indicates that soil and water of these two different basins have a different chemical composition, i.e. composition of inorganic elements. 4. CONCLUSIONS
1. In the case of investigated abonos samples, it has been determined, that the wood species code of moisture meter 353 is the most suitable for samples from Sava river basin, and the code 354 is the most suitable for samples from Drava river basin.
2. Visual similarity or difference in structure and colour between abonos wood logs from the same location of origin can be an approximate indicator of similarity or difference in their electrical properties.
3. The electrical resistance method is a practical and reliable method for abonos, if a good preparation has been done and if the method is tested in each particular case. There may be big differences in properties between each individual abonos log.
4. The recommendation is that for each abonos log should be conducted a comparison of oven-dry method and electrical resistance method, regardless of the moisture meter manufacturer. In this way, the one will know which code of moisture meter is most suitable, and how much the results deviate from the oven-dry method results (reference results), and especially in which direction (positive, negative or both ways).
Acknowledgements: We wish to thank Mr. Darko Franjić, the owner of a wood processing company, for providing the abonos samples for this research. REFERENCES Ege, C. (2017): Personal communication. Sales International, Gann Mess- u. Regeltechnik GmbH,
Schillerstrasse 63, 70839 Gerlingen, Federal Republic of Germany. Franjić, D. (2017): Personal communication. Owner of the abonos processing company. Croatia. Sinković, T.; Govorčin, S.; Dubravac, T.; Roth, V.; Sedlar, T. (2009): Usporedba tehničkih svojstava
abonosa i recentnog drva hrasta lužnjaka (Quercus robur L.). Šumarski list 133 (11-12): pp. 605-611.
Turkulin, H. (2017): Personal communication. Professor at the Wood technology department, Faculty of Forestry, University of Zagreb, Republic of Croatia.

28th International Conference on Wood Science and Technology 2017 IMPLEMENTATION OF WOOD SCIENCE IN WOODWORKING SECTOR
36

28th International Conference on Wood Science and Technology 2017 IMPLEMENTATION OF WOOD SCIENCE IN WOODWORKING SECTOR
37
Traditional Ways Using of Wood and Forest Products in Housings and in Daily Livelihoods in Albania Populations/Communities
Haska, Hajri1; Kullolli, Bajram2; Ismaili, Hajri 4; Haska, Eneida3
1Department of Forestry, Faculty of Forestry Science, University of Agriculture, Tirana, Albania 2Regional Administrate of Protected Area, Elbasan, Albania.
3Department of Architecture, Faculty of Architecture and Urbanization, Polytechnic University, Tirana, Albania 4 Albanian Genetic Bank, University of Agriculture, Tirana, Albania
ABSTRACT
Since ancient times, as in other countries, in Albania as well, wood and other forest products have been widely used by the population. Forests in Albania have served as shelters and protection for the people, received timber for cooking, heating. Wood and stone are used for centuries in housing construction in Albania. Even today in many regions in Albania, there are many wooden buildings, interior decorations with wooden floors and ceilings, many fine works on carving on the walls, doors, windows and tables and chairs and other products. There is home equipment such: wooden barrel, equipment for keeping and processing milk, cheese, butter, wooden sofas, wood spoons, loom for wool processing, till in the plow for earthwork, or withe from willow for making baskets wood, hedges around the gardens or fields. Beautifully crafted crafts of wooden products in Albania such as pipes, cutty, tobacco pipe, beautiful wooden boxes, and wood bottles, up to Albanian towns or historic figures sculpted in wooden reliefs, or iconostasis in religious places are sculpted in wood. From forests, and in Albania, profited flowers, seeds, fruits, leaves, mushrooms and birds, animals that are object for hunting. These will be the object of our presentation at this conference. Key words: Albania, Equipment, Housings, Wood 1. INTRODUCTION
Albania is a small country located on the Balkan Peninsula, on the south-eastern part of Europe, between geographic coordinates 39° 8’ and 42° 9’ latitude and 19° 16’ longitude. With only 28,748 km2 total surface area, most of the territory is close to the sea and mountains, and as result it has different climatic zones and a well-defined vertical vegetation structure (Haska, 2011). Approximately 36% of the total surface area of Albania is covered by forests amounting to 1,042,790 ha, with a total standing volume of 75,726,100 m3, of which 62% is commercial timber and 38% firewood. More of the forest lies at north-east and south-eastern part of Albania. According to national statistics the current forest situation is as follows: high forest-325,370 ha; coppice forest- 457,598 ha; shrub/scrub and other vegetation- 260,190 ha. Some of the main forest species that grow in Albania there are: Beech (Fagus), Oak (Quercus),Black pine(P.nigra Arnold), Fir (Abies) Strawberry tree (Arbutus unedo), Hornbeam (Carpinus) (Haska, 2011; AAEF, 2005, 2007, 2009).
From 1889 year an Albanian leader, ideologist Frasheri S. has written: “All these jobs, as well as the woods, forests and the metals will be watched by the ministry of general works. Each forest will be divided into several parcels, and until to take the to harvest the last parcel, the parcel that was harvested the firstly will be reconstructed, regenerated; and so will always be wooded by forests, and never will the forests be not finished, will regenerated, they will be repeated, and be ever flourishing” (Frasheri, 1889).

28th International Conference on Wood Science and Technology 2017 IMPLEMENTATION OF WOOD SCIENCE IN WOODWORKING SECTOR
38
2. MATERIALS AND METHODS
First, in order to reach a respectable level of representation, we had to test all the Albanians (Albania have 12 county/prefectures) to see which region is richer in forests and in the same time has a multiplicity of use of wood products in daily life. From a study of the various materials and decays available, it turns out that the Elbasan county (Haska, 2011; Haska, 2002) best fulfils our target with regard to the relevant study.
Elbasan County lies in the central area of Albania. It has a total area of 3,292 km2 and a population of 437,394 inhabitants. It is bordered to the north and northwest with the District of Tirana, east and southeast of the Korça district, west and southwest with the district of Berat. It consists of four districts: Elbasan district, which is also the center of this district, the Librazhd district, Peqin district, Gramsh district. Administratively, Elbasan County has 7 municipalities with 50 administrative units and many villges (See and the map of Fig.1). Balkan Peninsula is a key region in the climatic transition zone between the western and eastern Mediterranean and also between the Mediterranean and central European synoptic regimes (Seim et al., 2012).
Many studies have identified four climatic zones in Albania: i) field Mediterranean climate zone, ii) hilly Mediterranean climate zone, iii) pre-mountain Mediterranean zone and iv) mountain Mediterranean climatic zone, as well as five vegetation types in Albania: (i) Mediterranean vegetation type (macchia Mediterranean); (ii) oak forests; (iii) beach forests; (iv) fir forests; (v) Bosnian and Balkan pine forests (Haska, 2011; Haska, 2012). The climate of Elbasan County is characterized by a Mediterranean climate, with soft winters and hot summers. Precipitation mostly falls in the winter and autumn seasons with an average of 1,490 mm per year. The average annual temperature is 15.4 ° C. In terms of relief 38% is made up of mountains, 28% consists of fields and 34% consists of hills. The county is crossed by two rivers: Shkumbini, with a surface of 1,062 km2 and 90 km, as well as the river of Devolli (Haska, 2011).
Here, in the Elbasan county area the wood has been used since early times (Haska, 2002), and in period after 1950 year there has been in functions one the most powerful procesing enterprise of woodworking process in the country, in Albania, called Combinat of Woodprocesing Elbasan, which produced since timber saw, till to plywood, veneer, wood flooring and many other wood sub-products. Even today, this enterprise, Combinat, continues to produce but in relatively smaller quantities.
But most importantly, it is noteworthy that in this region, many rural families, but also in the cities, still use wood in many traditional ways, and this is where we finally decided to implement our study in this region.
Figure 1. Administrative map of Elbasan County.

28th International Conference on Wood Science and Technology 2017 IMPLEMENTATION OF WOOD SCIENCE IN WOODWORKING SECTOR
39
2.1. The forest wealth/estate of the Elbasan County.
Table 1. Forest wealth of Elbasan county (http://www.qarkuelbasan.gov.al/)
Nr Nomination Total (Ha) State (Ha) Communal(Ha) Private (Ha)
1. Surface forest +pasture 132 550 70 910 61 380 260 2. Forest 128 080 67 070 60 800 210
3 High forests 65 480 49 620 15 650 210 4 Coppice 16 520 3 970 12 550 0
5 Shrubs 46 080 13 480 32 600 0 6 Surface with forest plants 4 470 3 840 580 50
From the Table 1 we can see that Elbasan county is very reach with forests, have about
12.3 % again of the total forest surface in Albania. In a general study for the Elbasan County, high forest with production aim include about
72 340 ha with volume about 9.7 million m3, but from a more specific study concluded as about 54 420 ha high forests with volume 8.5 million m3, that is worth to intervened with harvesting works (FPRI, 2002). The Elbasan County has a very good forest economy with the very good network of the forest roads, as for example Stravaj, Qarrishta, Holta ect (FPRI, 1999).
2.1.1. Questionnaire/survey compilation
In order to derive some scientific results in relation to traditional ways of using wood and forest products in housings and in everyday living in Albania populations/communities, one of the most recent methods of semi-structured, and then get face to face interviews from various interviewers in our study. Questionnaire was built with 7 sections and many subsections.
2.1.2. Target groups and questionnaire form
To achieve more convincing and representative results, we first identified several Target groups, with the main ones having significant correlation with forests, wood products as well as their use as well as Non Wood Forest Products (NWFP). And more specifically, these target groups are as follows:
a Forest Harvesting subjects – FHS, b. Collectors of Non Wood Forest Products – CNWFP, c. Farmers in the village - FV, d. Women in the village – WV, e. Forest and environment associations – FEA, f. Students of Forest Faculties resident in villages – SFFRV, g. Local Government Unit – LGU, h. Forest administrate – FA, i. Others – O.
3. RISULTS AND DISCUSION
After defining the target groups, as well as drafting the questionnaire, we initially tested 3 versions of questionnaires with interview, and then made the necessary adjustments and the questionnaire got the final form. Then groups of interviewers went to the field, and based on the target groups, interviews took place.

28th International Conference on Wood Science and Technology 2017 IMPLEMENTATION OF WOOD SCIENCE IN WOODWORKING SECTOR
40
3.1. Collection data and data processing
In total we took 45 interviews, as follows: Forest Harvesting subjects – FHS 4 persons, collectors of Non Wood Forest Products – CNWFP 5 persons, farmers in the village - FV 6 persons, women in the village – WV 4, Forest and environment associations - FEA 5, students of Forest Faculties resident in villages – SFFRV 5 persons, Local Government Unit-LGU - 7 persons, Forest administrate – FA- 6 persons and Others – O - 3 persons.
Then all the data were coded and inserted in an Excel format for a more sophisticated processing then, and they worked to get the final results.
3.1.1. Results and discussion
After a compilation of computerized and processing data, some very significant data were produced, namely:
Section - cognitive questions, in relation of the age, dividing them into three age classes have those results: age till 20 year 11.1% of interviewees, 20-40 year 31.1 %, and more then40 year 57.8 % of interviewees. In relation of education: with 8 years of education (elementary school) 24.4%, with secondary education 17.8%, and with higher education 57.8% of interviewees.
With regard to employment status from the questionnaires we have: 2% unemployed, 2% employed in private company, 7% retired, 17% university graduate students, 30% employed in public sector and 42% self-employed.
Subsection – is rich in nature resources your county: 2 % answer don’t konow, 18 % little and 80 % answer many.
Subsection – what kind of nature resources predominate in your county: more answers are for forest, pasture, water, minerals, and since every interviewer has had the opportunity of more than one alternative we have those results: 58 % answered water resources, 95% forests, 82 % pastures, 27 % minerals, and 5 % medicinal plants and 2 % fauna of forests and 2 % olives
Subsection - is rich with forest and pasture your county: 13 % answered little and 87 % many.
Subsection: relation of predomination property form of forestry and pasture in the Elbasan County - 6% private propriety and 94 % say for state proprietary, including here and municipality proprietary.
Users group that profit more from the forest / pasture, and here interviewer has had the opportunity of more than one alternative: 94 % answered for harvesting of wood production, 87 % grazing, 78 % collectors of medicinal plants, 22 % tourism, 6 % hunting, 2 % quarry and 2 % mines.
Question: where you live – 4 % answer in peripheries, in village 40 % and 56 % in the city, as well as 42 lives in apartment and 58 % lives in private home.
In home have something products, constructions and equipment from Albanian forests, have some answers: 58 % have wood roof, 38 % wooden ceiling, 64 % have wooden floors, wooden tables 89 %, wooden buffet/carryall 84%, wooden chair 86%, wooden stool 31%, beehive beehives 18%, wooden door 53%, wooden windows 35%, wooden stair 11%, wooden cage for home animals 2 %.
In daily livelihood use device, furniture, equipment from Albanian forest wood, interviever answered: Mahogany wood 4%, wood spoon 93 %, wooden furka/fork 4 % (women in Albania work with wool processing with them), wooden loom 9 % (production carpeting in artisanal and traditional way), wooden tail 49 %, wooden frames 24 %, wooden plow 13 %, equipment for shaking milk 20 %, wooden pots 11 %, wooden equipment for noodles of the pie 62 %, rolling pin 78 %, wood sculptures 11%.
In cases when have yard or garden, in it have planted: fruit plants 24 %, and mixt plants, forest tree and fruit trees 31 %.

28th International Conference on Wood Science and Technology 2017 IMPLEMENTATION OF WOOD SCIENCE IN WOODWORKING SECTOR
41
The question: with what you cook and heat, are answer – 11% with energies, 11% with gas, 52 % with fire wood, 36 % combine fire wood + energy.
In relation of NWFP, questions for knowledge about them, are answered: 40 % say have good knowledge, 58 % somewhat and 2 % don’t know.
Questions: take/using NWFP from the forests, are answered – 49 % using fruits from forests, 31% forest seeds, 82 % flowewrs, 58 % leaves, 11 % roots, 33% mushrooms, 82 % medicinal plants, 33 % edible plants, 11 % wild animals, 11% wild poultry, 2 % stone. 93 % say that using of NWFP from the forest have an impct in the environment and only 9 % say no, 4 % say have positiv impact, 22 % say have negative impact and others say have both, pozitive and negative impact on environment.
In relation of social impact of NWFP, 98 % say that community have profit from using of NWFP, only 2 % say no; 29 % say that more profit community that live in peripheries whereas 44 % say that more profit from using NWFP communities that lives in villages.
Interviewers given and some suggestions that can summarize as: to preserve and manage in a right way natural resources, to add more forest surface through new planting/afforestation, to be given great support from the government and donors the subjects that work in forestry field, to be more carefully in harvest wood products, to act every time in accordance with environmental regulations, to collect and harvest according to strict criteria NWFP, to train and qualify the persons who collect medicinal plants, to support with financing cultivating of medicinal plants, processing and marketing of medicinal herbs, certification of NWFP, financing of the establishment of wood processing lines and medicinal plants, assisting the revival of traditional wood crafts, to be used with many of our wooden equipment in our daily lives, etc., to involve more women and females especially in NWFP collection and processing processes, to draft legislation on NWFP and forests and to apply it directly, to strike hard violations in environment and illegal logging in forests etc. And in the end only 8 persons want to know with results of this study.
4. CONCLUSIONS
Albania, and especially Elbasan County are very reach with nature resources, and especially with forests, pasture, and other NWFP. From the early times, in the Albanian family, especially in rural area, wood and forest products have been used in housings and in daily livelihoods in populations/communities. Those traditional ways continue and today in many families in rural area but and in the town/city. Very important for the rural population is using of NWFP. Our duty for the future is to support with awareness, financial support, training, qualification etc., revitalization of the traditional crafts for wood products and equipments, as a tool and a very effective way for the sustainable management of the natural resources and at the same time for the growth of social welfare especially of the rural area, civic and suburban communities, which are generally connected a part of their lives with natural resources, always through a sustainable use and their continuous addition.
Acknowledgements: We wish to thank; forest staff in municipality cities of Elbasn, Librazhd, Gramsh, Administrate of Protected Area Elbasan, and Local Government Unit of Gjinar as well as all interviewer that spent the time in the helping of realisation of this study. REFERENCES AAEF (2005, 2007, 2009): Albanian Agency of Environment and Forestry, Report of State Environment
in Albania 2005-2007-2009 years; Tirana, Albania.
28th International Conference on Wood Science and Technology 2017 IMPLEMENTATION OF WOOD SCIENCE IN WOODWORKING SECTOR
42
FPRI (1999)-Forest and Pasture Research Insitute (FPRI): “Per nje zvhillimit te qendrueshem tepylltarise shqipetare- For a Sustainable development of Albanian forestry ”, Scientifich Sesion, organised at December 1999, held on the occasion of the 35th anniversary of the FPRI, published by FPRI, 72 page, 1999, Tirana, Albania.
FPRI (2002) - Forest and Pasture Research Insitute(FPRI): “Ne ndihme te strategjise se zhhillimitte qendrueshem te pyjeve dhe kullotave ne Shqiperi- In helping the strategy of sustainable forest and pasture development in Albania” , Pilot region Elbasan, Seminar organised at July 2002, published by FPRI, 82 page, 2002, Tirana, Albania.
Frasheri S.(1889): “Shqipëria ç'ka qenë, ç'është e ç'do të bëhetë-Albania what it was, what it is and what will be done”, publishing by “Dituria” Bukuresht, page 96, 1899 year.
Haska H.(2002): “Forest – Environment-Community”; postgraduate text used in the one-year course of Environmental Training of specialists and cadres in the framework of the project “Protection and Environmental Administration in Albania”, publication by University of Athenes, Departament of Biology, Albanian Autocephalous Church and Faculty of Environment Tiranë, -page 116, 2002, Athens, Greece.
Haska H.,(2011): “The status of European beech (Fagus sylvatica L.) in Albania and its genetic resources”.VTI, Johann Heinrich von Thunen-Institute, Lnabauforchung, VTI Agriculture and Forestry
Research, Germany, 350.(2011).ISBN978-3-86576-076-0, Page11-26 , Germany. Haska H., at al (2012): “Forest Ecosystems and Climatic Changes – A Case Study on Albania country”, Journal of International Environmental Application & Science , Vol.7 (5) page 927-932
(2012).ISSN-1307-0428, Konya, Turkey. Seim A., Haska H., at al (2012):“Climate sensitivity of a millennium-long pine chronology
fromAlbania”. Climatic Research, Vol.51: 217- 228, 2012, Germany. http://www.qarkuelbasan.gov.al/

28th International Conference on Wood Science and Technology 2017 IMPLEMENTATION OF WOOD SCIENCE IN WOODWORKING SECTOR
43
Temperature as an Important Factor in Rotary Welding of Wood
Žulj, Ivan1*; Župčić, Ivica1; Grbac, Ivica1; Slivar, Valentino1 Radmanović, Kristijan2 1Department for Furniture and Wood Products, Faculty of Forestry, University of Zagreb, Zagreb, Croatia
2Department of Processes Engineering, Faculty of Forestry, University of Zagreb, Zagreb, Croatia *Corresponding author: [email protected]
ABSTRACT
Welding of wood is an innovative way of connecting wood, or pieces of wood, without the use of glue or another binder. The main reason for welding is melting of the welding surface layers of wood (lignin and hemicelluloses) and physical and chemical reactions that lead to the solidification of the melt and creating a solid compound. The paper will investigate the influence of the rotation frequency (1520 min-
1) and the welding depth (20 mm) on the temperature in the rotary welded joint. The welding direction is perpendicular to the direction of the fibers with constant welding time. The temperature was measured with probes placed vertically in the welding direction. The position of the measuring probes is defined in this study. The probe closest to the surface (probe 1) achieves an average temperature of 184 ° C. Probe 4, which is 16 mm away from the surface, achieves at least the average temperature of 68 ° C. The average embedded force is 1631 N. The welding of pine wood is shown in a three-dimensional rectangular coordinate system. Key words: Welding solid wood, Dowels, Welding temperature, Weld factors, Embedded force 1. INTRODUCTION
Welding of wood is a relatively new way of bonding two or more wood elements or
wood boards without the use of adhesive. The welding process causes thermally-induced softening of wood components (lignin and hemicelluloses) leading to polymerisation, while the surface of wood layers melt when they are in contact (due to the friction between two pieces of material). The result is the destruction of the cell wall in the interfacial zone and a considerable increase in the density in the welding zone. Mechanical friction (which produces high temperatures), pressure fore and chemical reactions at the cooling stage make cell walls burst. The joints produced in this way can be compared to other ways of bonding. Many recent research has been dedicated to wood to find new ways of the application of this valuable and renewable raw material. Kanazawa et al. (2005) studied parameters that affect a dowel during rotational welding. The authors concluded that the temperature was likely to exceed 200°C. However, the restricted speed of the camera prevented them from measuring the accurate temperature. This was confirmed by subsequent studie of Rodriguez et al. (2010). in which they welded birch wood (Betula Alleghaniensis) and maple wood (Acer Saccharum) with smooth beech dowels. They found out that welding temperature is directly correlated with the rotation frequency. Leban et al. (2008) conducted a study into the impact of frequency on rotational welding of spruce wood (Picea Abies) with grooved beech dowels (Fagus Sylvatica). The obtained the best results in embedded strength at a frequency of 1500 min-1, whereas an increase in frequency resulted in lower strength. Moreover, they found out that higher welding frequencies produced a higher concentration of destroyed tissue i.e. a high increase in temperature was generated, so that melted material shifted further away from the bond line and created thus a gap. Research into rotational welding was also conducted at the Faculty of Forestry of the University of Zagreb. Župčić et al. (2008) examined the optimal shape of the receiver hole where the bond line would run along the entire periphery of the dowel. A study was done in the welding-through doweling of oak and spruce samples with the oak substrate always placed on the upper

28th International Conference on Wood Science and Technology 2017 IMPLEMENTATION OF WOOD SCIENCE IN WOODWORKING SECTOR
44
side. The authors concluded that there is a statistically significant difference between the glued and the welded dowel. Further, they showed that the dowel welded to the oak substrate yields higher embedded force compared to the dowel glued or welded to the spruce substrate. Auchet et al. (2010) studied a comparison between a constant welding speed and a changing (increasing) welding speed. The results showed that the highest embedded force (4.7 MPa) was generated at a constant welding speed of 20 mm/s, whereas the changing welding speed generated an embedded force of 3 MPa. Župčić et al. (2014) also examined the impact of wood species and cross-sections on the strength of the joint obtained by rotational welding. The study results showed that the wood species and the cross- section have an important impact on the embedded force. The highest results for the embedded force were yielded by the dowels welded to the beech transverse cross-section. It was also shown that that there is a statistically significant difference between the values of the embedded force for the dowels welded parallel to the fibre orientation and those welded perpendicular to the fibre orientation. However, no statistically significant difference was found between the value of the embedded force in the direction perpendicular to the fibre orientation (radial, radial/tangential and tangential). The study results showed that beech is the most suitable wood species for dowel welding regardless of fibre orientation.
2. MATERIALS AND WORKING METHOD
2.1. Samples, welding parameters and moisture content
The study was conducted at the laboratory of the Department for Furniture and Wood Products at the Faculty of Forestry of the University of Zagreb. Pine wood (Pinus Sylvestris L.) for the study had been selected randomly from the stack of sawn dry timber. Criteria for the element selection were as follows: the sawn timber had to be of regular structure, without any knots, cracks and damages. Smooth beech dowels of 1000 mm in length were used during the selection of the material for the study (random selection was employed). To fit with the study purpose, smooth dowels were made by planning on a four- sided planer, and were trimmed to a length of 120 mm. Table 1 displays welding parameters, sample designation and the total number of samples. Table 1. Sample list and their designations
Sample designation Wood species Rotation
frequency (min-1) Welding
penetration (mm)
BO_1520_20_x Pine wood 1520 20
Number of samples: 30 pcs
x- stands for the ordinal number of the welded dowel (1-30)
The pine samples were conditioned at a temperature of 23 + 2°C and a relative air humidity of 50 + 5%. All samples had more or less the same radial-tangential texture (Figure 1). Sample dimensions and their weight were measured in order to determine the moisture content of the samples using the gravimetric method according to HRN ISO 3130-1975. The average initial moisture content in the pine samples was 9.33% (the lowest moisture content was 8.89%, and the highest moisture content was 11.11%). The average density amounted to 0.547 g/cm³ (the lowest density was 0.544 g/cm³, and the highest was 0.556 g/cm³). The samples having the dimensions 30 x 200 x 30 mm were used in the study.

28th International Conference on Wood Science and Technology 2017 IMPLEMENTATION OF WOOD SCIENCE IN WOODWORKING SECTOR
45
Figure 1: Radial-tangential texture
Three receiver holes were drilled into each pine sample. The holes had a diameter of 8 mm. A further four holes were drilled for the test probes. The additional holes were drilled perpendicularly to the dowel holes at a distance of 4 mm. A CNC machine with a 3 x 12 x 60 mm spiral milling cutter was used to make the holes for the measuring probes on the samples (Figure 2).
Figure 2. Schematic illustration of the test pine sample for dowel welding
The samples were welded (Figure 3) on a welding machine that can operate in a mode with the dowel rotating. The rotation frequency during the welding process was 1520 min-1. The time needed to weld the dowel on the sample was 4 s, and the clamp time after the welding process was 3 – 5 s. Weld penetration was 20 mm. The dowel was welded to a static sample. A total of 30 samples were welded. Figure 4 illustrates a test sample ready for further testing. A program developed exclusively for this type of study was used during welding. The software recorded current temperature (Figure 5) and depicted it as a graph on a printout in real time. It was developed by M-electronic. Due to some shortcomings of the software, maximum temperatures were read by Acrobat Reader DC with the possibility of error of + 1.5°C. Temperature probes PT1000 with a temperature range of -70 to + 550 °C were used for the test. The probes are Class B with the possibility of error of 0.3%.
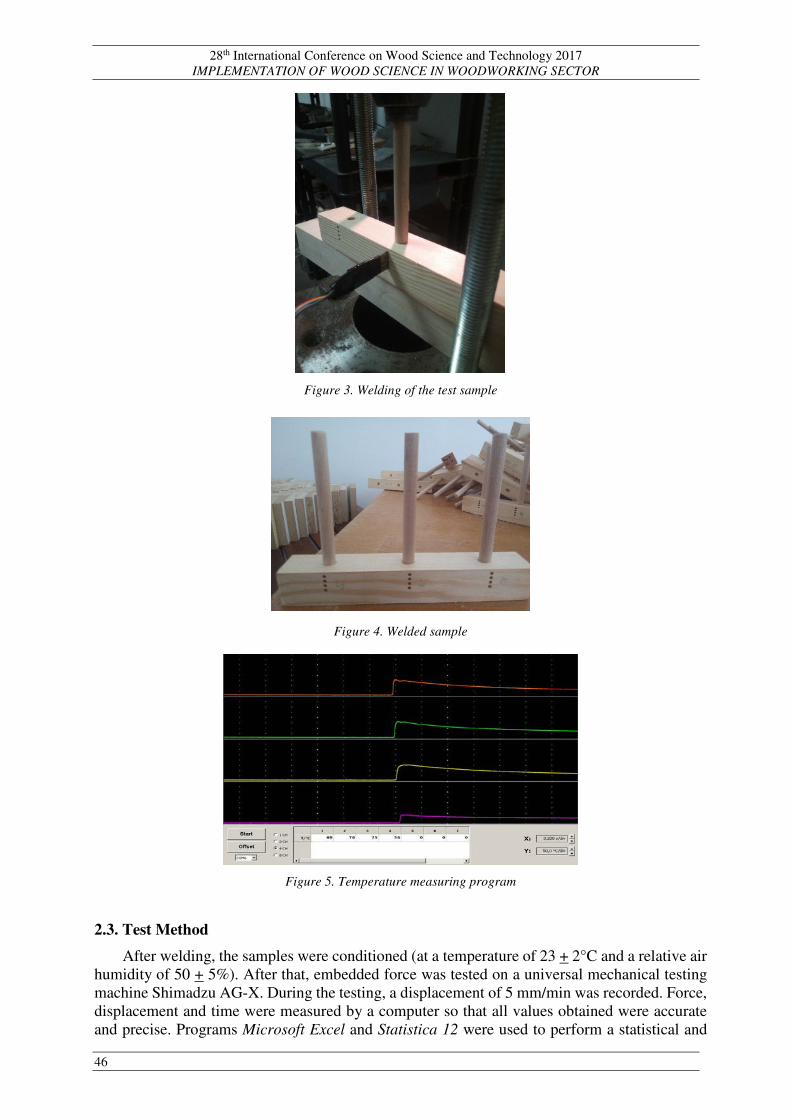
28th International Conference on Wood Science and Technology 2017 IMPLEMENTATION OF WOOD SCIENCE IN WOODWORKING SECTOR
46
Figure 3. Welding of the test sample
Figure 4. Welded sample
Figure 5. Temperature measuring program
2.3. Test Method
After welding, the samples were conditioned (at a temperature of 23 + 2°C and a relative air humidity of 50 + 5%). After that, embedded force was tested on a universal mechanical testing machine Shimadzu AG-X. During the testing, a displacement of 5 mm/min was recorded. Force, displacement and time were measured by a computer so that all values obtained were accurate and precise. Programs Microsoft Excel and Statistica 12 were used to perform a statistical and

28th International Conference on Wood Science and Technology 2017 IMPLEMENTATION OF WOOD SCIENCE IN WOODWORKING SECTOR
47
graphical analysis of the data. Descriptive statistics was used for all analysed variables, and the percentage difference was calculated for some tests. An error of 5% is considered as statistically significant for all statistical analyses. All graphical illustrations of the statistical analysis were made as box plots, while other results were presented in tables. The arithmetic mean and standard deviation were used for parametric tests, and the median and the 25th and 75th percentile for nonparametric tests. 3. RESULTS AND DISCUSSION
The study results are presented in Diagram 1 and Figure 6. Welding temperature was measured at four points on the samples along the hole depth. The probe closest to the surface (Probe 1) recorded an average temperature of 184°C due to friction produced as the dowel enters the sample substrate. Probe 2 achieved a statistically insignificant higher average temperature. This increase in temperature is induced by heat transfer from the surface and the dowel (185°C). Probe 4, placed 16 mm away from the surface, recorded the lowest temperature. The reason for the lowest average temperature of 68°C is to be found in the fact that the dowel reduced the tightness due to friction.
Figure 6. Average temperatures recoded by the probes (BO_1520_20)
Diagram 1 clearly shows the correlation between the rise in temperature and the rise in embedded force, and supports the studies by Kanazawa et al. (2005) and Rodriguez et al. (2010). The average embedded form is 1631 N with a standard deviation of 540.8, and the average maximum temperature is 190°C with a standard deviation of 10.8. The highest temperature was 217°C, and the highest embedded force was 2925 N at 203°C. The trend line allows a conclusion that the embedded force increases with a rise in temperature. The R - quadrant value for the trend lines is 0.193. The value suggests high scattering of data.

28th International Conference on Wood Science and Technology 2017 IMPLEMENTATION OF WOOD SCIENCE IN WOODWORKING SECTOR
48
Diagram 1. Impact of temperature on embedded force (BO_1520_20)
4. THEORETICAL RESEARCH INTO HEATH TRANSFER The issue of heath transfer from the welding place to the measuring point has been studied by Zoulalian and Pizzi (2007). However, they studied the heath transfer only in the direction of the temperature measuring device (y-axis). Due to the distance between the welding place and the measuring point (in this study it is 2 mm), there occur some losses and the heath transfer from other axes (x-axis and z-axis) to the measuring point. For that reason, a heath transfer model has been developed that takes into account the impact of all axes. The wood welding process is shown in a three-dimensional rectangular coordinate system where the welding process is done along the y-axis (Figure 7). During the process the dowel is in a dynamic contact with each point along the y-axis, represented by 0 ≤ y ≤ y'. For that reason, these points become heath sources. As the time intervals over which the dowel is in contact with each single point along the y-axis differ, so does the intensity of the heath sources. The aim of the study is to formulate an equation to describe the source and the transfer of heath to Point A at which temperature is measured. The said model is a good introduction to the heath transfer issue as it builds upon the heath transfer model by Zoulalian and Pizzi (2007).
Figure 7. Wood welding in a three-dimensional rectangular coordination system. A point at which temperature is
measured
5. CONCLUSION The conducted studies demonstrate that a smooth beech dowel can be successfully welded to a pine substrate (embedded force 2925 N). The study shows that the values of embedded force (joint strength) depend on temperature, supporting, thus, research by Kanazawa et al. (2005) and Rodrigez et al. (2010). It was demonstrated that there is no statistically significant difference in welding temperature between the samples welded at the same frequency and with the same
y = 4181,3ln(x) - 20303
R² = 0,193
0
500
1000
1500
2000
2500
3000
3500
150 170 190 210 230E
mbe
ded
forc
e (
N)
Temperature (°C)

28th International Conference on Wood Science and Technology 2017 IMPLEMENTATION OF WOOD SCIENCE IN WOODWORKING SECTOR
49
welding penetration (20 mm). The said model is a good introduction to the heat transfer issue as it builds upon the heat transfer model by Zoulalian and Pizzi (2007). Unfortunately, such welded joints have not found wide application due to the complexity of the process, many factors that influence the welding process (welding time, tightness, rotation frequency, wood welding temperature, wood structure and species and the like). Their application is rather insignificant. Therefore, many studies are being conducted in order for the welded joint to find its proper place in the production of furniture. REFERENCES Auchet, S.; Segovia, C.; Mansouri, H.R.; Meausoone, P.-J.; Pizzi, A.; Omrani, P. (2010): Accelerating
vs Constant Rate of Insertion in Wood Dowel Welding. J. Adhesion Sci. Technol., 24: 1319 – 1328
Kanazawa, F.; Pazzi, A.; Properzi, M.; Delmotte, L.; Pichelin, F. (2005): Parameters influencing wood-dowel welding by high-speed rotation. J Adhesion Sci. Technol., 19 (12): 1025 – 1038
Leban, J.-M.; Mansouri, H.R.; Omrani, P.; Pizzi, A. (2008): Dependence od dowel welding on rotation rate. Holz Roh Werkst, DOI 10.1007/s00107-008-0228-6.
Rodriguez, G.; Diouf, P.; Blanchet, P.; Stevanovic, T. (2010): Wood – Dowel Bonding by High-Speed Rotation Welding – Application to Two Canadian Hardwood Species. J Adhesion Sci. Technol., 24 (2010): 1423 – 1436.
Zoulalian, A.; Pizzi, A., (2007): Wood-dowel rotation welding – a heat – transfer model. J. Adhesion Sci. Technol., 21 (2) 97-108
Župčić, I.; Mihulja, G.; Bogner, A.; Grbac, I.; Horvat, B., (2008): Zavarivanje masivnog drva. Drvna industrija 59 (3) 113 – 119
Župčić, I., Vlaović, Z., Domljan, D., Grbac, I. (2014).: Influence of Various Wood Species and Cross-Sections on Strength of a Dowel Welding Joint. Drvna industrija 65 (2) 121 – 127

28th International Conference on Wood Science and Technology 2017 IMPLEMENTATION OF WOOD SCIENCE IN WOODWORKING SECTOR
50

28th International Conference on Wood Science and Technology 2017 IMPLEMENTATION OF WOOD SCIENCE IN WOODWORKING SECTOR
51
Effect of Tartaric Acid Addition to Catalyst on Curing Behaviour of Urea-Formaldehyde Resin
Španić, Nikola1*; Jambreković, Vladimir1; Radmanović, Kristijan1; Mihulja, Goran1;
Kljak, Jaroslav1 1 Wood Technology Department, Faculty of Forestry, University of Zagreb, Zagreb, Croatia
*Corresponding author: [email protected]
ABSTRACT
This paper reports on possibility of tartaric acid (L-(+)-tartaric acid) use as a part of a catalyst for commercial urea-formaldehyde (UF) resin curing. An aqueous solution (20 %) of ammonium sulphate with the addition of 0.25 to 1.0 % of tartaric acid was used as two-component catalyst and curing behaviour of UF resin was determined. More precisely, changes in pH values and resin curing times as affected by catalyst type and addition were determined. Alongside, the pH value changes of prepared resin/catalyst mixtures during the course of 4 hours were determined and cured resin was additionally analysed by means of FT-IR spectroscopy. Test results showed that the curing behaviour of resin for which the pure ammonium sulphate was used as the catalyst is somewhat similar to that of resins cured with the catalyst prepared with the addition of tartaric acid, but with one significant difference, which is the resin curing time. Such results indicate the possibility of thus modified catalyst use in the production of particleboards, where a shortened resin curing time could potentially result in a shortening of the board pressing time. Key words: Catalyst, Curing behaviour, FT-IR, pH value, Urea-formaldehyde resin, Tartaric acid 1. INTRODUCTION
Global demand for type P2 particleboard (boards for interior fitments, including furniture) as a readily available and a relatively inexpensive material is growing on daily basis. For this reason, many board manufacturers are forced to look for ways to increase their productivity and to reduce operating costs while manufacturing the environmentally acceptable products with satisfactory properties. Given that the P2 particleboards are almost exclusively manufactured using urea-formaldehyde (UF) resins in which the emission of free formaldehyde is determined, in the context of the latter statement, the term environmental acceptability refers to limitations of formaldehyde emissions without impairing of any other board properties. Use of paper production by-products (Jambreković, 2000) or natural substitutes as a part of UF resins, such as liquefied wood (Antonović et al., 2010; Kunaver et al., 2010) or furan derivatives (Schneider et al., 1996; Naceur Belgacem and Gandini, 2003) is one of the ways to reduce production costs. However, this type of savings is not necessarily related to productivity increase, but to a potential reduction of board manufacturing costs. Modifications in the composition of catalysts which are necessary for initiating and carrying out the reaction of UF resin curing are another way of achieving greater productivity, costs reduction, and board production optimization. UF resins dry matter, its pH value and the type and the percentage of added catalyst, combined with the knowledge of catalyst solution pH value are essential data for the proper conduction of the particleboard manufacturing process. This is so because interconnectivity and interaction of those properties as depending on the press temperature and time directly condition the development of the final product with satisfying physical and mechanical properties. Therefore, studies that include this interaction and interdependence of UF resins and type of catalyst are essential for the understanding of the problems involving UF resin curing with an emphasis on the direct application of thus gained knowledge in the particleboard manufacturing process.

28th International Conference on Wood Science and Technology 2017 IMPLEMENTATION OF WOOD SCIENCE IN WOODWORKING SECTOR
52
Results of determining the changes in rate of pH values decrease and UF resin curing time (Dongbin et al. 2006) indicate that in respect with changes in pH value and resin curing time, molar ratio of urea and formaldehyde resin has the greatest impact, while the catalyst type is less pronounced. Similar results were obtained by Park et al. (2002) whose results showed that the UF resin curing rate is almost completely governed by changes in pH value after addition of catalyst. Their study showed that during UF resin cure in highly acidic condition (pH≈1.0) uronic structures form which in the end results with higher amounts of adhesion strength. Latter statement is further confirmed by the fact that gel time of resin to which low pH value catalyst was added (e.g. ammonium chloride or ammonium citrate) is shorter in comparison with the gel time of resin to which higher pH value catalyst was added (e.g. zinc borate). Kamal et al. (2010) also came to a similar conclusion, emphasising the importance of the presence of ammonium ions in the catalyst system. Partially conflicting results are reported by Xing et al. (2006) who found that the correct polymerization due to the drastic pH value change of resin is directly conditioned with free formaldehyde content, if ammonium chloride is used as catalyst. Thereby UF resin gel time decreases with the increase of catalyst and resin dry matter content due to the decrease of pH value of the complete system. These findings point to the importance of controlling the dry matter content of resin, and the water content of wood chips during particleboard production. However, as the value of the water content and pH value of the wood are directly linked, a question arises of the influence of pH value of wood on the UF resin curing rate and the resultant impact on the properties of the particleboards. Akyüz et al. (2010) dealt with the latter mentioned problems and they have found that the pH value of wood chips and the percentage additions of strong acid based catalysts greatly influence the physical and mechanical properties of particleboards produced using UF resin.
The reports of mentioned authors, suggest that the type of catalyst does not affect in particular the process of UF resin curing. The fact that the only requirement that ensures proper cure of UF resin is that catalyst in its structure must contain ammonium (NH4+) ions, opens a very large range of options for partial replacement and/or modification of the commercial catalysts with price acceptable bio products. For exactly this reason the objective of this study was to assess the effects of partial replacement of ammonium sulphate catalyst with tartaric acid on UF resin curing behaviour. 2. MATERIALS AND METHODS 2.1. Materials
UF resin with 66 % dry matter content and industrial grade ammonium sulphate ((NH4)2SO4) were kindly provided by Kronospan CRO, Ltd. Industrial grade tartaric acid (L-(+)-tartaric acid) for oenological purposes was obtained from Begerow GmbH & Co. Deionised water used for catalyst preparation was ASTM type II, and prepared using TKA MicroMed system. All catalyst solutions were prepared as 20 % water solutions of pure ammonium sulphate (catalyst A) or as two component catalysts that contained ammonium sulphate and 0.25 % (catalyst B), 0.5 % (catalyst C) and 1 % (catalyst D) of tartaric acid, respectively.
2.2. Methods
2.2.1. The effect of catalyst content on the pH value changes of resin/catalyst mixtures
The effect of catalyst addition to resin and the pH values changes of resin/catalyst mixtures were determined on 400 ml of UF resin held in glass laboratory beaker. The catalyst solutions were added to UF resin in five steps, each step adding 0.2 % of catalyst solution. Catalyst solutions were added based on their solid contents in regards to neat UF resin solid content. Prior to first catalyst addition, the neat resin in glass laboratory beaker was stirred for 10 minutes
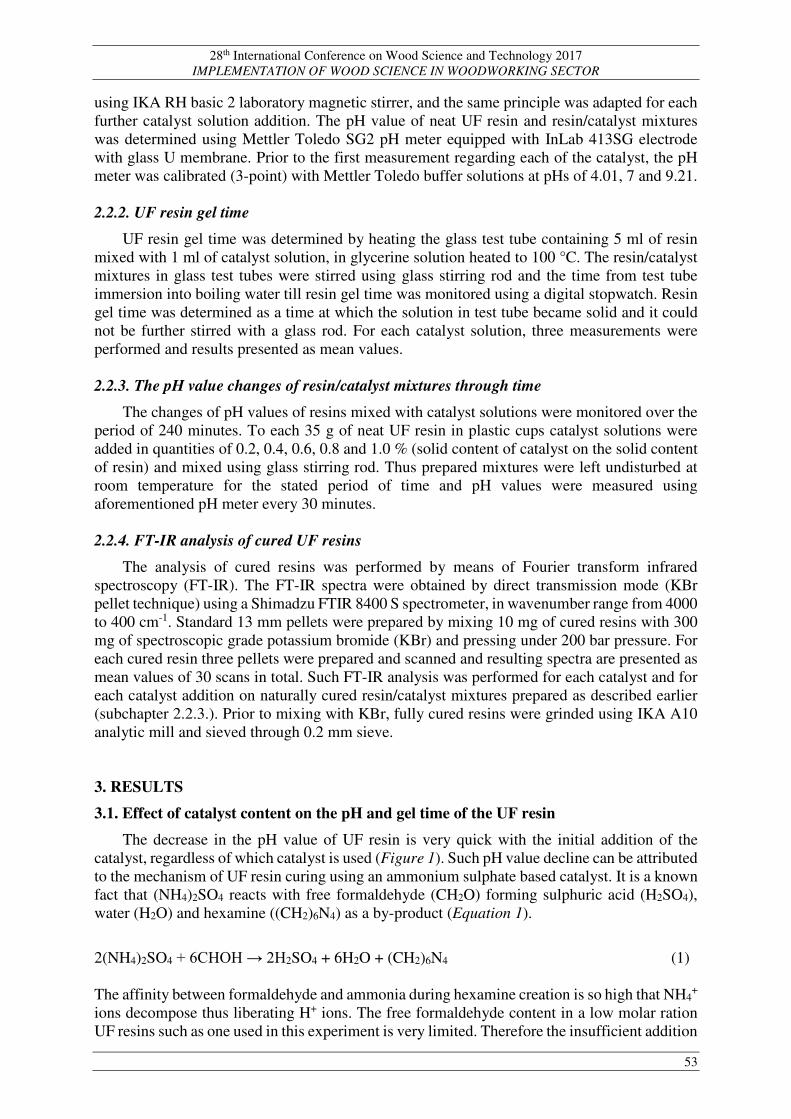
28th International Conference on Wood Science and Technology 2017 IMPLEMENTATION OF WOOD SCIENCE IN WOODWORKING SECTOR
53
using IKA RH basic 2 laboratory magnetic stirrer, and the same principle was adapted for each further catalyst solution addition. The pH value of neat UF resin and resin/catalyst mixtures was determined using Mettler Toledo SG2 pH meter equipped with InLab 413SG electrode with glass U membrane. Prior to the first measurement regarding each of the catalyst, the pH meter was calibrated (3-point) with Mettler Toledo buffer solutions at pHs of 4.01, 7 and 9.21. 2.2.2. UF resin gel time
UF resin gel time was determined by heating the glass test tube containing 5 ml of resin mixed with 1 ml of catalyst solution, in glycerine solution heated to 100 °C. The resin/catalyst mixtures in glass test tubes were stirred using glass stirring rod and the time from test tube immersion into boiling water till resin gel time was monitored using a digital stopwatch. Resin gel time was determined as a time at which the solution in test tube became solid and it could not be further stirred with a glass rod. For each catalyst solution, three measurements were performed and results presented as mean values. 2.2.3. The pH value changes of resin/catalyst mixtures through time
The changes of pH values of resins mixed with catalyst solutions were monitored over the period of 240 minutes. To each 35 g of neat UF resin in plastic cups catalyst solutions were added in quantities of 0.2, 0.4, 0.6, 0.8 and 1.0 % (solid content of catalyst on the solid content of resin) and mixed using glass stirring rod. Thus prepared mixtures were left undisturbed at room temperature for the stated period of time and pH values were measured using aforementioned pH meter every 30 minutes. 2.2.4. FT-IR analysis of cured UF resins
The analysis of cured resins was performed by means of Fourier transform infrared spectroscopy (FT-IR). The FT-IR spectra were obtained by direct transmission mode (KBr pellet technique) using a Shimadzu FTIR 8400 S spectrometer, in wavenumber range from 4000 to 400 cm-1. Standard 13 mm pellets were prepared by mixing 10 mg of cured resins with 300 mg of spectroscopic grade potassium bromide (KBr) and pressing under 200 bar pressure. For each cured resin three pellets were prepared and scanned and resulting spectra are presented as mean values of 30 scans in total. Such FT-IR analysis was performed for each catalyst and for each catalyst addition on naturally cured resin/catalyst mixtures prepared as described earlier (subchapter 2.2.3.). Prior to mixing with KBr, fully cured resins were grinded using IKA A10 analytic mill and sieved through 0.2 mm sieve. 3. RESULTS
3.1. Effect of catalyst content on the pH and gel time of the UF resin
The decrease in the pH value of UF resin is very quick with the initial addition of the catalyst, regardless of which catalyst is used (Figure 1). Such pH value decline can be attributed to the mechanism of UF resin curing using an ammonium sulphate based catalyst. It is a known fact that (NH4)2SO4 reacts with free formaldehyde (CH2O) forming sulphuric acid (H2SO4), water (H2O) and hexamine ((CH2)6N4) as a by-product (Equation 1).
2(NH4)2SO4 + 6CHOH → 2H2SO4 + 6H2O + (CH2)6N4 (1) The affinity between formaldehyde and ammonia during hexamine creation is so high that NH4
+ ions decompose thus liberating H+ ions. The free formaldehyde content in a low molar ration UF resins such as one used in this experiment is very limited. Therefore the insufficient addition

28th International Conference on Wood Science and Technology 2017 IMPLEMENTATION OF WOOD SCIENCE IN WOODWORKING SECTOR
54
of (NH4)2SO4 results with a low release of H2SO4 which is not enough to equalize the amount of alkalisation agent (ammonia or sodium hydroxide) present in the system. Consequently, the reaction of (NH4)2SO4 and CH2O is accelerated and the pH value decreases significantly. However, the changes in the pH values became somewhat limited with the catalyst contents rise in case of catalysts A and B (Figure 1), when the pH value of approx. 6.7 is reached. This is so due to the fact that at a certain point, no more H+ can be released because there is no more free formaldehyde to react with the catalyst (Xing et al., 2006).
Figure 1. The pH value of UF resin as dependant on catalysts type and content
Although they are quite similar, graphical representations of pH value decline in case of catalyst A and B (Figure 1) reveal that even very low addition of tartaric acid (0.25 %) caused overall pH value shift to lower values. Further increase of tartaric acid in catalyst system caused even more pronounced pH values decline (catalysts C and D). This can be explained by the increase of free H+ ions originating from tartaric acid (C4H4O6). In case of catalyst C, the increase of tartaric acid and catalyst content caused retardation of H+ release represented with slight pH value rise at 1.0 % catalyst addition. This tendency is completely different in case of catalyst D where pH value significantly and almost constantly decline with the increase of catalyst content. Such results indicate that catalyst D is much faster than others examined. However, the question of catalyst D/UF resin mixture gel time and open time (pot life) arise. As it can be seen from results presented in Table 1, UF resin gel time is severely reduced with the catalyst addition regardless of its type. The initial gel time reduction is rather dramatic as in case of all four catalysts used, the values decline from 4860 s for neat UF resin to values between 526 and 559 s regarding which catalyst was used. Although such tendency is obviously expected, the results presented in Table 1 and in Figure 1 reveal that if added to catalysts system in small quantities (up to 1 %) tartaric acid can act as a buffer. This is especially pronounced in case of catalyst B as the gel time at all catalyst additions are almost the same as those obtained for catalyst A (Table 1) and tendencies of pH value changes of those two catalysts (Figure 1) are almost the same. As for catalyst D, the buffering effect is noticed only in case of 0.4 % catalyst addition if compared to catalyst A.

28th International Conference on Wood Science and Technology 2017 IMPLEMENTATION OF WOOD SCIENCE IN WOODWORKING SECTOR
55
Table 1. UF resin gel time as effected with catalyst addition
UF resin gel time, s
Catalyst type
Catalyst content, % 0.0 0.2 0.4 0.6 0.8 1.0
A 4860 527 471 460 458 453 B 4860 559 475 462 461 459 C 4860 549 475 464 453 453 D 4860 526 489 446 455 440
The results of UF resin gel time measurement confirmed that out of four examined, catalyst
D is the fastest if added in quantities above 0.6 % and that the open time of such resin/catalyst mixture is sufficient for use in particleboard production. 3.2. The pH value changes of resin/catalyst mixtures over time
The pH values of resins catalysed using catalysts A and D monitored over 240 minutes are given in Tables 2 and 3, respectively. Table 2. The pH values changes of UF resin/catalyst A mixture over 240 minutes
Resin/catalyst mixture pH value
Time, min Catalyst content, %
0.2 0.4 0.6 0.8 1.0
30 5.68 5.77 5.97 6.10 6.26 60 5.66 5.76 5.76 5.75 5.75 90 5.37 5.45 5.51 5.54 5.47 120 5.68 5.66 5.65 5.66 5.68 150 5.42 5.41 5.49 5.49 5.35 180 5.29 5.37 5.41 5.46 5.48 210 5.17 5.27 5.31 5.30 5.27 240 5.44 5.47 5.46 5.45 5.42
Table 3. The pH values changes of UF resin/catalyst D mixture over 240 minutes
Resin/catalyst mixture pH value
Time, min Catalyst content, %
0.2 0.4 0.6 0.8 1.0
30 6.34 6.35 6.33 6.26 6.20 60 6.12 6.14 6.16 6.12 6.08 90 6.05 6.04 6.02 6.01 6.01 120 5.88 5.95 5.95 5.94 5.92 150 5.68 5.68 5.69 5.68 5.65 180 5.67 5.67 5.73 5.73 5.74 210 5.57 5.61 5.61 5.60 5.60 240 5.42 5.44 5.48 5.47 5.45
The pH values changes in case of both resin/catalyst mixtures over a prolonged period of
time are quite similar. However, it is very indicative that the pH values in case of catalyst D, excluding the values determined after 240 minutes are slightly higher than those obtained for catalyst A in given time period (Tables 2 and 3). As with the addition of tartaric acid, the

28th International Conference on Wood Science and Technology 2017 IMPLEMENTATION OF WOOD SCIENCE IN WOODWORKING SECTOR
56
number of H+ ions able to react with free formaldehyde rises, a more pronounced effect of the pH value decline is expected. If the pH values determined after 210 and 240 minutes are examined it is clearly evident that the values decline in case of catalyst D as they rise in case of catalyst A. Such results additionally confirm the buffering effect that the addition of tartaric acid has on catalyst system, somewhat retarding the pH values change for 120 minutes and then significantly lowering it after the certain time period. 3.3. FT-IR analysis of cured UF resins
The comparison of FT-IR spectra of cured UF resins catalysed with 1.0 % of catalysts A and D given in Figure 2, reveals that the chemical structure of both resins is almost the same.
Figure 2. FT-IR spectra of cured UF resins
As it can be seen from Figure 2 there is almost no difference in intensities and positions of
peaks characteristic for UF resins. More precisely peaks at 1032 cm-1 (1) assigned to C-N or NCN stretching of methylene linkages, 1131 cm-1 (2) assigned to C-O stretching of aliphatic ether, 1243 cm-1 (3) assigned to C-N and N-H stretching of tertiary amides, 1385 cm-1 (4) assigned to C-H mode in CH2 and CH3, 1650-1550 cm-1 (5) assigned to C-N stretching of secondary amine and C=O stretching of primary amide, 2960 cm-1 (6) assigned to –O–CH3 (methoxy) in aliphatic esters and 3325 cm-1 (7) assigned to O-H in urea or NH stretching of primary aliphatic amines (Osemeahon and Barminas, 2007; Šmidriaková and Lourová, 2011; Park et al., 2003). The absence of significant changes of FT-IR spectra implies that the use of tartaric acid as a part of the catalyst system did not change the chemical structure of cured UF resin. This is so probably due to the fact that tartaric acid (C4H4O6) completely reacted with the alkalisation agent present in UF resin via acid-base reaction. However, as the tartaric acid was added in relatively small quantities it would be very interesting to see would the results be the same if tartaric acid was added in larger quantities.

28th International Conference on Wood Science and Technology 2017 IMPLEMENTATION OF WOOD SCIENCE IN WOODWORKING SECTOR
57
4. CONCLUSION Based on obtained results it can be concluded that tartaric acid addition to commercial ammonium sulphate catalyst influenced the UF resin curing behaviour. At low additions (catalysts B and C) the tartaric acid caused only slight changes of resin/catalyst mixtures pH value at all contents (0.2 to 1.0 %), and with it related gel time and pot life. At 1.0 % addition (catalyst D) those changes are more prominent, and the buffering effect of tartaric acid is noted. Such results, alongside the fact that there isn’t any chemical difference between resins cured using neat and ammonium sulphate catalyst with added tartaric acid, imply the possibility of such catalyst use in industrial particleboard production. Using the catalyst with 1.0 % of tartaric acid could influence the particleboard producing companies’ productivity by shortening the board pressing time. REFERENCES Akyüz, K. C.; Nemli, G.; Baharoglu, M.; Zekoviç, E. (2010): Effects of acidity of the particles and
amount of hardener on the physical and mechanical properties of particleboard composite bonded with urea formaldehyde. International Journal of Adhesion and Adhesives 30 (4): pp. 166-169.
Antonović, A.; Jambreković, V.; Kljak, J.; Španić, N.; Medved, S. (2010): Influence of urea-formaldehyde resin modification with liquefied wood on particleboard properties. Drvna Industrija 61 (1): pp. 5-14.
Belgacem, M. N.; Gandini, A. (2003): Furan-based adhesives. In: Handbook of Adhesive Technology, Second Edition, Revised and Expanded. CRC Press, Boca Raton, 615-635.
Dongbin, F.; Jianzhang, L.; An, M. (2006): Curing characteristics of low molar ratio urea-formaldehyde resins. Journal of Adhesion and Interface 7 (4): pp. 45-52.
Jambreković, V. (2000): The influence of urea-formaldehyde resins modification with lignosulfonates on particleboard properties. Doctoral Thesis, University of Zagreb Faculty of Forestry, 1-187 [in Croatian].
Kamal, I.; Poh, K. M.; Eng, T. Y.; Ren, X. J.; Ashaari, Z.; Abood, F.; Beyer, G.; Masseat, K. (2010): Buffering capacity of fast-growing species and curing time of UF resin modified with zinc borate and monoammonium phosphate. American Journal of Applied Sciences 7 (8): 1079-1082.
Kunaver, M.; Medved, S.; Čuk, N.; Jasiukaitytȧ, E.; Poljanšek, I.; Strnad, T. (2010): Application of liquefied wood as a new particle board adhesive system. Bioresource Technology 101 (4): pp. 1361-1368.
Osemeahon, S. A.; Barminas, J. T. (2007): Study of some physical properties of urea formaldehyde and urea proparaldehyde copolymer composite for emulsion paint formulation. International Journal of Physical Sciences 2 (7): pp. 169-177.
Park, B.-D.; Kim, Y. S.; So, W. T.; Lim, K. P. (2002): Effects of reaction pH and hardener type on reactivity, properties and performance of urea-formaldehyde (UF) resins. Journal of the Korean Wood Science and Technology 30 (3): pp. 1-11.
Park, B.-D.; Kim, Y. S.; Singh, A. P.; Lim, K. P. (2003): Reactivity, chemical structure, and molecular mobility of urea-formaldehyde adhesives synthesized under different conditions using FTIR and solid state 13C CP/MAS NMR spectroscopy. Journal of Applied Polymer Science 88 (11): pp. 2677-2687.
Schneider, M. H., Chui, Y. H.; Ganev, S. B. (1996): Properties of particleboard made with a polyfurfuryl-alcohol/urea-formaldehyde adhesive. Forest Products Journal 46 (9): pp. 79-83.
Šmidriaková, M.; Lourová, M. (2011): ATR-FTIR spectral analysis of modified UF adhesive. In: Annals of Warsaw University of Life Sciences – SGGW. Forestry and Wood Technology 76: pp. 49-53.
Xing, C.; Zhang, S. Y.; Deng, J. (2004): Effect of wood acidity and catalyst on UF resin gel time. Holzforschung 58 (4): pp. 408-412.

28th International Conference on Wood Science and Technology 2017 IMPLEMENTATION OF WOOD SCIENCE IN WOODWORKING SECTOR
58

28th International Conference on Wood Science and Technology 2017 IMPLEMENTATION OF WOOD SCIENCE IN WOODWORKING SECTOR
59
Relationship between Entrepreneurial Competencies and Firm Performance: A Study on Furniture Manufacturing SMEs in Croatia
Perić, Ivana1*; Grladinović, Tomislav1; Kropivšek, Jože2; Greger, Krešimir1
1 Department of Production Organization, Faculty of Forestry, University of Zagreb, Zagreb, Croatia 2 Department of Wood Science and Technology, Biotechnical Faculty, University of Ljubljana, Ljubljana,
Slovenia *Corresponding author: [email protected]
ABSTRACT
In this paper, we investigate the relationship between entrepreneurial competencies and the success of SMEs performance using data obtained from furniture manufacturing SMEs in Croatia. Regarding the theoretical background and previous related research, the fact is that entrepreneurial competencies are central determinants that lead towards to the success of the overall business, especially in case of SMEs who have lack of financial resources, skills, technology, and knowledge. In this paper, we report on the results of this study. The implications, contributions, and limitations of this study, as well as directions for further research, will also be discussed. Keywords: SMEs, Entrepreneurial competencies, Furniture manufacturing, Business success 1. INTRODUCTION
The last decades, government and business have been part of a far-reaching economic transformation, made possible by remarkable advances in information, communication and transport technologies. Advances in technology and an enabling policy environment have allowed businesses to internationalize their operations across multiple locations in order to increase efficiency, reduce costs and speed up production. Businesses today look to add value in production where it makes the most sense to do so; indeed, this has become a key element of corporate competitiveness (Elms & Low, 2013). On the other hand, traditional “production functions” focus on labour, capital, materials, and energy; knowledge and technology are external influences on production. Now analytical approaches are being developed so that knowledge can be included more directly in production functions. Investments in knowledge can increase the productive capacity of the other factors of production as well as transform them into new products and processes. And since these knowledge investments are characterized by increasing (rather than decreasing) returns, they are the key to long-term economic growth (OECD, 1996).
Analysing the business sector in Croatia, Small and medium enterprises (SMEs)1 are the backbone of the economy, and their importance is recognized in particular through the share in employment, total revenues, and exports. In 2015, there were 106,221 micro, small and medium enterprises (99.7% of the total number of registered enterprises) operating in Croatia (CEPOR, 2017). Profile of furniture manufacturing industry (FMI) or called it „resource base and traditional industry“ is the same. 98,76% of the total number of registered enterprises belong to the classification of SMEs, according to the available data of Croatian Chamber of Economy (HGK, 2017)2, mainly lead by one manager, and by the owners’ structure private (Perić et al., 2017).
1Criteria for classification of entities in the small and medium enterprise sector in Croatia are defined by the Accounting Act (Official Gazette NN 109/07, 54/13) and the Small Business Development promotion Act (Official Gazette, NN 29/02, 63/07, 53/12, 56/13). 2 Selected parametar- all active enterprises listed by the National clacification of sector, by sector C31 (Manufacture of furniture). SEMs divided by size: micro (1-10 employees), small (11-50 employees) and medium-sized (51-250 employees).

28th International Conference on Wood Science and Technology 2017 IMPLEMENTATION OF WOOD SCIENCE IN WOODWORKING SECTOR
60
FMI in Croatia is facing various challenges and issues such as business customers pressure associated with the implementation of FSC (high certification costs) (Klarić et al., 2016), insufficient skilled labour force, competition from global market especially from producers from Asia, the low capability to meet the requirements of globalization standards and the lack of management skills and expertise (Pric Barčić et al., 2016). To be competitive (explicitly the manufacturing sector who is an industry that is driven by knowledge and technology) on the global market they have to be innovative in all aspects of the business. For this purpose, enterprises need to manage their resources and processes more efficiently than their competitors can (Singh & Garg, 2007). According to Ajitabh & Momaya (2004), to improve the efficiency of various processes, initiatives have to be taken by top management. As Sánchez (2012) mentioned the behavioural, psychological, and demographic characteristics of entrepreneurs are usually the most influential factors in the performance of small and medium-sized enterprises. Management can enhance the flexibility of operations and reduce risks by pursuing creative workforce policies. This is particularly valuable to SMEs that cannot withstand huge fluctuations in market demand (Singh & Garg, 2007). Studies of entrepreneurial competencies by group of author Thompson, Stuard and Lindsay (1997) as cited by Ahmad et al. (2017) showed that competencies found to be important at the early stage of development SMEs include foresight and strategic planning, flexibility (ability to change), having a focused mind, drive and dedication, communication skills, initiative flair, ability to create a good profit margin, global awareness, and an ability to motivate others. Further, a study by Sanchez (1996) showed that it is important to have top management support, the widespread practice of personal training, promoting early worker participation, the choice of suppliers based on technical expertise and the experience. Assessing the business success of enterprises, according to different approach it can be measured from financial and non-financial dimensions of organizational performance, taking into account that both approaches have their own advantages and disadvantages.
As already mentioned, most of the FMI in Croatia are led by a single owner-manager which has highlighted the importance of considering the role of entrepreneurs for the business success of SMEs. The aim of this study was to define the profile of observed SMEs. Further to determine whether there is a connection between entrepreneurial competencies and firm performance non-financial dimensions of organizational performance within SMEs in Croatian furniture industry. 2. RESEARCH METHODOLOGY
The framework of the present study was tested with the use of a developed questionnaire on a sample of Croatian furniture manufacturing enterprises, made by Perić (2015). The initial target population was taken from the Register of Business Entities supervised by Croatian Chamber of Commerce. The list included all active SMEs according to their core business activities - C 31 - furniture manufacturing, based on National Classification of Activities (2007).
Postal surveys and mail surveys were approaches used in this study. The design of the questionnaire for this research required a variety of measures and items. The items have been collected and adapted from different sources. Open questions and the five-point Likert scale was used for some of the measurement of included variables (1 = “strongly disagree” to 5 = “strongly agree”) or (1 = ”very unimportant” to 5 = ”very important”). Only 68 usable questionnaires, under selected criteria, were returned.
Data from the survey questionnaire were submitted to the database in Microsoft Office Excel 2016. The database was used to record properly completed questionnaires and to store all respondents who responded to the survey questionnaire. Statistical data analysis was performed using the IBM SPSS Statistics Desktop for Trial statistical program (IBM, 2017). A total of 34 items were used to measure the study’s independent variable (firm performance) and

28th International Conference on Wood Science and Technology 2017 IMPLEMENTATION OF WOOD SCIENCE IN WOODWORKING SECTOR
61
entrepreneurial competencies. For analysing data, descriptive (to present quantitative descriptions) and inferential statistical methods (determining interconnection) were used. The data was checked for model assumptions of normality, linearity, independence of error, and homogeneity of variance.
3. RESULTS
3.1. Profile of furniture manufacturing SMEs in Croatia
According to the results obtained, a total number of usable survey received from SMEs was 68. Results showed that enterprises headquarters were mostly located in the large urban areas (population up to 500,000 people) of Northwest of Croatia. More precisely, City of Zagreb and Zagreb County (44,2% of respondents). 98,5 of respondent SMEs were Croatian and privately-owned furniture manufacturing enterprises. Observing establishment year, the oldest SMEs was established in while the youngest one was in 2013. The companies are private owned and are lead by one manager. Half of (50,0%) of questioned enterprises belong to a group that has between 1 to 10 employees, 32,4% of them to have from 11-50 employees and 17,6% between 51 and 250. Looking the demographic structure 70,1% of total employees were a man and 29,9% women. Analysing the educational structure of the surveyed companies, more than average of all respondents (63,7%) reported to employee people with secondary education and 25,1% with no education or primary education.
3.2. Entrepreneur’s competencies
Part of the questions was related to the entrepreneur's professional qualification, working experience in the wood processing industry and working experience in current SMEs. Results showed that entrepreneurs have mostly working experience between 10 to 20 and more than 21 years (35,3% and 39,7 %). The respondents generally had worked in current SMEs for between 5 and 9 years (33,8%), 22,1 percent from 10 to 19 years. The same result was for 2-4 and more than 20 years of service (20,6% of responders). Question regarding the entrepreneurial competencies of the companies were measured with the 10 variables shown in Table 1. The sample has a normal distribution, as assessed by Shapiro-Wilks test (p > 0,05). In order to understand whether the questions in this questionnaire all reliably measure the same latent variable (feeling of safety) (so that a Likert scale could be constructed), a Cronbach's alpha was run. All measures showed good levels of internal consistency with Cronbach’s alpha 0,809. Table 1. Entrepreneurial competencies (n=68)
Variables Mean Std. Deviation Analytical planning competencies 3,90 0,883 Financial management skills 4,10 0,813 Teamwork competency 4,06 0,790 Human resources management 3,78 0,808 Marketing competency 3,32 1,029 Communication skills (foreign languages) 3,53 1,072 Quality management 3,97 0,914 Innovation competency 4,16 0,857 Network competency 3,79 1,030 Leadership competency 3,91 0,910 (W= 0,985; p= 0,0597)
By observing leadership competencies, (Table 1) all 10 elements were rated with relatively high scores. The main factors were: innovation competency (M = 4,16; SD ± 0,857), financial management skills (M = 4,10; SD ± 0,813) and teamwork competency (M = 4,06; SD ± 0,790).

28th International Conference on Wood Science and Technology 2017 IMPLEMENTATION OF WOOD SCIENCE IN WOODWORKING SECTOR
62
But, on the other hand, the lowest rating was obtained for factors such as marketing competency (3,53) and communication skills (knowing a foreign language). 3.3. Business performance
Questions regarding the business performance of the companies were divided into three groups namely: operational performance (M = 4,1; SD ± 0,70), market performance indicators (M = 3,12; SD ± 0,65), customers' business performance (M = 4,06; SD ± 0,64) (total 24variables). As mentioned, the five-point Likert scale was used to measure performance. The reliability test was used to ensure the consistency or stability of the items. All measures showed good levels of internal consistency with Cronbach’s alpha values above 0,80 (Table 2).
Table 2. The reliability test of business performance of SMEs (n=68)
Indicators Cronbach's
Alpha Cronbach's Alpha Based on Standardized Items
N of Items
Operational performance 0,926 0,931 9 Market performance indicators 0,823 0,819 10 Customers' business performance
0,901 0,902 5
3.4. The impact of entrepreneur’s competencies on business performance
The aim of this research was to establish the connection between leadership competencies and individual non-financial performance of the furniture manufacturing company. So, to determine whether if there is a connection, correlation analysis was done (Table 3). These results demonstrate that there has been a significantly positive correlation (Pearson's coefficient of correlation r = 0,449) between entrepreneurial competencies and operational performance. Further, at a confidence level of 99%, entrepreneurial competencies have been shown to be significantly positively related to market performance indicator (r = 0,295), and customers' business performance (r = 0,280).
Table 3. Correlation matrix
** Correlation is significant at the 0.01 level (2-tailed). * Correlation is significant at the 0.05 level (2-tailed). 4. DISCUSSION AND CONCLUSION
In this present study 50,0% of the respondents have a business with <10 employees, with
secondary education, and according to classification, belong to the small and medium-sized enterprises. To be competitive in the global market, companies, especially in SMEs, have to be innovative in all areas of business, which gives particular emphasis to the importance of entrepreneurial competencies (as results showed, all SMEs are led by single manager). The aim of this research was to determinate entrepreneurial competencies (EC) relying on previous research done by Ahmad et al. (2017), Perić (2015), Sánchez (2012), Thompson et al., (1997) and Tehseen & Ramayah (2015) and who highlight EC as an important factor for a business
Operational performance
Market performance
indicators
Customers' business
performance
Entrepreneurial
competencies
Pearson Correlation 0,449** 0,295* 0,280*
Sig. (2-tailed) 0,000 0,015 0,021
N 68 68 68
28th International Conference on Wood Science and Technology 2017 IMPLEMENTATION OF WOOD SCIENCE IN WOODWORKING SECTOR
63
success. According to the Singh & Garg (2007), these factors should be structured to find out the factors that are a prerequisite to the success and which facilitate the achievement of others. Based on the data obtained from the quantitative survey and its evaluation, it is possible to state that at present SMEs find it important to concentrate on innovation and knowledge. The highest scores, according to respondents' ratings were for variables like innovation competency, financial management skills, teamwork competency and quality management. Observing the other factors like marketing competency and communication skills, they should be improved. To be competitive, they need to know the factors that may significantly enhance their competitiveness. Furthermore, empirical investigation confirms the role entrepreneurial competencies in fostering a positive business success. This all implies the conclusion, to create a better system within furniture manufacturing SMEs, especially in a small market as the Republic of Croatia is, that the existence of professional and educated top management in the enterprise is necessary for building and maintaining market success and for achieving better production systems. REFERENCES Ahmad N.; Suseno Y.; Seet PS.; Susomrith P.; Rashid Z. (2017): Entrepreneurial Competencies
and Firm Performance in Emerging Economies: A Study of Women Entrepreneurs in Malaysia. Knowledge, Learning and Innovation. Contributions to Management Science., pp. 5-26.
Ajitabh, A.; Momaya, K. S. (2004): Competitiveness of firms: review of theory, frameworks and models. Singapore Management Review, 26(1), pp. 45-61.
CEPOR (2017): Small and Medium Enterprises Report: Croatia − 2016, Zagreb: CEPOR – SMEs and Entrepreneurship Policy Center.
Elms, D. K.; Low, P. (2013): Global value chains in a changing world. Geneva: WTO Publications, World Trade Organization.
Klarić, K.; Greger, K.; Klarić, M.; Andrić, T.; Hitka, M.; Kropivšek, J. (2016): An Exploratory Assessment of FSC Chain of Custody Certification Benefits in Croatian Wood Industry. Drvna industrija, 67 (3), pp. 241-248.
OECD (1996): The Knowledge-Based Economy. Paris: OCDE/GD(96)102. Perić, I., (2015): Assessment of Factors of Competitiveness in Furniture Manufacturing Enterprises.
Zagreb: University of Zagreb, Faculty of Forestry, Ph.D. thesis. Perić, I.; Debelić, A.; Grladinović, T. (2017): Enterprise Resource Planning: Case Study of Croatian
Wood Processing Companies. Prag, WoodEMA, i.a., pp. 212-218. Pric Barčić, A.; Motik, D.; Oblak, L.; Vlosky, R. (2016): Management Activity Linkages to Innovation
Deconstruction: An Exploratory Study of the Furniture Industry in Croatia. BioResources, 11(2), pp. 3987-4005.
Sánchez, J. (2012): The influence of entrepreneurial competencies on small firm performance. Revista Latinoamericana de Psicología, 44(4), pp. 165-177.
Singh, R. K.; Garg, S. K. (2007): Interpretive structural modelling of factors for improving competitiveness of SMEs. International Journal of Productivity and Quality Management, 4 (2), pp. 422-439.
Tehseen, S.; Ramayah, T. (2015): Entrepreneurial Competencies and SMEs Business Success: The Contingent Role of External Integration. Mediterranean Journal of Social Sciences, 1 (6), pp. 50-61.
Thompson, J., Stuart, R.; Lindsay, P. (1997). The competence of top team members: A framework for successful performance. Team Performance Management, 3 (2), pp. 57-75.
HGK (2017) URL: http://www.biznet.hr/

28th International Conference on Wood Science and Technology 2017 IMPLEMENTATION OF WOOD SCIENCE IN WOODWORKING SECTOR
64

28th International Conference on Wood Science and Technology 2017 IMPLEMENTATION OF WOOD SCIENCE IN WOODWORKING SECTOR
65
Identification of Diagnostic Anatomical Features in Ten Species of Sapindales Occurring in the Brazilian Amazon
Chipaia, Fabiana1; Urbinati, Claudia2; Dos Santos, Patricia1; Reis, Alisson1
1Forest Engineering, Federal University of Pará, Altamira, Brazil 2Forest Engineering, State University of Pará, Altamira, Brazil
ABSTRACT
Sapindales is one of the largest orders of angiosperms in terms of number of genera and species, comprising about 15 families and 5400 species, most of which belong to the families Rutaceae and Sapindaceae. Therefore, studies that investigate their anatomical structure are undoubtedly useful tools for wood identification, in addition to facilitating the correct use of nomenclature. The objective of this study was to identify the anatomical features of 10 species of wood belonging to four families of the order Sapindales, which present paratracheal parenchyma, non-stratified rays, and predominantly solitary pores with simple perforation plates as general features, and axial parenchyma as the main feature to identify and distinguish the species within the order. Key words: Anatomical features, Parenchyma, Wood Identification. 1. INTRODUCTION
According to Cronquist (1988), Sapindales is one of the largest orders of angiosperms interms of number of genera and species, comprising about 15 families and 5400 species, most of which belong to the families Rutaceae and Sapindaceae. He also states that the order Sapindales is a natural group, characterized by the presence of woody plants with compound or fissured leaves, haplostemonous or diplostemonous flowers with a well-developed nectariferous disk, and syncarpousovary with 1–2 ovules in each locule. These features are not exclusive, as they also occur in the order Rosales. However, they do not occur together, except in some species of Cunoniaceae (SouzaandLorenzi, 2012). Cronquist considered the families Staphyleaceae and Zygophyllaceous peripheral, as they are atypical for having more than 2 ovules per locule; therefore, the author suggested that these families are related to the orders Rosales and Geraniales, respectively.
Based on molecular data, Judd et al. (2009) consider the order Sapindales monophyletic because of the synapomorphy of pinnately compound leaves (occasionally becoming trifoliate or unifoliate palmately compound leaves), and flowers with an evident nectariferous disk. They are woody plants, presenting alternate spiral leaves without stipules, and small tetramerous or pentamerous flowers with overlapping perianth segments. Technological and phylogenetic developments have influenced studies since the 1990s. These studies are based on molecular data, with the aim of organizing the order, as in the studies by Gadek et al. (1996), Muellner et al. (2007), and Muellner et al. (2010), among others. Studies on wood morphological and anatomical features are becoming scarce, although they can foster the organization and systematization of vegetal groups. Holden (1912) described and systematized some species of the order Sapindales based on leaf and wood anatomical features. Several studies have been undertaken the task of systematizing vegetal groups, such as Silva et al. (2014), based on the wood anatomical features of family Leguminosae, Oliveira et al. (2014), based on the leaf anatomical data of seedlings of family Leguminosae, and Luna (2013), based on leaf anatomical features of Stylogyne (Primulaceae).
Studies on wood anatomy are undoubtedly useful tools for the identification of wood, in addition to facilitating the correct use of nomenclature. However, correct identification depends

28th International Conference on Wood Science and Technology 2017 IMPLEMENTATION OF WOOD SCIENCE IN WOODWORKING SECTOR
66
on the training, knowledge, and ability of the researchers. It is also worth noting that scientific names should be used together with corresponding popular names, as wood has a variety of popular commercial names (Zenid, 2007).
The objective of this study was to identify the anatomical features of 10 species of wood belonging to four families of the order Sapindales, so as to contribute to the scientific knowledge and facilitate the classification and systematization of this order.
2. MATERIAL AND METHODS
Samples for the study were obtained from the Walter Engler wood library at the Emílio Goeldi Museum. All the samples were botanically identified and incorporated into the João Murça Pires herbarium. This study was developed at the Wood Technology Laboratory, Forestry Engineering School, Federal University of Pará, Altamira campus. Table 1 List of species studied
Family Scientific name Vernacular name Anacardiaceae Anacardium giganteum W. Hancock ex Engl. Cajuaçu and caju-da-mata
Anacardium sp. Cajueiro (cashew tree) Tapirira guianensis Aubl. Tapiririca Spondias mombin L. Cajazeira
Meliaceae Carapa guianensis Aubl. Andiroba Cedrela fissilis Vell Cedro (cedar) Cedrela odorata L. Cedro-rosa (pink cedar)
Rutaceae Fagara acreana K. Krause Tamanqueira Sapindaceae Allophylus edulis Radlk Crila
Sapindus saponaria L. Jequitig
2.1 Macroscopic description
Macroscopic description of wood structure was performed following the norms set by Coradin and Muñiz (1992). Test specimens were obtained from wood samples, measuring approximately 2 cm each in transverse, tangential longitudinal, and radial longitudinal sections. Anatomical description was performed using a Reichert slide microtome, where transverse, tangential longitudinal, and radial longitudinal sections were leveled. A textile magnifier (10× magnification) was used to visualize the anatomical structures. 2.2 Microscopic description
Test specimens of the 10 species of Sapindales were immersed and boiled in water to soften, and then fixed in the slide microtome to obtain thin histological sections (15–20 µm thick) of the 3 sections, which were subsequently clarified (bleach), washed (distilled water), dehydrated (alcohol 50%), stained (hydro-alcoholic safranin), dehydrated (alcohol series 70%–100%, acetate and alcohol 1:1 n-Butyl acetate), selected, and mounted on a glass slide with Canada balsam.
For the maceration process, wood segments were transferred to test tubes with distilled water, and subsequently to test tubes with a macerating solution (glacial acetic acid and hydrogen peroxide 120 vol.), which were then kept in an oven at 60 °C for 24 h. The samples were finally drained and washed in running water. To study the morphology and evaluate dimensions, cells dissociated from the wood were stained with safranin, mounted on semi-permanent glass slides with glycerin, and visualized under a LEICA microscope coupled with a SONY video camera and an image analysis system using Visilog 5.1 software. The microscopic structure of the wood species was described according to Iawa (1989).

28th International Conference on Wood Science and Technology 2017 IMPLEMENTATION OF WOOD SCIENCE IN WOODWORKING SECTOR
67
2.3 Photographic documentation
Macroscopic photographic documentation was obtained by observing the transverse surface of the specimen, using a magnifying glass. Microscopic photographic documentation was obtained using a photomicroscope, or through image capture using the digital analysis system. 3. RESULTS
3.1. Family Anacardiaceae
3.1.1. Anacardium giganteum W. Hancock ex Engl
Macroscopic Characteristics (Figure 1A): Indistinct growth layers. Diffuse pores visible to the naked eye, undefined arrangement, predominantly solitary, absent content, simple perforation plate, rectilinear vascular lines in tangential section. Paratracheal vasicentric axial parenchyma visible to the naked eye, sometimes aliform with short borders. Non-stratified rays visible only under a 10× lens in transverse section, and to the naked eye in tangential section, absent radial secretory canals, poorly contrasted mirror in radial section.
Microscopic Characteristics (Figure 2A, 3A, and 4A): Indistinct growth layers. Diffuse vessels, undefined arrangement, predominantly solitary, predominant circular outline, simple perforation plates, alternate intervessel pitting, absent bordered pitting, distinctly bordered vessel-ray pitting, similar to intervessel pitting in size and shape in ray cells. Fibers with simple non-septate pitting. Paratracheal vasicentric axial parenchyma, sometimes aliform with short borders, with 3–4 cells per series. Uniseriate rays, two different sizes, non-stratified ray body constituted of upright or square cells.
3.1.2. Anacardiumsp.
Macroscopic Characteristics (Figure 1B): Indistinct growth layers. Diffuse pores visible to the naked eye, undefined arrangement, predominantly solitary, simple perforation plate, irregular vascular lines in tangential section. Aliform axial parenchyma visible only under 10× lens, lozenge-aliform, sometimes confluent. Non-stratified rays visible only under a 10× lens in transverse section, and to the naked eye in tangential section, poorly contrasted in radial section.
Microscopic Characteristics (Figure 2B, 3B, and 4B): Indistinct growth layers. Diffuse vessels, undefined arrangement, predominantly solitary, predominant circular outline, simple perforation plates, alternate intervessel pitting, distinctly bordered vessel-ray pitting, similar to intervessel pitting in size and shape in ray cells. Fibers with simple or reduced bordered pitting, non-septate. Aliform paratracheal axial parenchyma, angular extension, sometimes confluent, with 3–4 cells per series. Non-stratified rays, 1–3 cells wide, two different sizes, ray body consisting of procumbent, square, and upright cells interspersed along the ray, presence of aggregate rays.
3.1.3. Tapirira guianensis Aubl.
Macroscopic Characteristics (Figure 1C): Slightly distinct growth layers, individualized by darker transverse fibrous areas. Diffuse pores visible only under 10× lens, undefined arrangement, predominantly solitary, irregular vascular lines in tangential section. Scarcevasicentric paratracheal axial parenchyma visible only under 10× lens. Non-stratified rays visible only under 10× magnification lens in transverse and tangential sections, linear mean frequency 11 rays per mm, poorly contrasted mirror in radial section.

28th International Conference on Wood Science and Technology 2017 IMPLEMENTATION OF WOOD SCIENCE IN WOODWORKING SECTOR
68
Microscopic Characteristics (Figure 2C, 3C, and 4C): Slightly distinct growth layers, individualized by darker transverse fibrous zones. Diffuse vessels, undefined arrangement, predominantly solitary, predominant oval outline, simple perforation plates, alternate intervessel pitting, vessel-ray pitting with well-reduced to apparently simple borders, round pitting. Fibers with simple septate pitting. Scarce vasicentric paratracheal axial parenchyma with 5–8 cells per series. Wider rays, predominantly with 4–10 cells, aggregated, ray body consisting of procumbent cells, with a row of non-stratified square and/or upright marginal cells; presence of surrounding cells. Presence of prismatic crystals in the square and/or upright ray cells.
3.1.4. Spondias mombin L.
Macroscopic Characteristics (Figure 1D): Indistinct growth layers. Diffuse pores visible to the naked eye, undefined arrangement, predominantly solitary, absent content, simple perforation plate, rectilinear vascular lines in tangential section. Aliform paratracheal axial parenchyma visible only under 10× lens, angular extension, sometimes confluent. Non-stratified rays visible to the naked eye in transverse and tangential sections, contrasted mirror in radial section.
Microscopic features (Figure 2D, 3D, and 4D): Indistinct growth layers. Diffuse vessels, undefined arrangement, predominantly solitary, predominant circular outline, simple perforation plates, alternate intervessel pitting, distinctly bordered vessel-ray pitting, similar to intervessel pitting in size and shape in ray cells. Fiber with simple, non-septate pitting. Aliform paratracheal axial parenchyma, angular extension, sometimes confluent, with 3–4 cells per series. Rays 1–3 cells wide, two different sizes, ray body consisting of procumbent cells, with a row of non-stratified square and/or upright marginal cells. Presence of prismatic crystals in axial parenchyma cell chambers.
3.2. Family Meliaceae
3.2.1. Carapa guianensis Aubl.
Macroscopic Characteristics (Figure 1E): Indistinct growth layers. Diffuse pores visible to the naked eye, undefined arrangement, predominantly solitary, absent content, simple perforation plate, rectilinear vascular lines in tangential section. Marginal vasicentric paratracheal axial parenchyma visible only under 10× lens. Non-stratified rays visible only under 10× lens in transverse section, and visible to the naked eye in tangential section, contrasted mirror in radial section. Presence of axial secretory canals.
Microscopic Characteristics (Figure 2E, 3E, and 4E): Indistinct growth layers. Diffuse vessels, undefined arrangement, predominantly solitary, circular outline, simple perforation plate, alternate intervessel pitting, distinctly bordered vessel-ray pitting, similar to intervessel pitting in size and shape. Fibers with simple non-septate pitting. Vasicentric paratracheal axial parenchyma with 3–4 cells per series. Non-stratified rays with 1–3 cells, ray body consisting of procumbent cells with a row of square and/or upright marginal cells, two different sizes. Presence of axial intercellular canals in long tangential lines. Presence of prismatic crystals in axial parenchyma cells.
3.2.2. Cedrela fissilis Vell.
Macroscopic Characteristics (Figure 1F): Indistinct growth layers. Diffuse pores visible to the naked eye, undefined arrangement, predominantly solitary, simple perforation plate, irregular vascular lines in tangential section. Marginal axial parenchyma visible to the naked eye. Non-stratified rays visible to the naked eye in transverse section, and only under 10× lens in tangential section, poorly contrasted mirror in radial section.

28th International Conference on Wood Science and Technology 2017 IMPLEMENTATION OF WOOD SCIENCE IN WOODWORKING SECTOR
69
Microscopic Characteristics (Figure 2F, 3F, and 4F): Indistinct growth layers. Diffuse vessels, undefined arrangement, predominantly, circular outline, simple perforation plate, alternate intervessel pitting, distinctly bordered vessel-raypitting, similar to intervessel pitting in size and shape. Fibers with simple non-septate pitting. Vasicentric paratracheal axial parenchyma with 3–4 cells per series. Non-stratified rays with 1–3 cells, ray body consisting of procumbent cells with a row of square and/or upright marginal cells, two different sizes. Presence of axial intercellular canals in long tangential lines. Presence of prismatic crystals in axial parenchyma cells.
3.2.3. Cedrela odorata L.
Macroscopic Characteristics (Figure 1G): Distinct growth layers, individualized by marginal parenchyma. Diffuse pores visible only under 10× lens, undefined arrangement, predominantly multiple of 2, simple perforation plate, irregular vascular lines in tangential section. Aliform paratracheal axial parenchyma visible only under 10× lens in marginal bands, angular extension, sometimes confluent. Non-stratified rays visible to the naked eye in transverse and tangential sections, contrasted mirror in radial section. Presence of axial secretory canals. Microscopic Characteristics (Figure 2G, 3G, and 4G): Distinct growth layers, individualized by marginal parenchyma. Diffuse vessels, undefined arrangement, predominantly multiple of 2, circular outline, simple perforation plate, alternate intervessel pitting, distinctly bordered vessel-raypitting, similar to intervessel pitting in size and shape. Fibers with simple or reduced bordered pitting, non-septate. Aliform paratracheal axial parenchyma in marginal bands, angular extension, sometimes confluent, with 3–4 cells per series. Wider non-stratified rays with 4-10 cells, two different sizes, ray body consisting of procumbent cells with a row of square and/or upright marginal cells; presence of aggregate rays and surround cells. Presence of prismatic crystals in axial parenchyma cells.
3.3. Family Rutaceae
3.3.1. Fagara acreana K. Krause
Macroscopic Characteristics (Figure 1H): Slightly distinct growth layers, individualized by marginal parenchyma. Diffuse pores visible only under 10× lens, undefined arrangement, predominantly multiple of 2, single perforation plate, rectilinear vascular lines in tangential section. Marginal axial parenchyma visible to the naked eye. Non-stratified rays visible to the naked eye in transverse and tangential sections, contrasted mirror in radial section.
Microscopic Characteristics (Figure 2H, 3H, and 4H): Slightly distinct growth layers, individualized by marginal parenchyma. Diffuse vessels, undefined arrangement, predominantly multiple of 2 or more, circular outline, simple perforation plate, alternate intervessel pitting, distinctly bordered vessel-ray pitting similar to intervessel pitting in size and shape. Fibers with simple non-septate pitting. Marginal axial parenchyma, with 3–4 cells per series. Non-stratified rays with 1–3 cells, two different sizes, ray body consisting of procumbent cells with 2–4 rows of square and/or upright marginal cells. Presence of prismatic crystals in square and/or upright ray cells. 3.4. Family Sapindaceae
3.4.1. Allophylus edulis Radlk.
Macroscopic characteristics (Figure 1I): Distinct growth layers, individualized by darker transverse fibrous zones. Diffuse pores visible only under 10× lens, undefined arrangement, predominantly solitary, simple perforation plate, irregular vascular lines in tangential section. Axial parenchyma visible to the naked eye in narrow bands. Non-stratified rays, visible only

28th International Conference on Wood Science and Technology 2017 IMPLEMENTATION OF WOOD SCIENCE IN WOODWORKING SECTOR
70
under 10× lens in transverse section, and to the naked eye in tangential section, contrasted mirror in radial section.
Microscopic characteristics (Figure 2I, 3I, and 4I): Distinct growth layers individualized by darker transverse fibrous zones. Diffuse vases, undefined arrangement, predominantly solitary, circular outline, simple perforation plate, alternate intervessel pitting, distinctly bordered vessel-ray pitting, similar to intervessel pitting in size and shape. Fibers with simple non-septate pitting. Axial parenchyma in narrow bands, with 3–4 cells per series. Non-stratified rays with 1–3 cells, two different sizes, ray body consisting of procumbent cells with 2–4 rows of square and/or upright marginal cells, presence of aggregate rays. Presence of prismatic crystals in fiber chambers. 3.4.2. Sapindus saponaria L.
Macroscopic Characteristics (Figure 1J): Indistinct growth layers. Diffuse pores visible to the naked eye, undefined arrangement, predominantly solitary, simple perforation plate, rectilinear vascular lines in tangential section. Axial parenchyma in narrow bands, visible to the naked eye. Non-stratified rays visible only under 10× lens in transverse and tangential sections, poorly contrasted mirror in radial section.
Microscopic Characteristics (2J, 3J, and 4J): Indistinct growth layers. Diffuse vessels, undefined arrangement, predominantly solitary, circular outline, simple perforation plate, alternate intervessel pitting, distinctly bordered vessel-ray pitting, similar to intervessel pitting in size and shape. Fibers with simple non-septate pitting. Axial parenchyma in narrow bands, with 3–4 cells per series. Non-stratified rays with 1–3 cells, two different sizes, ray body consisting of all procumbent cells.
MACROSCOPIC ANATOMIC IDENTIFICATION KEY 1. Vasicentric paratracheal axial parenchyma ............................................................. 2 1.1. Axial parenchyma in bands .................................................................................. 4 1.2. Marginal parenchyma ........................................................................................... 6 1.3. Aliform axial parenchyma .................................................................................... 7 2. Poorlycontrastedrays ............................................................................................... 3 2.1. Contrasted rays ................... .....................................................Carapa guianensis 3. Rectilinear vascular lines ....... .....................................................Tapirira guianensis 3.1. Irregular vascular lines ....... ............................................... Anacardium giganteum 4. Indistinct growth layers ........................................................................................... 5 4.1. Distinct growth layers ........ ....................................................... Allophyllus edulis 5. Rectilinear vascular lines ....... .....................................................Sapindus saponaria 5.1. Irregular vascular lines ....... ............................................................ Cedrela fissilis 6. Rectilinear vascular lines ....... .......................................................... Fagara acreana 6.1. Irregular vascular lines ....... .......................................................... Cedrela odorata 7. Poorlycontrastedrays ............ ............................................................ Anacardium sp. 7.1 Contrasted ............................ ....................................................... Spondias mombin

28th International Conference on Wood Science and Technology 2017 IMPLEMENTATION OF WOOD SCIENCE IN WOODWORKING SECTOR
71
Figure 1. Macroscopic aspects in transverse sections: A – Anacardium giganteum W. Hancock ex Engl., B – Anacardium sp., C – Tapirira guianensis Aubl., D – Spondias mombin L., E – Carapa guianensis Aubl., F –
Cedrela fissilis Vell., G – Cedrela odorata L., H - Fagara acreana K. Krause., I – Allophylus edulis Radlk, J – Sapindus saponaria L.

28th International Conference on Wood Science and Technology 2017 IMPLEMENTATION OF WOOD SCIENCE IN WOODWORKING SECTOR
72
Figure 2. Microscopic aspects in transverse sections: A – Anacardium giganteum W. Hancock ex Engl., B – Anacardium sp., C – Tapirira guianensis Aubl., D – Spondias mombin L., E – Carapa guianensis Aubl., F –
Cedrela fissilis Vell., G – Cedrela odorata L., H - Fagara acreana K. Krause., I – Allophylus edulis Radlk, J – Sapindus saponaria L.

28th International Conference on Wood Science and Technology 2017 IMPLEMENTATION OF WOOD SCIENCE IN WOODWORKING SECTOR
73
Figure 3. Microscopic aspects in tangential sections: A – Anacardium giganteum W. Hancock ex Engl., B – Anacardium sp., C – Tapirira guianensis Aubl., D – Spondias mombin L., E – Carapa guianensis Aubl., F –
Cedrela fissilis Vell., G – Cedrela odorata L., H - Fagara acreana K. Krause., I – Allophylus edulis Radlk,J – Sapindus saponaria L.

28th International Conference on Wood Science and Technology 2017 IMPLEMENTATION OF WOOD SCIENCE IN WOODWORKING SECTOR
74
Figure 4. Microscopic aspects in radial sections:A – Anacardium giganteum W. Hancock ex Engl., B – Anacardium sp., C – Tapirira guianensis Aubl., D – Spondias mombin L., E – Carapa guianensis Aubl., F –
Cedrela fissilis Vell., G – Cedrela odorata L., H - Fagara acreana K. Krause., I – Allophylus edulis Radlk,J – Sapindus saponaria L.
4. DISCUSSION Family Anacardiaceae presented indistinct growth layers as a general feature for species
Anacardium giganteum W. Hancock ex Engl, Anacardium sp., Tapirira guianensis Aubl., and Spondias mombin L. SpeciesA. giganteumand T. guianensis presented vasicentric paratracheal parenchyma, whereas Anacardium sp. and Spondias mombin presented aliform parenchyma with angular extension. As for rays and pores, the species presented non-stratified rays, and diffuse pores, which were predominantly solitary.

28th International Conference on Wood Science and Technology 2017 IMPLEMENTATION OF WOOD SCIENCE IN WOODWORKING SECTOR
75
Cury (2001), who studied Schinus terebinthifolius and Astronium graveolens, found axial parenchyma invisible to the naked eye and of diffuse porosity with few thin pores. A study by Silva et al. (2013) on Astronium lecointei found scarce vasicentric paratracheal axial parenchyma, groups of predominantly solitary vessels, and growth layers individualized by darker tangential fibrous zones. Reis et al. (2014) found vasicentric parenchyma and slightly distinct layers in Astronium lecointei.
Family Meliaceae presented indistinct growth layers for species Carapa guianensis Aubl. and Cedrela fissilis Vell. Cedrela odorata L. presented distinct growth layers. Species C. guianensis presented vasicentric paratracheal parenchyma, C. fissilis presented parenchyma in broad bands, and C. odorata presented parenchyma in bands similar to the marginal paratracheal parenchyma of angular extension. As for rays and pores, the species presented non-stratified rays and diffuse pores, predominantly solitary for C. guianensis and C. fissilis, and multiple for C. odorata.
A study by Nisgoski et al. (2003) on Swietenia sp., Entandrophragma sp., Carapa sp., and Cedrela sp. found marginal growth layers, marginal parenchyma, stratified and non-stratified rays, and solitary and multiple vessels. These results differ from our findings with respect to the parenchyma and growth layers, while the findings about rays and pores are consistent with this study.
A similar result was reported by Marochi (2007), who studied cedar wood anatomy and found growth layers demarcated by bands of marginal axial parenchyma, semi-porous rings, and larger semi-porous vessels, predominantly solitary to multiple. Similar results were also found by Alves et al. (2012), who found vasicentric paratracheal axial parenchyma and bands, growth layers individualized by marginal parenchyma, and semi-porous rings.
Fagara acreana K. Krause presented slightly distinct growth layers, marginal parenchyma, non-stratified rays, and predominantly multiple pores as general wood features.
Different results were reported by Alves et al. (2012) for Euxylophora paraensis Huber, where the authors found growth layers individualized by darker tangential fibrous zones, diffuse porosity, and invisible axial parenchyma. A study by Darosci and Paulilo (2012) onRaulinoa echinata R. S. Cowan presented distinct growth layers, and scarce vasicentric and aliform confluent paratracheal parenchyma, differing from the results found for F. acreana in this study.
A study by Cury (2001) on Zanthoxylum Rhoifolium found growth layers individualized by darker tangential fibrous zones, and diffuse porosity, predominantly solitary and multiple.
Allophylus edulis Radlk presented distinct growth layers, whereas Sapindus saponaria L. presented indistinct growth layers as general wood features. As for parenchyma, both species presented parenchyma in narrow bands, non-stratified rays, and predominantly solitary pores.
Different results were obtained by Siegloch et al. (2013) in a study with Allophylus guaraniticus (St.-HiI.) Radlk (family Sapindaceae), who reported scarce paratracheal parenchyma and heterogeneous rays. An anatomical study by Tamaio (2011)on family Sapindaceae, genus Serjania, found diffuse porosity and scarce paratracheal axial parenchyma.
5. CONCLUSION The order Sapindales presented paratracheal parenchyma, non-stratified rays, and
predominantly solitary pores with simple perforation plates as general features among the families.
Based on the set of anatomical features, it is possible to identify and distinguish the wood of the studied species using the axial parenchyma as a criterion.
The species of family Anacardiaceae presented vasicentric and aliform paratracheal parenchyma of angular extension, diffuse vessels, and fibers with simple or reduced bordered pitting.

28th International Conference on Wood Science and Technology 2017 IMPLEMENTATION OF WOOD SCIENCE IN WOODWORKING SECTOR
76
The species of family Meliaceae presented vasicentric paratracheal parenchyma, in broad bands and in bands similar to the marginal paratracheal parenchyma of angular extension, with diffuse vessels and fibers with simple or reduced bordered pitting.
The species of family Rutaceae presented marginal parenchyma, diffuse vessels, and fibers with simple or reduced bordered pitting.
The species of family Sapindaceae presented parenchyma in narrow bands, diffuse vessels, and non-stratified rays with 1–3 cells in two different sizes.
REFERENCES
Alves, R. C.; Oliveira, J. T. S.; Motta, J. P.; Paes, J. B.(2012): Caracterização Anatômica Macroscópica de Madeiras Folhosas Comercializadas no Estado do Espírito Santo. Floresta e Ambiente, 19(3): pp. 352-361.
Coradin, V.T.R.& Muniz, G.I.B.: (1992): Normas para procedimentos em estudos de anatomia de madeira: I. angiosperma, II. gimnosperma. Brasília: 19 p. (Série Técnica,15).
Cronquist, A. (1988): The evolution and classification of flowering plants.2ª edición. New York Botanical Garden, Bronx.
Cury, G. (2001): Descrição da Estrutura anatômica do lenho e sua aplicação na identificação de espécies arbóreas do cerrado e da Mata Atlântica do Estado de São Paulo. Dissertação (Mestrado) Escola Superior de Agricultura Luiz de Queiroz – ESALQ/USP.
Darosci, A. A.; Paulilo, M. T. S. (2012): Anatomia do lenho de Raulinoa echinata R. S. Cowan (Rutaceae). Uma espécie endêmica. Revista do Instituto Florestal, 24(2): pp. 189-199.
Gadek, P. A.; Fernando, E. S.; Quinn, C. J.; Hoot, A. B.; Terrazas, T.; Sheahan, M. C.; Chase, M. W. (1996): Sapindales: Molecular Delimitation and Infraordinal Groups. American Journal of Botany.
Holden, R. (1912): Some Features in the Anatomy of the Sapindales. Botanical Gazette Vol. 53, No. 1. Jan.
Iawa Committee. (1989) List of microscope features for hardwood identification. IAWA Bull. New Ser.,10(3): pp. 234-332.
Judd, W.S.; Campbell, C.S.; Kellogg, E.A.; Stevens, P.F.& Donoghue, M.J. (2009): Sistemática vegetal: um enfoque filogenético. 3a ed. Artmed, Porto Alegre.612p.
Luna, B. N de.; Carrijo, T. T.; Freitas, M de F.; Barros, C. F. (2013): Comparative leaf anatomy of neotropical Stylogyn especies (Myrsinoideae – Primulaceae). Rodriguésia, 64(4): pp. 717-726.
Marochi, C. I. (2007): Anéis Anuais de Crescimento do Cedro (CedrelaFissilis - Meliaceae) Aplicados a Avaliação da Taxa de Crescimento e Dendroclimatologia. Tese(Pós-Graduação em Engenharia Florestal), Universidade Federal do Paraná. Curitiba.
Muellner, A. N.; Vassiliades, D. D.; Renner, S. S. (2007): Placing Bieber steiniaceae, a herbaceous clade of Sapindales, in a temporal and geographic contexto. Plant Systematics and Evolucion.
Muellner, A. N.; Pennington, T. D.; Koecke, A. V.; Renner, S. S. (2010): Biogeography of Cedrela (Meliaceae, Sapindales) in Central and South America. American Journal of Botany. New York, 511-518.
Nisgoski, S.; Muniz, G. I. B de.; Ceccantini, G. (2003): Caracterização Anatômica Macroscópica das Madeiras Utilizadas para Laminação na Região de Curitiba-PR. Scientia Agraria, 4(1-2): pp.47-52.
Oliveira, J. H. G de.; Iwazaki, M. C.; Oliveira, D. M. T. (2014): Morfologia de plantulas, anatomia e venação dos cotiledones e eofilos de três espécies de Mimosa (Fabaceae, Mimosoideae). Rodriguésia 65(3): pp. 701-710.
Pirani, J. R.. (2014): Sapindales: filogenia e diversificação na região neotropical. Instituto de Biociências (IB). Universidade de São Paulo (USP).01 de outubro de 2014. Disponivel em:<http://www.bv.fapesp.br/pt/auxilios/87172/sapindales-filogenia-e-diversificacao-na-regiao-neotropical>. Acessado em: 07 de dezembro de 2014.
Reis, L. P.; Reis, A. R. S.; Carvalho, J. C.; Silva, E. F. R da.; Silva, J. R. (2014): Caracterização anatômica de madeiras comercializadas como perna-manca nas estâncias de Altamira-pa. Enciclopédia Biosfera, Centro Científico Conhecer - Goiânia, 10 (19): pp. 463-479

28th International Conference on Wood Science and Technology 2017 IMPLEMENTATION OF WOOD SCIENCE IN WOODWORKING SECTOR
77
Siegloch, A. M.; Marchiori, J. N. C.; Santos, S. R dos (2013): Anatomia do lenho de allophylus guaraniticus (st.-hil.) Radlk. (sapindaceae). Balduinia. n. 39, pp. 19-23.
Silva, K. S.; Souza, M. J. C.; Scheidegger, S. R. R. R.; Silva, G. R.; Albuquerque, A. R.; Rego, V. C. (2013): Estudo Anatômico Macroscópico de Espécies Nativas Exploradas Comercialmente dentro do Estado Do Pará. In: II Simpósio de Estudos e Pesquisas em Ciências Ambientais na Amazônia, Belém.
Silva, E. F. R.; Reis, A. R. S.; Carvalho, J. C.; Lisboa, P. L. B.; Urbinati, C. V. (2014) Anatomia sistemática do lenho de espécies de fabaceae. Enciclopédia Biosfera, v. 10, n. 19, p. 128-155.
Souza, V.C. & Lorenzi, H. (2012): Botânica Sistemática: Guia Ilustrado para identificação das famílias de Fanerógamas nativas e exóticas no Brasil, baseado em APG III. 3ª ed. Nova Odessa-SP: Instituto Plantarum. 768.
Zenid, G. J. (2007): Madeiras e suas características. In: Oliveira, J. T. S.; Fiedler, N. C Nogueira M, editores. Tecnologias aplicadas ao setor madeireiro. Jerônimo Monteiro: Suprema; 2007.
Tamaio, N. (2011): Caracterização anatômica das madeiras de lianas de Sapindaceae utilizadas comercialmente em São Paulo - SP. Cerne, v. 17, n. 4, p. 533-540, out/dez. 2011. Disponível em http://www.scielo.br/pdf/cerne/v17n4/v17n4a12.pdf.

28th International Conference on Wood Science and Technology 2017 IMPLEMENTATION OF WOOD SCIENCE IN WOODWORKING SECTOR
78

28th International Conference on Wood Science and Technology 2017 IMPLEMENTATION OF WOOD SCIENCE IN WOODWORKING SECTOR
79
Optimization of Juglans sp. Wood Processing from Sustainable Plantations' Thinning, Wood Profitability and Final Product Quality
Urbán Martínez, I.1*, Gutiérrez Tejón, E.1, Santaclara Estévez, O.2, Merlo Sánchez, E.2
1 BOSQUES NATURALES. Departamento de I+D+i. Avenida de la Vega 1. Edificio 3 - Planta baja 28108 Alcobendas. Madrid, Spain
2 MADERA PLUS CALIDAD FORESTAL S.L. Parque Tecnológico de Galicia, Rúa de Vigo nº 2, 32901. San Cibrao das Viñas. Ourense
*Corresponding author: [email protected]
ABSTRACT It has been evaluated the wood processing of walnut small logs from sustainable plantations thinning. Also, the suitability of this wood for different solid products, such as veneer flooring or jointed boards, has been considered. Moreover, it has been analyzed the optimum sawing schemes for the use of small diameter logs, the drying curves, and the staining process. Furthermore, it has been defined, the final profitability for different products, as well as the products' quality. The work has been done with wood from clonal and seed material of Juglans sp, obtained from the thinning of different plantations. The wood has been characterized by growth and form parameters, and by sonic methodology from the standing tree and logs. All plantations are managed in a sustainable way by the company Bosques Naturales S.A., pioneer in Spain of planted forests to obtain hardwood quality wood. Key words: Walnut plantation, Small diameter logs, Staining process, Wood quality, Wood processing, Wood products.

28th International Conference on Wood Science and Technology 2017 IMPLEMENTATION OF WOOD SCIENCE IN WOODWORKING SECTOR
80

28th International Conference on Wood Science and Technology 2017 IMPLEMENTATION OF WOOD SCIENCE IN WOODWORKING SECTOR
81
Analysis of the Raw Material Properties in the Agro-wood Pellets Production
Šafran, Branimir1*; Jug, Matija1 ; Radmanović, Kristijan1; Đukić, Igor1; Kramar, Daniel;
Beljo Lučić, Ružica1; Risović, Stjepan1 1 Department of Processes Engineering, Faculty of Forestry, University of Zagreb, Zagreb, Croatia
*Corresponding author: [email protected]
ABSTRACT
The production of fuel pellets from biomass has become a significant economic activity in the world. Energy from biomass has multiple environmental benefits in comparison to other fuels, while its use requires minimal modifications of the system used in the combustion of fossil fuels. The increase of the production capacity influences the increase of the need for biomass. Great potential apart from wood lies in agricultural biomass. Agricultural residues have certain drawbacks that could be expressed as increased ash content and the difficulty pelleting process. One of the solutions for these problems is mixing agricultural and wood material. This paper analyzes eight types of agricultural residues in certain proportions mixed with fir wood biomass. Mixtures are formed in order to produce pellets of quality grade EN B which allows 3 % of ash content in the fuel. Moisture and ash content were determined for every mixture and the results were analyzed. Since in some mixtures is determined ash content which exceeded the limit value of 3 %, adjustments of proportions were made. According to the results of the ash content analysis and available amounts of biomass, it was selected optimum mixture (the share of fir-wood biomass was 70 % and of corn stem 30 %). The selected mixture was used for agro-wood pellets production using a small press with a horizontal die. Produced pellets were tested for determined properties according to EN ISO 17225-1: 2014. Key words: Biomass, Agro-wood pellets, Moisture content, Ash content, Calorific value 1. INTRODUCTION
Nowadays, the environment protection and the use of natural and renewable materials is of great importance. Similarly is in the area of energy production, where more and more importance gets renewable energy sources. Demand for renewable energy sources in Europe is constantly growing. This is certainly influenced by the rise of fossil fuel prices, but also of environmental protection laws and an increase in awareness of the need to use clean energy sources. There exist more types of renewable energy sources such as wind, water, sun, and biomass. The main advantage of biomass use in regard to fossil fuels is lower emissions of harmful gases and waste materials. Atmospheric burden of CO2 by using biomass is negligible due to CO2 storage in biomass by their growth. Biomass and fossil fuel combustion emissions of CO2 are not significantly different. Renewable biomass in the form of newly planted crops that are renewed in very short time cycles ensures the return of CO2 to land instead in the atmosphere (Labudović, 2012). There is a lot of talk in media about the potential of biomass as an energy source in Croatia due to great capacity in this area. In biomass, we count various residuals of wood in the wood processing industry, the remains of wood-harvesting in forests and the remains of one year plants that remain in agricultural production. Apart from the fact that biomass supplies energy, the waste, and residues from agriculture, forestry and wood processing (Jurišić et al., 2016) are also disposed of in an ecologically acceptable way. Wood and wood residuals as a source of energy are most promoted and used because of certain advantages and simplicity in exploitation and processing (Šafran, 2015). Agricultural residues can also be used efficiently, but compared to wood agricultural biomass has some drawbacks. This is the case for ash and mechanical properties that are mainly worse than for wood biomass

28th International Conference on Wood Science and Technology 2017 IMPLEMENTATION OF WOOD SCIENCE IN WOODWORKING SECTOR
82
(Stelte et al., 2011a). As an energy source wood and wood residues can be used as split wood, wood chips, wood briquettes and wood pellets. The easiest use and best utilization of wood biomass is achieved by using wood pellets. Today, the use of biomass for energy production is promoted by a respected principle of sustainable development. The most commonly used is wood and agricultural mass that is created as a byproduct or waste and residues that can only be used for energy purposes. Such biomass is used as fuel in electricity and heat generation plants (Stelte et al., 2013) or is processed into gaseous and liquid fuels for use in vehicles and households.
The basic properties of biomass as an energy source are same for all fuels: chemical composition, calorific value, fuel self-ignition temperature, combustion temperature, physical properties that affect the fuel quality (eg. density, moisture content, etc.). The basic value for energy calculation from a certain amount of biomass is its calorific value. The greatest influence on calorific value has the moisture content, then chemical composition, density, and health of biomass. In the case of wood biomass, the collection of biomass can take place almost through the whole year. Harvesting of agricultural biomass takes place in shorter time periods and are determined solely by the completion of harvesting and collection of agricultural products. Biomass collection is not necessary immediately after harvesting, but the quality of biomass gradually decreases with time, so it is advisable to do it with a small time interval from harvest. Of course, the problem of collecting is also related to the problem of storing the agricultural residue.
There are various assessments of the biomass potentials and its role in global energy policy in the future. In all scenarios, it is anticipated its significant growth and more important role. The increased need for biomass is permanent and its sustainable use will only be possible with the assumption of an increase in the raw material base. It could be significantly increased by the combined use of wood and agricultural biomass, especially in countries with limited forest potential (Stelte et al., 2011b). 2. MATERIALS AND METHODS
The raw material used in this paper (Figure 1.) was the fir wood biomass (Abies alba Mill.), corn stalk and corn cob (Zea mays), rye straw (Secale cereale), barley straw (Hordeum Vulgare), wheat straw (Triticum avestum), triticale straw, rapeseed straw (Brassica napus), and miscanthus (Miscanthus giganteus) as a representative of fast growing grass. The fir biomass is collected at a local sawmill and is shredded, chopped and dried. Raw materials of all straw were collected from agricultural areas after harvest in the same year, as well as corn stalk and corn cob, while miscanthus (Chinese grass) was collected from experimental area at the Faculty of Agriculture in Zagreb.
Figure 1. Samples used in experiment

28th International Conference on Wood Science and Technology 2017 IMPLEMENTATION OF WOOD SCIENCE IN WOODWORKING SECTOR
83
According to the Area Situation Report (2012.), Croatia has almost 2.7 million ha of farmland (2.695.037 hectares) and has 0.63 ha of agricultural and 0.45 ha of cultivable land per capita. So, Croatia is relatively rich with agricultural land. According to the Croatian Statistical Yearbook for the year 2014. in period 2007. - 2013., the used agricultural area was about 1.3 million ha. In 2014 when ARKOD system was introduced, it was registered 1.03 million ha of agricultural area. The processed fields were 823.929,82 ha. From the above data, it could be concluded that there is a huge potential for significant agricultural production, but also the potential for energy production from the harvested residues. The residues amount can be roughly approximated with the harvest index. The usual harvest index for wheat and barley is 1.5 and for corn and oats 1.0. With the yield of 5 t/ha of wheat, the yield of wheat straw can be calculated and amounts 7.5 t/ha, with corn yield of 10 t/ha equal is the amount of harvested residues. By corn production, the ratio of corn stalk and cob is 82:18 %. It is recommended that 30-50 % of the residue is ploughed to the ground, thus preventing impoverishment and soil deterioration. Table 1. and 2. show the planted surface and the total yield of cultures analyzed in this paper. By ploughing of 50 % of harvested residue, Croatia still has enormous potential in exploiting the harvested residues in energy purpose. By ploughing of 50 % of the corn residue potential according to data from 2015, it would still be 1.7 million tons, and wheat potential 1.12 million tons.
Table 1. Harvested areas in hectars, Republic Croatia 2011.-2015. (http://www.dzs.hr/)
2011. 2012. 2013. 2014. 2015.
1. Wheat 149.797 186.949 204.506 156.139 140.986
2. Rye 871 846 1.019 1.373 1.093
3. Barley 48.318 56.905 53.796 46.160 43.700
4. Corn 305.130 299.161 288.365 252.567 263.970
5. Tritical 9.951 13.039 14.087 16.855 13.972
6. Rapeseed 17.563 9.893 17.972 23.122 21.977
Table 2. Production of arable land crops in tons, Republic Croatia 2011.-2015. (http://www.dzs.hr/)
2011. 2012. 2013. 2014. 2015.
1. Wheat 773.415 991.740 990.286 641.765 750.294
2. Rye 1.737 1.620 1.409 2.258 2.518
3. Barley 184.949 223.296 191.033 168.487 183.185
4. Corn 1.726.688 1.290.970 1.865.960 2.031.517 1.700.953
5. Tritical 33.690 52.244 46.016 59.640 51.957
6. Rapeseed 49.367 26.406 47.827 71.176 56.780
2.1. Sample preparation
Collected samples of fir wood, straw, corn, corn cob, and miscanthus are grinded on the mill with knives (model Retsch SM 300) using square mash with openings 4.00 mm. The rotation frequency of the knife was 1500 min-1. Grinded samples of raw materials were stored in plastic containers and used for further analysis.
2.2. Determination of moisture content according to HRN EN ISO 18134-3:2015 Prepared empty dishes with a lid stored in the desiccator are weighted on an analytical
balance with a precision of 0.1 mg. The grained and prepared sample ≈ 1 g is added to the empty dish and the mass of the sample is recorded. The grained sample should be uniformly distributed inside the dish (0.2 g / cm2). Open dish with the sample and the lid beside are dried in a drying oven to a constant mass (change in mass does not exceed 0.1 mg in the time of 60 minutes),

28th International Conference on Wood Science and Technology 2017 IMPLEMENTATION OF WOOD SCIENCE IN WOODWORKING SECTOR
84
and the total drying time usually takes 2 - 3 hours. When sample drying is finished it is necessary to cover the dish with a lid and move it to the desiccator to cool to room temperature. After the cooling is completed, the dish and the sample are weighted to 0.1 mg accuracy. Because of the relatively small granulation of biofuel sample and the great hygroscopicity, it is important to weigh samples quickly.
To measure moisture content Mad expressed as a percentage of mass we use the following equation (1): ��� =
(�2 −�3)
(�2 −�1)· 100 (1)
m1 – vessel mass with lid, g m2 – vessel mass with lid and sample before drying, g m3 - vessel mass with lid and sample after drying, g 2.3. Determination of ash content according to HRN EN ISO 18122:2015
Determination of ash content was performed by annealing samples in the muffle furnace Nabertherm L9 / 13 / B180 according to HRN EN ISO 18122: 2015. Empty dishes are weighted on an analytical balance to determine the initial mass and grained samples of 1 g are added. The sample must be evenly distributed to the dish. Prepared samples are moved to a cold muffle furnace where the heating process begins. The heating begins with a uniform raising of the temperature up to 250 °C for 30 minutes. The achieved temperature is maintained for the next 60 min to evaporate the volatile compounds. After 60 min temperature increases to 550 ± 10 °C, i.e. start of sample ashing for the next 30 min. The reached temperature is kept for the next 120 min. At the end of the process, the dishes are removed from the furnace and partially cooled for 5 minutes and then moved to the desiccator and cooled to room temperature. After cooling the dishes, the final mass is used to calculate the ash content.
Ash content is determined according to equation (2): �d =(�3 −�1)
(�2 −�1)∙ 100 ∙ 100
100 −�ad (2)
Ad – ash content % m1 – vessel mass g m2 – vessel and sample mass before annealing g m3 – vessel and sample mass after annealing, g mu – sample mass, g Mad – moisture content, % 2.4. Determining calorific value according to HRN EN ISO 18125:2017
Determination of calorific value takes place in 2 phases. The first is a preparation of samples by compressing “tablets” of the minimum weight 1 ± 0.1 g. The 13 mm diameter tablets are pressed by force of 40 kN with the hydraulic press and metal mold. During the pressing, force is retained about 10 seconds.
The second phase is the measurement of the higher calorific values measured by the calorimeter IKA C200. The basic parts of calorimeter are calorimeter bomb, calorimeter vessel, mixer and temperature sensor. Testing begins with the preparation of a calorimeter bomb (Figure 2). The cellulose thread is used for the ignition of the tablet. The thread is fastened to the platinum wire connected to the electrode on the bomb cap and during alignment, it must be in contact with the sample. After preparation, the bomb is closed with a lid, filled with 99.5 % pure oxygen at a pressure of 3 MPa. Calorimeter bomb moves then in a calorimeter and a tank is filled with water. Water temperature needs to be 18 - 25 °C to determine the temperature change during combustion of the sample. Before starting the test, the calorimeter cap closes and

28th International Conference on Wood Science and Technology 2017 IMPLEMENTATION OF WOOD SCIENCE IN WOODWORKING SECTOR
85
inserts pre-weighed sample mass (tablet) on the digital display of the device. The measurement takes about 15 minutes and takes place in 3 substages:
1. substage – mixing and water temperature stabilization 2. substage – ignition and combustion 3. substage – water temperature equalization and displaying the
results At the end of the measurement, the calorific value is displayed on the device display.
Figure 2. Preparation of a calorimeter bomb
2.5. Production of fuel pellets and their analysis
For pellet production in this research, small pellet press with a horizontal die was used. Power of electrical engine was 7.5 kW, and used press in pellet production was press for private domestic use. The press was set for the production of wood pellets from the carpentry workshop residues and there was no change or correction of the pressing parameters. The pellet press didn’t have the equipment to control temperature or the pressing pressure. After the completion of the production of fir pellets and agro-wood fir and corn stalk pellets, produced pellets were tested for properties according to EN ISO 17225-1: 2014. Tested properties were dimensions according to (HRN EN ISO 17829:2015), density, bulk density (HRN EN ISO 17828:2016), mechanical durability (HRN EN ISO 17831-1:2016), moisture content (HRN EN ISO 18134-3:2015), ash content (HRN EN ISO 18122:2015) and calorific value (HRN EN ISO 18125: 2017). Quality parameters of produced pellets were tested according to stated standards except for density parameter which was carried out as a ratio of mass and volume. Mass was measured on a laboratory scale with accuracy 0,1 mg Sartorius Talent TE214S-OCE and volume was determined after digital caliper measurement of dimensions of produced pellets on Mitutoyo Absolute Series 500.
3. RESULTS
The measurement results (Table 3) show small deviations in the moisture content of all collected samples and they fulfill all the criteria for further processing and production of agro-wood pellets. The fir wood residuals collected at the local sawmill has an optimal moisture content. It can also have a high moisture content ranging from 10 to 200 %, so it will be essential

28th International Conference on Wood Science and Technology 2017 IMPLEMENTATION OF WOOD SCIENCE IN WOODWORKING SECTOR
86
to dry the sawmill residues when using it. A similar situation is with the collection of corn stalk and miscanthus that are collected in late autumn and winter and their moisture content is also disadvantageous. The best situation is by collecting straw in the summer months and their moisture content is around 10 % what is ideal for the production of agro-pellets. Research and pelleting of the fibrous material in practice has shown that optimal moisture content must range from 8 to 12 % (Sokhansanj et al., 2011). The main problem remains the need for a large storage capacity to remove residues from the field after harvesting. By leaving straw on the field it grows mildew and fungi and with the atmospheric impact, the straw loses on quality and quantity. Table 3. Results of moisture content, ash content and calorific value of analyzed samples
Nr. Sample
Moisture
content
(%)
Higher calorific
value of the
sample (J/g)
Higher calorific value of
the sample expressed in 0
% moisture content (J/g)
Ash content
(%)
1 fir - wood 10.04 18.568 20.640 0.40
2 corn cob 11.86 17.346 19.680 1.65
3 miscanthus 8.29 18.108 19.744 2.37
4 tritical - straw 8.65 17.609 19.276 3.24
5 rye - straw 8.36 17.403 18.990 3.77
6 barley - straw 9.44 16.751 18.497 7.03
7 corn stalk 8.79 16.248 17.813 7.43
8 wheat - straw 9.58 16.684 18.451 7.65
9 rapeseed - straw 11.01 16.155 18.153 8.80
The higher calorific value was measured for all types of raw materials and according to the
known moisture content, it was calculated a calorific value for the dry state of the samples. From the data in Table 3, it can be seen that the fir raw biomass has the highest calorific value, slightly lower calorific value has corn cob and miscanthus. All cereal straws have similar calorific value and the smallest calorific value have rapeseed straw and corn stalk. According to Quirin et al. (2004), the higher calorific value of 258 wood species ranges from 16.04 to 22.29 MJ / kg, so the obtained raw material values are satisfactory for the production of energy agro-wood pellets. It is also possible to increase the calorific value by thermal modification, but the process requires additional equipment and analysis. According to Calonega et al. (2016) by thermal wood modification at 180 ºC, they reached an increase in calorific value ranging from 3.7 to 6.8 %, which wasn’t significant increase. Similar results are shown by Felfti et al. (2005) and they conclude that a significant increase in calorific value is achieved by thermal modification at temperatures above 250 ºC.
The data from Table 3 and Figure 3 show the ash content of the analyzed samples showing a high content of ash in rapeseed straw samples also wheat and barley straw and corn stalk have high ash content. Miscanthus and corn cob have an optimal ash content while fir wood residues have very small amount of ash at about 0.4 %. Fir wood was selected as the primary raw material in this research. It is known that the calorific value of the raw material affects the ash content. With each 1 % ash content the calorific value decreases by 0.2 MJ / kg (Cassida et al., 2005). Furthermore, raw and inorganic elements (alkali) produced by combustion of biomass can create serious problems by deposition in the flue gas system and corrosion (Monti et al., 2008).
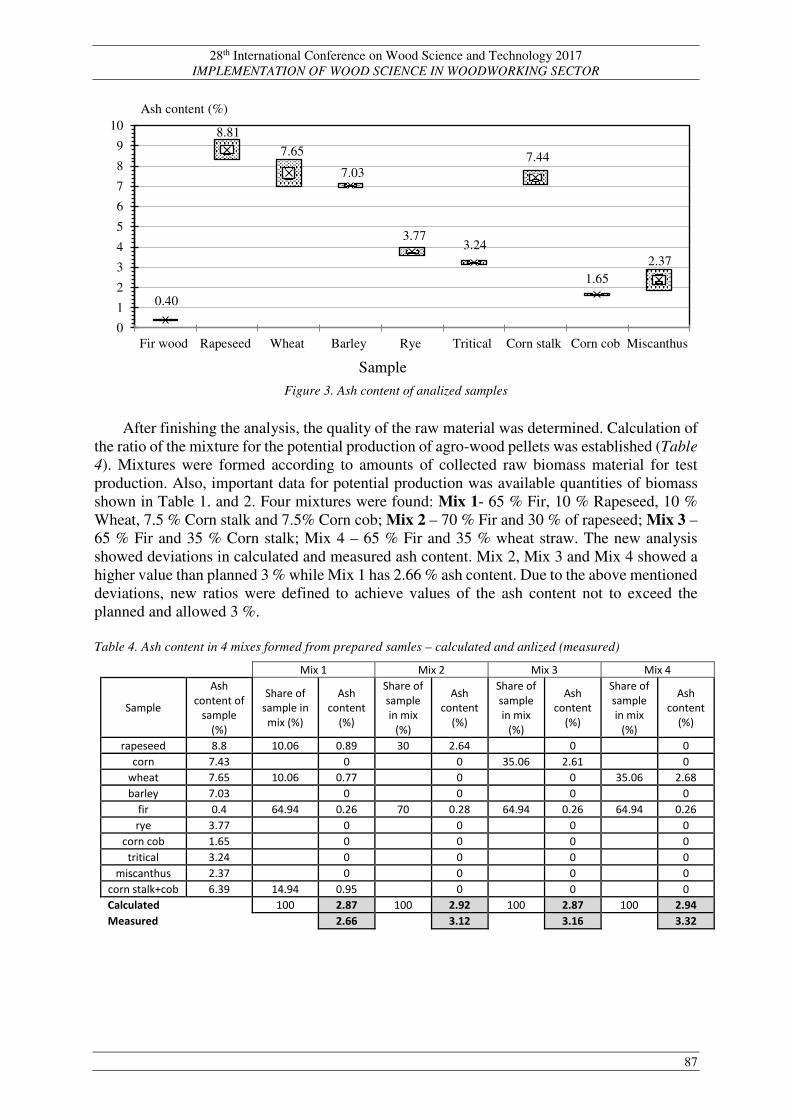
28th International Conference on Wood Science and Technology 2017 IMPLEMENTATION OF WOOD SCIENCE IN WOODWORKING SECTOR
87
Figure 3. Ash content of analized samples
After finishing the analysis, the quality of the raw material was determined. Calculation of the ratio of the mixture for the potential production of agro-wood pellets was established (Table 4). Mixtures were formed according to amounts of collected raw biomass material for test production. Also, important data for potential production was available quantities of biomass shown in Table 1. and 2. Four mixtures were found: Mix 1- 65 % Fir, 10 % Rapeseed, 10 % Wheat, 7.5 % Corn stalk and 7.5% Corn cob; Mix 2 – 70 % Fir and 30 % of rapeseed; Mix 3 – 65 % Fir and 35 % Corn stalk; Mix 4 – 65 % Fir and 35 % wheat straw. The new analysis showed deviations in calculated and measured ash content. Mix 2, Mix 3 and Mix 4 showed a higher value than planned 3 % while Mix 1 has 2.66 % ash content. Due to the above mentioned deviations, new ratios were defined to achieve values of the ash content not to exceed the planned and allowed 3 %. Table 4. Ash content in 4 mixes formed from prepared samles – calculated and anlized (measured)
Mix 1 Mix 2 Mix 3 Mix 4
Sample
Ash
content of
sample
(%)
Share of
sample in
mix (%)
Ash
content
(%)
Share of
sample
in mix
(%)
Ash
content
(%)
Share of
sample
in mix
(%)
Ash
content
(%)
Share of
sample
in mix
(%)
Ash
content
(%)
rapeseed 8.8 10.06 0.89 30 2.64 0 0
corn 7.43 0 0 35.06 2.61 0
wheat 7.65 10.06 0.77 0 0 35.06 2.68
barley 7.03 0 0 0 0
fir 0.4 64.94 0.26 70 0.28 64.94 0.26 64.94 0.26
rye 3.77 0 0 0 0
corn cob 1.65 0 0 0 0
tritical 3.24 0 0 0 0
miscanthus 2.37 0 0 0 0
corn stalk+cob 6.39 14.94 0.95 0 0 0
Calculated 100 2.87 100 2.92 100 2.87 100 2.94
Measured 2.66 3.12 3.16 3.32
0.40
8.81
7.65
7.03
3.773.24
7.44
1.652.37
0
1
2
3
4
5
6
7
8
9
10
Fir wood Rapeseed Wheat Barley Rye Tritical Corn stalk Corn cob Miscanthus
Sample
Ash content (%)

28th International Conference on Wood Science and Technology 2017 IMPLEMENTATION OF WOOD SCIENCE IN WOODWORKING SECTOR
88
Table 5. Ash content in 4 mixes with corrected shares – calculated and analized (measured)
Mix 1 Mix 2 Mix 3 Mix 4
Sample
Ash
content of
sample
(%)
Share of
sample in
mix (%)
Ash
content
(%)
Share of
sample
in mix
(%)
Ash
content
(%)
Share of
sample
in mix
(%)
Ash
content
(%)
Share of
sample in
mix (%)
Ash
content
(%)
rapeseed 8.8 8 0.7 25 2.2 0 0
corn 7.43 12 0.89 0 30 2.23 0
wheat 7.65 10 0.76 0 0 30 2.29
barley 7.03 0 0 0 0
fir 0.4 67 0.27 75 0.3 70 0.28 70 0.28
rye 3.77 0 0 0 0
corn cob 1.65 3 0.05 0 0 0
tritical 3.24 0 0 0 0
miscanthus 2,37 0 0 0 0
corn stalk+cob 6.39 0 0 0 0
Calculated 100 2.68 100 2.50 100 2.51 100 2.58
Measured 2.79 2.58 2.92 2.79
For four mixtures it was defined new ratios to achieve the best results of the total ash
content. The ratios of individual raw materials in the new compositions were: Mix 1- 67 % Fir, 12 % Corn stalk, 10 % Wheat straw, 8 % Rapeseed straw, 3 % Corn cob; Mix 2 – 75 % Fir and 25 % Rapeseed straw; Mix 3 – 70 % Fir and 30 % Corn stalk; Mix 4 – 70 % Fir i 30 % Wheat straw. For new-formed mixtures it was repeated determination of ash content and difference between the measured and the calculated ash content is shown in Table 5. All mixtures match the planned ash content. The deviations from the calculated and measured ash contents can be attributed to the non-homogeneous composition of the raw materials, which is logical because some parts of the plant also have differences in the ash content (Monti et. al., 2008.).
Because of the corn stove material which is in Croatia in large quantities and has no usable value nor in animal husbandry nor in any other production, it was decided to produce pellets of Mix 3. Produced pellets were tested regarded to HRN EN ISO standard 17225-1 and results should show if they fulfilled quality criteria for use in the household. For comparison (control) will be also produced pellets of fir wood.
Test results of produced pellets are shown in Table 6. Pellets produced from fir wood biomass and a mixture of fir wood and corn stalk biomass (Mix 3) fulfilled the dimensions and enter to category D06 (diameter 6 mm ± 1.0 mm and length 3.15 mm < L ≤ 40). The density of the pellets is not specified by the standard but was carried out for comparison of the produced pellets. The data of the density has shown a smaller value in the Mix 3 pellets, whereby the fir pellets have 0.1 g / cm3 higher density of pellets from Mix 3 raw material. The result is logical because of the poor binding of the corn stove particles in the pellet, which also confirms the larger diameter of the Mix 3 pellets. The pellets from both materials were produced on the same device with equal pressing settings and on the same pellet die. From the results, it is clear that pellets from Mix 3 material have grater expansion by emerging from the die. The pellet density is relatively low, and the manufacturer's recommendation is 1.2 to 1.3 g / cm3 (Nielsen et al., 2010). The density of Mix 3 pellets does not fulfill the recommendation results because the measured density is 1.04 g / cm3.
Density is closely related to the results of bulk density and mechanical durability. The bulk density of the produced pellets is also insufficient and should be greater than 550 kg / m3, while it is 514.96 kg / m3 for the fir pellets and 490.76 for the Mix 3 pellets. The pellets also have a low mechanical durability of 95,56 % for fir pellets and 94.88 for mix 3 pellets. The results of mechanical durability for pellets should be greater than 97.5 %. Ash content from the results confirms a good ratio of fir and corn stalk in the Mix 3 and is below 3 % ash. The ash content in fir pellets has increased slightly. This is possible because part of the used material was not unbarked, but the result of 0.86 % was acceptable, even though it was more than twice of the

28th International Conference on Wood Science and Technology 2017 IMPLEMENTATION OF WOOD SCIENCE IN WOODWORKING SECTOR
89
initial 0.4 %. The moisture content of the mix 3 was 13.33 % and it is the result of the preparation of raw material for the pelletizing process, whereby the mixture of fir and corn stalk is added about 4.5 % water. Water is added to the raw material preparation due to fiber activation and is an important factor in the biomass compression process because it facilitates the formation of hydrogen bonds in the cellular wall. Dry biomass acts as a thermal insulator and prevents heat transfer between the particles. Water in the pelletizing process partially evaporates due to the high temperature that develops due to friction. The temperature in the die channel during pelletizing usually ranges 110 - 140 °C. Biomass consists of cellulose, hemicelluloses, proteins, lignin, fibers, and ash. Among the mentioned components, lignin has a low melting point at about 140 °C. When biomass is heated, softens and obtains thermoplastic properties (van Dam et al., 2004). With temperature and humidity, the most important influence in the pelletizing process has the pressing pressure. Higher density material creates higher resistance by pressing and requires higher pressures for the same degree of pellet compactness (Mani, 2006). The moisture content, pressing time and the water addition of raw material are the main determinants of pellet quality and energy consumption in the pelletizing process (Gilpin, 2002). Drying of raw material and pressing are the most energy demanding operations in pellet production.
The moisture content of produced pellets was 10.16 and 10.34 % what is more than required 10 %. We can conclude that too much water was added to the process of preparing and conditioning the raw material which did not evaporate during the pelletization process. It is also possible that the pressing parameters were not set correctly. Table 6. Main properties of agro-wood and control fir pellets
Dimensions (HRN EN ISO 17829:2015) and density
sample Diameter D
(mm) Length L (mm)
Mass
(g)
Density
(g/cm3)
Fir pellet 5.97 30.88 1.00 1.15
Mix 3 pellet 6.16 21.07 0.65 1.04
Bulk density (HRN EN ISO 17828:2016), mechanical durability (HRN EN ISO 17831-1:2016)
sample Bulk density
(kg/m3) Mechanical durability (%)
Fir pellet 514.96 95.56
Mix 3 pellet 490.76 94.88
Moisture content (HRN EN ISO 18134-3:2015), ash content(HRN EN ISO 18122:2015),
calorific value (HRN EN ISO 18125: 2017)
sample Moisture
content (%)
Ash content
(%)
Calorific value
(J/g)
Calorific value by
0 % moisture
content (J/g)
Fir pellet 10.34 0.86 18308 20420
Mix 3 pellet 10.16 2.95 17737 19741
Mix 3 raw material 13.33 2.88 17070 19695
Calorific value of fir pellets amounted 20.42 MJ / kg, which is close to the result of
preliminary testing of raw material 20.64 MJ / kg. With the calorific value of the raw material expressed to 0 % moisture content, it is possible to compare the quality of the raw material. To evaluate fuel energy quality of pellet, it is better to compare the calorific value with the specified moisture content, because the water contained in it is calculated in the result. During the combustion of pellets the contained water must evaporate which represents a certain loss in the combustion process, therefore the calorific value of raw material or pellets with moisture content is better data for comparison. 4. CONCLUSION

28th International Conference on Wood Science and Technology 2017 IMPLEMENTATION OF WOOD SCIENCE IN WOODWORKING SECTOR
90
Croatia has great potential for producing agro-wood pellets. Potential is significant in the
production of cereals, especially corn and wheat. The harvest residue is a part of a plant that remains on the field after harvest and which is usually ploughed. About 50 % of the harvest residue can be used for energy purposes. Utilizing 50 % of the harvest residue, corn potential according to 2015 data would still be 1.7 million t, and wheat potential 1.12 million tons. The problem of using agro residues as biomass for energy purposes is the need for large storage space due to harvesting process which takes only few weeks. The analysis showed the moisture content, ash content and calorific values of 8 types of agro-residues and wood residues of fir. The high ash content had rapeseed straw. Corn cob, wheat and barley straw had slightly better ash content results, while the fir wood had the lowest value. The calorific value of fir wood at dry state was 20.64 MJ / kg, while the miscanthus and corn cob had ≈ 19.7 MJ / kg. and the minimum value had corn stalk 17.8 MJ / kg. Calculation is made for mixtures (Mix 1 - Mix 4) and from it is possible to produce EN B quality pellets which will have less than 3 % ash content. The measurement found that the mixtures did not fulfill the ash content less than 3 % and corrections of mixtures were made. The new mixtures were made to fulfill the planned ash content. Mixture Mix 3 (70 % fir and 30 % corn stalk) was selected, with 2.92 % ash content and pellet was produced on a small horizontal pellet press. Along with the Mix 3 pellets, a certain amount of pellet was produced from fir wood biomass. These fir pellets used as a quality comparison control. The analyzes show an increased moisture content in Mix 3 pellets. Pellets have also slightly weaker results of bulk density 490.76 kg / m3 and mechanical durability of 94.88 %. The pellet dimensions fulfill the EN B quality, but there is a visible expansion of pressed material that confirms the insufficient binding of corn stalk and wood particles. New determination of calorific value and ash content confirmed results of raw material analysis. The obtained results show that production improvements need to be made to get better quality pellets. By planning the mixture for the production of this agro-wood pellets concentration was at ash content less than 3 %. Further research should pay attention to the pressing parameters and thereby further improvement of the product. Research results have shown that raw material of corn stalk and fir should be a good mixture for the production of agro-wood pellets. 5. REFERENCES Calonego, F. W.; Severo, E. T. D., Sansígolo, C.A.; Rezende, M.A.; Bruder, E.M.; Costa, V.E. (2016.):
Calorific Value and Chemical Properties in Juvenile and Mature Wood of Thermally-Modified Eucalyptus Grandis. Drvna industrija 67 (3): 207-214 (2016).
Cassida, K.A.; Muir, J.P.; Hussey, M.A.; Read, J.C.; Venuto, B.C.; Ocumpaugh, W.R. (2005.): Biofuel component concentrations and yields of switchgrass in South central US environments. Crop Science 2005.; 45: 682–692.
Felfti, F. F.; Luengo, C. A.; Suárez, J. A.; Beatón, P. A., (2005.): Wood briquette torrefaction. Energy Sust. Develop., 9 (3): 19-22.
Gilpin, A. S.; Herrman, T. J.; Behnke, K. C., Fairchild, F. J. (2002.): Feed Moisture, Retention Time, and Steam as Quality and Energy Utilization Determinants in the Pelleting Process. Appl. Eng. Agr., 18: 331–338.
HRN EN ISO 18122: 2015 Čvrsta biogoriva - Određivanje udjela pepela HRN EN ISO 18125: 2017 Čvrsta biogoriva - Određivanje ogrjevne vrijednosti HRN EN ISO 18134-3: 2015 Čvrsta biogoriva - Određivanje udjela vlage - Metoda sušionika - 3. dio:
Vlaga u općem uzorku za analizu Jurišić, V.; Krička, T.; Matin, A.; Bilandžija, N.; Antonović, A.; Voća, N.; Torić, T. (2016.) Proizvodnja
energije i proizvoda dodane vrijednosti pirolizom koštica trešnje i višnje // Proceedings-51st Croatian and 11th International Symposium on Agriculture Opatija, Hrvatska, str. 475-479.
Kramar D. (2012.): Istraživanje parametara proizvodnje agro-drvnih peleta. Bachelor’s Thesis (2012.) 1-62.

28th International Conference on Wood Science and Technology 2017 IMPLEMENTATION OF WOOD SCIENCE IN WOODWORKING SECTOR
91
Labudović, B. (2012.): Osnove primjene biomase – Utjecaj primjene šumske biomase na okoliš 224 (6): pp. 223-242.
Mani, S., Tabil, L.G., Sokhansanj, S. (2006.): Effects of compressive force, particle size and moisture content on mechanical properties of biomass pellets from grasses. Biomass and Bionergy, 30: 648–54.
Monti, A.; Di Virgilio, N.; Venturi, G. (2008.): Mineral composition and ash content of six major energy crops. Biomass and bioenergy 32 (2008): 216 – 223.
Nielsen, N.P.K.; Gardner, D.J.; Felby, C. (2010.): Effect of extractives and storage on the pelletizing process of sawdust. Fuel, 89 (1), 94–98.
Quirino, W. F.; Vale, A. T.; Andrade, A. P. A.; Abreu, V. L. S.; Azevedo, A. C. S., (2004.): Calorific value of wood and wood residues. Biomassa e Energia, 1 (2): 173-182.
Sokhansanj S., Mani S., Bi X., Zaini P., Tabil L.G. (2005.) Binderless pelletization of biomass. ASAE Annual International Meeting, Tampa Convention Centre, Tampa, FL, Paper Number 056061.
Stelte, W.; Holm, J. K.; Sanadi, A. S.; Barsberg, S.; Ahrenfeldt, J.; Henriksen, U.B. (2011.a): A study of bonding and failure mechanisms in fuel pellets from different biomass resources. Biomass & bioenergy 35 (2011); 910-918.
Stelte W., Clemons C., Holm J.K., Ahrenfeldt J., Henriksen U.B., Sanadi R.A. (2011.b): Fuel pellets from wheat straw: the effect of lignin glass transition and surface waxes on pelletizing properties. Bioenerg Res 2012; 5(2): 450-458.
Stelte W., Nielsen N.P.K., Hansen H.O., Dahl, J., Shang, L., Sanadi, A.R. (2013.): Pelletizing properties of torrefied wheat straw. Biomass and bioenergy 2013; 49: 214-221.
Šafran, B. (2015.): Ovisnost mehaničkih svojstava peleta o ulaznim veličinama drvne sirovine. PhD Thesis (2015.); 1-54.
van Dam, J.E.G.; van den Oever, M.J.A.; Teunissen, W.; Keijsers, E.R.P.; Peralta, A.G. (2004.): Process for production of high density/high performance binderless boards from whole coconut husk - Part 1: Lignin as intrinsic thermosetting binder resin. Industrial Crops and Products 19: 207-216.
URL: http://www.dzs.hr/ https://www.agroklub.com/ratarstvo/zaoravati-ili-spaljivati-zetvene-ostatke/15244/

28th International Conference on Wood Science and Technology 2017 IMPLEMENTATION OF WOOD SCIENCE IN WOODWORKING SECTOR
92

28th International Conference on Wood Science and Technology 2017 IMPLEMENTATION OF WOOD SCIENCE IN WOODWORKING SECTOR
93
Relationship between Strength and Ddensity as an Indicator of Sycamore Maple (Acer pseudoplatanus L.) Wood Quality
Sedlar, Tomislav1; Sinković, Tomislav1; Trajković, Jelena1; Šefc, Bogoslav1; Jambreković,
Branimir1; Ištok, Iva1
1 Department for Wood Science, Faculty of Forestry, University of Zagreb, Zagreb, Croatia *Corresponding author: Šefc, Bogoslav; [email protected]
ABSTRACT
The relationship between strength and density of wood plays important role in application of wood in construction. Available information on technical properties of sycamore maple wood are modest, and science based information on many important technical properties of this wood is missing. Some physical and mechanical properties of sycamore maple wood from Medvednica region were investigated. The relationship between strength and density as an indicator of wood quality was calculated. Wood quality was determined by strength quotient, bending quotient and toughness quotient. Variations of mentioned quotients from pith to bark were investigated. Statistical analysis showed no significant differences in the distribution of quotient values from pith to bark. Quality coefficients were compared to available data on some other wood species. Key words: Bending quotient, Sycamore maple wood, Strength quotient, Toughness quotient, Wood quality 1. INTRODUCTION
Wood quality is defined as the combination of all wood characteristics that affect the value recovery chain and the serviceability of end products (Zhang, 2003). According to that author, wood density has long been considered the most important wood quality attribute and to a large extent determines the suitability of a species for a specific end use. As well, density is one of the major technical properties of wood. It is relatively easy to determine and is well correlated to many other properties of wood, like strength, stiffness, and performance in use. Some wood quality attributes share a unique link. For example, structural timber needs a high density and strength (Barnett and Jeronimidis, 2003).
Sycamore maple (Acer pseudoplatanus L.) is native mainly in the mountainous regions of Southern, South-western, Western, Central and Eastern Europe (Figure 1), with the extreme easterly limit at the Casparian Sea (Krabel and Wolf, 2013).
Figure 1. Distribution map of sycamore maple (Acer pseudoplatanus L.) in Europe. (Source: EUFORGEN,
2009, www.eufrogen.org).

28th International Conference on Wood Science and Technology 2017 IMPLEMENTATION OF WOOD SCIENCE IN WOODWORKING SECTOR
94
In many parts of Europe, sycamore maple is considered invasive and exotic species and therefore causing some debate among forests breeders and conservators. Some of them believe that sycamore maple should be eradicated in areas where it threatens the ancient indigenous forests (Rusanen and Myking, 2003). Others speak of great economic value and potential of reforestation with sycamore maple, and it is considered as hardwood species whose value grows in Central Europe (Kleinschmit et al., 2009).
Genetic conservation aims at ensuring continuous survival and adaptability of the target species. These proposed guidelines reflect the view that sycamore is not considered an endangered species. Sycamore has significant potential for forestry, and its use as a timber resource should be promoted (Rusanen and Myking, 2003).
In Europe, 1.7% of the total annual cuttings consist of sycamore maple. Researchers claim that the future area proportion of ash, sycamore maple and wild cherry in Europe will double; therefore the future proportion of sycamore maple harvest could increase remarkably (Thies et al., 2009). According to Kölling and Zimmermann (2007) and Kölling (2007), sycamore maple is regarded as a species that is well adapted to current and also to predicted future climatic conditions in Central Europe. The total wood stock of sycamore maple in Croatia is about 3.3 million m3, which represents 0.81% of the total wood stock. About 2.6 million m3 belongs to state forests, while 0.6 million m3 are private (Hrvatske šume, 2014).
There is a very close correlation between density and the strength characteristics of wood (Kolmann, 1951; Niemz and Sonderegger, 2003), therefore it can be used as an indicator for the primary assessment of mechanical properties (Niemz, 1993; Perelygin, 1965; Vikram et al. ,2011).
Available data on physical and mechanical properties of sycamore maple wood is modest, and science based information is missing. It is known that relationship between strength and density of wood plays important role in application of wood in construction (Govorčin et al., 1984). In this article, a relationship between strength and density was used as an indicator of wood quality. Wood quality was determined by strength quotient, bending quotient and toughness quotient. Variations of mentioned quotients from pith to bark were investigated. A described anticipation of growing quantities of sycamore maple in the near future along with the lack of scientifically formed, confirmed and tested information on the properties of sycamore maple wood and on their radial variation have all led to research presented here. Variations in properties of sycamore maple wood are compared with available data for sycamore maple wood, beech wood, and some other diffuse-porous species.
This article describes research on some physical and mechanical properties of sycamore maple wood, as a basis for determination of quality quotients. 2. MATERIAL AND METHODS
For the purpose of this research, five representative sycamore maple trees from different diameter classes were selected with a method of random samples. The test trees were chosen as representative of the stand according to ISO 3129:1999. Trees were located on mount Medvednica, on its northern slope. This area is a part of “Training and forest research center Zagreb”, which belongs to Faculty of Forestry in Zagreb. Mountain Medvednica represents typical natural habitat with a mild continental climate where sycamore maple grows in community with beech. After cutting down, one test trunk of 1m length was sawn from each test tree. Length of test trunk started at breast height (1.3 m), downwards to root collar. Afterwards, these 1 m long trunks were sawn into bark to the bark cores approximately 6 cm thick. One core was oriented north-south, and the others from east and west side (Figure 2). Cores were then submitted to natural drying on dry and drafted stock. After the cores had dried to a water content of about 12%, highest parts of the cores, which were in the area of the breast height (1.3 m), were sawn

28th International Conference on Wood Science and Technology 2017 IMPLEMENTATION OF WOOD SCIENCE IN WOODWORKING SECTOR
95
out into rectangular samples of 20 mm × 20 mm × 25 mm. The samples were sawn in the radial direction from the pith to the bark and labelled with markers that indicate from which tree they were sawn, to which side of the world they belong to and the ordinal number from the pith to the bark.
Figure 2. Bark to bark cores (north – south, east and west).
Density was measured according to HRN ISO 3131:1999, compression strength parallel to
grain according to HRN D.A1.045-1957 and bending strength according to HRN D.A1.046-1979. Statistical analysis of the results and their comparison was carried out in specialized statistical program Statistica 8. Statistical analysis has shown the number of measured samples, an average value of certain measured properties as well as their variance. A comparison study of properties of juvenile and mature wood was carried out by Mann-Whitney test.
For the purpose of using wood in construction, relationship between strength and density is considered to be very important. This relationship is referred as the quality coefficient of wood. In this research, the quality of wood was expressed by strength quotient, bending quotient and toughness quotient. The strength quotient of wood is calculated according to the expression (1): �� =
���12% (1)
where is: ks – strength quotient (according to Janka)
σc – compression strength parallel to grain (MPa) ρ12% – wood density 12% (g/cm3) The bending quotient of wood is calculated according to the expression (2): �� =
���12% (2)
where is: kb – bending quotient (according to Monnin)
σb – bending strength (MPa) ρ12% – wood density 12% (g/cm3)

28th International Conference on Wood Science and Technology 2017 IMPLEMENTATION OF WOOD SCIENCE IN WOODWORKING SECTOR
96
The toughness quotient of wood is calculated according to the expression (3): �� =
���� (3)
where is: kt – toughness quotient (according to Monnin)
σb – bending strength (MPa)
σc – compression strength parallel to grain (MPa)
The higher are the quotients, the higher is the coefficient of quality respectively, and the wood is better for use in constructive purposes. 3. RESULTS AND DISCUSSION Table 1. Comparison of strength quotient of the sycamore maple wood from the Medvednica region with reference sycamore maple wood, beech wood from the same site, beech wood from Gorski kotar, white willow wood and teak wood
Wood species Density
ρ12% (g/cm3)
Strength
σc (MPa)
Strength quotient
Sycamore maple (Sedlar 2015) 0,630 45,5 72,2
Sycamore maple (Wagenführ, 2007) 0,630 49,0 77,8
Sycamore maple (Ehmcke i Grosser, 2014)
0,630 50,0 79,4
Beech (Štajduhar, 1973) 0,740 59,9 80,9
Beech (Govorčin, 1996) 0,660 47,3 71,7
White willow (Salix alba L.)* 0,520 28,0 53,8
Teak (Tectona grandis L.)* 0,630 72,0 114,3
Legend: ρ12% – wood density 12%, σc – compression strength parallel to grain. * Wagenführ (2007)
Table 1 shows the comparison of the strength quotient between sycamore maple wood from
Medvednica and known data of sycamore maple wood (Wagenführ, 2007; Ehmcke and Grosser, 2014), beech wood from the same site (Štajduhar, 1973), beech wood from Gorski kotar (Govorčin, 1996) and two diffuse porous wood species, white willow and teak.
Mean value of strength quotient of sycamore maple wood from Medvednica varies about 10% from the value of known data of sycamore maple wood (Wagenfür, 2007; Ehmcke and Grosser, 2014) and beech wood from the same site, while it is almost identical to the average value of beech wood from Gorski kotar. Mean value of strength quotient of investigated sycamore maple wood is 35% higher than of the white willow wood, and for about 60% lower than the average value of the teak wood.
Table 2 shows the comparison of bending quotient between sycamore maple wood from Medvednica and known data of sycamore maple wood (Wagenführ, 2007; Ehmcke and Grosser, 2014), beech wood from the same site (Štajduhar, 1973), beech wood from Gorski kotar (Govorčin, 1996) and two diffuse porous wood species, white willow and teak.

28th International Conference on Wood Science and Technology 2017 IMPLEMENTATION OF WOOD SCIENCE IN WOODWORKING SECTOR
97
Table 2. Comparison of bending quotient of the sycamore maple wood from the Medvednica region with reference sycamore maple wood, beech wood from the same site, beech wood from Gorski kotar, white willow wood and teak wood
Wood species Density
ρ12% (g/cm3)
Strength
σb (MPa) Bending quotient
Sycamore maple (Sedlar 2015) 0,630 88,5 140,5
Sycamore maple (Wagenführ, 2007) 0,630 95,0 150,8
Sycamore maple (Ehmcke i Grosser, 2014)
0,630 120,0 190,5
Beech (Štajduhar, 1973) 0,740 120,7 163,1
Beech (Govorčin, 1996) 0,660 91,7 138,9
White willow (Salix alba L.)* 0,520 31,0 59,6
Teak (Tectona grandis L.)* 0,630 148,0 234,9
Legend: ρ12% – wood density 12%, σb – bending strength. * Wagenführ (2007)
Mean value of bending quotient of sycamore maple wood from Medvednica varies about
10% from the value of known data of sycamore maple wood (Wagenfür, 2007) and beech wood from the same site, while it is almost identical to the average value of beech wood from Gorski kotar. Mean value of bending quotient of sycamore maple wood (Ehmcke and Grosser, 2014) is about 35% higher than of investigated sycamore maple wood. Mean value of bending quotient of investigated sycamore maple wood is 135% higher than of the white willow wood, and for about 65% lower than the average value of the teak wood. Table 3. Comparison of toughness quotient of the sycamore maple wood from the Medvednica region with reference sycamore maple wood, beech wood from the same site, beech wood from Gorski kotar, white willow wood and teak wood
Vrsta drva
Strength
σc (MPa)
Strength
σb (MPa)
Toughness quotient
Sycamore maple (Sedlar 2015) 88,5 45,5 1,95
Sycamore maple (Wagenführ, 2007) 95,0 49,0 1,94
Sycamore maple (Ehmcke i Grosser, 2014)
120,0 50,0 2,40
Beech (Štajduhar, 1973) 120,7 59,9 2,02
Beech (Govorčin, 1996) 91,7 47,3 1,94
White willow (Salix alba L.)* 31,0 28,0 1,11
Teak (Tectona grandis L.)* 148,0 72,0 2,06
Legend: ρ12% – wood density 12%, σc – compression strength parallel to grain, σb – bending strength. * Wagenführ (2007)
Table 3 shows the comparison of toughness quotient between sycamore maple wood from Medvednica and known data of sycamore maple wood (Wagenführ, 2007; Ehmcke and Grosser, 2014), beech wood from the same site (Štajduhar, 1973), beech wood from Gorski kotar (Govorčin, 1996) and two diffuse porous wood species, white willow and teak.

28th International Conference on Wood Science and Technology 2017 IMPLEMENTATION OF WOOD SCIENCE IN WOODWORKING SECTOR
98
Mean value of toughness quotient of sycamore maple wood from Medvednica is almost identical to the average value of known data of sycamore maple wood (Wagenfür, 2007), beech wood from the same site, and beech wood from Gorski kotar. Mean value of toughness quotient of sycamore maple wood (Ehmcke and Grosser, 2014) is about 20% higher than of investigated sycamore maple wood. Mean value of toughness quotient of investigated sycamore maple wood is about 75% higher than of the white willow wood and almost identical to the average value of the teak wood.
Table 4 presents mean values of strength quotient (Janka), bending quotient (Monnin), and toughness quotient (Monnin) with statistical indicators based on test results for all trees. Table 4. Mean values of strength quotient, bending quotient and toughness quotient of all trees.
Number of samples
Mean value Minimal
value Maximal
value Standard deviation
Coefficient of variation
(%)
Strenght quotient
168 72,8 60,6 80,9 4,47 6,14
Bending quotient 157 132,1 99,2 154,9 10,62 8,04
Toughness quotient 157 2,0 1,5 2,4 0,15 7,62
Figures 3, 4 and 5 present the arrangement of quality quotients in radial direction, from
pith to bark for all trees together. By comparing all trees together, the tendency of quality quotients in radial direction, from
pith to bark, does not indicate a general conclusion. There is no correlation between quality quotients and distance from pith.
Figure 3. Arrangement of strength quotient in the radial direction of all trees together.
y = -0,0028x2 + 0,2095x + 69,708
R² = 0,0324; F = 15179,2; p < 0,00155,0
60,0
65,0
70,0
75,0
80,0
85,0
0 10 20 30 40 50 60 70
Str
en
gh
t q
uo
tie
nt
Distance from pith (annual ring)
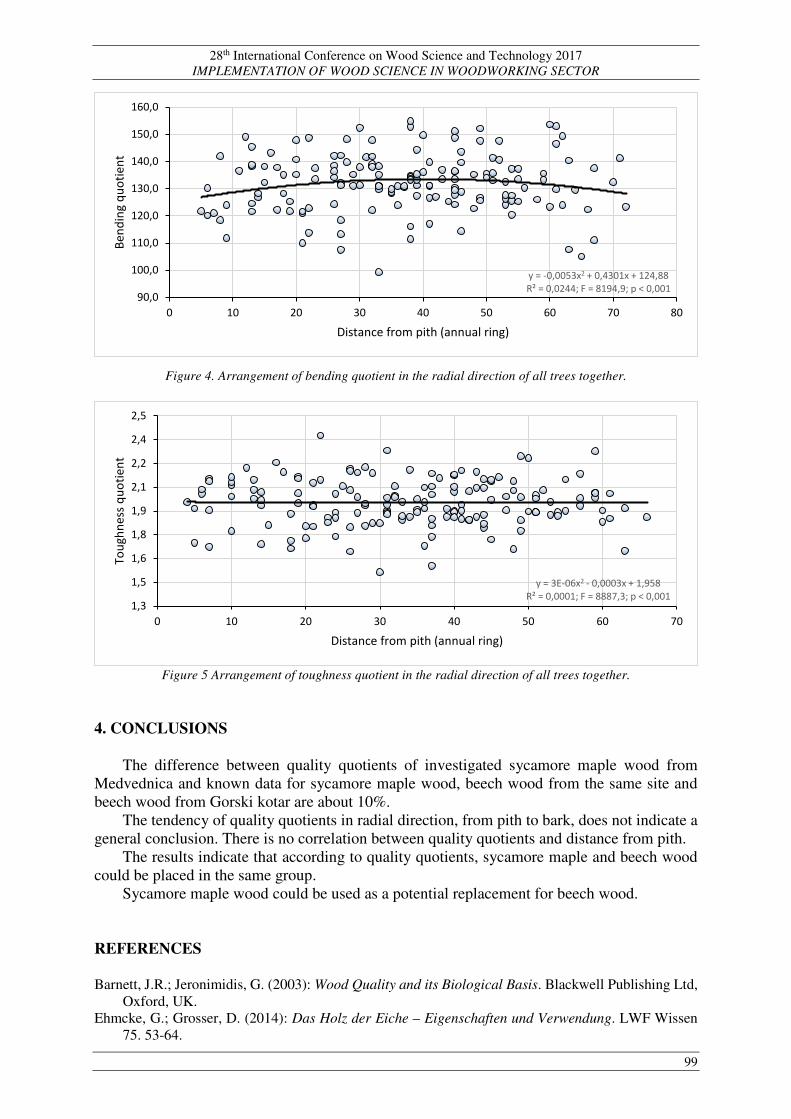
28th International Conference on Wood Science and Technology 2017 IMPLEMENTATION OF WOOD SCIENCE IN WOODWORKING SECTOR
99
Figure 4. Arrangement of bending quotient in the radial direction of all trees together.
Figure 5 Arrangement of toughness quotient in the radial direction of all trees together.
4. CONCLUSIONS
The difference between quality quotients of investigated sycamore maple wood from Medvednica and known data for sycamore maple wood, beech wood from the same site and beech wood from Gorski kotar are about 10%.
The tendency of quality quotients in radial direction, from pith to bark, does not indicate a general conclusion. There is no correlation between quality quotients and distance from pith.
The results indicate that according to quality quotients, sycamore maple and beech wood could be placed in the same group.
Sycamore maple wood could be used as a potential replacement for beech wood. REFERENCES Barnett, J.R.; Jeronimidis, G. (2003): Wood Quality and its Biological Basis. Blackwell Publishing Ltd,
Oxford, UK. Ehmcke, G.; Grosser, D. (2014): Das Holz der Eiche – Eigenschaften und Verwendung. LWF Wissen
75. 53-64.
y = -0,0053x2 + 0,4301x + 124,88
R² = 0,0244; F = 8194,9; p < 0,00190,0
100,0
110,0
120,0
130,0
140,0
150,0
160,0
0 10 20 30 40 50 60 70 80
Be
nd
ing
qu
oti
en
t
Distance from pith (annual ring)
y = 3E-06x2 - 0,0003x + 1,958
R² = 0,0001; F = 8887,3; p < 0,0011,3
1,5
1,6
1,8
1,9
2,1
2,2
2,4
2,5
0 10 20 30 40 50 60 70
To
ug
hn
ess
qu
oti
en
t
Distance from pith (annual ring)

28th International Conference on Wood Science and Technology 2017 IMPLEMENTATION OF WOOD SCIENCE IN WOODWORKING SECTOR
100
Govorčin, S.; Horvat, I.; Bađun, S. (1984): Fizička i mehanička svojstva bagremovine (Robinia pseudoacacia L.). Bilten ZIDI, 12 (5) 44-54.
Govorčin, S. (1996): Svojstva juvenilnog i adultnog drva bukovine iz područja Bjelolasice. Doktorska disertacija. Šumarski fakultet Sveučilišta u Zagrebu.
Kleinschmit, J.; R. G. Kleinschmit, J. (2009): Genetics and Tree Breeding. In Spiecker, Hein, & Makkonen‐Spiecker, Valuable Broadleaved Forests in Europe (pp. 45‐60). Boston: European Forest Institute: Research report 22.
Kollmann, F. (1951): Technologie des Holzes und Holzverkstoffe 1. Springer Verlag. Berlin, 1050 pp. Kölling, C. (2007): Klimahüllen für 27 Waldbaumarten. Allgemeine Forstzeitschrift/Der Wald. 23, 1242
– 1245. Kölling, C.; Zimmermann, L. (2007): Die Anfälligkeit der Wälder Deutschlands gegenüber dem
Klimawandel. Gefahrstoffe. 67, 259 – 268. Krabel, D.; Wolf, H. (2013): Sycamore maple (Acer pseudoplatanus L.). In: Paˆques L.E. (ed) Forest
tree breeding in Europe. Springer, Netherlands, pp 373–402. Niemz, P. (1993): Physik des Holzes und der Holzwerkstoffe. DRW-Verlag. Weinbrenner, 243 pp. 32. Niemz, P.; Sonderegger, W. (2003): Untersuchungen zur Korrelation ausgewählter Holzeigenschaften
untereinander und mit der Rohdichte unter Verwendung von 103 Holzarten. Schweizerische Zeitschrift für Forstwesen 154(12): 489-493.
Perelygin, L.M. (1965): Wood science. (Náuka o dreve). SVTL Bratislava, 448 pp (in Slovak) Rusanen, M.; Myking, T. (2003): EUFROGEN Technical Guidelines for genetic conservation and use
for sycamore (Acer pseudoplatanus). International Plant Genetic Resources Institute, Rome, Italy. 6 pages.
Štajduhar, F. (1973): Prilog istraživanja fizičko-mehaničkih svojstava bukovine u Hrvatskoj. Drvna industrija 24 (3-4) 43-59.
Thies, M.; Hein, S.; Spiecker, H. (2009): Results of a Questionnaire on Management of Valuable Broadleaved Forests in Europe. In Spiecker, Hein, Makkonen‐Spiecker, & Thies, Valuable Broadleaved Forests in Europe (pp. 27‐42). Boston: European Forest Institute: Research Report 22.
Vikram, V.; Cherry, M.; Briggs, D.; Cress, D.W.; Evans, R.; Howe, G.T. (2011): Stiffness of douglas-fir lumber: Effects of wood properties and genetics. Canadian Journal of Forest Research 41(6): 1160-1173.
Wagenführ, R.S. (2007): Holzatlas, 6th edn. Fachbuchverlag, Lepzig. Zhang, S.Y. (2003): Wood Quality Attributes and Their Impacts on Wood Utilization. Proceedings from
the XII World Forestry Congress, Quebec City, Canada. *** HRN D.A1.045-1957: Ispitivanje drva – Čvrstoća na tlak paralelno sa smjerom vlakanaca. *** HRN D.A1.046-1979: Ispitivanje drva – Određivanje statičke čvrstoće na savijanje. *** HRN ISO 3129:1999: Drvo – Postupci i odrednice pri uzimanju uzoraka za ispitivanje fizikalnih i
mehaničkih svojstava. *** HRN ISO 3131:1999: Drvo – Određivanje gustoće za ispitivanje fizikalnih i mehaničkih svojstava. *** Hrvatske šume, 2014. Usporedba plana sječe sa izvršenjem sječe od 01.01.2006 do 31.12.2013.

28th International Conference on Wood Science and Technology 2017 IMPLEMENTATION OF WOOD SCIENCE IN WOODWORKING SECTOR
101
Some Physical and Mechanical Properties of White Poplar (Populus alba L.) Wood Grown in Varaždin Region
Sinković, T.1; Jambreković, B. 1; Šefc B. 1; Ištok I. 1; Veseličić F. 2; Sedlar, T. 1
1Authors are professor, assistant, associate professor and PhD assistants at Department for Wood Science, Faculty of Forestry, University of Zagreb, Zagreb, Croatia
2 Author is a student at Faculty of Forestry, University of Zagreb, Croatia.
ABSTRACT
Investigation of physical and mechanical properties of wood is important for application of wood as a raw material. Nowadays, large quantities of wood from fast-growing species, especially from agricultural unusable land, are available on the market. One of them is poplars. The available data on physical and mechanical properties of white poplar wood grown in Croatia is insufficient. In this work, some of this properties were investigated on white poplar (Populus alba L.) from the region near Varaždin. Also, the distribution of this properties from pith to bark was investigated. This preliminary study was carried out on five trees, using only segments with north and south orientation in the wood at breast height. This article presents charts of listed properties from pith to bark for trees where the correlation of properties was highest. The average values of results in this preliminary study are: density in absolute dry condition is 0,390 g/cm3, density at 12% of moisture content is 0,422 g/cm3, maximum volume shrinkage is 15,1%, static bending strength is 62,8 MPa, modulus of elasticity at static bending is 12,99 GPa, compression strength parallel to grain is 34,3 MPa. In order to determine the statistical reliability, research must be continued on a larger number of samples. Key words: White poplar (Populus alba L.), Physical properties, Mechanical properties, Radial direction, Distribution 1. INTRODUCTION
So far, research has been carried out on white poplar in Croatia (Horvat, 1960) on physical and mechanical properties on location in Slavonija. Unfortunately, these studies were carried out in an older way that was appropriate to this time and the possibilities of data processing. Research of anatomic properties was carried out at the same location (Ištok et al., 2017) as this research of physical and mechanical properties. Based on the interesting results of this research, we began to this test research of the physical and mechanical properties of white poplar. Defining the distribution of physical and mechanical properties in the radial direction was the primary goal. The research was conducted on a relatively small number of samples as a pilot study. Defining the distribution of properties in the radial direction contrubutes to a better application of white poplar for different types of products: wood for packaging fruits and vegetables, wood as a raw material for the production of heat energy, wooden small products ... Knowing the distribution of properties in the radial direction allows us to determine the most valuable parts of logs to produce products with the highest added value. The advantage of white poplar is fast-growing rate regardless to the type of soil even on soils that are not suitable for agricultural production. The area of Varaždin and Međimurje or north-western part of Croatia has a lot of land that can be used for growing poplar or clones of poplars. In developing clones of poplars (Šefc et al., 2009; Ugrenović, 1950), it is also important to create a database of physical and mechanical properties of white poplar characteristics that will allow comparison of the properties of clones with white poplar. Such comparisons allow us to evaluate new clone of poplar in this area.

28th International Conference on Wood Science and Technology 2017 IMPLEMENTATION OF WOOD SCIENCE IN WOODWORKING SECTOR
102
2. MATERIAL AND METHODS
The material necessary for researching of white poplar properties was taken from test trunk samples of five trees in Lipovac Forest Administration. From ten selected trees, three were located in the Varaždin Forest Administration, forest area of Varaždinske podcravske šume, department 3a (Figure 1).
Figure 1. Mapp of the location the test trees.
The test trees were selected as the best representatives of their age, size, habitus,
dendrometric elements and outer trunk properties. The test trees were healthy, normal, with regular crowns, straight stems, average flawlessness and fullness of bole as well as grain texture (Table 1). Table 1. Basic data on test trees.
number of test trees
height of the tree (m)
height to the first thick branch (m)
diameter on breast height (cm)
27 16 7,5 50,5 28 14 6 51 29 14,3 8 41 30 14,1 8,2 44,5 31 13 7,3 39,2
The test trunk samples used for establishing the physical and mechanical properties were
taken from the breast height (HRN ISO 3129:2015). The trunk samples were taken immediately upon felling and after that, the heart boards oriented North-South were made out of them. The heart boards were stacked and naturally dried until the water content was around 20%. For testing the physical properties we made samples for testing the density in absolute dry condition, and samples for testing density at 12% of moisture content in accordance with HRN ISO 3130:1999 and HRN ISO 3131:1999 For testing the mechanical properties we made samples for testing compression strength parallel to the grain and samples for testing bending strength and modulus of elasticity at bending strength in accordance with HRN ISO 3787:1976 and HRN ISO 3133:1975.

28th International Conference on Wood Science and Technology 2017 IMPLEMENTATION OF WOOD SCIENCE IN WOODWORKING SECTOR
103
3. RESULTS AND DISCUSSION
The basic test results of physical and mechanical properties for all test trees are given in Table 2. Table 2. Basic statistical test results for all test trees.
PROPERTI ρ o ρ 12% σc‖ σB EB
UNIT [g/cm3] [g/cm3] [MPa] [MPa] [GPa]
COUNT 53 62 62 57 52
MIN 0,254 0,319 19,6 40,8 2,2
AVERAGE 0,413 0,429 34,3 62,5 5,2
MAX 0,563 0,586 46,7 81,3 12,9
STEDEV 0,062498 0,057368 6,243973 10,87632 2,180905
VAR 0,003906 0,003291 38,9872 118,2943 4,756348 Legend: ρ o- density in absolute dry condition, ρ 12%- density at 12% of moisture content, σc‖- compression strength parallel to the grain, σB- bending strength, EB- modulus of elasticity at bending strength, COUNT- number of samples, MIN- the minimum value of the tested samples, AVERAGE- the mean value of the tested samples, MAX- maximum value of the tested samples, STEDEV- standard deviation and VAR- variance
For the purpose of obtaining a radial distribution of physical and mechanical properties in
the radial direction, a basic representation was made with the lines of the polynomial second degree and the coefficient of correlation in Excel. The results are shown in Table 3. Table 3. Results of the correlation coefficient of the distribution of physical and mechanical properties in the radial direction.
PROPERTI ρ o ρ 12% σc‖ σB EB
R2 0,18 0,12 0,12 0,13 0,03
Legend: ρ o- density in absolute dry condition, ρ 12%- density at 12% of moisture content, σc‖- compression strength parallel to the grain, σB- bending strength, EB- modulus of elasticity at bending strength and R2- coefficient of correlation.
As an example, the Excel rendering results for density in the absolute dry state are shown
in Figure 2.
Figure 2. Distribution of density in absolute dry condition in radial direction for all test trees.
y = -1E-05x2 + 0,0008x + 0,4188R² = 0,1828
0,200
0,250
0,300
0,350
0,400
0,450
0,500
0,550
0,600
0 20 40 60 80 100 120 140
DE
NS
ITY
IN
AP
SO
LU
T D
RY
C
ON
DIT
ION
(g/
cm3)
DISTANCE MIDDLE OF THE SAMPLE FROM THE HEART (mm)
DISTRIBUTION OF DENSITY IN APSOLUT DRY CONDITION IN RADIAL DIRECTION FOR ALL
TREES

28th International Conference on Wood Science and Technology 2017 IMPLEMENTATION OF WOOD SCIENCE IN WOODWORKING SECTOR
104
By looking at figure per every tree, it was found that in some trees the dependence of physical and mechanical properties in radial direction gives bigger or very large correlation coefficients. The examples are shown in Table 4 and best results in Figure 3 and 4. Table 4. Results of the correlation coefficient of the distribution of physical and mechanical properties in the radial direction per tree.
NUMBER OF TREE
ρ 12% σc‖ σB EB
R2 27 0,54 0,53 0,20 0,83
R2 28 0,40 0,05 0,44 0,03
R2 29 0,51 0,78 0,33 0,06
R2 30 0,59 0,24 0,87 0,16
R2 31 0,51 0,29 0,31 0,64 Legend: ρ 12%- density at 12% of moisture content, σc‖- compression strength parallel to the grain, σB- bending strength, EB- modulus of elasticity at bending strength and R2- coefficient of correlation.
Figure 3. Distribution of compression strength parallel to the grain in radial direction for tree 29.
y = -0,0064x2 + 0,7028x + 22,793
R² = 0,7837
30,0
32,0
34,0
36,0
38,0
40,0
42,0
44,0
46,0
48,0
0 20 40 60 80 100 120
CO
MP
RE
SS
ION
ST
RE
NG
TH
PA
RA
LL
EL
TO
TH
E G
RA
IN (
MP
a)
DISTANCE MIDDLE OF THE SAMPLE FROM THE HEART (mm)
DISTRIBUTION OF COMPRESSION STRENGHT PARALLEL TO THE GRAIN IN RADIAL DIRECTION FOR TREE 29

28th International Conference on Wood Science and Technology 2017 IMPLEMENTATION OF WOOD SCIENCE IN WOODWORKING SECTOR
105
Figure 4. Distribution of bending strength in radial direction for tree 30.
The most interesting illustration of the correlation between physical and mechanical
properties was the influence of wood density at 12% water content and pressure strength in parallel with fiber. This correlation is shown in Figure 5.
Figure 5. Influence of density at 12% of moisture content on compression strength parallel to the grain for all trees.
y = -0,0134x2 + 1,6916x + 22,924R² = 0,8724
30,000
40,000
50,000
60,000
70,000
80,000
90,000
0 20 40 60 80 100 120 140
BE
ND
ING
ST
RE
NG
TH
(M
Pa)
DISTANCE MIDDLE OF THE SAMPLE FROM THE HEART (mm)
DISTRIBUTION OF BENDING STRENGTH IN RADIAL DIRECTION FOR TREE 30
y = -106,19x2 + 183,3x - 24,426
R² = 0,7307
15,0
20,0
25,0
30,0
35,0
40,0
45,0
50,0
0,300 0,350 0,400 0,450 0,500 0,550 0,600 0,650
CO
MP
RE
SS
ION
ST
RE
NG
TH
PA
RA
LL
EL
TO
TH
E G
RA
IN (
MP
a)
DENSITY AT 12% MOISTURE CONTENT (g/cm3)
IFLUENCE DENSITY AT 12% OF MOISTURE CONTENT ON COMPRESSION STRENGTH PARALLEL TO THE GRAIN FOF
ALL TREES

28th International Conference on Wood Science and Technology 2017 IMPLEMENTATION OF WOOD SCIENCE IN WOODWORKING SECTOR
106
4. CONCLUSIONS
1. . The number of samples at this preliminary research for density in absolute dry condition, the density at 12% moisture content, compression strength parallel to the grain, static bending strength and modulus of elasticity in bending of white poplar in radial direction were small to give a statistically correct conclusion on their interdependence.
2. The density at 12% of moisture content distribution in the radial direction shows good coefficients of correlation per individual trees and indicating that it would be necessary to conduct research on a large number of samples to get a statistically correct conclusion.
3. Conclusion on the increase in the number of samples also applies to compression strength parallel to the grain, bending strength and modulus of elasticity at bending strength.
4. The most interesting is the dependence of compression strength parallel to the grain and density at 12% of moisture content that shows the strongest evidence of the need to conduct research on a large number of samples to get statistically correct conclusion.
5. REFERENCES 1. Horvat, I. (1960): Prilog poznavanju nekih fizičkih i mehaničkih svojstava bijele i crne topolovine
(Populus alba L., Populus nigra L.). Šumarski list, 3-4: 95-115. 2. Ištok I., ŠefcB., Hasan M., Popović G., Sedlar T. (2017): Fiber Characteristics of White Poplar
(Populus alba L.) Juvenile Wood along the Drava River. Drvna industrija, 68 (3): 241-247 3. Šefc, B.; Trajković, J.; Govorčin, S.; Despot, R.; Hasan, M. (2009): Selected tree characteristics and
wood properties of two poplar clones. Wood Research, 54 (1): 1-8. 4. Ugrenović, A. (1950): Tehnologija drveta. Nakladni zavod Hrvatske. Zagreb. 5.... required, used HRN and ISO norms

28th International Conference on Wood Science and Technology 2017 IMPLEMENTATION OF WOOD SCIENCE IN WOODWORKING SECTOR
107
The Efficiency of Exhaust System in the Wooden Floor Production: A Case study
Anka Ozana Čavlović1, Matija Jug1, Andrija Novosel2
1 Wood technology department, Faculty of Forestry, University of Zagreb, Zagreb, Croatia 2 Drvnoproizvod d.d., Jastrebarsko, Croatia
*Corresponding author: [email protected]
ABSTRACT
Wood particles (sawdust, wood dust, etc.) are a constant problem in the wood industry. This can be handled by installing a central exhaust system which removes wood particles from the processing place and the working environment. The objective of analysis of existing exhaust system of wood particles in wooden floor production was to determine the exhaust system efficiency. Based on the measurement and calculation of required parameters (air velocity and partial static pressure) it is determined the fan operating point of four fans, an analysis was made of all pipelines on the suction side of the existing exhaust system and a new construction is proposed regarding the new calculations. By comparing the present system calculations to the new ones, oversize fan power with small efficiency and low partial static pressure are found. This research enables an optimization of the exhaust system, but also can reduce the electric power consumption. Keywords: Wood particles, Hygiene of the machine and the working environment, Exhaust system,
Energy savings
1. INTRODUCTION
Within the framework of the environmental management system in the wood industry, special attention should be paid to the characteristics of cleaner production through the principles of reduction, more rational and optimal use of energy for the operation of the exhaust system in the wood industry. Significant financial savings are achieved by applying techniques and measures of cleaner production through increased energy efficiency in production, and preventing emissions contributes to environmental protection. The air conveyor is exhaust system, which, in addition to the lack of large unit energy consumption and the constantly noisy operation of the whole system, is almost irreplaceable in the wood industry. In winter months, due to the discharge of hot air from the working environment, three times more energy is consumed than for drive of the exhaust system (Hamm, 1980).
Suction and transport of wood shavings, sawdust, sanding dust and wood dust from working machines achieved the level of hygienic conditions in the production plant, increase the safety from the risk of fire and explosion, and enables more precise operation of machines and their maintenance easier (Hamm, 1980; Sever, 1988). Self-flammability and explosive properties of wood dust refer to a water content of less than 12-14 %, the average particle size less than 0.3 mm and aerosol mass concentration of 35 to 55 mg/m3 (Jug, 2014). The removal of wood particles from the working place is extremely important due to health reasons, especially oak-wood and beech-wood particles, which, according to previous researchers, international documents and the Croatian Regulation on the protection of workers from the risk related to exposure to carcinogens or mutagens at work, are classified, along with other dust of hardwood species, in carcinogenic substance of Group 1 (NN 40/2007). Exposure to harmful substances from wood processing can be reduced by cleaner production and by respecting and applying of existing laws and regulations. According to the Regulation NN 40/2007, one of the technical measures for prevention and reduction of exposure to hardwood dust refers to the supervision of the efficiency of the suction system work. According to this Regulation, the

28th International Conference on Wood Science and Technology 2017 IMPLEMENTATION OF WOOD SCIENCE IN WOODWORKING SECTOR
108
employer must ensure the removal of carcinogenic substances from sources by using local suction or central exhaust in accordance with the public health and environmental protection standards. The employer must provide a safe technique for collecting, storing, handling and transporting of wood dust. Exhausted air which contains hardwood dust must not be brought back (recuperated) into the working environment. Exhausted air can be brought back into the working environment if it has been previously cleaned of all the carcinogenic substances by using the filter separator with very high separation efficiency. The employer must provide the control of exhaust and separation efficiency control at least once a year (Čavlović, 2015). In addition to energy inefficiency, the failure of exhaust work has also been shown in the wear of pipes and fan blades by bumping larger wood particles and pieces in the wall. Damage to fan blades due to the passage of transported mixture can cause non-functionalities and very high energy inefficiency of fan operation. The benefit of the exhaust system is the adaptability of the starting and ending points of transport, ease of operation, low investment and automatic operation without the special need of experts in handling and maintenance. Efficiency control is determined by air velocity measurements and their comparison with the recommended air velocity for each particle size. The recommended air velocity for the fine wood dust amount to 10-15 m/s for air dry sawdust and wood shaving 15-25 m/s, for large and wet wood particles 25-30 m/s, while speeds greater than 30 m/s should not be used in the frame of increased energy consumption (Sever, 1988). The fan efficiency is checked by determining the input values of the fan operating point in the (Q-∆p) diagram, which is the amount of flow rate and total pressure loss in the exhaust system. The fan operating point, defined by the rpm and the necessary power (mechanical effective), should be in the area of greater value the fan efficiency. The fan motor efficiency is determined by comparing the measured and necessary fan power for its optimum performance. The exhaust system project includes the number and type of machine tools, the floor plan of the plant with the position of the machines, the quantity, the type and condition of the wood particles and the required level for clean air after the separation (Horvat and Krpan, 1967; Kos-Pervan, 1997).
The aim of this research is to determine the exhaust system efficiency and recommend improvements based on observed shortcomings in system work. On the basis of determined air velocities in the pipelines and the partial static pressures in the system, the accuracy and efficiency of installed fans and electric motors in the system will be evaluated.
2. MATERIALS AND METHODS
2.1. Air velocity measurement and dynamic pressure in the pipeline
The observed exhaust system consists of four major pipelines with associated centrifugal fans. The air velocity in each of the four major pipelines is measured on the suction side on the horizontal pipe at a distance greater than the eight diameters of the knee (for avoiding the source of turbulence). The air velocity was also measured in the pipe at critical machines at the distance from the suction entrance of more than eight diameters of this tube. The length of the suction system was measured using a laser meter (Bosch DLE50 Professional).
In cooperation with a factory worker, measuring point in the major pipeline for air velocity and dynamic pressures measuring was made by drilling procedure (Figure 1).

28th International Conference on Wood Science and Technology 2017 IMPLEMENTATION OF WOOD SCIENCE IN WOODWORKING SECTOR
109
Figure 1. Measuring procedure on the major pipeline
Within the pipeline, the air velocity was measured using the digital manometer (Kimo
Constructeur MP200) at about 1/3 of the tube diameter (the air velocity at that point is average). The obtained air velocities for each major pipeline were used to calculate the dynamic pressure in the table program in Excel according to the form (1):
�din = �mix ∙ �2
2(Pa) (1)
However, for the calculation of dynamic pressure (pdin), the data on the density of transported mixture (ρmix) is required. To calculate the air density (ρA), the surrounding air condition was determined. The microclimate conditions of the air were measured at the parquet production facility. The surrounding air temperature was measured by a thermometer, atmospheric air pressure by the barometer, and relative humidity of the air by the hygrometer. The atmospheric air pressure is readable from the Torr barometers (in mm of mercury column), and for further use of the data, this value is converted from Torr to Pascal.
To determine the density of the transported material, it is necessary to know the density of the fragmented material (oak-wood) (ρOW) and air density (ρA). Air density was obtained from known atmospheric air pressure and temperature (Table 1) and the density of fragmented oak-wood was obtained from the resulting amount of fragmented wood and the amount of flow rate in the system (Table 2). 2.2. Method for determining the fan operating point
The study analyzed the exhaust system efficiency in the production of oak parquet, by determining the fan operating point for four fans. The control of all the exhaust system parameters (length and diameter of all pipe sections, knee geometry, air velocity and partial static pressure in pipelines, and selection of electric motor and fan) are performed separately for each line at each of the four fans. For each of the four fans, a two-case fan operating point was determined, first according to the calculation with all existing and measured working parameters of the exhaust system (EXISTE), and then according to the calculation for improving working parameters of the exhaust system (IMPROVE). The two parameters needed to read the fan operating point in the Q-Δp diagram are the flow rate (Q) and the total pressure loss (Δp) in each of the four suction side pipelines including partial static pressure from the pressure side and in the cyclone. In Excel 2007, the amount of flow rate is calculated from the measured pipe diameter and the recommended air velocity in the pipe. Total pressure loss is obtained from the calculated pressure loss coefficient (Σξ) and dynamic pressure (pdin) in each of the observed parts of the exhaust system.

28th International Conference on Wood Science and Technology 2017 IMPLEMENTATION OF WOOD SCIENCE IN WOODWORKING SECTOR
110
3. RESULTS AND DISCUSSION
3.1. Results of determining the density of transported mixtures
The density of fragmented wood 0.152 kg/m3 was calculated from the oversize from the known volume of solid sawn wood pieces. During the oak parquet production from this oversize volume daily various types of resulting fragmented wood (sawdust and wood shaving) were transported by using the existing exhaust system. The process of woodworking in two shifts per day produces fragmented wood from a solid wood of 45 m3 volume (Novosel, 2015). The density of the transported mixture at 1.352 kg/m3 was obtained by adding the density of fragmented wood and air density (Table 1 and Table 2).
Table 1. Determination of the air density from the mean value of the measured air condition at the plant
PARAMETERS VALUES CALCULATION Air temperature, T 29.5 C
ρA= patm/RT Air relative humidity, ϕ 51 % Atmospheric air pressure patm 996.25 hPa Air density, ρA 1.2 kg/m3
Table 2. Determination of density of transported mixture
PARAMETERS VALUES CALCULATION Daily amount of wood waste (in form of
solid wood) 45 m3
ρCW = qτ/ 3600Q
Flow rate in exhaust, Q 3.35 m3/h Density of oak-wood, ρOW 650 kg/m3 Mass flow rate of chipped wood, qτ 1828.5 kg/h Density of the chipped wood, ρCW 0.152
kg/m3 Density of transported mixture, ρmix 1.352
kg/m3 ρmix=ρA +ρCW
3.2 Results of determination of air velocity and dynamic pressure
Table 3 shows air velocity measured on the M1, M2, M3, and M4 measuring points on each of the four major pipelines. In addition to the existing (EXISTE) parameters obtained by measuring, the recommended values for improving the exhaust system work (IMPROVE) are also listed in table 3. For further calculation, maximum air velocity of 24 m/s is recommended for the transport of air dry sawdust and wood shaving (Sever, 1988). The same table shows the dynamic pressure and partial static pressure, for each of the four exhaust pipelines, calculated using measured and recommended air velocity. During the calculation, the air velocity is corrected in each pipe because of the rounding up the measured diameter of the pipe to a total of 5 mm. The flow rate depends on the cross-sectional area of the pipe so that the air velocity in the calculation varies from the starting value either into the EXISTE or IMPROVE calculation. From the defined pipe diameter and air velocity, the amount of flow rate in each part of the pipeline and the total flow rate in the exhaust system has been calculated (Table 4). The existing pipeline was estimated to be approximately 15 % larger dimensions. This overhead dimensioning of the pipeline but also the fan motor is justified on the assumption that the production process capacity and the number of suction entrances will be increased due to the possible upgrading of the existing exhaust system.

28th International Conference on Wood Science and Technology 2017 IMPLEMENTATION OF WOOD SCIENCE IN WOODWORKING SECTOR
111
3.3. Results of determining the fan operating point
The partial static pressure was calculated from the pressure loss coefficient, regarding to flow resistance inside the pipeline, flow resistance in the suction entrance and additional flow resistance due to the curved parts of the pipe (knees). In the Excel spreadsheet, all geometric data for calculating the flow resistance coefficient for each pipeline (pipe length, knee number with corresponding diameters and angles) are entered. At the end of the calculation, the highest partial static pressure in each of the four pipelines was selected, according to which in the (Q-∆p) diagram selects the fan and fan electric motor for the obtained flow rate. The static pressure loss on the pressure side of all four fans was taken to 1100 Pa (including static pressure loss in the cyclone). It is needed to select the fan with the greatest efficiency.
Table 3. Existing and recommended air velocity, dynamic and total pressure loss in four pipelines
Measurement point
Air velocity, (m/s) Dynamic pressure,
(Pa) Total pressure loss,
(Pa) EXISTE IMPROVE EXISTE IMPROVE EXISTE IMPROVE
M1 20.5 24 290.9 407.9 1921.7 2369.2 M2 13.5 24 127.6 406.5 1451.6 2272.1 M3 19.0 24 252.7 402.1 1759.9 2033.8 M4 18.0 24 226.8 399.3 1780.3 2522.7
Table 4 shows that the recommended fan motor power is greater than the existing fan motor
power for the existing exhaust system drive. The recommended necessary (effective) fan power is increased by an average of 35 % of determined existing fan power. Table 4. Existing and recommended amounts of flow rate, fan air power, and motor power
Measurement point
Flow rate, (m3/s) Fan air power,
(kW) Motor (mechanical)
power, (kW) EXISTE IMPROVE EXISTE IMPROVE EXISTE IMPROVE
M1 4.87 3.5 9.35 8.29 20.42 16.47 M2 4.18 6.29 6.03 14.28 11.99 28.46 M3 2.74 3.35 4.82 6.81 9.56 13.5 M4 4.13 4.51 7.35 11.37 14.54 22.7
Calculations of the fan operating point for all four fans have shown that the fan type can
remain unchanged (TSV-8), but also that the recommended fan operating point is in a higher zone with higher values of total pressure loss and flow rate. For example, Figure 2 shows a fan operating points in the diagram with the determined and recommended points (1-EXISTE; 2-IMPROVED) of the third (M3) exhaust system pipeline.

28th International Conference on Wood Science and Technology 2017 IMPLEMENTATION OF WOOD SCIENCE IN WOODWORKING SECTOR
112
Figure 2. Fan operating point according to the determined (1-EXISTE) and recommended parameters (2-
IMPROVE) Table 5 shows the parameters important for comparing the two fan operating points of the
third pipe.
Table 5. Fan Parameters for the third pipeline
PARAMETERS IN 3TH PIPELINE (M3) EXISTE IMPROVE Pressure loss coefficient, Σξ 0.59 0.55 Total pressure loss, ∆p, Pa 1759.9 2033.8 Fan air power, PA, kW 4822 6812.7 Mechanical fan power, Pef, kW 8342.6 11746 Fan efficiency, ηV 0.578 0.58
The recommended parameters of the existing exhaust system can be achieved by applying
practical recommendations made by observing the practice in production. It is necessary: • check the fan, especially damage to the fan blades and other parts of the fan which
results in the low fan efficiency and explains the measured very low air velocity in the exhaust system;
• check the suction entrance position, which may also affect the quality of the suction on each machine due to the above assumed reduced air velocity in the pipes;
• check all flexible pipes as well as the metal tubes of the exhaust system because only minor damage can significantly reduce the pressure and flow rate;
• alert employees to the closure of those machines that are not often in use to make the suction system as efficient as possible.
On some machines, the appearance of remaining larger wood residues (eg brushing
machines) is expected to occur, so the exhaust system should not adapt to the exceptions. That

28th International Conference on Wood Science and Technology 2017 IMPLEMENTATION OF WOOD SCIENCE IN WOODWORKING SECTOR
113
needs to be addressed in a simpler way, for example by mechanical means or by installing a mobile suction unit beside such machines. All these recommendations and procedures would further contribute to the quality of the exhaust system, environmental and workers protection.
4. CONCLUSIONS
Existing 40 kW installed electric motors have been shown to be oversized for the purpose
of the existing exhaust system. Despite the large existing motor power, insufficient air velocity in the pipeline (13.5 - 20.5 m/s) and lower partial static pressures than required were measured. It is assumed that each line at some point further retracts the air into the system due to which insufficient flow rates have been measured as indicators of the inefficient work of the exhaust system. Given that the maximum air velocity for the transport of this type of material is in the calculation for the recommendation, the final necessary motor power could be less than the recommended ranging from 13.5 to 28 kW. Recommendations for improvements were made to the system analysis by the reported failure of the exhaust system. The selection of oversized electromotor and pipeline for the quality and safe operation of the exhaust system is not a guarantee. The calculation has shown the need for continuous control of damage to pipelines and fan blades and their losses (energy, air velocity, and pressure) because the impact of these defects is very important to the most important operating parameters of the exhaust system.
REFERENCES
Čavlović, A. O. (2015): Interna skripta iz kolegija Zaštita industrijskog okoliša. Šumarski fakultet Sveučilišta u Zagrebu.
Hamm, Đ. (1980a): Utjecaj stanja zraka na trajnost uređaja za odsisavanje i za pneumatski transport u drvnoj industriji. Studija.
Hamm, Đ. (1980b): Ekshaustorski uređaji u drvnoj industriji s energetskog aspekta. Studija. Horvat, I.; Krpan, J. (1967): Drvno industrijski priručnik.Tehnička knjiga, Zagreb. Kos-Pervan, A. (1997): Istraživanje dobrote zračnih konvejera u finalnoj obradi drva
(Investigation of air conveyors efficiency in furniture woodworking companies). Zagreb. Magistarski rad. Šumarski fakultet Sveučilišta u Zagrebu.
Jug, M. (2014): Primjena infracrvene termografije i termogravimetrijske metode u istraživanju činitelja zapaljenja drvnih čestica (The implementation of infrared thermography and thermogravimetric methods in the research of factors on the ignition of wood particles). Doktorska disetacija. Šumarski fakultet Sveučilišta u Zagrebu.
Novosel, A. (2015): Analiza stanja i prijedlozi poboljšanja zaštite industrijskog okoliša (Analysis of the state and suggestion of improvements in protection of industrial environment). Diplomski rad. Šumarski fakultet Sveučilišta u Zagrebu.
Sever, S. (1988): Interna skripta iz kolegija Transport u drvnoj industriji. Šumarski fakultet Sveučilišta u Zagrebu.
Pravilnik o zaštiti radnika od rizika zbog izloženosti karcinogenim ili mutagenim tvarima (Regulation on the protection of workers from the risk related to exposure to carcinogens or mutagens at work) (NN 40/2007)
Wood Products Energy Saving Guide. Energy Trust of Oregon. URL: HTTP://www.energytrust.org/library/GetDocument/3439

28th International Conference on Wood Science and Technology 2017 IMPLEMENTATION OF WOOD SCIENCE IN WOODWORKING SECTOR
114

28th International Conference on Wood Science and Technology 2017 IMPLEMENTATION OF WOOD SCIENCE IN WOODWORKING SECTOR
115
Surface Characterization of Some Woods Exposed to Accelerated Weathering
Can, Ahmet1*; Temiz, Cengiz2; Sivrikaya, Hüseyin1
1 Faculty of Forestry, Bartin University, Bartın, Turkey 2Science and Technology Research and Application Center, Bulent Ecevit University, Zonguldak, Turkey
*Corresponding author: [email protected]
ABSTRACT
In this study, the photo degradation of beech (Fagus orientalis), oak (Quercus robur), ash (Fraxinus spp.), and poplar (Populus euramericana) wood samples were investigated by accelerated weathering test in order to determine the chemical change by Attenuated total reflectance-Fourier transform infrared (ATR-FTIR), surface degradation by Scanning Electron Microscopy (SEM) and colour measurements by portable spectrophotometer. For this purpose, weathering of wood samples was performed in an accelerated weathering tester using ultraviolet irradiation with 0.85 W/m2 at 340 nm for 1000 h. According to results after 168 hours of weathering, the exposed samples showed considerable change in colour, which accompanied with the chemical change in wood components. After that time the total colour change showed a decrease. During the remaining time in weathering process total colour change lowered in comparison to 168 hours. Overall, the highest colour change was obtained with ash samples after weathering. SEM analyses showed cracks on the surface of the wood samples exposed to 1000 hours of weathering. Key words: Wood, Accelerated weathering, SEM, FTIR 1. INTRODUCTION
Wood and wood-based materials have been commonly used in the interior spaces for centuries and also constitute preferred multi-purpose materials for exterior applications. However, wood is damaged by the exposure to various biotic (insect defoliation, and borer attack, infection by pathogenic fungi, microorganisms) and abiotic factors (air pollution, nitrogen eutrophication, soil chemical stress, solar radiation, moisture) in the external environment (Thomas et al., 2002; Zhang et al., 2009).
Among the factors affecting the environmental degradation of wood, accelerated weathering reproduces photodegradation the fastest and effective, but the other factors are also important (Can and Sivrikaya, 2016). Photodegradation leads to surface degradation of wood and is defined by colour changes, loss of gloss, roughening and cracking (Cogulet et al., 2016). Degradation of wood by weathering primarily affects the wood components; in particular, results in the degradation of lignin and hemicellulose (Jin et al., 1991). Lignin is able to absorb UV light at a short wavelength below 500 nm and is responsible for the colour change when wood exposed to weathering (Sivrikaya et al., 2015; Cogulet et al., 2016). Especially in the range from 295nm to 400 nm (UV-A and UV-B), the absorption of UV light in to the wood can be explained by the detection of discolouration and formation of chromophoric groups in wood (Feist and Hon, 1984; Hon and Chang, 1984; Zhang et al., 2009).
The effect of photodegradation has been studied by authors who asserted two approaches to better understanding of wood weathering. One of these approaches is the colour measurement of wood according to CIELAB system using colour scale. Secondly, Fourier transform infrared (FT-IR) spectroscopy analysis of the surface allows the study of chemical changes in wood due to the photodegradation. It requires a simple sample preparation step and small amount of sample (Tolvaj and Oscar, 1995; Muller et al., 2003; Cogulet et al., 2016).

28th International Conference on Wood Science and Technology 2017 IMPLEMENTATION OF WOOD SCIENCE IN WOODWORKING SECTOR
116
Vibrational spectroscopy methods such as infrared and Raman spectroscopy are used to detect mechanism and monitor the extent of wood degradation. Both techniques (FT-IR and Raman) are non-destructive, require few samples, have a simple preparation step and provide some information about the lignin or holocellulose (Long et al., 1986; Rowell, 2012; Ozgenc et al., 2017).
In this study, these techniques (FTIR-ATR) were used to investigate the effect of photo degradation in terms of colour change by spectrophotometer, chemical changes by FTIR and surface degradation by SEM in hardwoods such as beech, oak, ash and poplar, exposed to accelerated weathering for 1000 hours. 2. MATERIAL AND METHOD
Beech (Fagus orientalis), oak (Quercus robur), ash (Fraxinus spp.), and poplar (Populus euramericana) specimens, free of defect and fungal infestation, were prepared from sapwood blocks with dimensions of 15x75x150 mm (H x W x L) according to AWPA Standard E4-03. Prior to weathering wood samples were put in the conditioning room at 12% RH and 22 ºC until the constant weight. 2.1. Accelerated weathering tests (QUV)
Accelerated weathering tests was performed using UV-light irradiation for 24 hours (ASTM G154 1998). The average irradiance level was 0.85 W/m2 at 340 nm and the temperature in the chamber was set to 50 °C. Four replicate samples of each treatment were exposed to accelerated weathering for 4, 24, 48, 96, 168, 500, 1000 hours respectively. 2.2. Surface characterization 2.2.1. Colour measurements
Colour measurement was performed according to ISO 7724. The CIELab system is described by three parameters: L* represents the lightness, a* and b* are the chromaticity coordinates; a*>0 describes red, a*<0 green, b*>0 yellow and b*<0 blue. L* varies from 100 (white) to zero (black).
The colour coordinates L*, a* and b* were determined for each sample before and after exposure to accelerated weathering. The colour was measured by a colour measurement device using a D65 light source. These values were used to calculate the colour change ΔE* as a function of the UV irradiation period according to Equation 1 ΔE* = [ΔL*2 + Δa*2 + Δb*2 ]1/2 (1)
Where ΔL*, Δa*, and Δb* are the changes between the initial values and the value after certain time periods of exposure. A low ΔE* corresponds to a low colour change or a means stable colour (ISO 7724-2 1984). 2.2.2. ATR-FTIR spectroscopy analysis
Fourier Transform Infrared Spectroscopy (FT-IR) analysis has been used as a technique to obtain information about the structure of the wood constituents and chemical changes taking place in the wood weathering process. FTIR spectra were obtained by a Shimadzu IRAAffinity-1 equipped with a Single Reflection ATR pike MIRacle sampling accessory. Wood surface contacted the ATR crystal, and the evanescent wave could be absorbed by the powder. The resultant attenuated radiation produced an ATR spectrum, similar to a conventional absorption spectrum (Khoshhesab, 2012). Four accumulated spectra with a resolution of 4 cm-1 were obtained for wavenumbers from 700 cm-1- 4000 cm-1 with 32 scans for each sample.

28th International Conference on Wood Science and Technology 2017 IMPLEMENTATION OF WOOD SCIENCE IN WOODWORKING SECTOR
117
2.2.3. Scanning electron microscopy
The morphology of the surfaces under nitrogen were observed with an environmental scanning electron microscope (ESEM) (Phillips Electroscan 2020) with an accelerating voltage of 5 kV. The radial surface of all samples was sputter-coated with gold using a Denton sputter coater for enhanced conductivity. Wood structure and the degradation caused by weathering were investigated.
3. RESULTS AND DISCUSSION It is known that UV radiation plays the most important role in the degradation of organic
materials when exposed to exterior conditions, with the breaking of the chemical bonds by means of the energy present in the UV rays that results in the reducing of the service life of wood material. At the end of the present study, some changes in colour towards greyish were observed when examined the wood surface with the increasing of the weathering time. For instance, the brightness of the surface decreased, and the colour turned to greyish as a result of accelerated weathering after 1000 h.
Tables 1-4 present the colour changes of the Beech, Oak, Poplar and Ash samples in the form of CIELAB parameters, namely L*, a*, b*, and ∆E* after were exposed to weathering.
Table 1. Average values of the chromatic coordinates as function of irradiation duration of Beech
Irradiation
durations (hours) L a b ∆E
0 67,28 10,30 19,68 -
4 62,72 10,01 21,78 5,12
24 62,19 10,43 24,31 6,96
48 62,37 10,36 24,52 6,97
96 62,47 10,32 24,38 6,82
168 62,56 10,14 23,71 6,37
500 64,49 9,43 21,97 3,93
1000 66,06 8,99 20,38 2,49
Table 2. Average values of the chromatic coordinates as function of irradiation duration of Oak
Irradiation
durations (hours) L a b ∆E
0 65,51 6,86 21,03 -
4 61,24 7,29 23,57 5,02
24 58,91 8,51 27,03 9,11
48 58,3 8,96 27,4 9,90
96 57,72 9,35 27,02 10,18
168 57,22 9,61 26,12 10,15
500 57,06 9,24 22,71 8,97
1000 58,37 8,83 20,33 7,5
As shown in Table 1, the light stability (L*) value of beech (Fagus orientalis) and oak (Quercus robur) sapwood samples decreased with increasing irradiation durations (h), whereas tended to increase after 500 h. In case of the poplar and ash woods, L* value stabilized after 500 hours of aging. After accelerated weathering, the lowest value regarding light stability was found 62,56 in beech, followed by 57,06 in oak, 74,13 in poplar and 69,08 in ash samples. In the early stages of the accelerated weathering, dark-coloured woods are turned to greyish, whereas light-coloured woods darkened (Feist and Hon, 1984). Temiz et al. (2007) obtained

28th International Conference on Wood Science and Technology 2017 IMPLEMENTATION OF WOOD SCIENCE IN WOODWORKING SECTOR
118
negative ΔL* values due to the darkening of the wood surfaces after the weathering. In another research performed by Salla et al. (2012), L* values decreased when the samples subjected to 200 hours of weathering.
Table 3. Average values of the chromatic coordinates as function of irradiation duration of Poplar
Irradiation durations (hours)
L a b ∆E
0 88,59 1,67 15,42 - 4 85,06 2,22 22,41 7,86
24 81,01 4,78 28,99 15,86 48 79,39 5,99 30,35 18,06 96 77,89 7,13 31,04 19,70 168 76,47 8,08 31,09 20,83 500 74,88 8,78 29,35 20,80 1000 74,13 8,92 27,31 20,08
Table 4. Average values of the chromatic coordinates as function of irradiation duration of Ash
Irradiation durations (hours)
L a b ∆E
0 84,60 3,75 18,38 - 4 80,37 4,12 25,04 7,91
24 76,36 6,65 31,17 15,50 48 74,69 7,89 32,54 17,78 96 73,11 9,06 33,16 19,46 168 71,56 10,08 33,13 20,68 500 69,95 10,93 30,69 20,45 1000 69,08 11,22 28,40 19,93
As can be seen from Tables 1-4, the changes in a* and b* values generally decreased in
beech and oak wood samples, nevertheless increased in the cases of poplar and ash woods. a* value showed a decrease in all periods in beech wood, while increased in oak wood through 500 h, following that decreased. For the b* value, the first 48 hours of beech and the first 96 hours of oak, and the first 168 hours of poplar and ash exhibited an increasing followed by decreasing in the remaining time. In the CIELAB system, a positive ∆a* correspond to reddish, and a positive ∆b* show an increase of yellow colour. It is thought that the degradation of lignin and other compounds are caused by UV radiation after weathering, subsequently the generation of o- and p-quinoid groups is due to the lignin degradation that leads to colour change (Salla et al., 2012; Feist et al., 1984; Hon and Shiraishi 2001). Since the natural colour of beech wood is reddish white, therefore it was shown that the beech samples give the highest colour value of the red. It was reported by Keskin and Atar (2007), the red colour tone in the beech wood was found to be 26% greater than oak.
The increasing in the total colour change (∆E*) regarding the exposure time was different depending on the wood species; for beech in 48 h, oak in 96 h, poplar and ash in 168 h. The reason why the colour changes were relatively may be the absence of the water in the accelerated weathering process. Earlier workers (George et al. 2005; Williams 2005) reported that water contributes the removing of the fragments on the wood surface during the weathering process. When compared to colour change among wood species the highest change was obtained in oak wood (96 hours), in addition total colour change was high in beech and oak, whereas low in poplar and ash woods. This is because the tree species having dark surface exhibit less colour change than those having light surface. Some workers studied on weathering during 12 months with Scots pine and beech indicating that the reason of less colour change in beech was explained by its having dark surface, furthermore the differences in the ratio of main

28th International Conference on Wood Science and Technology 2017 IMPLEMENTATION OF WOOD SCIENCE IN WOODWORKING SECTOR
119
and side compounds of wood that effect the photodegradation as well (Temiz et al., 2004; Budakcı and Karamanoglu 2014).
The colour changes of wood surfaces is not only visible but also chemical changes. UV light is largely responsible for wood degradation. FTIR spectroscopy has done much to help us understand the chemical mechanisms of wood degradation. Figures 1-4 show the changes in the wood surface as analysed by the FTIR method.
It is clearly seen that the peak at 3400-3200 cm-1 refers to hydrogen bonded OH group stretch, CH bonds at 2800-3000 cm-1, and the peaks at 1743 cm-1 and 1605 cm-1 respectively, indicating the absorption peaks of C=O and C-O bonds present in the hemicellulose. Furthermore, the peak at 1653 cm-1 represents the absorbed OH groups. The peak at 1510 cm-
1 originates from the lignin aromatic groups whereas the peak at 1251 cm-1 derives from the guaiacyl group present in wood. The peak at 1467 is due to C-H deformation in lignin and at 1427 cm-1 indicates the C-H group in carbohydrates. Previous authors reported the representation of the following peaks as follow: 1375 cm-1 indicates the C-H deformation in cellulose and hemicellulose, 1320 cm-1 shows the –CH vibration in cellulose and 1160 cm-1 comes up from the vibration of C-O-C group in cellulose and hemicellulose and 1058 cm-1 originates from the CO stretching in cellulose and hemicellulose, in addition 898 cm-1 reveals the C-H deformation in cellulose (Pandey, 1999; Baeza et al., 2000; Tshabalala, 2005).
Figure 1. FTIR-ATR spectra corresponding to different exposure period of test and control beech sapwood
sample
When the peak values described above are examined, we see no significant change in the case of beech wood. Figure 1 shows the lignin bands and an increase in the cellulose at the wood surface. The lack of a significant change in peak values is thought to be due to the fact that only UV light was present during the weathering process. According to Andrew (2001) DRIFT spectra showed that the wood exposed to both water and light showed a much higher degree of weathering than did the wood exposed to either water or light by itself.
0
0,02
0,04
0,06
0,08
0,1
0,12
0,14
0,16
698 1.084 1.469 1.855 2.241 2.627 3.012 3.398 3.784
Wavenumber (cm-1)
Ab
so
rban
ce (
u.m
)
0 hour
500 hours
1000 hours

28th International Conference on Wood Science and Technology 2017 IMPLEMENTATION OF WOOD SCIENCE IN WOODWORKING SECTOR
120
Figure 2. FTIR-ATR spectra corresponding to different exposure period of test and control oak sapwood sample
As can be shown from the Figure 2, while the C-H deformation peak in cellulose (898 cm-
1) increased, on the other hand significant decrease was found in C-H bonds in cellulose and hemicellulose. At the peak of 1743 cm-1, it appears that there is a decrease with the increasing of exposure time. The peak of 2916 cm-1 shows the C-H bond in methyl and methylene groups. Consequently, these peak values mentioned above were significantly lowered in a short time (Socrates, 2004; Hesse, 2005).
Figure 3. FTIR-ATR spectra corresponding to different exposure period of test and control poplar sapwood sample
Among the wood species in the present study, poplar was the most influenced by the UV
radiation. It is believed that UV has much higher impact on lignin than other wood components. This can be understood from the significant decrease in the peaks at 1510 cm-1 derived from
0
0,02
0,04
0,06
0,08
0,1
0,12
0,14
698 1.084 1.469 1.855 2.241 2.627 3.012 3.398 3.784
Wavenumber (cm-1)
Ab
so
rban
ce (
u.m
)
0 hour
500 hours
1000 hours
0
0,05
0,1
0,15
0,2
0,25
698 1.084 1.469 1.855 2.241 2.627 3.012 3.398 3.784
Wavenumber (cm-1)
Ab
so
rban
ce (
u.m
)
0 hour
500 hours
1000 hours

28th International Conference on Wood Science and Technology 2017 IMPLEMENTATION OF WOOD SCIENCE IN WOODWORKING SECTOR
121
the aromatic groups, at 1461 cm-1 arised from the C-H deformation and at 1267 cm-1 due to guaiacyl groups in lignin. Likewise, CH stress peaks as well as decreasing in the C-O, C-O-C bonds in cellulose and hemicellulose were found. It was also indicated that the peaks at 1630-1660 cm-1 are associated with the aryl ketones bonded to the -C = O, unbound with C = C in lignin and water band. The study showed that these peaks decreased in poplar samples after accelerated aging test (Temiz et al., 2006).
Figure. 4. FTIR-ATR spectra corresponding to different exposure period of test and control ash sapwood sample
After weathering, FTIR peaks at 1035 cm-1 and 1251 cm-1 were greatly diminished for ash
wood. These bonds refer to C-O and C-O-C found in hemicellulose and cellulose. Similarly, there was a significant decrease at the peak of 1510 cm-1 representing the guaiacyl lignin, and at 1251 cm-1 which describes aromatic rings in the lignin.
SEM images of the Beech, Oak, Poplar and Ash sapwood samples were exhibited in Fig. 5-8, showing wood fibres, and decomposition of cell walls. Characterization of the weathered and control samples displayed in these images. In addition to colour and chemical changes, physical changes also occur on the wood surface that weakens the chemical bonds in the cell wall and leads to intercellular stretching and cracking. With the contribution of water, the cracks can cause erosion on the wood surface. However, as the water was not used in our experiment the crack formation was not observed. Still, very few micro cracks were observed on the wood surfaces with the 1000 hours of weathering. The changes in the anatomic structure resulting from the outdoor weathering were investigated by some authors (Hon and Shiraishi, 2001; Pandey and Pitman, 2002).
Figure 5 shows that no change in the pit structure was observed. This demonstrates that the accelerated weathering process without water does not bring any changes in the chemical structure of the beech wood (Fig. 1).
Structural changes in cell walls at the microscopic level were seen from SEM micrographs after the oak, poplar and ash wood specimens were exposed to 1000 hours accelerated weathering (Fig.6-8).
0
0,05
0,1
0,15
0,2
0,25
0,3
698 1.084 1.469 1.855 2.241 2.627 3.012 3.398 3.784
Wavenumber (cm-1)
Ab
so
rban
ce (
u.m
)
0 hour
500 hours
1000 hours

28th International Conference on Wood Science and Technology 2017 IMPLEMENTATION OF WOOD SCIENCE IN WOODWORKING SECTOR
122
Figure 5. SEM analysis of the Beech wood, control (0 hours) and exposed to weathering (1000 hours) (10 µm, x5000).
Figure 6. SEM analysis of the Oak wood, control (0 hours) and exposed to weathering (1000 hours) (10 µm, x5000)
Figure 7. SEM analysis of the Poplar wood, control (0 hours) and exposed to weathering (1000 hours) (100 µm, x500).

28th International Conference on Wood Science and Technology 2017 IMPLEMENTATION OF WOOD SCIENCE IN WOODWORKING SECTOR
123
Figure 8. SEM analysis of the Ash wood, control (0 hours) and exposed to weathering (1000 hours) (100 µm, x500).
REFERENCES Baeza, J.; Freer, J. (2000): Chemical characterization of wood and its components. Wood and cellulosic
chemistry, 2(1), 275-384. Budakci, M.; Karamanoglu, M. (2014): Açık Hava Koşullarının Odunun Bazı Fiziksel Özelliklerine
Etkileri. Journal of Forestry Faculty of Kastamonu University 14.1. Can, A.; Sivrikaya, H. (2016): Accelerated Weathering Performance of Impregnated Wood Samples
Coated with Zinc by Means of Plasma-Assisted Particle Deposition. The International Research Group on Wood Protection, At Lisbon, Volume: IRG/WP 16-30682
Cogulet, A.; Pierre B.; Véronic L. (2016): Wood degradation under UV irradiation: A lignin characterization. Journal of Photochemistry and Photobiology B: Biology 158 (2016): 184-191.
Feist, W.C.; Hon, D.N.S. (1984): Chemistry of Weathering and Protection, The Chemistry of Solid Wood, American Chemical Society, 401- 454.
George, B.; Suttie, E.; Merlin, A.; Deglise, X. (2005): Photodegradation and photostabilisation of wood–the state of the art. Polymer Degradation and Stability, 88(2), 268-274.
Hesse, M.; Meier, H.; Zeeh, B. (2005): Spektroskopische Methoden in der organischen Chemie. Georg Thieme Verlag.
Hon, D.N-S.; Chang, S.T. (1984): Chang, Surface Degradation of Wood by UV-light, J.Polym. Sci. Polym.Chem. Ed. 22, 2227- 2241.
Hon, D.N.S.; Shiraishi, N. (2001): Wood and cellulosic chemistry–2nd ed., rev. and expanded.-New York and Basel. P.513-46
Jin, L.; Archer, K.; Preston, A. (1991): Surface Characteristics of Wood Treated With Various AAC, ACQ and CCA Formulations After Weathering. IRG/ WP / 2369.
Keskin, H.; Atar, M. (2007): Impacts of Impregnation with Timbercare Aqua on The Red and Yellow Colour Tone of Some Woods and Varnishes. Journal of applied polymer science, 106, 3952-3957.
Khoshhesab, Z. M. (2012): Reflectance IR spectroscopy. In Infrared Spectroscopy, Materials Science, Engineering and Technology. InTech.
Lang, P. L.; Katon, J. E.; O'Keefe, J. F.; Schiering, D. W. (1986): The identification of fibers by infrared and Raman microspectroscopy. Microchemical journal, 34(3), 319-331.
Moore, A.K.; and Owen, N.L. (2001): Infrared spectroscopic studies of solid wood. Applied Spectroscopy Reviews, 36(1), 65-86.
Müller, U.; Rätzsch, M.; Schwanninger, M.; Steiner, M.; Zöbl, H. (2003): Yellowing and IR-changes of spruce wood as result of UV-irradiation. Journal of Photochemistry and Photobiology B: Biology, 69(2), 97-105.
Özgenç, Ö.; Durmaz, S.; Boyaci, I. H.; Eksi-Kocak, H. (2017): Determination of chemical changes in heat-treated wood using ATR-FTIR and FT Raman spectrometry. Spectrochimica Acta Part A: Molecular and Biomolecular Spectroscopy, 171, 395-400.
Pandey, K.K. (1999): A study of chemical structure of soft and hardwood and wood polymers by FTIR spectroscopy. J Appl Polym Sci,71(12): 1969-75.

28th International Conference on Wood Science and Technology 2017 IMPLEMENTATION OF WOOD SCIENCE IN WOODWORKING SECTOR
124
Pandey, K. K.; Pitman, A. J. (2002): Weathering characteristics of modified rubberwood (Hevea brasiliensis). Journal of applied polymer science, 85(3), 622-631.
Rowell, R. M. (2012): Handbook of wood chemistry and wood composites. CRC press Sivrikaya, H.; Ekinci, E.; Can, A.; Tasdelen, M.; Gokmen, K. (2015): Effect of heat treatment on the
weathering and hardness properties of some wood species. Proceedings of the 11th Meeting of the Northern European Network for Wood Sciences and Engineering (WSE), Poland
Socrates, G. (2004): Infrared and Raman characteristic group frequencies: tables and charts. John Wiley & Sons.
Temiz, A.; Yıldız, Ü.C.; Kırcı, H.; Gezer, E.D.; Yıldız, S. (2004): Odunun Foto-degredasyonu. KÜ Artvin Orman Fakültesi Dergisi, 3-4, 145-156.
Temiz, A.; Terziev, N.; Jacobsen, B.; Eikenes, M. (2006): Weathering, water absorption, and durability of silicon, acetylated, and heat treated wood. Journal of Applied Polymer Science, 102(5), 4506-4513.
Thomas, F.M.; Blank, R.; Hartmann, G. (2002): Abiotic and biotic factors and their interactions as causes of oak decline in Central Europe. Forest Pathology, 34 (4-5), 277-307.
Tolvaj, L.; Faix, O. (1995): Artificial ageing of wood monitored by DRIFT spectroscopy and CIE L*a*b* colour measurements. 1. Effect of UV light. Holzforschung-International Journal of the Biology, Chemistry, Physics and Technology of Wood, 49(5), 397-404.
Tshabalala, M.A. (2005): Surface characterization. In: Rowell RM, editor. Hand- book of wood chemistry and wood composites. Boca Raton: CRC Press; p. 187-211 [chapter 8].
Williams, R. S. (2005): Weathering of Wood, Handbook of Wood Chemistry and Wood Composites, edited by Roger M. Rowell, USDA, Forest Service, Forest Products Laboratory, Madison, WI, 402-451.
Zhang, J.; Kamdem, D.P.; Temiz, A. (2009): Weathering of Copper- amine Treated Wood. Applied Surface Science, 256, 842-846.

28th International Conference on Wood Science and Technology 2017 IMPLEMENTATION OF WOOD SCIENCE IN WOODWORKING SECTOR
125
Effect of Water Repellents on the Surface Characterisation of Scots Pine (Pinus sylvestris) Exposed to Accelerated and Outdoor Weathering
Can, Ahmet1*; Sivrikaya, Hüseyin1
1 Faculty of Forestry, Bartin University, Bartın, Turkey *Corresponding author: [email protected]
ABSTRACT
Numerous chemicals have been investigated to inhibit photodegradation of wood and to protect it long term against weathering in-service. However, most of these chemicals cannot provide a long-term protection on wooden surface. Therefore, water repellent materials are needed to stabilize the wood surfaces and make it permanent against photodegradation. In this study, the influence of Poly Ethylene Glycol (PEG 600), N,N-(1,8-Naphthalene) hydroxylamine (NHA-H) and Methyl Hydrogen Silicon (MHS) were investigated against UV light. For this purpose, wood samples were impregnated with these chemicals according to full cell process (pressure or vacuum). After impregnation, the samples were exposed to accelerated weathering (500 hours) and to outdoor weathering for 6 and 12 months respectively. Optical and chemical changes on the surface of treated and untreated wood samples were studied by colour changes, glossiness and Fourier Transform Infrared Spectroscopy (FTIR) analysis. When the results regarding total colour change were examined, the best results were obtained in the samples impregnated with MHS both in the accelerated and outdoor weathering test. In the control specimens, new peaks were formed at 2927 cm-1 and 1697 cm-1, while the chemical structure maintained its integrity in samples impregnated with MHS.
Key words: Methyl Hydrogen Silicon, N,N-(1,8-Naphthalene) hydroxylamine, Poly Ethylene Glycol, Weathering 2. INTRODUCTION
Wood is treated by either biocidal or non-biocidal chemicals to protect it against biotic and abiotic causes of degradation. Wood impregnated with CCA (copper/chromium/arsenic) displays leaching which is less than preservatives free of chromium. However, due to the presence of arsenic in the CCA, its use in today has been restricted and replaced by new generation wood preservatives. The main problem of the preservatives substitution with CCA is its susceptibility to leaching from the wood material after the impregnation and corrosiveness.
Despite the use of plastic, metal, aluminium, concrete and cement products instead of wood with the advancing technology, wood is always preferred in many places because of its appearance, insulation and easy processing. Impregnated wood is considered to be a building material because it is resistant to biotic and abiotic agents, due to the aesthetic appearance and economic aspect. Wood is used in several parts in the buildings such as roofing materials, joinery and covering materials, scaffoldings, and decorative materials. Apart from such materials, wood provides services in the following places; telecommunication poles, railway sleepers, water cooling towers, marine support posts, joinery and exterior facades, roofing materials, fence poles (Kartal, 1998). Water-borne wood preservatives do not cause odour problem, moreover surface treatments can be applied to wood after impregnation, and offer a safer material for transportation and use.
Unprotected wood surfaces exposed outdoors are affected by photodegradation, leaching, wood hydrolysis and water swelling, discoloration and decay fungi. Chemical, colour, microscopic and physical changes occur on wood surface as a consequence of exposure to biotic and abiotic factors. Wood degrading factors due to the weathering are as follows;

28th International Conference on Wood Science and Technology 2017 IMPLEMENTATION OF WOOD SCIENCE IN WOODWORKING SECTOR
126
Light. It was reported that when the wood surface was exposed the weathering, 60% of the wood components are affected by the UV radiation in the wavelength range of 200-400 nm; in particular, lignin was degraded as a result of chemical reaction series. Hence, the colour of the wood exposed to sunlight turns into yellowish or brownish, and then greying. These changes are superficial, and occur only at a depth of only 0.05-0.5 mm, and in particular UV radiation initiates photodegradation by changing the chemical composition of the lignin on the wood surface.
Water: It increases the formation of free radicals by enlarging the gaps in the wood and by allowing light to penetrate deeper into wood.
O2: Oxygen molecules react with free radicals to form polymeric epoxy radicals and peroxides. Thus, oxygen provides the formation of free radicals and plays an important role on the weathering by light effect.
Temperature: The increase in temperature is accompanied by an increase in photochemical reactions in wood in addition to crack formation.
To protect wood surface against outdoor weathering, paints are used to either form a film layer on the wood surface or penetrate into wood without forming a coating layer. Protection methods against weathering should ensure the following (Temiz, 2005);
• prevention of UV radiation • modification of light absorption units being in wood components • elimination of the components causing colour change • removal of oxygen or reduction of O2 reaction • removal of free radicals generated from the light effect. Water repellents are used to protect wood material against moisture uptake and decay fungi.
Such materials reduce water absorption and delay the development of decay fungi. Although they are not classified as paints, preservatives protect wood from outdoor weathering and decay without the use of paint. Wood impregnated with preservatives under pressure generally shows high resistance to exterior conditions (Feist and Ross, 1995).
The use of biocides in wood protection for outdoor use poses an environmental risk in the case of leaching. Therefore, environmentally friendly chemicals are needed. Many traditional preservatives are used to protect wood against outdoor conditions. However, these chemicals are not effective for long-term protection on wood surface. For this reason, water repellent chemicals which should be permanent are required for protection on wood surface. In this study, Poly Ethylene Glycol (PEG 600), N, N- (1,8-Naphthalene) hydroxylamine (NHA-NA) and Methyl Hydrogen Silicone (MHS) were investigated to get insight into their effectiveness against UV radiation by recording colour changes and FTIR-ATR analysis. 2. MATERIALS AND METHODS
Sapwood samples of Scots pine free of defects and discoloration or decay were prepared with the dimensions of 1,5x7,5x15 cm (Radial x Tangential x Longitudinal) in this research.
PEG 1600 (Merck) was a clear transparent liquid at 23 ºC, NHA-H (C12H7NO3) having following properties: melting point 283-286 ºC, molecular weight 213,19, pale yellow colour, insoluble in water was provided from Alfa Aesar Methyl Hydrogen Methyl Hydrogen Silicon (MHS) was purchased from RUI Chem.
PEG was prepared as 20% concentration, whereas MHS was diluted with water for 5%. NHA-H was prepared with methanol at the concentration of 0.1%.
After the kiln dry weight was recorded, the wood samples were impregnated with water repellents under vacuum (30 min) and pressure (6 bar for 1 h). Afterwards, wet weight of the samples was done, then left to drying at 80 ºC for 2 days. Weight percent gain (WPG%) values of the samples was calculated according to equation 1.

28th International Conference on Wood Science and Technology 2017 IMPLEMENTATION OF WOOD SCIENCE IN WOODWORKING SECTOR
127
WPG(%) = ((My-M0)/M0)*100 (1) 2.1. Outdoor weathering
The outdoor weathering test was carried out for 6 and 12 months in the province of Bartin which is located 41° 38′ 4″ N, 32° 20′ 15″ E in the Western Black Sea region.
Figure 1. Weathering rack in Bartın province
2.2. Accelerated weathering
Accelerated weathering test was carried out in the device of Q-Panel Lab Products, in the laboratory of the Industrial Forest Engineering department of Bartin University. Test parameters in the device are as follows; water spray for 15 min, UV (340 nm, wavelength) at 0,85 W/m2 for 8 h and conditioning at 50 ºC for 3.45 h. Overall, this cycle was operated for 500 h totally (ASTM-G53, 1998).
2.3. Fourier Transform Infrared Spectroscopy (FTIR)
Fourier Transform Infrared Spectroscopy (FTIR, Shimadzu) instrument was used to measure the chemical analysis of the test samples before outdoor weathering. In accordance with the FTIR device, ATR Diamond/ZnSe kit (PIKE) was used to make solid measurements on the surface without causing any damage in the samples. The spectra of the samples were obtained at 700-4000 cm-1 wavelength, with a resolution of 4 cm-1 with 30 scans.
2.4. Colour measurement
Colour measurement of the test samples before and after the outdoor and accelerated weathering were carried out in accordance with ISO 7724 standards by Konica Minolta CD-600 colour meter. On the wood samples, the colour measurements from 3 different points were measured and their mean value were calculated for three replicates in each variation (ISO-7724, 1984).
The CIELab (Commission Internationale de l'Eclairage) system consists of three variants (ISO 7724). L* refers to Light stability, a* and b* chromatographic coordinates (+a* indicates red, -a* green, +b* yellow, -b* blue). The values of L*, a* and b* were measured on the samples and the color changes were determined according to the following formulas ΔL*=Lf*-Li* (3) Δa*=af*-ai* (4) Δb*= bf*- bi* (5) ΔE* = (ΔL*2 + Δa*2 + Δb*2)½ (6)

28th International Conference on Wood Science and Technology 2017 IMPLEMENTATION OF WOOD SCIENCE IN WOODWORKING SECTOR
128
3. RESULTS AND DISCUSSION The weight percent gain (WPG) values in the wood samples after impregnation were given
in Table 1. The WPG results of the samples exposed to accelerated and natural weathering respectively were 134.68%-130.99% with PEG impregnation, 115.68%-111.91% with MHS and 62.15-60.64% with NHA.
Table 1. Weight percent gain (WPG %) of the samples
Accelerated weathering Outdoor weathering
PEG 134,68 (4,64) 130,99 (7,36)
MHS 115,68 (5,49) 111,91 (12,95)
NHA 62,15 (3,92) 60,64 (18,81)
*Values in parenthesis indicate the standard deviation Under outdoor conditions, UV light plays the most important role in the degradation of
organic material with the energy of UV rays by breaking the chemical bonds in the wood. This shortens the using period of the samples in service.
The results regarding colour change after the accelerated weathering were given in Figure 2, and after outdoor weathering in Figures 3 and 4.
Figure 2. Colour change after accelerated weathering (ΔL* - first set of columns, Δa* - second set of columns,
Δb* - third set of columns, ΔE* - fourth set of columns)
Figure 3. Colour change after six months outdoor weathering (ΔL* - first set of columns, Δa* - second set of
columns, Δb* - third set of columns, ΔE* - fourth set of columns)

28th International Conference on Wood Science and Technology 2017 IMPLEMENTATION OF WOOD SCIENCE IN WOODWORKING SECTOR
129
Figure 4. Colour change after twelve months outdoor weathering (ΔL* - first set of columns, Δa* - second set of
columns, Δb* - third set of columns, ΔE* - fourth set of columns)
When ΔL* light stability was examined, all samples including treated and untreated
showed a tendency to negative direction. The darkening was observed on the surface of the samples exposed to both accelerated and outdoor weathering.
Besides, increasing darkening on the surface accompanied with the increase in the duration of outdoor weathering. In contrast to outdoor weathering lower ΔL* values were obtained by accelerated weathering.
The light stability gave better results in test samples than control. It means that both accelerated and outdoor weathering test samples have lower ΔL* values compared to the control samples. The samples impregnated with MHS were found to be the most stable with respect to light stability in the accelerated test, whereas PEG was the best in outdoor weathering involving both 6 and 12 months.
When Δa* (red-green) values were examined, tendency of a* value was positive in the accelerated test, whereas a* was negative in the outdoor test. In the case of accelerated aging test, it was considered that there was a tendency towards red colour on the surface of the samples due to the UV effect.
In the outdoor weathering test, the mold formation induced to green colour on the samples surfaces within 6 months. When the samples exposed to 12 months, the trend towards green colour was more apparent as the mold growth increased on the surface over time. The least change was in samples impregnated with MHS, but the most change was in samples impregnated with NHA-H in terms of colour.
The colour of all samples tended to be negative in Δb* (yellow-blue) colour scale. In the accelerated test, the control samples showed a tendency towards the yellow colour, while tended to blue colour in the outdoor test. In the outdoor test, the trend towards blue colour increased with the increasing in time.
When the total colour change (ΔE*) in the samples was examined, there was less colour change in the test samples than in the control or equal to the control. The highest colour change was observed with control samples in the accelerated test, but with NHA-H in the outdoor weathering test.
However, the almost same colour change values were obtained in all variations. The total colour change values obtained in the samples exposed to the accelerated test were less than those in the outdoor weathering test. The reason is that the accelerated aging test applied for 500 hours might correspond to less than 6 months compared to the outdoor weathering test, or the light intensity (0.85W/m2) applied in the accelerated test might be lower than outdoor. This means that the 500-hour accelerated aging test is equivalent to less than 6 months in the outdoor
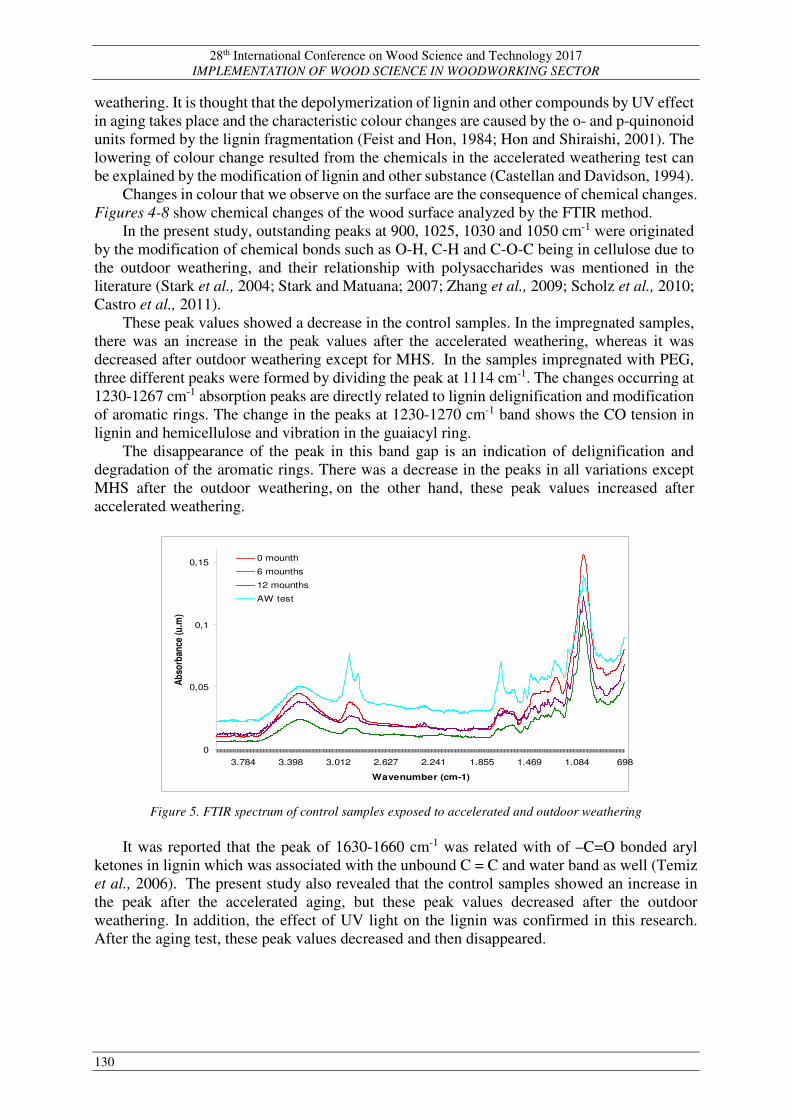
28th International Conference on Wood Science and Technology 2017 IMPLEMENTATION OF WOOD SCIENCE IN WOODWORKING SECTOR
130
weathering. It is thought that the depolymerization of lignin and other compounds by UV effect in aging takes place and the characteristic colour changes are caused by the o- and p-quinonoid units formed by the lignin fragmentation (Feist and Hon, 1984; Hon and Shiraishi, 2001). The lowering of colour change resulted from the chemicals in the accelerated weathering test can be explained by the modification of lignin and other substance (Castellan and Davidson, 1994).
Changes in colour that we observe on the surface are the consequence of chemical changes. Figures 4-8 show chemical changes of the wood surface analyzed by the FTIR method.
In the present study, outstanding peaks at 900, 1025, 1030 and 1050 cm-1 were originated by the modification of chemical bonds such as O-H, C-H and C-O-C being in cellulose due to the outdoor weathering, and their relationship with polysaccharides was mentioned in the literature (Stark et al., 2004; Stark and Matuana; 2007; Zhang et al., 2009; Scholz et al., 2010; Castro et al., 2011).
These peak values showed a decrease in the control samples. In the impregnated samples, there was an increase in the peak values after the accelerated weathering, whereas it was decreased after outdoor weathering except for MHS. In the samples impregnated with PEG, three different peaks were formed by dividing the peak at 1114 cm-1. The changes occurring at 1230-1267 cm-1 absorption peaks are directly related to lignin delignification and modification of aromatic rings. The change in the peaks at 1230-1270 cm-1 band shows the CO tension in lignin and hemicellulose and vibration in the guaiacyl ring.
The disappearance of the peak in this band gap is an indication of delignification and degradation of the aromatic rings. There was a decrease in the peaks in all variations except MHS after the outdoor weathering, on the other hand, these peak values increased after accelerated weathering.
Figure 5. FTIR spectrum of control samples exposed to accelerated and outdoor weathering
It was reported that the peak of 1630-1660 cm-1 was related with of –C=O bonded aryl
ketones in lignin which was associated with the unbound C = C and water band as well (Temiz et al., 2006). The present study also revealed that the control samples showed an increase in the peak after the accelerated aging, but these peak values decreased after the outdoor weathering. In addition, the effect of UV light on the lignin was confirmed in this research. After the aging test, these peak values decreased and then disappeared.
0
0,05
0,1
0,15
6981.0841.4691.8552.2412.6273.0123.3983.784
Wavenumber (cm-1)
Ab
sorb
ance
(u
.m)
0 mounth
6 mounths
12 mounths
AW test

28th International Conference on Wood Science and Technology 2017 IMPLEMENTATION OF WOOD SCIENCE IN WOODWORKING SECTOR
131
Figure 6. FTIR spectrum of the samples treated with PEG after accelerated and outdoor weathering
Figure 7. FTIR spectrum of the samples treated with MHS after accelerated and outdoor weathering New peaks were observed at 2162 cm-1 in the samples treated with MHS. This is due to the
structure of the chemical used in the experiments, not related with the weathering. In the samples impregnated with PEG, peak formation was observed at this point after the outdoor weathering. The 2161 cm-1 bond which is extremely strong and shows the -S-C≡N bond in the aromatic rings (Socrates, 2004; Hesse et al., 2005).
0
0,05
0,1
0,15
0,2
6981.0841.4691.8552.2412.6273.0123.3983.784
Wavenumber (cm-1)
Ab
so
rban
ce (
u.m
)
0 mounth
6 mounths
12 mounths
AW test
0
0,05
0,1
0,15
0,2
0,25
0,3
0,35
0,4
0,45
0,5
0,55
0,6
0,65
0,7
0,75
6981.0841.4691.8552.2412.6273.0123.3983.784
Wavenumber (cm-1)
Ab
so
rban
ce (
u.m
)
0 mounth
6 mounths
12 mounths
AW test

28th International Conference on Wood Science and Technology 2017 IMPLEMENTATION OF WOOD SCIENCE IN WOODWORKING SECTOR
132
Figure 8. FTIR spectrum of the samples treated with NHA-H after accelerated and outdoor weathering The peak at 2916 cm-1 refers the C-H bond in methyl and methylene groups. There was no
change in the samples impregnated with MHS, while increasing with NHA and control, and decreasing with PEG after accelerated weathering. After the outdoor weathering test, decreasing occurred in the samples treated with control and NHA and then disappeared (Socrates, 2004; Hesse et al., 2005). 4. CONCLUSION
MHS was found to be effective in reducing the total colour changes. Colour changes of the samples exposed to outdoor weathering were similar or higher then the control samples. At the end of 12 months, the highest colour change was obtained in the samples impregnated with NHA-H. This might be due to the lower concentration or UV blocking behaviour of NHA-H.
According to the results of chemical analysis, the most effective chemical was MHS, because there was no change in chemical structure of wood both in accelerated and in outdoor weathering test. As a result, lignin which is responsible for the colour change in wood was blocked by MHS, resulted in the protection to the UV rays. Acknowledgements: This study was supported by Bartin University, Scientific Research Coordination Office (Project number:2016-FEN-C-001). REFERENCES
Kartal, S.N. (1998): CCA Emprenye Maddeleri ile Korunan Ağaç Malzemenin Dayanıklılık, Yıkanma ve Direnç Özellikleri, İÜ. Fen Bilimleri Enstitüsü, Doktora Tezi, İstanbul.
Temiz, A. (2005): Benzetilmiş Dış Hava Koşullarının Emprenyeli Ağaç Malzemeye Etkileri, KTÜ. Fen Bilimleri Enstitüsü, Doktora Tezi, Trabzon.
Feist, W.; Ross, A.S. (1995): Performance and durability of finishes on previously coated cca-treated wood. Forest Prod. J. 45(9):29-36.
ASTM G53. (1988): Standard practice for operating light and water exposure apparatus for exposure of nonmetallic materials.
ISO 7724-2. (1984): Paints and varnishes-Colorimetry- Part 2: Color measurement, ISO Standart.
0
0,02
0,04
0,06
0,08
0,1
0,12
0,14
6981.0841.4691.8552.2412.6273.0123.3983.784
Wavenumber (cm-1)
Ab
so
rban
ce (
u.m
)
0 mounth
6 mounths
12 mounths
AW test

28th International Conference on Wood Science and Technology 2017 IMPLEMENTATION OF WOOD SCIENCE IN WOODWORKING SECTOR
133
Feist, W.C.; Hon, D.N.S. (1984): Chemistry of weathering and protection. 401-451. DOI: 10.1021/ba-1984-0207.ch011
Hon, D.N.S.; Shiraishi, N. (2001): Wood and cellulosic chemistry–2nd ed., rev. and expanded.-New York and Basel. P.513-46
Castellan, A. and Davidson, R. S. (1994): Steady-state and fluorescence emission from abies wood. J. Photochem. Photobiol. A: Chem. 78:275-279.
Stark, N.M.; Matuana, L. M.; Clemons, C. M. (2004): Effect of Processing Method on Surface and Weathering Characteristics of Wood-Flour/HDPE Composites, Journal of Applied Polymer Science, 93, 1021-1030.
Stark, N. M.; Matuana, L.M. (2007): Characterization of Weathered Wood-Plastic Composite Surfaces Using FTIR Spectroscopy, Contact Angle and XPS, Polmer Degradation and Stability, 92, 1883-1890.
Zhang, J.; Kamdem, P.D.; Temiz, A. (2009): Weathering of Copper-Amine Treated Wood, Applied Surface Science, 256, 842-846.
Scholz, G.; Windeisen, E.; Liebner, F.; Bäucker, E.; Bues, C.T. (2010): Wood Anatomical Fetaures and Chemical Composition of Prosopis kuntzei from the paraguayan chaco, IAWA Journal, 31, 1, 39-52.
Castro, K.; Pirinci, E.; Proietti, N.; Manso, M.; Capitani, D.; Vicini, S.; Madariaga, J. M.; Carvalho. M.L.D. (2011): Assessment of the Weathering Effects on Cellulose Based Materials Through A Multianalytical Approach, Nuclear Instruments and Methods in Physics Research B, 269, 1401-1410.
Temiz, A.; Terziev, N.; Jacobsen, B.; Eikenes, M. (2006): Weathering, Water Absorption, and Durability of Silicon, Acetylated, and Heat-Treated Wood, Journal of Applied Polymer Science, 102, 4506-4513.
Socrates G. (2004): Infrared and Raman characteristic group frequencies: tables and charts. John Wiley&Sons.
Hesse, M.; Herbert, M.; Bernd, Z. (2005): Spektroskopische Methoden in der organischen Chemie. Georg Thieme Verlag

28th International Conference on Wood Science and Technology 2017 IMPLEMENTATION OF WOOD SCIENCE IN WOODWORKING SECTOR
134

28th International Conference on Wood Science and Technology 2017 IMPLEMENTATION OF WOOD SCIENCE IN WOODWORKING SECTOR
135
Contribution to the Optimisation of Esterification of Beech Wood by Citric Acid
Marin Hasan1*, Adriana Hasan2, Gordana Orešković1, Branimir Jambreković1, Suzana
Antolović2 1University of Zagreb, Faculty of Forestry, Svetosimunska 25, 10002 Zagreb, Croatia
2Ante Starčevića 16, 10370 Dugo Selo, Croatia 3PhD candidate at University of Zagreb, Faculty of Forestry, Svetosimunska 25, 10002 Zagreb, Croatia
*Corresponding author: [email protected]]
ABSTRACT Different concentrations of chemicals in water solution, final temperatures and curing periods were used for common beech wood modification with Citric acid (CA). In distilled water (at 60 °C) extracted specimens were impregnated with citric acid (CA) water solutions of different concentrations with phosphate catalyst. After impregnation, specimens were air-dried and then cured at elevated temperatures using different regimes. The effects of different modification regimes were assessed through the values of weight percentage gain (WPG), anti-swelling efficiency (ASE), mass loss caused by leaching (MLL) and leachability coefficient of gained mass (LCM). Optimal combination of modification parameters was chosen for each of mentioned properties and then only one optimal combination of modification parameters was selected. Keywords: Anti Swelling Efficiency (ASE), Chemical modification, Leachability Coefficient of gained Mass (LCM), Mass Loss caused by Leaching (MLL), Weight Percentage Gain (WPG); Wood Modification
1. INTRODUCTION
Chemical modification implicates etherification, esterification or acetylation between some chemical and OH groups of cellulose, hemicelluloses and lignin. Important parameters for successful modification by some chemical are the chemical concentration in dilution, temperature and processing time, type of catalyst and wood species.
One of the most researched wood modifying chemical is DMDHEU (1,3-dimethylol-4,5-dihidroxyethylene urea). Wood modified by DMDHEU has increased dimensional stability for up to 50 – 60 %. Pine, Asian cedar and Beech wood modified by DMDHEU have increased durability against several basidiomycetes, although this modification doesn’t comply with many nowadays preservatives). Lignocellulosic materials modified by DMDHEU have a problem of formaldehyde release caused by the hydrolytic destruction of N-methylol groups at higher modification temperatures. Because of the formaldehyde problem, scientists are introducing new non-formaldehyde chemicals.
One non-formaldehyde chemical is cyclic alcohol furfurol which can be easily produced from agricultural biomass. Wood furfurilation can result in huge WPG. Furfurilated wood has very good biological durability and dimensional stability. On one hand, furfurol, as a cyclic chemical is capable of modifying lignin while many other wood modifying chemicals mainly modify holocellulose. On the other hand, the main problem of this chemical is that it is susceptible to self-polymerisation.
Although wood acetylation has been developed to the large scale production, there are still lots of problems with this process. Other non-formaldehyde chemicals are polycarboxylic acids (PCA). By application of three-carboxylic acids, the first anhydride arises from two neighbouring carboxyl groups for first bond creation, and the second anhydride arises from other two neighbouring carboxyl groups. This possibility of bonding the second anhydride with

28th International Conference on Wood Science and Technology 2017 IMPLEMENTATION OF WOOD SCIENCE IN WOODWORKING SECTOR
136
hydroxyl groups of wood ensures cross-linking, bond stability and durability (Bischof Vukušić et al., 2006; Hasan, 2010). Katovic et al. (2004), Bischof Vukusic et al. (2006), Hasan (2010), Hasan et al. (2006, 2007, 2012), Despot et al. (2008), Šefc et al. (2009, 2012) have esterified several wood species with citric acid (CA) and gained very good dimensional stability and biological durability, while micro tensile strength decreased for 30 %, and compression strength parallel to the grain stayed unchanged.
The aim of this article is to show the process of optimisation of modification of beech wood with citric acid (CA) and the method of selection of optimal regime. 2. MATERIALS AND METHODS
Home-grown beech wood (Fagus sylvatica L.) was used for this research. Wood lattices close to bark were sawn from the air-dried and afterwards kiln-dried radial planks. All specimens for modification optimisation were cut out of selected lattices (R×T×L: 20×20×10 ± 0.1 mm), successively axially selected, marked and prepared according to DIN 52 184 (1979) (Table 1). For biological durability and compression strength parallel to the grain tests specimens were prepared according to HRN EN 113 (1996) (R×T×L: 15×25×50 ± 0.1 mm) and according to HRN D. A1.045 (R×T×L: 20×20×40 ± 0.1 mm; Table 2). 2.1. Chemicals, solutions, modification and leaching procedures
A water solution of different concentrations of CA and catalyst were prepared for modification. At 60 °C extracted specimens were full-cell impregnated with prepared solutions (Despot et al., 2008). Afterwards specimens were slowly air dried and oven dried till constant mass and then thermocondensed at different temperatures for different times (Table 1). Table 1. Combinations of chemicals concentrations, temperature and time of thermocondensation, number of specimens
Modification Treatment
Code
Chemicals concentrations [%] Number
of specimens
Thermocondensation
CA Catalyst Temperature
[°C] Time [h]
1A 7.0 5.0 30
140 10
2A 7.0 6.5 30 3A 7.0 8.0 30 4A 10.5 7.5 30 5A 10.5 9.75 30 6A 10.5 12.0 30 1B 7.0 5.0 30
160 10
2B 7.0 6.5 30 3B 7.0 8.0 30 4B 10.5 7.5 30 5B 10.5 9.75 30 6B 10.5 12.0 30 1C 7.0 5.0 30
180 2.5
2C 7.0 6.5 30 3C 7.0 8.0 30 4C 10.5 7.5 30 5C 10.5 9.75 30 6C 10.5 12.0 30
Specimens prepared for extraction and leaching were conditioned at standard climate, and
then leached (full-cell impregnated with distilled water and heated in an oven at 60 °C for 48 hours). Every 12 hours the water was changed. Then the specimens were again air-dried and

28th International Conference on Wood Science and Technology 2017 IMPLEMENTATION OF WOOD SCIENCE IN WOODWORKING SECTOR
137
oven-dried to constant mass. After modification and after the first and second cycle of leaching weight percentage gain (WPG), anti-swelling efficiency (ASE), mass loss caused by leaching (MLL), leachability coefficient of gained mass (LCM) were measured in order to define optimal modification parameters (Table 1). 2.2. WPG, ASE, MLL and LCM determination
Weight percentage gain of modified specimens (WPG) was calculated as a ratio of difference of oven-dried mass after modification (m2) and oven-dried mass before modification (m1) and m1 (1).
[ ]%1001
12 ×−
=m
mmWPG (1)
Dimensional stability of non-leached and leached specimens was quantified by comparing the volumetric swelling coefficients (αV; equation 2) of treated and control specimens. After modification and air-drying, all specimens including controls were oven dried at 103 °C to a constant mass and then full-cell impregnated with distilled water following atmospheric soak for 24 hours. The volumetric anti-swelling efficiency (ASE) was calculated according to (3):
[ ]%100*)(
O
OSV V
VV −=α (2)
[ ]%100*)(
VC
VTVCASEα
αα −= (3)
where: V is the volume, indexes: S represents water-saturated, O oven dried at 103 °C, C control, T treated (modified).
Mass loss of specimens caused by leaching (MLL) was calculated by dividing the difference of oven-dried mass of specimens after modification-before leaching (m2) and oven dry mass of specimens after leaching (m3) and mass of specimens before leaching (m2) (4).
[ ]%100*2
32
m
mmMLL
−= (4)
Leachability coefficient of mass gained by modification (LCM) was calculated by dividing the difference of oven-dried mass of specimens after modification-before leaching (m2) and oven dry mass of specimens after leaching (m3) by the difference of oven dry mass of specimens after modification-before leaching (m2) and starting mass (m1) (5).
12
32
mm
mmLCM
−−
= (5)
3. RESULTS AND DISCUSSION
Either by increasing the concentration of citric acid or a catalyst, WPG is constantly increasing at each thermocondensation temperature. WPG of specimens cured at 140 °C is significantly higher than of those cured at 160 °C while specimens cured at 180 °C had the smallest WPG for all chemicals concentrations. This can be explained by partially catalyst evaporation and partially evaporation of thermally destroyed wooden components during thermocondensation.

28th International Conference on Wood Science and Technology 2017 IMPLEMENTATION OF WOOD SCIENCE IN WOODWORKING SECTOR
138
1A 2A 3A 4A 5A 6A
Modification Treatment Code
0
2
4
6
8
10
12
14
16
18
20
WP
G [
%]
Mean Mean±SE Mean±1,96*SE
A
1B 2B 3B 4B 5B 6B
Modification Treatment Code
0
2
4
6
8
10
12
14
16
18
20
WP
G [
%]
Mean Mean±SE Mean±1,96*SE
B
1C 2C 3C 4C 5C 6C
Modification Treatment Code
0
2
4
6
8
10
12
14
16
18
20
WP
G [
%]
Mean Mean±SE Mean±1,96*SE
C
Figure 1. Weight percentage gain (WPG) of specimens thermo-condensed at: A= 140 °C, 10h; B= 160 °C, 10 h
and C= 180 °C, 2.5 h
Combinations 1, 2 and 3 represent the concentration of CA of 7.0 % and combinations 4, 5 and 6 represent the concentration of CA of 10.5 %. It is visible that the greatest increase in WPG occurs when a greater concentration of CA is introduced than when greater catalyst concentration is introduced. Therefore, for all temperatures, as the optimal combination of chemicals concentrations, combination 4 was selected. Since specimens cured at 140 °C had the greatest WPG, combination 4A was selected as the best combination for WPG property (Figure 1). It was expected that higher temperature would lead to smaller MLL since this regularity is present at WPG. The greatest MLL had specimens thermocondensed at 140 °C for most chemicals combinations, while the smallest MLL had specimens thermocondensed at 160 °C. When comparing MLL of first and second leaching cycle it is visible that the smallest difference in MLL between first and second leaching cycle had specimens thermocondensed at 180 °C. Furthermore it was expected that greater concentrations of catalyst ensure a greater amount of CA bonded to wood cell wall compounds, but the results of MLL stand in contrast to that. That could be explained with a greater density of catalyst than of CA and at catalyst concentration increase MLL also increased at all thermocondensation temperatures. All mentioned led to the conclusion that combination 1 lead to the smallest MLL the same as the temperature of 160 °C. For MLL optimal combination of modification, parameters is 1B (Figure 2).
4A 4B 4C
Modification Treatment Code
0
2
4
6
8
10
12
14
16
18
WP
G [
%]
Mean Mean±SD Mean±1,96*SD
OPTIMUM

28th International Conference on Wood Science and Technology 2017 IMPLEMENTATION OF WOOD SCIENCE IN WOODWORKING SECTOR
139
Figure 2. Mass loss caused by leaching (MLL) of specimens thermo-condensed at: A= 140 °C, 10 h; B= 160 °C,
10 h; C= 180 °C, 2.5 h, after first and second leaching
For each CA concentration, LCM is almost constant with very slight increase as the concentration of catalyst increased. That is a pure proof that the catalyst after thermocondensation was leached out of the specimens. Greater concentration of CA resulted in smaller LCM which confirms that greater concentration of CA resulted in greater esterification. Therefore the combination 4 of chemicals concentrations is optimal for LCM. No significant difference in LCM between specimens thermocondensed at 140 and 160 °C was determined for almost all combinations of chemicals concentrations. Thermocondensation temperature of 180 °C resulted in the greatest LCM which is logical due to thermal degradation of thermally unstable wood cell wall compounds which were leached out of the specimens. Modification parameters combination 4A resulted in the smallest LCM after both cycles of leaching and it is optimal for CLM (Figure 3).
1A
L
1A
2×
L
2A
L
2A
2×
L
3A
L
3A
2×
L
4A
L
4A
2×
L
5A
L
5A
2×
L
6A
L
6A
2×
L
Modification Treatment Code and Leaching
0
2
4
6
8
10
12
ML
L [
%]
Median 25%-75% Min-Max
A
1B
L
1B
2×
L
2B
L
2B
2×
L
3B
L
3B
2×
L
4B
L
4B
2×
L
5B
L
5B
2×
L
6B
L
6B
2×
L
Modification Treatment Code and Leaching
0
2
4
6
8
10
12
ML
L [
%]
Median 25%-75% Min-Max
B
1C
L
1C
2×
L
2C
L
2C
2×
L
3C
L
3C
2×
L
4C
L
4C
2×
L
5C
L
5C
2×
L
6C
L
6C
2×
L
Modification Treatment Code and Leaching
0
2
4
6
8
10
12
ML
L [
%]
C
Median 25%-75% Min-Max
1A i 1A 2×i 1B i 1B 2×i 1C i 1C 2×i
Modification Treatment Code and Leaching
0
1
2
3
4
5
6
ML
L [
%]
Median 25%-75% Min-Max
OPTIMUM

28th International Conference on Wood Science and Technology 2017 IMPLEMENTATION OF WOOD SCIENCE IN WOODWORKING SECTOR
140
Figure 3. Coefficient of leachability of beech-wood specimens thermo-condensed at: A= 140 °C, 10 h; B= 160
°C, 10 h; C= 180 °C, 2.5 h, after first and second leaching
Figure 4: Anti-swelling efficiency (ASE) of specimens modified at: A= 140 °C, 10h; B= 160 °C, 10h; C= 180
°C, 2.5h, before and after first and second leaching Dimensional stability of beech wood modified by CA was improved for 35 to 45 %. ASE
significantly decreased after leaching. Statistically, the greatest ASE had specimens modified at 140 °C and the smallest ASE had specimens modified at 180 °C. At increasing the concentration of CA, ASE significantly increased while at increasing concentration of catalyst, ASE significantly decreased for all thermocondensation temperatures. According to all mentioned optimal regime for ASE was 4A (Figure 4).
After summarising all optimal combinations of modification parameters it can be concluded that between investigated parameters optimal combination is 4A (Table 2).
1A
L
1A
2×
L
2A
L
2A
2×
L
3A
L
3A
2×
L
4A
L
4A
2×
L
5A
L
5A
2×
L
6A
L
6A
2×
L
Modificiation Treatment Code and Leaching
0,0
0,2
0,4
0,6
0,8
1,0
1,2
1,4
1,6
1,8
2,0
LC
M
Median 25%-75% Min-Max
A
1B
L
1B
2×
L
2B
L
2B
2×
L
3B
L
3B
2×
L
4B
L
4B
2×
L
5B
L
5B
2×
L
6B
L
6B
2×
L
Modificiation Treatment Code and Leaching
0,0
0,2
0,4
0,6
0,8
1,0
1,2
1,4
1,6
1,8
2,0
LC
M
Median 25%-75% Min-Max
B
1C
L
1C
2×
L
2C
L
2C
2×
L
3C
L
3C
2×
L
4C
L
4C
2×
L
5C
L
5C
2×
L
6C
L
6C
2×
L
Modificiation Treatment Code and Leaching
0,0
0,2
0,4
0,6
0,8
1,0
1,2
1,4
1,6
1,8
2,0
LC
M
Median 25%-75% Min-Max
C
4A
i
4A
2×
i
4B
i
4B
2×
i
4C
i
4C
2×
i
Modification Treatment Code and Leaching
0,0
0,2
0,4
0,6
0,8
1,0
1,2
LC
M
Median 25%-75% Min-Max
OPTIMUM
1A
1A
L
1A
2×
L
2A
2A
L
2A
2×
L
3A
3A
L
3A
2×
L
4A
4A
L
4A
2×
L
5A
5A
L
5A
2×
L
6A
6A
L
6A
2×
L
Modification Treatment Code and Leaching
-20
-10
0
10
20
30
40
50
60
AS
E [
%]
Median 25%-75% Min-Max
A
1B
1B
L
1B
2×
L
2B
2B
L
2B
2×
L
3B
3B
L
3B
2×
L
4B
4B
L
4B
2×
L
5B
5B
L
5B
2×
L
6B
6B
L
6B
2×
L
Modification Treatment Code and Leaching
-20
-10
0
10
20
30
40
50
60
AS
E [
%]
Median 25%-75% Min-Max
B
1C
1C
L
1C
2×
L
2C
2C
L
2C
2×
L
3C
3C
L
3C
2×
L
4C
4C
L
4C
2×
L
5C
5C
L
5C
2×
L
6C
6C
L
6C
2×
L
Modification Treatment Code and Leaching
-20
-10
0
10
20
30
40
50
60
AS
E [
%]
Median 25%-75% Min-Max
C
4A
4A
i
4A
2×
i
4B
4B
i
4B
2×
i
4C
4C
i
4C
2×
i
Modification Treatment Code and Leaching
0
10
20
30
40
50
60
AS
E [
%]
Median 25%-75% Min-Max
OPTIMUM

28th International Conference on Wood Science and Technology 2017 IMPLEMENTATION OF WOOD SCIENCE IN WOODWORKING SECTOR
141
Table 2. Summary of optimal modification parameter combination for researched properties
Researched property of modified wood Optimal Parameter combination WPG 4A MLL 1B LCM 4A/4B* ASE 4A
OPTIMAL COMBINATION 4A *4A was chosen due to lover temperature (140 °C instead of 160 °C)
4. CONCLUSIONS On the basis of weight percentage gain, mass loss caused by leaching, leachability
coefficient of gained mass and anti-swelling efficiency optimal regime for beech wood modification by citric acid was chosen (c(CA)=10.5 %, c(catalyst)=7,5 %, t=140 °C, τ=10 hours).
Although the optimum regime of the wood modification by CA was assessed, it is necessary to continue the examination of other favourable parameters combinations for measured properties regardless of the regime.
REFERENCES Bischof Vukušić, S., Katović, D., Schramm, C., Trajković, J., Šefc, B. (2006): Polycarboxylic acids as
non-formaldehyde anti-swelling agents for wood. Holzforschung 60(4):439-444. Despot, R., Hasan, M., Jug, M., Šefc, B. (2008): Biological durability of wood modified by citric acid.
Drvna industrija. 59(2): 55-59. Hasan, M. (2010): The influence of different modification procedures onto biological durability of
modified wood. Dissertation. University of Zagreb, Faculty of Forestry, Zagreb. pp. 259 [in Croatian language].
Hasan, M., Despot, R., Katović, D., Bischof Vukusić, S., Bogner, A., Jambreković, V. (2007): Citric Acid – Promising Agent for Increased Biological Durability of Wood. Proceedings of the 3rd European Conference on Wood Modification. Cardiff, UK, October 15-16th 2007. pp. 275-278.
Hasan, M., Despot, R., Šefc, B., Ištok, I., Sedlar, T., Lacić, R. (2012): Optimisation of Modification of Beech Wood by Citric Acid. Proceedings of the Sixth European Conference on Wood Modification (Electronic Edition). Ljubljana, Slovenia, September 17-18th 2012. (ISBN: 978-961-6144-35-3), pp. 63-71.
Hasan, M., Despot, R., Trajković, J., Šefc, B. (2006): Role of modification processes at increasing biological durability of wood. Proceedings European Union – Challenges and perspectives for the wood-processing industry. Zagreb, Croatia, October 13th 2006, pp. 153-158.
Katović, D., Bischof Vukušić, S., Trajković, J., Šefc, B. (2004): Alternative agents and methods for chemical modification of wood. Drvna industrija. 55(4): 175-180.
Šefc, B., Hasan, M., Trajković, J., Despot, R., Jug, M., Katović, D., Bischof Vukušić, S. (2009): Selected Properties of Beech Wood Modified by Citric Acid. Proceedings of the 4th European Conference on Wood Modification. Stockholm, Sweden, April 27-29th 2009. pp. 425-428.
Šefc, B., Trajković, J., Sinković, T., Hasan, M., Ištok, I. (2012): Compression strength of Fir and Beech Wood modified by Citric Acid. Drvna industrija. 63(1): 45-50.

28th International Conference on Wood Science and Technology 2017 IMPLEMENTATION OF WOOD SCIENCE IN WOODWORKING SECTOR
142

28th International Conference on Wood Science and Technology 2017 IMPLEMENTATION OF WOOD SCIENCE IN WOODWORKING SECTOR
143
Bendability of Thermally Modified Oak (Quercus robur F)
Milan Gaff 1*; František Kačík1, 2; Danijela Domljan3; Veronika Vondrova1; Marian Babiak1 1Department of Wood Processing, Faculty of Forestry and Wood Sciences, Czech University of Life Sciences
Prague, Czech Republic 2Department of Chemistry and Chemical Technologies, Faculty of Wood Sciences and Technology, Technical
University in Zvolen, Zvolen, Slovakia 3Department of Furniture and Wood Products, Faculty of Forestry, University of Zagreb, Zagreb, Croatia
*Corresponding author: [email protected]
ABSTRACT
Thermally modified wood is increasingly used as a structural element in wooden buildings. Depending on the use of the material, different material characteristics that are telling of the bendability of the material can be used. Important characteristics include the force at the limit of proportionality FE, the deflection at the limit of proportionality YE, the force at the modulus of rupture FP and the deflection at the modulus of rupture YP. Since the flexibility also depends on the thickness of the material, it is appropriate to express the bendability by a ratio of the thickness of the material to the smallest achievable bend radius. In the research we used an analysis of the properties, using characteristics determining the minimum bend radius Rmin and the coefficient of bendability Koh. These characteristics were determined for thermally modified oak wood (Quercus robur F), focusing on determining the effect of the different temperatures used in the thermal modification (160, 180, 210 °C). The results measured in these test specimens were compared with the results measured in a set of test specimens not subjected to thermal modification (20 °C). To identify these material characteristics, software developed by us for accurately determining boundary points in force-deformation diagrams obtained during measurement was used. In this article we present a part of the research results, which resulted in new knowledge about the bendability of oak wood thermally modified at different temperatures. Key words: Coefficient of bendability, Deflection at the limit of proportionality, Force at the limit of proportionality, Force at the modulus of rupture, Minimum bend radius 1. INTRODUCTION
The bendability of a material is a property that can be classified either positive or a negative material characteristic, depending on the purpose of use. In the case of materials intended for bending (solid wood in bentwood furniture) (Kurjatko et al., 2010; Bal, 2014; Bond and Ansell, 1998), this property is desirable, whereas in the case of materials intended for construction, this property is considered a property that has a negative impact on the stability and durability of the built structure (Bao, 2001; Guntekin et al., 2014; Hsu, 1988).
In recent years, there has been a growing interest in thermally modified wood. This is due to several factors, the most important of which include: the smaller production of durable raw wood material, restrictions on the use of toxic substances, taxes, legislation, the increased interest in durable building materials, and others.
Thermal modification of wood is a prospectively expanding method of modification, which can be termed as an environmental method of modification (Hill, 2006; Kubovsky and Babiak, 2009; Gašparík and Barcík, 2013; 2014; Svoboda et al., 2015; Miftieva et al., 2016; Hrčka and Babiak, 2012).
In the present study, we applied the model created in study (Gaff et al., 2016) to the bendability analysis, according to which we defined the correct relations for determining the minimum bend radius Rmin, which can then be used to calculate the coefficient of bendability Kbend.

28th International Conference on Wood Science and Technology 2017 IMPLEMENTATION OF WOOD SCIENCE IN WOODWORKING SECTOR
144
For the purpose of accurately determining the necessary data, we used a prototype of a program designed to accurately determine boundary points in a force-deformation diagram for the analysis of the force-deformation diagrams. 2. MATERIALS AND METHODS 2.1. Materials
We used four sets of oak specimens for the experiment (Quercus robur F), which came from the Poľana region in Slovakia. The 20 × 20 × 300 mm (t × w × l) specimens were subjected to thermal modification (160, 180, 210 °C). The specimen used for comparation was not subjected to thermal modification (20 °C). These samples were air-conditioned in the conditioning room (ϕ = 65 ± 3 % and t = 20 ± 2 ºC) for more than six months to achieve an equilibrium moisture content (EMC) of 12%.
2.1.1. Thermal modification
The thermal modification was divided into three following stages: 1. Heating and drying:
In this stage, the temperature in the dryer is increased to 100 °C with steam. The drying medium is hot air. Throughout this stage, the wood is dried to approximately zero moisture content.
2. Thermal modification: In the second stage, the temperature is increased to 185 – 230 °C for 2 – 3 hours. The
temperature and duration of the effect is given by the requirements for the class of Thermowood products (Thermo-S a Thermo-D).
3. Cooling and conditioning: In the third stage, the wood is gradually cooled to 80 – 90 °C, and the humidity is stabilized
so that the final moisture content stabilizes at 4 – 7 %. 2.2. Methods
2.2.1. Determining the coefficient of bendability
For bending measurements, the support span was adjusted to L1 = 20 × h. The samples were bent in mid-length using a universal testing machine FPZ 100 (TIRA, Germany) in accordance with EN 310 (EN 310, 1993). The loading speed was 3 mm/min so that the test duration would not exceed 2 min. Maximum breaking forces of samples were recorded using datalogger ALMEMO 2690-8 (Ahlborn GmbH, Germany).
To identify the characteristics, a program developed by us with the task of accurately identifying and quantifying data that can be obtained from the force-deformation diagram was used. The wood density was determined before and after testing according to ISO 13061-2 (ISO 13061-2, 2014). The moisture content of samples before and after testing was measured according to ISO 13061-1 (ISO 13061-1, 2014), as well as drying to oven-dry state.
2.2.2. Evaluation and Calculation
The measured data were used to create a force-deformation diagram, in which we applied the method of accurate identification of boundary points developed by authors:
• force at the limit of proportionality FE, • deflection at the limit of proportionality YE, • force at the modulus of rupture FP, • deflection at the modulus of rupture YP.

28th International Conference on Wood Science and Technology 2017 IMPLEMENTATION OF WOOD SCIENCE IN WOODWORKING SECTOR
145
We focused on evaluating bendability using the minimum bend radius and coefficient of bendability. For the analysis we used the equations (1, 2, 3 and 4) that we deduced from publication (Gaff et al., 2016).
The minimum bend radius RminB (eq. 1.) and the coefficient of bendability KohB (eq. 2.) are
based on the bending geometry.
2
h
2max
y
maxy*8
20
l
minBR −+= (1)
2
h
2max
y
maxy*8
20
l
h
RminB
h
bendBK
−+
==
(2) RminB – minimum bend radius KohB – coefficient of bendability The minimum bend radius RminC (eq. 3.) and the coefficient of bendability KohC (eq. 4.) are
based on the basic bending equation.
maxy*12
20
l
minCR = (3)
max12
20
min
*y
l
h
CR
h
bendCK ==
(4) RminC – minimum bend radius KohC – coefficient of bendability. The effect of individual factors was evaluated using ANOVA, specifically utilizing
Fisher’s F-test in STATISTICA 12 (Statsoft Inc., USA). The results were evaluated using a 95% confidence interval, which represents a significance level of 0.05 (P < 0.05).
To determine the effect of the wood density on the monitored characteristics, we used a correlation analysis and coefficient of determination r2, which can be used to describe the dependence between the monitored characteristics. The relationship between the monitored characteristics was described based on Spearman's correlation.
3. RESULTS AND DISCUSSION The article presents a part of the obtained results relating to researching parameters of
bendability of thermal modified oak (Quercus robus F). The results of the one-factor analysis of variance evaluating the effect of the thermal
modification on the YE, YP, FP, and FE values are shown in Table 1. Based on the significance level P, we can state that the temperature of the thermal modification has a statistically very significant effect on the YE, YP, FP, and FE.

28th International Conference on Wood Science and Technology 2017 IMPLEMENTATION OF WOOD SCIENCE IN WOODWORKING SECTOR
146
Table 1. Statistical evaluation of the factors affecting the values of the YE, YP, FP and FE
YE (mm)
Monitored factor Sum of squares
Degree of freedom
Variance Fisher's F - Test
Significance level P
Intercept 351.716 1 351.716 2960.216 *** 1) Thermal modification 1.389 3 0.463 3.896 *** Error 4.990 42 0.119 The respective model explains roughly 100 % of the total sum of squares.
YP (mm)
Monitored factor Sum of squares
Degree of freedom
Variance Fisher's F - Test
Significance level P
Intercept 1019.191 1 1019.191 2557.285 *** 1) Thermal modification 65.119 3 21.706 54.464 *** Error 16.739 42 0.399 The respective model explains roughly 79.6 % of the total sum of squares.
FP (N)
Monitored factor Sum of squares
Degree of freedom
Variance Fisher's F - Test
Significance level P
Intercept 185531798 1 185531798 1050.211 *** 1) Thermal modification 13786198 3 4595399 26.012 *** Error 7419781 42 176661 The respective model explains roughly 65.0 % of the total sum of squares.
FE (N)
Monitored factor Sum of squares
Degree of freedom
Variance Fisher's F - Test
Significance level P
Intercept 58870804 1 58870804 2640.063 *** 1) Thermal modification 1011247 3 337082 15.116 *** Error 936559 42 22299 The respective model explains roughly 51.9 % of the total sum of squares.
NS – not significant. *** - significant. Significance was accepted at P < 0.05 The difference between the values of the deflection at the limit of proportionality YE is not
significant (Figure 1). It is evident that there is a statistically insignificant difference between the values measured in 20 °C and 160 °C sets of specimens, as well as between 180 °C and 210°C specimens. However, we can see that higher temperatures of 180 °C and 210°C resulted in a 16 % drop in the measured values in comparison with temperatures of 160 °C. The decline in mechanical properties may be due to changes in the main wood components. At high temperatures, first hemicelluloses are degraded, and lignin is depolymerized and then condensed (Nakajima et al., 2009; Kačíková et al., 2016; Čabalová et al., 2016). As a result of these changes, the deflection value decreases; its increase at the modulus of rupture at 210 °C may be caused by the cleavage of glycosidic bonds in the cellulose and the shortening of its chains, as well as by the increasing crystallinity of the cellulose.
Figure 1. The effect of thermal modification on the deflection at the modulus of rupture and at the limit of
proportionality

28th International Conference on Wood Science and Technology 2017 IMPLEMENTATION OF WOOD SCIENCE IN WOODWORKING SECTOR
147
We can see similar behavior to that observed during the evaluation of the deflection at the modulus of rupture YP and at the limit of proportionality YE in the evaluation of the force at the limit of proportionality FE and the force at the modulus of rupture FP (Figure 2). In both characteristics, there is an evident significant drop in values due to the application of temperatures of 180 °C and 210 °C. When applying a temperature of 160 °C, we found a 5.6 % decline in FP values; when the temperature was increased to 180°C, this decline was 39 % compared to untreated specimens, and at 210 °C we achieved a drop of up to 49.2 % in comparison with values measured in untreated (20 °C) test specimens (Figure 2). The dependence between the FE and the temperature of the thermal modification was not as significant, although the trend and the statistical significance coincided with that of the FP.
Svoboda et al. (2017) were analyzed the size of forces during the bending of beech and aspen wood. The results of their work indicate the primary values of the force at the modulus of rupture at a level of 1600 N for beech wood and 1100 N for aspen wood. In the case of the force at the limit of proportionality, the values were 830 N for beech wood and 610 N for aspen wood. Considering the lower wood density values, this corresponds with the data measured by us.
Figure 2. The effect of thermal modification on the force at the modulus of rupture and at the limit of
proportionality The minimum bend radius increases statistically significantly due to increasing
temperatures applied during thermal modification, in both RminB and RminC (Figure 3). We can observe an average difference of 32 % between the RminB and RminC. A significant increase in the monitored characteristics was achieved by applying a temperature of 180 °C; this increase was up to 73 % in comparison with untreated (20 °C) test specimens.
Figure 3. The effect of thermal modification on the minimum bend radius

28th International Conference on Wood Science and Technology 2017 IMPLEMENTATION OF WOOD SCIENCE IN WOODWORKING SECTOR
148
Given the statistically significant increase in the minimum bend radius caused by the temperature increase during thermal modification, a decrease in the coefficient of bendability is logical (Figure 4). The difference between KohB and KohC values is approximately 32 %. We can observe that the KohB values decrease linearly as the thermal modification temperature increases. In the case of the KohC, we do not observe such a linear decrease; the graph shows a statistically insignificant difference in KohC values between specimens subjected to 180 °C and 210 °C.
Figure 4. The effect of thermal modification on the coefficient of bendability
Table 2. Comparison of the effect of the material on YE, YP, FP and FE values using Duncan’s test
YE (mm)
Thermal modification (1)
2.9018 (2)
2.9622 (3)
2.6825 (4)
2.5245 1 20°C 0.677 0.135 0.016 2 160°C 0.677 0.072 0.007 3 180°C 0.135 0.072 0.279 4 210°C 0.016 0.007 0.279
YP (mm)
Thermal modification (1)
6.4018 (2)
5.2729 (3)
3.4458 (4)
3.7255 1 20°C 0.000 0.000 0.000 2 160°C 0.000 0.000 0.000 3 180°C 0.000 0.000 0.295 4 210°C 0.000 0.000 0.295
FE (N)
Thermal modification (1)
1245.5 (2)
1301.3 (3)
1053.2 (4)
929.47 1 20°C 0.375 0.004 0.000 2 160°C 0.375 0.000 0.000 3 180°C 0.004 0.000 0.054 4 210°C 0.000 0.000 0.054
FP (N)
Thermal modification (1)
2628.0 (2)
2474.4 (3)
1603.8 (4)
1334.7 1 20°C 0.387 0.000 0.000 2 160°C 0.387 0.000 0.000 3 180°C 0.000 0.000 0.133 4 210°C 0.000 0.000 0.133
The results of Duncan's tests (Table 2) show that the temperature applied during thermal
modification significantly affects the deflection at the modulus of rupture YP. In this case, there was only an insignificant difference between specimens thermally modified at 180 °C and 210

28th International Conference on Wood Science and Technology 2017 IMPLEMENTATION OF WOOD SCIENCE IN WOODWORKING SECTOR
149
°C (P = 0.295). The result shown in Figure 1, indicating that the YE values are affected less significantly than YP values, was confirmed. In this case, a statistically significant difference was only confirmed between untreated wood and wood modified at 210 °C.
In the case of the force at the modulus of rupture and the force at the limit of proportionality, there was an insignificant difference between specimens subjected to 20 °C and 160 °C, as well as specimens subjected to 180 °C and 210 °C.
Hovewer the amount of statistical analyses were done, in this article there is shown just a part of the results. One of correlation results is presented in the Table 3 and Figure 5.
The results of the correlation analysis in Table 3 show the degree of dependence between the monitored characteristics. In most cases, the degree of dependence exceeded 50 %; the interdependence can therefore be considered significant. It is evident from the results in Figure 7 how the individual characteristics affect each other. Table 3. Spearman's correlation for each monitored material
Variables YE (mm) YP (mm) FE (N) FP (N) KohB KohC RminB RminC YE (mm) 0.371 0.497 0.511 0.406 0.490 -0.470 -0.469 YP (mm) 0.371 0.686 0.808 0.742 0.885 -0.855 -0.855 YP (mm) 0.497 0.686 0.806 0.680 0.689 -0.711 -0.711 FP (N) 0.511 0.808 0.806 0.811 0.873 -0.844 -0.845 KohB 0.406 0.742 0.680 0.811 0.804 -0.890 -0.890 KohC 0.490 0.885 0.689 0.873 0.804 1.000 -0.895 -0.895 RminB -0.470 -0.855 -0.711 -0.844 -0.890 -0.895 1.000 RminC -0.469 -0.855 -0.711 -0.845 -0.890 -0.895 1.000
Figure 5. Correlation matrix of evaluated characteristics

28th International Conference on Wood Science and Technology 2017 IMPLEMENTATION OF WOOD SCIENCE IN WOODWORKING SECTOR
150
4. CONCLUSION
1. The deflection at the modulus of rupture YP significantly increases as the thermal modification temperature increases, while a significantly lower FP value is required to achieve it. From a practical point of view, this means that wood modified at temperatures above 180°C is deformed at a much higher level with smaller forces. There is therefore no need to expect a higher degree of risk with its application in building structures. In terms of the wood species, oak can be considered a very suitable wood that has significantly higher characteristics after thermal modification than teak or other hardwoods.
2. The values of the minimum bend radius correspond with the size of the deflection. As the thermal modification temperature increases, the minimum bend radius also increases, causing the Koh values to decrease. There was no statistically significant difference between values measured at temperatures of 20°C and 160°C. There was also no difference between the values measured in specimens modified at 180°C and 210°C.
3. No level of significance was found between the monitored characteristics and the density of individual thermally modified specimens.
Acknowledgements: We are grateful for the support of the University-wide Internal Grant Agency (CIGA) of the Faculty of Forestry and Wood Sciences at Czech University of Life Sciences Prague. Project 2016-4308. REFERENCES Bal, B.C. (2014): Flexural properties. Bonding performance and splitting strength of LVL reinforced
with woven glass fiber. Construction and Building Materials 51(1). pp. 9-14. Bao, F.; Fu, F.; Choong, E.T; Hse, C. (2001): Contribution factor of wood properties of three poplar
clones to strength of laminated veneer lumber. Wood and Fiber Science 33(3). pp. 345-352. Bond, I.P.; Ansell, M.P. (1998): Fatigue properties of joined wood composites: Part I. Statistical
analysis. Fatigue master curves and constant life diagrams. Journal of Material Science 33(11). pp. 2751-2762.
Čabalová, I.; Kačík, F.; Tribulová, T. (2016): The Effects of Heat Treatment on the Chemical Alterations of Oak Wood. Key Engineering Materials, Vol. 688, 44-49.
Gaff, M.; Vokaty, V.; Babiak, M.; Beki, C.B. (2016): Coefficient of wood bendability as a function of selected factors. Construction and building materials. 126 (2016). 632-640.
Gašparík, M.; Barcík, Š. (2013): Impact of plasticization by microwave heating on the total deformation of beech wood. BioResources 8(4). pp. 6297-6308.
Gašparík, M.; Barcík, Š. (2014): Effect of microwave heating on bending characteristics of beech wood. BioResources 9 (3). 4808-4820.
Guntekin, E.; Ozkan, S.; Yilmaz, T. (2014): Prediction of bending properties for beech lumber using stress wave method. Maderas. Ciencia y Tecnología 16(1). pp. 93-98.
Hill, C.A.S. (2006). Wood Modification: Chemical. Thermal. and other Processes. John Wiley & Sons. Hoboken. NJ. USA. pp. 260.
Hrčka, R.; Babiak, M. (2012): Some non-traditional factors influencing thermal properties of wood. Wood Research 57(3). 367-373.
Hsu, W.E. (1988): Laminated veneer lumber from aspen. In: Proceedings of the 22nd International Particleboard/Composite Maerial Symposium. March 22-24. Pullman. WA. pp. 257-269.
Kačíková, D.; Kačík, F.; Čabalová, I.; Ďurkovič, J. (2013): Effects of thermal treatment on chemical, mechanical and colour traits in Norway spruce wood. Bioresource Technology 144, 669-674.
Kubovsky, I.; Babiak, M. (2009): Color changes induced by CO2 laser irradiation of wood surface. Wood Research 3. 61-66.
Kurjatko, S.; Čunderlík, I.; Dananajová, J.; Dibdiaková, J.; Dudas, J.; Gáborík, J.; Gaff, M.; Hrčka, R.; Hudec, J.; Kačík, F.; Kúdela, J.; Lagaňa, R.; Laurová, M.; Mamoň, M.; Mišíková, O.; Račko, V.;

28th International Conference on Wood Science and Technology 2017 IMPLEMENTATION OF WOOD SCIENCE IN WOODWORKING SECTOR
151
Rohanová, A.; Solár, R. (2010): Wood quality parameters determining its end use. Ivan Makovíny. Štefan Šteller (eds.). Technical University in Zvolen. Slovakia. 352 p. (in Slovak)
Miftieva, E.; Gaff, M.; Svoboda, T.; Babiak, M.; Gašparík, M. (2016): Effect of selected factors on bending characteristics of beech wood. BioResources 11(1). 599-611.
Nakajima, M.; Furuta, Y.; Ishimaru, Y.; Ohkoshi, M. (2009): The effect of lignin on the bending properties and fixation by cooling of wood. Journal of wood science 55(4), 258-263.
Svoboda, T.; Ruman, D.; Gaff, M.; Gašparík, M.; Miftieva, E.; Dundek, L. (2015): Bending characteristics of multilayered soft and hardwood materials. BioResources 10(4). 8461-8473.
Svoboda, T.; Gaffová, Z.; Rajnoha, R.; Šatanová, A.; Kminiak, R. (2017): Bending Forces at the Proportionality Limit and the Maximum – Technological Innovations for Better Performance in Wood Processing Companies. BioResources 12(2). pp. 4146-4165.
EN 310 (1993): Wood-based panels -- Determination of modulus of elasticity in bending and of bending strength. European Committee for Standardization, Brussels, Belgium.
ISO 13061-2 (2014): Physical and mechanical properties of wood -- Test methods for small clear wood specimens -- Part 2: Determination of density for physical and mechanical tests. International Organization for Standardization, Geneva, Switzerland.
ISO 13061-1 (2014): Physical and mechanical properties of wood -- Test methods for small clear wood specimens -- Part 1: Determination of moisture content for physical and mechanical tests. International Organization for Standardization, Geneva, Switzerland.

28th International Conference on Wood Science and Technology 2017 IMPLEMENTATION OF WOOD SCIENCE IN WOODWORKING SECTOR
152

28th International Conference on Wood Science and Technology 2017 IMPLEMENTATION OF WOOD SCIENCE IN WOODWORKING SECTOR
153
Effect of Bio-Based Additives on Physico-Mechanical Properties of Medium Density Fibreboards
Hosseinpourpia, Reza1,2*; Adamopoulos, Stergios1; Mai, Carsten2; Hemmilä, Venla1
1 Department of Forestry and Wood Technology, Faculty of Technology, Linnaeus University, Växjö, Sweden 2 Department of Wood Biology and Wood Products, Faculty of Forestry, Georg-August-University Göttingen,
Göttingen, Germany *Corresponding author: [email protected]
ABSTRACT
Dimensional stability of wood-based panels is generally improved with application of suitable additives. Most of these additives, such as paraffin wax, are petroleum-based and with relatively high cost, and therefore, it is desirable to develop low-cost and effective substitutes from renewable resources. This work studied the potential of using a renewable water-repellent additive, such as tall oil fatty acid, for lab-scale manufacturing of medium density fibreboards (MDF). Tall oil fatty acid (TOFA) was used at 1 and 3% w/w of urea formaldehyde (UF) resin. MDF panels with similar concentrations of paraffin wax (wax) and panels without adding a water-repellent agent were served as controls. It was assessed the dimensional stability of the panels in terms of thickness swelling and water uptake after 4 and 24h immersion in water, and their mechanical performance in terms of modulus of elasticity, modulus of rupture and internal bonding. Results showed no obvious differences in the strength behaviour of the panels by addition of water-repellent agents. Dimensional stability, however, considerably improved by addition of TOFA, but it was still inferior when compared to that provided by wax. Key words: Dimensional stability, wood-based panels, paraffin wax, tall oil fatty acid, water-repellent additives, strength properties 1. INTRODUCTION
Wood-based panel is a general term for a wide range of different wood-derived products composed of strands, particles, fibres, or veneers of wood, and bonded with synthetic adhesives, mainly urea-formaldehyde (UF), phenol-formaldehyde (PF), melamine-urea formaldehyde (MUF), and polymeric diphenylmethane diisocyanate (PMDI), under heat and pressure to form composite materials. These panels show reversible and irreversible swelling when they are exposed to high relative humidity or immersed in water. Reversible swelling of the panels is related to the annealing of amorphous wood polymers (Hosseinpourpia et al., 2017), while irreversible swelling is attributed to the springback of densified materials, such as wood particles or fibres, and the breakage of inter- or intra-adhesive bonds (Hsu et al. 1988).
A traditional approach to overcome this problem is to improve the dimensional stability of wood-based panels with application of small amount of water repellents agents, such as emulsified paraffin wax (wax). This is because micro-particles of wax emulsions can penetrate deep into the capillary structure of wood, and the strongly hydrophobic nature of the wax prevents the uptake of water through the capillaries (Borgin and Corbett, 1970). However, addition of wax in higher amounts adversely affects the bond quality and the strength of the panel (Hundhausen et al., 2009). Moreover, wax is a relatively high cost substance as a by-product of the petroleum distillation process.
Hyvönen et al. (2007) revealed that the bio-based oil such as tall oil, a by-product from kraft pulping process, is capable to improve the dimensional stability of wood. Crude tall oil is characterized as viscous and sticky dark brown liquid that is ill-smelling prior to refining (Marda, 2006). The refined tall oil is less brown and viscous but oily (Baumassy, 2014). Tall oil fatty acid (TOFA) is refined from crude tall oil and consists predominantly of free-fatty

28th International Conference on Wood Science and Technology 2017 IMPLEMENTATION OF WOOD SCIENCE IN WOODWORKING SECTOR
154
acids e.g. oleic acid and linoleic acid. TOFA has the largest market for end-uses compared to the other tall oil distillation products and produced at 90–98% purity, which may deviate depending on the end-use application (Panda, 2013). The main uses for fatty acids include protective coatings and inks, chemical intermediates, soaps and detergents and ore flotation (Panda 2013).
The present study aimed at investigating the effect of a bio-based additive, this case tall oil fatty acid (TOFA), on the physical and mechanical properties of medium density fibreboards. For comparison, panels made with conventional wax and without a water-repellent agent were used. 2. EXPERIMENTAL
MDF panels were manufactured by standardized procedures that simulated industrial production in the laboratory. Dry wood fibres (Steico Steinmann & Co. GmbH, Germany), with moisture content below 5%, were mixed with UF resin for 3 min using a rotary drum adhesive blender fitted with a pneumatic spray gun. UF adhesive was mixed with ammonium sulphate as a hardener just before its application to the fibres. The water repellent agents (TOFA, wax) were then added, according to Table 1, and further mixed with fibres for another 3 min.
Following the blending treatment, the mixture was weighed and then formed into a mat on an aluminium caul plate, in a 450 × 450 mm2 forming box. To reduce the mat height, cold pressing was applied first. The hot pressing was performed in a manually controlled electrical-heated press. The maximum pressure, temperature and total press time were 20 N mm-2, 190°C and 10 min, respectively. The panels were then trimmed to a final size of 400 × 400 × 10 mm3 after cooling. Three experimental panels were manufactured for each treatment. The density of the panels after trim was 750-771 kg m-3. The samples with similar density levels were selected for mechanical and dimensional stability tests. Table 1. Dosage of adhesive, hardener and water-repellent agents in MDF panels
UF1 (%)
Hardener2 (%)
wax2 (%)
TOFA2 (%)
14 3 - - 14 3 1 - 14 3 3 - 14 3 - 1 14 3 - 3
1) The concentrations represent percentage resin based on dry fibre 2) The concentrations represent percentage additive based on dry resin
2.1. Determination of dimensional stability and mechanical properties
Determinations of thickness swelling and water uptake were done according to a modified version of EN 317 (1993) using 5 samples (50 × 50 mm2) per board (n= 15). The length, width and thickness of samples were measured before and after immersion in the water bath at 20±2°C for 4 and 24 hours. Percentage thickness swelling and water absorption of samples were calculated.
A three-point bending test was performed according to EN 310 (1993) to determine the modulus of elasticity (MOE) and modulus of rupture (MOR) using a Zwick machine (model 010). Four samples (50 × 350 mm2) per MDF board (n= 12, per treatment) were tested. The span of the supports was 200 mm, and the loading speed was 8 mm min-1. The internal bond strength test was performed following EN 319 (1993) using Zwick machine (model 010). Five samples (50 × 50 mm2) per MDF board (n= 15, per treatment) were tested. Metal plates were

28th International Conference on Wood Science and Technology 2017 IMPLEMENTATION OF WOOD SCIENCE IN WOODWORKING SECTOR
155
glued to both sides of the specimens with hot melt glue (CM ultra 250, Henkel Technologies France SAS). The samples were pulled in the direction of thickness or across the surface of the panel until they failed. Tests were performed with a loading speed of 8 mm. min-1. 3. RESULT AND DISCUSSION
Results of bending testing of the MDF categories are presented in Figure 1. Based on standard EN 622-5 (2009), the minimum requirements for MOR and MOE of MDF panels for indoor application are 22 N mm-2 and 2500 N mm-2, respectively. All the MDF categories, regardless of their bio- or petroleum-based hydrophobic agents, fulfilled the minimum requirement of the standard for bending strength and stiffness (Figure 1a, b).
Figure 1. Mean moduli of rupture (MOR, a) and elasticity (MOE, b) of MDF categories manufactured by using bio- or petroleum-based additives (TOFA and wax). The bars show standard deviation.
The results of internal bond (IB) strength also showed that the MDF categories were able
to meet marginally the minimum requirement of EN 622-5 (2009) of 0.6 N mm-2 (Figure 2). In general, application of bio- or petroleum-based water repellent agents had no negative effect on mechanical strength of the MDF categories. As explained previously, the mechanical properties of wood-based panels are directly and linearly related to their density (Jarusombuti et al., 2012; Amini et al., 2013), and thus the similar mechanical behaviour of the MDF categories can be explained by similarities in their density.
0
5
10
15
20
25
30
35
40
45
UF UF-1%wax UF-3%wax UF-1%TOFA UF-3%TOFA
MO
R (
N m
m-2
)
0
500
1000
1500
2000
2500
3000
3500
4000
4500
UF UF-1%wax UF-3%wax UF-1%TOFA UF-3%TOFA
MO
E (
N m
m-2
)
a
b

28th International Conference on Wood Science and Technology 2017 IMPLEMENTATION OF WOOD SCIENCE IN WOODWORKING SECTOR
156
Figure 2. Mean internal bonding (IB) of MDF categories manufactured by using bio- or petroleum-based additives (TOFA, wax). The bars show standard deviation.
The water-related properties of MDF categories demonstrated a different trend than their
mechanical performance. As expected, use of water repellent agents could enhance the dimensional stability of the panels as compared to those made without any additive (Figure 3a, b). Addition of small amount of the bio-based water-repellent agent (1%), TOFA, caused a similar thickness swelling as control category without a hydrophobic agent after 4h, while it was considerably reduced the thickness swelling of MDF categories after 24h. Addition of 3% TOFA decreased the thickness swelling of MDF categories after both 4h and 24h measuring time. Similar trends have seen in terms of water uptake of the panels, which it was not improved by addition of low dosage of TOFA (1%), but strongly decreased by application of higher concentration of TOFA (3%). The wax additive, however, performed better than TOFA at both 1% and 3% loading levels in terms of thickness swelling and water uptake after 4h and 24h.
Figure 3. Thickness swelling (a) and water uptake (b) of MDF categories manufactured by using bio- or petroleum-based additives (TOFA, wax). The bars show standard deviation.
In addition, MDF categories that produced with higher concentration of TOFA (3%) and
with both loading levels of wax (1% and 3%) fulfilled the minimum requirement of EN 622-5 for thickness swelling after 24h at 20%. The better performance of MDF panels that
0.0
0.1
0.2
0.3
0.4
0.5
0.6
0.7
0.8
UF UF-1%wax UF-3%wax UF-1%TOFA UF-3%TOFA
Inte
rna
l b
on
din
g (
N m
m-2
)
0
5
10
15
20
25
30
35
40
45
UF UF-1%wax UF-3%wax UF-1%TOFA UF-3%TOFA
Th
ickn
ess
Sw
elli
ng
(%
)
4h
24h
0
20
40
60
80
100
120
UF UF-1%wax UF-3%wax UF-1%TOFA UF-3%TOFA
Wa
ter
up
take
(%
)
4h
24h
a
b

28th International Conference on Wood Science and Technology 2017 IMPLEMENTATION OF WOOD SCIENCE IN WOODWORKING SECTOR
157
manufacture with wax addition might be attributed to the better dispersion of emulsified wax at the fibre surfaces during mixing process in comparison with TOFA, which was resulted in higher stability of the samples in terms of water uptake and thickness swelling. Nevertheless, the results of present study indicate the great potential of TOFA to be applied as a water-repellent agent in MDF panels.
4. CONCLUSIONS
The use of bio- or petroleum-based water repellent agents (TOFA, wax) in manufacturing MDF panels bonded with UF did not alter their mechanical properties (MOR, MOE, internal bonding). TOFA could reduce the thickness swelling and water uptake of the MDF panels, especially at the higher loading level (3%). However, wax performed much better than TOFA in this respect and could fulfil the requirements for thickness swelling set by the EN 622-5 (2009) standard. Although TOFA proved to be inferior to wax as regards its hydrophobation effect on MDF panels, it is an interesting bio-based material to study further and optimise its application for a better interaction with the fibre surfaces. Acknowledgements: Reza Hosseinpourpia, Stergios Adamopoulos and Carsten Mai acknowledge the financial contribution of VINNOVA, Swedish Governmental Agency for Innovation Systems (planning grant, No. 2015-04162, VINNMER Marie Curie Incoming project, grant No. 2015-04825). Stergios Adamopoulos is grateful to the financial provided by the Crafoord Foundation, Research grant No. 20160533. REFERENCES Amini, M. H. M.; Hashim, R.; Hiziroglu, S.; Sulaiman, N. S.; Sulaiman, O. (2013): Properties of
particleboard made from rubberwood using modified starch as binder. Composites: Part B 50: pp. 259-264.
Baumassy, M. (2014): The tall oil industry: 100 years of innovation. In: Presentation at Pine Chemicals Association International Conference, Seattle, Washington, September, 2014. 21-23.
Borgin, K.; Corbett, K. (1970) The stability and weathering properties of wood treated with various oils. Plast Paint Rubber 14(3): pp. 69-72.
Hosseinpourpia, R.; Adamopoulos, S.; Holstein, N.; Mai, C. (2017): Dynamic vapour sorption and water-related properties of thermally modified Scots pine (Pinus sylvestris L.) wood pre-treated with proton acid. Polymer Degradation and Stability 138: pp. 161-168.
Hundhausen, U.; Stohldreier, R.; Militz, H.; Mai, C. (2009): Procedural influence on the properties of particleboards made from AKD modified chips. European Journal of Wood and Wood Products 67 (3): pp. 303-311.
Hsu, W.E.; Schwald, W.; Schwald, J; Shields, J.A. (1988): Chemical and physical changes required for producing dimensionally stable wood-based composites. Wood Science and Technology 22 (3): pp. 281-289.
Hyvönen, A.; Nelo, M.; Piltonen, P.; Hormi, O.; Niinimäki, J. (2007): Using iron catalyst to enhance the drying properties of crude tall oil-based wood preservative. Holz als Roh- und Werkststoff 65 (2): pp.105-111.
Jarusombuti, S.; Bauchongkol, P.; Hiziroglu, S.; Fueangvivat, V. (2012): Properties of rubberwood medium-density fiberboard bonded with starch and urea-formaldehyde. Forest Product Journal 62 (1): pp. 58-62.
Panda, H. (2013): Handbook on Tall Oil Rosin Production, Processing and Utilization. Asia Pacific Business Press Inc., Delhi, 1-480.

28th International Conference on Wood Science and Technology 2017 IMPLEMENTATION OF WOOD SCIENCE IN WOODWORKING SECTOR
158

28th International Conference on Wood Science and Technology 2017 IMPLEMENTATION OF WOOD SCIENCE IN WOODWORKING SECTOR
159
Image and FT-IR Analysis of Blended Particles
Medved, Sergej1*; Jože Resnik1; Jambreković, Vladimir2; Španić, Nikola2; Antonović Alan2
1 University of Ljubljana, Biotechnical Faculty, Department of Wood Science and Technology, Ljubljana, Slovenia
2 University of Zagreb, Faculty of Forestry, Zagreb, Croatia *Corresponding author: [email protected]
ABSTRACT
Blending is an important stage of wood-based composite production process, namely a relatively small amount of adhesive is applied on a relatively large surface, espoecially if particles and fibres are in qiestion. To visualize the presence od colourless adhesive appropriate dying technique should be used. The purpose of this paper is to present the possibility to determine the presence of adhesive by using FT-IR spectroscopy and to determine the surface covered with adhesive, by using dying technique and image analysis, when blending fines from different wood species. It was determined that we can determine differences between FT-IR spectra of blended and unblended particles. With image analysis we determined that surface covered with adhesive at fine particles averages between 23 and 27%, and that adhesive is non uniformly distributed within and between particles. Key words: FT-IR spectroscopy, image analysis, particles, share of adhesive, wave number 1. INTRODUCTION
The quality of blending is an important factor influencing the quality of particle and fibre based wood-based composites, where a relatively small amount of adhesive is sprayed on relatively large surface. However, this is not the only challenge. The distribution of adhesive on constituent surface should also be uniformly distributed within and between constituents, which are different in size and shape (Lehmann, 1965 and 1968). Hill and Wilson (1987) determined that although smaller particles have higher specific area and that they could receive more adhesive, the relative share of adhesive on smaller particles is lower. Dunky (1988) determined, the area that adhesive covers the particles depends on the size of particles. Higher area covered with adhesive was determined on bigger particles (lower specific surface area). Also Kamke et al. (1996) stated that uniform distribution of adhesive would resulted in particleboards with better properties (1996).
The determination of the distribution of adhesive on particle surface as well as the surface covered with adhesive is challenging, firstly because of the droplet size and secondly due to the colour of the adhesive. Later is especially true in case of urea-formaldehyde (UF) adhesive application. UF adhesive is colourless, hence difficult to visualize on wood surface. In order to emphasize the resinated area of UF adhesive on wood surface several techniques have been used such as dying of adhesive (Lehmann, 1965; Lehmann, 1968; Scott, 2001; Loxton et al., 2003; Medved and Resnik, 2004; Grisby and Thumm, 2012), staining (Van Herwijnen et al., 2013) and FT-IR (Niemz et al., 1990; Körner et al., 1992; Medved and Resnik, 2010).
The aim of this paper is to present the possibly to use image analysis and FT-IR spectroscopy to determine the surface of particle covered with adhesive.
2. MATERIALS AND METHODS
For the purpose of research particles from beech (Fagus sylvatica), oak (Quercus robur) and spruce (Picea abies) were used. We only used fines, that means particles fraction between

28th International Conference on Wood Science and Technology 2017 IMPLEMENTATION OF WOOD SCIENCE IN WOODWORKING SECTOR
160
0,237 and 0,6 (particles that remained on the sieve with mesh size 0,237 mm but passed through the sieve with mesh size 0,6 mm). The size of particle chosen for the experiment was due to its highest share in surface layer. Each wood species was separately blended with urea-formaldehyde adhesive to which wax emulsion (1% s/s) and Rhodamin B (0,5 s/s) as dye was added. The blending ratio was 11,5% (w/w o.d. particles). The adhesive was sprayed on particles by pressurized nozzle technique. The nozzle pressure was 3,5 bars. The time of adhesive spraying was 3 minutes, followed by 3 minutes of mixing. Blended particles were, for 4 minutes exposed to temperature 180˚ C.
For the determination of surface covered with adhesive image analysis was used. We used a microscope with the fluorescent light source on which the CCD camera was attached (Figure 1).
Površina iveri [Particle surface]
Površina lepila [Adhesive surface]
Monitor [Monitor]Racunalnik [Computer]
Mikroskop [Microscope]
Fotoaparat [Camera]
Figure 1. Microscope and CCD camera for image scoping and schematic layout of particle (black outline)
and adhesive (red outline) surface determination
Surface covered with adhesive (SCA%) was calculate in accordance to following equation: ���% =���� (1)
where: - AA stands for the surface covered with adhesive in mm2 and - AP stands for the whole particle surface mm2. Beside image analysis, we also used Fourier Transform Infrared (FT-IR) spectroscopy for
the determination of adhesive on particles. The technique used in this research was the Diffuse Reflectance Infrared Furier Transform (DRIFT) technique. The DRIFT technique is the most commonly used for particles, glued or coloured surfaces. The samples (blended and unblended particles) were grinded in laboratory grinder to the maximum size 50 µm. Grinded sample (0,05 g) was afterward thoroughly mixed with KBr (5,0 g). Spectra obtained by DRIFT technique is expressed in Kubelka-Munk (KM) units.
At obtained spectra’s we identified the differences between blended and unblended particles. We also looked for peaks at wave number 1540...1550 cm-1 and 1655...1665 cm-1 which are, according to Körner et al. (1992) the peaks significant to presence of UF adhesive.
3. RESULTS AND DISCUSSION
The mean surface covered with adhesive was between 25% and 27% as it is shown in Figure 2, 3, 4 and 5.

28th International Conference on Wood Science and Technology 2017 IMPLEMENTATION OF WOOD SCIENCE IN WOODWORKING SECTOR
161
Figure 2. Surface covered with adhesive with regard to the wood species used
Figure 3. Blended3 spruce particles (magnification 20×)
Figure 4. Blended4 beech particles (magnification 20×)
Figure 5. Blended5 oak particles (magnification 20×)
3 Red colour presents the adhesive, which is the result od dying of colourless UF resin with Rhodamin B 4 Red colour presents the adhesive, which is the result od dying of colourless UF resin with Rhodamin B 5 Red colour presents the adhesive, which is the result od dying of colourless UF resin with Rhodamin B

28th International Conference on Wood Science and Technology 2017 IMPLEMENTATION OF WOOD SCIENCE IN WOODWORKING SECTOR
162
Image analysis of adhesive coverage shows a non-uniformity dispersion of adhesive within and between particles. We can see that adhesive coverage ranges from only traces of adhesive on surface towards wider areas of adhesive on the surface. The system of adhesive application that was used for investigation generates adhesive droplets with size between 5 and 25 μm. Due to mixing of particles, adhesive spreading on the particle surface and transformation of adhesive between particles, some droplets joined together hence creating partially filmed like adhesive surface (larger surface covered with adhesive). This adhesive mobility after blending was also observed by Grigsby and Thumm (2012). Second reason for such creation of larger surface covered with adhesive could be the result of blending technique. Due to spraying of adhesive mist on particles we can assume that several adhesive droplets hits almost the same spot on particle surface hence larger surface is covered with adhesive.
Statistical analysis (at α=0,05) showed that the surface covered with adhesive at fines (particles fraction 0,237) is not dependant on wood species used.
FT-IR spectra’s shows differences between blended and unblended particles (Figure 6, 7 and 8).
Figure 6. FT-IR spectra of blended and unblended spruce particles
Figure 7. FT-IR spectra of blended (Beech – A) and unblended (Beech – C) beech particles

28th International Conference on Wood Science and Technology 2017 IMPLEMENTATION OF WOOD SCIENCE IN WOODWORKING SECTOR
163
Figure 8. FT-IR spectra of blended (Oak – A) and unblended (Oak – C) oak particles
The differences between blended and unblended particles were determined at wave number between 1655...1665 cm-1 and 1540...1560 cm-1 (Table 1).
Table 1. Comparison of K–M values for chosen peaks for unblended (Beech – C; Oak – C; Spruce – C) and
blended (Beech – A; Oak – A; Spruce – A) particles with regard to the wood species
Wave number in cm-1
K-M Wave number in cm-1
K-M
Beech – C 1655 0,43 1549 0,21
Beech – A 1659 1,11 1545 1,01 Oak – C 1655 0,45 1554 0,27 Oak – A 1658 1,11 1547 0,99 Spruce – C 1660 0,41 1550 0,18 Oak – C 1660 1,10 1540 0,96
Peaks at mentioned wave number can be associated with urea-formaldehyde adhesive
(Niemz et al., 1990; Körner et al., 1992; IR-Wizard results..., 2003). According to Körner et al. (1992) and Müller et al. (2009) the peak between 1535...1550 cm-1 is caused by secondary amides, resulting as a modification of pure urea as a component of UF resin.
3. CONCLUSIONS
With regard to the results presented in paper, we can draw following conclusions: - Dying of adhesive with appropriate dye can be a successful method for determination
of surface covered with adhesive on particle surface. - With FT-IR spectroscopy we determined differences between blended and unblended
particles. - At blended particles peaks between 1655 to 1665 cm-1 and 1535 to 1550 cm-1 were
determined (not present at unblended particles). - The differences between particles within the same fractions but different wood species
were not statistically significant. Acknowledgements: The authors would like to thank for the support to Slovenian Research Agency within program P4-0015 (Wood and lignocellulosic composites).

28th International Conference on Wood Science and Technology 2017 IMPLEMENTATION OF WOOD SCIENCE IN WOODWORKING SECTOR
164
REFERENCES Dunky, M. (1988): Einfluss der Spangrößenverteilung auf den Beleimungsgrad der Späne.
Holzforschung und Holzverwertung, 40 (6): pp. 126-133 Grigsby, W. J.;Thumm, A. (2012): Resin and wax distribution and mobility during medium density
fibreboard manufacture. European Journal of Wood and Wood Products, 70: pp. 337-348 Kamke, F. A.; Lenth, C. A.;Saunders, H. G. (1996): Measurement of resin and wax distribution on wood
flakes. Forest Products Journal, 46(6):63–68 Körner S.; Niemz P. Wienhaus O.;Henke R. (1992): Orientierende Untersuchungen zum Nachweis des
Klebstoffanteils auf Holzpartikeln mit Hilfe der FTIR–Spektroskopie. Holz als Roh– und Werkstoff, 50, 1: 67–72
Lehman, W. F. (1965): Improved Particleboard through Better Resin Efficiency. Forest Products Journal, 15(4): pp. 155-161
Lehman, W. F. (1968): Resin Distribution in Flakeboard Shown by Ultraviolet Light Photography. Forest Products Journal, 18 (10): pp. 32-34
Medved, S.; Resnik, J. (2004): Influence of particle size on the surface covered with adhesive at particles from beech wood. Wood research, 49(1): pp. 33-40
Medved, S.; Resnik, J. (2010): Determination of share of adhesive on particles with FT-IR spectroscopy. Wood research, 55(1): pp. 101-109
Müller, G.; Schöpper, C.; Vos, H., Kharazipour, A.; Polle, A. (2009): FTIR-ATR spectroscopic analyses of changes in wood properties during particle- and fibreboard production of hard- and softwood trees. BioResources, 4(1): pp. 49–71
Niemz P.; Wienhaus O.; Körner S.;Szaniawski M. (1990): Untersuchungen zur Anwendung der Infrarot – Spektroskopie in der Holzforschung. Teil 3. Nachweis des Nadel–, Rinden– und Klebstoffanteils in Spangemischen aus Kiefernholz. Holzforschung und Holzverwertung, 42, 2: pp. 25-28
Scoot K. A. 2001. Economic Feasibility of Implementing a Resin Distribution Measurement System for MDF Fiber: 31–41 http://scholar.lib.vt.edu/theses/available/etd-04232001-143555/unrestricted/Keithfinalthesis.pdf (14. mar.2003)
Van Herwijnen, H.; Mahrdt, E.; Gindl-Altmutter, W.; Kantner, W.; Moser, J.; Müller, U.; Stöckl, F. (2013): Novel methods to investigate the UF resin distribution within industrial MDF and particleboards. International Conference on Wood Adhesives 2013, Toronto, Canada, Volume: pp: 243-250.

28th International Conference on Wood Science and Technology 2017 IMPLEMENTATION OF WOOD SCIENCE IN WOODWORKING SECTOR
165
Influence of Relative Humidity on the Strength of Hardwood and Softwood Pulp Fibres and Fibre to Fibre Joints
Jajcinovic, Marina1*; Fischer, Wolfgang Johann1; Hirn, Ulrich1; Bauer, Wolfgang1
Institute of Paper, Pulp and Fibre Technology, Graz University of Technology, NAWI Graz, Graz, Austria *Corresponding author: [email protected]
ABSTRACT
Natural materials such as cellulose are highly susceptible to fluctuations in temperature and especially relative humidity. Besides morphological changes such as swelling and shrinking, the mechanical properties of individual pulp fibres and fibre to fibre joints change as well. The present study compares the forces needed to break individual hardwood as well as softwood fibres and fibre to fibre joints after equilibration at different relative humidity (30%, 50% and 80% RH). To determine the time needed for the fibres and joints to reach the Equilibration Moisture Content (EMC), Dynamic, Sorption Measurements (DVS) were performed and subsequently validated using mechanical testing. The analysis of the results revealed a maximum breaking load at 50% RH, with a decrease in breaking load of both fibres and joints when approaching either end of the RH scale (30% or 80% RH).
Key words: hardwood, softwood, individual fibres, fibre to fibre joints, breaking load, RH 1. INTRODUCTION
Paper products are expected to bear load and hold structural form in a variety of environmental conditions, many of which differ greatly from laboratory conditions in which the paper and the constituent fibres are usually tested. How relative air humidity affects the elastic modulus, stiffness and strength of paper is well known (Salmen and Back, 1980). Upon increasing moisture content at higher RH, the paper starts to exhibit a more ductile and elastic behaviour, whereas upon drying, the material becomes more brittle. If one is to draw conclusions from the behaviour of paper, it is right to assume that the e-modulus and strength of the fibres will decrease upon exposure to water or humid air and increase upon drying. It is at this point, that the data collected from the literature tends to branch off in two different directions. Certain studies have shown that the mechanical properties, mainly strength of individual fibres will increase (Wardrop, 1951, Leopold and Thorpe, 1968) upon exposure to high RH or water; whereas others have shown that the strength of fibres decreases when exposed to high relative humidity or water (Kersavage, 1973, Klauditz et al., 1947, Russell et al., 1964, Kallmes and Perez, 1965).
With fibre to fibre joints, the literature provides limited amount of data and the observed decrease in case of higher RH is attributed to the differences in the shrinkage coefficient of the constituent fibres (Russell et al., 1964, Schniewind et al., 1964). In this study, a chamber for conditioning of individual fibres and joints prior to mechanical testing has been developed. The present study compares the force needed to break individual hardwood as well as softwood fibres and fibre to fibre joints at three different relative humidities (30%, 50%, 80% RH). Since the strength of paper mainly depends on the strength of individual fibres and fibre to fibre joints (Page, 1969), it is important to know how the fibres and joints will behave when exposed to elevated or decreased RH. The results of this study are expected to provide deeper insight and understanding of behaviour of hardwood and softwood fibres and joints and their impact on the failure process at different humidity levels.

28th International Conference on Wood Science and Technology 2017 IMPLEMENTATION OF WOOD SCIENCE IN WOODWORKING SECTOR
166
2. MATERIAL AND METHODS All investigations have been performed using both softwood and hardwood pulp. Softwood
pulp was an industrial, once dried, unbeaten, unbleached kraft pulp (mixture of spruce and pine, κ-number < 45). Hardwood pulp was an industrial, once dried, unbeaten, bleached kraft pulp (mixture of Eucalyptus nitens and Eucalyptus globulus, κ -number < 1). Individual fibres and joints were prepared according to Kappel et al. (2009). After the preparation, the samples were conditioned at 50% RH and 23°C for a minimum of 24 h. For subsequent testing at 30% or 80% RH, 50% RH was used as the starting humidity. 2.1 Testing setup, sample fixation and testing procedure
For the purpose of this study, 10 samples of both pulps at three RH-s (30, 50 and 80%) have been tested. All the tests have been performed using a micro bond tester developed at Graz University of Technology (Fischer et al., 2012). As an additional part, a conditioning chamber has been manufactured where the different relative humidity could controlled in a range from 25 to 95% RH by circulating air from a S503 Humidity Generator (Michell instruments). The working principle of the humidity generator and the conditioning chamber is shown in Figure 1 and is as follows:
Figure 1. Conditioning and testing setup
Within the generator, the air is sucked in through an air inlet by means of an internal
ventilator and circulated over a silica gel and/or deionised water beaker (depending on whether the desired air is saturated or dried). Once the starting RH (in this case 50% RH) is reached, the extraction ventilator is turned on and the air is blown through the air outlet through a rubber tube into the closed conditioning chamber. At this point, humidity and temperature in the chamber are recorded by means of a RH/temperature sensor (Rotronic Hygroclip S). 2.2 Sample fixation and testing procedure
Fixation of samples for individual fibre tensile testing was done using sample holders with span lengths of 1 (softwood) and 0.3 mm (hardwood). Fixation procedure and sample holders are described in detail in previous studies (Fischer et al., 2012; Jajcinovic et al., 2016). After placing the sample holder carrying the fibres and joints on the micro bond tester, the chamber was closed and the conditions within the chamber were left at 50% RH and 23°C for 5 -10 min. Changing the RH immediately was postponed for two reasons - to ensure that the signal from the load cell (measured during conditioning time) comes from the fibre response and not from vibrations induced during mounting, and, secondly, in case of joints, to provide sufficient time for the adhesive to cure. The signal from the load cell was recorded for both individual fibre and joints. During preliminary tests, it was observed that upon drying, the fibres exhibited increase in load due to shrinkage. To avoid such drying stresses, similar to restrained drying,

28th International Conference on Wood Science and Technology 2017 IMPLEMENTATION OF WOOD SCIENCE IN WOODWORKING SECTOR
167
individual fibres were unloaded during conditioning in the following manner. Once the fibre has been mounted and the vibrations in the load cell ceased, changing of RH was started, simultaneously to the load signal recording. The signal was monitored and it was observed that the increase in the load signal was most pronounced at the initial stage. Once the signal stopped increasing, the load was decreased by moving the mount backwards, i.e. relaxing the fibre. Unloading rate was 1 µm/s until the signal of an unloaded cell was reached. The same procedure was repeated upon subsequent increases in the load. In case of fibres conditioned at higher RH, no load increase was detected. Hardwoods, being weaker and tested over a shorter span could only be tested after applying the unloading procedure described above. In cases where unloading was not performed, the fibre broke during conditioning time. Softwood fibres, being stronger, were able to condition without breaking and were therefore tested both in the unrelaxed and relaxed state (10 samples each). In case of joints, no unloading procedure was performed since the moving of one of the fibres in the joint would result in damaging the joint prior to testing. Both humidity and temperature were recorded at an interval of one m easurement per minute during the setting, conditioning and testing time. After conditioning, fibres and joints were loaded at a rate of 1 µm/s until failure in the set humidity. 2.4 Sorption behaviour
Isotherms of water vapour sorption were determined with a Dynamic Vapour Sorption (DVS) from with a dynamic gravimetric water sorption analyser (DVS Intrinsic, Surface Measurement Systems, Alperton- London, UK). Approximately 40 mg of the pulp was placed in the sample pan and was pre-conditioned at 0% (RH) for 12 h at 25°C to remove any adsorbed water molecules prior to all three sorption tests. After being conditioned at 0%, the RH was elevated to a desired level of 30, 50 and 80% and kept constant for 12 hours. Equilibrium was detected by comparing the mass of sample with a mathematical asymptote model. When the difference was less than 1%, the mass was noted. 3. RESULTS AND DISCUSSION 3.1 Sorption behaviour and conditioning time
For both samples, the moisture content (MC) was measured at 3 different RH (30, 50 and 80%) with a MC of pulp at 0% RH as a reference. The measurement principle is shown in Figure 2.
Figure 2. Sorption behaviour of softwood kraft pulp
Time to reach equilibrium is defined as a function of the equilibrated moisture content (EMC) based on the individual sorption/desorption kinetics of the pulp at constant humidity and 25°C and it depends on the initial MC of the pulp, RH level and the RH increase rate. Table

28th International Conference on Wood Science and Technology 2017 IMPLEMENTATION OF WOOD SCIENCE IN WOODWORKING SECTOR
168
1 shows the time needed to reach equilibrium moisture content as well as the percentage of EMC reached after 120, 240 and 480 min. Table 1. Equilibration time
% of EMC after RH% time to EMC 120 min 240 min 480 min 0 - 30 480 99.95 99.98 99.99 0 - 50 500 99.93 99.96 99.99 0 - 80 600 99.77 99.91 99.98
Since these measurements were performed on bulk pulp it is assumed that the time needed
to reach the equilibrium at the single fibre level is much lower. The chosen conditioning time of 120 min was believed to be sufficient for the joints and fibres to reach an equilibrium state. However, to ensure that longer conditioning time played no role in the behaviour of the samples, mechanical tests with 240 and 480 min of equilibration times were also performed. The values obtained from those tests are summarized in Table 2 and a t-test with a 95% confidence level revealed no statically significant difference. Table 2. Breaking load of joints after different equilibration times
Breaking load at 80% RH [mN]
cond. time 120 min 240 min 480 min
SWjoints 3.1 (1.3) 4.3 (2.3) 3.2 (1.5)
* ()standard deviation
The %EMC values obtained by the DVS measurements varied less than 0.5% with various
equilibration times, and no difference was observed in the values obtained by mechanical testing. Therefore, 120 min conditioning time is suffcient for both fibres and joints to reach an equilibrium in the set RH.
3.2 Single fibre tensile testing
Table 3 and Figure 3 show a comparison of breaking load values obtained for single fibre tensile testing. As can be seen in case of both softwood and hardwood, there is a decreasing trend in breaking load when moving toward higher or lower RH, having somewhat of a maximum around 50% RH. Table 3. Breaking load of softwood and hardwood fibres tested at different RH
Breaking load [mN]
30% RH 50%RH 80%RH
softwood 186.7 (97.7) 236.0 (56.6) 194.0 (82.7)
143.4 (46.8)**
hardwood 24.1 (11.8) 38.8 (16.3) 27.4 (14.6)
*()standard deviation
** conditioned under restraint

28th International Conference on Wood Science and Technology 2017 IMPLEMENTATION OF WOOD SCIENCE IN WOODWORKING SECTOR
169
Figure 3. Breaking load of softwood and hardwood fibres
In case of softwoods, the breaking load is around 20% smaller when the fibres were tested
either in elevated or decreased humidity. This difference, however, was not statistically significant. The only significant difference was obtained with softwood fibres conditioned "under restraint" at 30% RH (α =0.01, p-value = 0.0047). In case of hardwood fibres, the same behaviour as in case of non-restrained softwoods can be observed. For fibres tested at 30 and 80% RH, a reduction of 29 and 38% can be seen, respectively, but no significant difference was obtained in neither of the cases. Figure 4. shows a comparison of current values for softwood with values from previous studies. The values obtained in the current study are similar to the most comprehensive study performed by Kersavage (1973), showing a maximum at 60% RH and a decrease when moving towards higher or lower RH.
Figure 4. Comparison of breaking loads of individual softwood fibres
Nevertheless, besides the wet samples in case of Kersavage (1973), none of the values from
the previous or the current study show a statistically significant difference. Additionally, majority of the studies performed focused only on the differences in fibre behaviour in the dry and wet state and this rendered most of the studies incomparable. Leopold and Thorpe (1968) have attributed the change in breaking load to the breaking of hydrogen bonds within the fibre. In case of fibres with low internal cohesion (i.e. springwood fibres) the strength decreases due to hydrogen bond disruption whereas in case of summerwood fibres, the breaking of hydrogen bonds improves the stress distribution across the fibre surface. Wardrop (1951) also attributed increase in breaking load of wet fibres to more uniform stress distribution. Additionally, lower breaking load values in case of dry fibres could be attributed to the possible development of strength reducing flaws during drying (Russell et al., 1964). Higher occurrence of such weak spots, in combination with tension forces during conditioning, could result in a fibre that is already damaged prior to testing. Contrary to that, Klauditz et al. (1947) and Kersavage (1973)

28th International Conference on Wood Science and Technology 2017 IMPLEMENTATION OF WOOD SCIENCE IN WOODWORKING SECTOR
170
attributed higher dry than wet strength to a closer contact and higher cell wall cohesiveness of dry fibres when compared to wet fibres. The increase in strength is attributed to either the increase in cell wall cohesivness present at lower MC (Kersavage, 1973; Klauditz et al., 1947; Leopold and Thorpe, 1968) or an improvement of internal stress distribution at higher MC or RH (Russell et al., 1964; Wardrop, 1951; Leopold and Thorpe, 1968). Nevertheless, it is possible that both mechanisms, increase in stress distribution and cell wall cohesiveness, coexist and compete at the same time, and the nonlinearity of their behaviour results with a maximum at around 50% RH. Additionally, there is a third factor that plays a role in the outcome of the testing, the effect of restrained testing. A free standing fibre, when conditioned from 50 to 30% RH will shrink, rotate and twist. By gluing it in one plane, all three natural behaviors are being disabled. Due to these restrictions, the fibre can not shrink freely, inner tension develop and the fibre becomes more brittle. Due to the tension forces created by the fibre shrinkage, it is possible that cracks in the wall are initiated even without any external load. The embrittlement, in combination with possible crack initiation would account for the loss in the load bearing capacity. An amplified effect of the embrittlement present at lower RH can be seen with softwood fibres which were tested "under restraint" and where the unloading sequence was not performed. Those fibres are the only one that exhibited statistically significantly lower values than the fibres tested at 50% RH. In case of fibres tested at 80% RH, the opposite effect is taking place and the moisture absorbed from the air act as a soft ener. Since the fibre is still fixed during moisture absorption and therefore cannot move, it is possible that some internal bonds break, cellulose chains slip, and the load bearing capacity of the softened matric diminish. Figure 5 shows the principle of the changes the fibres undergo upon variation in the relative humidity, the embrittlement which is present with low RH, and softening present at higher RH.
Figure 5. Fibre response towards changes in RH
Nevertheless, had the fibres been conditioned in a unrestrained state, it is very probable that different results would have been obtained. 3.3 Fibre to fibre joint testing
Table 4 and Figure 6 show breaking load values of joints. tested at three different RH. Table 4: Breaking load of fibre to fibre joints tested at different RH
Breaking load [mN] 30% RH 50%RH 80%RH softwood 4.27 (2.67) 6.58 (4.45) 3.11 (1.31) hardwood 1.99 (1.04) 1.82 (0.48) 1.69 (0.94) *()standard deviation

28th International Conference on Wood Science and Technology 2017 IMPLEMENTATION OF WOOD SCIENCE IN WOODWORKING SECTOR
171
Figure 6. Breaking load of softwood (left) and hardwood (right) joints
Softwood joints tested at 30 and 80% RH show lower values when compared to values
obtained at 50% RH. Those tested at 30% RH show a 35% reduction in breaking load whereas bonds tested at 80% show a 52% reduction when compared to 50% RH (statistically significant difference, α = 0.05, p-value = 0.023). Contrary to them, hardwoods seem to exhibit no change in the breaking load when exposed to either high or low RH. It is believed that the exposure of 2 hours was suffcient for the hardwood joints to reach an equilibrium since the same was observed in case of softwoods. Since results similar to softwood kraft pulp have been obtained using softwood sulphite pulp (to be published subsequently), it appears that the results obtained for hardwoods are an artefact of measurement setup or the testing procedure. The reduction in breaking loads of joints tested at elevated or decreased RH is attributed to the increase and decrease of the dried-in stresses and the effect of restrained conditioning. Same as in the case of individual fibres, the joints were also glued in one plane and could therefore not swell or shrink freely. Figure 7 shows the response of the joints towards changes in RH.
Figure 7. Fibre to fibre joint response towards changes in RH
In case of joints tested at 30% RH, the dried-in stresses increase even more due to the
shrinkage of the fibres in the cross direction, while the shrinkage in the longitudinal direction imposes additional tensile stress on the joint. As stated earlier, it was not possible to perform the unloading procedure in case of joints, but the fact that they did not break gives an indication that the embrittlement evident in individual fibres was avoided through compensation of the crossing fibre bending. In case of fibres tested at 80% RH, the decrease is attributed to the decrease in the dried in stresses and partial failure of the bond due to swelling. As the moisture get absorbed, the fibres swell and soften which in turn leads to similar changes in the bonded area to occur. Nevertheless, same as in the case of individual fibres, it is quite possible that

28th International Conference on Wood Science and Technology 2017 IMPLEMENTATION OF WOOD SCIENCE IN WOODWORKING SECTOR
172
different results would be obtained if the joints have been conditioned in a unrestrained state. Comparison with previous studies (Schniewind et al., 1964; Russell et al., 1964) was not possible since the samples in those studies have been tested either fully wet or in laboratory conditions.
4. CONCLUSIONS
In the present study, a method and a setup for investigating the inuence of humidity on fibres and joints was developed, the results presented and future improvements suggested. In single fibre tensile testing a decreasing trend but no significant difference in the breaking loads of individual fibres was observed (both for softwood and hardwood fibres). It appears that the optimum for the breaking load is around 50% RH with decreasing trends towards high or low RH. The lower breaking load values appear to be a consequence of three effects taking place: the increase in stiffness (or cell wall cohesiveness), moisture induced softening (more uniform stress distribution) and the effect of restrained conditioning (causing embrittlement or chain slippage). However, due to the large scattering of the values, no statistically significant differences could be obtained.
When it comes to fibre to-fibre joints, a decreasing trend and significant difference in case of softwood joints tested at 80% RH can be observed, but not in the case of joints tested at 30% RH. Hardwood joints show no response to either high or low relative humidity, which, at this point, is considered to be an artefact of the measurement system. The lower breaking load values of softwood joints are attributed to the changes in the intensity of the dried-in stresses and the effect of restrained conditioning.
The aim of this study was to gain a better understanding of the fibre and joints behaviour when exposed to different RH. Eventhough a reduction upon increase and decrease in the RH can be observed both in case of fibres and joints, further tests with non-restrained (free) conditioning should be performed. Acknowledgements: Financial support for this work in the framework of the PhD School DokIn'Holz funded by the Austrian Federal Ministry of Science, Research and Economy, Sappi and Mondi is gratefully acknowledged. REFERENCES Fischer, W. J.; Hirn, U.; Bauer, W.; Schennach, R. (2012): Testing of individual fiber-fiber joints under
biaxial load and simulataneous analysis of deformation. Nordic Pulp and Paper Research Journal 27 (2): pp. 237-244.
Hartler, N.; Kull, G.; Stockman, L. (1963): Determination of fibre strength through measurement of individual fibres. Svensk papperstidning 8: pp. 301-308.
Jajcinovic, M.; Fischer, W. J.; Hirn, U.; Bauer, W. (2016): Strength of individual hardwood fibres and fibre to fibre joints. Cellulose, 23:2049-2060.
Kallmes, O. J.; Perez, M. (1965): Load/elongation properties of fibres. In: Consolidation of the Paper Web, British Paper and Board Makers' Association, Cambridge, 507-528.
Kersavage, P. (1973): Moisture content effect on tensile properties of individual douglas -fir latewood tracheids. Wood and Fiber Science 5 (2): pp. 105-117.
Klauditz, W.; Marschall, A.; Ginzel, W. (1947): Zuer technologie verholzter panzlicher zellwaende: Ermittlung der zgfestigkeit von zellstofffasern aus pinus merkusii-holz. Holzforschung 4: pp. 98-103.
Leopold, B; Thorpe, J. (1968): Effect of pulping on strength properties of dry and wet pulp fibers from norway spruce. Tappi 51 (7): pp. 304-308.
Page, D. H. (1969): A Theory for the Tensile Strength of Paper. Tappi Journal, 2 (4): pp. 674-681.

28th International Conference on Wood Science and Technology 2017 IMPLEMENTATION OF WOOD SCIENCE IN WOODWORKING SECTOR
173
Russell, J.; Kallmes, O. J.; Mayhood, C. H. (1964): The inluence of Two Wet-Strength Resins on Fibers and Fiber-Fiber Contacts. Tappi Journal 47 (1): pp. 22-25.
Salmen, N.; Back, E. (1980): Moisture- dependent thermal softening of paper, evaluated by its elastic modulus. Tappi 63 (6): pp. 117-120.
Schniewind, A.; Nemeth, L.; Brink, D. (1964): Fiber and pulp properties: I. shear strength of single-fiber crossings. Tappi 47: pp. 244-248.
Wardrop, A. (1951). Cell wall organization and the properties of the xylem: I. cell wall organization and the variation of breaking load in tension of the xylem in confer stems. Australian Journal of Scientific Research 4: pp. 391-414.

28th International Conference on Wood Science and Technology 2017 IMPLEMENTATION OF WOOD SCIENCE IN WOODWORKING SECTOR
174

28th International Conference on Wood Science and Technology 2017 IMPLEMENTATION OF WOOD SCIENCE IN WOODWORKING SECTOR
175
Influence of Black Poplar Wood Particle Size (Populus nigra L.) on Content and Properties of Bio-oil
Stanešić, Juraj1*; Podvorec, Tomislav1; Antonović, Alan1
1Department of Materials Technology, Faculty of forestry, University of Zagreb, Zagreb, Republic of Croatia *Corresponding author: [email protected]
ABSTRACT
It is well known that the world energy crisis is increasingly coming to the fore. In order to run "green revolution" in the energy sector on a global level and to lignocellulosic biomass begin to exploit in its entire latitude. The scientific community with it’s researches related to obtaining and characterization of bio-oil from different wood species, puts more pressure on society. The aim of this study was to determine the effect of feedstock biomass, in this case, the energy and fast-growing wood species of black poplar (Populus nigra L.) as a raw material for the production of bio-oil in the process of thermochemical pyrolytic decomposition or the process of slow pyrolysis. The test samples were different size particles with different water content. In the process of slow pyrolysis, a modified apparatus was used which meets all the requirements placed in front of it to process the slow pyrolysis at laboratory scale. The research results show that the initial moisture content and particle size of raw material affect generated the amount of bio-oils. Overall speaking, the black poplar tree has shown great results related to the amount of the resulting bio-oil. All results are expressed as a percentage of the input mass of the sample and compared to the results of other studies. Key words: Bio-oil, Black poplar tree (Populus nigra L.), Slow pyrolysis 1. INTRODUCTION
At present, the world's energy market relies heavily on fossil fuels. The fact is that sources of fossil fuels, with extreme exploitation, are disappearing and growing attention is being given to new, renewable sources of energy. With the use of fossil fuels, there come also issues of environmental protection and reduction of CO2 emissions which, when combusting fossil fuels, are high and more contribute to greenhouse gases (GHG), acid rain, etc. arising as a result of global warming. The European Parliament and Council Directive (2009) provides energy from renewable sources, wind energy, solar energy, aerothermal energy, geothermal energy, hydrothermal and ocean energy, hydro power, biomass, waste gas, gas obtained from wastewater treatment plants and biogas. Also, the biomass is defined as a biodegradable part of the product, waste and residues of biological origin from agriculture (including plant and animal origin), forestry and related manufacturing activities, including fisheries and aquaculture, and biodegradable fraction of the industrial and municipal waste. The advantage of wood biomass compared to fossil fuels is the negative balance of CO2 emissions when it is used or processed. This is to say that wood absorbs more carbon dioxide than it emits into the atmosphere when processing. The pyrolysis process is currently one of the applicable processing possibilities for wood biomass in energy at the industrial level. 2. PYROLYSIS PROCESS
Pyrolysis is a thermochemical process of converting biomass that takes place at a temperature of 300 to 650°C in the absence of oxygen. Obtained products are liquids (bio-oil), gases and solids (bio-char). Gases are divided into volatile and non-volatile gases. Volatile gases are converted into a liquid phase (bio-oil) by slow cooling, while the solid product is bio-char. Pyrolysis is the first stage in the combustion and flotation of biomass where complete or

28th International Conference on Wood Science and Technology 2017 IMPLEMENTATION OF WOOD SCIENCE IN WOODWORKING SECTOR
176
partial oxidation of primary products takes place. The yield of certain pyrolysis products depends on the chemical composition of the biomass and the conditions of the pyrolysis process. The chemical components of wood biomass are thermally differentiated at different speeds. The most stable is lignin so degradation takes place in the following order: hemicellulose, cellulose, lignin.
Numerous studies have been carried out on this topic and explored potentials of many types of wood for bio-oil production. Thus, in different reactors and under different conditions, different quantitative values of utilization of wood biomass in the form of bio-oil are obtained. The average utilization of wood biomass in the form of bio-oil is between 40 and 50% (Czernik and Bridgwater, 2004; Oasmaa and Czernik, 1999).
If the goal of biomass pyrolysis conversion is to obtain the maximum yield of the liquid product, then the process should take place at low temperatures, at high heating rates and a short time of evaporation of the biomass in the reaction zone. In order to achieve a high yield of solid residuals, it takes place at low temperatures and low heating rates, and for a high yield of pyrolytic gas, the process is carried out at high temperatures, low heating rates and a long period of gas residence in the reactor. 2.1. Types of pyrolysis
Depending on the heating rate as well as other parameters of the procedure, the following processes of pyrolysis of wood biomass are distinguished:
1. slow pyrolysis,
2. fast pyrolysis,
3. "flash" pyrolysis.
These processes differ in chemistry, yield and quality of products obtained such as pyrolytic gas, bio-oil and bio-coal (Müller-Hagedorn et al., 2003).
Fast pyrolysis is a high-temperature process whereby biomass is heated at a high speed of about 300°C/min (Goyal et al., 2008) without the presence of oxygen. Rapid pyrolysis products are a gaseous phase and aerosol in large quantities and bio-carbon in a small amount. After the cooling and condensation of the gaseous phase, a liquid phase of a dark brown color called bio-oil is obtained. Studies have shown that the maximum bio-oil yield is obtained at the reaction temperature of about 500°C and a short period of residence of the gaseous phase, mainly 1s, in order to avoid secondary reactions.
"Flash" pyrolysis is a process in which very small particles of biomass (105-250 μm) are heated at high speed in a short period of time of a few seconds in a flow reactor or a fluidized bed reactor, in order to obtain the maximum yield of the liquid product. Studies have shown that yield of liquid product can be achieved up to 68% (Goyal et al., 2008).
Slow pyrolysis occurs at temperatures above 400 ºC and for a long period of residence of the gas phase (4-8 minutes). The heating rate ranges from 1-5 ºC / s. Under these conditions, the gas component of the product has a high yield due to completed secondary reactions. The final yield of the solid residue decreases with the temperature rise of 400 to 700 ºC. The liquid product reaches the maximum value at 550 ºC and decreases at 700 ºC. The reduced yield of solid residue at higher temperatures occurs due to increased yield of volatile matter from tar. There are secondary reactions, which implies lower production of the liquid phase and higher gas yield (Zajec, 2009).
2.1.1. Composition of pyrolysis products and their application
Bio-oil, or liquid product, represents a homogeneous mixture of the organic component and water (15-30%, mass fraction). Water comes from the present water in the starting material and is also generated during the pyrolysis reaction. The presence of water affects the reduction

28th International Conference on Wood Science and Technology 2017 IMPLEMENTATION OF WOOD SCIENCE IN WOODWORKING SECTOR
177
of the thermal value and the ignition temperature of the bio-oil as well as the reduction of viscosity. Exposed water cannot be removed by distillation.
Bio-oil is dark brown and is highly enriched with oxygen with 15-30% water content. Although we call it oil, it should not be mixed with oil as an oil derivative. It has a low pH value ranging between 2 and 4 and as an acidic medium can be very corrosive. It consists of hundreds of different chemical components, mainly organic components including acetic acid, methanol, various aldehydes and ketones, alkylphenols, alkyl methoxyphenols, sugars and lignin derivative components (Mohan et al., 2006).
It has a wide application and can be used as a fuel for combustion in boilers, furnaces and power generation, as a fuel or a component for mixing with fossil diesel fuel for diesel engines and raw materials for the production of chemical components, adhesive agents, anhydrous sugars etc. The large oxygen content in bio-oil indicates the presence of numerous polar groups in the compounds present in bio-oils, which cause high viscosity, thermal instability, and corrosive action.
The gaseous component consists mainly of carbon monoxide CO, carbon dioxide, and methane CH4. Hydrogen, ethane, propane, propylene, butane, pentane are present in the lower contents. Compared with the gas obtained by the flotation process, pyrolysis gas has a higher thermal value and can be used as a combustion fuel in gas turbines for industrial purposes.
Bio-char consists of elemental carbon with hydrogen and its yield in the pyrolysis process is in the range of 20-26%. It can be used as solid fuel in boilers, either alone or in combination with biomass, for the production of activated charcoal and in heat-treating processes for the production of high-performance hydrogen gas and thermal cracking. 3. OBJECTIVES
Influence of different particle size of black poplar wood (Populus nigra L.) in the process of pyrolytic degradation was observed on the content and bio-oil properties. The basic objectives of the study, which are related to the research of bio-oil content and properties, are the determination of: bio-oil, bio-char and non-volatile gases content depending on the input particle size, and depending on the moisture content of wood, pH and volume mass value of bio-oil as well as dry matter content and liquid phase of bio-oil. 4. MATERIALS AND METHODS
4.1. Black Poplar (Populus nigra L.)
For the study of the bio-oil selection of black poplar wood (Populus nigra L.) was selected. Black poplar is a deciduous tree from a family of bears (Salicaceae). Grow up to 30 meters in height. The weight is approximately 150 cm in diameter. It is distributed in Central and South Europe, Southwestern and Central Asia and in Northwest Africa. The habitats are light and damp areas, growing on the banks of rivers and lakes, planting as a decorative plant in the cities. It grows very fast, lives up to 300 years (URL:http://www.plantea.com.hr/crna-topola). 4.2. Wood sampling and samples selection
Samples were sampled after cutting trees, from 5-15 cm thick rolls, from the first log tree, about 2 m (TAPPI T257 cm-02 - Sampling and preparation for wood analysis). This method is suitable for wood sampling for all kinds of chemical analyzes and reactions of chemical wood processing, and the procedure outlined for sampling for all forms of wood samples (logs, branches, roots, chips or wood dust). Furthermore, samples were chopped in the Fritsch – Pulverisette 19 mill until required particle size was obtained. The laboratory electromagnetic

28th International Conference on Wood Science and Technology 2017 IMPLEMENTATION OF WOOD SCIENCE IN WOODWORKING SECTOR
178
screen sieve Cisa RP.08 was used for sieving. Samples were sieved through a standard sieve (ISO - 3310.1) with eye size of 0.25 mm (100 - 150 eyes/cm2). 4.3. Slow pyrolysis
As a thermochemical reaction, the process of "slow" pyrolysis was used. In the process of slow pyrolysis, wood biomass is heated to about 500°C. The gas retention time varies between 5 and 30 min (Bridgwater and Kuester, 1991). Laboratory equipment for the pyrolysis process was compiled by Balat and Demirbas (2009) as shown in Figure 1.
Figure 1. Compiled laboratory equipment for the slow pyrolysis process
at the Faculty of Forestry
The apparatus consists of 1.) Bunsen burner, 2.) test tube with sample in it, 3.) Liebig cooler and 4.) bio-oil collection unit. Prior to the initiation of the pyrolysis process, the granulometric composition of wood was determined and three granulations were selected for the research. The results of the granulometric composition are shown in table 1. The input mass of the sample was 10 g per repetition with allowances of +/- 0.05 g per each fraction. After the completion of the pyrolysis process, test tube with obtained bio-char and the collecting unit with the obtained bio-oil were weighed on the analytical scale with the accuracy of d = 0.0001g.
Table 1. Granulometric composition of wood sample
Sieve eye size Sample (%)
1 mm 1,66
710 μm 11,01
355 μm 37,44
<355 μm 49,89
3.4. Determination of bio-oil properties
The bio-oil density was determined according to ISO 758: 1976. The method is based on determining the mass of the substance at a known volume at 20 °C contained in a pycnometer. The volume of a pycnometer is measured by weighing a pycnometer mass filled with water at 20 °C. The density calculation is based on the sample mass and the volume of the pycnometer (ISO 758: 1976). To determine density in the bio-oil analysis, Hubbard's pycnometer was used for a volume of 27,042 cm3. The pH value was determined by the titration device of Mettler Toledo EasyPlus/Easy Pro by immersing the glass electrode in the obtained bio-oil sample. It

28th International Conference on Wood Science and Technology 2017 IMPLEMENTATION OF WOOD SCIENCE IN WOODWORKING SECTOR
179
is recommended to use a glass electrode to avoid acid damage and rapid drying to avoid damage to the electrode and to achieve a more accurate measurement. The dry matter content was determined using the Atago Pocket PAL-α manual refractometer. Before analyzing the dry matter content in bio-oil, the samples were homogenized on the IKA VORTEX 4 digital mixer at t = 20 sec at the rate of n = 1500 min-1. Figure 5 shows homogenised samples of the obtained bio-oil of all three fractions. Two sample drops were used for the analysis, it is necessary to completely cover the prism of the device to make the analysis successful. All results are displayed as percent (%) expressed in Brix scale. The measurement was done according to the instructions of the refractometer manufacturer. The content of the liquid phase of the bio-oil was calculated as the difference between the total sample (100%) and the content of the dry substance. 4. RESULTS AND DISCUSSION
4.1. Slow pyrolysis
The obtained bio-oil of dark brown is a color, non-homogeneous liquid and is highlighted by the intense smell of smoke. Non-volatile gases are easily flammable and potentially toxic. All results of the pyrolysis product obtained are expressed in the form of quantitative biomass utilization in order to obtain a relational presentation of the utilization of black poplar (Populus nigra L.) in the form of bio-oil and bio-coal. When preparing biomass, it is necessary to pay close attention to the granulation. Preferably, the biomass particle size should be kept below 1 mm in diameter in order to obtain as much quantitative yield as possible. The particle size of the biomass less than 1 mm in diameter does not result in a large oscillation of the obtained results. Also, wood moisture content should be 8-12%. Figure 4 shows the bio-oil product during the pyrolysis process.
Figure 2. Yields of bio-oil, bio-char and non-volatile gases depending on the particle size of the sample
Figure 2 shows the dependence of percentage utilization, in the context of all pyrolysis
products, on the size of the distributed particle. From the graphic representation, it is apparent that the size of the distributed particle of the biomass determines the high yield of black topolines for the desired pyrolysis product. Thus, we can conclude that for the largest percentage of the use of black poplar wood in the context of bio-oil, particle size less than 355 μm should be used, while for the largest percentage of black poplar wood utilization in the context of bio-coal the particle size of about 0.5 mm more precisely 355 - 710 μm. The highest losses in the pyrolysis process have been demonstrated when using particles larger than 710 μm in diameter. As mentioned in the pyrolysis method, losses in the process occur in the form of
0,00
5,00
10,00
15,00
20,00
25,00
30,00
35,00
40,00
45,00
1 2 3
Ob
tain
ed
pe
rce
tag
e
Granulation fraction
Moisture content
Percentage of the obtainedbio-oil
Percentage of the obtainedbio-char
Percentage of the obtainednon-volatile gases

28th International Conference on Wood Science and Technology 2017 IMPLEMENTATION OF WOOD SCIENCE IN WOODWORKING SECTOR
180
non-volatile gases. Özbay (2015), in his research, states that the share of pyrolysis products from Abies bornmülleriana Mattf. Bio-oil ranges from 39.9 to 46% of the initial mass of the sample.
Figure 3. Yields of bio-oil, bio-char and non-volatile gases
depending on the moisture content Figure 3 shows the percentage share of all three pyrolysis products depending on the
moisture content of wood. Observing the graphical representation, it is clear that wood moisture content is crucial to obtaining all three products in the pyrolysis process. It can also be concluded that as a limit of moisture content is 11% after which a decrease in the quantitative utilization of black poplar wood has been reported.
Figure 4. Obtained bio-oil in the slow pyrolysis process
4.1. Bio-oil properties
Mean pH value is lower than expected. Although the expected pH value was between 2 and 4, the average pH value of bio-oil from black poplar wood was surprisingly low. After fifteen repetitions it obtained value 2,00. Previous studies have shown that the pH value rarely drops below 2.5. Thus, for bio-oil, Czernik and Bridgwater (2004) compared bio-oil with fossil oil as the pH value of bio-oil was 2.5. In the second study, Bridgwater and Peacock (2000) found on beech wood showed that the pH value of bio-oil is about 2.7, while Sipila et al. (1998)
0,00
5,00
10,00
15,00
20,00
25,00
30,00
35,00
40,00
45,00
50,00
Obt
aine
d pe
rcan
tage
(%
)
Moisture content (%)
Percentage of obtainedbio-oil
Percentage of theobtained bio-char
Percentage of theobtained non-volatilegases

28th International Conference on Wood Science and Technology 2017 IMPLEMENTATION OF WOOD SCIENCE IN WOODWORKING SECTOR
181
in bio-oil from a combination of oak and maple biomass expressed a pH value of 3.7. Such a low pH value can be a major problem in the use of bio-oil as it can cause corrosion on storage tanks and pipelines and in this case, it is important to pay attention to the choice of pipeline construction material (Bridgwater, 1999). After three specific density measurements, the mean value obtained is 1.072 g/cm3. Czernik and Bridgwater (2004) also in their research as a physical property exhibit a density of 1.2 g/cm3. Ba et al. (2004) determined the density of bio-oil from the softwood species, which is 1,188 g/cm3. The mean value of dry matter content was 32.51% and the liquid phase was 67,49%. The lack of bio-oil proved to be in the form of tar extracted by wood, which is deposited with the surface of the tube during decomposition. If bio-oil was used at a commercial level in the industry, bio-oil production should be kept in mind as efficient as possible to isolate bio-fuel pitches in smaller losses to make it cleaner and easy to apply. The calculated amount of plated tar as a loss of liquid bio-oil then the amount of bio-oil obtained drops from an average of 41.24% to a minimum of 13.38% by weight of the input sample. This data gives a realistic picture of how much liquid phase bio-oil applicable in the chemical industry can be expected from the available raw material. Similar results are also apparent from the research of pyrolysed oil from a mixture of oak and maple biomass and wheat residues after harvesting and they range in the range of 20 - 40% of the input mass of the sample (Sipila et al., 1998).
Figure 5. Final form of bio-oil products
5. CONCLUSIONS
In accordance with the set goals, the research plan and the results obtained by research are the following concluding thoughts. For the greater quantitative utilization of the inlet biomass of black poplar wood (Populus nigra L.), it is useful to use wood particles less than 0.5 mm in diameter. The density of bio-oil from black poplar wood is somewhat lower compared to bio-oils from other types of wood but still has a higher density than a heavy fossil oil. The pH value is exceptionally low and represents a potential problem in the storage of storage tanks and bio-oil pipelines. The dry matter content is relatively high although it is within the limits of expected results, thus reducing the amount of liquid bio-oil obtained. Black poplar wood is just one of the many types of wood in the series that show very good results in quantity, but also the quality of the products of the pyrolysis process and as such, is a significant raw material for obtaining bio-oil. With its short ripening time and with its annual increment, black poplar wood is profitable to use for bio-oil production. REFERENCES Ba, T.; Chaala, A.; Garcia-Perez, M.; Roy, C., 2004.: Energy Fuels, 18 (1), 188-201 Balat, M.; Demirbas, M. F., 2009.: Bio-oil from Pyrolysis of Black Alder Wood, Energy Sources, Part
A: Recovery, Utilization, and Environmental Effects, 31:19, 1719-1727

28th International Conference on Wood Science and Technology 2017 IMPLEMENTATION OF WOOD SCIENCE IN WOODWORKING SECTOR
182
Bridgwater A. V., 1999.: J. Anal. Appl. Pyrolysis, 51, 3-22 Bridgwater, A. V.; Kuester, J. L., 1991.: Research in Termochemical Biomass Conversion; Elsevie
Science Publishers: London Bridgwater, A. V.; Peacocke, G. V. C., 2000.: Renewable Sustainable Energy Rev. 4 (1), 1-73 Czernik, S.; Bridgwater A. V. 2004.: Energy fuels, 18, 590 – 598 Directive 2009/28/EC of the European Parlament ant of The Council of 23 April 2009 on the promotion
of the use of energy from renewable sources and amending and subsequently repealing Directives 2001/77/EC and 2003/30/EC
Goyal H. B.; Diptendu S.; Saxena R. C., 2008.: Biofuels from thermochemical conversion of renewable resources: A review. Renewable and sustainable energy reviews 12: 504‒517.
ISO 758:1976 – Liquid chemical products for industrial use -- Determination of density at 20 degrees °C
Mohan, D.; Pittman, Jr., C. U.; Steele, P. H., 2006.: Pyrolysis of Wood/Biomass for Bio-oil: A Critical Review, Energy & Fuels, 20, 848-889
Müller – Hagedorn, M.; Bockhorn, H.; Krebs, L; Müller U., 2003.: A comparative kinetic study on the pyrolysis of three different wood species. Journal of Analytical and Applied Pyrolysis 68-69: 231‒249
Oasmaa, A.; Czernik, S., 1999.: Energy Fuels, 13, 914 – 921 Özbay, G. 2015.: Pyrolysis of Firwood (Abies bornmülleriana Mattf.) Sawdust Characterization of Bio-
Oil and Bio-Char, Drvna industrija 66 (2) 105-114 (2015) Sipila, K.; Kuoppala, E.;Fagernas, L.; Oasmaa, A., 1998.: Biomass Bioenergy, 14, 103-113 Sipile, K.; Kuoppala, E.; Fagernaes, L.; Oasmaa, A., 1998.: Characterization of biomass based flash
pyrolysis oils, Biomass and Bioenergy Vol. 14, No. 2, pp. 103±113 TAPPI T257 cm-02- Uzorkovanje i priprema drva za analize; Sampling and preparing wood for
analysis Zajec L. 2009.: Slow pyrolysis in a rotary kiln reactor: Optimization and experiments. Master’s Thesis,
the School for Renewable Energy Science, University of Iceland and University of Akureyri URL:http://www.plantea.com.hr/crna-topola, 10.10.2017.

28th International Conference on Wood Science and Technology 2017 IMPLEMENTATION OF WOOD SCIENCE IN WOODWORKING SECTOR
183
Influence of Veneering on the Properties of Lightweight Particleboards with Expanded Polystyrene
Kozak, Liubov1*; Bekhta, Pavlo1; Sedliačik, Ján2; Iždinský, Ján3
1 Department of Wood-Based Composites, Cellulose and Paper, Ukrainian National Forestry University, Lviv, Ukraine
2 Department of Furniture and Wood Products, Faculty of Wood Sciences and Technology Technical University in Zvolen, Slovakia
3 Department of Mechanical Wood Technology, Faculty of Wood Sciences and Technology Technical University in Zvolen, Slovakia
*Corresponding author: [email protected]
ABSTRACT
In this study, non-veneered and veneered lightweight single-layer particleboards were made and their properties were investigated. The wood particles, expanded polystyrene and UF resin were used to make boards in laboratory conditions. Rotary-cut birch veneer was used for veneering of lightweight boards. The boards were made in a thickness of 18 mm and density of 350, 450 and 550 kg/m3 at pressing temperature of 200 °С, pressure of 2.4 MPa and time of 0.23 min/mm. To make the boards the wood particles were mixed with expanded polystyrene at the ratio 93:7. The UF glue consumption was 10% of the mass of absolutely dry wood particles. Modulus of rupture (MOR), modulus of elasticity (MOE), tensile strength perpendicular to the plane of board (IB), thickness swelling, and water absorption of lightweight particleboards were determined. It was found that veneering of lightweight particleboards by birch veneer improved their properties significantly. The results of research have shown that the MOR and MOE of veneered boards within density range of 350-550 kg/m3 meet the requirements (for lightweight particleboards) of EN 16368 (types LP1 and LP2). The IB value of veneered boards only with density of 550 kg/m3 meets the requirements of EN 16368 (only type LP1). The MOR, MOE and IB of non-veneered boards also meet the requirements of EN 16368 (type LP1) except boards with density of 350 kg/m3 for MOR and MOE, and except densities of 350 and 450 kg/m3 for IB.
Key words: Lightweight particleboard, Construction of the board, Expanded polystyrene, Veneering, Physico-mechanical properties 1. INTRODUCTION
In every year, lightweight composites are becoming increasingly popular in consumers and manufacturers of furniture products (Shalbafan et al., 2013). In Central Europe, every second euro spent on furniture is being used to buy lightweight furniture (Thomen, 2008). However, with a decrease in the weight of board materials, there is a significant increase in the proportion of voids and pores, and their inner structure changes, which causes the decreasing of the physical and mechanical properties of such boards. Therefore, the construction of lightweight boards requires additional research.
Today, there are many ways to achieve the light construction of boards (Thomen, 2008; Dziurka et al., 2013; Shalbafan et al., 2013; Barbu, 2015; Dziurka et al., 2015). Dziurka et al. (2015) investigated the possibility of using rape straw and expanded polystyrene for the production of low density particleboards. The Kaurit® Light technology from BASF suggests the use of expanded polystyrene in construction of board with a top layer of MDF that makes them 20-30% lighter than traditional particleboards and at the same time is equivalent in the strength (Basf, 2010). Currently, the development of this technology is ongoing. Moreover, such boards are more thermo-insulating than constructional ones. In the sandwich constructions of

28th International Conference on Wood Science and Technology 2017 IMPLEMENTATION OF WOOD SCIENCE IN WOODWORKING SECTOR
184
lightweight boards, Dascanova Co uses 3D frame of corrugated cardboard or thin fibrolite (Barbu and Paulitsch, 2014). However, their application for furniture needs special accessories.
It is known: that even one-side veneering of extruded particleboards significantly (in 15-20 times) increases their strength and it makes possible to produced hollow boards (Bekhta, 2004). Wood veneer can strengthen the construction and improve the aesthetic appearance of lightweight boards, facilitating their surface treatment. However, we did not find any literature resources related to the veneering of lightweight particleboards made with expanded polystyrene and information about how this process affect the properties of such boards.
Therefore, the aim of this study was to strengthen lightweight particleboards with expanded polystyrene by veneering them and to investigate their properties. 2. MATERIALS AND METHODS
The industrial wood particles, rotary-cut birch veneer of the thickness 1.5 mm and moisture content of 6±2%, expanded polystyrene (granules of 4-8 mm in diameter) and UF resin (Dukol) were used for manufacturing lightweight particleboards.
Lightweight single-layer particleboards were produced with the thickness of 18 mm and density of 350, 450 and 550 kg/m3. Two types of boards were made (Figure 1): type A – non-veneered, type B – veneered. In both board’s type the wood particles were mixed with expanded polystyrene at the ratio 93:7 and the UF glue consumption was 10% of the mass of absolutely dry wood particles. To prepare the UF glue the paraffin emulsion (15.7 mass fraction to 100 mass fraction of their resin solution) and hardener ammonium nitrate (5 mass fraction to 100 mass fraction of their resin solution) were added to UF resin.
Figure 1. Types of lightweight particleboards.
To make the boards the mixing of wood particles, expanded polystyrene and UF glue were
carried out in the laboratory drum blender. Firstly, wood particles and 50% of glue were loaded into the blender and mixed for 10 minutes. After that, expanded polystyrene and the rest of the glue were added to obtained mixture and then this mixture was continued to blend during the next 5 minutes. The formed mat took place in the form. The form was installed on a metal pallet. After that, the dispersed part of the mat, that consisted mixture of wood particles, UF glue and expanded polystyrene, fell into the form. For board type B the veneer with glue on one of its surfaces was putted on the metal pallet and on the top of the dispersed part.
The formed mat was pre-compressed in a cold press for 10 minutes before pressing. The pressing was carried out in a hot press using distant gaskets. The boards were pressed at temperature of 200 °C, pressure of 2.4 MPa and time of 0.23 min/mm in a one-step process. The obtained boards were conditioned for seven days and then cut into samples to determine

28th International Conference on Wood Science and Technology 2017 IMPLEMENTATION OF WOOD SCIENCE IN WOODWORKING SECTOR
185
the physical and mechanical properties (modulus of rupture (MOR) and modulus of elasticity (MOE), tensile strength perpendicular to the plane of board – internal bond (IB), thickness swelling and water absorption) according to EN 310 (1993), EN 319 (1993) and EN 317 (1993).
3. RESULTS
As a result of the study, it was found, that the MOR and MOE in board type B are higher, than in board type A (Figures. 2, 3). It can be clearly seen that the veneering made it possible to improve MOR and MOE significantly. Moreover, the values of MOR and MOE increased with rising density of both types of lightweight particleboards. The increasing values of MOR were 259%, 366% and 416%, and MOE were 460%, 437% and 425% for boards’ type B with density 350, 450 and 550 kg/m3, respectively. The similar trend in increasing MOR and MOE can be observed in the boards type A. It is logical that with increasing density of boards MOR increases practically proportionally. Schirp et al. (2008) were also found that the MOR and the MOE are proportional to the density of the boards.
The results of this study have shown that values of MOR and MOE of lightweight particleboards type A and B within density range of 350-550 kg/m3 meet the requirements for lightweight particleboards according to EN 16368.
Figure 2. Modulus of rupture of lightweight particleboards.
2.7
4.8
6.8
9.7
22.4
35.1
0
5
10
15
20
25
30
35
40
350 450 550
Modulu
s o
f ru
ptu
re (
MO
R),
MP
a .
Density of boards, kg/m3
Type A Type B
3,5 MPa (LP1)
EN 16368

28th International Conference on Wood Science and Technology 2017 IMPLEMENTATION OF WOOD SCIENCE IN WOODWORKING SECTOR
186
Figure 3. Modulus of elasticity of lightweight particleboards.
Figure 4. Tensile strength perpendicular to the plane of lightweight particleboards.
The influence of the type and density of boards on their IB is presented on Figure 4. It was
established that the IB of the lightweight board does not depend on the studied construction of the boards and rising proportionally with increasing density. This agrees well with the well-known assertions that density affects and determines the strength of the composite boards (Maloney, 1993). However, it should be stated that IB of lightweight boards type A with density 450 and 550 kg/m3 and type B only with density 550 kg/m3 meets the requirements of EN 16368 (only type LP1). The IB values of boards with density 350 kg/m3 (type A and B) and 450 kg/m3 (type A) does not meet these requirements. This can be explained by the fact that the volume of expanded polystyrene in boards with density 350 or 450 kg/m3 is larger than in boards with density 550 kg/m3. Expanded polystyrene is the least durable material among components of lightweight boards, so the destruction of the boards samples during IB test take place precisely in the places of polystyrene concentration. There was no delamination of the veneer from the chip-polystyrene package in the samples during IB tests.
473
984
3907
5163
728
2651
0
1000
2000
3000
4000
5000
6000
350 450 550
Density of boards, kg/m3
Modulu
s o
f ela
stic
ity (
MO
E),
MP
a .
Type A Type B
500 MPa (LP1)
EN 16368
0.13
0.23
0.33
0.12
0.24
0.35
0
0.1
0.2
0.3
0.4
0.5
350 450 550
Density of boards, kg/m3
Tensile
str
ength
perp
endic
ula
r to
the p
lane
(IB
), M
Pa
Type A Type B
0,24 MPa (LP1)
EN 16368

28th International Conference on Wood Science and Technology 2017 IMPLEMENTATION OF WOOD SCIENCE IN WOODWORKING SECTOR
187
Thickness swelling values after 2 and 24 hours immersion in water respectively is shown in Figure5. It was established that the boards type B are swollen less than boards type A. The thickness swelling after 2 hours for boards type A was on 60%, 62% and 67% higher than for boards type B with density 350, 450 and 550 kg/m3, respectively. This is due to the protective surface effect of the veneer in the board type B, which prevents water from penetrating into its porous structure.
Figure 5. Thickness swelling of lightweight particleboards.
Thickness swelling after 24 hours of the boards type A was higher than those of type B on
45%, 27%, and 15% for densities of 350, 450 and 550 kg /m3, respectively. Moreover, thickness swelling increases with increasing density of boards. Dziurka et al. (2013) found that elevated gluing degree of the core layer was accompanied by reduced water absorption and swelling after 24 hours of immersion in the water. Improved hydrophobic properties were a function of the adhesive type and expanded polystyrene.
The water absorption values of investigated boards during 2 and 24 hours are shown in Figure6. The water absorption after 2 hours was decreased for both types (A and B) of boards on 24%, 20% and 8% for density 350, 450 and 550 kg/m3 respectively. In the boards with high density the content of the pores is small, so the absorption of water is less. The difference in the water absorption values after 24 hours between boards type A and B was increasing on 15% 18% and 23% for the density 350, 450 and 550 kg/m3 respectively.
6.0
13.9
9.6
11.6
13.5
7.38.5
14.7
15.5
5.3
3.64.5
0
4
8
12
16
20
350 450 550
Density of boards, kg/m3
Thic
kness s
welli
ng, %
Type A (2 h) Type A (24 h)
Type B (2 h) Type B (24 h)

28th International Conference on Wood Science and Technology 2017 IMPLEMENTATION OF WOOD SCIENCE IN WOODWORKING SECTOR
188
Figure 6. Water absorption of lightweight particleboards.
Water absorption after 24 hours was decreased with increasing the board’s density in the
studied range. Moreover, this decrease was higher in the boards’ type B. These results may be explained by the presence of hydrophobic expanded polystyrene in the boards and veneering the board type B.
4. CONCLUSION
Physical and mechanical properties of veneering and non-veneering lightweight plasterboards containing expanded polystyrene were investigated in this study. The veneering of lightweight particleboards by birch veneer improved their properties significantly. The results of the study have shown that the MOR and MOE of veneered lightweight particleboards within the density range of 350-550 kg/m3 meet the requirements for lightweight particleboards of EN 16368 (types LP1 and LP2). The IB values of veneered lightweight boards with density 450 and 550 kg/m3 and non-veneered boards with only density 550 kg/m3 meet the requirements of EN 16368 (only type LP1). Veneered lightweight particleboards have less thickness swelling and water absorption than non-veneered boards.
Acknowlwdgement: This work was supported by the Slovak Research and Development Agency under the contract No. APVV-14-0506.
REFERENCES
Barbu, M. C. (2015): Evolution of lightweight wood composites. PRO LIGNO 11 (4): pp.21-26. Barbu, M. C.; Paulitsch, M. (2014): World Market Development of wood-based Products. In:
Proceedings of the 3rd International Conference Technologies for the Forest and Biobased Products Industries. Austria, Kuchl. September, 2014. 36-41.
Basf. (2010): Kaurit Light. Superspan Star. URL: HTTP//www.kauritlight.com
Bekhta, P. (2004): Technology of wood-based panels and laminates. Osnova. Kyjiv, 780p. Dziurka, D.; Mirski, R.; Dukarska, D.; Derkowski, A. (2015): Possibility of using the expanded
polystyrene and rape straw to the manufacture of lightweight particleboards. Maderas. Ciencia y tecnología 17 (3): pp. 647-656.
64.2
44.8
25.4
110.1
89.5
68.8
48.5
23.3
35.9
52.7
73.2
93.7
0
20
40
60
80
100
120
350 450 550
Density of boards, kg/m3
Wate
r absorp
tion, %
Type A (2 h) Type A (24 h)
Type B (2 h) Type B (24 h)

28th International Conference on Wood Science and Technology 2017 IMPLEMENTATION OF WOOD SCIENCE IN WOODWORKING SECTOR
189
Dziurka, D.; Mirski, R.; Trojanski, A. (2013): Characteristics of lightweight particleboards with the core layer supplemented with rape straw and expanded polystyrene. In: Annals of Warsaw University of Life Sciences – SGGW Forestry and Wood Technology 82: pp. 250-254.
EN 310 (1993) Wood-based panels - Determination of modulus of elasticity in bending and of bending strength.
EN 317 (1993) Particleboards and fiberboards - Determination of swelling in thickness after immersion in water.
EN 319 (1993) Particleboards and fiberboards - Determination of tensile strength perpendicular to the plane of the board.
Maloney, T.M. (1993): Modern particleboard and dry-process fiberboard manufacturing, Backbeat Books. 672p.
Schirp, A.; Dix, B.; Meinlschmidt, P.; Thole, V. (2008): Lightweight Particleboards made from annual and perennial plants or based on foamed adhesives. In: Proceedings of the 42nd International wood composites symposium, USA, Seattle/Washington. April, 2008. 443-495.
Shalbafan, A.; Mark, A.; Dietenberger, J.; Welling, J. (2013): Fire performances of foam core particleboards continuously produced in a one-step process. European Journal of Wood and Wood Products 71 (1): pp. 49–59.
Thomen, H. (2008): Lightweight panels for the European furniture industry: some recent developments. In: COST Action E49 International Workshop: Lightweight wood-based composites: production, properties and usage. Slovenia, Bled. June, 2008. 1–13.

28th International Conference on Wood Science and Technology 2017 IMPLEMENTATION OF WOOD SCIENCE IN WOODWORKING SECTOR
190

28th International Conference on Wood Science and Technology 2017 IMPLEMENTATION OF WOOD SCIENCE IN WOODWORKING SECTOR
191
Modeling of Externally Invisible Cabinet Furniture Joints
Krzyżaniak, Łukasz1; Smardzewski, Jerzy1 Department of Furniture Design, Faculty of Wood Technology,
Poznan University of Life Sciences, Poznan, Poland
ABSTRACT
Study aims were determined in such a way as to meet furniture industry needs of both producers and customers. It was decided to create a novel disassembly furniture joint that would also be externally invisible and would confirm its usability on the basis of strength and rigidity evaluation. For this purpose, a prototype was designed and physically created. It guaranteed users’ quick and tool-less assembly and disassembly of cabinet furniture. An innovative approach was to use a torsional-stress mechanism generating assembly forces that tightened connected elements. Preliminary experiments with corner joint samples showed satisfactory stiffness and rigidity in comparison with reference joints employing common furniture connectors. It was demonstrated that the new design possessed required features to create durable and straightforward furniture joints competitive with variants already available on the market. Additionally, the authors also devised a technological process of making connector sockets with employment of a single drill bit. Key words: 3D design, Furniture, Joints, Strength, Technology 1. ORIGIN OF THE PROBLEM
A construction is as strong as its weakest link. It is the quality of the connectors employed in the construction that influence the final system ultimate strength. In furniture making, generally speaking, we deal with the following two basic groups of furniture construction: cabinet and skeleton furniture. In spite of widespread attempts to minimise production costs many furniture manufacturers continue to use wood as their basic construction material. Among the main problems facing cabinet furniture designers is the selection of appropriate construction solutions regarding the method of connecting individual elements. A furniture connection constitutes a fragment of a furniture construction in which at least two elements have been joined. Furniture elements can be united by means of glue adhesive, connectors or joints. One of the most common ways of fastening elements of cabinet furniture is connecting them by dowels or mortises. The above-mentioned types of attachments are very advantageous technologically as they are characterised by high aesthetic properties thanks to invisibility of the joint, good strength and low price. The main disadvantage of dowel and mortise connections is the need to use glue and their inseparability. They owe their popularity to the simple technological process of making mortise seats. Most frequently employed detachable furniture connector is the eccentric. The main advantage of the application of the eccentric is its capability to form a strong and stiff detachable joint. A shortcoming of the majority of mechanical connectors is their high degree of complexity. The endurance of eccentric joints is relatively high because of the tightening strength exerted on the connected elements which it generates (Demirci, 2011). The Lamello© company is among leading manufacturers of novel furniture connectors. The most resilient Lamello© connectors require the application of tools to obtain the connection which indicates its next disadvantage, i.e. a visible orifice made in the connected element. The employment of glue in the case of application of shape connectors exerts a significant influence on their strength (Derikvand and Eckelman, 2015). Advances made in the field of butterfly-shaped connectors led to their shape improvement, method of their assembly as well as to the application of innovative materials. The use of heuristics makes it possible to create novel constructions and to develop them in non-typical directions (Daly et

28th International Conference on Wood Science and Technology 2017 IMPLEMENTATION OF WOOD SCIENCE IN WOODWORKING SECTOR
192
al., 2012). Ease of joint assembly and disassembly without the need to use tools, external invisibility, high aesthetics as well as strengths and stiffness can contribute to high potentials of furniture joints in industrial and trade practice (Smardzewski et al., 2016). The construction of the connector, the method of its mounting as well as the material which was used to make it, do not in themselves determine directly the strength of a given furniture construction. As demonstrated by Norvydas et al. (2005) also the distribution and number of connectors play an important role. There is no doubt that the increase in numbers of connectors also enhances the bending strength of the joint (Rajak and Eckelmann, 1996). The kind and thickness of the material from which a given piece of furniture is manufactured also influence the strength of the joint (Kasal et al., 2006). Furthermore, the way in which connectors unite connected elements is also important. The effectiveness of joints employing neodymium magnets makes them possible to be employed in furniture designing (Smardzewski and Prekrat, 2015). A general trend is noticeable to minimise external visibility and number of connectors and, at the same time, to maximise their strength. External visibility of joints is a characteristic undesirable by furniture customers. There are no investigations regarding the strength of joints manufactured with the assistance of innovative construction solutions.
2. THE OBJECTIVE OF STUDY
The goal of the performed experiments was to design an innovative externally invisible furniture joint with a torsional-stress mechanism. The cognitive objective of this investigation was to determine stiffness and strength of the developed joints based on experimental studies.
3. METHODOLOGY
3.1. Design assumptions, analysis of the existing solutions and ideas regarding new proposals
To increase furniture stiffness and durability, it is important to make manufacturers aware which factors play key roles in strengthening furniture connections (Maleki et al., 2012). It was suggested that an ideal furniture joint should be very simple during the tool-less assembly process, externally invisible and simple in construction. The most desirable features of the designed joint comprised: invisibility, assembly without the need to use tools and internal strength produced by a connector. Generation of the tightening force connecting elements with one another required accumulation in the connector appropriate energy. To restrict the number of activities essential to assemble a piece of furniture, the authors decided to design a mechanism accumulating energy in the connector during torsion and expansion. For reasons described above, a cylinder was adopted as the initial form of the connector. The problem was how energy was to be accumulated. Induction of a torsional moment was considered as the best method of energy accumulation in the connector without having to introduce a considerable change in its form (Figure 1).
Figure 1. Construction sketch of a torsional connector: 1. Sleeve, 2. Connector (the authors’ own design)

28th International Conference on Wood Science and Technology 2017 IMPLEMENTATION OF WOOD SCIENCE IN WOODWORKING SECTOR
193
Appropriate keys made at the base of the connector (Figure 1) were to cause its torsion during its installation in the sleeve (1). The energy accrued in the connector (2) in the way described earlier was to be returned thanks to the appropriately shaped sleeve. An improved version of this solution involved the transformation of keys into arms as well as enlargement of the sleeve into a form of three cylinders connected with one another. However, the outcome of the transformed device was a cylinder. This solution was to guarantee an effective torsion of the connector during the coupling process and possibility of making the seat for the sleeve in the drilling centre (Figure 2).
Figure 2. Construction sketch of a torsional connector: 1. Sleeve, 2. Connector (the authors’ own design)
Figure 2 presents the sketch draft of the connector (TwiCom) selected for experiments.
The solution consists of a pair of identical sleeves (1) and the connector proper (2). The presented sleeves were to be glued into properly shaped seats. Appropriately shaped sleeve inside was to cause torsion of the connector and, later, its expansion. To achieve the required effect of energy return by the connector (2), it is essential to maintain parallelism of sleeves (1). For this reason, there must always be at least two connectors.
3.2. Description of the selected corner joint
3.2.1. Method of obtaining the connector and sleeves
During the process of prototyping, the authors employed the 3D printing technology and employed ABS and PLA type of materials. The acrylonitrile-butadiene-styrene (ABS) copolymer is a plastic material manufactured by the polymerisation of butadiene and co-polymerisation of acrylonitrile with styrene. The polylactide (PLA) is a polymer obtained from natural raw materials, which exerts influence on its biodegradability and constitutes its basic advantage. PLA material is characterised by similar physical and mechanical properties as ABS. The applied prototyping process revealed dimensional variations of hardened models manufactured from PLA in comparison with the virtual model. This was the basis of rejecting this material in favour of the ABS copolymer.
3.2.2. Description of the applied corner joint
Elements of the joint were made from glued oak wood 25 mm thick. Wood intended for experiments was subjected to seasoning in laboratory conditions at 65 % relative air humidity and temperature of approximately 25 oC until it reached constant mass. Taking into consideration internal force distribution acting on the furniture construction nodes, the authors decided to select for experiments an L-type corner joint appropriate for determining bending strength in closing and opening tests. A solution based on typical drillings using multiple-spindle drilling machines was adopted. Shapes of seats made it possible to slide sleeves easily into one vertical and one horizontal element, to place the connector into sleeves and then press both elements in the direction parallel to the axis of the connector (Figure 3). Mutual relocation of the elements causes internal forces on the surface of contact of the connector, sleeve and the panel and a growing pressure on the contact area of the two elements. Five samples were used

28th International Conference on Wood Science and Technology 2017 IMPLEMENTATION OF WOOD SCIENCE IN WOODWORKING SECTOR
194
for each kind of joints. Bearing in mind the fact that experiments were of compression and tensile test nature, the total of 10 samples were prepared.
Figure 3. Construction sketch of a corner joint: 1. Element 1, 2. Sleeve, 3.connector, 4. Element 2
3.2.3. Method of determination of joint stiffness and strength
The authors decided to determine joint mechanical properties, including stiffness and strength, using for this purpose compression (Figure 4a) and tensile (Figure 4b) tests. Experiments were carried out on a numerically controlled test machine Zwick 1445. Tests were terminated when the load dropped by 20 N or once the displacement DP exceeded 10 mm along the direction of action of force P.
Figure 4. Dimensions necessary to calculate stiffness coefficient K: a) compression, b) tension (c=b=2.5 mm)
In addition, it was decided that in each sample, the value change of Δf angle between joint
arms would be determined. For this purpose, analytical calculations were applied (Figure 4). The strength of the joint was expressed as the highest value of the bending moment causing the destruction of the construction. Analytically, the stiffness of the joint was determined based on the analysis of change of joint geometry during its loading with force P (Figure 4). During the joint compression test (Figure 4a), its stiffness was determined from the following equation:

28th International Conference on Wood Science and Technology 2017 IMPLEMENTATION OF WOOD SCIENCE IN WOODWORKING SECTOR
195
Joint stiffness in the tensile test (Figure 4b) was determined from the following equation (Smardzewski et al., 2016):
It was decided that the strength of joints would be determined by comparing maximal
bending moments resulting in the destruction of the joint. For joints subjected to tension, the following formula was applied: � = ��′, whereas for joints subjected to tension - � = ��′.
4. ANALYSIS OF RESULTS AND THEIR DISCUSSION
4.1. Stiffness of joints
Empirical experiments helped evaluate objectively the stiffness and strength of examined joints. First, the tensile test was conducted (Figure 5a) followed by the compression test (Figure 5b).
a) b) Figure 5. Joint empirical experiments: a) tension, b) compression
It is recommended that joints should be characterised by high stiffness if they are to be used in furniture making. The stiffness of the examined joint in the tensile test was presented graphically (Figure 6a) as a relationship of the moment of force to the angle of rotation between arms.
Figure 6. Joint stiffness in: a) tension, b) compression tests
The stiffness test of novel joints in the compression test (Figure 6b) demonstrated less
advantageous results in comparison with the tensile test.

28th International Conference on Wood Science and Technology 2017 IMPLEMENTATION OF WOOD SCIENCE IN WOODWORKING SECTOR
196
4.2. Strength of joints
Figure 7 presents graphically a comparison of dependencies of load on deflection.
Figure 7. Dependence of the load on deflection in: a) tension, b) compression tests
Destruction in the case of the innovative solution consisted in the detachment of the
construction which was to be one of the features of the joint. After completing empirical tests, samples of new joints could be re-assembled again. None of the elements undergone physical destruction. It is true that the thickness of connected elements as well as the material from which they were manufactured played a role in the strength of the examined joints. The innovative solutions were manufactured from elements 25 mm thick and from material of very good mechanical properties, which, undoubtedly, exerted an advantageous impact on the new solution. It is true that connectors made of ABS are characterised by a very low modulus of elasticity with respect to e.g. metal from which eccentric connectors were manufactured. The obtained very good results characterising the strength of the novel joint were affected by the thickness of the connected elements as well as the wood material from which they were made. Taking into account the above considerations, it was concluded that the new solution, with respect to its strength, was as good as standard joints available on the market.
4.3. Comparison with other experimental studies
The comparison of the obtained research results with data regarding maximal stiffness of other joints (Smardzewski and Prekrat, 2015), it was observed that in the compression test (Figure 8), joint rigidity was satisfactory. It has to be admitted that the observed high stiffness level was also influenced by the kind of material from which the connected elements were manufactured. The sample described in this study was made from wood, whereas the remaining items from the list were based on samples manufactured from wood-based materials. In future experiments, joint sampled with be prepared from particleboard.
Figure 8. Comparison of the maximal stiffness levels of joints in a compression test (kNm/rad)

28th International Conference on Wood Science and Technology 2017 IMPLEMENTATION OF WOOD SCIENCE IN WOODWORKING SECTOR
197
5. CONCLUSIONS
Based on the performed research and design investigations, the following conclusions can be drawn:
1. An innovative joint for elements of cabinet furniture was designed which ensure: simplicity of execution, simple assembly and disassembly without the need to use tools as well as external invisibility of connectors.
2. Satisfactory stiffness and strength of joints useful in furniture design were demonstrated experimentally.
3. The prepared construction design makes it possible to implement the solution in mass production.
4. In future studies as well as industrial applications, it will be expedient to replace the ABS connectors by metal connectors.
5. In future experiments, it is recommended to compare joints based on connection of elements uniform with respect to the raw material they are manufactured from.
REFERENCES Daly, S.R.; Yilmaz, S.; Christian, J.L.; Seifert, C.M.; Gonzalez, R. (2012). Design Heuristics in
Engineering Concept Generation. Journal of Engineering Education 101(4): pp. 623-624 Demirci, H.I. (2011). The experimental and element analysis of diagonal tensile tests conducted on
frame-type constructed corner joints. Technology 14(1): pp. 12-13 Derikvand, M.; Eckelman, C.A. (2015). Bending Moment Capacity of L-Shaped Mitered Frame Joints
Constructed of MDF and Particleboard. Bioresources 10(3): pp. 5687-5688 Kasal, A.; Sener, S.; Belgin, C.M.; Efe H. (2006). Bending Strength of Screwed Corner Joints with
Different Materials. G.U. Journal of Science 19(3): pp. 160-161 Maleki, S.; Derikvand, M.; Dalvand, M.; Ebrahimi G. (2012). Load-carrying capacity of mitered
furniture corner joints with dovetail keys under diagonal tension load. Turkish Journal of Agriculare and Forestry 36: pp. 636-643
Norvydas, V.; Juodeikienė, I.; Minelga, D. (2005). The Influence of glued Dowel Joints Construction on the Bending Moment Resistance. Materials science 11(1): pp. 38-39
Rajak, Z.; Eckelman, C.A. (1996). Analysis of corner joints constructed with large screws. J. of Tropical Forest Products 2(1): pp. 80-92
Smardzewski, J.; Prekrat, S. (2015). Furniture Joints with Neodymium Magnets. Implementation of wood science in woodworking sector 2(1): pp. 201-207
Smardzewski, J.; Rzepa, B.; Kiliҫ H. (2016). Mechanical properties of externally invisible furniture joints made of wood-based composites. Bioresources 11(1): pp. 1226-1237

28th International Conference on Wood Science and Technology 2017 IMPLEMENTATION OF WOOD SCIENCE IN WOODWORKING SECTOR
198

28th International Conference on Wood Science and Technology 2017 IMPLEMENTATION OF WOOD SCIENCE IN WOODWORKING SECTOR
199
Trends In The Production And Design Of Upholstered Furniture
Tauber, Jiří*; Holouš, Zdeněk; Szökeová, Sarah; Kozák, Miroslav; Svoboda, Jaroslav Department of Furniture, Design and Habitation, Mendel University in Brno, Czech Republic
*Corresponding author: [email protected]
ABSTRACT
The aim of this paper is to show new trends in living room furniture, design and development of the sofa. Possibility of using contemporary technology, solid wood, composite materials and upholstery. The aim of this paper is also to demonstrate the design process of the sofa experimental design. The design is based on common material and technical options and the requirements of European test standards. The result is a sofa set of elongated shape, required properties (safety, strength, durability and stability). Mounting the sofa allows for safe transport. The goal was to create a simple and functional product of an interesting shape that meets the ergonomic and safety requirements of European standards for seating furniture. Key words: Upholstered furniture, Design, Construction, Strength, Safety 1. THE CURRENT STATE OF SOLVED PROBLEMS
At present, large wall units, heavy massive sofas and armchairs are still used in some households, but this type of equipment is already past in many of them. People are increasingly following the trend of today's times, in which the sofa plays a major role.
Sofas are made in a wide range of designs, technical construction, colours and materials. Style and shape along with the sofas in the room greatly influence the atmosphere of the living room. With wrong selection or placement of a sofa the disposition of the room may be disturbed.
In many households, these modular systems or classical L-shaped and U-shaped corner sofas currently exist. In small spaces are normally used sofa beds or two smaller subtle sofas, which can be moved across the room. The most common colours of sofas are neutral. For example, cream, beige and light grey, or dark colours.
Sofa beds are nowadays very popular. The folding type of sofas is an ideal choice especially for small houses and flats, where disposition does not allow a separate guest room. However, it is very difficult to obtain a folding sofa, which would be also subtle. Folding system requires a more complex and robust design, and therefore this type of sitting will always be a little more robust than available variants of classic sofas.
The so-called intelligent furniture comes to the forefront, in this case we are talking about intelligent sofas. This is a type of variable furniture that has hidden mechanisms inside which can be used to set individual position of seating. In this kind of sofas it is possible to change the depth and slope of the seat, the height of the backrest, the height of the head or lumbar support, the shape and inclination of the armrests, and in some cases even the rigidity of the seat or lumbar support can be adjusted. This kind of sofas cost much more than typical ones. They can also include massage systems. Massage and folding mechanisms should be easy to manipulate, so we can meet the furniture with electromotors.
A very current and modern theme are simple sofas that use new materials and technologies.

28th International Conference on Wood Science and Technology 2017 IMPLEMENTATION OF WOOD SCIENCE IN WOODWORKING SECTOR
200
1.1. Examples of solutions for a variable sofa
Living Sculpture sofa was created by the design of the world-famous Danish architect and designer Verner Panton. It proves that alternative and variable seating is not just a matter of modern times, but this kind of unconventional concept of furniture has been made earlier. This sofa, made in 1970s, with a height about 3.5 meters, is more like a statue than a classic sofa. It is special by its colourful and atypical organic shape, which encourages other activities than traditional sitting or lying. This sofa can be used as a home playground especially for children.
Figure 1. Example of modern sofa design (Playscapes, 2017)
Variable sofa Wave, or wool, is an example of how to combine the high functionality of a product with a simple and modern design. "Wave" thanks to its organic curves and free pillows offers several possibilities of sitting and lying in a very small space. Thanks to its simplicity and curves, it also has a very elegant look and fits in almost every interior.
Figure 2. sofa Wave (Gase Lebensräume einrichten, 2017)

28th International Conference on Wood Science and Technology 2017 IMPLEMENTATION OF WOOD SCIENCE IN WOODWORKING SECTOR
201
"Yang" was designed by French designer Francois Bauchet for Ligne Roset. The sofa excels in its specific and very simple shape at the same time. Sofa is standing just on the subtle metal legs, so it acts airy. This four-piece sofa has several possibilities to use. It can be assembled into two separate sofas, a curved L-shaped sofa and one armchair, or all 4 parts of the sofa can be assembled into a single enclosed unit in the form of a rounded square.
Figure 3. sofa Yang (UBlog, 2017)
2. SOFA DESIGN
Design of this upholstered sofa links historically proven facts with the current trend. Visually, there is a link in permeation of matter and subtitle look, which has been created by stylish thin wooden legs. The design of the sofa comes from classical construction and craft processing while following basic rules concerning ergonomics and typology that are being laid upon upholstered furniture. This article shows the whole process starting with the original thought up to testing in a furniture testing room. During the process, the author of this design was developing the final shape using visualizations. First visualizations were followed by creating a reduction model. Shape proving of an upholstered sofa led to more exact construction solutions and a realization of the final prototype and testing in the furniture testing room.
Final appearance of the new sofa is shown in the first figure. There are three shape variations of appearance of this upholstered sofa. The first option shows a fully upholstered variation of the seat. The second and third option use decorative wooden component which is placed to the front side of the seat.
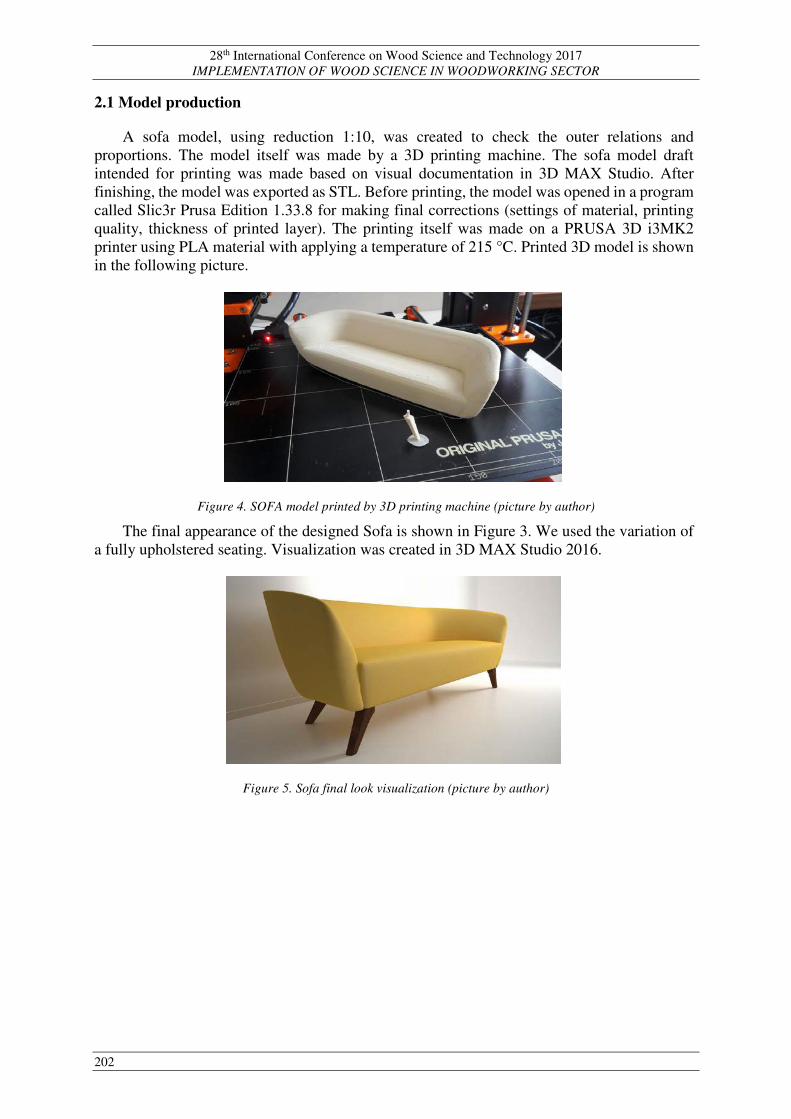
28th International Conference on Wood Science and Technology 2017 IMPLEMENTATION OF WOOD SCIENCE IN WOODWORKING SECTOR
202
2.1 Model production
A sofa model, using reduction 1:10, was created to check the outer relations and proportions. The model itself was made by a 3D printing machine. The sofa model draft intended for printing was made based on visual documentation in 3D MAX Studio. After finishing, the model was exported as STL. Before printing, the model was opened in a program called Slic3r Prusa Edition 1.33.8 for making final corrections (settings of material, printing quality, thickness of printed layer). The printing itself was made on a PRUSA 3D i3MK2 printer using PLA material with applying a temperature of 215 °C. Printed 3D model is shown in the following picture.
Figure 4. SOFA model printed by 3D printing machine (picture by author)
The final appearance of the designed Sofa is shown in Figure 3. We used the variation of a fully upholstered seating. Visualization was created in 3D MAX Studio 2016.
Figure 5. Sofa final look visualization (picture by author)

28th International Conference on Wood Science and Technology 2017 IMPLEMENTATION OF WOOD SCIENCE IN WOODWORKING SECTOR
203
3. TECHNICAL DESCRIPTION OF THE CONSTRUCTION
A supporting frame construction is determined by its shape which brings a certain way of covering the sofa by textile material. The supporting frame is composed out of four assemble units (2 armrests [A], 1 backrest [B] and one seat frame [C]). These parts are put together using screws and T-nuts M8 after being upholstered. See the following pictures (Figure 4. – 6.).
Figure 6 Supporting frame, (picture by author)
3.1 Supporting frame material
Rails and support blocks are made of hard solid wood (beech), other rails are made of hard coniferous wood (spruce). Vertical and shape units which are not suitable for solid wood because of size are made of 15 mm wide birch plywood. The strained parts are doubled and have 30 mm width. Fillings are made of hard 3 mm thick fibre board and of 2,2 mm thick cardboard.
3.2 Construction of assembling units
3.2.1. Supporting frame of the armrests [A].
Connecting of parts is made by screws ø 4,5 mm or staples and supporting blocks, all connections are glued by PVAc on the whole surface. The fillings are glued and fastened on the peripheries by staples. The supporting frame of the armrests is divided into two parts depending on the shape, front linear and back, which is round and spreads out behind the seat up to the backrest part. Upholstery is made from foam and a wadding made of fibre.
3.2.2. Supporting frame of the backrest [B].
Similary to the armrests, the connecting of backrest components is made by screws ø 4,5 mm or staples and support blocks, all connection parts are glued with PVAc on the whole surface. The middle part is smaller on the front side than the side parts, to make it softer by inserting foam. Springing of the backrest surface is made by horizontal springing straps and 2 layers of foam with the fibre wadding under covering, the back filling of the backrest is being placed after firming to the upholstered armrests. Covering is stitched invisibly.
Figure 7. Technical drawing of the supporting frame of the backrest [B]. (picture by author)

28th International Conference on Wood Science and Technology 2017 IMPLEMENTATION OF WOOD SCIENCE IN WOODWORKING SECTOR
204
3.2.3. Seat frame [C].
Seat frame is in shape of irregular hexagon, horizontal rails and support blocks are made of hard wood (beech), the back sidelong part is made of coniferous wood on the peripheries (spruce), side parts, crossbars and front seating skew part are made of 15 mm thick birch plywood. The connection of front rails and side parts is made thanks to wooden dowels ø 10 mm, which go through the whole thickness of the side parts where the screw is in between. The other connections are made by screws and support blocks. There are wooden screw legs fastened to the lower rails by allen screws screwed to stop nuts and wooden pegs ø 10 mm glued to the leg. There are holes ø 12 mm made on the side and back part for screws, for connection with the armrests and the back rest. Springing of the seat is made by zig-zag springs, where is sandwich from polyuretan foam and a fibre wadding under the covering.
Figure 8. Technical drawing of the seat frame [C]. (picture by author)
4. PROTOTYPE MANUFACTURING
While working on the solution, it was managed to create two prototypes of the Sofa. The
construction is described in the paragraph named Supporting frame material. The Sofa construction was made in practical workrooms of the Mendel University. The supporting frame for upholstery can be seen in Figure 9. Upholstered parts were made in cooperation with the upholstery Karel Malý. We used classical modern materials. There is 3 mm thick fiberboard and 2,2 mm thick cardboard used for the filling. Covering textile is used in two colorful variations. When creating the prototype, the following type of covering textile was used, which has high resistance to scuff marks. The covering material has commercial name BORA TERRA 25 and 28, Damask, made from 100% PES (polyester), weight: 330 g/m², resistance 100.000 ot.MD (EN ISO 12947), permanence on light: 5 (EN ISO 105-B02), endurance against humidity/dryness: 5/5 (EN ISO 105-X12), width 140 cm, hard to ignite: BS 5852.
Figure 9: Supporting frame propotype. (picture by author)

28th International Conference on Wood Science and Technology 2017 IMPLEMENTATION OF WOOD SCIENCE IN WOODWORKING SECTOR
205
5. TESTS AND REQUIREMENTS FOR STRENGTH AND SAFETY The designed sofa meets the upholstered furniture requirements stated in European
standards EN 16139 Furniture - Strenght, durability and safety requirements for non- domestic seating.
If the requirements of these standards are met, it is probable that it will meet also requirements of domestic usage, EN12520 Furniture - Strength, durability and safety requirements for domestic seating, because the requirements of EN 16139 are generally higher than EN 12520.
5.1 Stability
The stardard above states in general that the seating furniture must not be overturned in these situations:
- while there is loading on the front edge of the seat surface in median plane; - while loading the seat surface led over the front corner; - while tilting to the side; - while leaning on the backrest; - while sitting on the front side of the seat.
Requirements for stability are met if the furniture is not overturned during tests demanded by the standards EN 16139. The tests are being carried out due to EN 1728 Furniture-Seating-Test methods for the determination of strength and durability while using loadings stated in EN1613, level of test severity is in relation to applications and it determines 2 levels of usage and extreme usage.
Figure 10. Prototype of yellow variation of the Sofa, legs: American walnut (picture by author)
6. CONCLUSION
During the project was made an overview of the most commonly used upholstery sofas at households. We introduced the current trends of upholstered furniture. Based on the research, a new seating element was created. For the new designed sofa, the new model of inner structure was created. There are also important strength and safety requirements that must be met by the newly designed sofa. The requirements are based on European standards for this type of furniture.

28th International Conference on Wood Science and Technology 2017 IMPLEMENTATION OF WOOD SCIENCE IN WOODWORKING SECTOR
206
The described product is designed to meet the requirements of public areas of general use. There are two experimental prototypes on which these requirements will be verified.
Acknowledgments: This article was created with the support of the Internal Grant Agency of the Faculty of Forestry and Wood Technology, Mendel University LDF_VT_2016018.
The result of the project is 7x industrial design, 2x professional publication, 1x abstract in proceedings, 3x diploma thesis, 2x functional sample, 2x international conference, 1x student conference. Elaborated outputs to be completed during January 2017 1x original scientific publication, 1x professional publication focused on marketing.
REFERENCES
EN 12520 (2016): Furniture - Strength, durability and safety - Requirements for domestic seating. EN 16139 (2013): Furniture - Strength, durability and safety - Requirements for non-domestic seating. EN 1728 (2013): Furniture - Seating - Test methods for the determination of strength and durability.
Gase Lebensräume einrichten [online]. Übach-Palenberg: Veronika Gase, 2017 [cit. 2017-10-24]. Available from: https://www.gase-lebensraeume.de/moebel/werther- moebelmanufaktur/sofas.html Playscapes [online]. Paige Johnson, 2017 [cit. 2017-10-24]. Available from: http://www.play- scapes.com/play-art/playable-sculpture/verner-panton-wohnskulptur-1972/ TAUBER, J.; ŠIMEK, M.; HOLOUŠ, Z.; SVOBODA, J. (2016) New Trends in Upholstered Furniture. In The Path Forward for Wood Products: A Global Perspective: Proceedings of Scientific Papers. Zagreb: WoodEMA, i. a., pp. 35--41. ISBN 978-0-692-76612-5. UBlog [online]. UBlog, 2017 [cit. 2017-10-24]. Available from: http://www.ublog.live/bunk-bed- couch/14/couches-that-turn-into-bunk-beds/

28th International Conference on Wood Science and Technology 2017 IMPLEMENTATION OF WOOD SCIENCE IN WOODWORKING SECTOR
207
Comparison between Preschool Tables used in Kindergartens in Croatia, Macedonia and Bulgaria
Iliev, Boris1; Domljan, Danijela1
1 Department for Furniture and Wood Products, Faculty of Forestry, University of Zagreb, Zagreb, Croatia * Corresponding author: [email protected]
ABSTRACT
The pre-school period is a time of the children aged from 1 to 6,5 years, in which occur the greatest changes in psycho-physical growth and development. Therefore, preschool furniture, especially tables used in kindergartens should meet requirements for proper growth and development of pre-school children, in addition to adjusting their residential environment. The tables must follow the anatomy and size of the child's body, as well as construction, material and safety needs. The aim of the research was to identify shortcomings through the collection and comparation of specific dimensional data of the existing furniture used by children in pre-school institutions. Focus of this research was on dimensions of preschool tables used in kindergarten sin the capital towns in three countries: Zagreb (Croatia), Skopje (Macedonia) and Sofia (Bulgaria). The compared results will be used as the basis for solutions for improving the characteristics of the tables. Key words: Design, Dimensions, Furniture, Kindergartens, Preschool children, Tables 1. INTRODUCTION
In urban areas with highly segregated population, language barriers and cultural differences, kindergartens provide an opportunity for the population to integrate, as children easily establish communication and social interaction (Iliev, 2011). Architecture can facilitate this process, acting as a social catalyst (Bajbutović, 1983). Therefore, designing preschool institutions, as well as furniture for their equipping, is a very sensitive process (Domljan, 2011). The end-users of these facilities, the children, need to identify with these institutions in order to encourage a rational, emotional and, above all, a personal attitude, so that they can feel the preschool object as if it were their second home (Ivanovič Šekularac, 2000). On the other hand, through the educational process implemented in these institutions, they can more easily master and accept the tasks given to them by teachers. All this can be achieved only on the basis of the quality of the spatial ambient and the equipment in it.
The construction of new modern facilities intended for preschool education is a very expensive investment, therefore the quality and suitability of furniture is usually given secondary importance (Domljan et al., 2015). Hence, it leads to the use of furniture that is unsuitable for children. When designing furniture for preschools, an extensive analysis needs to be made in which experts from different fields should be included. In addition to architects, designers and furniture designers, pedagogues, psychologists and parents should also be consulted, with the ultimate result of providing a suitable space for healthy and proper psycho-physical development of the children (Domljan et al., 2015).
The goal of the research is, through the collection of specific data on the existing furniture
used by children in pre-school institutions in three different countries, to identify certain shortcomings which will be the basis for concrete solutions for improving the characteristics of the furniture. Another goal of the research is to provide a basis and impetus for further research to improve the process of designing children's furniture, in which professionals from several fields should be involved interdisciplinary.

28th International Conference on Wood Science and Technology 2017 IMPLEMENTATION OF WOOD SCIENCE IN WOODWORKING SECTOR
208
2. METHODS, POLIGONS AND SAMPLES
2.1. Research method
For the purpose of the research, in order to obtain complete information for achieving the goal, two types of methods have been used:
• Method of objective and direct measurement, • Method of observation, recording and photographing.
2.1.1. Measuring the dimensions of the samples – the preschool furniture
All furniture items have been measured that are used in pre-school institutions only by pre-school children, namely in the playrooms.
The measurements have been performed using calliper (0-500) mm, with an error margin of ± 0.02 mm.
All furniture have been measured inheight, depth and width.The measures were taken according to EN 1729-1(EN 1729-1, 2015).
2.1.2. Photographing of the samples
Furniture in kindergartens, used only by pre-school children, has been digitally photographed.
2.2. Poligons
The research was done in several polygons over a period from March to September 2017. The research polygons were kindergartens in three cities:
I. Skopje, Republic of Macedonia (8 kindergartens); II. Zagreb, Republic of Croatia (4 kindergartens);
III. Sofia, Reublic of Bulgaria (3 kindergartens). The polygons were randomly selected.
2.3. Samples
The samples, which were analysed and included in the research according to the methods performed are taken directly from the polygons (Figure 1). Most of the polygons have the same or similar furniture, depending on the manufacturers. They differ from each other according to the shape-constructive solutions, dimensions and materials used in their production (Table 1).
Table 1. Measured samples of the tables
Polygon TableType
Description
I
1 possibility to regulate height, metal legs, worktop made of plywood board, trapezoidal with ABS edge-trim, legs screwed to the worktop (table for 4 persons)
2 possibility to regulate height, metal legs, worktop made of plywood board, circular with ABS edge-trim, legs screwed to the worktop (table for 4 persons)
3 legs made of veneer beech press, worktop made of plywood board, rectangular with solid wood edge-trim, Top (table for 4 persons)
4 legs made of veneer beech press, worktop made of medium-density fiber boards, circular (table for 4 persons)
5 legs made of solid beech wood, worktop made of plywood board, rectangular with ABS edge-trim, Top (table for 4 persons)
6 legs made of solid beech wood, worktop made of plywood board, rectangular with solid wood edge-trim, Top (table for 6 persons)
7 legs made of polypropylene, worktop made of plywood board, rectangular with ABS edge-trim, Top (table for 4 persons)
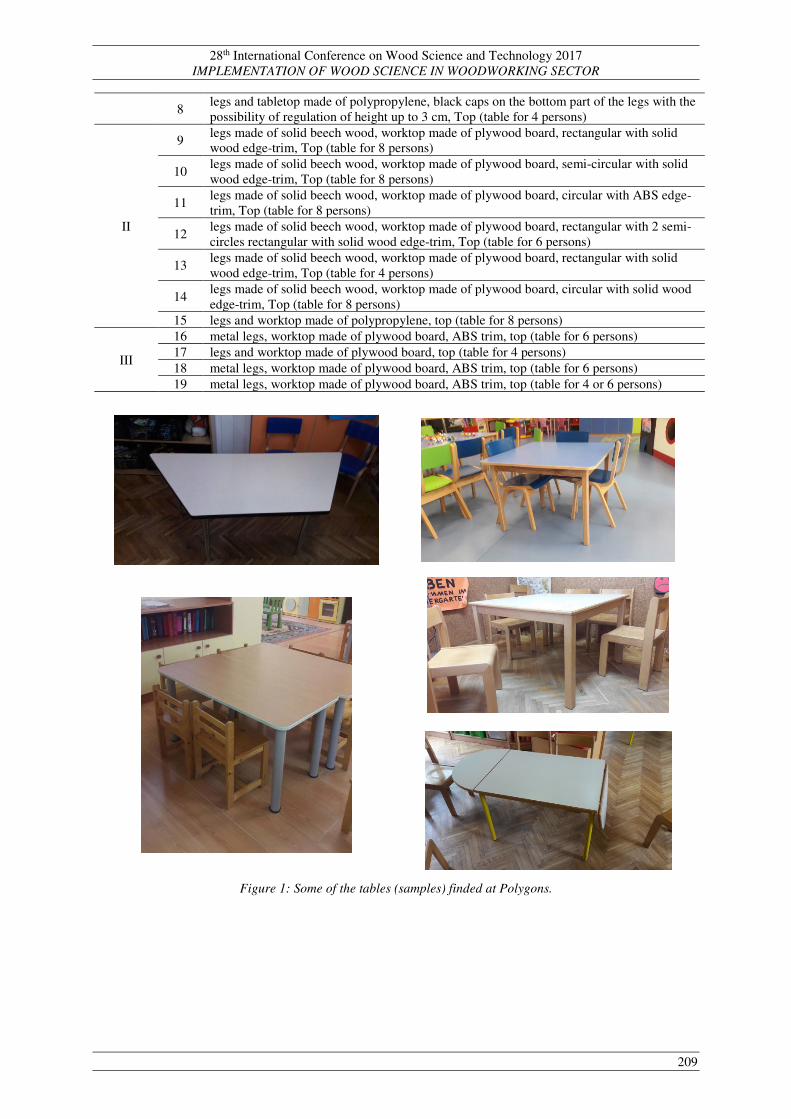
28th International Conference on Wood Science and Technology 2017 IMPLEMENTATION OF WOOD SCIENCE IN WOODWORKING SECTOR
209
8 legs and tabletop made of polypropylene, black caps on the bottom part of the legs with the possibility of regulation of height up to 3 cm, Top (table for 4 persons)
II
9 legs made of solid beech wood, worktop made of plywood board, rectangular with solid wood edge-trim, Top (table for 8 persons)
10 legs made of solid beech wood, worktop made of plywood board, semi-circular with solid wood edge-trim, Top (table for 8 persons)
11 legs made of solid beech wood, worktop made of plywood board, circular with ABS edge-trim, Top (table for 8 persons)
12 legs made of solid beech wood, worktop made of plywood board, rectangular with 2 semi-circles rectangular with solid wood edge-trim, Top (table for 6 persons)
13 legs made of solid beech wood, worktop made of plywood board, rectangular with solid wood edge-trim, Top (table for 4 persons)
14 legs made of solid beech wood, worktop made of plywood board, circular with solid wood edge-trim, Top (table for 8 persons)
15 legs and worktop made of polypropylene, top (table for 8 persons)
III
16 metal legs, worktop made of plywood board, ABS trim, top (table for 6 persons) 17 legs and worktop made of plywood board, top (table for 4 persons) 18 metal legs, worktop made of plywood board, ABS trim, top (table for 6 persons) 19 metal legs, worktop made of plywood board, ABS trim, top (table for 4 or 6 persons)
Figure 1: Some of the tables (samples) finded at Polygons.

28th International Conference on Wood Science and Technology 2017 IMPLEMENTATION OF WOOD SCIENCE IN WOODWORKING SECTOR
210
3. RESULTS
A total of 19 types of tables were analysed, marked with an ordinal number from 1 to 19 (Table 2).
Table 2. Results of measured samples of the tables (EN 1729-1, 2016)
Polygon Table type
Dimensions(cm) Marking (colours)
User guide h1 t1 w1 b1 L
h2, h4,
t2, t3 h9 y z
I
1 56 156/76 74 74 0,1406 / / / 21 / / 2 51 37 58 ø74 0,107 / / / 16 / / 3 50 80 80 80 0,16 / / / 15 / / 4 50 45 70,65 ø90 0,1589 / / / 15 / / 5 50 80 80 80 0,16 / / / 15 Y / 6 50 90 45 90 0,135 / / / 15 / / 7 52 40 62,8 ø80 0,1256 / / / 22 / / 8 52 62 62 62 0,0961 / / / 16,5 / /
II
9 58 90 45 90 1,0125 / / / 24 / / 10 58 45 70,65 Ø90 0,1589 / / / 24 / / 11 48 45 70,65 ø90 0,1589 / / / 21 / / 12 52 80/30 40/ 35 60,ø60 0,1271 / / / 18 / / 13 50 80 80 80 0,16m2 / / / 16 / / 14 54 60 47,1 ø120 0,1413 / / / 19 / / 15 54 57 44,745 ø114 0,1275 / / / 22 / /
III
16 56 100 50 50 0,083 / / / 26 / / 17 52 100 50 60 0,15 / / / 22 / / 18 56 100 50 50 0,15 / / / 26 / / 19 52 100/30 50/35 60 0,15/0,1
27 / / / 21,5 / /
Legend: h1-depth of table top (cm); t1- depth of table top (cm); w1- width of top, per person at front edge, where pupils sit (cm); b1- Width of top surface; S- Surface area per person (min, m2); L- h2, h4, t2, t3- legroom (cm); h9- Height of footrest (cm); y-inclination of the table top (cm); z-vertical distance between the top of the table and the top of the seat (cm).
Various types of tables were found in the research, different in dimensions and shapes,
construction, mobility, use of materials and colours. It was find out that tables in preschool institutions located in all three polygons are used
for many different functions: eating, writing, reading, playing or performing a given task. Adjustable dimensions and shapes
According to the possibility of changing the dimensions, we found tables with the option to adjust the height of the worktops (types 1,2 and 8). The regulation of the tables of types 1 and 2 is possible due to a system located on the legs, composed of two metal bars which enter (slip) into each other. The lower bar that is movable has a small protruding part and enters the upper bar that is fixed and has holes. At the desired height, the protruding part of the bottom bar enters the hole of the upper one. At the table type 8, the height is regulated in such a way that there are caps on the bottom part of the legs, which are wound up in them.
Tables that alter the dimensions according to the collection or assembly principle were found only in Polygon II (type 12). The worktop was consisted of rectangular and two semi-circular top plates. The semi-circular plates are screwed with piano hinges on the rectangular plate, which is held by two movable metal bars that pull back and forth. When the metal bars are pulled in, the semi-circular tops fall down, making the table decrease in dimensions.
Tables that have mechanisms for stretching the tops in width or length, as well as a mechanism for changing the angle of the worktop, were not found. According to the dimensions and condition on the spot, the tables can be divided into higher, i.e., those used in the playrooms

28th International Conference on Wood Science and Technology 2017 IMPLEMENTATION OF WOOD SCIENCE IN WOODWORKING SECTOR
211
for children aged 3 to 7, and smaller tables used for nursery age children. Most often in one preschool facility there are tables of the higher type, which differ in size for several centimetres (maximum +/-5 cm), depending on the manufacturer.
The functional dimensions of the tables are given in Table 1, each measured and marked according to EN 1729-1 (EN 1729-1, 2016) Shapes
Depending on the shape of the worktop there were detected: • quadrangular (types 3, 5, 6, 8, 9, 13, 16, 17 and 19a) • circular (types 2, 4, 7, 11, 14, 15) • semi-circular (type 19b) • trapezoidal (types 1, 19c) • a combination of multiple forms (types 12, 18). The worktop is with outflows from all four sides, that is, longer and wider than the sub-
construction it holds. They are made of plates with a thickness of 18 and 25 mm. The surface of the tables is made of plywood boards covered with melanin paper in several patterns and colours. Mobility
According to the mobility, the tables that are divided into immovable, movable and easily movable – tables with wheels (Kjuchukov, 2004), there are only of the type of easily movable. Materials
According to the materials used, distinguished was tables made of solid wood, wood materials, non-wood materials, and a combination of materials. a) Tables of wood materials:
• Legs made of veneer press and worktop made of plywood boards, edge-trimmed with solid wood trim (type 3) and ABS trim (type5).
• Legs made of solid wood and worktop made of plywood boards edge-trimmed with solid wood trim (types6, 7, 10) or ABS trim (type11).
• Legs made of veneer press and worktop made of medium-density fibre boards (type4). • Table completely made of plywood boards (type17)
b) Tables made of non-wood materials are: plastic substances (types8, 15). c) Tables made of a combination of multiple materials:
• Metal legs and plywood boards worktop, edge-trimmed with solid wood trim (types12, 13, 14) or ABS trim (types1, 2, 16, 18, 19).
• Plastic legs and plywood boards worktop(type7). Construction
In terms of construction, the tables have been designed in the following manner: • Tables on which the legs are directly screwed to the worktop, without carrier
construction (types 1, 2, 7, 8, 15, 18, 19). • Tables with a carrier sub-construction of metal bars in the form of a rectangle, welded
together and screwed to the worktop. (types 12, 13, 14, 15). • Tables with a carrier sub-construction of solid detail rails, connected with fixed
connection with dowels and glue (types 5, 6, 9, 10- semi-circular dowel, 11) • A vertical sub-construction of veneer press, where the legs themselves make up the • construction. They are composed of a single veneer press. During the analysis of the tables, in none of them was found footrest and legs room.

28th International Conference on Wood Science and Technology 2017 IMPLEMENTATION OF WOOD SCIENCE IN WOODWORKING SECTOR
212
Colors
In terms of color, the tables are all different. The legs most often retain the natural appearance of the material, if they are from wooden materials - beech natur, and if they are metallic - the metal finish. The worktops are in the range of white and beige tones, while those of MDF are painted in bright colours, red, green, blue or yellow
4. DISCUSSIONAND CONCLUSION
The comparison of the research of tables carried out in all the three polygons with EN 1729-1:2016 is far from satisfactory. None of the tables in Polygon I meets the dimensional requirements that are prescribed by the standard. The width and length of the tables are within the permissible parameters, while the height and the space prescribed for one child per m2 in more than half is out of the standard. In Polygon II, only two tables type 10 and 11 are within the prescribed standard, while in the case of the others at least one of the dimensions does not fit into the standard. In Polygon III, too, none of the tables is according to the standard. Here, besides the height, the depth is not meet either.
The situation is the same with the comparison between the JUS (JUS.D.E4. 021, 1965) and the BDS (***, 1988). The samples compared to the JUS have great differences in the height of the tables, while in the width and depth there are no significant deviations. In addition to the height, there is deviation in the width with the BDS, both in width and depth.
According to the standard for performing preschool activities in the Republic of Macedonia (***, 2009), the situation is somewhat different. More than half of the tables are designed according to the parameters prescribed by the standards. From all of this, it can be concluded that only a few tables are dimensioned according to the standards. Incorrectly projected tables, compared with chairs, lead to improper growth and development of children.
In all preschools, two types of tables were found, one with a bigger height, and the other with a smaller one. The higher ones were used in the rooms where children aged 3 to 7 were resided, while the rest were in the rooms where the nursery units were, i.e., in the playrooms for children aged 2 to 3 years.
The European standard prescribes 4 heights of tables marked from 0 to 3. When inspecting and analysing the data of the tables, the same conclusion is reached as with the chairs, whereby a height difference should be made in the tables in 4 categories according to the age of the children: from 2 to 3, from 3 to 4, from 4 to 5 and from 5 to leaving for school. From the inspection it was concluded that the lowest table is of a height of 48 cm, which enters the group 2, for children with a height of 1 080 - 1 210 mm. For children with shorter growth than this height, the tables are inadequate. According to the European standard, each height has its own colour, after which the tables should be marked. It can be marked on the lower parts of the legs or on the underside of the worktop.
According to some authors, the height of the worktop of the table can be obtained through the height of the elbow in a sitting position, with the addition of 3 to 5 cm (Bylon, 1962; Troussier at al., 1999). The anthropometric data for this population are very old or there are few in number. In the region, in this area in the last five years there is only one master thesis (Iliev, 2011), which provides some basic data. A big problem is precisely the lack of such anthropometric data.
Another important factor affecting inadequately designed furniture is the misuse of materials. When manufacturing the worktops, materials that are resistant to cleaning agents should be used and have a high coefficient of surface mechanical damage. Type 4 tables found in one of the polygons are made of MDF plates. In this type of tables, surface defects have been noted. The worktops of the tables that are made of plywood boards without exception should

28th International Conference on Wood Science and Technology 2017 IMPLEMENTATION OF WOOD SCIENCE IN WOODWORKING SECTOR
213
be edge-trimmed with abs trim of 3 mm. From the insight it was concluded that this is not the case with all the tables.
Regarding the shape, the tables should be rectangular, semi-circular or quarter circle, with the possibility of joining them together and creating a larger working space when doing a group task (Domljan, 2011). In terms of the utilization of the material from which the worktop is made, bigger saving is made when the shapes are rectangular than circular.
Based on the data obtained from the overall analysis of the existing types of furniture, compared to the applicable standards and the established deviations found in preschools in all three polygons of research, by initiating some proposals for solutions to certain problems, an attempt is made to contribute to the improvement of the process of designing preschool furniture, fully adapted to the needs of children. Contribution to this have also been the conducted conversations with the employed caretakers and teachers in preschool institutions as ones directly involved in the educational process. The suggestions of furniture designers should also be taken into consideration.
Based on the set goal it can be concluded that the existing preschool furniture does not
correspond to the needs of the children according to valid standards. This can be confirmed: 1. The dimensions of the furniture do not correspond to children's anthropometric
measures. There is a lot of inconsistency. Tables are either higher or smaller, there is no more sizes. Inadequately designed furniture affects the psycho-physical development of children. As a result, manifestations such as improper posture, back and neck pain, fatigue, and loss of concentration can be manifested (Schröder, 1997; Knight and Noyes, 1999).
2. The dimensions of tables can be divided into four sizes, for children aged 2 to 3, from 3 to 4, from 4 to 5, and from 5 years old to starting school. Each of the sizes should be marked with a number or colour, as shown in the European standard EN 1729-1. In the groups where children of only one age are staying, the application of the dimensions would be easier than in the groups where the age is mixed.
3. The use of appropriate furniture requires active education of the employees in the kindergartens.
4. The furniture used does not fully satisfy the pedagogical standards either. They should be easily mobile and multi-functional, with an easy option to adapt to space. This mostly applies to cabinet furniture that is bulky and heavy.
5. Proper use of adequate materials during their design. 6. Existing regulations and rulebooks are too general and in some places ambiguous. This
can lead to confusion among manufacturers, investors, teaching staff and others involved. With comprehensive analysis and inclusion of interdisciplinary teams of experts, the rulebooks and standards should be improved, which should be binding during the process of furniture design (Domljan et al., 2015).
7. The procurement of furniture for the needs of preschool institutions is carried out in a procedure regulated by law, through a public procurement. Most often, the basic criterion for procurement is the lowest price, and not the quality of the furniture. In this case, the supplier's free choice is limited and determined.
The solution for all the problems listed above is complex and systematic and requires the involvement of several competent institutions and teams of various professions. When designing furniture for preschool institutions, interdisciplinary teams composed of architects, pedagogues, psychologists, sociologists, doctors, physiatrists, orthopaedists, as well as professionals dealing with research of new materials should be included.

28th International Conference on Wood Science and Technology 2017 IMPLEMENTATION OF WOOD SCIENCE IN WOODWORKING SECTOR
214
REFERENCES
Bylon, M. (1962): Školske zgrade. Građevinska knjiga, Beograd. Bajbutović, Z. (1983): Arhitektura školske zgrade. Svjetlost, OOUR Zavod za udžbenike i nastavna
sredstva, Sarajevo. Domljan, D. (2011): The design of contemporary school furniture as a prerequisite for maintenance of
pupils' health. Doctoral thesis. University of Zagreb Faculty of Forestry, Zagreb Domljan, D., Grbac, I.; Jirouš-Rajković, V.; Vlaović, Z.; Živković, V.; Župčić, I. (2015): Kvaliteta i
tehnički opisi proizvoda od drva, Svezak I. Opremanje zgrada za odgoj i obrazovanje. Sveučilište u Zagrebu, Šumarski fakultet, Zagreb
Iliev, B. (2011): Comparative analysis for the preschool institutions in Municipality of Centar with modern tendencies in designing and articulations of specific interventions in space as a result of the psycho-physical needs by the children. Master thesis. “SsKiril and Metodius, Faculty of Design and Technology of furniture and interior, Skopje
Ivanovič Šekularac, J. (2000): Predškolske ustanove i komfor. Magisterski trud. Zadužbina Andrejevič, Beograd.
Kjuchukov, G. (2004): Design of furniture, doors and windows. Matkom, Sofia. Knight, G., Noyes, J. (1999): Children’s behaviour and the design of school furniture, Ergonomics, Vol
42, No. 5, 747 – 760. Schröder, I. (1997): Sitting posture and physical activity, Coll. Antropol. 21(1997)2, 397- 403, Zagreb. Troussier, B., Tesniere, C., Fauconnier, J., Grisons, J., Juvin, R., Phelip, X., 1999: Comparitive study of
two different kinds of school furniture among children. Ergonomics 42: 516-526. БДС (BDS) 8475 – 88, (1988): Български стандард. Функционални димензии на мебелите за деца
од предучилишна възраст. (Bulgarian state standard) EN 1729-1 (2016): Chairs and tables for educational institutions - Part 1: Functional dimensions. ***, (2009): Rulebook on standards and norms for performing the kindergarten activity. Ministry of
Labor and Social Policy of the Republic of Macedonia (Official Gazette of the Republic of Macedonia 35/2009).

28th International Conference on Wood Science and Technology 2017 IMPLEMENTATION OF WOOD SCIENCE IN WOODWORKING SECTOR
215
Comfort of Cervical Pillow with Polyurethane Coil Springs
Vlaović, Zoran1*; Seleš, Karla; Grbac, Ivica1; Žulj, Ivan1, Domljan, Danijela1 1Department of Furniture and Wood Products, University of Zagreb, Faculty of Forestry, Zagreb, Croatia
*Corresponding author: [email protected]
ABSTRACT
Pillow as a part of the bed system plays a significant role in healthy sleep. The ergonomic and anatomic shape and construction of a pillow, as well as appropriate use of materials, create the main precondition for proper positioning of the head and neck. The requirements upon this product are defined by different sleeping habits, health condition, diseased conditions and other individual characteristics of a sleeper, and they define the shape, construction and anatomic characteristics of the pillows. How much change in the pillow affects the comfort of the user, this (pre)research has shown. It was conducted on an innovative pillow that contains PUR springs whose role is to create a space through which the air can flow more easily and thus remove the accumulated moisture from the pillows. Key words: Comfort, Neck, Pillow, Polyurethane springs, Sweating 1. INTRODUCTION
Pillow as a part of the bed system plays significant role in healthy sleep (Grbac et al., 2006). Sleep, one of the important activities human beings pursue (Borazio and Van Laerhoven, 2012, quoted in Lin and Wu, 2015), occupies one third of time in human beings’ life. Thus the sleep quality indirectly affect our health. The definition of sleep quality on some occasions, “sleep quality” is used to refer to a series of sleep measures, including total sleep time (TST), total wake time, sleep onset latency (SOL), degree of fragmentation, sleep efficiency, and sometimes sleep disruptive events such as spontaneous arousals or apnea (Krystal and Edinger, 2008, quoted in Lin and Wu, 2015).
Pillow is one of the factors which affect our sleep quality, including snoring and waking symptoms. The main function of a pillow is to support the cervical spine in a neutral position to prevent more "end-range" cervical spine posture, which are considered to increase biomechanical stresses on cervical spine structures (Helewa et al., 2007; McDonnell, 1946; Jackson, 1976, quoted in Lin and Wu, 2015).
Cervical pillows come in a variety of heights and curves, with the goal of maintaining proper cervical spine alignment. Recent studies have shown that cervical pillow height is an important factor that affects the perception of pillow comfort (Erfanian et al., 2004; Liu et al., 2011, quoted in Wang et al., 2015). Erfanian et al. (quoted by Wang et al., 2015) showed that a cervical pillow with a uniform height is not appropriate for everyone. Therefore, the "best" cervical pillow height differs among individuals. Nevertheless, few studies have addressed methods for predicting a patient's preferred cervical pillow size. When trying to select a comfortable pillow among several sizes, most consumers base their choice on their physical "size". The authors found no statistically significant correlation between cervical dimensions and pillow height preference, and concluded that cervical measurements are not useful for predicting appropriate cervical pillow height. Therefore, the physical size of an individual may not serve as a good predictor for pillow height preference. Hence, recommendations of optimal pillow height based on physical size are inappropriate.
Neck and shoulder ailments are often encountered among the population; therefore, several researchers believe that an appropriate choice of pillows will be associated with these ailments (Jens, 2003; Bert et al., 2002; Guy, 2002, quoted in Liu et al., 2011). Kawabata and Tokura (1996) studied the thermal characteristic of a pillow on alleviating symptoms. These results suggested that reducing the temperature of the pillow may improve the quality of sleep.

28th International Conference on Wood Science and Technology 2017 IMPLEMENTATION OF WOOD SCIENCE IN WOODWORKING SECTOR
216
Research of Okamoto et al. (2003) also showed that cool pillow design can reduce sweating and whole-body temperature, and indirectly improve the quality of sleep. These findings suggest that thermal characteristic of pillows may be related to the type of materials used. Kushida et al. (1999, 2001) reported that in patients with mild sleep disordered breathing, a cervical pillow helps reduces snoring and improves the quality and efficiency of sleep and the subjective-specific depth of sleep. Thus, these studies showed that the support provided by a pillow is strongly related to its shape. In addition to temperature, support, material, and shape, time factor of exposure to a pillow is another critical factor that affects the acceptance of a pillow. The research of Shields et al. (2006) showed that some patients may initially find cervical pillows uncomfortable. However, patients accept them after an extended use; and they will eventually be acceptable at the end (quoted in Liu et al., 2011).
With regard to a product design point of view, every product should be designed according to a target: a specific group of consumers. Because each target group has unique requirements, it is not realistic to have a single product that can satisfy all groups of consumers. Hence, it is important to identify the pillow design factors that affect a subject's comfort; and it is significant to design a better and properly suitable product (Liu et al., 2011). The fit of pillow-to-human form has not been reported in the literature (Gordon et al., 2009), and was not investigated in present study either. Authors continues that anthropometric studies may thus provide useful information regarding if, and what, anatomical parameters will ensure a comfortable, symptom free union between person, mattress and pillow.
Of all bed system components, a pillow is one that causes most concern whether night sleep would be deep and restful or it will cause painful neck (Grbac et al., 2005). Circadian rhythms, that is one of several biological rhythms found in humans, are produced jointly by the action of various structures of the nervous system and are influenced by various environmental factors, and also by sleep quality (Gracovetsky, 1987; Danda et al., 2005, quoted in Desouzart et al., 2015). The common sense warn that the quality of our day depends on the quality of our previous night. Among the main factors contributing to a better sleep quality is the postural behaviour during the sleep period. However, little or nothing is known about the actual influence of these behaviours on people sleep quality. Human health may have several problems that occur when sleep disturbances are verified, causing loss in the sleep quality, autonomic dysfunction and decreased professional or academic performance (Danda et al., 2005; Gracovetsky, 1987; Desouzart et al., 2014, quoted in Desouzart et al., 2015). This disruption of the normal circadian rhythm can result in fatigue, poor sleep quality, and degraded performance, gastrointestinal upset, and negative mood.
The aim of this study was to investigate the relationship between the pillow design and subjective comfort level in subjects during the 10 nights experiment in real conditions of sleep.
2. MATERIALS AND METHODS The study of the comfort of the pillow made of visco-foam and polyurethane (PUR) springs
was carried out during 10-night use in real sleeping conditions in the participant's sleeping rooms (Seleš, 2015).
Subjects provided their personal information before the experiment. That previous questionnaire included information pertaining to height, sex, age, height, weight, sleep posture preferences (lying on back or on a side), and existing spine problems.
Ten male (codes 1M...10M) and 12 female (codes 1F...12F) subjects, aged 21 to 42 years, height of 153 to 188 cm, mass of 44 to 113 kg and BMI of 17 to 32 kg/m2 (Table 1) participated in the study. Subjects reported that 16 of them had no spinal problems, four had pain in the lumbar region, one had in the thoracic and one had in the cervical spine.

28th International Conference on Wood Science and Technology 2017 IMPLEMENTATION OF WOOD SCIENCE IN WOODWORKING SECTOR
217
Table 1. Anthropometric characteristics of subjects
Sex M/F (n) 10/12 Age (year) 26,09 ± 5,61 Body height (cm) 172,32 ± 10,54 Body mass (kg) 66,95 ± 16,86 BMI (kg/m2) 22,25 ± 3,51 M = male, F = female, BMI = body mass index Data are presented as number or mean ± standard deviation
The sample-pillow is the patented product of the Croatian manufacturer and has been on
the market for several years (Figure 1). According to producer, pillow is designed to optimally support and adjust the cervical spine to help prevent various illnesses or reduce existing ones.
Figure 1. Cross-section of sample-pillow
(Trade name: Pospanko, producer: Bernarda d.o.o., Croatia) The main feature of the pillow are built-in polyurethane coil springs that simulates the air
pumps along the entire cushion: under head pressure, the "spiral" springs push out moist air and drag in fresh air, thereby achieving faster moisture reduction in the cushion.
The pillow is made of anatomically shaped visco-foam (50 kg/m3; 0.8 to 1.9 kPa ISO 2439-B, 40%). Dimensions of the sample were (l×w×h: 50×40×10/13) cm. The cover is made of Tencell knitted polyester wadding (56 % lyocell, 44 % polyester).
Brand new pillows (14 pieces) were using in the study, and each participant slept on a sample-pillow for ten nights in a row. According to Gordon et al. (2009), seven days appears to be a suitable period for a pillow trial as all dropouts occurred before the fifth trial day.
After five and after 10 nights, the subjects filled out a survey about sleep quality and comfort of sleeping on the pillow. Certain questions in both surveys were identical in order to compare the responses, or to determine which comfort factor changed after the respondent got used to the sample-pillow and whether there was a difference in comfort after five to ten nights.
3. RESULTS AND DISCUSSION Responding to the previous questionnaire, all subjects were cite that, regardless
experiment, use pillow during sleep. Fourteen subjects reported that their neck was not sweating during the night before the experiment, at four of them sweating is occasionally, and two subjects experience sweating during the nights (Figure 2).
About the habit of the most common position of sleep, the respondents prefer to sleep on the side (15), five on prone position and two on the back.

28th International Conference on Wood Science and Technology 2017 IMPLEMENTATION OF WOOD SCIENCE IN WOODWORKING SECTOR
218
Figure 2. Answers about ordinary neck sweating over night At the beginning of the experiment (after five nights of sleep on a sample-pillow) most of
participants needs just 20 minutes to fall asleep, six of them reported time up to 40 minutes, and only one need more than 40 minutes to fall asleep (Figure 3). After 10th night of experiment majority of subjects need the same time to fall asleep, but for subjects 5F and 12F that time increasing for 20 minutes. On the other hand, subject 1F experienced 20 minutes decreasing of time.
Figure 3. Time to fall asleep during and after experiment When asked about sleep quality, half of respondents answered that they did not wake up
during the night (Figure 4), while the other half did so once or twice. One respondent replied that, in the first five nights of experiment, he woke up more than two times per night, while after ten nights he said he woke up less, i.e. up to two times during the night. It can be said that the respondent needed five nights to get used to new pillow.
Subject 5M responded that he waking up one to two times during the first five nights of experiment, while after ten nights of sleeping on the sample-pillow, he waking up more than two times per night. Hence, the subject probably does not prefer this form of cushion.
Subject 11F said that she woke up one to two times in the first five nights, and after ten nights, she did not wake up at nights. After ten nights sleeping on a sample-pillow, two subjects answered that their number of waking ups decreased in comparison to the first five nights, while only one subject replied that in the second five nights, he woke up more than before.
The other 11 subjects answered that number of waking ups has not changed.

28th International Conference on Wood Science and Technology 2017 IMPLEMENTATION OF WOOD SCIENCE IN WOODWORKING SECTOR
219
There were several answers to the question about the cause of waking during the night. Thus, 11 subjects answered that they did not waking during the night, and the same number claim that the cause of waking are pain, noise, etc. Beside, five subjects said after the first five nights that the cause of the wake ups was a sample-pillow (Seleš, 2015).
Figure 4. Frequency of waking up during each night of experiment After all ten nights, one subject less replied that the pain was not caused by the pillow.
During the first five nights, five subjects experienced a pain caused by a pillow, while only single one experienced the pain at end of experiment (Figure 5). In addition, 14 subjects claim that sample-pillow is the most comfortable while sleeping on side, and seven respond it is on the back. No responses were that pillow is comfortable while lying prone.
Figure 5. Answers about pain caused by sample-pillow
According to the survey results, 12 subjects answered that the sample-pillow is of ideal
hardness, while 11 persons think that the pillow is too hard. No one replied that sample-pillow was too soft (Seleš, 2015).
Subjects who reported having pain in some part of the spine (6 persons) later stated that this pain manifests mostly in the evening and in the morning (Figure 6). Responses have shown that such pain is not wake-up-reason during the night (in 82 % of cases) and in only five case feel that this pain is caused by a sample-pillow (23 %).

28th International Conference on Wood Science and Technology 2017 IMPLEMENTATION OF WOOD SCIENCE IN WOODWORKING SECTOR
220
Figure 6. Answers when spinal pain occurs Sixteen subjects argue that they did not pull-out the pillow overnight, while six people
claim to rid-out of it. After ten nights on the sample-pillow, 17 respondents answered that they did not pull-out the pillow during the night, while five of them were (Figure 7).
Figure 7. Responses about pillow pull-out during sleep If we observe appearance of sweating after 10 nights and after five nights of experiment
(Figure 8) one can notice that 20 subjects (91 %) did not reported sweating at all. In comparison with data before trial (Figure 2) that is significant improvement.
Figure 8. User experience of neck sweating during experiment

28th International Conference on Wood Science and Technology 2017 IMPLEMENTATION OF WOOD SCIENCE IN WOODWORKING SECTOR
221
According to results shown on Figure 8, one participant (5M) feel the same rate of sweating after 5th and 10th night but in comparison with data prior to experiment the rate is higher, and one participant (10M) feel sweating more than usual after 10 nights, but also he experienced higher rate of sweating overall. 4. CONCLUSION
This study is characterized like pre-research because it is necessary to carry out similar
research based on a higher number of participants, longer time of use and with more detailed every day survey.
According to the results of pre-research it can be concluded that the pillow fulfils its function of comfort and is designed to causes almost no sweating during use. There is a possibility of pain in the spine during the first few nights, but after the body becomes accustomed to change, that pain disappears and the users in the morning are more rested.
In addition to temperature, support, material, and shape, the time factor of exposure to a pillow is another critical factor that affects the acceptance of a pillow (Liu et al., 2011). As quoted in Lavin et al. (1997), if neck pain is exacerbated during sleep by poor head and neck support, then it is not surprising that individuals frequently awaken experiencing increased morning headaches and neck pain. Consequently, adequate head and neck support during sleep might have a beneficial carryover effect on daytime pain relief.
According to survey results (Seleš, 2015), most participants answered that the visco-foam is considered ideal material for the pillow. Likewise, its shape ensures proper neck support.
The opinions about the hardness of the sample-pillow are divided. Half of the subjects believe that the pillow is too hard, and the other half believe that the pillow is ideal. Everyone agrees that the pillow is not (too) soft.
Furthermore, it was concluded that the sample-pillow is not suitable for prone sleeping, mainly because it is too high, and people who prefer prone position would not be able to use or should change their habits.
Although after ten night, only one subject less (5 vs. 6) responded by removing the pillow during the night, and even though it can be concluded that the pillow is acceptable to the subject's population (because they probable adopt to pillow during the trial), is likely to be uncomfortable or too thick pillow, neck pain, etc. It is therefore important to carry out a wider study on different thicknesses of the pillow so that these claims can be proven.
Erfanian et al. (1998) assessed whether external measurements of the subject’s neck are predictive of the preferred thickness of cervical pillow, given a choice of four different contour thicknesses. (…) After being given about 10 minutes to try the pillow out, subjects were asked to choose the most comfortable of the four thicknesses. This study found no statistically or clinically significant correlation between neck dimensions and pillow size preference. The authors suggested that pending further investigation, it may be prudent to continue recommending double-contoured or other variably-sized pillows.
Acknowledgements: Authors wish to thank company "Bernarda" d.o.o. for sample-pillows. Disclaimer: Authors did not have any conflict of interest during or after research.
REFERENCES
Desouzart, G.; Filgueiras, E.; Matos, R. (2015): Relationship between postural reeducation technique during sleep and relaxation technique in sleep quality. Procedia Manufacturing 3: pp. 6093-6100.

28th International Conference on Wood Science and Technology 2017 IMPLEMENTATION OF WOOD SCIENCE IN WOODWORKING SECTOR
222
Erfanian, P.; Hagino, C.; Guerriero, R.C. (1998): A preliminary study assessing adverse effects of a semi-customized cervical pillow on asymptomatic adults. J Can Chiropr Assoc, 42 (3): pp. 156–162.
Gordon, S.J.; Grimmer-Somers, K.; Trott, P. (2009): Pillow use: The behaviour of cervical pain, sleep quality and pillow comfort in side sleepers. Manual Therapy, 14 (6): pp. 671–678.
Grbac, I. (2006): Bed and health. University of Zagreb, Faculty of Forestry, Academy of Forestry Sciences, Zagreb.
Grbac, I.; Markovac, Ž.; Domljan, D. (2005): Ergonomic Pillows for Healthy Sleep. Sigurnost 47 (2): pp. 153-160.
Lavin, R.A.; Pappagallo, M.; Kuhlemeier, K. V. (1997): Cervical pain: A comparison of three pillows. Archives of Physical Medicine and Rehabilitation, 78 193–200.
Lin, X.-Y.; Wu, F.-G. (2015): Pillow shape design to enhance the sleep quality of middle-aged groups. Procedia Manufacturing 3: pp. 4429 – 4435.
Liu, S.-F.; Lee, Y.-L.; Liang, J.-C. (2011): Shape design of an optimal comfortable pillow based on the analytic hierarchy process method. Journal of chiropractic medicine, 10 (4): pp. 229–39.
Seleš, K., 2015: Research of comfort of a pillow with polyurethane coil springs. Diploma thesis (in Croatian). University of Zagreb, Faculty of Forestry, Zagreb.
Wang, J.-C.; Chan, R.-C.; Wu, H.-L.; Lai, C.-J. (2015): Effect of pillow size preference on extensor digitorum communis muscle strength and electromyographic activity during maximal contraction in healthy individuals: A pilot study. Journal of the Chinese Medical Association 78: pp. 182-187.

28th International Conference on Wood Science and Technology 2017 IMPLEMENTATION OF WOOD SCIENCE IN WOODWORKING SECTOR
223
Furniture Design for the Entrance Hall
Sobotková, Alena1*, Šimek Milan1, Domljan, Danijela2 1 Department of Furniture, Furniture Design and Habitation, Faculty of Forestry and Wood Technology,
Mendel University in Brno, Brno, Czech Republic 2 Department od Furniture and Wood Products, Faculty of Forestry, University of Zagreb, Zagreb, Croatia
*Corresponding author: [email protected]
ABSTRACT
The article is dealing with the problematics of entrance halls and furniture used in this space. Described is the process of designing new products - bench with hanger, table and mirror, which can be hanged on the bench or it can stand separately in a room, as well as the manufacturing process and working with wood and metal. The aim of the concept is to bring this product to the market as a competitive product, which will be sold in design showroom. Target group for the product are mostly young people, who like simple but practical design. It is not targeted for mass production, but more for the manufacture of quality collections in few pieces. Design of those products should change the view about furniture for entrance halls, which is usually very similar. It supposed to serve as full-fledged “storage” space, but also it can work as a “statue” or artistic piece in the interior. Key words: Bench, Collection, Entrance hall, Hanger, Mirror, Storage space 1. INTRODUCTION
Every time we meet new people, we are making first opinion about them, according their clothes, shoes and their appearance. It is the same as the interior of the entrance hall, because it is the first place we see, when we enter a house and it gives us the first opinion about the inhabitants of the house as well. We can imagine how the rest of the house looks like from the furniture used and its interior design. It gives us an idea about how people live in the whole house, what kind of style they like and sometimes even what are their hobbies. That is why this place should not be the last one to think about, when planning the house. There should be placed furniture that is equally as good as in the rest of the house. Usually there are a lot of doors and it is quite difficult to make the room look nice, but it should have a representative character too.
The entrance hall is a place where people mostly store their clothes. It is estimated, that most of the people wear only 20 % of their clothes. It means, that most of the storage space is overloaded with clothes, which we do not even wear (Conran, 2006).
The entrance hall should be well designed, because it is a place where the family members cross many times during the day and they need to take off their jackets and shoes or put their keys away. In some countries, especially in the South of Europe, people are used to not taking off their shoes. It is probably because of the weather conditions. In the Czech Republic, and especially during the winter we must take off our wet shoes, winter jacket, scarf or a cap. This proves the importance of having a hanger, shelves, some storage space for shoes, which we usually wear and so on.
Furniture for the entrance hall is very important, but the people don’t think about this so much. Usually there are used cabinets with a few hangers and a bench, with quite similar design. The author tried to design a new product for this area, which will change the traditional appearance of the entrance hall.
The goal of this work is to describe the process of designing and manufacturing collection of furniture, which will be used at the entrance hall or elsewhere in the house. It continues with the work made during the Exchange studies in Finland and was continued with the topic of the entrance halls and its furniture

28th International Conference on Wood Science and Technology 2017 IMPLEMENTATION OF WOOD SCIENCE IN WOODWORKING SECTOR
224
2. METHODOLOGY
Methodology of this work was affected by the design methodology used during exchange studies in Finland, the country with traditional and timeless furniture design. At first, there was designed and manufactured laptop table, which can also serve as a breakfast table. Design of this product was the inspiration for another product - entrance halls and the bench connected with hanger. The idea was to merge two functions needed at the entrance halls, as the main concept was born after analysing phase. It started with creation of the battenboard from the birch wood. When the battenboard was ready, the construction from tubular steel was created. During the manufacturing process, there were several problems, which had to be solved. First, we made the frame from only two rectangular profiles on the shorter side. Unfortunately, this frame was not strong enough and the whole product was moving from side to side. To avoid constructional problems, it was decided to weld another two rectangular profiles to the longer sides as well. After that the product had finally a good stability and it is possible to sit down normally without any movement of the prototype.
As the halls are generic spaces, it is needed to design another functional piece of furniture, such as supplements for the bench, a mirror. It can be hanged at the bench or it can stand separately anywhere in the room. It is also possible to store jewelleries in the stand for the mirror. The frame is made from the birch battenboard as well with a mirror and leather eyelet for hanging, which makes nice detail to the product. The Bow mirror makes the whole collection even more useful, because the user has all the things on a hand. The jacket from the hanger can be just taken in a minute, the shoes put on and the whole appearance can be easily checked in the mirror. 2.1. Entrance hall
The entrance hall creates the first idea and opinion about the people who live in the house. Family members are walking through this area many times during the day. At the entrance hall, we are carrying out several actions in the same sequences. Firstly, we are taking off our shoes, coats and other accessories (scarf, gloves,). We are putting aside our keys, phone, purse or shopping bags. From those functions derives fitting things, such as hangers, shelves, bench or chair, shoe holder and mirror (Černíková, 2010).
It has a function of semi – public space, because it is dividing privacy of the house from public spaces. Another function is communication, which means, that it is accessing other rooms in the house. Storage space and storing function is also very important, because usually, the clothes is stored there. According the Czech standard ČSN 73 4301 Residential Buildings, there must be the entrance space (hall) at family houses, which is capturing dirt from the outside and it is keeping the house from losing its warmth (ČSN 73 4301, 2004). Because of moving of furniture, the size of the entrance hall should not be less than 1200 x1200 mm (Poštulková, 2008). Per ČSN 73 4301, disposition of the house must allow objects to be moved with dimensions 1800 x 600 x 1800 mm to all the rooms. The entrance door must have minimal width 900 mm. The space, where the room is connecting to other rooms, the width cannot be less than 800 mm. Entrance door should be opening to the inside of the house. The interior of the entrance hall should not be the last to think about. It has a function of communication, which means that we are entering other rooms in the house from there, then there is storing function, because we need to take off our jacket when we arrive to the house and take off our shoes. The functionality and the aim of the entrance space can be different in other countries, because not every nationality and culture are used to taking off their shoes when they arrive home.
Before the entrance hall is even made, the proposal of the interior must be done. First, it is important to choose the right size of the space. It should not be too big and fancy, but also it should not be too straitened. The interior should be practical, and it should correspond with the rest of the house interior. While designing the product it is necessary to think about the

28th International Conference on Wood Science and Technology 2017 IMPLEMENTATION OF WOOD SCIENCE IN WOODWORKING SECTOR
225
dimensions of furniture. The size of the bench was derived from the dimensions of a chair (Table 1).
Table 1. Size of domestic chair (***, 2017)
Size (CM) (XS) S M L (XL) Height of the person +/- 5 cm 155 cm 165 cm 175 cm 185
cm 195 cm
A 32,0 40,0 42,0 45,0 47,0 B 40,0 40,0 45,0 45,0 50,0 C1 19,0 20,0 21,0 22,0 23,0 C2 18,0 19,0 20,0 21,0 22,0 Width of the seating 35,0 40,0 40,0 45,0 45,0 Distance BETWEEN REST 55,0 60,0 60,0 65,0 70,0 Angle of the seat 0° – 3° Angle of the back rest 95° Angle of the from edge of the seat 10°- 20°
2.1.1. Function of the entrance hall
The entrance hall has several functions. It is the first look of the house, but it can also say something about the people, who live in the house. It is also a filter between outside space and the living area in the house. The size of the entrance hall is proportional with the size of the whole house. It is not considered as a living room, so it does not have to have day light with windows and ventilation (Hála, 2009).
At the entrance hall, we leave our clothes, such as coats, jackets, scarfs and other accessories. We also take off our shoes in this space and change outdoor shoes with the house “slippers”. It also serves as storage area in the house very often. That is why there are usually hangers, hanging wall, storage space for shoes, shelves for the keys or smartphones, which we have almost all the time in our hands these days. There also must be a mirror, to check our appearance (Černíková, 2010).
From the practical view, it is suggested to have three cleaning zones. This is not usually possible at the family houses, so there should be quality mat for cleaning the shoes. The next important thing is the floor and walls. People should not save money on the quality of flooring they use, when there is an option for pavement or vinyl floor. Pavement flooring is the best especially in the case when there are animals living in the house, because it is easy to clean it. For the walls, it is good to use resistible and washable paint (Černíková, 2010).
2.1. The analyse of the entrance hall’s furniture
Furniture of the entrance hall is edited by ČSN 91 0000 NÁBYTEK-NÁZVOSLOVÍ in Czech Republic. There is a closet with shoe holders in use in most of the Czech houses.
Storing furniture:
According the size:
• Big storage space – wardrobe
• Small storage space – shelves, boxes, …
According the stored objects:
• Closet, shoe holder, … (Fišerová, 2006).
Shoe holder - Most often used piece of furniture. Not all the shoes of the whole family must be at one place. There can be some smaller shelf for worn shoes and then, another storage space

28th International Conference on Wood Science and Technology 2017 IMPLEMENTATION OF WOOD SCIENCE IN WOODWORKING SECTOR
226
for seasonal shoes. If it is a shoe holder or a shelf, which is closed, there must be some space, so it can breathe.
Seating - Older people, kids but probably almost anyone of us, prefer that there is some seating, which helps us to put on our shoes easily. There can be a smaller stool, poufs or a bench. The seating is very often wired with the shoe holder as well. It is possible to put on the top of the holder some upholstered mat, pillows or plaid as a decoration and make the seating more comfortable.
Closable storage space - Because entrance halls are usually quite small, it is better if all the jackets and shoes are not on a visible hanger. That is why it is better to have a closet, which is possible to close. For a jacket, which we are wearing right now it is enough to have some hangers, but it is always good to have an option of hiding everything in the closet, if someone is coming to visit our house for example.
Small storage space – Another need is to put somewhere our keys, mobile phone or post. It can be a small shelf, drawer or a console table.
Mirror – A mirror is very important item for every interior in the entrance halls. There should be a big mirror, where we can see our whole body and check our appearance, before we leave the house. Another good property is, that it is making the room look bigger. The mirror should not be right in front of the door, because it does not look very pleasant. It is better to place it next to the door either on the left or right side, depending on which side the door is opening. It is important to have enough distance from the mirror, relative to the lighting in the entrance hall.
Also, there can be a separate changing room, which serves also for storing seasonal things, like sleeping bags, in-line skates, ice skates, snowboarding shoes, skiing shoes and so on. It is also good to have stand for wet umbrellas (Hála, 2009). 3. RESULTS AND CONCLUSION
The result of this work is design of new collection of furniture, which is planned to be used at the entrance hall, but it can serve anywhere else in the house as well. The Bow collection enables the user to have their favourites garments on hand always. Bow is a bench with bow for hanging clothes, bags or whatever else we are using in the moment. The concept of the products was to create a new kind of furniture for people who like to hang their garments and accessories open in a room rather than concealed in a closet or wardrobe. Also, it is motivated by hygienic reasons — to air the garments out after wearing them the whole day. It is a multifunctional seating for the entrance hall, which is suitable also for small halls, for single living or a starting house for young couples. Even though it was designed for the entrance hall, it can also serve as a valet stand in a bedroom. It is connecting the function for the hanging jackets, bags and other items, sitting while taking off shoes and as a storage space for keys or smartphone, before we leave the house. Those are the three things we usually do before we leave the house or when we arrive home. The good thing is, that it connects all of this in one piece, so we do not have to go from one place to another. If the piece is used in the bedroom, it can serve as the valet stand for the clothes we are wearing right now, hanging bags, but also as a table or a stair, when we need to reach some high to reach shelves. The Bow table and the mirror are giving to the Bow bench another option of usage – to check our appearance before we leave the house or use the Bow table as a stool for our legs too.
The great use of the products was demonstrated at several exhibitions. The first one was at the University of Applied Sciences in Kouvola (Figure 1). The exhibition was called “Eteinen” which means entrance hall in Finnish. The manager from the company Hakola came to the

28th International Conference on Wood Science and Technology 2017 IMPLEMENTATION OF WOOD SCIENCE IN WOODWORKING SECTOR
227
university to see all the products and presentations of students work, as well as the other teachers from the university.
Figure 1: Eteinen, KYAMK, Kouvola (Photo: Sobotková, 2017)
Because of the great success of the exhibition, all the products were sent to Habitare furniture fair, which was held in September 2016 (Figure 2). It was exhibited in the area for student’s work together with informative “postcards” for each product. In September 2016, there was posted an article in the online magazine Wallpaper about Habitare fair and the bench was mentioned in the article.
Figure 2. Habitare furniture fair, Helsinki (Photo: Riku Laine, 2017) The product participated in the competition „The price of professor Jindřich Halabala”,
which was held in November 2016 in Brno. Bow accomplished to get to the exhibition at Moravian gallery in Brno with the best products chosen. The author signed up Bow also to the Grand Prix Mobitex 2017, which was held during Mobitex furniture fair in Brno (Figure 3). In this exhibition, there was exhibited the whole collection already together with the Bow mirror, which was manufactured by the company Chatrný nábytek.
The last exhibition, where was the whole collection exhibited was during the beginning of October at Moravian gallery in Brno once again, where was the exhibition of student’s works from Mendel University in Brno.

28th International Conference on Wood Science and Technology 2017 IMPLEMENTATION OF WOOD SCIENCE IN WOODWORKING SECTOR
228
Figure 3. Grand Prix Mobitex 2017, Brno (Photo: Sobotková, 2017)
From the designers’ point of view the first phase of the design process is the most important
one to find out the needs of users. The analyse of entrance halls and users’ needs and behaviour in halls gives the important guidelines for new design of furniture. The result is multifunctional and elegant piece of furniture.
It can be concluded that this kind of furniture correspond with the new way of living of young people – they are traveling, moving from one place to another and they don’t need so many things. Especially for students it is great to have furniture, which is easy to disassemble and move it together with them. The whole collection is very useful as the whole set but it can be used also separately. Bench can serve as a silent servant in a bedroom, mirror can stand on a shelf and table can be used as a serving table for a breakfast or a table for laptop.
The whole project was influenced by abroad experiences of the author and also by the needs of student, who was moving from one place to another many time.
REFERENCES Conran, T. (2006): Úložné prostory a jejich uspořádání. V Praze: Slovart, 224 s. ISBN 80-720-9805-5. Černíková, H. (2010): Atraktivní bydlení. V Brně: Computer Press, a.s., 152 s. ISBN 978-80-251-2953-
1. ČSN 73 4301 Obytné budovy. ČSN 91 0100. Nábytek – Požadavky na bezpečnost. ČSN EN 1728(91 0235) Nábytek bytový – sedací nábytek – Zkušební metody pro stanovení pevnosti a
trvanlivosti. ČSN EN 12520 Nábytek – Pevnost, trvanlivost a bezpečnost – Požadavky pro domácí sedací nábytek Hála, Boris. Interiér: tvorba obytného prostoru. Praha: Grada, 2009. ISBN 978-80-247-3216-9. Nábytkářský informační systém. Rozměrové požadavky [online]. [cit. 2013-09-24]. Dostupné z:
http://n-i-s.cz/cz/ulozny/page/278 Poštulková, Ľ. Teplanová, E. (2008): Typológia : zariaďovacích prvkov verejného a pracovného
interiéru. Zvolen : Technická univerzita, 2008. 138 s. ISBN 978-802-2819-503. ***, 2017: www.n-i-s.cz

28th International Conference on Wood Science and Technology 2017 IMPLEMENTATION OF WOOD SCIENCE IN WOODWORKING SECTOR
229
Product Line Safari
Szökeová, Sarah*; Kozák, Miroslav; Šimek, Milan Department of Furniture, Design and Habitation, Mendel University in Brno, Czech Republic
*Corresponding author: [email protected]
ABSTRACT
The goal of our article is present new product line named Safari. This product line consists of six furniture products – the playhouse, chair, toy, light, blackboard and coat hook. All of the products are designed for children into public spaces primarily. The product line is inspired by parks of Sub-Saharan Africa – Safari. The design is focused on ergonomics, quality, safe materials, functionality and also pleasant appearance. The main objective was to make more pleasant time in public waiting areas. The first product of this line was a playhouse. It is made of CLT (cross laminated timber) panel. On two sides of this product is milled an animal, on another two sides is milled a baobab which is the connecting element of all variants of the playhouses. The chair is made of solid wood and plywood board. The user can move it due to rope resembling a tail. The toy works on the principle of theatrical backdrops – the child can build his own safari thanks to the milled grooves where an animal-shaped cut-out can be insert. The light is used to induce a pleasant atmosphere. The blackboard and the coat hook are made from residual material from the playhouses production. All of the products are surface-treated with safe materials. Key words: Children, Design, Furniture, Public space, Safari 1. INTRODUCTION
Children are future of each society and it is necessary to give them quality and stimulating environment from an early age. There are a lot of products for children in the market today. Unfortunately, the products are very similar. Most of these products are made from plastic materials in very intense colours.
Not only functioning and safety but also design is necessary in creating new products. The appearance of the product is also important to form a child´s personality.
These were the main reasons to create new product line – to show children that wood furniture can be enjoyable and modern and it is possible to create whole product line not only one product.
2. METHODOLOGY
The whole project is divided into two parts – theoretical and practical part. First part is theoretical – there is a description about potential users (children), requirements
and division of indoor playgrounds and related research. Following is a research of the products offered on the market and the requirements for individual products. Next section is about safety, ergonomics, materials and surface treatments for children´s products. In conclusion, this part consists of basic knowledge about design management.
The second part of this project is practical. There is the description of the formation of task and the main design of playhouses.
The 3D visualizations were made in Autodesk 3DS Max, the technical drawings were made in Autodesk AutoCAD 2016.

28th International Conference on Wood Science and Technology 2017 IMPLEMENTATION OF WOOD SCIENCE IN WOODWORKING SECTOR
230
3. RESEARCH OF INDOOR PLAYGROUNDS IN PUBLIC SPACES
Nowadays, we have a lot of public spaces. Banks, hospitals, schools, offices, shops, shopping centres, airports, train stations, restaurants and many others should have a place only for children because children are in each of these public spaces. Children usually have specific requirements for using these spaces. It is necessary to create appropriate environment. This requirement is solved by separate larger or smaller space of the public interior. We can divide these indoor playgrounds into two types – with presence of parents and without.
The indoor playgrounds do not have a long history. The playgrounds were created when people had the reason to spend time in public spaces. The first interiors where we can talk about interior playgrounds are hospitals, primarily hospitals for children. Nowadays, the most popular indoor playgrounds are in shopping centres where the investors want people to stay as long as possible. That is the reason why they invest into playgrounds where the parent can leave the child for a certain time and in this time the parent can spend money in the shopping centre. Next example is transportation. The airports are bigger and areas for children are passengers too.
3.1. The indoor playgrounds with presence of parents
This type of indoor playgrounds is based on looking after the child by parents or adult person. It is a playground where the sole responsibility lies on the supervisors. Usually, it is a separated place in the interior of the public space by impact material or by boundaries. There are toys, tables and chairs, sometimes also playhouses – depends on the largeness of the space. (Services in IC trains RegioJet, 2016)
3.2. The indoor playgrounds without presence of parents
In this type of indoor playgrounds is always present a professional staff who is looking after a child. The parent can leave child there. This type of indoor playground is most common in shopping centres. These indoor playgrounds are usually larger and child can utilize various activities.
4. RESEARCH OF PRODUCTS 4.1 The playhouse
The playhouses are used for children entertainment. There are many products on the market, but usually products are made of plastic materials. Some companies are focusing on production playhouses made of organic or agglomerated materials. Notable example can be company named Smartyplayhouse founded by David Lamolla Kristians (Ifitshipitshere, 2017). They use plywood and MDF (Medium Densify Fibreboard) boards most often. (One of the playhouse is in the Pic. 1)
Figure 1. Kyoto Indoor Playhouse (SmartPlayhouse, 2017)

28th International Conference on Wood Science and Technology 2017 IMPLEMENTATION OF WOOD SCIENCE IN WOODWORKING SECTOR
231
4.2. The sitting product
Sitting products for children are everywhere – the market is fully saturated. We can talk about chairs, tabourets or pillows for sitting. There are differences – decisive factors are used materials, inspirations, age of child and also type of usage.
In 2010, Elad Ozeri, Israeli designer, designed a series of chairs for children for animal motives (Pic. 2). The chair is made of acryl (Animal chairs by Elad Ozeri, Designboom, 2010).
Picture 2. The series of chairs named Zelig created by Elad Ozeri (Designboom, 2017)
4.3. The lamp
The lamps for children must be safe – the specific regulations are in ČSN EN 60598 (ČSN EN 60598 ‐ Lamps: General requirements and tests, 2009). This ensures a number of regulations and standards. We can divide two types of lamps for children – mood lighting and direct lighting.
The example in this chapter are series of lamp by Gones company (Gones, 2017). The lamps are made of plywood and they are used in interior as a mood lighting. The inspiration were animals (Pic. 3)
Figure 3. The series of lamps created by Fones company (Gones, 2017)
4.4. The coat hook and the board
Hooks only for children are not so common. Usually, we use normal coat hooks for adult and children. Good example can be coat hook Nature by Robert Bronwasser (Cascando, 2017). It is designed for both public and private interiors and it is inspired by trees. The coat stand made of MDF board. (Pic. 4)
Figure 4. The coat hook Nature by Robert Bronwasser (Cascando, 2017) and The combined self-sufficient board (Internet Mall, a. s., 2017)

28th International Conference on Wood Science and Technology 2017 IMPLEMENTATION OF WOOD SCIENCE IN WOODWORKING SECTOR
232
The board can be black – using chalks or white – using fixes. The board must be absolutely flat. This element is usually self-sufficient. The market offers amount of these boards, however, all are quite similar. Common is also the type of chalkboard combination on one side and the whiteboards on the other side (Pic. 4). 4.5. The toy
The market for wooden toys is very diverse. Toys differ primarily in function. You can buy kits, jigsaw puzzles, toys that move in some way, social games and toys on which the child can paint or draw.
An example of beautiful and modern toy is Koski designed by studio deForm (Pic. 5). Koski is a social game for children. This is the fact that the kids connect wooden prisms. They create a virtual game which can be seen in the tablet. It is therefore about connecting the virtual game to the real world. (KOSKI a mixed reality building block game, 2017)
Figure 5. The social game Koski (deForm, 2017)
5. PRODUCTION
The playhouse is made of CLT panel. This panel was machined using a CNC machine. The construction elements were applied manually. Four cutouts are left in this production – twice the hippo and twice the baobab shape. This material was used for production of the blackboard and the coat hook. Whole the production of these three elements was provided by INET company.
The lamp and the toy are made of birch plywood and also using CNC machine. The lamp has opaque polymethyl methacrylate boards behind the cutouts – this material is used for lamps and his properties are described in Materiology by Kula Daniel (2012). This production was provided by František Voráč – LIFE company. The sitting element is made of massive wood in combination with plywood. The basic shape was achieved on the turning device. The production was provided by Milan Mátl.

28th International Conference on Wood Science and Technology 2017 IMPLEMENTATION OF WOOD SCIENCE IN WOODWORKING SECTOR
233
6. RESULTS
6.1 The playhouse
The project Safari originated in 2015. Originally, it was project by Stora Enso company which wanted use rest of material of their production. The company also wanted to show healthy living for children (Storaenso: Products and services, 2017).
The playhouse is inspired by African animals. There are three variants in visualisations – the hippo, the elephant and the lion. There are baobabs, on two sides of the playhouse, on another sides, there are animals. The baobab sides are linking elements – when two playhouses are side by side the child can go through all of playhouses. Due to the original assignment the two baobab sides and upper part are covered by a transparent coating, the rest two sides are covered by a pigment coating – acrylic laquer. All used paints are health-conscious.
Figure 6. The visualisation of playhouse variants (picture by author, 2017)
The playhouse is constructed by five CLT boards into a shape of cube. One side has
measure 1,230 mm. Dimensioning has been based on ergonomics of children. Holes designed to crawl (hippo and baobab) are sized according to standards of EN 71-1. The height of the holes is approximately 1 000 mm. The width of the hippo hole is in the middle part 500 mm and the width of the baobab hole in the most problematic part of 220 mm. The edges of the hatchways are rounded by radius 5 mm. All other edges are rounded by a radius 3 mm. All of these measures are compliant with the ČSN EN 71 – 1: Safety of toys (2015).
All boards are interconnected by an eccentric hardware (by Blum) forging in combination with non-glued beech dowels. This is because of the dismantling of the house behind transport and storage. Stability is ensured by four adjustable feet that can compensate for any unevenness of the floor. These playhouses are designed for children aged from 3 to 8 years.
Figure 7. The prototyp of playhouse (picture by author, 2017)

28th International Conference on Wood Science and Technology 2017 IMPLEMENTATION OF WOOD SCIENCE IN WOODWORKING SECTOR
234
6.2. The sitting product
Designed chair reminds animal. The child can sit on it and also move it using a rope to remind the tail of the animal. Chair legs show real legs of the animal thanks to the material removed. The whole stools are in the same colours as playhouse variants up to the seating area and the material taken on the legs where it is only transparent surface finish. The reason is to see materials – solid wood and plywood. Under the seat is slightly bend. This element should represent the animal´s abdomen. Legs are not perpendicular, especially because of stackability – two chairs can be locked in. All of used measures are compliant with the ČSN EN 16121: Furniture. Wood sitting furniture for children. Basic measures. (1991)
6.3. The lamp
The lighters have cutouts in the shape of an animal or baobab on all sides. Behind them the cutouts are fitted with acrylic glass plates. This acrylate is only translucent to the user does not see the light source directly and the light does not shine. The lamp sides are connected by toothed joints.
Figure 8. The prototype of the lamp (picture by author, 2017)
6.4. The coat hook
The coat hook is made of waste of production the playhouse – baobab cutouts. It should be fixed to the wall – it is therefore wall hanger. All of used measures are compliant with the ČSN EN 16121: Non-residential storage furniture: Requestments for safe, strenght, stability and durability (2014). 6.5. The board (black or white)
The black board is also made of waste material from production of playhouse – spruce CLT panel a thickness of 27 mm. The area was coated with board surface. The edges are rounded by a radius of 7 mm.
Figure 9. The prototype of blackboard and the sitting product (picture by author, 2017)
6.6. The toy

28th International Conference on Wood Science and Technology 2017 IMPLEMENTATION OF WOOD SCIENCE IN WOODWORKING SECTOR
235
The toy is made of birch plywood as well as the lamp. It consists of several components – playing board and individual animals and plants that fit into milled grooves. Children can build their own Safari as they like. They can also move with individual components – animals and plants can touch each other. The toy is hand-painted. It is compliant with standard ČSN EN 71 – 1: Safety of toys – Part 1: Mechanical and physical properties (2015).
Figure 10. The prototype of toy (picture by author, 2017)
7. CONCLUSION
The main aim of this project is to design six products for children into public space. The
effort of the aim was also to give children a touch of nature. The next aim of the project was to make enjoyable stay for children in public spaces.
After finding what offer children´s interior playgrounds and market with products for children was decided to design in a different way. Create nice and safe products for children with using only a limited amount of plastic. Wood was chosen as the main construction material. There was an effort to design modern and attractive products. All products were designed to not only be functional but also aesthetic complements for indoor playgrounds, waiting rooms at doctors or for other public places or even children´s rooms. After the phase of designing new product followed a phase of creating of technical drawings and prototyping.
There was a testing phase after production of the first prototypes in kindergarten where it was shown that the products are becoming very popular. Nowadays, the first playhouse was donate to hospital for free usage. REFERENCES Animal chairs by elad ozeri [online]. Design Boom, 2010 [cit. 2017‐04‐09]. Available from:
http://www.designboom.com/design/animal‐chairs‐by‐elad‐ozeri/ Cascando. (2nd March 2017). Cascando. Available from: http://www.cascando.nl/coatstands/
tree Gones. (2nd March 2017). Gones. Available from: http://www.gones.fr/en/kids/animallamp‐
zooo‐2 Toys [online]. Prague: Czech office for standards, metrology and testing, 2017
[cit. 2017‐03‐10]. Available from: http://www.unmz.cz/URAD/HRACKY Processing: A Programming Handbook for Visual Designers and Artists (Second Edition) [online]. The MIT Press, 2003 [cit. 2017‐03‐10]. Available from:
https://processing.org/handbook/

28th International Conference on Wood Science and Technology 2017 IMPLEMENTATION OF WOOD SCIENCE IN WOODWORKING SECTOR
236
Services in IC trains RegioJet [online]. Prague: Student agency, 2016 [cit. 2017‐04‐09]. Available from: https://www.regiojet.cz/servis/sluzby‐ve‐vlaku
Storaenso: Products and services [online]. Stockholm: Storaenso, 2017 [cit. 2017‐03‐ 10]. Available from: http://www.storaenso.com/products‐and‐services/building‐and‐living
Toys safety [online]. Brusell: Europe Union, 2017 [cit. 2017‐03‐10]. Available from: http://ec.europa.eu/growth/sectors/toys/safety/guidance/
ČSN 91 0612 ‐ Furniture. Wood sitting furniture for children. Basic measures. Prague: Czech office for standards, metrology and testing, 1991. ČSN EN 16121 ‐ Non-residential storage furniture: Requestments for safe, strenght, stability and dur-
ability. Prague: Czech office for standards, metrology and testing, 2014. ČSN EN 60598 ‐ Lamps: General requirements and tests. Edition 5. Prague: Czech office for stand ards, metrology and testing, 2009. ČSN EN 71‐1 ‐ Safety of toys – Part 1: Mechanical and physical properties. Prague: Czech office for standards, metrology and testing, 2015. KULA, Daniel, Elodie TERNAUX a Quentin HIRSINGER. Materiology: guide the world materials and technologies for architects and designers. Prague: Happy Materials, c2012. ISBN 9788026005384. Directive 2009/48 / EC of the safety of toys. 1. Bruxelles: Commission européenne, Ifitshipitshere. (12th April 2017). SmartPlayhouse Adds Mondrian-Inspired Stijlhaus To Their Colle-
ction. Available from: http://www.ifitshipitshere.com/smartplayhouse-adds-mondrian-stijhaus-collection/
Internet Mall, a. s. (2nd March 2017). Mall.cz. Available from Marionette Drawing board 2in1: https://www.mall.cz/kreslici‐tabule/marionette‐kreslici‐tabule‐2v1
KOSKI a mixed reality building block game [online]. London: studio deFORM, 2016 [cit. 2017‐04‐09]. Available from: http://www.studiodeform.com/KOSKI‐GAME

28th International Conference on Wood Science and Technology 2017 IMPLEMENTATION OF WOOD SCIENCE IN WOODWORKING SECTOR
237
Outdoor Wooden Furniture as a Component of an overall Municipal Project: “Green City”
Damary, Roy1; Pryadilina, Natalia2; Zalesov, Sergey3; Opletaev, Anton4
1 President of the Institute of Business and Management "INSAM", Geneva, Switzerland 2 Institute of Economics and Management, Ural State Forestry Engineering University, Ekaterinburg, Russia
3 Department of Forestry, Ural State Forestry Engineering Universit, Ekaterinburg, Russia 4 Department of Forestry, Ural State Forestry Engineering University, Ekaterinburg, Russia
ABSTRACT
Ekaterinburg is undertaking a major project aimed at renewing and expanding green space in the city. Urban street and park furniture and decoration nearly always found in any metropolis. The installation of wooden outdoor furniture cannot be haphazard, but integrated into the overall landscaping of the "Green City" project - a major priority of the city authorities of Ekaterinburg. This article provides information about the system and the structure of the green endowment (or the “given assets”) of Ekaterinburg, the structure of the woodland and the main ways it can be preserved and developed as in the strategic project “Green City”. As the environmental situation is deteriorating, woodland’s sanitary-and-hygienic, health-improvement, aesthetic and other functions are becoming key issues. The goal of the project is to preserve and develop the city's green endowment and to enhance the environment for the quality of life and the recreation of citizens. It relies on all types of green space being maintained in an optimal state, and enhanced with outdoor wooden furniture and sculpture.
Key words: city woodland, forest park, green spaces, recreation, strategic project, outdoor furniture.
1. INTRODUCTION
With the growth of the city of Ekaterinburg and the development of its industry, protecting the environment and maintaining decent living standards has become more and more complex. In recent decades, the impact of humans on the environment and, in particular, on green spaces, has become very negative, and is now one of the major environmental problems in the city.
Green plants and woodland of Ekaterinburg are an integral part of its urban development and ecological framework. They are part of the life support system of the city, and the most essential environmental factor responsible for ensuring the comfort and quality of the human habitat, as well as a necessary and important element of the urban landscape together with urban street furniture and sculpture.
2. STATE OF THE ISSURE
The green spaces making up a single ecological system of the city of Ekaterinburg cover an area of 24.5 thousand hectares. The green ring of 15 forest parks forms an exceptionally powerful and technically irreplaceable biological filter of the city. No other city of Russia has anything resembling that. It is an invaluable socio-ecological heritage for further generations.
The territory of the municipality called "City of Ekaterinburg" includes forests under Federal ownership (30.78 thousand hectares). More than 70% of all green spaces of Ekaterinburg are accounted for by natural forests, about 20% by green areas of limited use and special purposes and 10% by urban plantations for common use (Table 1).
69% of the territory in the structure of natural forests is made up of forest parks and 16% of urban forests. Parks play a special role in urban greenery and account for more than 90% of the total area.

28th International Conference on Wood Science and Technology 2017 IMPLEMENTATION OF WOOD SCIENCE IN WOODWORKING SECTOR
238
Table 1. Composition and structure of green endowment
(or “assets” of Ekaterinburg city in 2013) [1]
№ Denomination Measurement hectares %
1 City green spaces, in total 24.554 100
2 including:
Natural woodland of forested areas
17.432
71
among them: - city forests
2.863
16
- forest areas under construction sites 745 5 - forest parks 12.088 69
- forest areas under non-delimited state property
1.736
10 3 City plantings of common use 2.493 10
among them: - parks
2.255
91
- squares 154 6 - boulevards 58 2 - gardens 25 1 4 Landscaped areas of restricted and special use 4.629 19
among them: - road network
291
6
City woodlands are one of the main factors defining the quality of life for residents.
However, the level of landscaping and condition of the urban forests of Ekaterinburg does not really meet the requirements imposed on them. Problems related to the considerable age of the greater part of green space, poor species composition, low sanitary, aesthetic and decorative characteristics of urban spaces lead inevitably to deterioration of the quality of life in the urban environment.
Currently in Ekaterinburg there are about 20 m2 per capita of green spaces of common use including parks, squares, and boulevards and 110.9 m2 per capita of forest parks and urban forests, for which the state of health is estimated at only 2 points out of a 5-point scale. Existing indicators do not meet the environmental requirements for such a large industrial city like Ekaterinburg with a constantly growing number of motor vehicles.
Integrated development and conservation of the recreational system of the city as a single green framework is only feasible by maintaining all types of green plant in optimal conditions. Successful solution of the problem is only possible via comprehensive study, assessment and forecast of the structure, life state and restoration processes of urban green space. For the protection of the environment, and the health-and-hygiene, recreational and aesthetic roles of forests, woodland and urban plantings are invaluable, as they represent ideal places for the residents to spend their leisure time.
In view of the psychologically stressful environment of a large city, regular and effective recreation in nature is reckoned to be essential for the life of local people, as well as for environmental protection from industrial and household pollution. Shartash, Uktuss and the South-Western parks are the most visited in that context.
Wooden outdoor furniture is one of the elements contributing to architecture aimed at improving the urban environment in Ekaterinburg, along with landscaping in parks, squares, railway stations, stadiums and airports. Wooden furniture and decorative elements can be considered small architectural forms as structures, adaptations or artistic and decorative elements. Thus wood enhances the appearanced of the streets and buildings of the city and render parks and urban forests more useful and attractive for the citizens.
Walking around Ekaterinburg, one encounters wooden street furniture: kiosk shops, benches, outdoor sofas, waste paper baskets, various flowerbeds, fences and so on.

28th International Conference on Wood Science and Technology 2017 IMPLEMENTATION OF WOOD SCIENCE IN WOODWORKING SECTOR
239
3. STRATEGIC PROJECT “GREEN CITY”
In 2013, the city Administration of Ekaterinburg, supported by the Committee on environment and natural resources management, developed a strategic project called "Green city" (Urban forests) [2]. Its main purpose was optimization and further improvement of the system of the green endowment of the city to provide the citizens with a favourable living and recreation environment.
This document was developed with the direct participation of employees of the Department of landscape building of the Ural State Forestry University, by Professor L Atkina and Professor T Srodnykh.
The project is planned to be fully implemented by 2020. The primary objective of the project is to develop a regulatory framework, including development of propositions on specially protected natural areas of local importance, on urban forests and on urban landscaping. Additional documentation and regulatory-production rules in all major types of activity in the area of green economy are being prepared. Establishment of a modern material and a technical base for the city’s green economic development will definitely improve the quality of maintenance of the objects considered.
The following tasks are not less important: • reconstruction and construction of objects of green economy with the use of modern technologies of greenery planting and landscape design, • further realisation of target programs; • increase of recreational capacity of the green fund of the city; • partial conversion of forests within the boundaries of "Ekaterinburg city" municipality
into urban forests and parks and creation of new landscapes; • transfering conservation lands owned by the government of Sverdlovsk region to the
City under terms of perpetual use. The main priorities for the city at present are: • preservation and restoration of the existing green endowment; • extension of urban green areas; • enhancement of decorativeness; • expansion of the species composition; • increasing the recreational capacity of the objects of the natural complex together with the
use of new types of outdoor wooden furniture. Target indicators of the strategic project anticipate an increase of the amount of work on
renewal of green plantings in the squares, boulevards and parks, all to be done by 2020. For instance, the planned reconstruction of 46 objects with an area of 184.4 hectares, as well as accomplishment of 943.5 hectares of green areas in the urban forests, will significantly increase the recreational capacity of the territories. The number of objects with the status of "especially protected natural territory of local importance" is expected to be increased from 16 to 40 and their area will be expanded from 137,2 to 239.6 hectares accordingly. Moreover the project supposes massive greening of the roofs of city buildings. The total area of green space within the city limits of Ekaterinburg is planned to be increased to 28 thousand hectares by 2025 (now 24,5 thousand hectares).
In the course of the analysis, according to the Committee on improvement of Administration of Ekaterinburg, there has been a tendency to approximate the values of the main project targets for achievement by 2020 and 2025. Of particular concern are the following indicators: • "proportion the area of the reconstructed objects of the green economy of general use and the ratio of the area of landscaped areas of urban forests "; • "the proportion of the reconstructed green facilities of public use."

28th International Conference on Wood Science and Technology 2017 IMPLEMENTATION OF WOOD SCIENCE IN WOODWORKING SECTOR
240
4. ROLE OF OUTDOOR WOODEN FURNITURE AND SCULPTURES IN “GREEN CITY” PROJECT
A key component in the "Green City" project is the role of wooden outdoor furniture to upgrade and enhance the beauty of the territory. Thus the City is improving the urban amenities, working through the Committee on Urban Construction.
Many Ekaterinburg companies are supplying outdoor furniture for this project. They include but are not limited to Gras EKB, Gorodok and Dobrodel,.
The choice of small architectural forms for streets, squares and parks of the city, city services should always take into account the basic requirements for urban wooden street furniture: • aesthetics - furniture should reflect the architectural, compositional, artistic patterns of the space of the urban environment; Each new element must fit harmoniously into the environment, giving it an attractive and finished look; • safety – choices to be made on roundness of shape, the optimal height, a minimum of unnecessary parts, the absence of sharp angles, as well as fire safety. Even at the development stage, measures should be envisaged to reduce the danger of outdoor furniture. • functionality - in advance the dimensions need determining, and certain design solutions developing to take into account the purpose and possible features of the use of wooden outdoor furniture (e.g. if it is a bench, then it should be convenient to sit on it, if the waste paper basket is easy to use and simple to empty); • durability, reliability, resistance to natural effects and vandalism; • versatility - simple installation; • practicality - easy to maintain, repair. All these requirements are met by wooden outdoor furniture, provided the wood, prior to use, undergoes serious pretreatment.
Pine provides a common and inexpensive material for outdoor furniture. This wood has a loose structure but with a high resin content and low swelling coefficient. It is resistant to biological corrosion, but can be easily machined (convenient for carving, polishing, drilling).
Heat-treatment of wood provides high-quality material solving many problems that until recently could be solved only partially by using special types of wood or expensive coatings. Heat treatment can be uses on many species, including, for our case, pine. It involves prolonged exposure to high temperatures in specialized equipment. The following processes then occur: • the moisture content of wood is reduced by 50-90% (depending on the heat treatment conditions and raw materials); • the surface becomes denser, and the cellular structure changes; • wood sugars, which are a nutrient medium for microorganisms, burn out; • the resin from the coniferous tree practically completely flows out or burns out; • the colour and appearance change throughout the volume, the material acquires a new aesthetic potential.
Figure 1. Heat treatment of wood
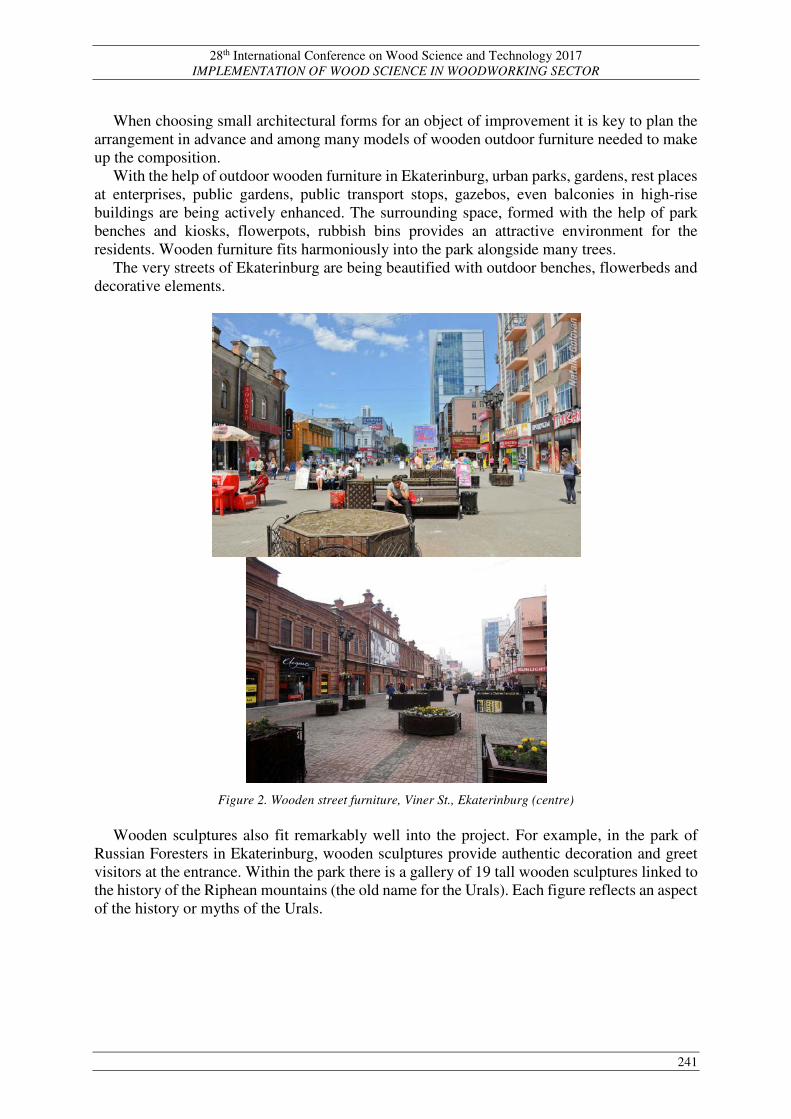
28th International Conference on Wood Science and Technology 2017 IMPLEMENTATION OF WOOD SCIENCE IN WOODWORKING SECTOR
241
When choosing small architectural forms for an object of improvement it is key to plan the
arrangement in advance and among many models of wooden outdoor furniture needed to make up the composition.
With the help of outdoor wooden furniture in Ekaterinburg, urban parks, gardens, rest places at enterprises, public gardens, public transport stops, gazebos, even balconies in high-rise buildings are being actively enhanced. The surrounding space, formed with the help of park benches and kiosks, flowerpots, rubbish bins provides an attractive environment for the residents. Wooden furniture fits harmoniously into the park alongside many trees.
The very streets of Ekaterinburg are being beautified with outdoor benches, flowerbeds and decorative elements.
Figure 2. Wooden street furniture, Viner St., Ekaterinburg (centre)
Wooden sculptures also fit remarkably well into the project. For example, in the park of
Russian Foresters in Ekaterinburg, wooden sculptures provide authentic decoration and greet visitors at the entrance. Within the park there is a gallery of 19 tall wooden sculptures linked to the history of the Riphean mountains (the old name for the Urals). Each figure reflects an aspect of the history or myths of the Urals.

28th International Conference on Wood Science and Technology 2017 IMPLEMENTATION OF WOOD SCIENCE IN WOODWORKING SECTOR
242
Figure 4. Park of the Russian Foresters, Ekaterinburg
Small architectural wooden forms enliven the appearance of Ekaterinburg, saving it
from being faceless and drab. Even the most beautiful and rich parts of the city can benefit from further development reflecting modern trends to create a comfortable urban environment.
5. CONCLUSION In conclusion, the system of the city green planting associated with ideas for outside furniture design is the main framework for city enhancement of Ekaterinburg to ensure the viability of the whole urban organism. During its development the strategic project "Green city" had no analogues on the territory of the Russian Federation. However, the initiative was eventually emulated and now similar projects have appeared in several Russian cities such as Volgograd, Omsk, etc. The implementation of measures set out in this document leads to the conclusion that living environment of the population of this large industrial city will be significantly improved and the reputation of the municipal authorities enhanced. The civic activity of the inhabitants of the conurbation will increase in the sphere of conservation of the green framework of the city. Combined with the emergence of new ideas for the use of wooden furniture and sculptures in urban design, Ekaterinburg is becoming a city of high ecological and aesthetic culture. REFERENCES [1] Imatova I and Pryadilina N 2014 Strategy of conservation of the ecological potential of
urban forests of Yekaterinburg Apriori series: natural and technical sciences vol 3 p 6 [2] The decree of the administration of Ekaterinburg dated 16.08.2013 no. 2885 “Approval of
the strategic project "green city” (in Russian)

28th International Conference on Wood Science and Technology 2017 IMPLEMENTATION OF WOOD SCIENCE IN WOODWORKING SECTOR
243
Management of the Project of Traditional Estate Adaptation into Object of Village Tourism
Klanfar, Franciska1*; Smardzewski, Jerzy2; Domljan, Danijela3
1-3Department of Wood technology, Faculty of Forestry, University of Zagreb, Zagreb, Croatia 2Department of Furniture Design, Faculty of Wood Technology, Poznan University of Life Sciences, Poznan,
Poland *Corresponding author: [email protected], [email protected]
ABSTRACT
The paper defines project of traditional estate adaptation into object of village tourism in rural environment of Croatia. Aim of the paper was to define all necessary activities on the project, its participants, time determinants and deadlines, and overall budget for the implementation of such a project. Because of the complexity of the overall project, it was divided into four sub-projects. Project selection methodology, project management methodology, Gantt diagrams and network diagrams were used, and it was obtained that the overall project budget was up to 2.229.631,00 HRK, with time duration foreseen for the full implementation of the project of 131 working days in the case when sub-projects were conducted simultaneously. Key words: Project, Project management, Village tourism 1. INTRODUCTION
Traditional estate adaptation into object of village tourism was unique business situation
which was possible to realize with creating a complex and high-budget project. The investor of the project was the Organization of an existing village household, owner of the traditional estate, the initiator of the project idea and its members were forming a project team. With purchasing of a traditional property and with regard to its own capacities, the Organization had a vision of promoting village tourism development of rural area of Žumberak which is situated in the Nature Park Žumberak-Samoborsko highlands, on the west part of Croatia in Zagreb county. Furthermore, Organization's mission was to preserve cultural and history heritage of the project environment and to invest in continental tourism of Croatia. In addition to the Organization's aforementioned field of interest, financial constraint and fulfilment of basic conditions, the project has a possibility to apply for competition for obtaining funds from the EU.
1.1. Aims of the paper
This paper outlines the mission of the project defining its aims. General aim of the paper was to show the insight of Organization's vision with achieving project result which was a new object of village tourism in the above-mentioned project environment of Žumberak. Specific aims of the paper were to define all activities on the project, its participants, time determinants and deadlines, and overall budget for the implementation of a project. Furthermore, paper includes representation of conceptual solution of the main building created in the 3D Autodesk Inventor and few samples of collected inspirational pictures in order to show conceptual solutions for interior and exterior equipping of the future object of village tourism in a traditional way of the rural region where it belongs. Exploring the specific touristic developed rural areas for inspirational solutions for interior and exterior equipping in Poland and Austria were a part of the research work, so paper also includes few samples of the Zakopane and Tirol style in order of comparison with Croatian style.

28th International Conference on Wood Science and Technology 2017 IMPLEMENTATION OF WOOD SCIENCE IN WOODWORKING SECTOR
244
1.2. Volume of the project
The work which was needed to be accomplished in this project, in order to achieve the project result, was defined in the volume of the project (Figure 3). Project includes implementation of all activities and working tasks which includes adaptation of existing buildings on the traditional estate and their interior and exterior equipping for touristic, catering and educational purposes of the future object. Traditional estate (Figure 1) in its present state includes the main building, which was former mill (Figure 2), the outbuilding, a former forge and infield.
Figure 9. Traditional estate in its present state
Figure 10. Former mill in its present state
Given the complexity of the overall project of the traditional estate adaptation, the project
was divided into four sub-projects.
Figure 11. Volume of the project
2. METHODS OF RESEARCH
The main method of the research was project management methodology which was used
through Gantt diagrams and network diagrams. Within mentioned methodology essential parameters of all sub-projects were obtained in the case when sub-projects were conducted simultaneously. According to pre-projection methodology CBS (Cost Breakdown Structure) was used to define specific aims which were needed to be accomplished in order to achieve project result. With methodology of data collection all needed parameters were collected, which
SUB-PROJECT 1
Adaptation of the main building for tourist and
catering purpose
SUB-PROJECT 2
Adaptation of the outbuilding for
educational purpose
SUB-PROJECT 3
Adaptation of the former forge into a
rural house for vacation
SUB-PROJECT 4
Equipping of the exterior
PROJECT OF TRADITIONAL ESTATE ADAPTATION INTO OBJECT OF VILLAGE TOURISM

28th International Conference on Wood Science and Technology 2017 IMPLEMENTATION OF WOOD SCIENCE IN WOODWORKING SECTOR
245
were used for making a CBS. Foreseen time for the sub-project 1 implementation was 6 months and overall expected costs were up to 1.000.000,00 HRK. A priority project plan (Figure 4) was drawn up and with project selection methodology it was determined that sub-project 1 have priority among other sub-projects. It was obtained that sub-project 1 was time and financial most demanding sub-project and its implementation time covers up sub-projects 2-4. Furthermore, with implementation of the sub-project 1 as a priority project, Organization have biggest profit and it brings its primary earning because it is a main building for the business of the Organization.
Figure 12. Project selection methodology
With methodology of data collection in specific rural touristic environments in Croatia, Poland and Austria conceptual solutions for interior and exterior equipping of the future object of village tourism are shown in order to have insight for Organization vision of the overall project and comparison with aforementioned rural touristic environments in Europe.
3. RESEARCH RESULTS Research results includes the research work according to pre-projection methodology which
includes CBS, project management methodology which includes Gantt diagrams and network diagrams, 3D visualization of the main building and data collection methodology which includes conceptual solutions of the future object of village tourism.
3.1. Pre-projection methodology
Table 1 shows CBS which includes main activities, its participants, needed time and overall budget for the implementation of the sub-project 1 according to pre-projection methodology as an example of creating CBS. For the research and for creating CBS first few months all needed documentation was collected. First activity on the project was to create sketches of existing buildings and drawings with suggestion of the realization solution which was conducted by architectural office. When the drawings were finished, and the Organization elected the realization solution, team member 2 collected all needed offers for implementation of the project activities. Regards to Organization capacity the best offer was selected with help of other members in the project team. All the major activities of the sub-project 1 were conducted consequently, meaning that each activity can start only when the previous activity is finished

28th International Conference on Wood Science and Technology 2017 IMPLEMENTATION OF WOOD SCIENCE IN WOODWORKING SECTOR
246
completely. During implementation of the sub-project 1, the process of the publicity and marketing can start, but the programmer cannot finish the Website before buildings are finished.
Table 1. CBS of the sub-project 1 - Adaptation of the main building for tourist and catering purpose according to pre-projection methodology
Activities Who performed Duration Costs
Preparation activities Architectural office Team member 2
28 days 33.750,00 HRK
Preparatory work Construction company
6 days 11.500,00 HRK
Hard construction work
Construction company Team member 2 Carpentry workshop Company for plumbing installations Electric company
95 days 601.985,00 HRK
Equipping of the interior
Carpentry workshop Team A Team B Ceramic company Project team
31 days 334.500,00 HRK
Publicity and marketing Programmer 20 days 5.000,00 HRK
Sum 180 days 986.785,00 HRK
3.2. Comparison of the pre-projection and project management methodology
Table 2 shows implementation paths of sub-projects 1 - 4. According to pre-projection methodology it was obtained that time foreseen for the project implementation was 482 days if the sub-projects were conducted consequently. According to project management technology it was obtained that duration of the project implementation is 378 days if the sub-projects were conducted consequently. Duration of the project implementation according to project plan was 131 days in the case if the sub-projects were conducted simultaneously, which was accomplished by using Gantt diagrams (Figure 5) and network diagrams (Figure 6) in the Microsoft Project. It was obtained that the overall project budget was up to 2.229.631,00 HRK.
Table 2. Comparison of the implementation paths of sub-projects 1–4
Sub-project Pre-projection
duration Duration according
to project plan From date –
to date Costs
(label) (days) (days) (2018.) (HRK)
P1 180 131 09.04. – 09.10. 986.785,00
P2 116 92 09.04. – 15.08. 631.835,00
P3 117 107 09.04. – 07.09. 529.011,00
P4 69 48 30.07. – 04.10. 82.000,00
Sum 482 378 09.04. – 09.10. 2.229.631,00

28th International Conference on Wood Science and Technology 2017 IMPLEMENTATION OF WOOD SCIENCE IN WOODWORKING SECTOR
247
Figure 5 shows segment of Gantt diagram of the sub-project 1. It shows all activities and its time duration according to project management methodology.
Figure 13. Gantt diagram of the sub-project 1 according to project management methodology
Figure 6 shows segment of network diagram of the sub-project 1 according to project management methodology. It shows segments of project activities and its precise date of start and the end of implementation, who conducted which activity and their time duration. Network diagram allows better overview and schedule of the project resources which understands time and participants on the project.
Figure 14. Network diagram of the sub-project 1 according to project managemet methodology
3.3. Conceptual solutions of interior and exterior equipping
In order to understand insight of the Organization vision part of the research work was to create conceptual solution of the main building and to collect inspirational pictures of the project environment on the traditional way of the region where it belongs. In order to have samples for comparison of interior and exterior traditional equipping of other touristic rural environments in Europe with Croatian style, few samples of the Zakopane and Tirol style were collected. In order to understand selection of the regions for data collection it is necessary to mention that Zakopane region is the most popular rural touristic destination of Poland, same as Tirol in Austria, while Žumberak is less popular rural touristic region of Croatia.

28th International Conference on Wood Science and Technology 2017 IMPLEMENTATION OF WOOD SCIENCE IN WOODWORKING SECTOR
248
3.3.1. 3D visualization of the main building for touristic and catering purpose
Figure 7 shows 3D visualization and orthogonal representation of conceptual solution of the main building for touristic and catering purpose. Dimensions of the main building are 1220×940×600 cm.
Figure 15. 3D and orthogonal representation of the main building for touristic and catering purpose
3.3.2. Interior equipping in Žumberak and Zakopane style
Figures 8-13 show conceptual samples of the interior equipping in Žumberak style, traditional furniture and details of the rural region of Žumberak in Croatia.
Figure 16. Interior unit for guests
Figure 17. Accommodation capacity 1
Figure 18. Accommodation capacity 2
Figure 19. Commode
Figure 20. School bench
Figure 21. Traditional souvenir
Figures 14, 15 and 16 show traditional samples of interior equipping in Zakopane style with traditional furniture and details of the rural region of Zakopane in Poland.

28th International Conference on Wood Science and Technology 2017 IMPLEMENTATION OF WOOD SCIENCE IN WOODWORKING SECTOR
249
Figure 22. Interior unit
Figure 23. Cabinet
Figure 24. Work desk
Observing Figures 8-16 it has been established that traditional furniture in Žumberak style is smaller in dimensions and more modest than traditional furniture in Zakopane style which is richer and decorated with many wood carved details.
3.3.3. Exterior equipping in Žumberak, Zakopane and Tirol style
Figures 17–19 show conceptual samples of the exterior equipping for the future object of village tourism in project environment of Žumberak. Figure 18 represents sample of water wheel which is the most important detail of exterior equipping because the main building was the former mill. One of the missions of Organization was to put back water wheel in order to preserve cultural heritage of the future object of village tourism. Furthermore, with creative process of renovation called „Upcycling“, Organization wants to preserve traditional old furniture and details connected with rural area of Žumberak.
Figure 25. Traditional house in Žumberak style 1
Figure 26. Water wheel
Figure 27. "Upcycling" of old window
Figure 28. Traditional house in Zakopane style
Figure 29. Traditional house in Tirol style
Figure 30. Traditional Polish house
Traditional house in Zakopane style which is shown on Figure 20 is a museum of cultural
and history heritage of Tatra culture. The picture was collected in the oldest street in Zakopane.

28th International Conference on Wood Science and Technology 2017 IMPLEMENTATION OF WOOD SCIENCE IN WOODWORKING SECTOR
250
The museum is only place in Poland acquainting the visitors with the history of achievements of the first theoretically wrought and successfully effected concept of a Polish national style based on the architecture and decorative art of the inhabitants of the region of Podhale. Figure 21 represents traditional rural touristic house in Tirol style and Figure 22 represents traditional touristic Polish house which was collected in Upper Silesian Ethnographic Park in Chorzów in Poland. Observing Figures 17, 20, 21 and 22 it was established that traditional houses in Žumberak style have influence of Pannonian and Alps architecture, the same as Polish traditional houses. Traditional houses in Zakopane style have influence of Tirol and Swiss mountain architecture, while traditional houses in Tirol style have specific architecture of Alps.
4. CONCLUSION The project of traditional estate adaptation into object of village tourism included the initial
phase of the project and it was organized as a good base for next phase for implementation of the project. With further elaboration project can be established and realized. The project also has an opportunity to be established by the future consultant who can arrange preparation of the project to apply it for competition for obtaining EU funds, which was also one of the aims of the project. The existing Organization is already engaged in tourism and catering business, but it wishes to extend its offer for educational purpose to contribute to its project mission. Educational purpose considerably contributes to the opportunity of receiving support from EU funds. The project was acceptable from resource point of view because all participants were ready to work off all needed work in given time. It was acceptable from community point of view because with the project implementation there is an opportunity for opening new working places, for the inhabitants of the rural area of Žumberak and interior and exterior design of the future object of village tourism would not disturb ambience of the environment. The project was time acceptable because with the project management methodology harmonious organisation and distribution of the project resources was established. If the project succeeds to receive support from EU funds, project would be financially acceptable. The project was acceptable to creditors because with project implementation degradation of rural area could be prevented, the quality of life of the rural population could be raised, sustainable development could be encouraged, the tradition and cultural heritage of continental tourism in the Republic of Croatia could be preserved and it would give contribution to profiling the Republic of Croatia as a destination for rural tourism. Furthermore, the project was acceptable to the state because with the project implementation economic performance, tourism sector status, economic sustainability of the Republic of Croatia could be improved.
REFERENCES Deljac, S. (2007): Kako provoditi školske projekte, Microsoft: Partners in Learning, Agencija za odgoj
i obrazovanje Drabek, J., Jelačić, D. (2007): Investment Projects, Nikara, 2007. 65 p. Lockitt, B. (2000): Practical project management for education and training, FEDA, London Maylor, H. (2010): Project Managment, fourth edition, Grafos S.A., Arte sobre papel, Spain Meredith, J.R., Mantel, S.J. (2012): Project management, eighth edition, John Wiley & Sons, Inc. Omazić, M.A.; Baljkas, A. (2005): Projektni menadžment, Zagreb: Sinergija nakladništvo d.o.o. https://en.wikipedia.org/wiki/Upcycling NN 138/06, 43/09, 88/10 Zakon o ugostiteljskoj djelatnosti NN 68/07, 88/10 Zakon o pružanju usluga u turizmu NN 5/08, 44/11, 118/11 Pravilnik o pružanju ugostiteljskih usluga u seljačkom domaćinstvu

28th International Conference on Wood Science and Technology 2017 IMPLEMENTATION OF WOOD SCIENCE IN WOODWORKING SECTOR
251
Improvements to the Production Management System of Wood-processing in Small and Medium Enterprises
Dušak, Marko1;
1pHD student, Faculty of Forestry, University of Zagreb, Croatia *Corresponding author: [email protected]
ABSTRACT
Small and Medium Enterprises (SMEs) make up over 99% of all industrial enterprises in southeast Europe. A similar percentage of SMEs can be found within southeast Europe’s wood-processing and furniture manufacturing companies. This research aimed to investigate the current situation in the production management systems of SMEs in wood-processing companies in select Southeast European countries and to suggest possible improvements according to the results. A total of 30 small and medium companies from different countries in the region were surveyed to investigate the advantages and disadvantages of their production management systems. This research aimed to propose a model to create better systems within SMEs in the wood- processing branch and, therefore, achieve better production and business results. In addition, a total of 10 experts who work with management systems in wood-processing from the examined countries were surveyed with the same purpose. The Analytical Hierarchy Process (AHP) analysis of experts’ opinions showed that the managers in small and medium enterprises for wood-processing and furniture manufacturing should pay the most attention to the conditions of the market, promotion, marketing, range of products, and product quality.
Key words: Wood-processing; Small and Medium Enterprises (SME’s); Production management system; Management parameters; AHP; Decision making process 1. INTRODUCTION Small and medium enterprises (SMEs) represent a significant part of the economy and industrial system of every country (Bumgardner et al., 2011; Buehlmann et al., 2013), and southeast European countries are no different in regard to the participation of SMEs within their economy. Recently, research shows that the numbers for SMEs increase annually (Bistričić et al., 2011). According to European laws, micro enterprises are those that employ less than 10 employees and whose income is less than €2 million per year. Small enterprises are those that employ less than 50 employees with an annual revenue of less than €10 million. Medium enterprises have an annual revenue of less than €50 million, with less than 250 employees (European Commission 2015). The study is an accurate representation for the average situation and percentages of small and medium enterprises in southeast European wood-processing and furniture manufacturing companies as a whole. Because most of the companies are situated in rural areas of southeast Europe, small and medium enterprises make up a large percentage of all wood industry companies. However, most of the research was conducted and implemented in large companies and, in some cases, medium companies. This fact especially applied for wood-processing companies, because large companies have the equipment, personnel, and financial assets for providing the necessities and for implementing such research (Dasmohapatra 2009; Motik et al., 2010; Faletar et al., 2016). In contrast, to be able to survive in the market, small and medium enterprises have to be innovative in all possible aspects. Baković and Ledić-Purić (2011) researched the role of innovations in SMEs, while Pirc Barčić et al. (2016) gave the perspective of innovations and their links to management activities in the furniture industry. Wu et al. (2015) researched the work systems and workplace performances in small, medium, and large companies, and Neira et al. (2009) studied the

28th International Conference on Wood Science and Technology 2017 IMPLEMENTATION OF WOOD SCIENCE IN WOODWORKING SECTOR
252
interaction of innovations and performances in small and medium furniture enterprises. The possibilities of the implementation of an integrated approach to safety in small companies was presented by Nielsen et al. (2015), while Koprolčec et al. (2012) tried to establish the best insurance models for wood sector companies. This research aimed to examine the current situation in production management systems in SMEs of wood-processing and furniture manufacturing companies in four southeast European countries. The study hoped to establish parameters for enterprise owners and managers in SMEs should consider improving their business and production results in the future. The questionnaire aimed to establish the advantages and disadvantages associated with SME's production management systems. Also, to suggest a model to create better production and management systems within SME's in the wood industry sector, and for use in other industries. 2. MATERIALS AND METHODS A survey was provided to the company managers of 130 micro/small and medium companies from four southeast European countries (Croatia, Macedonia, Serbia, and Slovenia). A total 117 questionnaires were sent to micro/small enterprises and a total 13 questionnaires was sent to medium enterprises, according to number of enterprises in each country (Croatia 25%, Serbia 50%, Macedonia 15%, and Slovenia 10%). In total, only 30 enterprises responded to the survey in full, and these responses were taken into further analysis. Of the responded questionnaires, 27% were from macro enterprises, while 33% were from small enterprises, and 30% were from medium enterprises. An emailed survey, based on methods recommended by Dillman (2000), was the approach used in this study. The questionnaire consisted of 40 questions with several statements concerning each question. The managers had to choose a statement related to different production management parameters that were either more or less important for the companies’ production management system. The questionnaire was divided into two parts. The first part consisted of 11 questions and was dedicated to general information about the company. The second part consisted of 29 questions directly connected to production management system parameters. Those 29 questions gave several statements for each question marked 1 through 5 (1- not important at all, 5- most important). The same questionnaire was given to 10 experts from the same four countries, who had to give answers to the second part of the questionnaire (questions 12 through 40). The goal of having both experts and managers answer the questions was to establish the differences between opinions of managers in the companies and experts not working in the companies. In the second survey, different questionnaires for the purpose of an AHP analysis were used. The production management system parameters were grouped into seven categories and those categories were placed in relationships. The questionnaire was given to the same experts who had to grade the relationships among the categories, according to their own opinion. The differences in the frequency of answers given by the managers and experts were tested by a χ2-test for each individual question (the hypothesis, H0, was the distribution of answers to the same question that were equally given by both groups). The test showed that there was a statistically significant difference between the distribution of all answers given by company managers and those given by experts (for all tested values p < 0.01). Thus, this study aimed to establish which production management system category of parameters, according to the experts’ opinions, should be considered. Therefore, the authors conducted the AHP method. The AHP method is a multi-criterion decision making method that helps decide among suggested alternatives. Seven categories of parameters were established and placed to make x·(n-1)/2 pairs. The questionnaire condition that should receive most consideration during the analysis was for the Consistency Ratio (CR) to be less than 10% (CR ≤ 0.10), meaning that less than 10% of given answers (values) should be inconsistent. All statistical analysis and graphical presentations were conducted using Microsoft Excel software

28th International Conference on Wood Science and Technology 2017 IMPLEMENTATION OF WOOD SCIENCE IN WOODWORKING SECTOR
253
(Microsoft EMEA, Issy-les-Moulineaux, France). 3. RESULTS AND DISCUSSION The first 11 questions in the questionnaire were dedicated to general information about the companies. The micro companies surveyed in the research were manufacturing furniture or joinery (windows and doors), while small and medium companies were sawmills, furniture, or joinery manufacturers. Two thirds (67%) of the companies manufacture products exclusively through known customers, while 33% of the companies have their own shops, enabling them to combine their production for known customers and to that of the shop (unknown customers). Of enterprises responding to the questionnaire, 26.7% were small craft companies, usually family businesses that manufactured unique products ordered by a single customer who came to the company to order furniture or joinery by reputation (they gathered the information about the company from a friend or by chance). The other companies functioned through a type of legal entity. One fifth (20%) of surveyed companies used classic production technology and hand tools only, while 13% exclusively used computer aided technology, and two thirds (67%) used a combination of both. The most questions like: statements about leadership, goals, and objectives of SMEs; statements about management and errors in production; criteria at the level of organization within the enterprises; importance of SMEs’ organization, methods of selling the products and others were “highly significant” (0.001 < p <= 0.01). Some of questions like: frequent market research; packaging as a mean of protection; high quality means longer products life cycle, were "very highly significant" (p <= 0.001). To be able to help the managers in the decision-making processes, it was necessary to establish which of the seven groups of production management parameters to pay the most attention. Therefore, an AHP analysis method was performed. Figures 1 and 2 show the results of the AHP analysis of the answers given by the experts.

28th International Conference on Wood Science and Technology 2017 IMPLEMENTATION OF WOOD SCIENCE IN WOODWORKING SECTOR
254
Figure 1. AHP Analysis on the seven groups of production management parameters
Figure 2. AHP Analysis – Matrix of answers by the seven groups of production management parameters
The AHP analysis showed that CR = 1.2%, which designated that the analysis was valid. By the results of the analysis and by the ranking given according to the weight of each of the seven groups of parameters, the managers in SMEs in wood-processing and furniture manufacturing should pay the most attention to the conditions of the market activities and marketing (weight = 24.91%), followed by range of products, quality of products (weight= 19.59%), and information technology versus modern production technology (weight = 14.78%). In the Figure 3 we can see the new organizational model for small and medium enterprises based on previous results.

28th International Conference on Wood Science and Technology 2017 IMPLEMENTATION OF WOOD SCIENCE IN WOODWORKING SECTOR
255
Figure 3. Organizational model for small and medium enterprises
4. CONCLUSION
The aim of this research was to establish the differences in opinions on different production
management system parameters between managers in different small and medium wood-processing and furniture manufacturing companies in four southeast European countries and experts dealing with production management issues within the same countries. By using a χ2-test, the research indicated that the differences between all given questions and statements were significantly different. This stipulated that the AHP analysis was conducted to establish the ranking among the production management system parameters as a tool in the decision-making process and in the end we create new organizational model.
It was discovered by the AHP method that managers in wood-processing and furniture manufacturing SMEs in Southeast European countries should pay the most attention to conditions on the market activities and marketing. Knowing the needs and demands of the customers could help in improving production and business results of SMEs in this particular branch.
A second group of production management system parameters that SMEs’ company managers should pay attention to are the range of products available and quality of products. Customers welcome quality products, and even prefer quality over price.
This research and analysis can help managers in SMEs in wood-processing and furniture manufacturing improve their decision making process, improving their production and business results.
REFERENCES Baković, T.; Ledić-Purić, D. (2011): Uloga inovacija u poslovanju malih i srednjih poduzeća. Role of
innovations in business of small and medium enterprises. Poslovna Izvrsnost Zagreb 5(2), 27-42. Bistričić, A.; Agatić, A.; Trošić, N. (2011): The importance of small and medium- sized enterprises in
Management
Market, promotion and
marketing
-Internet sales
-Market research
-Various types of advertising
-Innovation in product,
technology,
process
Range of product and
product quality
-Larger production program
-ISO 9001
-Ideally distributed
processes in production
Information and modern production tecnology
-Flexible information
system
-Electronic connection
with business partners
Process culture, management processes and
production deadlines
-Various types of business processes
-Process documentation with clearly
roles
-Availability of materials
Human resources
-Motivation
-Awarding employees for
expanding skills
-Teaching them by various
methods and tecnhiques
Leadership, policy and
organizational structure
-General improvement of business processes
-Adjustment to customer wishes
-Fast management reaction on competition
activity
Ecologically pure
production
-Preventing various
pollution
-Protecting the natural
environment
-Saving energy

28th International Conference on Wood Science and Technology 2017 IMPLEMENTATION OF WOOD SCIENCE IN WOODWORKING SECTOR
256
the Croatian economy and in the European union states economies. Scientific Journal of Maritime Research 25(1), 145-158.
Buehlmann, U.; Bumgardner, M.; Sperber, M. (2013): How small firms contrast with large firms regarding perceptions, practices and needs in the U.S. secondary woodworking industry. BioResources 8(2), 2669-2680. DOI: 10.15376/biores.8.2.2669-2680.
Bumgardner, M.; Buehlmann, U.; Schuler, A.; Crissey, J. (2011): Competitive actions of small firms in a declining market. Journal of Small Business Management 49(4), 578-598. DOI: 10.1111/j.1540-627X.2011.00337.x.
Dasmohapatra, S. (2009): Future marketing drivers for the forest products industry. BioResources 4(4), 1263-1266. DOI: 10.15376/biores.4.4.1263-1266.
Dillman, D. A. (2000): Mail and Internet Surveys – the Tailored Design Method. John Wiley & Sons, Inc., New York, NY.
European Commission (2015): User guide to the SME definition. Luxembourg: Publications Office of the European Union, European Union. DOI: 10.2873/620234.
Faletar, J.; Jelačić, D.; Sedliačiková, M.; Jazbec, A.; Hajdúchová, I. (2016): Motivating employees in a wood-processing company before and after restructuring. BioResources 11(1), 2504-2515. DOI: 10.15376/biores.11.1.2504-2515.
Koprolčec, M.; Motik, D.; Oblak, L. (2012): Insurance models of wood sector companies. Drvna Industrija 63(3), 177-186.
Motik, D.; Šegotić, K.; Jazbec, A. (2010): Application of AHP model and survey results in deciding on a pbumgroduct line in furniture industry. Drvna Industrija 61(2), 83-87.
Neira, C. O.; Lindman, M. T.; Fernández, M. J. (2009): Innovation and performance in SME furniture industries: An international comparative case study. Marketing Intelligence & Planning 27(2), 216-232. DOI:10.1108/02634500910944995.
Nielsen, K. J.; Kines, P.; Pedersen, L. M.; Andersen, L. P.; Andersen, D. R. (2015): A multi-case study of the implementation of an integrated approach to safety in small enterprises. Safety Science 71, 142-150. DOI: 10.1016/j.ssci.2013.11.015.
Pirc Barčić, A.; Motik, D.; Oblak, L.; Vlosky, R. (2016): Management activity linkages to innovation deconstruction: An exploratory study of the furniture industry in Croatia. BioResources 11(2), 3987-4005. DOI: 10.15376/biores.11.2.3987-4005.
Wu, N.; Hoque, K.; Bacon, N.; Bon Llusar, J. C. (2015): High-performance work systems and workplace performance in small, medium-sized, and large firms. Human Resource Management Journal 25(4), 408-423. DOI: 10.1111/1748- 8583.12084.
