organization of pilot and icebreaking in the nordic...
TRANSCRIPT
Inge Vierth
Organization of pilot and icebreaking in the Nordic countries
and update of the external costs of sea transports in Sweden
A report in SAMKOST 3VTI rapport 988A
| Organization of pilot and icebreaking in the N
ordic countriesand update of the external costs of sea transports in Sweden
www.vti.se/en/publications
VTI rapport 988APublished 2018


VTI rapport 988A
Organization of pilot and icebreaking in the Nordic countries
and update of the external costs of sea transports in Sweden
A report in SAMKOST 3 Inge Vierth

Author: Inge Vierth, VTI Reg. No., VTI: 2017/0367-7.4 Publication: VTI rapport 988A Cover picture: Bertil Bernhardsson och Esbjörn Strid Published by VTI, 2018
VTI rapport 988A
Abstract The Swedish government has commissioned VTI to review current knowledge of the external costs for all modes of transport. This report is the third part of the government commission (Samkost 3), it addresses sea transports where the access to data and the knowledge level is generally lower than for the land-based modes. One finding in the government commission 2016 (Samkost 2) was that the possibilities to apply the external cost estimates for pricing are rather limited in the existing organizational structures. This report comprises two parts. Part 1 addresses the organization models of piloting and icebreaking in Denmark, Finland, Norway and Sweden. The Nordic countries have chosen different organization models to provide these services that can influence the capacity and service levels, the cost structure, the cost effectiveness and the pricing of the services. Part 2 updates the costs of pilot and icebreaking services and the external costs related to traffic safety, greenhouse gases and air pollution caused by sea transports in Swedish waters from Samkost 2 (2014 prices and valuations) to Samkost 3 (2017 prices and valuations). The calculated total external costs per year are lower in Samkost 3 than in Samkost 2: about five percent in the low alternative and about ten percent in the high alternative. This implies that the internalization is about 100 percent which is higher than in Samkost 2. The external costs caused by the transports in international waters are probably are internalized to a low extent and national and international policies are needed to reach e.g. national and international climate objectives.
Title: Organization of pilot and icebreaking in the Nordic countries and update of the external costs of sea transports in Sweden - A report in Samkost 3
Author: Inge Vierth (VTI, www.orcid.org/0000-0001-6401-6536)
Publisher: Swedish National Road and Transport Research Institute (VTI) www.vti.se
Publication No.: VTI rapport 988A
Published: 2018
Reg. No., VTI: 2017/0367-7.4
ISSN: 0347–6030
Project: MC3 SAMKOST-SJÖ
Commissioned by: Swedish Government
Keywords: External costs, sea transport, internalization, pilotage, icebreaking
Language: English
No. of pages: 78
VTI rapport 988A
Referat Regeringen har bett VTI att se över den aktuella kunskapen om de externa kostnaderna för samtliga trafikslag. Denna rapport ingår i den tredje etappen av regeringsuppdraget (Samkost 3). Rapporten behandlar sjötransporter där tillgången till data och kunskapsnivån i allmänhet är lägre än för de landbaserade trafikslagen. En slutsats i Samkost 2 (år 2016) var att möjligheterna att tillämpa de beräknade externa kostnaderna för prissättningen är tämligen begränsade i de befintliga organisations-strukturerna. Denna rapport består av två delar. Del 1 jämför organisationsmodellerna för lotsning och isbrytning i Danmark, Finland, Norge och Sverige. De nordiska länderna har valt olika modeller för att tillhandahålla lots- och inbrytningstjänster, vilket kan påverka kapacitet och servicenivån, kostnads-strukturen, kostnadseffektiviteten och prissättningen av tjänsterna. Del 2 uppdaterar (infrastruktur)-kostnaderna för lotsning och isbrytning och de externa kostnaderna avseende trafiksäkerhet, växthusgaser och luftföroreningar som orsakas av sjötransporter på Sveriges sjöterritorium från Samkost 2 (2014 års priser och värderingar användes) till Samkost 3 (2017 års priser och värderingar används). De beräknade totala årliga externa kostnaderna är lägre i Samkost 3 än i Samkost 2: ca fem procent i det lågalternativet och ca tio procent i högalternativet. Detta innebär att internaliserings-graden för sjöfart på svenskt sjöterritorium är ungefär 100 procent, vilket är högre än i Samkost 2. Transporterna på internationellt vatten troligtvis har en låg internaliseringsgrad och det krävs både nationella och internationella styrmedel för att uppnå t.ex. uppsatta nationella och internationella klimatmål.
Titel: Organisation av lotsning och isbrytning i de nordiska länderna och uppdatering av sjötransporternas samhällsekonomiska kostnader i Sverige – en delrapport inom Samkost 3
Författare: Inge Vierth (VTI, www.orcid.org/0000-0001-6401-6536)
Utgivare: VTI, Statens väg och transportforskningsinstitut www.vti.se
Serie och nr: VTI rapport 988A
Utgivningsår: 2018
VTI:s diarienr: 2017/0367-7.4
ISSN: 0347–6030
Projektnamn: MC3 SAMKOST-SJÖ
Uppdragsgivare: Regeringen
Nyckelord: Externa kostnader, sjötransporter, internalisering, lotsning, isbrytning
Språk: Engelska
Antal sidor: 78
VTI rapport 988A
Preface This report is a deliverable within the government commission on the estimation of the costs related to the use of the infrastructure and the external costs and their impacts (Regeringskansliet (2017)) and addresses sea transports. It comprises two parts.
The first part compares the organization of the piloting and icebreaking services in the Nordic countries based on country reports from Jørgen Jordal-Jørgensen (COWI) for Denmark, Juha Tervonen (JT-con) for Finland and Kenneth Løvold Rødseth (TØI) for Norway and our previous report (Vierth, 2016) for Sweden. Henrik Swahn (HSAB) has contributed with comments to an earlier version of this part.
The second part updates the costs of pilot and icebreaking services and the external costs caused by sea transports in (Vierth, 2016). Axel Hörteborn and Fredrik Olsson (SSPA) have improved the input-data regarding sailed kilometres and fuel consumption. Tobias Lindé and Inge Vierth (both VTI) have revised the calculation of the different components of the costs.
Thanks to Peter Andersson (Linköping university) for constructive and detailed comments on an earlier version of this report.
Stockholm, November 2018
Inge Vierth Project leader
VTI rapport 988A
Quality review Review seminar was carried out on 13 September 2018 where Taneli Antikainen from the Finish Transport Agency reviewed and commented on the report. Author Inge Vierth has made alterations to the final manuscript of the report. The research director Mattias Haraldsson examined and approved the report for publication on 8 October 2018. The conclusions and recommendations expressed are the author’s and do not necessarily reflect VTI’s opinion as an authority.
Kvalitetsgranskning Granskningsseminarium har genomförts 13 september 2018 där Taneli Antikainen från Finska Trafikverket var lektör. Författaren Inge Vierth har genomfört justeringar av slutligt rapportmanus. Forskningschef Mattias Haraldsson har därefter granskat och godkänt publikationen för publicering 8 oktober 2018. De slutsatser och rekommendationer som uttrycks är författarens egna och speglar inte nödvändigtvis myndigheten VTI:s uppfattning.
VTI rapport 988A
Table of content
Summary .................................................................................................................................................9
Sammanfattning ...................................................................................................................................13
1. Structure of the report ....................................................................................................................17
2. Part 1: Organization of pilot and icebreaking in the Nordic countries ......................................18
2.1. Introduction ................................................................................................................................18 2.2. Organization, demand and costs of pilot services ......................................................................19
2.2.1. Denmark ................................................................................................................................19 2.2.2. Finland ..................................................................................................................................22 2.2.3. Norway ..................................................................................................................................25 2.2.4. Sweden ..................................................................................................................................29 2.2.5. Comparative analysis ............................................................................................................31
2.3. Organization, demand and costs of icebreaking services ...........................................................35 2.3.1. Denmark ................................................................................................................................35 2.3.2. Finland ..................................................................................................................................37 2.3.3. Norway ..................................................................................................................................40 2.3.4. Sweden ..................................................................................................................................41 2.3.5. Comparative analysis ............................................................................................................43
2.4. Conclusions ................................................................................................................................45
3. Part 2: Update of Swedish external costs related to sea transports ............................................47
3.1. Introduction ................................................................................................................................47 3.2. Vessel-kilometres and fuel consumption ...................................................................................47
3.2.1. Vessel-kilometres ..................................................................................................................48 3.2.2. Fuel consumption ..................................................................................................................51 3.2.3. International reporting ..........................................................................................................56
3.3. Update of external costs .............................................................................................................57 3.3.1. Greenhouse gases ..................................................................................................................57 3.3.2. Air pollution ..........................................................................................................................60 3.3.3. Traffic safety .........................................................................................................................61 3.3.4. Piloting ..................................................................................................................................64 3.3.5. Icebreaking ............................................................................................................................65
3.4. Internalization ............................................................................................................................66 3.4.1. Pilot fees and fairway dues ...................................................................................................66 3.4.2. Internalization per year .........................................................................................................67 3.4.3. Internalization for piloting ....................................................................................................68 3.4.4. Internalization per vessel type ..............................................................................................69
3.5. Conclusions ................................................................................................................................70
4. Overall conclusions .........................................................................................................................72
References .............................................................................................................................................75
Annex 1 ..................................................................................................................................................79
Annex 2 ..................................................................................................................................................89
Annex 3 ................................................................................................................................................103

VTI rapport 988A
VTI rapport 988A 9
Summary
Organization of pilot and icebreaking in the Nordic countries and update of the external costs of sea transports in Sweden – a report in Samkost 3
Inge Vierth (VTI)
Sweden is the only Nordic country that calculates the external costs caused by transports in a systematic way with the objective to provide a platform for implementing a welfare enhancing policy for pricing infrastructure. The Swedish government has commissioned VTI to review current knowledge of the external costs for all modes of transport. This report is the third part of the government commission (Samkost 3).
This report addresses sea transports where the access to data and the knowledge level is generally lower than for the land-based modes. The same is true for air transports. Sea and air transports are also to a high extent global and the responsibility for many policy measures lies on the international level.
One finding in the government commission 2016 (Samkost 2) was that the possibilities to apply the external cost estimates for pricing are rather limited in the existing organizational structures. Hence, this report comprises two parts: (1) the organizational aspects regarding the provision of the pilot and icebreaking services and (2) an update of the external costs that were presented in Samkost 2.
Part 1 addresses the organization models of piloting and icebreaking in Denmark, Finland, Norway and Sweden. The Nordic countries have chosen different organization models to provide these services that can influence the capacity and service levels, the cost structure, the cost effectiveness and the pricing of the services.
The most important providers of pilot services are state bodies, that have monopolies. The Danish system is in a process towards full privatisation in 2020. The overall reduction in the number of pilot services is assumed to continue and can be reinforced by the application of computer-based information systems and the integration of pilot services, vessel information and traffic control services.
Due to different geographical and weather conditions, the volume of icebreaking services differs a lot between Finland and Sweden on the one side and Norway and Denmark on the other side. The costs for the provision of the services are over 30 times higher in Sweden and Finland. All countries except Sweden, have outsourced a major part of the provision of icebreaking services to state-owned or private companies. Denmark is the only country that has icebreaking fees; the other countries fund icebreaking services via fairway dues, pilot fees or other fees. In harsh winters, typically state grants are awarded to cover cost overruns.
The Swedish Maritime Administration and the Norwegian Coastal Administration are responsible for both pilot and icebreaking services while different authorities are in charge in the other two countries. In Finland, the Transport Safety Agency is responsible for pilot services and the Finish Transport Agency, that is comparable to the Swedish Transport Administration for icebreaking services. In Denmark, the Maritime Authority controls the pilot services for regional transports and the International Maritime Organization (IMO) those related to transit transports; the Ministry of Defence and the Icebreaking Council are responsible for icebreaking.
The service levels targets differ somewhat between the Nordic countries and it would be interesting to study the distribution of the waiting time and costs between the pilot and icebreaking service providers on the one side and the vessel operator/shippers on the other side, and to investigate the optimal service levels for society.
10 VTI rapport 988A
Part 2 updates the costs of pilot and icebreaking services and the external costs related to traffic safety, greenhouse gases (GHG) and air pollution caused by sea transports in Swedish waters from Samkost 2 (2014 prices and valuations) to Samkost 3 (2017 prices and valuations).
As in Samkost 2, SSPA calculated the vessel-kilometres and fuel consumption for the vessel propulsion in 2015 for eight different vessel types on behalf of VTI. The calculations of the vessel-kilometres are based on AIS-data (Automatic Identification System). Samkost 3 considers, in contrast to Samkost 2, where it was assumed that all vessels use MGO (Marine Gasoil), the mix of the different fuel types and their distribution over the vessel types. The calculations in Samkost 3 also consider the impact of the bottom topography on the fuel consumption in more detail. Vessels in transit, that were included by mistake in Samkost 2, are excluded.
These changes imply 36 percent fewer vessel-kilometres and 40 percent lower fuel consumption in Samkost 3 than in Samkost 2. Due to different assumed delimitations (e.g. inclusion of the fuel that is used for help machines or not) and calculation methods, there are large differences (up to factor 2.6) between the fuel consumption for national sea transports calculated by the Swedish Energy Agency (SEA) and Statistics Sweden (SCB) or the Swedish Meteorological and Hydrological Institute (SMHI).
Since January,1 2018, the EU requires monitoring of CO2 emissions from sea transports. All intra-Union voyages, all incoming voyages from the last non-Union port to the first Union port of call and all outgoing voyages from a Union port to the next non-Union port of call are considered. The companies shall monitor the following parameters for vessels of 5,000 GT (gross tonnage) and above: port of departure and port of arrival, amount and emission factor for each type of fuel consumed, CO2 emitted, distance travelled, time spent at sea, cargo carried and transport work. The IMO has decided to introduce a similar system from January 1, 2019. Information collected based on these systems can hopefully be used in future analyses.
The calculation of the external costs of GHG and air pollution is based on the fuel consumption presented above. Regarding monetary valuations, Samkost 3 uses the value of SEK 1.14 per kilogram CO2 or CO2 equivalent for all modes. This value corresponds to the Swedish CO2-tax; the Samkost 2 report for sea transports applied half the value of SEK 0.66 per kilogram which corresponded to half the CO2-tax.
The external costs of air pollution at the regional level are as in Samkost 2 calculated applying the Impact Pathway approach. The costs are presented for a low alternative, that includes calculated health costs due to the exposure of secondary particles, and a high alternative, that also includes damage costs related to acidification, eutrophication and ozone based on expert judgements.
The calculation of the external costs of traffic safety is, as in Samkost 2, based on the average number of killed and injured persons, excluding accidents related to loading/unloading in ports (landside), work accidents on board as well as people that die due to illnesses or suicide. Personal damages are assumed not to be internalized and valued by the of the Swedish Transport Administration recommended monetary valuations. Material damages are assumed to be internalized via insurances.
The costs for the provision of the pilot and icebreaking services and the costs of GHG and air pollution caused by these services are updated by applying the costs presented in Samkost 2. Regarding the production costs for icebreaking, a report published by Trafikanalys in 2017 has led to the conclusion that the low alternative presented in Samkost 2 is more realistic than the high alternative.
The calculated total external costs per year are lower in Samkost 3 than in Samkost 2: about five percent in the low alternative and about ten percent in the high alternative. This implies that the internalization is about 100 percent (108 percent in low alternative, 96 percent in high alternative) which is higher than in Samkost 2 and much higher than in Trafikanalys’ reports 2016 and 2018.

VTI rapport 988A 11
The information can be used to compare the level of internalisation between the modes. However, the result that the external costs of sea transports are totally internalized does not mean that a shift from the land-based modes (the have lower degrees of internalization) to sea would reduce all external costs. It is important to remember that the external costs are calculated for the transports in Swedish waters and that a high share of the vessel-kilometres related to Swedish passenger- and freight transports are performed outside Swedish waters and that the external costs caused by the transports in international waters are probably internalized to a low extent. National and international policy instruments and measures are needed to reach e.g. national and international climate objectives.
Ideally the annual costs should be calculated for the different components: GHG, air pollution, traffic safety, piloting and icebreaking and as marginal costs, e.g. per additional vessel-kilometre or litre fuel consumed. A similar system is used for rail track fees. The actual sea transport fees have to cover the costs of the Swedish Transport Administration and are not designed in a way that they take into account the vessels’ fuel consumption (pilot fees and fairway dues are differentiated according to the size of the vessels) and the sailed distance (pilot fees are differentiated according to the time that is used).
The revenues from pilot fees are about three times higher than the calculated costs of piloting; this means that pilot fees based on these costs would not cover the costs of the Swedish Maritime Administration and that additonal funding would be needed. The revenues from fairway dues are calculated to cover the external costs for GHG, air pollution, traffic safety and icebreaking to 71 - 81 percent. The internalisation is generally higher than the average for larger vessels (tankers and roro-vessels) and lower for smaller vessels (ropax- and general cargo vessels).
For all vessel types except ropax vessels the pilot fees and fairway dues are calculated to cover the costs till 100 percent or more. However, our simple calculations can overestimate the external costs of GNG and air pollution as the use of different new technologies is not modelled at a detailed level and that the share of these technologies is increasing. A possible explanation on the revenue side is that the vessel-part of the fairway dues is designed so that ro-pax ferries get compared to the other vessel types high discounts when they make a high numbers of calls per month. This information can be used as basis for pricing and other policies; however, the exact figures must be interpreted with caution and more in-depth analysis is needed.

12 VTI rapport 988A
VTI rapport 988A 13
Sammanfattning
Organisation av lotsning och isbrytning i de nordiska länderna och uppdatering av sjötransporternas externa kostnader i Sverige - en delrapport inom Samkost 3
av Inge Vierth (VTI)
Sverige är det enda nordiska land som beräknar trafikens externa kostnader på ett systematiskt sätt. Målet är att skapa en bas för att införa en välfärdsfrämjande politik avseende prissättningen av infrastrukturen. Regeringen har bett VTI att se över den aktuella kunskapen om de externa kostnaderna för samtliga trafikslag. Denna rapport ingår i den tredje etappen av regeringsuppdraget (Samkost 3).
Rapporten behandlar sjötransporter där tillgången till data och kunskapsnivån i allmänhet är lägre än för de landbaserade trafikslagen. Det samma gäller för flygtransporter. Dessutom kännetecknas sjö- och flygtransporter av att vara globala och att ansvaret för många styrmedel ligger på internationell nivå.
En slutsats i Samkost 2 (år 2016) var att möjligheterna att tillämpa de beräknade externa kostnaderna för prissättningen är tämligen begränsade i de befintliga organisationsstrukturerna. Därför består denna rapport av två delar; den första behandlar de organisatoriska aspekterna när det gäller tillhandahållandet av lots- och isbrytningstjänster och den andra delen innehåller en uppdatering av de externa kostnader som presenterades i Samkost 2.
Del 1 jämför organisationsmodellerna för lotsning och isbrytning i Danmark, Finland, Norge och Sverige. De nordiska länderna har valt olika modeller för att tillhandahålla lots- och inbrytningstjänster, vilket kan påverka kapacitet och servicenivån, kostnadsstrukturen, kostnadseffektiviteten och prissättningen av tjänsterna.
De viktigaste leverantörerna av lotstjänster är statliga organ som har monopol. Det danska systemet är i en process mot en fullständig privatisering 2020. Den övergripande minskningen av antalet lotstjänster antas fortsätta och kan förstärkas genom tillämpningen av datorbaserade informationssystem och integreringen av lotstjänsterna med tjänsterna som rör fartygsinformation och trafikkontroll.
På grund av olika geografiska och väderförhållanden skiljer sig isbrytningens omfattning mycket mellan Finland och Sverige å ena sidan och Norge och Danmark å andra sidan. Kostnaderna för tillhandahållandet av tjänsterna är över 30 gånger högre i Sverige och Finland. Alla länder förutom Sverige har outsourcat en stor del av isbrytningen till statliga eller privata företag. Danmark är det enda land som har ”isbrytningsavgifter”; de andra länderna finansierar isbrytningen via farleds-, lots- eller andra avgifter. Under hårda vintrar, bidrar ofta staten till att täcka kostnaderna.
Det svenska Sjöfartsverket och det norska Kystverket ansvarar för både lots- och isbrytningstjänster medan olika myndigheter är ansvariga för lotsning respektive isbrytning i de två andra länderna. I Finland ansvarar säkerhetsmyndigheten för lotsningen och Trafikverket för isbrytningen. I Danmark kontrollerar sjöfartsmyndigheten lotsningen för regionala transporter medan IMO (Internationella sjöfartsorganisationen) ansvarar för transittransporter; försvarsministeriet och isbrytningsrådet har ansvar för isbrytningen.
Servicenivåerna som ska garanteras skiljer sig något mellan de nordiska länderna och det skulle vara intressant att studera hur väntetiden och kostnaderna fördelas mellan aktörerna som tillhandahåller lots- och isbrytningstjänster å ena sidan och fartygsoperatören och godstransportköpare å andra sidan för att identifiera de för samhället optimala servicenivåerna.
Del 2 uppdaterar (infrastruktur) kostnaderna för lotsning och isbrytning och de externa kostnaderna avseende trafiksäkerhet, växthusgaser och luftföroreningar som orsakas av sjötransporter på Sveriges

14 VTI rapport 988A
sjöterritorium från Samkost 2 (där 2014 års priser och värderingar användes) till Samkost 3 (där 2017 års priser och värderingar används).
Som i Samkost 2, anlitades SSPA för att beräkna seglade kilometer och bränsleförbrukning för framdrivningen av fartyget år 2015 uppdelat på åtta olika fartygstyper. Fartygskilometrarna beräknas baserade på AIS-data (Automatic Identification System). Till skillnad från Samkost 2, där det antogs att samtliga fartyg använder MGO (Marin Gasoil) används i Samkost 3 information om att olika bränsletyper används av åtta fartygstyperna. Beräkningarna beaktar även bottentopografins effekter på bränsleförbrukningen mer i detalj. Dessutom exkluderas transitfartyg, som av misstag inkluderades i Samkost 2 i beräkningarna.
Sammanlagt innebär ändringarna 36 procent färre fartygskilometer och 40 procent lägre bränsleförbrukning för framdrivningen år 2015 i Samkost 3 än i Samkost 2. På grund av olika avgränsningar (t ex inkludering av bränsle som används av hjälpmaskiner eller inte) och olika beräkningsmetoder finns även stora skillnader (upp till faktor 2,6) mellan den av Energimyndigheten och SCB respektive SMHI beräknade bränsleförbrukningen för de nationella sjötransporterna.
Sedan 1 januari 2018 kräver EU rapportering av sjöfartens CO2 emissioner för alla resor inom Unionen, alla inkommande resor från den sista hamnen utanför Unionen till den första anlöpshamnen i Unionen och alla utgående resor från en EU-hamn till nästa anlöpshamn som inte är i Unionen. Redarna ska registrera följande parametrar för fartyg med 5 000 GT (bruttodräktighet) eller mer: avgångshamn och ankomsthamn, mängd och emissionsfaktor för varje typ av bränsle som förbrukas, CO2 emissioner, seglad sträcka, tid till sjöss, transporterad gods och transportarbete. IMO har beslutat att införa ett liknande system från 1 januari 2019. Information som samlas in utifrån dessa system kan förhoppningsvis användas i framtida analyser.
Beräkningen av de externa kostnaderna relaterade till växthusgaser och luftföroreningar baseras på den ovan presenterade bränsleförbrukningen. När det gäller monetära värderingar används i Samkost 3 värdet av 1,14 kronor per kilogram CO2 eller CO2 för samtliga trafikslag; detta värde motsvarar den svenska CO2-skatten. Samkost 2-rapporten för sjötransporter använde 0,66 kronor per kilogram motsvarande halva CO2-skatten.
Kostnaderna för luftföroreningar (på regional nivå) beräknas som i Samkost 2 genom att tillämpa ”Impact Pathway” ansatsen. Kostnaderna redovisas både för ett lågt alternativ, som inkluderar beräkningen av hälsokostnaderna på grund av exponering av sekundära partiklar, och ett högt alternativ, som därutöver inkluderar kostnader relaterade till försurning, övergödning och ozon som baseras på expertbedömningar.
Beräkningen av de externa kostnaderna för trafiksäkerhet baseras, som i Samkost 2, på det på handelsfartyg genomsnittliga antalet dödade och skadade. Olyckor som sker i samband med lastning och lossning i hamnar (landsidan), arbetsolyckor ombord och dödsfall på grund av sjukdomar och självmord exkluderas. Personskador antas inte vara internaliserade och värderas med de av Trafikverket rekommenderade monetära värderingar. Materiella skador antas vara internaliserade via försäkringar.
Kostnaderna för tillhandahållandet av lots-och isbrytningstjänster och för växthusgaser och luftföroreningar som orsakas av dessa tjänster, beräknas genom att uppdatera uppgifterna i Samkost 2. När det gäller kostnaderna för tillhandahållandet av isbrytningstjänster leder en rapport publicerad av Trafikanalys i 2017 till att det låga kostnadsalternativet i Samkost 2 används eftersom detta anses som mer realistiskt än det höga alternativet.
De beräknade totala årliga externa kostnaderna är lägre i Samkost 3 än i Samkost 2: ca fem procent i det lågalternativet och ca tio procent i högalternativet. Detta innebär att internaliseringsgraden för sjöfart på svenskt sjöterritorium är ungefär 100 procent (108 procent i lågalternativ, 96 procent i
VTI rapport 988A 15
högalternativ) vilket är högre än i Samkost 2 och mycket högre än i Trafikanalys rapporter 2016 och 2018.
Denna information kan användas för att jämföra internaliseringsgraden på Sveriges territorium mellan de olika trafikslagen. Att de externa kostnaderna för sjötransporter på svenskt sjöterritorium täcks av intäkterna från lots- och farledsavgifterna innebär dock inte en överflyttning från de landbaserade trafikslagen (som har lägre internaliseringsgrader) till sjötransporter skulle minska de samlade externa kostnaderna. Det är viktigt att komma ihåg att en stor andel av fartygskilometrarna som är relaterade till svenska person- och godstransporter utförs utanför Sveriges territorium och att de externa kostnaderna av transporterna som genomförs på internationellt vatten troligtvis har en låg internaliseringsgrad. Det krävs både nationella och internationella styrmedel och åtgärder för att uppnå t ex uppsatta nationella och internationella klimatmål.
Idealt bör de årliga externa kostnaderna anges för de olika komponenterna växthusgaser, luftföroreningar, trafiksäkerhet, lotsning och isbrytning och marginalkostnader, exempelvis per ytterligare fartygskilometer eller förbrukad liter bränsle. Motsvarande system används för banavgifter. Dagens sjöfartsavgifter har krav att täcka Sjöfartsverkets kostnader och beaktar endast i begränsad omfattning fartygens bränsleförbrukning (lots- och farledsavgifter differentieras efter fartygens storlek) och seglade kilometrar (lotsavgifter differentieras efter använd tid).
Intäkterna från lotsavgifterna är ungefär tre gånger högre än de än beräknade (marginal)kostnaderna för lotsning; detta innebär att lotsavgifterna baserade på dessa kostnader inte skulle täcka Sjöfartsverkets kostnader och att ytterligare finansiering skulle behövas. Intäkterna från farledsavgifterna beräknas täcka de beräknade kostnader för växthusgaser, luftföroreningar, trafiksäkerhet och isbrytning till 71–81 procent. Internaliseringsgraden ligger generellt över genomsnittet för större fartyg (tank- och roro-fartyg) och under genomsnittet för mindre fartyg (ropax-och general cargo fartyg).
För samtliga fartygstyper förutom ropax-fartyg beräknas lots-och farledsavgifterna täcka 100 procent eller mer än de beräknade kostnaderna. Våra relativt enkla beräkningar kan dock överskatta de externa kostnaderna för växthusgaser och luftföroreningar eftersom användningen av olika nya motorer och bränslen inte beaktas på ett detaljerat sätt (och deras andel ökar). En möjlig förklaring på intäktssidan är att farledsavgiftens fartygsdel är så utformad att ro-pax fartyg får, jämfört med de andra fartygstyperna, relativt höga rabatter om de har många anlöp per månad. Denna typ av information kan användas som grund för prissättningen och andra styrmedel; de exakta siffrorna bör dock tolkas med försiktighet och mer djupgående analyser behövs.

16 VTI rapport 988A

VTI rapport 988A 17
1. Structure of the report The Swedish government has commissioned VTI to review current knowledge of the external costs for all modes of transport. Social marginal costs comprise (1) costs for the use of vehicles and vessels, (2) costs related to the use of the state-owned infrastructure and (3) external costs related to e.g. accidents, greenhouse gases (GHG) and air pollution. The first component is usually already internalized, and focus is on the latter two components.
The first and second part of the government commission focused on the estimation of the external costs related to the use of the infrastructure and the external costs, see the summarizing report for all modes, (Nilsson & Haraldsson, 2016) while the third part emphasizes policies to internalise the external costs and impact analyses, (Regeringskansliet, 2017). The government has instructed VTI to continue developing and updating the knowledge about the external costs caused by passenger and freight transports with all modes. Focus should be on air and sea transports as the knowledge about the external costs is lowest for these modes. The government has not specified how the results should be applied. Sweden is the only Nordic country that calculates the external costs in a systematic way with the objective to provide a platform for implementing a welfare enhancing policy for pricing infrastructure, (Nilsson et al.,2018).
Regarding sea transports, Mellin & Creutzer (2014) identify the relevant cost components. (Vierth, 2016) estimates the costs based on data from the automatic identification system (AIS) for vessels, the national accident database and the Swedish Maritime Administration’s costs for piloting and icebreaking and finds that the possibilities to apply the cost estimates for pricing are limited in the existing organizational structures.
Marginal costs are typically as the costs additional caused by an additional vehicle-km or vessel-kilometre or additional liter fuel used, which implies that marginal costs of GHG and air pollution can be calculated based on the fuel that is consumed. Marginal costs related to accidents can be calculated based on the sailed kilometers. Both for the costs of GHG and air pollution and traffic safety it needs to be specified which vessel-kilometres in which waters are included1. External costs related to piloting and icebreaking are the most important costs related to the use of the infrastructure, but not all vessels make use of pilot and icebreaking services. Below we calculate the external costs caused by sea transports and when possible the marginal external costs.
This report studies the external costs caused by sea transports in Sweden and comprises two parts
• Chapter 2 addresses the use of the maritime infrastructure, namely the costs of the piloting and icebreaking services. Denmark, Finland, Norway and Sweden have chosen different organization models to provide these services. The different models can influence the capacity and service levels, the cost structure, the cost effectiveness and the pricing of the services, e.g. based on marginal costs, full costs or profit maximizing. These aspects are addressed in an international comparison; needs for further research and data collection are identified.
• Chapter 3 updates the external costs of pilot and icebreaking services and the external costs caused by sea transports in (Vierth, 2016). It is also analysed to what extent the costs are covered by pilot fees and fairway dues. Needs for further research and data collection are identified.
Finally, some overall conclusions are drawn, and possible ways ahead are discussed in chapter 4.
1 See 3.1 and 3.2.
18 VTI rapport 988A
2. Part 1: Organization of pilot and icebreaking in the Nordic countries
2.1. Introduction The external marginal costs related to the infrastructure (per se) differ between the modes. Costs for wear and tear that are e.g. the main costs for the land-based modes are of limited importance for sea transports. Costs related to the provision of pilot and icebreaking services are the most important infrastructure related external marginal costs for sea transports.
In Sweden, pilot services advanced since the year 1500 from a source of extra income for fishermen and archipelago farmers to a modern profession. There was also a development from services used by navy ships to services used by the commercial maritime sector. The overall objective is to guarantee that vessels can sail safely in all fairways. Today, Denmark, Finland, Norway and Sweden have regulations that make it mandatory for vessels over a certain size to use a pilot in certain fairways. The extent of icebreaking services is, like the winter maintenance services of the land-based infrastructure, only necessary at certain times and in certain places and largely dependent on factors that the authorities and vessel operators cannot control.
The conditions for the provision of the pilot and icebreaking services can generally be described by the following points:
• the short-term and long-term demand (number, type and size of vessels) for the pilot and icebreaking services is not known beforehand. Demand is influenced by external factors (short-term fluctuations in demand, economic cycles, intermodal competition, weather conditions, access to technologies etc.) as well as regulations regarding e.g. pilot duties and required ice classes for vessels
• conditions differ between different regions and fairways and the organization/funding of the pilot and icebreaking services is in some cases used as regional policy or business policy instrument
• the service level for the pilot and icebreaking services needs to be specified
• the pilot and icebreaking services should be produced in a cost-effective way. This means e.g. that scale and/or scope economies in the production of the pilot and icebreaking services should be exploited.
• new technologies and services are developed and should be used to achieve a safe, environmentally friendly and cost-effective production of the services.
The bullet points above imply that pilot and icebreaking services can be organized in different ways: (i) be carried out by public agencies, public enterprises or private companies, (ii) be carried out by a monopoly or by companies that are selected in a tendering process or contracted directly2 and (iii) be organized for different geographical areas etc. The conditions differ also between pilot viz icebreaking services and different organization models can be chosen for these services.
Purpose and issues
The four Nordic countries organize the provision of the pilot and icebreaking services in different ways. Based on these examples we discuss whether and how the choice of organization model affects the service level, the cost structure and level (marginal costs vs fixed costs), the service level, cost
2 Typically, these services are produced applying public or public/private organization models. However, piloting can to a certain extent be carried out by the crew members on private vessels.

VTI rapport 988A 19
efficiency and pricing. The analysis is mainly descriptive and the need for further research and data collection is identified.
Approach
VTI commissioned researchers from Finland, Norway and Denmark to develop the aspects above for their countries: Jørgen Jordal-Jørgensen’s report for Denmark is presented in Annex 1, Juha Tervonen’s report for Finland report is presented in Annex 2 and Kenneth Løvold Rødseth’s report for Norway is presented in Annex 3 The information for Sweden is based on (Vierth, 2016) and actual data from the Swedish Maritime Administration. International co-operation issues that are of special relevance for icebreaking services are not discussed in detail.
Section 2.2 covers pilot services. Organization (incl. regulations and long-term planning), service providers, demand, production costs and cost coverage/funding of the services in the four Nordic countries are described and compared. This is done based on the points above. Section 2.3 addresses icebreaking services and applies the same structure as section 2.3. Section 2.4 concludes chapter 2.
2.2. Organization, demand and costs of pilot services
2.2.1. Denmark Denmark has two types of regulations for pilot services:
• In the international waters piloting is regulated by the International Maritime Organization (IMO). To comply with the IMO-recommendations vessels should use a pilot when transiting3 internal and external Danish waters through the passage Skagen - Gedser/Route T (all vessels with a draught of eleven metres or more, vessels carrying highly radioactive material) and the Sound (loaded oil tankers with a draught of seven metres or more, loaded chemical tankers irrespective of size and gas carriers irrespective of size, vessels carrying -highly radio-active material).
• Furthermore, it is mandatory to use a pilot for vessels passing to or from Danish ports and anchorage in Danish waters according to the Danish Pilotage Act (the last update was in 2014) if the vessels carry oil or have uncleaned cargo tanks that have not been rendered safe with inert gas, carry chemicals, carry gases, have more than 5,000 tonnes bunker oil onboard or are carrying highly radioactive material. The Danish Maritime Authority is responsible for these regulations.
Figure 1 shows the piloting areas in Denmark. The green lines are the routes where the IMO regulation is relevant.
3 passage without calling Danish port or anchorage

20 VTI rapport 988A
Figure 1 Piloting routes in Denmark.
Service providers
The Danish organization model goes towards an open market for the provisions of the pilot services. The Act on DanPilot from 2013 transforms the governmental pilot service provider DanPilot to an independent public enterprise with its own Board of Directors and independent economy. Today, DanPilot is an independent public enterprise under the Ministry of Business and Growth, with the Danish Maritime Administration as the supervising authority. There is significant cross subsidization within DanPilot of regional pilot services from the transit pilot services, which makes it difficult for small players to enter the market. After the year 2020, DanPilot will no longer be part of the administrative hierarchy of the Danish state.
DanPilot handles all transit pilot services and is obliged to deliver regional pilot services in Denmark. About 55 percent of DanPilot’s services in 2016 were transit services (see green lines in Figure 1) and about 45 percent regional services to/from Danish ports. DanPilot's fleet consists of 29 pilot boats providing pilot services from in total 22 pilot stations.
Beyond DanPilot, the private company Danish Pilot Service (DPS) provide pilot services (with 16 pilots). Although the market for pilot services is already in principle free, there has been limited interest from other players to enter the market. Jørgen Jordal-Jørgensen has calculated the market shares 2016 based on the labour costs that are presented in the annual reports; DanPilot’s market share was 94 percent and DPS’s share six percent.
Demand
Table 1 reveals that the number of pilot services that were carried out in Denmark increased by about 23 percent between 2010 and 2016. One explanation for this growth is the overall growth of sea transports in Danish waters mainly due to increased shipping of oil from Russian oil terminals in the Baltic Sea (Shippingwatch, 2015). However, the share of vessels that use pilot services on the route Gedser – Skagen decreased from 91 percent in 2013 to 81 percent in 2017 (Shippingwatch, 2018).

VTI rapport 988A 21
Table 1 Number of DanPilot’s of pilot services per year 2010-2016.
Year 2010 2011 2012 2013 2014 2015 2016
Number of pilot services 18,471 19,344 18,949 21,065 22,082 22,715 22,660
Source: DanPilot (annual reports)
Service level
Vessels requesting pilot services to transit waters shall provide DanPilot with a notice 18 hour prior to the vessel’s arrival at the pilot boarding point. Vessels requesting pilot services to call at Danish ports shall provide DanPilot with a notice 24 hour prior to the vessel’s arrival at the boarding point. Vessels requesting pilot services to depart from a Danish port shall provide DanPilot with a notice four hour prior to the vessel’s departure.
Costs
DanPilot’s costs for providing the pilot services were about € 54 million in 2015 and 2016. The costs for all staff stand for around 70 percent of all costs. See Table 2.
Table 2 DanPilot’s production costs for pilot services and cost shares 2015 and 2016
2015 2016
Production costs € 53,45 million € 53,73 million
Total labour costs (share) 70% 71%
Other costs (share) 29% 26%
Source: DanPilot, Annual Report 2016
In 2016, DanPilot’s average costs per pilot service were around € 2,371 (based on 22,660 pilot services in Table 1 and the costs presented in Table 2). The costs are proportional to the distance travelled. Since the labour costs constitute the major share of the costs, long distance transit pilot services are more expensive than short distance services. Table 3 shows for some examples how the rates differ. The rates are calculated based on (i) a basic fee: for port pilotages dependent on the firm notice given, and on the nature of operation and for all transit pilotages DKK 4.470, (ii) vessel fee calculated based on the dimensions of the vessel and draft during pilotage, (iii) mileage, a fixed fee per nautical mile sailed, and (iv) travelling expenses, a seven percent charge levied on the above elements, covering the expenses and time associated with the transport of the pilot to/from the vessel.
Table 3 Examples for rates for transit and regional pilot services in Denmark
Type of service Relation and distance Rate
Transit Bornholm – Skagen, 225/45/13, 377 nautical miles € 10,811
Transit Gedser – Skagen, 225/45/13, 278 nautical miles € 8,276
Transit Drogden – Sound, N M1, 225/45/13, 39 nautical miles € 1.948
Regional Port piloting, Nakskov € 805
Source: DanPilot calculator
22 VTI rapport 988A
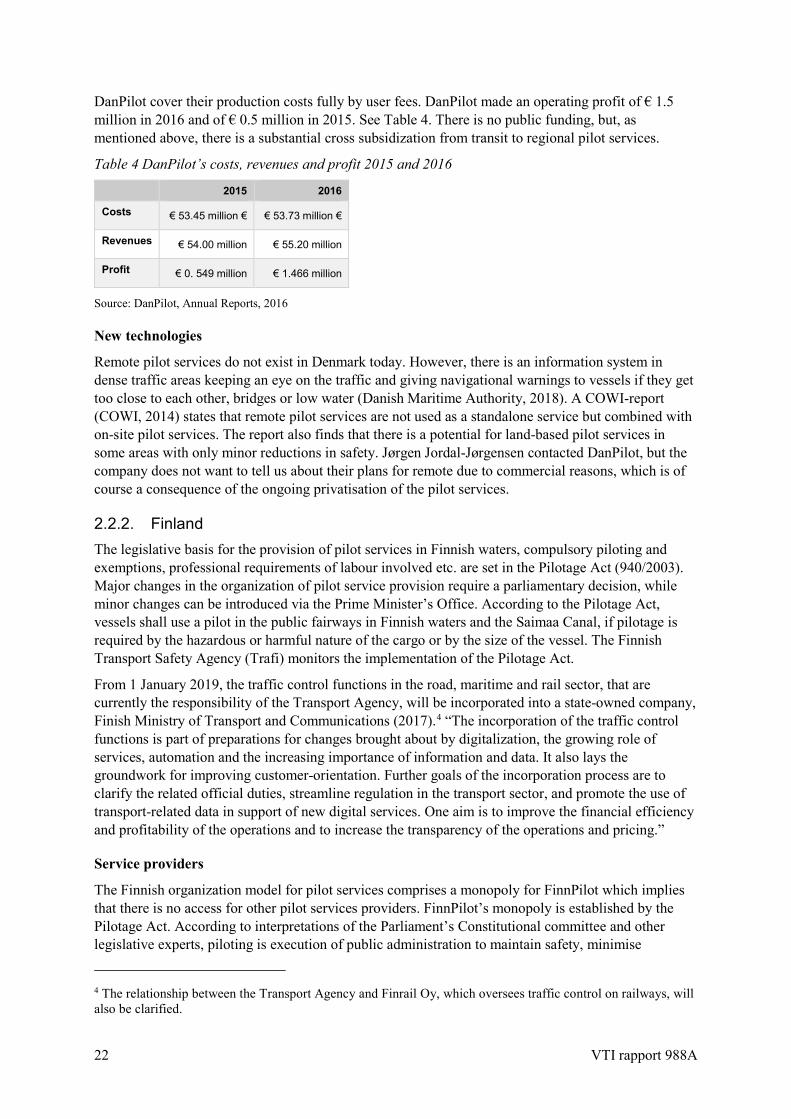
DanPilot cover their production costs fully by user fees. DanPilot made an operating profit of € 1.5 million in 2016 and of € 0.5 million in 2015. See Table 4. There is no public funding, but, as mentioned above, there is a substantial cross subsidization from transit to regional pilot services.
Table 4 DanPilot’s costs, revenues and profit 2015 and 2016
2015 2016
Costs € 53.45 million € € 53.73 million €
Revenues € 54.00 million € 55.20 million
Profit € 0. 549 million € 1.466 million
Source: DanPilot, Annual Reports, 2016
New technologies
Remote pilot services do not exist in Denmark today. However, there is an information system in dense traffic areas keeping an eye on the traffic and giving navigational warnings to vessels if they get too close to each other, bridges or low water (Danish Maritime Authority, 2018). A COWI-report (COWI, 2014) states that remote pilot services are not used as a standalone service but combined with on-site pilot services. The report also finds that there is a potential for land-based pilot services in some areas with only minor reductions in safety. Jørgen Jordal-Jørgensen contacted DanPilot, but the company does not want to tell us about their plans for remote due to commercial reasons, which is of course a consequence of the ongoing privatisation of the pilot services.
2.2.2. Finland The legislative basis for the provision of pilot services in Finnish waters, compulsory piloting and exemptions, professional requirements of labour involved etc. are set in the Pilotage Act (940/2003). Major changes in the organization of pilot service provision require a parliamentary decision, while minor changes can be introduced via the Prime Minister’s Office. According to the Pilotage Act, vessels shall use a pilot in the public fairways in Finnish waters and the Saimaa Canal, if pilotage is required by the hazardous or harmful nature of the cargo or by the size of the vessel. The Finnish Transport Safety Agency (Trafi) monitors the implementation of the Pilotage Act.
From 1 January 2019, the traffic control functions in the road, maritime and rail sector, that are currently the responsibility of the Transport Agency, will be incorporated into a state-owned company, Finish Ministry of Transport and Communications (2017).4 “The incorporation of the traffic control functions is part of preparations for changes brought about by digitalization, the growing role of services, automation and the increasing importance of information and data. It also lays the groundwork for improving customer-orientation. Further goals of the incorporation process are to clarify the related official duties, streamline regulation in the transport sector, and promote the use of transport-related data in support of new digital services. One aim is to improve the financial efficiency and profitability of the operations and to increase the transparency of the operations and pricing.”
Service providers
The Finnish organization model for pilot services comprises a monopoly for FinnPilot which implies that there is no access for other pilot services providers. FinnPilot’s monopoly is established by the Pilotage Act. According to interpretations of the Parliament’s Constitutional committee and other legislative experts, piloting is execution of public administration to maintain safety, minimise
4 The relationship between the Transport Agency and Finrail Oy, which oversees traffic control on railways, will also be clarified.

VTI rapport 988A 23
environmental risks and provide evenly priced services. Therefore, there is no open market for pilot services.
Before 2004, the Finish Maritime Administration was the only provider of pilot services in Finland, from 2004 to 2010 pilot services were provided by another legislatively established state-owned public enterprise. Since 2011, FinnPilot provides pilot services and reports to the Prime Minister’s Office’s Ownership Steering Department. The Pilotage Act requires that the company’s service provision and pricing of services is transparent and available for public reviews. FinnPilot was established because all state-owned public enterprises, that produce goods and services and did not at that time already have the status of a limited liability company5 must operate according to the same laws as private enterprises regarding share capital, independent balance, independent profit and loss accounting. According to the Pilotage Act and the Act on Transforming the State Pilotage Enterprise into a Limited Liability Company (1008/2010), FinnPilot is obligated to offer pilot services and related maritime safety services on all Finnish sea routes and inland routes.
FinnPilot’s monopoly has been challenged from time to time in the public debate. Private companies attempted to enter the market a few years ago, but they were pushed back by legislative fortification of the monopoly. For the time being, there are no parliamentary activities for preparing changes to the Act.
Demand
Table 5 shows that the number of pilot services in the six service areas that are presented in Figure 2 was 23,461 in 2016 (23,996 in 2015). The share of piloted calls of the total number of calls in Finnish coastal ports was 31.9 % in 2016 (32.9% in 2015). The demand for pilot services has declined over the years due to the increase of the number of pilot exemption certificates and this trend is expected to continue. It is also assumed that computer-based information systems like geographical positioning systems (GPS) can reduce the need for traditional piloting services. However, all new procedures and exemptions from the use of piloting service must be incorporated into the Pilotage Act.
Table 5 Number of FinnPilot’s pilot services. Number of piloted vessels
per service area (see Figure 2)
2015 2016
Perämeri (1) – coastal 4,727 4,903
Selkämeri (2) – coastal 3,212 3,170
Saaristomeri (3) – coastal 3,385 3,151
Helsinki (4) – coastal 5,124 5,111
Kotka (5) – coastal 4,203 4,157
Saimaa (6) – inland 3,345 2,969
Total 23,996 23,461
. Source: FinnPilot Pilotage Ltd. Figure 2 Service areas.
5 aktiebolag
24 VTI rapport 988A
Service level
FinnPilot applies a service level target of maximum three hours waiting time on the coast areas and six hours in the Saimaa area. In 2016, the success rate was 99.8% which means that only 47 out of 23,461 piloting instances failed to be delivered according to the time targets.
Costs
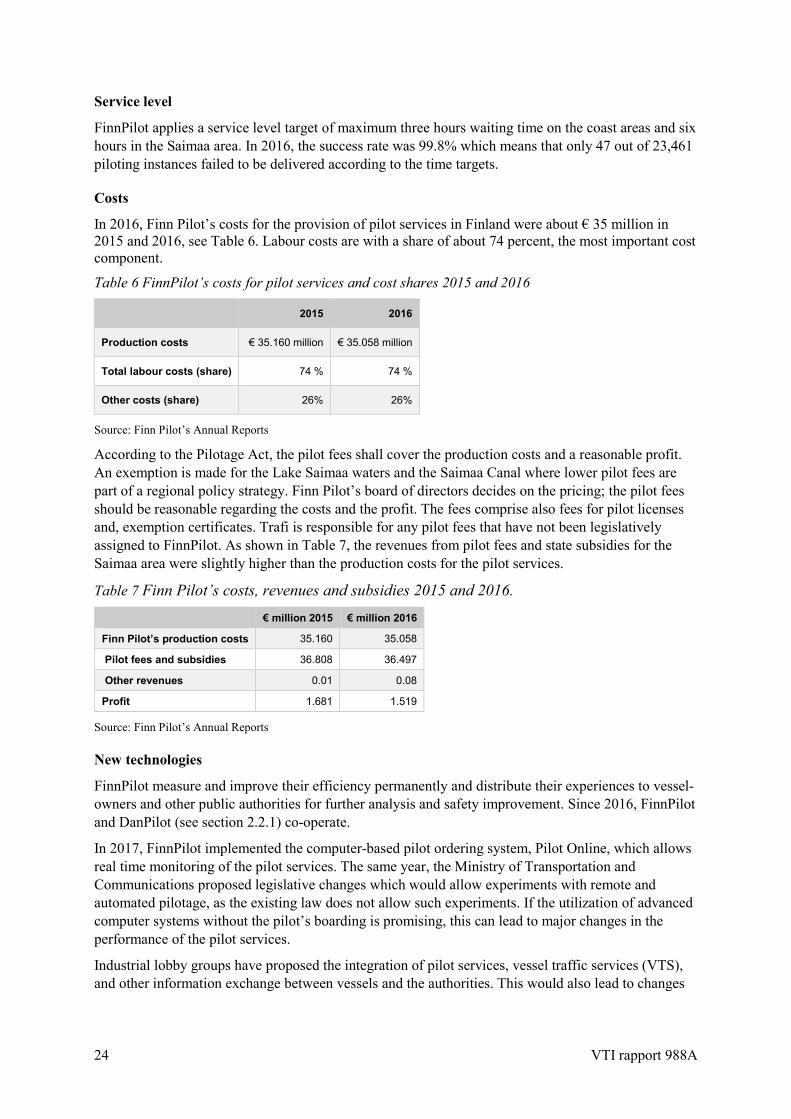
In 2016, Finn Pilot’s costs for the provision of pilot services in Finland were about € 35 million in 2015 and 2016, see Table 6. Labour costs are with a share of about 74 percent, the most important cost component.
Table 6 FinnPilot’s costs for pilot services and cost shares 2015 and 2016
2015 2016
Production costs € 35.160 million € 35.058 million
Total labour costs (share) 74 % 74 %
Other costs (share) 26% 26%
Source: Finn Pilot’s Annual Reports
According to the Pilotage Act, the pilot fees shall cover the production costs and a reasonable profit. An exemption is made for the Lake Saimaa waters and the Saimaa Canal where lower pilot fees are part of a regional policy strategy. Finn Pilot’s board of directors decides on the pricing; the pilot fees should be reasonable regarding the costs and the profit. The fees comprise also fees for pilot licenses and, exemption certificates. Trafi is responsible for any pilot fees that have not been legislatively assigned to FinnPilot. As shown in Table 7, the revenues from pilot fees and state subsidies for the Saimaa area were slightly higher than the production costs for the pilot services.
Table 7 Finn Pilot’s costs, revenues and subsidies 2015 and 2016. € million 2015 € million 2016
Finn Pilot’s production costs 35.160 35.058
Pilot fees and subsidies 36.808 36.497
Other revenues 0.01 0.08
Profit 1.681 1.519
Source: Finn Pilot’s Annual Reports
New technologies
FinnPilot measure and improve their efficiency permanently and distribute their experiences to vessel-owners and other public authorities for further analysis and safety improvement. Since 2016, FinnPilot and DanPilot (see section 2.2.1) co-operate.
In 2017, FinnPilot implemented the computer-based pilot ordering system, Pilot Online, which allows real time monitoring of the pilot services. The same year, the Ministry of Transportation and Communications proposed legislative changes which would allow experiments with remote and automated pilotage, as the existing law does not allow such experiments. If the utilization of advanced computer systems without the pilot’s boarding is promising, this can lead to major changes in the performance of the pilot services.
Industrial lobby groups have proposed the integration of pilot services, vessel traffic services (VTS), and other information exchange between vessels and the authorities. This would also lead to changes

VTI rapport 988A 25
in the organization of provision of the pilot services, but not in the services themselves or the monopoly.
2.2.3. Norway In Norway, pilot services are governed by the Pilotage Act from 2014, which is in place since the beginning of 2015 and has the objective to ensure more effective pilot services, to contribute to safe sea traffic and to protect the environment. The Pilotage Act encompasses the legal framework for compulsory pilotage, the responsibilities of the pilot and the master during pilotage, and the principles of exemption certificates and pilot fees. The “Compulsory Pilotage Regulations” describe which vessels are subject to pilotage and the areas to which the regulations apply. The general rule is that vessels that are 70 metres or more are subject to compulsory pilotage in waters within the baselines. Stricter rules apply to some vessel types, e. g. passenger vessels and vessels carrying dangerous and polluting cargo.
The Norwegian Coastal Administration (NCA, Kystverket) is responsible for the state pilot services. The aim of the service is to safeguard traffic at sea and protect the environment by ensuring that vessels operating in Norwegian waters have navigators with adequate qualifications for safe navigation, (Norwegian Coastal Administration, 2018). The pilot exemption certification scheme allows the certificate holder to sail in “preparedness waters” with the specified vessel without calling upon pilot services. To obtain the certificate, the deck officer must apply for the license and pass an exam.
Service providers
Norway applies an organization model that consists of two parts: a monopoly for the overall planning and the pilot services as such and a tendering process for the transport of the pilots to the vessels that use the pilot services by helicopter and boat.
Providers of pilot services as such
Prior to the re-organization in 2014, the day-to-day responsibilities for handling pilot operations were subordinate to the regional offices of the NCA, while the Department for Maritime Safety located at NCA’s head office oversaw operations, legislative work, and supervision. Pursuant to the Pilotage Act 2014, the duties of the NCA are: the organization of the pilot services, the dispatching of the pilots, the administration of the pilot exemption certificates, the stipulation and collection of the fees, the pilot training and the licencing as well as supervision, control and enforcement of these functions.
The groundwork for the re-organization is laid out in NOU 2013:183) that includes an historical overview of pilotage in Norway. The overall objective of the reform 2014 was to cut the ties between the administration and the execution of pilot services. The replacement of five regional offices by the NCA Pilotage Services was undertaken to ensure a streamlined chain of command and more efficient communication. Sources within the NCA argue that there is now a real division between the legislative and executive bodies, which in turn leads to objectivity e.g. in the handling of complaints due to failed pilotage or exemption certificates exams. They argue that the maritime industry finds the pilot service more credible after the reform.
The Department for Maritime Safety at NCA’s head office, administrates the pilot services and governs the development of the services. The NVA’s tasks include the development of objectives, strategies, and instructions such as technical standards and procedures for the pilot services, as well as supervision and control of the service provision. Proposals for amendments to regulations and guidelines are in most cases submitted to the Ministry of Transport and Communications. The Department for Maritime Safety oversees the certification of pilots and manages the pilot exemption certificate scheme.
26 VTI rapport 988A
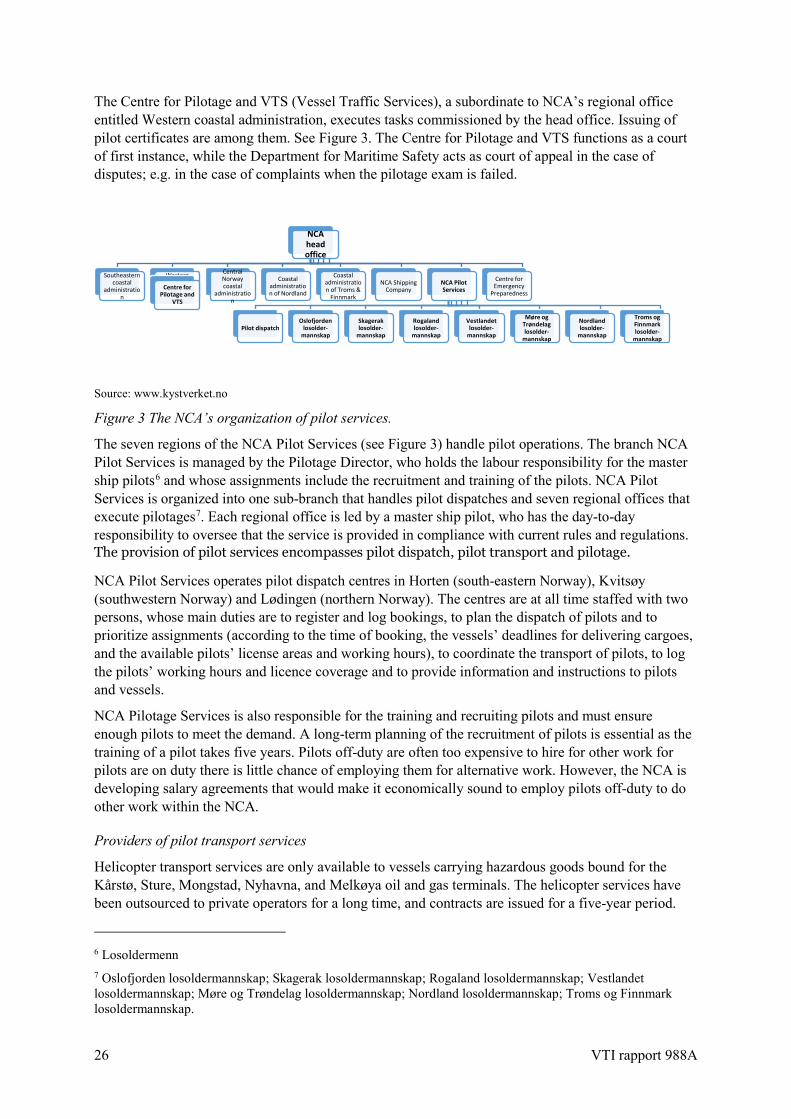
The Centre for Pilotage and VTS (Vessel Traffic Services), a subordinate to NCA’s regional office entitled Western coastal administration, executes tasks commissioned by the head office. Issuing of pilot certificates are among them. See Figure 3. The Centre for Pilotage and VTS functions as a court of first instance, while the Department for Maritime Safety acts as court of appeal in the case of disputes; e.g. in the case of complaints when the pilotage exam is failed.
Source: www.kystverket.no
Figure 3 The NCA’s organization of pilot services.
The seven regions of the NCA Pilot Services (see Figure 3) handle pilot operations. The branch NCA Pilot Services is managed by the Pilotage Director, who holds the labour responsibility for the master ship pilots6 and whose assignments include the recruitment and training of the pilots. NCA Pilot Services is organized into one sub-branch that handles pilot dispatches and seven regional offices that execute pilotages7. Each regional office is led by a master ship pilot, who has the day-to-day responsibility to oversee that the service is provided in compliance with current rules and regulations. The provision of pilot services encompasses pilot dispatch, pilot transport and pilotage.
NCA Pilot Services operates pilot dispatch centres in Horten (south-eastern Norway), Kvitsøy (southwestern Norway) and Lødingen (northern Norway). The centres are at all time staffed with two persons, whose main duties are to register and log bookings, to plan the dispatch of pilots and to prioritize assignments (according to the time of booking, the vessels’ deadlines for delivering cargoes, and the available pilots’ license areas and working hours), to coordinate the transport of pilots, to log the pilots’ working hours and licence coverage and to provide information and instructions to pilots and vessels.
NCA Pilotage Services is also responsible for the training and recruiting pilots and must ensure enough pilots to meet the demand. A long-term planning of the recruitment of pilots is essential as the training of a pilot takes five years. Pilots off-duty are often too expensive to hire for other work for pilots are on duty there is little chance of employing them for alternative work. However, the NCA is developing salary agreements that would make it economically sound to employ pilots off-duty to do other work within the NCA.
Providers of pilot transport services
Helicopter transport services are only available to vessels carrying hazardous goods bound for the Kårstø, Sture, Mongstad, Nyhavna, and Melkøya oil and gas terminals. The helicopter services have been outsourced to private operators for a long time, and contracts are issued for a five-year period.
6 Losoldermenn 7 Oslofjorden losoldermannskap; Skagerak losoldermannskap; Rogaland losoldermannskap; Vestlandet losoldermannskap; Møre og Trøndelag losoldermannskap; Nordland losoldermannskap; Troms og Finnmark losoldermannskap.
NCA head office
Southeastern coastal
administration
Western coastal
administration
Centre for Pilotage and
VTS
Central Norway coastal
administration
Coastal administration of Nordland
Coastal administration of Troms &
Finnmark
NCA Shipping Company
NCA Pilot Services
Pilot dispatchOslofjorden
losolder-mannskap
Skagerak losolder-
mannskap
Rogaland losolder-
mannskap
Vestlandet losolder-
mannskap
Møre og Trøndelag losolder-
mannskap
Nordland losolder-
mannskap
Troms og Finnmark losolder-
mannskap
Centre for Emergency
Preparedness

VTI rapport 988A 27
Airlift AS is responsible for helicopter operations since June 2017 and operates a fleet of 16 helicopters, stationed at its’ bases at Førde (Sogn og Fjordane), Kinsarvik (Hordaland), Stranda (Møre og Romsdal), Ljosland (Vest-Agder), and Eggemoen (Buskerud).
Boat transport services were recently outsourced following a period of high costs. The call for tender was issued in September 2014. The contract for pilot transport services was awarded for ten years compared to four years in the general recommendations for public procurement. The main reason for this was to give bidders a financial leeway to invest in new pilot boats. The NCA compiled information about the historical costs and produced fact sheets for each pilot station. This information was distributed to the bidders to make sure that they were informed about past cost trajectories, local traffic patterns, weather conditions etc. and to avoid information asymmetry among the bidders. The NCA was engaged in dialogues with all bidders, giving advice on how their bids could be improved. The competitive tendering was organized into two stages: the prequalification of bidders and the competition as such. Seven geographical areas were included; and the bidders could offer their services for one, several or all areas. The key evaluation criteria were price, service execution plans and pilot boat investment plans. In total 22 bids were received.
Since June 2016, the private company Buksér og Berging is responsible for all pilot transports by boat, which indicates that economies of scale can be exploited in the provision of these transport services. Buksér og Berging’s fleet consists of 25 pilot boats, stationed at 16 places along the Norwegian coast. They operate under a contract that provides a fixed payment irrespective of transports and a negotiated price per transport. In cases where the company’s services extend the current contract, e.g., when the duration of the transport exceeds the standard set in the contract, additional compensation is paid.
Demand
Table 8 shows the development of the number of voyages that were subject to compulsory pilotage. The share of voyages with pilotage decreased from 48 percent (2010) to 33 percent (2016). Hence, the certificate scheme appears to replace traditional pilotage. Upon revising the “Compulsory Pilotage Regulation” in 20158, the pilot exception certification scheme became more flexible. Since then three different certificate-classes are offered because of different needs of the vessel operators and the varying risks associated with different types of vessels, operations, and cargo. January 1, 2017, Annex 3 of the “Compulsory Pilotage Regulations” was updated accordingly; the changes enable more vessels to acquire exemption certificates to waive the requirements of compulsory pilotage. Exemption certificates are not valid for the transport of specific regulated substances and liquid bulk.
Table 8 Number of voyages subject to compulsory pilotage and share of voyages with pilotage in Norway.
2010 2011 2012 2013 2014 2015 2016
No of voyages subject to compulsory pilotage 94,014 98,358 100,213 107,377 114,733 116,314 116,355
Number (share) of voyages with pilotage 45,127 (48 %)
45,245 (46 %)
44,094 (44 %)
44,025 (41 %)
44,746 (39 %)
41,873 (36%)
38,397 33 %
Source: www.kystverket.no and NCA’s Annual Report 2016
Service level
The NCA strives to avoid more than one hour waiting time for vessels that have made bookings within the current deadline for reservations. In 2016, 1.4 % of the vessels (532 assignments) waited more than one hour.
8 The NCA reviewed their classification of 97 fairways in Norway.

28 VTI rapport 988A
Costs
Figure 4 summarizes the costs for the provision of the pilot services in Norway 2015 and 2016, divided into the components input value added tax, investments, labour costs and other running costs. In 2016, the total costs were NOK 755 million and the labour cost share about 57 percent. The labour costs declined significantly from 2015 to 2016. The NCA explains that about 75 percent reduction of the labour costs is caused by the outsourcing of pilot transports by boat, which took place between April and June 2016. Further labour cost reductions relate to the decline in the number of pilot services, as pilot salaries and support functions only partly depend on the activity level.
Source: NCA annual report, 2016 (in million NOK)
Figure 4 Total costs of pilot services in Norway 2015 and 2016.
The total costs for the provisions of the pilot services were constant, while the labor costs decreased, and other running expenses increased. This can be seen in Figure 4, where the grey bar decreased in 2016 while the blue bar increased. The other bars remain constant. The outsourcing of the transport services by boat is one explanation for the increase of the other running costs. The NCA points out that 2016 was a year of transition and a period where costs associated with in-house service provision and service tendering overlapped, resulting in higher costs than in a “normal year”. According to NCA’s annual report 2016, the outsourcing of the transport services by boat implied adaption costs in the range of NOK 14 million. Consequently, the NCA argues that it is too early to conclude if the outsourcing of pilot transport by boat has led to cost reductions. Nothing is reported after the implementation of the reform, neither at NCA’s web-page nor in the general media.
Table 9 provides an overview of the provision of pilot services 2014 to 2016, and the average costs per hour of pilotage and per assignment incl. pilot transports as noted in the NCA’s annual report 2016. The costs per hour increased by six percent between 2015 and 2016; this occurs because the decline in the costs of providing pilot services was not proportional to the decline in the demand for pilot services. One possible explanation is that pilots are permanent employees, with little (or very costly) alternative use. The pilot service was over-staffed, and new recruits were therefore not accepted in 2016 and 2017.
Table 9 Average pilot service costs per assignment and per hour.
2014 2015 2016 2014 2015 2016
NOK €
Average costs per assignment 17268.22 17 845.75 19 005.24 1864.82 1 927.19 2 052.40
Average costs per hour 5297.00 5491.00 5821.00 572.03 592.98 627.65
Source: NCA annual report 2016/ Norges bank (Rate, August 28th, 2017)
• Input value added tax
• Investments
• Other running cost
• Labor cost

VTI rapport 988A 29
Regulation REG 1994-12-23 no.1128 encompasses the legal framework for pilot fees. Vessels subject to compulsory pilotage, also those that hold exemption certificates, are required to pay a pilot readiness fee, which is progressive in the size of the vessel. Vessels that request pilot services pay a pilot service fee in addition to the readiness fee. The revenues from these fees should cover NCA’s costs for the provision of the pilot services.
The fees are determined based on the results in the last three to five years. Accumulated surpluses are transferred to the maritime industry by lowering the fees, while accumulated cost overruns are covered by increasing the fees. Figure 5 exhibits the pilot services’ total incomes in 2015 and 2016, and their decomposition into readiness fee, pilot service fee, pilot exemption certificates fee and subsidies from the central government. The pilot services were self-financing until 2015. In 2016, the pilot service had a cost overrun of NOK 107 million, which was partly covered by the government, which allocated NOK 86 million. The remaining NOK 21 million were covered by previously claimed fees (NOK 17 million) and by increasing pilotage fees in 2017 (NOK 4 million). See Figure 5.
Source: NCA annual report 2016 (in million NOK)
Figure 5 Total income related to pilot services in Norway.
Magnussen et al. (2015) do not calculate external costs associated to the provision of the pilot services as the fees are designed in a way that the costs are assumed to be internalized (or overinternalized). The Norwegian National Audit Office discusses the importance of efficient pilot services among others for the shift of goods from road to sea in a recently finalised report (Riksrevisjonen, 2018).
New technologies
NCA Pilotage Services work on a new regulation for the booking of pilot services. The purpose is to make pilot operating more predictable by establishing new deadlines for the booking of the pilots in the advent of arriving in waters subject to compulsory pilotage. Regarding possible future plans, interviews with the NCA revealed that the following topics are also on the agenda: the pilot services’ role related to unmanned vessels, the quality of GPS and the training of pilots to handle new types of vessels and equipment. The NCA has tested remote piloting in 2011; it was rejected because it was too expensive.
2.2.4. Sweden The Swedish Transport Agency (Transportstyrelsen) is responsible for most regulations for all modes of transport and regulates which vessels are subject to compulsory pilotage and the fairways to which the pilot regulations apply (Transportstyrelsen, 2012). The obligation to use pilot services depends on the vessel size and the cargo loaded. Generally, vessels that are 70 or more metres long and 14 or more metres wide or have more than 4.5 metres draught are subject to compulsory pilotage in most waters. The Swedish Transport Agency issues pilotage exemption certificates. These certificates are valid for three years and can be general or for specific fairways. The costs for the later (incl. tests) are, depending of the length of the fairway, SEK 9 000–SEK 51 000.
• Subsidy
• Pilotage service fee
• Pilotage readiness fee
• Pilotage exemption certificate fee

30 VTI rapport 988A
For the time being, the Swedish Transport Agency sees over the regulations for pilot services (Transportstyrelsen, 2018). The objective is to adapt the regulations to the conditions for shipping, to maintain safety and to make use of the technology development. The regulations, that are planned to be implemented October 1, 2019, are intended to be simplified, modernized and based on risk assessments.
Service providers
All pilot services are carried out in house by the Swedish Maritime Administration (SMA, Sjöfartsverket). The SMA can be characterised as both a public authority and a public enterprise that is funded via user fees. It seems that the administration and execution of the pilot services are not that clearly differentiated as between the Department of Maritime Safety and the Centre for Pilotage and VTS within the Norwegian Coastal Administration.
Demand
In 2017, the SMA carried out in total 33,481 pilot services distributed to eight geographical areas: Göteborg (16%) Malmö (16%), Marstrand (12%), Kalmar (14%), Stockholm (13%), Södertälje (10%), Gävle and Luleå (8% each) and four percent in Lake Vänern/Trollhätte canal (see Table 10). Mainly between 2010 and 2013, the trend towards larger vessels and the economic development led to reduction of the number of pilot services, while the number of pilot exemption fees decreased during that period. The number of pilot services was about 15 percent lower in 2016 than in 2010. The two percent increase in 2017 is mainly caused by the traffic increases in the pilot areas Stockholm and Kalmar (Sjöfartsverket, 2018)). Table 10 also shows that the number of pilot exemption certificates decreased by 18 percent between 2010 and 2016 and increased by about six percent between 2016 and 2017-
Table 10 Number of pilot services and pilot exemption certificates in Sweden 2010-2017.
Year 2010 2011 2012 2013 2014 2015 2016 2017
Pilot services 38,215 37,777 34,444 32,468 32,661 32,399 32,669 33,481
Exemption certificates 1085 1004 1006 956 931 932 894 944
Sources: Swedish Maritime Administration, Swedish Transport Agency
Service level
The Swedish Maritime Administration applies a service level target of maximum five hours waiting time9. In 2017, the success rate was 98.8 %. From 2018 the service level is measured based on the time that is desired by the client.
9 Senast fem timmar före önskad tidpunkt för lotsningens början skall definitiv lotsbeställning göras, se http://www.sjofartsverket.se/sv/e-tjanster/Lotsbestallning/..
VTI rapport 988A 31
Costs
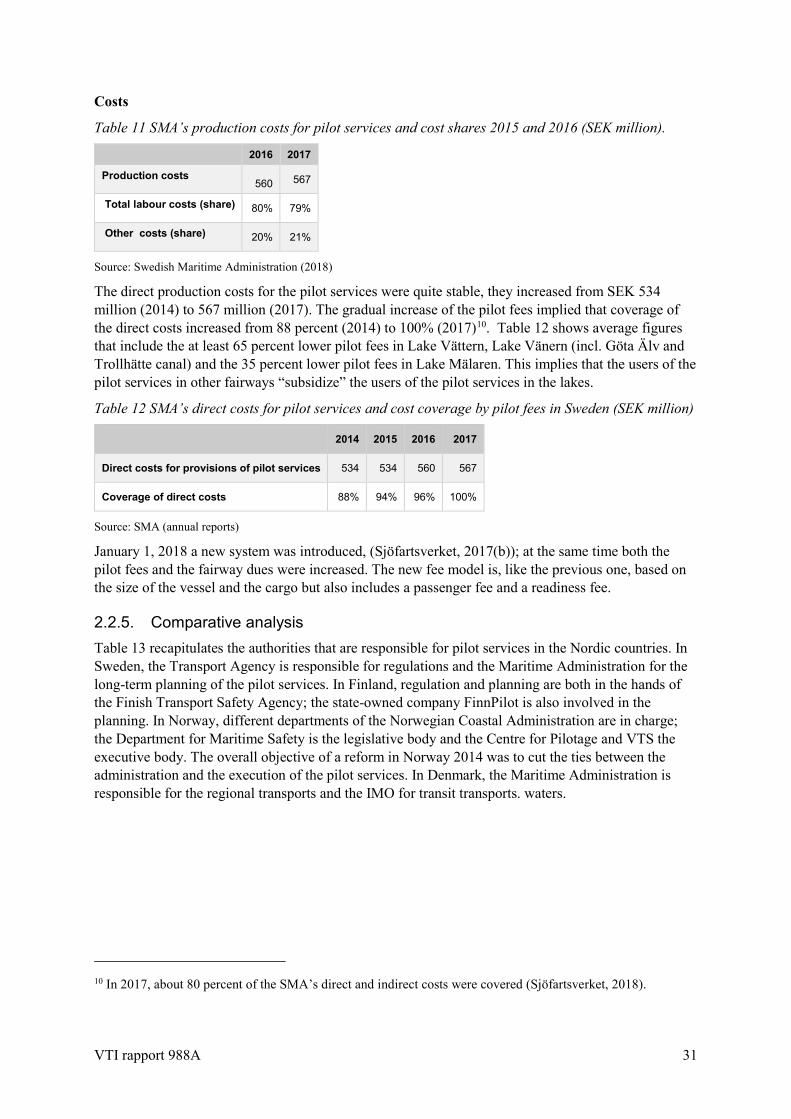
Table 11 SMA’s production costs for pilot services and cost shares 2015 and 2016 (SEK million).
2016 2017
Production costs 560 567
Total labour costs (share) 80% 79%
Other costs (share) 20% 21%
Source: Swedish Maritime Administration (2018)
The direct production costs for the pilot services were quite stable, they increased from SEK 534 million (2014) to 567 million (2017). The gradual increase of the pilot fees implied that coverage of the direct costs increased from 88 percent (2014) to 100% (2017)10. Table 12 shows average figures that include the at least 65 percent lower pilot fees in Lake Vättern, Lake Vänern (incl. Göta Älv and Trollhätte canal) and the 35 percent lower pilot fees in Lake Mälaren. This implies that the users of the pilot services in other fairways “subsidize” the users of the pilot services in the lakes.
Table 12 SMA’s direct costs for pilot services and cost coverage by pilot fees in Sweden (SEK million)
2014 2015 2016 2017
Direct costs for provisions of pilot services 534 534 560 567
Coverage of direct costs 88% 94% 96% 100%
Source: SMA (annual reports)
January 1, 2018 a new system was introduced, (Sjöfartsverket, 2017(b)); at the same time both the pilot fees and the fairway dues were increased. The new fee model is, like the previous one, based on the size of the vessel and the cargo but also includes a passenger fee and a readiness fee.
2.2.5. Comparative analysis Table 13 recapitulates the authorities that are responsible for pilot services in the Nordic countries. In Sweden, the Transport Agency is responsible for regulations and the Maritime Administration for the long-term planning of the pilot services. In Finland, regulation and planning are both in the hands of the Finish Transport Safety Agency; the state-owned company FinnPilot is also involved in the planning. In Norway, different departments of the Norwegian Coastal Administration are in charge; the Department for Maritime Safety is the legislative body and the Centre for Pilotage and VTS the executive body. The overall objective of a reform in Norway 2014 was to cut the ties between the administration and the execution of the pilot services. In Denmark, the Maritime Administration is responsible for the regional transports and the IMO for transit transports. waters.
10 In 2017, about 80 percent of the SMA’s direct and indirect costs were covered (Sjöfartsverket, 2018).
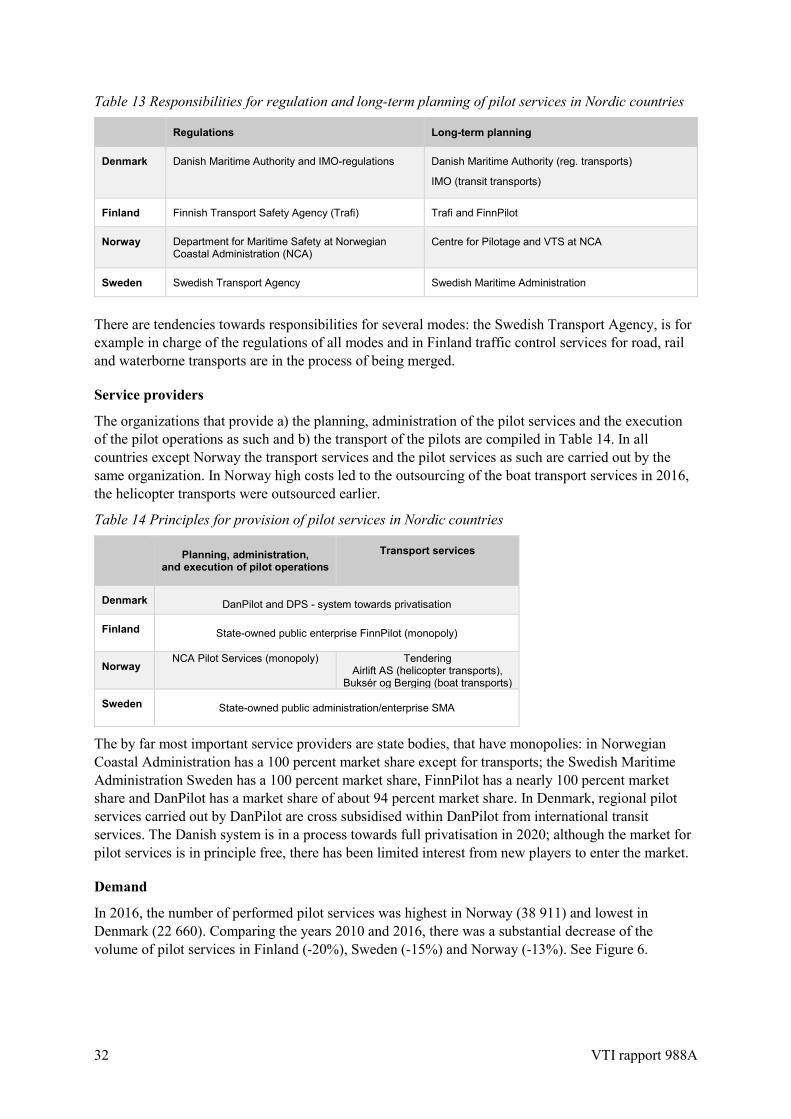
32 VTI rapport 988A
Table 13 Responsibilities for regulation and long-term planning of pilot services in Nordic countries
Regulations Long-term planning
Denmark Danish Maritime Authority and IMO-regulations Danish Maritime Authority (reg. transports)
IMO (transit transports)
Finland Finnish Transport Safety Agency (Trafi) Trafi and FinnPilot
Norway Department for Maritime Safety at Norwegian Coastal Administration (NCA)
Centre for Pilotage and VTS at NCA
Sweden Swedish Transport Agency Swedish Maritime Administration
There are tendencies towards responsibilities for several modes: the Swedish Transport Agency, is for example in charge of the regulations of all modes and in Finland traffic control services for road, rail and waterborne transports are in the process of being merged.
Service providers
The organizations that provide a) the planning, administration of the pilot services and the execution of the pilot operations as such and b) the transport of the pilots are compiled in Table 14. In all countries except Norway the transport services and the pilot services as such are carried out by the same organization. In Norway high costs led to the outsourcing of the boat transport services in 2016, the helicopter transports were outsourced earlier.
Table 14 Principles for provision of pilot services in Nordic countries
Planning, administration, and execution of pilot operations
Transport services
Denmark
DanPilot and DPS - system towards privatisation
Finland
State-owned public enterprise FinnPilot (monopoly)
Norway NCA Pilot Services (monopoly)
Tendering Airlift AS (helicopter transports),
Buksér og Berging (boat transports)
Sweden
State-owned public administration/enterprise SMA
The by far most important service providers are state bodies, that have monopolies: in Norwegian Coastal Administration has a 100 percent market share except for transports; the Swedish Maritime Administration Sweden has a 100 percent market share, FinnPilot has a nearly 100 percent market share and DanPilot has a market share of about 94 percent market share. In Denmark, regional pilot services carried out by DanPilot are cross subsidised within DanPilot from international transit services. The Danish system is in a process towards full privatisation in 2020; although the market for pilot services is in principle free, there has been limited interest from new players to enter the market.
Demand
In 2016, the number of performed pilot services was highest in Norway (38 911) and lowest in Denmark (22 660). Comparing the years 2010 and 2016, there was a substantial decrease of the volume of pilot services in Finland (-20%), Sweden (-15%) and Norway (-13%). See Figure 6.

VTI rapport 988A 33
Figure 6 Number of pilot services in the Nordic countries 2010–2016.
The overall decrease in the number of pilot services in the Nordic countries (except for Denmark, which registered an increase) by about ten percent between 2010 and 2016 can be explained by different factors that do not go in the same directions: increased transport demand, increasing size of the vessels, regulations that larger vessels are required to take pilot, lower education level of the staff on board, increasing share of exemption certificates. (All Nordic countries issue pilotage exemption certificates.) In Finland, the share of vessels that use pilot services decreased from 40 percent (2011) to 32 percent (2016). In Denmark, the share of vessels that use pilot services on the route Gedser – Skagen decreased from 91 percent (2013) to 81 percent (2017). In Sweden the number of pilot exemption certificates decreased between 2010 and 2016 but increased by about six percent between 2016 and 2017.
New technologies
Computer-based pilot ordering/booking systems, which allow real time monitoring of the pilot services, are in place (i.e. in Finland) or discussed in the Nordic countries. Different types of on-site pilot services (and remote piloting) and their potential as well as the integration of pilot services, vessel traffic services (VTS), and other information exchange between vessels and the authorities is also a topic that is investigated in the different countries. The overall picture is that the use of new technologies has a potential to lead to major changes in the performance of the pilot services in a long-term perspective.
The overall reduction in the number of pilot services is assumed to continue and can be reinforced by the application of computer-based information system and the integration of pilot services, vessel information services and traffic control services are assumed to be able to reduce the need for traditional pilot services.
Service level
The service level target for the pilot services differs somewhat between the countries. In Finland, the target for the maximum waiting is three hours on the coast and six hours in the Saimaa area while it is generally five hours in Sweden. The success rate is all through close to 100 percent. As far as we know, the costs related to the waiting time for the pilot services (that is external to the pilot service providers) and the distribution of the costs between the pilot service providers and vessel operator has not been studied. However, this aspect is especially interesting in Sweden where the measurement of the service level is based on the time that is desired by the vessel operator since 2018.
0
10000
20000
30000
40000
50000
2010 2011 2012 2013 2014 2015 2016
Num
ber o
f pilo
t ser
vice
s
Sweden Finland Norway Denmark

34 VTI rapport 988A
Costs
In Table 15 we calculate the production costs11 per pilot service in the Nordic countries in 2016 based on the information above. We use DanPilot’s data for Denmark and Finn Pilot’s data for Finland, hence covering nearly 100 percent of the pilot services in these countries. We would like to stress that our simple calculation needs to be taken with a pinch of salt. The costs per pilot hour would be a relevant indicator since this, partly, would control for differing lengths of pilot assignments. In the last two columns in Table 15 we compare the index based on our own calculation to the index that FinnPilot published in their annual report 2016. FinnPilot compares pilot fees for a hypothetical seven nautical miles pilot service in selected European countries in 2016. The Swedish index is coincidentally about the same in both cases. The Norwegian index is on both calculations higher than the Finish and Swedish index; which can possibly be explained by the generally higher price level in Norway and the fact that 2016 was a year with especially high costs due to the administration related to the outsourcing of the transport services by boat that year.
Table 15 Costs per pilot service in Nordic countries 2016.
A B C D E F
Number of
pilot services
Production costs Production costs
per pilot service
based on column B and C
Index (Costs per pilot
service, Finland =100)
Own calculation
based on column D
FinnPilot (2016)
Denmark 22,660 € 53,73 million € 2,371 159 85
Finland 23,461 € 35,06 million € 1,494 100 100
Norway 38,397 € 78,80 million € 2,052 137 182
Sweden 32,669 € 59,57 million € 1,823 122 121
The Danish index is the highest in our own calculation and the lowest in FinnPilot’s calculation, but as shown in Table 3 above. The rates should also be higher for the transit pilot services than for the regional pilot services as the revenues from the transit services are used to cross subsidize the regional serves. FinnPilot’s annual report 2016 comprises also the index values for Estonia (110), Germany (137) and The Netherlands (185).
In all Nordic countries the labour costs stand for a high share of the total production costs. This can be explained by the characteristics of the pilot services that require the continuous physical presence of the pilots which in turn implies that economies of scale hardly exist in today’s production system. In 2016, the labour share was around 80 percent in Sweden, 70 percent in Finland and Denmark and 57 percent in Norway. One explanation of the lower share in Norway is the outsourced transport services. It will be interesting to follow to what extent the tendering of the pilot transport services by boat in 2016 will contribute to an overall cost reduction. A crucial question regarding the pilot services as such is the employment of the pilots off-duty to other work. A more detailed data collection and in-depth analysis of the cost level and structure in the four countries is necessary to be able to draw more detailed conclusions.
11 The revenues and production costs 2016 are in the same range; therefore also the revenues and production costs per pilot service are in the same range.
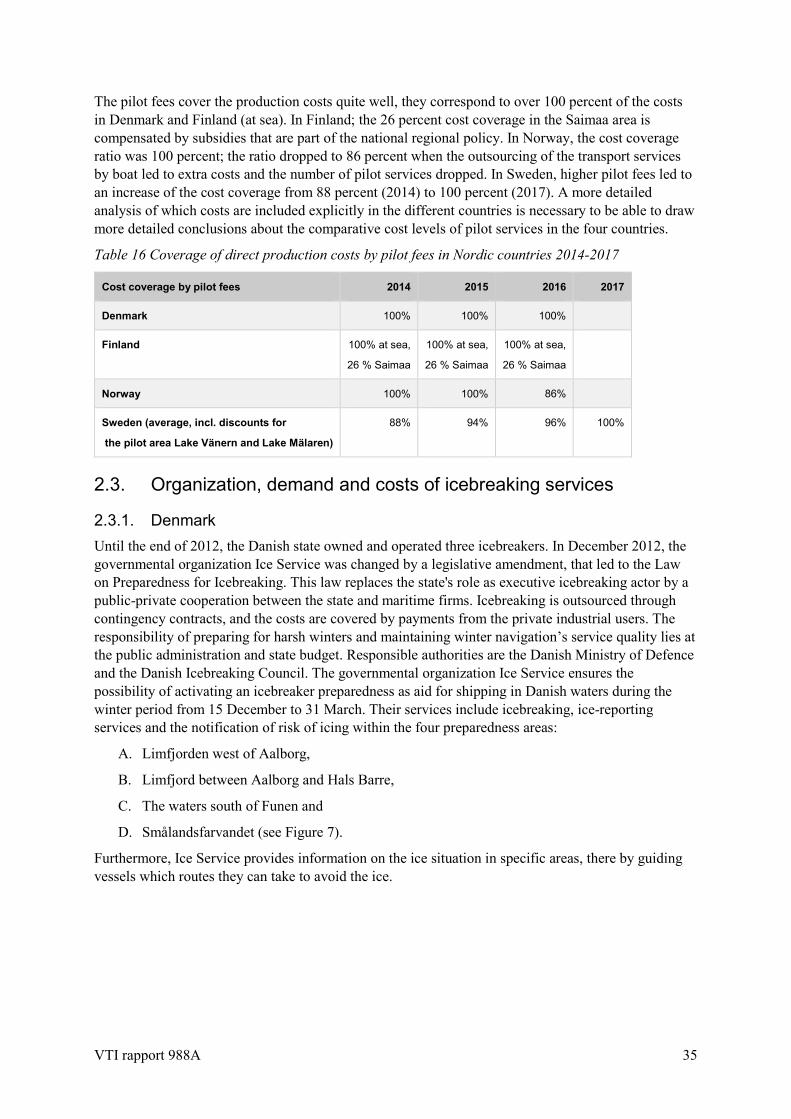
VTI rapport 988A 35
The pilot fees cover the production costs quite well, they correspond to over 100 percent of the costs in Denmark and Finland (at sea). In Finland; the 26 percent cost coverage in the Saimaa area is compensated by subsidies that are part of the national regional policy. In Norway, the cost coverage ratio was 100 percent; the ratio dropped to 86 percent when the outsourcing of the transport services by boat led to extra costs and the number of pilot services dropped. In Sweden, higher pilot fees led to an increase of the cost coverage from 88 percent (2014) to 100 percent (2017). A more detailed analysis of which costs are included explicitly in the different countries is necessary to be able to draw more detailed conclusions about the comparative cost levels of pilot services in the four countries.
Table 16 Coverage of direct production costs by pilot fees in Nordic countries 2014-2017
Cost coverage by pilot fees 2014 2015 2016 2017
Denmark 100% 100% 100%
Finland 100% at sea,
26 % Saimaa
100% at sea,
26 % Saimaa
100% at sea,
26 % Saimaa
Norway 100% 100% 86%
Sweden (average, incl. discounts for
the pilot area Lake Vänern and Lake Mälaren)
88%
94% 96% 100%
2.3. Organization, demand and costs of icebreaking services
2.3.1. Denmark Until the end of 2012, the Danish state owned and operated three icebreakers. In December 2012, the governmental organization Ice Service was changed by a legislative amendment, that led to the Law on Preparedness for Icebreaking. This law replaces the state's role as executive icebreaking actor by a public-private cooperation between the state and maritime firms. Icebreaking is outsourced through contingency contracts, and the costs are covered by payments from the private industrial users. The responsibility of preparing for harsh winters and maintaining winter navigation’s service quality lies at the public administration and state budget. Responsible authorities are the Danish Ministry of Defence and the Danish Icebreaking Council. The governmental organization Ice Service ensures the possibility of activating an icebreaker preparedness as aid for shipping in Danish waters during the winter period from 15 December to 31 March. Their services include icebreaking, ice-reporting services and the notification of risk of icing within the four preparedness areas:
A. Limfjorden west of Aalborg,
B. Limfjord between Aalborg and Hals Barre,
C. The waters south of Funen and
D. Smålandsfarvandet (see Figure 7).
Furthermore, Ice Service provides information on the ice situation in specific areas, there by guiding vessels which routes they can take to avoid the ice.

36 VTI rapport 988A
Figure 7 Preparedness areas in Denmark
Service providers
Denmark applies different principles inside and outside the preparedness areas:
• Inside the preparedness areas private firms provide icebreaking services. For the help and guidance of the maritime profession, the Navy Operative Command operates an internet-based platform containing an overview of available icebreakers. The overview enables shipping companies to contact relevant service providers and to agree on icebreaking services. Contracts are concluded between the requisite vessel and the icebreaker. In addition, the Armed Forces can establish a precautionary preparedness in all other offshore waters during the winter season if the ice conditions require this. In this case the Operational Command of the Navy is awarding contracts with private operators of icebreakers based on public tendering. The Danish Ministry of Defence is responsible for organising the icebreaking service, and the Naval Operative Command is responsible for the day-to-day operation of the service, including coordination of icebreaking efforts, implementation of the supply of emergency preparedness contracts, operation of the database of icebreaking capacities and the collection of the ice tax.
• Outside the preparedness areas shipping companies are responsible for contracting.
In Greenland, there is no governmental organisation that if responsible for icebreaking and no obligation for the government to secure free fairways. Shipping companies take care of their own demand for icebreaking.
Costs
Within the four preparedness areas (see Figure 7), the costs for the icebreaking services vary with the size of the icebreaker and the area where the icebreaker is operating. Table 17 shows the costs per hour. There is only one operator per area.
A
C
B
D

VTI rapport 988A 37
Table 17 Examples for icebreaking costs per hour in preparedness areas in Denmark. Preparedness area DKK/hour
excl. VAT € /hour
excl. VAT Served by
A. Limfjorden west of Aalborg 3,500 470
Agger Boatyard
B. Limfjorden between Aalborg and Hals Barre 6,900 930 Em. Z. Svitzer
C. Waters South of Funen 2,100 280 Stevns Charter & Towage
D. Smålandsfarvandet 3,600 480 Limfjord shipping
The icebreaking services are funded through an annual fee determined by the Icebreaking Council based on the quantities of goods passing through the individual ports.12 The fee is paid by the port administration, which pays the annual contingency contribution to the Danish Ministry of Defence.
Table 18 The Danish national icebreaking service’s total tendering costs (nominal DKK).
2015 2016 2017
Total costs (DKK) 4,261,040 1,184,160 2,239,960
Total costs (€) 571,952 158,948 300,666
Source: Order. BEK nr 131 af 06/02/2014 and statistics on freight amount from Statistics Denmark (SKIB72). Currency rate, March 21th, 2018
There is no state subsidy for icebreaking in Denmark. All costs are covered by the charge collected by the ports in combination with the possible direct payment from the shipping company to the icebreaking company.
2.3.2. Finland According to the Act on the Ice Classes of Vessels and Icebreaker Assistance (1121/2005) the Winter Navigation Unit of the Finnish Transport Agency (FTA, Finska Trafikverket) is responsible for arranging the availability of icebreaker assistance in Finnish waters when the ice conditions so require. The FTA comprises the former Finish Maritime Administration. The FTA is also responsible for the readiness of icebreaker assistance outside Finnish waters, if it is necessary to safeguard Finnish foreign trade or in case of agreements with other states. Furthermore, the FTA leads and monitors the implementation of the icebreaking services and follows up the clients’ satisfaction, in cooperation with e.g. the vessel traffic services (VTS) and Baltic Sea icebreaking organizations.
Icebreaking services include keeping specific routes open, the assistance of vessels when ice conditions so require and if necessary towing. The services are provided according to weather conditions throughout Finnish fairways in the Baltic Sea and in the Lake Saimaa area.13 During harsh winters, the FTA imposes regionally specified traffic restrictions, based on weather and ice conditions and the vessel’s ice class and deadweight. The Saimaa Canal is usually closed between January and April while assistance on the Lake Saimaa is usually provided throughout the winter.
12 Vessels requesting icebreaker services in the preparedness area pay 25 percent of the hourly rate for the services. Ports adjacent to a preparedness area pay 100 percent of the hourly rate. 13 Icebreaker assistance in the approach channel to the Canal on Russian waters in the Bay of Vyborg is the responsibility of Russian icebreakers.
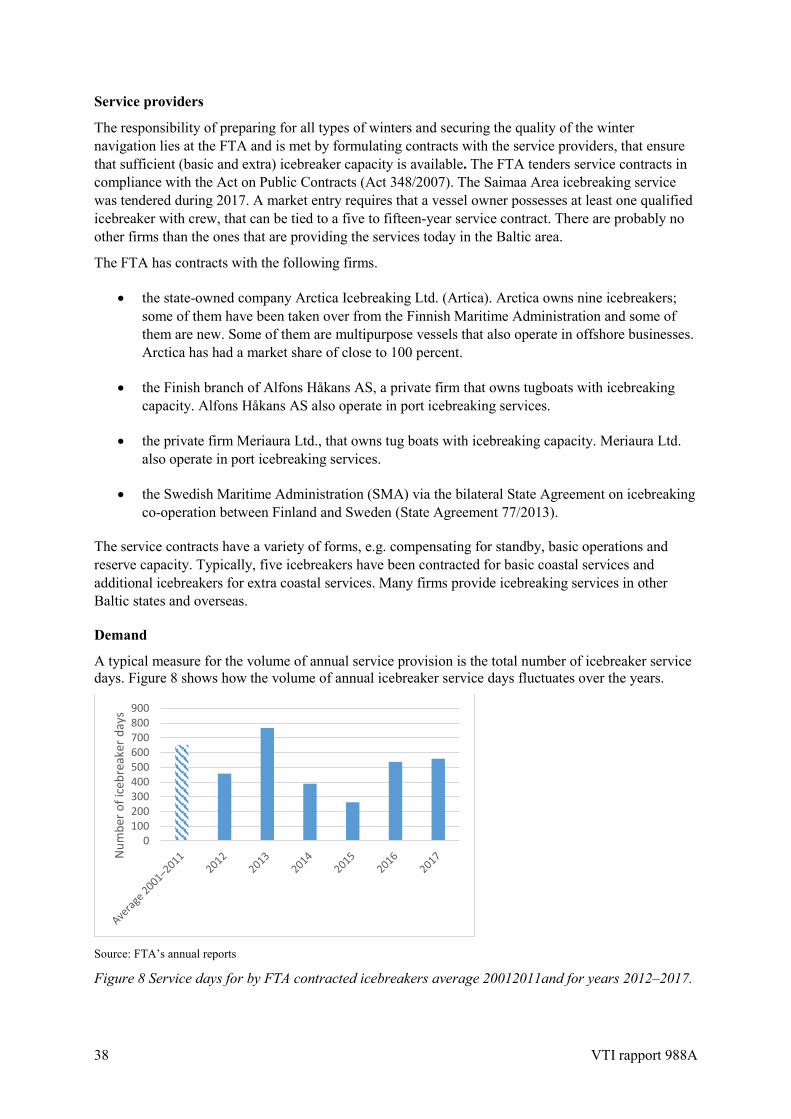
38 VTI rapport 988A
Service providers
The responsibility of preparing for all types of winters and securing the quality of the winter navigation lies at the FTA and is met by formulating contracts with the service providers, that ensure that sufficient (basic and extra) icebreaker capacity is available. The FTA tenders service contracts in compliance with the Act on Public Contracts (Act 348/2007). The Saimaa Area icebreaking service was tendered during 2017. A market entry requires that a vessel owner possesses at least one qualified icebreaker with crew, that can be tied to a five to fifteen-year service contract. There are probably no other firms than the ones that are providing the services today in the Baltic area.
The FTA has contracts with the following firms.
• the state-owned company Arctica Icebreaking Ltd. (Artica). Arctica owns nine icebreakers; some of them have been taken over from the Finnish Maritime Administration and some of them are new. Some of them are multipurpose vessels that also operate in offshore businesses. Arctica has had a market share of close to 100 percent.
• the Finish branch of Alfons Håkans AS, a private firm that owns tugboats with icebreaking capacity. Alfons Håkans AS also operate in port icebreaking services.
• the private firm Meriaura Ltd., that owns tug boats with icebreaking capacity. Meriaura Ltd. also operate in port icebreaking services.
• the Swedish Maritime Administration (SMA) via the bilateral State Agreement on icebreaking co-operation between Finland and Sweden (State Agreement 77/2013).
The service contracts have a variety of forms, e.g. compensating for standby, basic operations and reserve capacity. Typically, five icebreakers have been contracted for basic coastal services and additional icebreakers for extra coastal services. Many firms provide icebreaking services in other Baltic states and overseas.
Demand
A typical measure for the volume of annual service provision is the total number of icebreaker service days. Figure 8 shows how the volume of annual icebreaker service days fluctuates over the years.
Source: FTA’s annual reports
Figure 8 Service days for by FTA contracted icebreakers average 20012011and for years 2012–2017.
0100200300400500600700800900
Num
ber o
f ice
brea
ker d
ays

VTI rapport 988A 39
Service level
The level of the icebreaking services is planned by the FTA, considering the views of the different stakeholders. Since the early 1970’s, the fundamental service criteria have been the following: assistance is provided in all class 1 fairways with a minimum depth of eight metres leading to a coastal port. Assistance to other ports (along and beyond these fairways) is only given in relation to class 1 fairways, at least eight metres deep fairway sections or to other destinations specified by FTA. Icebreaking services have been provided for traffic to the same ports and according to the same basic service level. More detailed service criteria have been developed over the years to meet the companies’ logistic requirements regarding speed and punctuality. For now, the objective is that the waiting time for icebreaking services should not exceed 3.5 hours (Antikainen (2016)). The share of not delayed port calls during the ice period is also monitored. Success rates were high: 97 percent in 2015 and 98 percent in 2016. Changes of this type of overall objectives require an approval from the Ministry of Transport and Communications.
Costs
Cost data on icebreaking services is publicly available as annual totals. The “standby services” make up most of the costs; operation and fuel costs depend on the severity of the winter. Table 19 reveals the total costs of the Finish Transport Administration for icebreaking services.
Table 19 Production costs of icebreaking services in Finland (nominal prices)
Costs 2012 2013 2014 2015 2016 2017
€ million 35.0 41.4 38.9 34.6 51.0 58.8
Source: FTA’s annual reports, Budget proposal of the Ministry of Transport and Communication).
The FTA and the contracted companies undertake different measures, e.g. the integration of information systems to predict the demand and to improve the cost efficiency e.g. by reducing the transport time and fuel consumption of the manoeuvring vessels and icebreakers. Furthermore, vessel manufacturers develop technologies that allow the use of the icebreakers also outside the winter season or beyond the Baltic Sea. The aim is to create revenues that support the economy of icebreaking and to increase the markets for Finnish know-how and vessel building services.
The costs for the provisions of the icebreaking services, incl. the handling of fluctuating fuel prices and the maintenance and renewing of the icebreaker fleet are considered within the fairway charging system and the state budget. The funding is planned by the Ministry of Transport with help of the FTA. There is no special icebreaking fee. The fairway dues are collected from all commercial vessels irrespective of means that all vessels contribute to the funding of the icebreaking services. The fairway dues are differentiated according to the ice class of the vessels, to promote the use of vessels with high ice classes. However, the connection between the paid fairway dues and the received icebreaking services is only indirect.
According to Finnish legislation, the fairway dues are a tax that is collected by the Finnish Customs and the revenues are forwarded to the state budget. The fairway dues are designed so that the revenues largely cover the costs of icebreaking, maintenance of the fairways, VTS and other services for commercial vessels along the Finnish coast. In the case of icebreaking, the cost estimate is based on an average winter. The icebreaking costs and the cost coverage are mainly influenced by the type of winter and fuel prices. If the revenues do not cover the costs, the fairway dues are raised (reduced when the revenues are much higher than the costs). The Finish state has contributed additional funding when the cost coverage dropped in harsh winters, but there is no principle agreement for this.
The Finnish government has halved the fairway dues 2015-2018 to compensate for the cost increases caused by the sulphur directive (IMO, 2014)). In 2014, the fairway due revenues were about € 88

40 VTI rapport 988A
million and the cost coverage 105 percent. In 2015, after the halving of the fairway dues, the revenues were about € 45.3 million, and the cost coverage decreased to 62 percent. The cost coverage was 55 percent in 2015 and 57 percent in 2016.
2.3.3. Norway The icebreaking services are, as the pilot services, organized by the Norwegian Coastal Administration (NCA). The two main objectives are to provide information about the occurrence of ice in Norwegian waters, from the Swedish boarder to Kristiansand, and to perform icebreaking in main and secondary fairways. The national ice service is manned by Senior Engineer Steinar Hansen in a part time position; hence it constitutes only a small part of the NCA’s activities. The NCA attempts to keep the level of service at the minimum and deploys icebreakers only when vessels are obstructed by ice. Publicly available information about the icebreaking services is correspondingly scarce. The NCA’s five regional offices are in principle responsible for providing ice services. However, since ice is mainly a problem in Southern Norway, NCA Region Southeast oversees the providing the national ice service. See Figure 2 in section 2.2.3.
Key risks relate to the extent of icing. The current contracts reimburse the service providers for their costs. Thus, the cost risk is with the NCA and ultimately with the Norwegian taxpayers. As noted by the NCA’s web-page, the current contracts are viewed as “first-aid” in mild winters. In the case of harsh winters, there is need for more resources than the current contracts hold. This may involve the Coast Guard, the NCA, and private companies. Such occurrences will be challenging because the market for icebreaking is limited. Icebreaking in Norway is performed by tugboats and the tugboats are aging. The return on investment is considered so low that new vessels are not built for ice removal.
Service providers
In 2013, competitive tendering was introduced; before icebreaking was handled by private firms working on a contract with the NCA. The main reason for introducing competitive tendering was to ensure compliance with national regulations for the procurement of public services, and not to promote cost efficiency. The NCA has no opinion on whether the introduction of competitive tendering has lowered the costs of providing the icebreaking services. Typically, the procurement process starts with the issuing of the tender documentation parts 1 and 2 (where part 2 is the framework contract). The bids are evaluated using a score sheet, where the bidders’ capacities to break ice (size of the tugboats), the time to mobilize the tugboats, and the total costs are the main criteria.14 Announcements are made via the Norwegian national notification database for public tendering. On some occasions, there have been up to five bidders.
For the time being, the key operator is Buksér og Berging AS, established in 1913 and operating 30 vessels in relation to ports and offshore. Buksér og Berging AS have stand-by contracts in the Drammen fjord and in Halden. Buksér og Berging AS provide also pilot transport services (see section 2.2.3). Another operator is Kragerø Sjøtjenester, established in 1996 with six permanent employees and stand-by contracts in the Oslo fjord, the counties of Telemark, East- and West Agder and the area of Kragerø.
Demand and service level
There are no statistics concerning the demand of icebreaking services, the number of operation days, the service level etc. and the NCA considers it too labour intensive to compile this information.
14 Normally, the tug boats work on contracts with a life-span of one year, with the option of prolonging the contract up to four years.

VTI rapport 988A 41
Costs
In Norway, the companies provide icebreaking services based on stand-by contracts, consisting of a fixed cost component (i.e. a fixed annual payment and a cost reimbursement component, determined by the number of days the vessels are requisitioned for icebreaking) and the agreed day-rates. Clearly, cost reimbursement entails that the level of service is an important determinant of the total costs of icebreaking services. As mentioned above, the NCA attempts to keep the level of service at the minimum and will only deploy icebreakers in the case where cargo vessels are obstructed by ice. Table 20 shows the NCA’s total tendering costs.
Table 20 Norwegian national icebreaking service’s total tendering costs (nominal NOK and €). 2014 2015 2016 2014 2015 2016
NOK €
Costs 9,835,000 6,385,000 7,620,483 1,062,095 689,525 822,946
Source: NCA’s annual reports 2015 and 2016/ Norges bank (Currency rate, August 28th, 2017)
There is no special icebreaking fee. The icebreaking services are funded by the NCA by means of its overall annual budget, which is partly funded by users of other services, e.g. pilot services, and by the state budget. In harsh winters, additional grants from the Norwegian Parliament are awarded to cover cost overruns.
2.3.4. Sweden In Sweden, the Swedish Transport Agency is responsible for safety regulations i.e. regarding the icebreakers. The Swedish Maritime Administration (SMA) is responsible for the planning of the icebreaking services. Vessels suitable for winter shipping can get icebreaker assistance in coastal waters and between open-water at sea and waters protected from sea ice, drizzle ice and similar ice hinders. An icebreaker assistance means that one or more vessels follow an icebreaker in a broken ice channel tunnel, (Sjöfartsverket & SMHI, 2017).
Service providers
The Swedish Maritime Administration is also the main provider of the icebreaking services. Assistance is provided by five icebreakers that are owned by the SMA. The number was reduced from eight own icebreakers (2012) to five own icebreakers (2015). If necessary leased resources from Finland and other neighbouring countries are used (see section 2.3.2); the SMA has created greater flexibility by contracting icebreakers and cooperating with other countries.
The existing icebreaker fleet is getting old and measures need to be taken to guarantee Sweden’s icebreaker capacity in the coming decades, (Sjöfartsverket, 2017(a)). For the time being, the investment in a new large icebreaker with a diesel/electric system that allows the use of batteries, diesel and bio fuel, is investigated. The costs for such an icebreaker is SEK 1.1 to 1.3 billion and it is discussed to use it together with the Armed Forces and the Coast Guard.
Demand
The number of icebreaker service days was lower in recent years than in the harsh winter 2012/2013. As expected, the share of assistances performed by contracted icebreaker days was highest in the harsh winters 2009/2010 and 2010/2011 (over 40 %) and lowest in the winters 2014/2015 and 2016/2017 (about 1%). See Figure 9. The figures for Sweden (Figure 9) and Finland (Figure 8, see section 2.3.2) are not directly comparable as Finish figures include the operating days are for calendar years and the Swedish figures relate to icebreaking seasons.

42 VTI rapport 988A
Source: (Sjöfartsverket & SMHI, 2017)
Figure 9 Days of SMA’s own and contracted icebreakers in Sweden winter 2009/2011 to 2016/2017.
The demand can also be expressed in terms of number of icebreaking assistances, assisted vessels, distance or number of hours. Table 21 shows that the number of icebreaking assistances was considerably lower in the last four mild winters than in the harsh winters 2009/2010 and 2011/2012. Unsurprisingly, the number of assistances and assisted vessels is highest in harsh winters and lowest in mild winters. The relation between the number of assistances and the number of assisted vessels was 1.03 -1.17 in the mild winters, 1.41 in the normal winter 2012/2013 and 1.44 resp. 1.47 in the two harsh winters. This indicates that scarce icebreaker resources require an increased use of convoys and that economies of scale are realized when convoys are used.
Table 21 Number of assistances and assisted vessels in Sweden winter 2009/2010 to winter 2016/2017 Winter 2009/2010 2010/2011 2011/2012 2012/13 2013/14 2014/15 2015/16 2016/17
Type av winter Harsh Harsh Mild Normal Mild Mild Mild Mild
Assistances 2 003 2 589 676 1 363 429 290 668 511
Assisted vessels 2 942 3 720 699 1 919 457 320 770 600
Source: Sjöfartsverket & SMHI (2010, 2011, 2012, 2014, 2014, 2015, 2016, 2017)
Generally, milder winters reduce the demand for icebreaking services but environmental regulations like IMO’s Energy Efficiency Design Index (EEDI) regarding the vessels’ fuel consumption and emissions are expected to lead to a downsizing of engines and a lightening the structures of newly built vessels and increased demand for icebreaking services. This is true in all countries that need to offer icebreaking services. Reduced ice-coverage in the oceans is expected to reduce the need for icebreaking services: for the Baltic Sea, however, this may result in changes in type of ice and the form of the ice-coverage. The SMA does not expect any changes the nearest 60 years, but the needs may differ taking a longer time perspective into account, (Andersson-Sköld & Johannesson, 2018).
Service level
The current service level implies that vessels sometimes need to wait for icebreaking assistance, either to locate the icebreaker to the vessel or to wait for other vessels to be assisted in a convoy. According to SMA's strategy, the average waiting time should not exceed four hours, which has been met in most winters. In the winter 2016/2017, the average waiting time was two hours and twelve minutes, which can be compared to two hours and 28 minutes the winter before.
0200400600800
100012001400
2009/2010
2010/2011
2011/2012
2012/2013
2013/2014
2014/2015
2015/2016
2016/2017
Num
ber o
f ice
brea
ker d
ays
SMA's own Contracted

VTI rapport 988A 43
Costs
Table 22 reveals the production costs for icebreaking services in Sweden from winter 2009/2010 to winter 2016/2017.
Table 22 Production costs for icebreaking services in Sweden winter 2009/2010 to winter2016/2017
Production costs for
for icebreaking
2009/10 2010/11 2011/12 2012/13 2013/14 2014/15 2015/16 2016/17
SEK million 295 206 360 359 302 313 316 274
€ million* 28.6 40.0 40.2 35.3 35.1 33.5 32.2 28.6
Source: Sjöfartsverket & SMHI (2010, 2011, 2012, 2014, 2014, 2015, 2016, 2017).
*https://valutakurser.net/historic (1 January every year)
A specific icebreaking fee is not paid. The provision of the icebreaking is funded via fairway dues, revenues from renting out icebreakers and government funds. All vessels pay fairway dues and the vessels that do not take icebreaker assistance cross-subsidize the vessels that use icebreaking services..
2.3.5. Comparative analysis Due to different geographical and weather conditions, the need for and the volume of icebreaking services differs a lot between Finland and Sweden on the one side and Norway and Denmark on the other side. The average number of icebreaking days since 2012 was about 400 days per season in Sweden and about 500 icebreaking days per year in Finland. The corresponding figures are much lower for Norway and Denmark, but there are no official figures from these countries. The conditions differ also within the countries and especially the design and funding of the icebreaking services is in some cases used as regional policy instrument.
Service providers
The cost risk is with the responsible public authorities, the Swedish Maritime Administration, the Finnish Transport Agency, the Norwegian Coastal Administration and the Danish Ice Service and the Army (in preparedness areas), the ministries and ultimately the taxpayers. Outside the preparedness areas in Denmark it is the private firms’ responsibility to contract and pay for icebreaking services.
The responsible authorities and service providers in the Nordic countries are listed in Table 23.
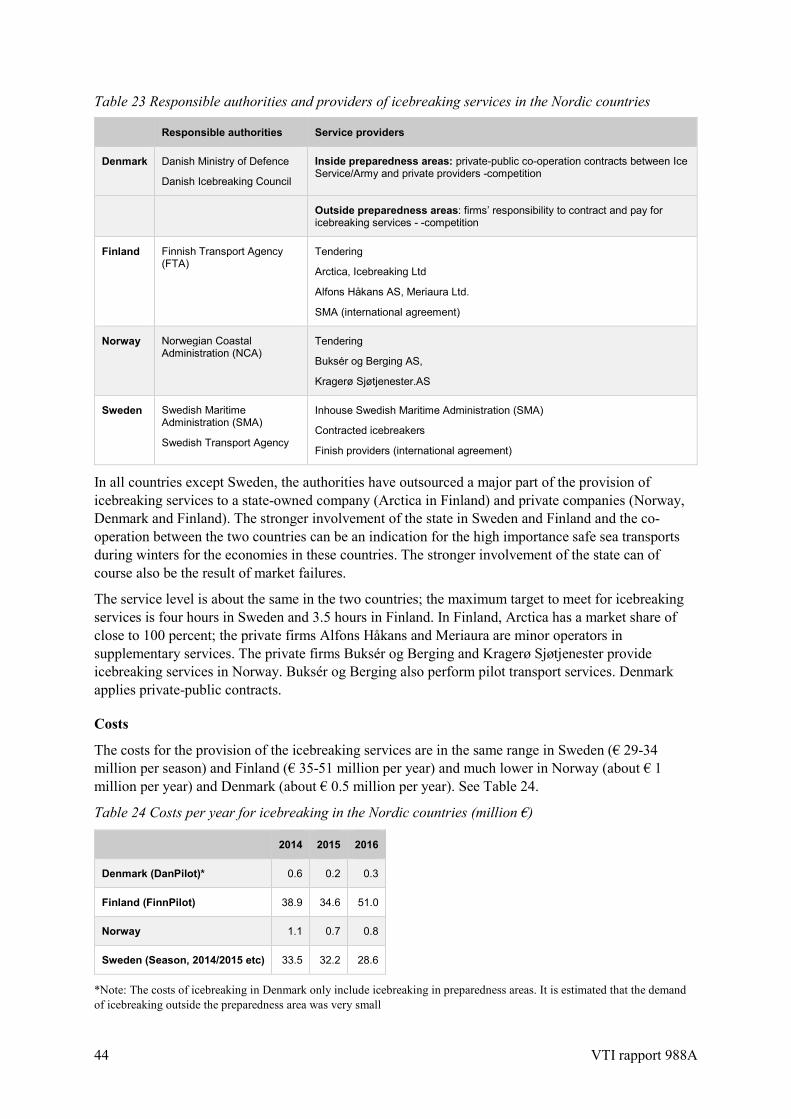
44 VTI rapport 988A
Table 23 Responsible authorities and providers of icebreaking services in the Nordic countries
Responsible authorities Service providers
Denmark Danish Ministry of Defence
Danish Icebreaking Council
Inside preparedness areas: private-public co-operation contracts between Ice Service/Army and private providers -competition
Outside preparedness areas: firms’ responsibility to contract and pay for icebreaking services - -competition
Finland Finnish Transport Agency (FTA)
Tendering
Arctica, Icebreaking Ltd
Alfons Håkans AS, Meriaura Ltd.
SMA (international agreement)
Norway Norwegian Coastal Administration (NCA)
Tendering
Buksér og Berging AS,
Kragerø Sjøtjenester.AS
Sweden Swedish Maritime Administration (SMA)
Swedish Transport Agency
Inhouse Swedish Maritime Administration (SMA)
Contracted icebreakers
Finish providers (international agreement)
In all countries except Sweden, the authorities have outsourced a major part of the provision of icebreaking services to a state-owned company (Arctica in Finland) and private companies (Norway, Denmark and Finland). The stronger involvement of the state in Sweden and Finland and the co-operation between the two countries can be an indication for the high importance safe sea transports during winters for the economies in these countries. The stronger involvement of the state can of course also be the result of market failures.
The service level is about the same in the two countries; the maximum target to meet for icebreaking services is four hours in Sweden and 3.5 hours in Finland. In Finland, Arctica has a market share of close to 100 percent; the private firms Alfons Håkans and Meriaura are minor operators in supplementary services. The private firms Buksér og Berging and Kragerø Sjøtjenester provide icebreaking services in Norway. Buksér og Berging also perform pilot transport services. Denmark applies private-public contracts.
Costs
The costs for the provision of the icebreaking services are in the same range in Sweden (€ 29-34 million per season) and Finland (€ 35-51 million per year) and much lower in Norway (about € 1 million per year) and Denmark (about € 0.5 million per year). See Table 24.
Table 24 Costs per year for icebreaking in the Nordic countries (million €)
2014 2015 2016
Denmark (DanPilot)* 0.6 0.2 0.3
Finland (FinnPilot) 38.9 34.6 51.0
Norway 1.1 0.7 0.8
Sweden (Season, 2014/2015 etc) 33.5 32.2 28.6
*Note: The costs of icebreaking in Denmark only include icebreaking in preparedness areas. It is estimated that the demand of icebreaking outside the preparedness area was very small
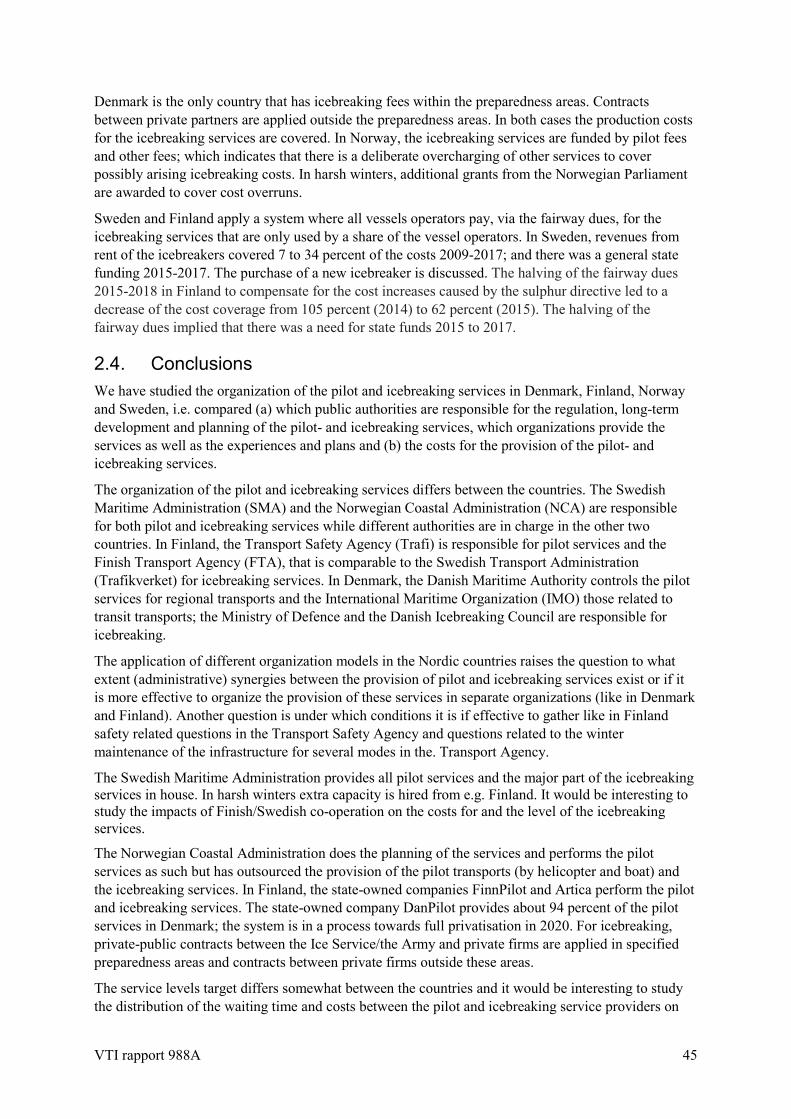
VTI rapport 988A 45
Denmark is the only country that has icebreaking fees within the preparedness areas. Contracts between private partners are applied outside the preparedness areas. In both cases the production costs for the icebreaking services are covered. In Norway, the icebreaking services are funded by pilot fees and other fees; which indicates that there is a deliberate overcharging of other services to cover possibly arising icebreaking costs. In harsh winters, additional grants from the Norwegian Parliament are awarded to cover cost overruns.
Sweden and Finland apply a system where all vessels operators pay, via the fairway dues, for the icebreaking services that are only used by a share of the vessel operators. In Sweden, revenues from rent of the icebreakers covered 7 to 34 percent of the costs 2009-2017; and there was a general state funding 2015-2017. The purchase of a new icebreaker is discussed. The halving of the fairway dues 2015-2018 in Finland to compensate for the cost increases caused by the sulphur directive led to a decrease of the cost coverage from 105 percent (2014) to 62 percent (2015). The halving of the fairway dues implied that there was a need for state funds 2015 to 2017.
2.4. Conclusions We have studied the organization of the pilot and icebreaking services in Denmark, Finland, Norway and Sweden, i.e. compared (a) which public authorities are responsible for the regulation, long-term development and planning of the pilot- and icebreaking services, which organizations provide the services as well as the experiences and plans and (b) the costs for the provision of the pilot- and icebreaking services.
The organization of the pilot and icebreaking services differs between the countries. The Swedish Maritime Administration (SMA) and the Norwegian Coastal Administration (NCA) are responsible for both pilot and icebreaking services while different authorities are in charge in the other two countries. In Finland, the Transport Safety Agency (Trafi) is responsible for pilot services and the Finish Transport Agency (FTA), that is comparable to the Swedish Transport Administration (Trafikverket) for icebreaking services. In Denmark, the Danish Maritime Authority controls the pilot services for regional transports and the International Maritime Organization (IMO) those related to transit transports; the Ministry of Defence and the Danish Icebreaking Council are responsible for icebreaking.
The application of different organization models in the Nordic countries raises the question to what extent (administrative) synergies between the provision of pilot and icebreaking services exist or if it is more effective to organize the provision of these services in separate organizations (like in Denmark and Finland). Another question is under which conditions it is if effective to gather like in Finland safety related questions in the Transport Safety Agency and questions related to the winter maintenance of the infrastructure for several modes in the. Transport Agency.
The Swedish Maritime Administration provides all pilot services and the major part of the icebreaking services in house. In harsh winters extra capacity is hired from e.g. Finland. It would be interesting to study the impacts of Finish/Swedish co-operation on the costs for and the level of the icebreaking services.
The Norwegian Coastal Administration does the planning of the services and performs the pilot services as such but has outsourced the provision of the pilot transports (by helicopter and boat) and the icebreaking services. In Finland, the state-owned companies FinnPilot and Artica perform the pilot and icebreaking services. The state-owned company DanPilot provides about 94 percent of the pilot services in Denmark; the system is in a process towards full privatisation in 2020. For icebreaking, private-public contracts between the Ice Service/the Army and private firms are applied in specified preparedness areas and contracts between private firms outside these areas.
The service levels target differs somewhat between the countries and it would be interesting to study the distribution of the waiting time and costs between the pilot and icebreaking service providers on

46 VTI rapport 988A
the one side and the vessel operator/shippers on the other side, and to investigate the optimal service levels for society (service providers, vessel operators and shippers).

VTI rapport 988A 47
3. Part 2: Update of Swedish external costs related to sea transports
3.1. Introduction In chapter 3, we update the estimates of the Swedish external costs caused by sea transports that are presented in our previous report (Vierth, 2016)). The update comprises revised and more differentiated information for the vessel-kilometres and the fuel consumption (3.2). The monetary valuations are brought up-to-date and adjusted to the price level 2017 (3.3). The calculation of the degree of internalization of the external costs is also updated (3.4). Some conclusions regarding the cost update are drawn in section 3.5.
Sweden is one of the few countries that have fairway dues that contribute to the internalization of the external costs. It is difficult to compare the calculated external costs and degrees of internalization to corresponding figures in other countries as there is no international consensus on which geographic area, costs and internalizing fees should be considered. A Dutch study, Schroten et al. (2014), includes half the distance to/from the destinations abroad and calculates that about 15 percent of the external costs are internalized via port fees. This is also discussed in Sweden, see e.g. (Andersson, 2018). However, a government document (Regeringen, 2018) comprises a discussion about the GNG caused by international passenger transports by air but not for international transports by sea. A public investigation “Miljömålsberedningen” recommended not to include to GNG caused by international air and sea transports in the national long-term climate objective to 2045.15 Regarding GNG from international sea transports, the government stresses the importance of an active participation in the International Maritime Organization (IMO) and the EU and that national measures promoting electrification and the use of alternative fuels in shipping can be complementary to international measures, (Regeringen, 2018).
3.2. Vessel-kilometres and fuel consumption The update of the vessel-kilometres and the fuel consumption is based on the study that SSPA carried out on behalf of VTI and the Swedish Energy Agency (SSPA, 2018). This study is a follow-up of the study that VTI commissioned earlier (SSPA, 2016). The purpose in SSPA’s study 2018 was
• to quantify the vessel-kilometres and fuel consumption for different vessel types and geographical areas with help of AIS-data and other input. The vessel-kilometres for eight vessel types are presented for (i) Swedish waters (Sveriges sjöterritorium) twelve nautic miles from baseline16, which is our focus, (ii) national sea transports between the Swedish ports17 as the climate policy target is specified for these transports (Ministry of the Environment and Energy (2017)) and for (iii) Sweden’s economic zone that is larger than the Swedish waters 18 as this demarcation is mentioned in some publications. We also include rough estimates on the vessel-kilometres related to Swedish goods all over the world. (See 3.2.1) and
• to identify the mix of the different fuel types in total and their distribution over the different vessel types based on interviews with fuel suppliers and ship owners (See 3.2.2).
15 “Miljömålsberedningen föreslår dock att utsläpp från utrikes flyg och sjöfart inte borde ingå i det långsiktiga nationella utsläppsminskningsmålet till 2045, p. 102 (Regeringen, 2018). 16 http://www.sjofartsverket.se/sv/Maritima-Tjanster/Havsgranser/Sjoterritoriets-grans-i-havet/ 17 In 2017, about 13 percent of total throughput (for both loading and unloading, which implies double counting of the tonnes for national transports) in the Swedish ports was related to national sea transports. 18 http://www.sjofartsverket.se/sv/Maritima-Tjanster/Havsgranser/Grans-for-ekonomisk-zon/

48 VTI rapport 988A
The “base year” 2015 is applied to facilitate comparisons to (SSPA, 2016) and other sources (3.2.3.); this year includes the implementation of the sulphur directive in the sulphur emission control area (SECA comprising the Baltic Sea, the North Sea and the English Channel) that led to major reductions of sulphur emissions. New international fuel reporting systems are also presented (3.2.4).
3.2.1. Vessel-kilometres SSPA’s calculation of the vessel-kilometres and fuel consumption 2018 is based on the data for 2,884 individual vessels19 that performed about 1.3 million individual trips in 2015. Fishing vessels, military vessels, minor vessels and vessels that only sail in archipelago and recreational boats are excluded. Based on that, the number of vessel-kilometers in 2015 is calculated to be about 10.4 million within the Swedish waters, about 5.1 million between the Swedish ports and almost 15.1 million in the Swedish economic zone (See Table 25). Ro-pax vessels, tankers and general cargo vessels had the longest sailed distance in Swedish waters.20
In addition to the statistics above, (SSPA, 2018) produced maps that show the routes that the vessels sail: the green flows are flows between Swedish ports and the yellow flows international flows to or from a Swedish port, see Figure 10–Figure 12. Please note that the green flows are not a subset of the yellow flows.21 (The green and the yellow flows are combined to calculate the vessel-kilometres in the Swedish waters and the Swedish economic zone.) When calculating the vessels-kilometres for national transports between Swedish ports (see column 2 in Table 25) the vessels-kilometres outside Swedish waters are included. These vessel-kilometres stand for a small part of the total national vessel-kilometres and the sea transports22.
The figures in the last column must be treated as rough estimates that need to be taken with a pinch of salt. We do e.g. not have detailed information about where Swedish goods in which ports transferred and which vessels carry Swedish goods.
19 AIS type no. 60-90, see (Marine Traffic, 2018)) 20 Domestic transports between Swedish ports are not subset of transports in Swedish waters as they can go outside this zone. 21 The green and the yellow flows are combined to calculate the vessel-kilometres in the Swedish waters and the Swedish economic zone 22 In 2017, about 13 percent of total throughput (for both loading and unloading, which implies double counting of the tonnes for national transports) in the Swedish ports was related to national sea transports.

VTI rapport 988A 49
Table 25 Vessel-kilometers and shares for different vessel types and geographical areas 2015
Calculated based on AIS-data Rough estimate based on AIS-data and
Swedish national freight transport model
Samgods
Vessel type National
transports
Swedish
waters
Economic
zone
World wide
Bulk 223,954 (4%) 271,083 (3%) 441,763 (3%) Ca 4,800,000
Container 208, 725 (4%) 477,860 (5%) 917,762 (6%) Ca 7,400,000
General Cargo* 542,858 (11%) 2,399,132 (23%) 4,075,806 (27%) Ca 42,100,000
Cruise 5,849 (0,1%) 146,332 (1%) 244,462 (2%) ?23
Ro-Ro** 549,662 (11%) 583,434 (6%) 584,737 (4%) Ca 730,000
Ro-pax*** 2,116,331 (41%) 2,561,536 (25%) 3,168,761 (21%) Ca 19,600,000
Tanker 732,400 (14%) 2,613,302 (25%) 3,295,567 (22%) Ca 45,900,000
Other 755,936 (15%) 1,342,163 (13%) 2,400,372 (16%) Ca 20,000,000
Total 5,135,715 10,394,842 15,129,230 Ca 140,000,000
Source: SSPA (2018)
*General Cargo vessels have a cargo space that is designed to carry different types of cargo.
**Ro-ro vessels, roll on, roll off vessel, are designed to easily load and unload cargo
***Ro-pax vessels, roll-on/roll off passenger vessel, combine passenger and cargo capacity.
23 Cruise vessels are not included in the Samgods model

50 VTI rapport 988A
Figure 10. National vessel-kilometers (between Swedish ports) 2015.
Figure 11 National (left) and international (right) vessel-kilometres in Swedish waters.

VTI rapport 988A 51
Figure 12 National (left) and international (right) vessel-kilometres in Swedish economic zone.
3.2.2. Fuel consumption
Marine fuels
In 2015, the sulphur directive (IMO, 2018(a)) was introduced by the International Maritime Organization (IMO), requiring a maximum of 0.1% by weight of sulphur in marine fuels in the Sulphur Emission Control Area (SECA) that comprises the Baltic Sea, the North Sea and the English Channel. This implied that new petroleum-based fuels and non-petroleum-based fuels and scrubbers (see below) were offered on the market.
Heavy Fuel Oil (HFO) is a thick marine oil (residual oil) that arises from the distillation of crude oil. Different sub categories with different sulphur content can be distinguished: High Sulphur Fuel Oils (HSFO) with max 3.5% sulphur, Low Sulphur Heavy Fuel (LSHFO) with max 1.0% sulphur and Ultra Low Sulphur Heavy Fuel (ULSHFO) with max 0.1% sulphur often referred to as SECA fuel as it fulfills the requirements in this area. In Sweden, ULSFO is used by most of the vessel types, except those that sail in the archipelagos.
Marine Gas Oil (MGO) or marine gas oil, is a medium crude petroleum distillate that forms the basis of light fuel oils and diesel fuel. Auxiliary machines (Help machines) are generally powered by MGO, but many vessels use MGO for propulsion of the main machine. The MGO used in the SECA is called LSMGO and contains max. 0.1% sulphur. MGO is used by all vessel categories in SSPA’s study.
Marine Diesel Oil (MDO) is typically a distillate but may also contain some residual oil. According to SSPA (2018) the most commonly used fuel used in the Environmental Class 124 is marine diesel with five percent RME (rap methyl ester ). The sulphur content of MK1 is max 0.001%.
Liquefied Natural Gas (LNG) is a natural gas cooled down to liquid form and consists generally of methane. LNG has a boiling point of -162° C and is therefore a cryogenic liquid, which means that
2424 Miljöklass MK 1
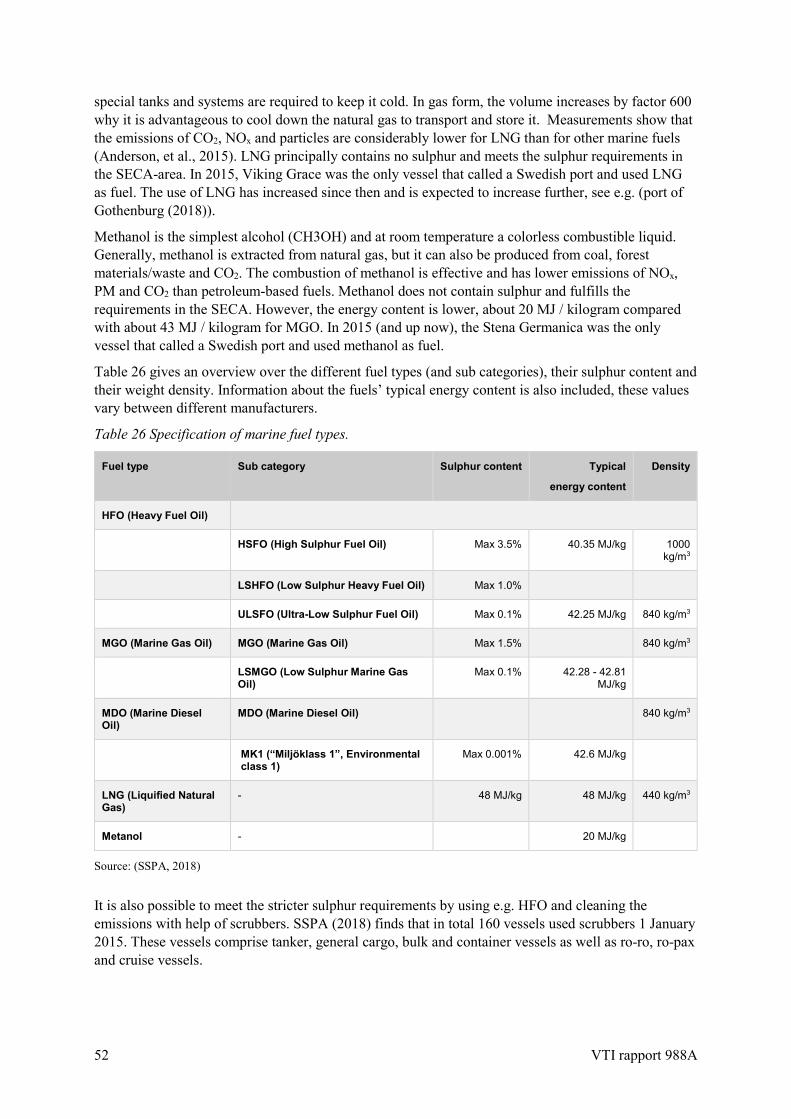
52 VTI rapport 988A
special tanks and systems are required to keep it cold. In gas form, the volume increases by factor 600 why it is advantageous to cool down the natural gas to transport and store it. Measurements show that the emissions of CO2, NOx and particles are considerably lower for LNG than for other marine fuels (Anderson, et al., 2015). LNG principally contains no sulphur and meets the sulphur requirements in the SECA-area. In 2015, Viking Grace was the only vessel that called a Swedish port and used LNG as fuel. The use of LNG has increased since then and is expected to increase further, see e.g. (port of Gothenburg (2018)).
Methanol is the simplest alcohol (CH3OH) and at room temperature a colorless combustible liquid. Generally, methanol is extracted from natural gas, but it can also be produced from coal, forest materials/waste and CO2. The combustion of methanol is effective and has lower emissions of NOx, PM and CO2 than petroleum-based fuels. Methanol does not contain sulphur and fulfills the requirements in the SECA. However, the energy content is lower, about 20 MJ / kilogram compared with about 43 MJ / kilogram for MGO. In 2015 (and up now), the Stena Germanica was the only vessel that called a Swedish port and used methanol as fuel.
Table 26 gives an overview over the different fuel types (and sub categories), their sulphur content and their weight density. Information about the fuels’ typical energy content is also included, these values vary between different manufacturers.
Table 26 Specification of marine fuel types.
Fuel type Sub category Sulphur content Typical
energy content
Density
HFO (Heavy Fuel Oil)
HSFO (High Sulphur Fuel Oil) Max 3.5% 40.35 MJ/kg 1000 kg/m3
LSHFO (Low Sulphur Heavy Fuel Oil) Max 1.0%
ULSFO (Ultra-Low Sulphur Fuel Oil) Max 0.1% 42.25 MJ/kg 840 kg/m3
MGO (Marine Gas Oil) MGO (Marine Gas Oil) Max 1.5% 840 kg/m3
LSMGO (Low Sulphur Marine Gas Oil)
Max 0.1% 42.28 - 42.81 MJ/kg
MDO (Marine Diesel Oil)
MDO (Marine Diesel Oil) 840 kg/m3
MK1 (“Miljöklass 1”, Environmental class 1)
Max 0.001% 42.6 MJ/kg
LNG (Liquified Natural Gas)
- 48 MJ/kg 48 MJ/kg 440 kg/m3
Metanol -
20 MJ/kg
Source: (SSPA, 2018)
It is also possible to meet the stricter sulphur requirements by using e.g. HFO and cleaning the emissions with help of scrubbers. SSPA (2018) finds that in total 160 vessels used scrubbers 1 January 2015. These vessels comprise tanker, general cargo, bulk and container vessels as well as ro-ro, ro-pax and cruise vessels.

VTI rapport 988A 53
Fuel consumption
In our previous and this report, we focus on the fuel consumption of the propulsion of the vessels and exclude the fuel consumption of the auxiliary engines for lighting, cooling, heating, water purification etc. at berth and at anchorage. One argument for the concentration of the fuel consumption of the main machine is the possibility to compare indicators like external marginal costs per (additional) kilometre to the other modes. Therefore, SSPA calculated the fuel consumption for the vessel propulsion only, in the studies 2016 and 2018.
(SSPA, 2016) and (Vierth, 2016) assumed that MGO was the only fuel that was used; this assumption was relaxed in 2018. The distribution over the different fuel types in Table 27 has been derived with help of interviews. See (SSPA, 2018).
Table 27 Fuel consumption for vessel propulsion 2015 per fuel type for different geographical areas
Fuel type* National
transports
Swedish
waters
Economic
zone
National
transports
Swedish
waters
Economic
zone
Cubic meters Tonnes
HSFO (HFO) 1 164 (1%) 17 107 (6%) 29 159 (7%) 1 164 17 107 29 159
ULSFO (HFO) 37 535 (37%) 105 511 (39%) 159 652 (41%) 31 529 88 629 134 108
MGO 42 332 (42%) 110 308 (41%) 164 452 (42%) 35 560 92 658 138 138
MDO 19 196 (19%) 19 188 (7%) 19 195 (5%) 16 124 16 118 16 124
LNG 0 (0%) 17 528 (7%) 17 528 (4%) 0 7 713 7 713
Total 100 227 269 642 389 986 84 377 222 225 325 242
Source: SSPA (2018) (*Methanol is not included as the share 2015 was very small (Hörteborn (2018))
The different fuels make up similar shares when measured in cubic meters and tonnes, except for LNG, that has a lower density than the other fuels and therefore makes up a smaller share of fuel consumption in tonnes. ULSFO and MGO represent similar parts and together account for about 80 percent of the fuel consumption in the three geographic areas. HSFO, MDO and LNG make up relatively equal parts of the rest of the fuel consumption in Swedish waters. MDO has a 19 percent share in the national transports segment, which is explained by a high use of this fuel in the archipelago traffic.
The distribution of the fuel consumption on eight vessel types and three geographic areas is shown in Table 28. Ro-pax vessels are calculated to stand for nearly half of the fuel consumption in Swedish waters. The highest fuel consumption in Swedish waters per cubic meters is calculated for ro-pax-vessels and cruise vessels and the lowest for tankers and general cargo vessels.
The calculations of the fuel consumption in (SSPA, 2018) are based on AIS-data, that include information about the individual vessels’ speeds. SSPA applies an approach developed by the ITTC (International Towing Tank Conference). The method is based on the energy required to pull the hull through water at a certain speed.25 The method is based on ITTC 57 for deep-water resistance and an estimated efficiency. Regarding sea margin, a detailed calculation of the impact of the bottom topography as well as a general mark up of ten percent is included. Waves are included as a fixed charge; the effects of wind, streams, tides and shallow water are not considered. The sizes and speeds
25 As mentioned above, consumers on board that are not related to the propulsion are not considered.

54 VTI rapport 988A
of the single vessels within the different vessel types contribute to the differences in fuel consumptions per vessel-kilometre in the different areas (see last three columns in Table 28).
Table 28 Fuel consumption in cubic meters and in cubic meters per vessel-kilometer 2015 for different vessel types and areas.
Vessel type National
transports
Swedish
waters
Economic
zone
National
transports
Swedish
waters
Economic
Zone
Fuel (m3) Fuel (m3) per vessel-km
Bulk 5 474 (5%) 7 556 (3%) 12 711 (3%) 24,4 27,9 28,8
Container 6 355 (6%) 15 444 (6%) 29 020 (7%) 30,4 32,3 31,6
General cargo 8 639 (9%) 36 019 (13%) 54 819 (14%) 15,9 15,0 13,4
Cruise 195 (0%) 6 559 (2%) 13 195 (3%) 33,3 44,8 54,0
Ro-ro 5 126 (5%) 17 710 (7%) 32 071 (8%) 9,3 30,4 54,8
Ro-pax 40 289 (40%) 130 472 (48%) 165 835 (42%) 19,0 50,9 52,3
Tanker 13 961 (14%) 32 839 (12%) 58 465 (15%) 19,1 12,6 17,7
Other 20 188 (20%) 23 043 (9%) 24 516 (6%) 26,7 17,2 10,2
Total 100 227 269 642 390 632 19,5 25,9 25,8
Source: SSPA (2018)
Comparison to other studies
Below we compare the vessel-kilometres and fuel consumption in SSPA’s studies 2016 and 2018. Table 29 reveals that 36 percent fewer vessel-kilometres and a 40 percent lower fuel consumption (in tonnes) are calculated in the study 2018. The main differences between the studies 2016 and 2018, that contribute to the different results, are presented in the table. The results in (SSPA, 2018) reveal that (SSPA, 2016) has misjudged the lower limit of the fuel consumption in Swedish waters 2015.26
26 ”SSPA anser att uppgifterna i Tabell 20 [370 661 ton] bör anses som en undre gräns för bränsleförbrukningen på svenskt sjöterritorium år 2015”, (Vierth, 2016).

VTI rapport 988A 55
Table 29 Vessel-kilometers and fuel consumption in Swedish waters in SSPA (2016) and SSPA (2018)
SSPA (2016) SSPA (2018)
Vessel kilometers 16 337 752 10 394 842
Fuel consumption (tonnes)
370 661 222 225
Main differences between the studies
Vessels in transit are included (that should not be included)
Vessels in transit are excluded
Assumption of general mark up for the” sea margin” of 20%
Detailed calculation of impact of bottom topography and general mark up of 10%
Assumption that MGO (energy content 46.2 MJ/kg) is used by all vessels
Information about the shares of the different fuel types (energy content ca 40 - 48 MJ/kg, is used
Source: (SSPA, 2018)
It is important to remember that the purpose of a study determines which demarcation for the marine fuel consumption is relevant. The fuel used for the propulsion of the vessels is i.e. relevant when calculating external marginal costs per (extra) kilometre and comparing the different modes of transport. However, the fuel that is used by the auxiliary engines at berth and at anchorage is relevant when calculating the total costs that sea transports cause for the society. The fuel consumed by the vessels’ main and auxiliary engines is also relevant when the objective is to reduce the CO2 emissions from national transports in Sweden; see (Ministry of the Environment and Energy, 2017), or to reach other environmental and climate objectives. In these cases, CO2 emissions arising from ships at berth or moving within ports, should also be covered, particularly as specific measures for their reduction or avoidance are available.
Below we compare the approach chosen in (SSPA, 2018) to the approaches chosen by the Swedish (SEA) Energy Agency and Statistics Sweden (SCB) resp. the Swedish Meteorological and Hydrological Institute (SMHI).
• SEA and SCB base their calculations on the marine fuel that is sold by all the Swedish fuel suppliers and the suppliers’ assessments on how much of the fuel is used for national transports. This means that the fuel that is used by the auxiliary engines should be included. It is obvious that the sold fuel does not have to correspond to used fuel. Besides, it can be difficult for the fuel suppliers to estimate the shares of the fuel that they sell that are used for national or international transports.
• SMHI investigated, on behalf of SEA, the possibilities of improving the fuel sales statistics for national transports by using AIS-data for the years 201 to 2015 and the SHIPAIR-mode system (SMHI (2017(a)). The calculations were updated in SMHI (2017(b)) by adding AIS-data for the years 2010, 2011, 2012 and 2016 and improving the calculations for vessels with missing data.
In all approaches in Table 30 the fuel consumption caused by (national) transports between the Swedish ports 2015 is calculated. The first line in the table shows that the calculated fuel consumption differs by factors up to 2.6 which is due to different delimitations and calculation methods.
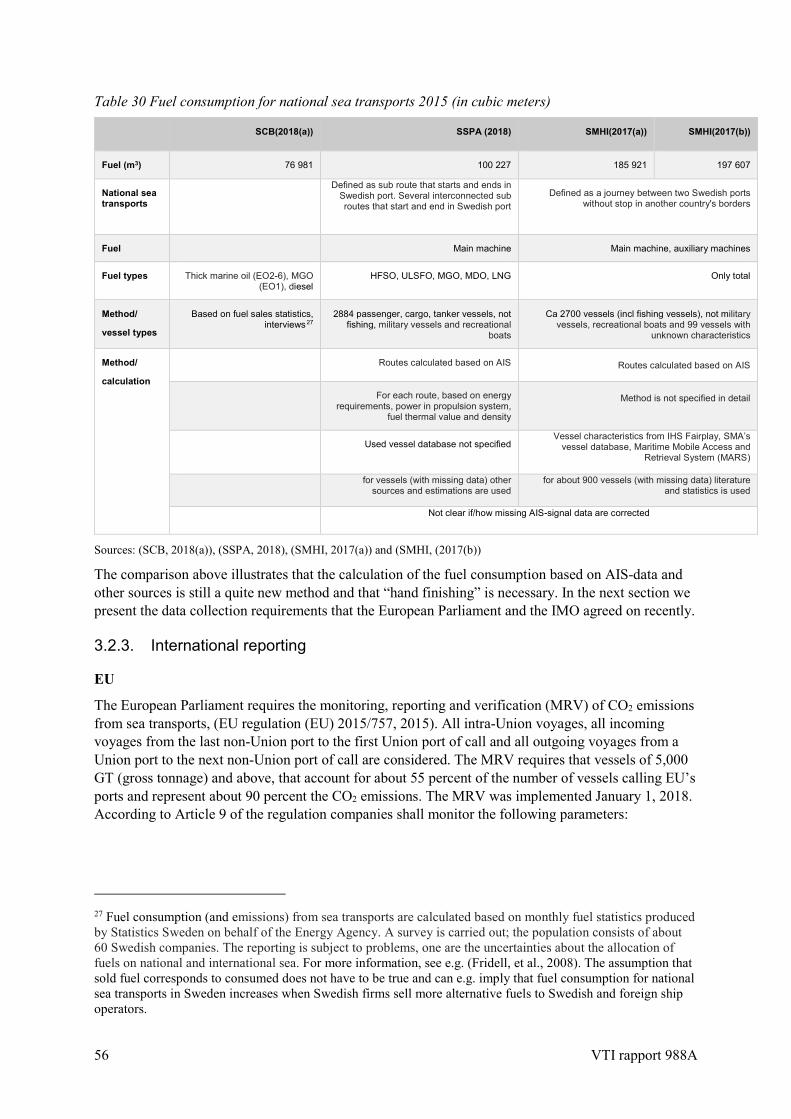
56 VTI rapport 988A
Table 30 Fuel consumption for national sea transports 2015 (in cubic meters)
SCB(2018(a)) SSPA (2018) SMHI(2017(a)) SMHI(2017(b))
Fuel (m3) 76 981 100 227 185 921 197 607
National sea transports
Defined as sub route that starts and ends in
Swedish port. Several interconnected sub routes that start and end in Swedish port
Defined as a journey between two Swedish ports without stop in another country's borders
Fuel Main machine Main machine, auxiliary machines
Fuel types Thick marine oil (EO2-6), MGO (EO1), diesel
HFSO, ULSFO, MGO, MDO, LNG Only total
Method/
vessel types
Based on fuel sales statistics, interviews27
2884 passenger, cargo, tanker vessels, not fishing, military vessels and recreational
boats
Ca 2700 vessels (incl fishing vessels), not military vessels, recreational boats and 99 vessels with
unknown characteristics
Method/
calculation
Routes calculated based on AIS
Routes calculated based on AIS
For each route, based on energy requirements, power in propulsion system,
fuel thermal value and density
Method is not specified in detail
Used vessel database not specified Vessel characteristics from IHS Fairplay, SMA’s
vessel database, Maritime Mobile Access and Retrieval System (MARS)
for vessels (with missing data) other
sources and estimations are used for about 900 vessels (with missing data) literature
and statistics is used
Not clear if/how missing AIS-signal data are corrected
Sources: (SCB, 2018(a)), (SSPA, 2018), (SMHI, 2017(a)) and (SMHI, (2017(b))
The comparison above illustrates that the calculation of the fuel consumption based on AIS-data and other sources is still a quite new method and that “hand finishing” is necessary. In the next section we present the data collection requirements that the European Parliament and the IMO agreed on recently.
3.2.3. International reporting
EU
The European Parliament requires the monitoring, reporting and verification (MRV) of CO2 emissions from sea transports, (EU regulation (EU) 2015/757, 2015). All intra-Union voyages, all incoming voyages from the last non-Union port to the first Union port of call and all outgoing voyages from a Union port to the next non-Union port of call are considered. The MRV requires that vessels of 5,000 GT (gross tonnage) and above, that account for about 55 percent of the number of vessels calling EU’s ports and represent about 90 percent the CO2 emissions. The MRV was implemented January 1, 2018. According to Article 9 of the regulation companies shall monitor the following parameters:
27 Fuel consumption (and emissions) from sea transports are calculated based on monthly fuel statistics produced by Statistics Sweden on behalf of the Energy Agency. A survey is carried out; the population consists of about 60 Swedish companies. The reporting is subject to problems, one are the uncertainties about the allocation of fuels on national and international sea. For more information, see e.g. (Fridell, et al., 2008). The assumption that sold fuel corresponds to consumed does not have to be true and can e.g. imply that fuel consumption for national sea transports in Sweden increases when Swedish firms sell more alternative fuels to Swedish and foreign ship operators.
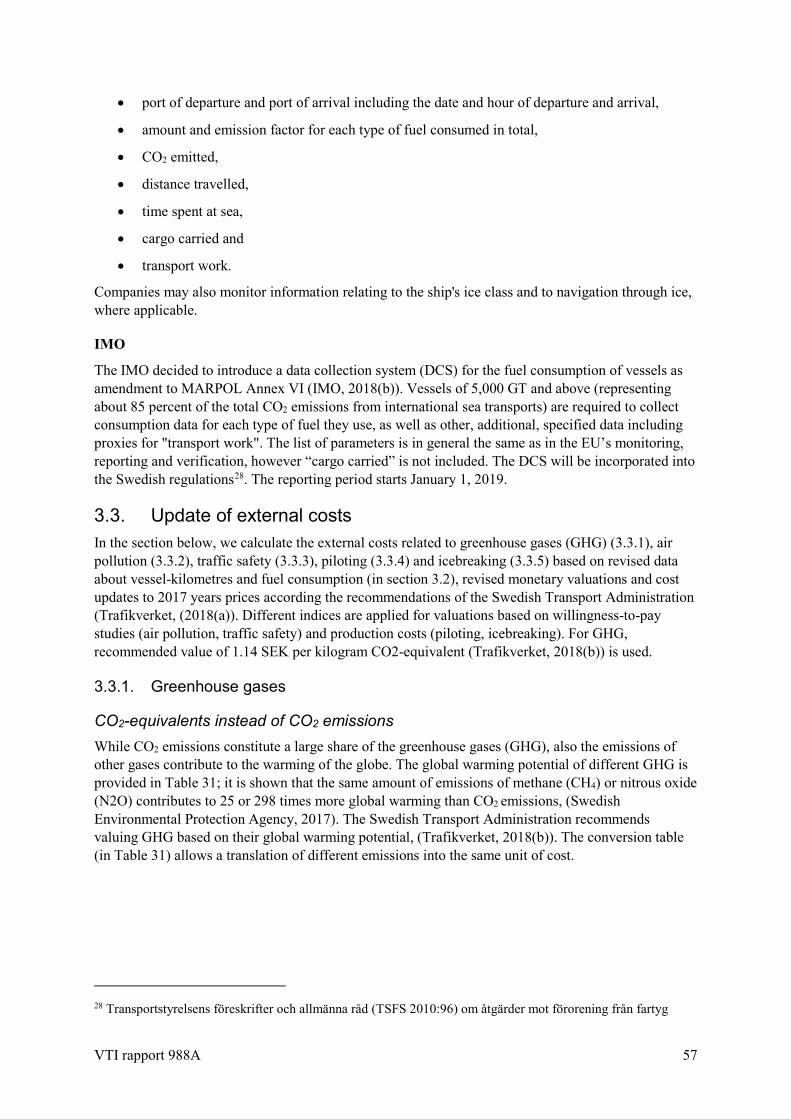
VTI rapport 988A 57
• port of departure and port of arrival including the date and hour of departure and arrival,
• amount and emission factor for each type of fuel consumed in total,
• CO2 emitted,
• distance travelled,
• time spent at sea,
• cargo carried and
• transport work.
Companies may also monitor information relating to the ship's ice class and to navigation through ice, where applicable.
IMO
The IMO decided to introduce a data collection system (DCS) for the fuel consumption of vessels as amendment to MARPOL Annex VI (IMO, 2018(b)). Vessels of 5,000 GT and above (representing about 85 percent of the total CO2 emissions from international sea transports) are required to collect consumption data for each type of fuel they use, as well as other, additional, specified data including proxies for "transport work". The list of parameters is in general the same as in the EU’s monitoring, reporting and verification, however “cargo carried” is not included. The DCS will be incorporated into the Swedish regulations28. The reporting period starts January 1, 2019.
3.3. Update of external costs In the section below, we calculate the external costs related to greenhouse gases (GHG) (3.3.1), air pollution (3.3.2), traffic safety (3.3.3), piloting (3.3.4) and icebreaking (3.3.5) based on revised data about vessel-kilometres and fuel consumption (in section 3.2), revised monetary valuations and cost updates to 2017 years prices according the recommendations of the Swedish Transport Administration (Trafikverket, (2018(a)). Different indices are applied for valuations based on willingness-to-pay studies (air pollution, traffic safety) and production costs (piloting, icebreaking). For GHG, recommended value of 1.14 SEK per kilogram CO2-equivalent (Trafikverket, 2018(b)) is used.
3.3.1. Greenhouse gases
CO2-equivalents instead of CO2 emissions While CO2 emissions constitute a large share of the greenhouse gases (GHG), also the emissions of other gases contribute to the warming of the globe. The global warming potential of different GHG is provided in Table 31; it is shown that the same amount of emissions of methane (CH4) or nitrous oxide (N2O) contributes to 25 or 298 times more global warming than CO2 emissions, (Swedish Environmental Protection Agency, 2017). The Swedish Transport Administration recommends valuing GHG based on their global warming potential, (Trafikverket, 2018(b)). The conversion table (in Table 31) allows a translation of different emissions into the same unit of cost.
28 Transportstyrelsens föreskrifter och allmänna råd (TSFS 2010:96) om åtgärder mot förorening från fartyg

58 VTI rapport 988A
Table 31 Conversion table for CO2 equivalent
Global Warming Potential
CO2 1
CH4 25
N2O 298
Source: (Swedish Environmental Protection Agency SEPA ,2017)
The emission factors in Table 32 are general values calculated as weighted averages in (IMO, 2015) and correspond relatively well to those recommended by the Swedish Transport Administration. These factors are assumed to be constant (per tonne fuel) and not affected by engine type, speed or sulphur fuel content, whereas the emission factors for air pollution (see 3.3.2) vary with these and other parameters.
Table 32 Emission factors, tonnes emissions per tonne fuel.
HFO
(ULSFO/HSFO)
MDO/MGO LNG
CO2 3,114 3,206 2,75
CH4 0,00006 0,00006 0,0512
N2O 0,00016 0,00015 0,00011
CO2-equivalents 3,16318 3,2522 4,06278
Source: IMO (2015).
Table 33 shows that the CO2 emissions in Swedish waters account for about 97 percent29 of the GHG measured in CO2-equivalents which is in line with those for national sea transports in SCB, 2018(b)) and international sea transports in (IMO, 2015). For LNG, the corresponding share is 68 percent; which means that 32 percent of the CO2-equivalents comes from methane and nitrous oxide.
Table 33 CO2 emissions and CO2 equivalents (tonnes) 2015 per fuel type for different areas
CO2-emissions CO2-equivalents
Fuel type National
transports
Swedish waters
Economic zone
National
transports
Swedish waters Economic zone
HSFO 3 625 53 271 90 801 3 682 54 113 92 235
ULSFO 98 181 275 991 417 612 99 732 280 349 424 208
MGO 114 005 297 062 442 870 115 648 301 342 449 252
MDO 51 694 51 674 51 694 52 438 52 419 52 438
LNG 0 21 211 21 211 0 31 336 31 336
Total 267 505 699 209 1 024 188 271 501 719 560 1 049 470
Source: Calculations based on SEPA (2017), IMO (2015) and SSPA (2018).
29 699 209 CO2 emissions / 719 560 CO2 equivalents
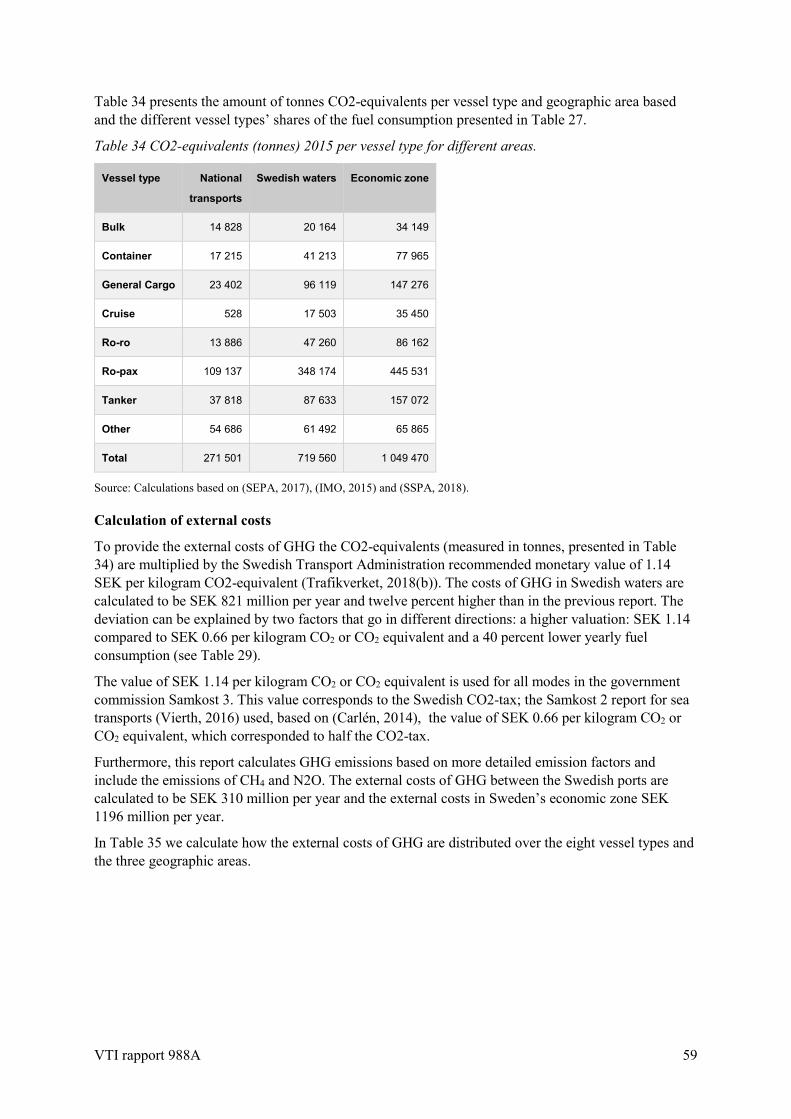
VTI rapport 988A 59
Table 34 presents the amount of tonnes CO2-equivalents per vessel type and geographic area based and the different vessel types’ shares of the fuel consumption presented in Table 27.
Table 34 CO2-equivalents (tonnes) 2015 per vessel type for different areas.
Vessel type National
transports
Swedish waters Economic zone
Bulk 14 828 20 164 34 149
Container 17 215 41 213 77 965
General Cargo 23 402 96 119 147 276
Cruise 528 17 503 35 450
Ro-ro 13 886 47 260 86 162
Ro-pax 109 137 348 174 445 531
Tanker 37 818 87 633 157 072
Other 54 686 61 492 65 865
Total 271 501 719 560 1 049 470
Source: Calculations based on (SEPA, 2017), (IMO, 2015) and (SSPA, 2018).
Calculation of external costs
To provide the external costs of GHG the CO2-equivalents (measured in tonnes, presented in Table 34) are multiplied by the Swedish Transport Administration recommended monetary value of 1.14 SEK per kilogram CO2-equivalent (Trafikverket, 2018(b)). The costs of GHG in Swedish waters are calculated to be SEK 821 million per year and twelve percent higher than in the previous report. The deviation can be explained by two factors that go in different directions: a higher valuation: SEK 1.14 compared to SEK 0.66 per kilogram CO2 or CO2 equivalent and a 40 percent lower yearly fuel consumption (see Table 29).
The value of SEK 1.14 per kilogram CO2 or CO2 equivalent is used for all modes in the government commission Samkost 3. This value corresponds to the Swedish CO2-tax; the Samkost 2 report for sea transports (Vierth, 2016) used, based on (Carlén, 2014), the value of SEK 0.66 per kilogram CO2 or CO2 equivalent, which corresponded to half the CO2-tax.
Furthermore, this report calculates GHG emissions based on more detailed emission factors and include the emissions of CH4 and N2O. The external costs of GHG between the Swedish ports are calculated to be SEK 310 million per year and the external costs in Sweden’s economic zone SEK 1196 million per year.
In Table 35 we calculate how the external costs of GHG are distributed over the eight vessel types and the three geographic areas.

60 VTI rapport 988A
Table 35 External costs of GHG 2015 for different vessel types and areas (million SEK)
Vessel type National
transports
Swedish waters Economic zone
Bulk 17 23 39
Container 20 47 89
General Cargo 27 110 168
Cruise 1 20 40
Ro-ro 16 54 98
Ro-pax 124 397 508
Tanker 43 100 179
Other 62 70 75
Total 310 821 1196
Source: Calculations based on (SEPA, 2017), (IMO, 2015), (SSPA, 2018) and (Trafikverket, 2018(b)).
3.3.2. Air pollution The calculation of the external costs of air pollution at the regional level is, as in the previous report, based on the monetary valuation developed in (Nerhagen, 2016). The calculation is based on the fuel consumption presented in Table 29 above, related emissions and by applying the Impact Pathway approach. The calculated valuations are in line with the European valuations (Ricardo, 2014). For details see (Nerhagen, 2016).
We update the values of SEK 1.288 per tonne fuel in the low alternative (that includes calculated health costs due to the exposure of secondary particles) and of SEK 1.545 per tonne in the high alternative (that also includes damage costs related to acidification, eutrophication and ozone based on expert judgements), that are given 2014 prices to 2017 prices. Following the recommendations in (Trafikverket, (2018(a)) an index of 1.09 is applied, that comprises a three percent higher consumer price index (CPI) and a six percent higher GDP per capita.
We consider also that about seven percent of the fuel that is used in the Swedish waters and about four percent that is used in the Swedish economic zone 2015 was LNG (see Table 27). SSPA (2018) reveal that the ro-pax vessel Viking Grace uses all this all LNG in 2015. As shown in Table 36 LNG produces about 90 percent less NOx emissions (per tonne fuel) than HFO and MDO.
Table 36 Emission factors, tonne emissions per tonne fuel.
HFO MDO LNG
NOx 0.093 0.08725 0.00783
CO 0.00277 0.00277 0.00783
NM VOC 0.00308 0.00308 0.00301
Source: IMO (2015).
The external costs of air pollution per year (incl. the correction for LNG) are calculated to be SEK 276 million per year in the low alternative and SEK 332 million in the high alternative. This implies that the costs of air pollution are about 40 percent lower than in the previous report. The difference can be

VTI rapport 988A 61
explained by the about 40 percent lower fuel consumption (see Table 29), the nine percent higher monetary valuations and the correction for LNG’s lower NOx emissions. The approach to correct for the fact that LNG causes lower air pollution costs than other marine fuels is simple and needs to be improved considering the growing use of LNG and other new fuels and energy sources.
Table 37 External costs (million SEK) of air pollution per year excl. and incl. correction for LNG
Excluding correction for LNG Including correction for LNG
National
transports
Swedish waters Economic zone National
transports
Swedish waters Economic zone
Low alternative 109 286 419 109 278 409
High alternative 130 343 502 130 332 491
Source: Calculations based on SSPA (2018) and Nerhagen (2016).
Table 38 distributes the yearly costs of air pollution in the high and low alternative on the different vessel types and areas, based on the fuel consumption presented in Table 28. Ideally it should be considered which vessel types consume which fuel types; however, this was not possible within this project.
Table 38 External costs of air pollution per year incl. correction for LNG (million SEK) for different vessel types and areas
Low alternative High alternative
Vessel type National
transports
Swedish
waters
Economic
zone
National
transports
Swedish
waters
Economic
zone
Bulk 6 8 13 7 9 16
Container 7 16 30 8 19 36
General cargo 9 37 57 11 44 69
Cruise 0 7 14 0 8 17
Ro-ro 6 18 34 7 22 40
Ro-pax 44 134 174 52 160 208
Tanker 15 34 61 18 40 73
Other 22 24 26 26 28 31
Total 109 278 409 130 332 491
Finally, we would like to stress that it is very important to ensure the quality of the calculation of the fuel consumption per fuel types (see also 3.2.2) as these input data are crucial for the calculation of the yearly external costs of GHG and air pollution.
3.3.3. Traffic safety In the calculation of the external costs of traffic safety we apply the average number of killed and injured persons from the previous report (Vierth, 2016). These figures exclude accidents related to loading unloading in the port (landside), work accidents on board as well as people that die due to illnesses, commit suicide or disappear. The average number is based on data for the period 1985-

62 VTI rapport 988A
201530. We would like to stress that the figures in Table 39 comprise all nationalities, as for the other modes of transport. It is impossible (or at least very difficult) to update long time series. However, as already stated in our previous report we see a need to ensure that different public authorities apply harmonized definitions and data bases. As for the fuel consumption and emissions different delimitations are required for different types of questions.
February, 1, 2017 new simplified regulations for the reporting of accidents were implemented. The feedback from the vessel operators was positive (they can e. g use their own forms), but it is too early to judge to if/what extend the reporting, i.e. the number and description of incidents, has improved.
Table 39 Number of killed and injured people on passenger- and freight vessels in Sweden, Kattegatt, the Sound, belts and Baltic Sea as proxy for Swedish waters 1985-2015,
Average number per year Fatalities Injured persons
Passenger vessels 0,6 18,4
Cargo vessels 2,5 9
Total 3,1 27,4
Sources: SOS (Transportstyrelsens databas SjöOlycksSystem and (Vierth, 2016)
Personal damages are assumed not to be internalized; material damages are assumed to be internalized via insurances.
Regarding the valuation of killed and injured persons, we apply the values that were recommended by the Swedish Transport Administration until 31 March 2018 (Trafikverket, 2016(b)) in the base case and the values that are recommended since 1 April 2018 (Trafikverket, 2018(c)) in a sensitivity analysis. We also update the values in (Trafikverket, 2016(b)) from 2014 prices to 2017 prices by applying the index 1.09 (as for air pollution above). See Table 40.
Table 40 Valuation of fatalities, injuries and property damages (million SEK) according to (Trafikverket, 2016(b)) and (Trafikverket, 2018(c)
Valuation Trafikverket (2016)
2014 prices
Trafikverket (2016)
2017 prices
Trafikverket (2018)
2014 prices
Trafikverket (2018)
2017 prices
Fatality 25.400 27.700 46.600 50.794
Severe injury 4.700 5.100 12.850 14.007
Non-severe injury 0.230 0.300 4.24 4.62
Property damage . 0.015 0.015
Source: Trafikverket (2016(b)) and (Trafikverket, (2018(c)).
Based on our simple approach we calculate in the base case yearly external costs of traffic safety of SEK 93 million in the low alternative, where we assume that all injuries are non-severe injuries, and SEK 226 million in the high alternative, where we assume that all injuries are severe injuries. These assumptions are required as the SOS-database does not differentiate between severe and non-severe injuries. See Table 41.
30 (ecluding 158 persones that were killed by the fire on the MS Scandinavian Star 1990.
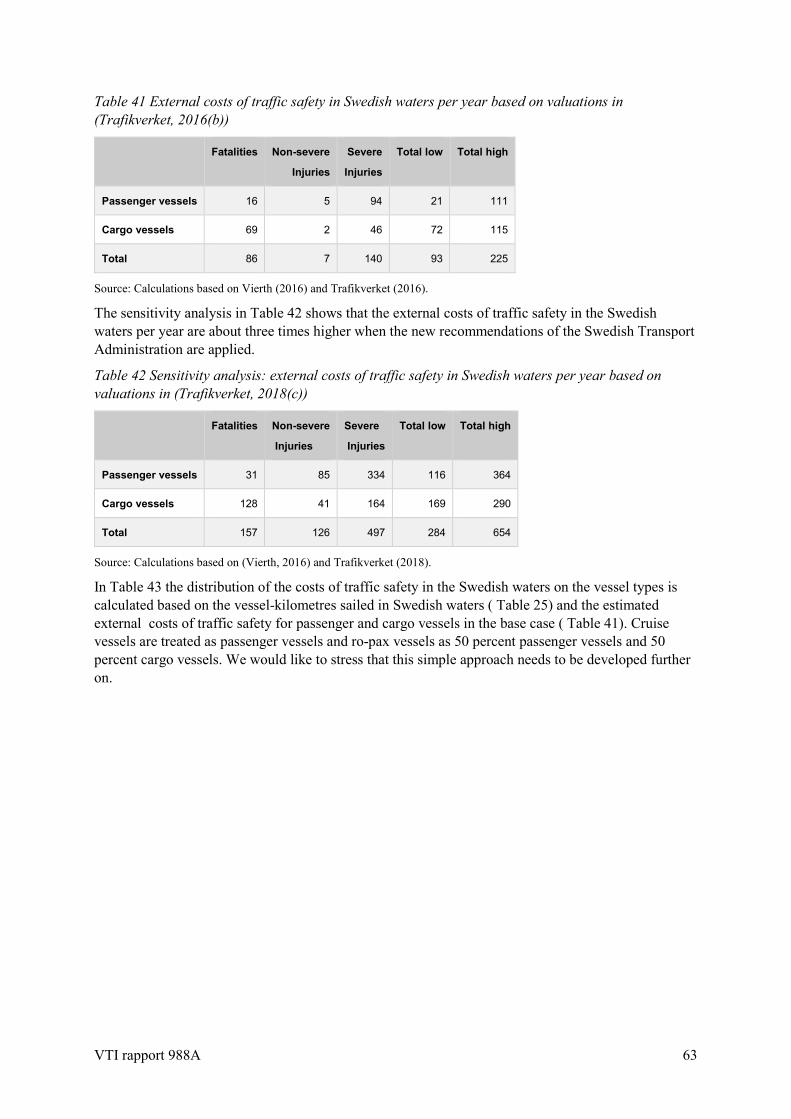
VTI rapport 988A 63
Table 41 External costs of traffic safety in Swedish waters per year based on valuations in (Trafikverket, 2016(b))
Fatalities Non-severe
Injuries
Severe
Injuries
Total low Total high
Passenger vessels 16 5 94 21 111
Cargo vessels 69 2 46 72 115
Total 86 7 140 93 225
Source: Calculations based on Vierth (2016) and Trafikverket (2016).
The sensitivity analysis in Table 42 shows that the external costs of traffic safety in the Swedish waters per year are about three times higher when the new recommendations of the Swedish Transport Administration are applied.
Table 42 Sensitivity analysis: external costs of traffic safety in Swedish waters per year based on valuations in (Trafikverket, 2018(c))
Fatalities Non-severe
Injuries
Severe
Injuries
Total low Total high
Passenger vessels 31 85 334 116 364
Cargo vessels 128 41 164 169 290
Total 157 126 497 284 654
Source: Calculations based on (Vierth, 2016) and Trafikverket (2018).
In Table 43 the distribution of the costs of traffic safety in the Swedish waters on the vessel types is calculated based on the vessel-kilometres sailed in Swedish waters ( Table 25) and the estimated external costs of traffic safety for passenger and cargo vessels in the base case ( Table 41). Cruise vessels are treated as passenger vessels and ro-pax vessels as 50 percent passenger vessels and 50 percent cargo vessels. We would like to stress that this simple approach needs to be developed further on.
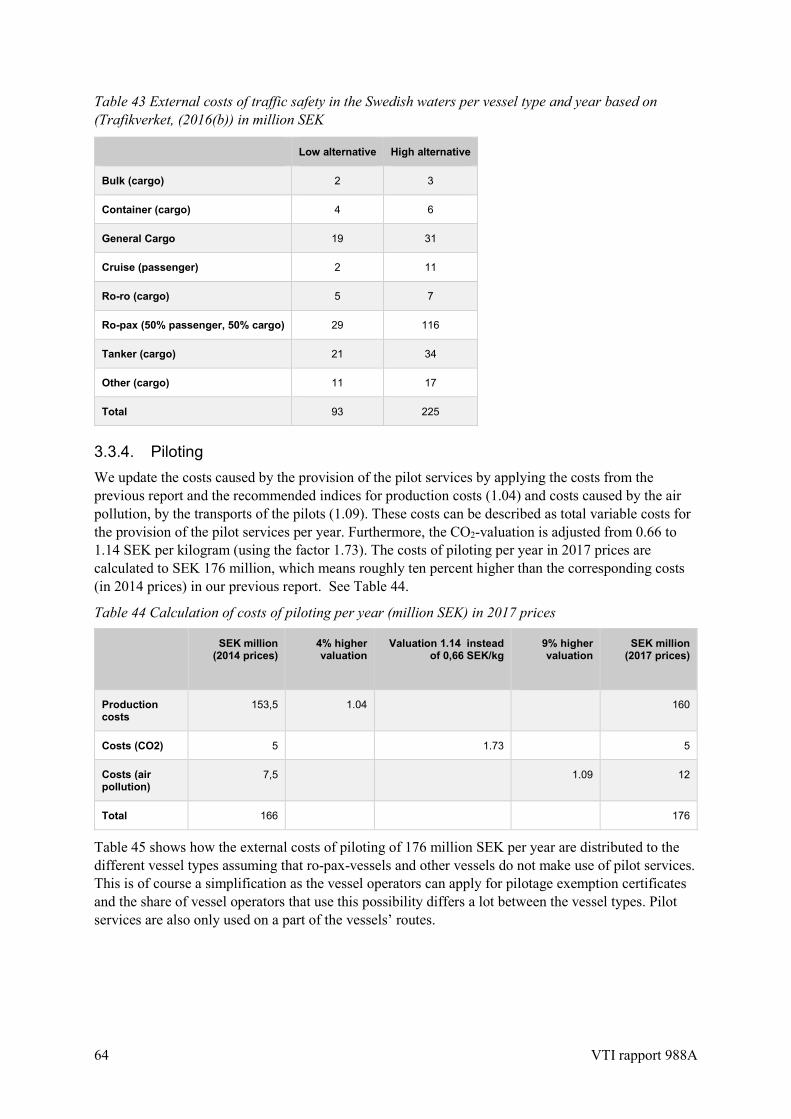
64 VTI rapport 988A
Table 43 External costs of traffic safety in the Swedish waters per vessel type and year based on (Trafikverket, (2016(b)) in million SEK
Low alternative High alternative
Bulk (cargo) 2 3
Container (cargo) 4 6
General Cargo 19 31
Cruise (passenger) 2 11
Ro-ro (cargo) 5 7
Ro-pax (50% passenger, 50% cargo) 29 116
Tanker (cargo) 21 34
Other (cargo) 11 17
Total 93 225
3.3.4. Piloting We update the costs caused by the provision of the pilot services by applying the costs from the previous report and the recommended indices for production costs (1.04) and costs caused by the air pollution, by the transports of the pilots (1.09). These costs can be described as total variable costs for the provision of the pilot services per year. Furthermore, the CO2-valuation is adjusted from 0.66 to 1.14 SEK per kilogram (using the factor 1.73). The costs of piloting per year in 2017 prices are calculated to SEK 176 million, which means roughly ten percent higher than the corresponding costs (in 2014 prices) in our previous report. See Table 44.
Table 44 Calculation of costs of piloting per year (million SEK) in 2017 prices
SEK million (2014 prices)
4% higher valuation
Valuation 1.14 instead of 0,66 SEK/kg
9% higher valuation
SEK million (2017 prices)
Production costs
153,5 1.04 160
Costs (CO2) 5 1.73 5
Costs (air pollution)
7,5 1.09 12
Total 166 176
Table 45 shows how the external costs of piloting of 176 million SEK per year are distributed to the different vessel types assuming that ro-pax-vessels and other vessels do not make use of pilot services. This is of course a simplification as the vessel operators can apply for pilotage exemption certificates and the share of vessel operators that use this possibility differs a lot between the vessel types. Pilot services are also only used on a part of the vessels’ routes.

VTI rapport 988A 65
Table 45 Costs of piloting per vessel type and year (million SEK)
Vessel type Million SEK
Bulk 7
Container 13
General cargo 65
Cruise 4
Ro-ro 16
Ro-pax 0
Tanker 71
Other 0
Total 176
3.3.5. Icebreaking A similar approach is applied for the update of the costs of icebreaking. In our previous report we calculate infrastructure costs of icebreaking services based on data on the yearly total variable costs from the Swedish Maritime Administration (SMA). As for the pilot services, average costs are calculated, and specific conditions are not considered though the costs differ obviously in terms of location and situation-specific conditions such as ice thickness, winds and wind direction. The costs also vary with the fuel price and regarding how the icebreaking services are produced (e.g. number of assisted vessels per assistance and share of hired icebreakers, see section 2.3 above). These aspects are analyzed in detail in by (Transport Analysis, 2017) who estimate the costs for icebreaking based on more detailed information for 16 winter seasons.
Considering the uncertainties about which costs to treat as variable costs, we assessed the costs for two extreme options in our previous report (Vierth, 2016): a low alternative that only includes the costs of fuel and lubricants and the costs of air pollution and CO2 emissions arising from the fuel consumption and a high alternative that additionally includes the costs of maintaining SMA’s own icebreakers and hiring of icebreakers from third parties. According to SMA’s estimation presented in (Transport Analysis, 2017) about ten to 20 percent of the maintenance costs are variable; this indicates that the low alternative in Table 12 in (Vierth, 2016) is more realistic. Transport Analysis (2017) also excludes also the costs for local icebreaking (up to 2.5 % of the variable costs).
The costs of icebreaking per year in 2017 prices are calculated to SEK 117 million, which means that they are between the high and low alternative in our previous study. Four percent higher production costs are assumed. See Table 46.
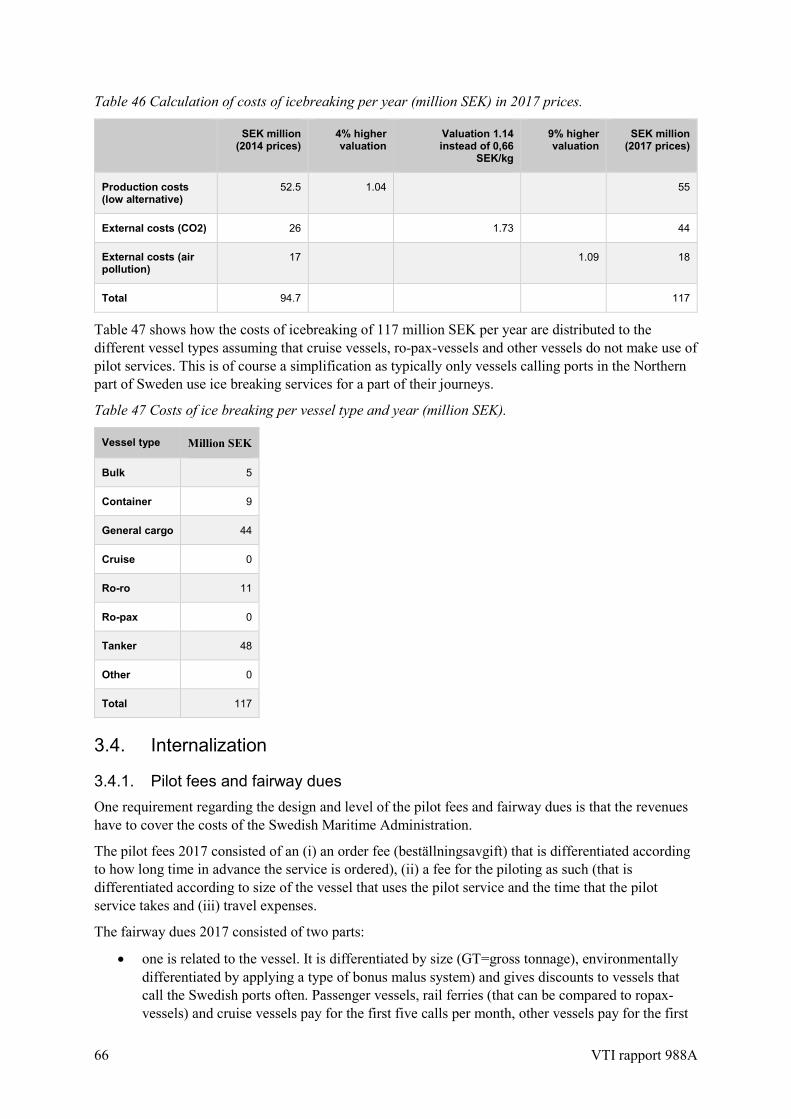
66 VTI rapport 988A
Table 46 Calculation of costs of icebreaking per year (million SEK) in 2017 prices.
SEK million (2014 prices)
4% higher valuation
Valuation 1.14 instead of 0,66
SEK/kg
9% higher valuation
SEK million (2017 prices)
Production costs (low alternative)
52.5 1.04 55
External costs (CO2) 26 1.73 44
External costs (air pollution)
17 1.09 18
Total 94.7 117
Table 47 shows how the costs of icebreaking of 117 million SEK per year are distributed to the different vessel types assuming that cruise vessels, ro-pax-vessels and other vessels do not make use of pilot services. This is of course a simplification as typically only vessels calling ports in the Northern part of Sweden use ice breaking services for a part of their journeys.
Table 47 Costs of ice breaking per vessel type and year (million SEK).
Vessel type Million SEK
Bulk 5
Container 9
General cargo 44
Cruise 0
Ro-ro 11
Ro-pax 0
Tanker 48
Other 0
Total 117
3.4. Internalization
3.4.1. Pilot fees and fairway dues One requirement regarding the design and level of the pilot fees and fairway dues is that the revenues have to cover the costs of the Swedish Maritime Administration.
The pilot fees 2017 consisted of an (i) an order fee (beställningsavgift) that is differentiated according to how long time in advance the service is ordered), (ii) a fee for the piloting as such (that is differentiated according to size of the vessel that uses the pilot service and the time that the pilot service takes and (iii) travel expenses.
The fairway dues 2017 consisted of two parts:
• one is related to the vessel. It is differentiated by size (GT=gross tonnage), environmentally differentiated by applying a type of bonus malus system) and gives discounts to vessels that call the Swedish ports often. Passenger vessels, rail ferries (that can be compared to ropax-vessels) and cruise vessels pay for the first five calls per month, other vessels pay for the first

VTI rapport 988A 67
two calls per month. The revenues were 537 million SEK in 2017.
• The other part is related to the loaded/unloaded goods (differentiated by type of commodity); the revenues were 482 million SEK in 2017). In 2017, about 54 percent of the revenues were related to the vessel-part; the share was highest for roro-vessels (68%) and ropax-vessels (65%) and lowest for tankers (38%) and bulk vessels (42%), (Swedish Transport Administration, 2018). Since 2018 there is also a fee per passenger.
3.4.2. Internalization per year Below we compile the components of the external costs (described in section 3.3) and compare them to the costs in our previous study and Transport Analysis’ reports 2016 and 2018. The overall picture is that GHG and air pollution have by far the largest share of the costs: 69 to 74 percent in our study (2018) and 81 to 85 percent in Transport Analysis study (2018). See Table 48. The higher external costs of GHG and air pollution are the main reason for Transport Analysis about 25 percent higher total external costs and the about 20 percent lower degree of internalization. The main underlying reason for the difference is that our estimates are based on updated calculations of the vessel-kilometers and the fuel consumption. The differences for traffic safety and piloting in VTI and Transport Analysis’ reports 2018 are relatively small. This is also true for icebreaking has icebreaking a low share of the total external costs.
Comparing our calculated costs in our reports 2016 and 2018, we identify the largest changes for GHG and air pollution, that are based on a lower fuel consumption 2018. However, for higher monetary valuations are applied, especially for GHG. For icebreaking, we apply the low alternative presented in our previous report as there are indications that this alternative is more realistic.
Table 48 reveals that the external costs are calculated to be internalized by the fairway dues and pilot fees. The degree of internalization is 108 percent in the low alternative and 96 percent in the high alternative. This means that the degree of internalization is higher than in our previous study (Vierth, 2016) and much higher than in Transport Analysis reports from 2016 and 2018.

68 VTI rapport 988A
Table 48 External costs, fees and degrees of internalization for sea transports per year in VTI and Transport Analysis’ studies.
VTI 2018 Transport Analysis (Trafikanalys, 2018)
VTI/Vierth 2016
Transport Analysis (Trafikanalys, 2016)
Year/price level 2017 2017 2014 2014
Low High Low High Low High Low High
Total external costs 1485 1669 2103 2332 1554 1846 2241 2500
-GHG 821 821 1286 1286 731 731 844 844
-Air pollution 276 330 502 603 477 572 1397 1397
-Traffic safety 93 225 90 219 85 207 0 45
-Piloting 176 176 171 171 166 166 0 214
-Icebreaking 117 117 52 52 95 170 0 123
Fairway and pilot fees
1600 1600 1604 1604 1400 1400 1400 1400
Degree of internalization
108% 96% 76% 69% 90 % 76 % 63% 56%
The calculated of degrees of internalisation in Table 48 indicate to what extent the total annual calculated external costs caused by sea transports in Swedish waters are covered by the annual pilot fees and fairway dues. The degree of internalization would of course different for national sea transports, transports in the Swedish economic zone or all Sweden’s transports in the world.
The derived results can be used to compare the level of internalisation for sea transports with the other modes. However, the result that the degree of internalization is about 100 percent (and higher as for road and rail) does not imply that a modal shift from the land-based modes to sea would reduce the external costs. It is important to remember that the policy instruments that can be applied to reduce the costs caused by international sea transports are agreed on at the global level (IMO) or European level (EU).
Another important aspect is that the level of internalisation in Table 48 is related to the total annual external costs and total revenues. Ideally the internalization should be expressed per component and as for rail track fees. It should also be expressed e.g. per vessel-kilometre and give incentives to reduce the external costs.
Below we report the internalization for piloting separately; this is possible as there is a specific pilot fee (that is paid for these services). We present also the calculated external costs, revenues and internalization per vessel type.
3.4.3. Internalization for piloting We break down the external costs to the costs per vessel type and compare these to the revenues from pilot fees and fairway Table 49 shows that the revenues from pilot fees that roughly correspond the direct production costs of the pilot services (579 million SEK) are about three times the calculated costs for piloting (176 million SEK). This implies, as already stated in (Vierth, 2016), that pilot fees based on the costs for piloting would not cover the costs of the Swedish Transport Administration and that additonal funding would be needed. It is not meaningful to calculate the degree of internalisation

VTI rapport 988A 69
per vessel type as the vessel operators can apply for pilotage exemption certificates and the share of vessel operators that use this possibility differs a lot between the vessel types.
3.4.4. Internalization per vessel type The last two columns in able 49 reveal the calculated degree of internalisation (except piloting!) per vessel type; it is highest for generally larger vessels (tankers (133%-145%) roro-vessels (124%-133%)) and lowest for generally smaller vessels (ropax-vessels (54%-64%) and general cargo (62%-67%)).
Table 49 External costs and revenues of the Swedish Transport Administration per year and vessel type (million SEK).
External costs
Pilot fees
Fairway dues
Internalization
(except piloting!) GHG Air
pollution Traffic safety Piloting Ice-
breaking Total
Vessel type Low High Low High Low High GT Goods Total Low High
Bulk 23 8 9 2 3 7 5 45 47 26 15 21 36 95% 90%
Container 47 16 19 4 6 13 9 89 94 75 40 29 70 92% 86%
General Cargo 110 37 44 19 31 65 44 275 294 141 62 80 142
67% 62%
Cruise 20 7 8 2 11 4 33 43 28 28 0 28 97% 72%
Ro-ro 54 18 22 5 7 16 11 104 110 57 80 37 117 133% 124%
Ro-pax 397 134 160 29 116 560 673 41 234 126 360 64% 54%
Tanker 100 34 40 21 34 71 48 274 293 211 112 184 295 145% 133%
Other31 70 24 28 11 17 105 115 3 4 7 7% 6%
Total 821 278 330 93 225 176 117 1485 1669 579 573 482 1055 81% 71%
Table 50 shows the internalization per vessels type based on the total calculated costs and revenues from both pilot fees and fairway dues. The “cost coverage” is over 100 percent for nearly all vessel types except ro-pax-ferries. However, our calculations can overestimate the external costs of GNG and air pollution as the use of catalytic converters, LNG and electric vessels etc is not modelled at a detailed level and that the share of these technologies has increased since 2015. A possible explanation on the revenue side is that the vessel-part of the fairway dues is designed in a way that the ro-pax ferries can get high discounts, e.g. pay only fairway dues for the first five calls per month while they typically have a (very) high numbers of calls per month. Another observation is that larger vessels (container, cruise, ro-ro and tanker vessels) typically have a higher degree of internalization than smaller vessels (general cargo vessels) as the pilot fees and the vessel part of the fairway dues is differentiated according to the vessel size of the vessel.32 The of degrees internalisation presented in Table 49 and Table 50 give indications for to what extent the total calculated external costs for the different vessel types are under- or overinternalized. This information can be used as basis for pricing strategies or other policy measures. The exact figures must be interpreted with caution and more in-depth analysis is needed.33
31 The very low degree of internalization for the category “other vessels” implies that the degree of internalization is overestimated somewhat for the remaining vessel types. 32 Table 2 in (Vierth, 2016) differentiates the eight vessels types into eight size categories. 33 Specific figures need also to be interpreted with caution as it is not guaranteed that SSPA’s vessel categories (that are used to calculate the external costs) are conform with the SMA’s vessel categories (that are used to calculate the revenues).

70 VTI rapport 988A
The last two columns in Table 50 show the degree of internalization presented in Transport Analysis latest report (Transport Analysis (2018)). The degree of internalization is much higher for tankers than for all other vessel types. The degree of internalization for ropax-vessels is, in contrast to our calculations, in line with most of the other vessel types. One reason for this can be that Transport Analysis has allocated the external costs for traffic safety, piloting and icebreaking based on the pilot fees and fairway dues that have been paid for the different vessel types. We think allocation of the costs based on the sailed kilometres34 is more appropriate to identify over- or under internalizations (even if this approach needs to be developed by taking into account exact information about the vessel kilometres carried out pilot- and icebreaking services). Also, Transport Analysis stresses that their results need to be taken with caution as there are uncertainties both related to the input data and the applied calculation approach.
Table 50 Degree of iinternalization for sea transports per year and vessel type in VTI and Transport Analysis’ studies 2018.
External costs Total revenues
Internalization
Internalization (Trafikanalys
(2018)
GHG Air pollution
Traffic safety GHG Air
pollution Total Total
Vessel type Low High Low Low High Low High
Bulk 23 8 9 23 8 7 5 45 47 62 137% 131% 58–62 %
Container 47 16 19 47 16 13 9 89 94 144 162% 154% 56–60 %
General Cargo 110 37 44 110 37 65 44 275 294 277 101% 94%
84–90 %
Cruise 20 7 8 20 7 4 33 43 56 170% 130% 66-79%
Ro-ro 54 18 22 54 18 16 11 104 110 173 167% 158% 56–60 %
Ro-pax 397 134 160 397 134 560 673 369 66% 55% 50–59 %
Tanker 100 34 40 100 34 71 48 274 293 505 184% 172% 126–132 %
Other 70 24 28 70 24 105 115 12 11% 10% 16–17 %
Total 821 278 330 821 278 176 117 1485 1669 1600 108% 96% 69-76%
3.5. Conclusions Sections 3.1 to 3.4 illustrate the limited access to reliable input data and knowledge about the external costs for sea transports compared to the land-based modes. One aspect is the regional dimension of the cost calculations. It is important to remember that the policy instruments that can be applied to reduce the external costs of international sea transports are agreed on at the global or European level.
Revised and more differentiated input data for the vessel-kilometres and the fuel consumption are derived as input data for the calculation of the external costs of GHG emissions and air pollution. About 36 percent less vessel-kilometres and about 40 percent less fuel consumption is calculated for the Swedish waters in 2015.
In the light of the use of different types of fuels and the climate and environmental objectives, that have been set up at the national and international level, and the partly larges differences that are calculated in different studies, we would like to stress the that it is important to improve the data
34 assuming that cruise and ro-pax vessels do not make use of icebreaking services
VTI rapport 988A 71
collection and the calculation tools in this area. It is also crucial to make use of the data that are collected within EU’s and IMO’s fuel report systems.
Regarding the external costs of traffic safety, we would like to stress, as already in our previous report, that it is important to ensure that different authorities apply harmonized definitions and data bases –to be able to carry out similar analysis as for the other modes and comparisons.
When it comes to the external costs related to piloting and icebreaking, we see a need to go from “cameralistic cost calculation approach” to an analysis that considers the general organizational questions that are discussed in Part 1 (chapter 2).
The calculated total external costs per year are five to ten percent lower than in Samkost 2. This implies that the degree of internalization is about 100 percent and higher than in Samkost 2 and much higher than in Transport Analysis’ reports 2016 and 2018. This information can be used to compare the level of internalisation for sea transports with the other modes. However, the result that the yearly fairway dues and pilot fees cover the external costs of sea transports are totally does not imply that a modal shift from the land-based modes to sea would reduce the external costs. Most policies to reduce the external costs of international sea transports are global or European policies.
Ideally the costs, revenues and internalization should be differentiated per component (GHG, air pollution, traffic safety, piloting and icebreaking) and, as for rail track fees, be based on marginal “indicators” like additional vessel-kilometres or additional litre fuel consumption - to give incentives to reduce the external costs. However, it is important to remember that the external costs per vessel-kilometre differ a lot (more than e.g. for trucks) according to the type and size of vessel. SSPA’s calculations in Table 28 show that the fuel consumption per kilometre is four to five times higher for ropax- and cruise vessels than for tankers.
The actual pilot fees and fairway dues are e.g. only indirectly distance based (pilot fees are partly time based) or based on the fuel consumption (pilot fees and fairway dues are partly differentiated according to vessel size. The vessel part of the fairway dues is also environmentally differentiated; a type of bonus malus system is applied. One requirement is that the revenues from the pilot fees and fairway dues shall cover the costs of the Swedish Maritime Administration.
The revenues from pilot fees are about three times higher than the calculated external costs for piloting; this means that pilot fees based on the external costs would not cover the Swedish Transport Administration and that additonal funding would be needed. It is not meaningful to calculate the degree of internalisation per vessel type as the share of vessel operators that use this possibility differs a lot between the vessel types.
The revenues from fairway dues are calculated to cover the external costs for GHG, air pollution, traffic safety and icebreaking to 71 to 81 percent. The degree of internalisation is generally higher than the average for larger vessels (tankers and roro-vessels) and lower for smaller vessels (ropax- and general cargo vessels).
The overall yearly cost coverage is over 100 percent for nearly all vessel types except ro-pax-ferries. However, our calculations can overestimate the external costs of GNG and air pollution as the use of catalytic converters, LNG and electric vessels etc is not modelled at a detailed level and that the share of these technologies ins increasing. A possible explanation on the revenue side is that the vessel-part of the fairway dues is designed so that ro-pax ferries get high discounts, e.g. pay only fairway dues for the first five calls per month while they typically have a (very) high numbers of calls per month. This information can be used as basis for pricing strategies or other policy measures; however, the exact figures must be interpreted with caution and more in-depth analysis is needed.

72 VTI rapport 988A
4. Overall conclusions Sweden is the only Nordic country that calculates the external costs in a systematic way with the objective to provide a platform for implementing a welfare enhancing policy for pricing infrastructure.
One finding in our previous report (Vierth, 2016)) was that the possibilities to apply the external cost estimates for pricing are rather limited in the existing organizational structures. Hence, this report addresses (1) the organizational aspects regarding the provision of the pilot- and icebreaking services and (2) an update of the external costs that were presented in the previous report.
In part 1, the organization models that Denmark, Finland, Norway and Sweden have chosen to provide pilot and icebreaking services are compared. The by far most important service providers for pilot services are state bodies: the Norwegian Coastal Administration has a 100 percent market share but has tendered the transports of the pilots; the Swedish Maritime Administration Sweden has a 100 percent market share. The state-owned companies FinnPilot and DanPilot have also market shares close to 100 percent in Finland resp. Denmark. DanPilot cross subsidizes pilot services to and from Danish ports from international transit services. The Danish system is in a process towards privatisation in 2020.
The pilot fees cover the direct production costs for the services well: 100 percent in Denmark and in Finland (at sea). In Finland, the 26 percent cost coverage in the Saimaa area is compensated by subsidies that are part of the national regional policy. In Norway, the cost coverage was 100 percent, but the ratio dropped, probably temporally, to 86 percent in 2016 when the outsourcing of the transport services by boat led to extra costs. In Sweden, increased pilot fees led to an increase of the cost coverage from 88 percent (2014) to 100 percent (2017).
Due to different geographical and weather conditions, the volume of icebreaking services differs a lot between Finland and Sweden on the one side and Norway and Denmark on the other side. The annual costs for icebreaking are more than 30 times higher in Finland and Sweden than in Norway and Denmark. In all countries except Sweden, the responsible authorities have outsourced a major part of the provision of icebreaking services to a state-owned company (Arctica in Finland) and private companies (Norway, Denmark and Finland). In Finland, Arctica has a market share of close to 100 percent; Denmark applies private-public contracts. There is a formal co-operation between Finland and Sweden.
Denmark is the only country that has icebreaking fees within and adjacent to defined preparedness areas. Sweden and Finland apply a system where the fairway dues fund icebreaking services and fairway services. This means that other vessel operators subsidize the operators that use icebreaking services. In Norway, the icebreaking service are funded by i.e. pilot fees and state funds in harsh winters.
The application of different organization models in the Nordic countries raises the question to what extent there are administrative synergies between the provision of pilot and icebreaking services or if it is more effective to organize the provision of these services in separate organizations, like in Denmark and Finland. Another question is to what extent there are synergies between the different modes that make it useful to gather, like in Finland, safety related topics in one Transport Safety Agency and topics related to the winter maintenance of the infrastructure in the Finish Transport Agency.
One central conclusion of the comparison is that more detailed cost analyses are necessary to be able to say how the different organization models influence the service level, the cost structure, cost effectiveness and level as well as the size of the external costs. Ideally, the role of the ports as interfaces between sea and land transports and users of icebreaking services should be included as well.
In Part 2, the Swedish external costs and degrees of internalization are updated. It is shown that the access to reliable input data and knowledge about the external costs for sea transports is limited

VTI rapport 988A 73
compared to the land-based modes. This is especially true for the input data for the calculation of GHG and air pollution that stand for around 70 percent of the total external costs.
One aspect is the regional dimension of the cost calculations. It is important to remember that the policy instruments that can be applied to reduce the external costs of international sea transports are agreed on at the global or European level.
The sum of the calculated external costs is lower than in our previous report, about five percent in the low alternative and about ten percent in the high alternative. The degree of internalization is 108 percent in the low alternative and 96 percent in the high alternative and thus higher than in our previous report.
Revised and according to fuel types more differentiated data for the fuel consumption are used as input data in the calculation of the external costs of greenhouse gases and air pollution. The use of alternative fuel types has increased and is expected to increase further e.g. to fulfil climate and environmental objectives that have been set up at the national and international level. Hence, another central conclusion is that it is necessary to improve the data collection and the calculation tools in this area. It is also crucial to make use of the data that are collected within EU’s and IMO’s fuel report systems.
Regarding the external costs of traffic safety, we would like to stress, as already in our previous report, that it is important to ensure that different public authorities apply harmonized definitions and data bases –to be able to carry out similar analysis as for the other modes and comparisons.
A conclusion regarding the external costs related to piloting and icebreaking is the need to go from “cameralistic cost calculation approach” to an analysis that considers organizational aspects. The identified differences and similarities in the Nordic comparison should be used as one input. Another reason for the inclusion of organizational issues is the planned investment in a new large icebreaker in Sweden.
The service levels target differs somewhat between the countries and it would be interesting to study the distribution of the waiting time and costs between the pilot and icebreaking service providers on the one side and the vessel operator/shippers on the other side, and to investigate the for society optimal service levels.
Finally, the organization and funding of the pilot and icebreaking services cannot be seen independently from the overall transport system and policies that influence the competition between the modes. In all Nordic countries, there is a wish to shift long distance road transports to rail and sea transports to contribute to the achievement of climate- and environmental objectives. At least in Sweden, there may be a trade-off between setting the pilot fees and fairway dues to cover the costs of the Swedish National Maritime Administration and setting the fees that provide incentives for modal shifts to sea transports.

74 VTI rapport 988A

VTI rapport 988A 75
References Anderson, M., Salo, K. & Fridell, E., 2015. Particle- and Gaseous Emissions from an LNG Powered Ship. Environmental Scieince & Technology, Volym 49, pp. 12568-12575. Andersson, P., 2018. Geagrafisk avgränsning vid beräkning av sjöfartens externa kostnader. u.o.:(E-mail 2018-09-05).
Andersson-Sköld, Y. & Johannesson, M., 2018. Klimatförändringens påverkan på sjöfart och luftfart: översiktligt underlag för handlingsplan, u.o.: VTI (VTI rapport 960/2018).
Carlén, B., 2014. Värdering av koldioxidutsläpp från svenska transporter – en kommentar, u.o.: VTI (VTI rapport 835/2014).
COWI, 2014. Teknologiundersøgelse af mulighederne for landbaseret lodsning i danske farvande, u.o.: https://www.dma.dk/Presse/Nyheder/Documents/Endelig%20rapport%20om%20landbaseret%20lodsning.pdf.
Danish Maritime Aunthority, 2018. Nautical information. [Online] Available at: https://www.dma.dk/SikkerhedTilSoes/Sejladsinformation/Advarsler/Sider/default.aspx
Delhaye, E., De Ceuster, G., Vanhove, F. & Maerivoet, S., 2017. Internalisation of external costs of transport in Flanders. Reflets et perspectives de la vie économique, Volym 2017/2 (Volume LVI), pp. 55-74.
EU regulation (EU) 2015/757, 2015. REGULATION (EU) 2015/757 OF THE EUROPEAN PARLIAMENT AND OF THE COUNCIL on the monitoring, reporting and verification of carbon dioxide emissions from maritime transport, and amending Directive 2009/16/EC 2015/757. u.o.:https://eur-lex.europa.eu/legal-content/EN/TXT/PDF/?uri=CELEX:32015R0757&from=SV.
Finish Ministry of Transport and Communcations, 2017. Traffic control functions of the Transport Agency to be incorporated. [Online] Available at: https://www.lvm.fi/en/-/traffic-control-functions-of-the-transport-agency-to-be-incorporated-940469 [Använd 2017].
Fridell, E., Jernström, M. & Segersson, D., 2008. Översyn av sjöfartens emissioner av luftföroreningar, http://www.smed.se/wp-content/uploads/2011/05/SMED_Rapport_2008_14.pdf: SMED (SMED Rapport 14/2008).
Hörteborn, A., 2018. SSPA [Intervju] (16 8 2018).
IMO, 2014. Prevention of Air Pollution from Ships. [Online] Available at: http://www.imo.org/blast/mainframe.asp?topic_id=233.
IMO, 2015. Third IMO GHG Study 2014, London: IMO.
IMO, 2018(a). Sulphur oxides (SOx) and Particulate Matter (PM) – Regulation 14. [Online] Available at: http://www.imo.org/en/OurWork/Environment/PollutionPrevention/AirPollution/Pages/Sulphur-oxides-(SOx)-–-Regulation-14.aspx [Använd 2008].
IMO, 2018(b). IMO Resolution MEPC.278(70), Initial IMO strategy om reduction of GHG emissions from ships, Annex 11, Resolution MEPC.304(72), (adopted on 13 April 2018). u.o.:http://www.imo.org/en/MediaCentre/HotTopics/GHG/Pages/default.aspx.

76 VTI rapport 988A
Karvonen, T. & Lappalainen, A., 2014. The unit costs of vessel traffic 2013, Helsinki (in Finish): The unit costs of vessel traffic 2013. Finnish Transport Agency, Planning Department. Helsinki 2014. Research reports of the Finnish Transport Agency 41/2014. In Finnish..
Magnussen, K. o.a., 2015. Marginale eksterne kostnader ved transport av gods på sjø og bane, u.o.: VISTA Analyse (Rapport 2015/54)..
Marine Traffic, 2018. What is the significance of the AIS Shiptype number?. [Online] Available at: https://help.marinetraffic.com/hc/en-us/articles/205579997-What-is-the-significance-of-the-AIS-Shiptype-number-
Mellin, A. & Creutzer, C., 2014. SJÖSAM - sjöfartens samhällsekonomiska marginalkostnader, u.o.: VTI (VTI rapport 807/2014).
Milton, J., 2018. Transportstyrelsen (FB-TS-RES-PEC-LOTSDISPENSER) [Intervju] (20 6 2018).
Ministry of the Environment and Energy, 2017. The Swedish climate policy framework, Government Offices of Sweden, Ministry of the Environment and Energy.. [Online] Available at: URL: http://www.government.se/495f60/contentassets/883ae8e123bc4e42aa8d59296ebe0478/the-swedish-clima
Nerhagen, L., 2016. Externa kostnader för luftföroreningar - Kunskapsläget avseende påverkan på ekosystemet i Sverige, betydelsen av var utsläppen sker samt kostnaden för utsläpp från svensk sjöfart , u.o.: VTI (VTI Rapport ?/2016).
Nilsson, J.-E. & Haraldsson, M., 2016. Redovisning av regeringsuppdrag kring trafikens samhällsekonomiska kostnader, u.o.: VTI (VTI rapport 914).
Nilsson, J.-E.o.a., 2018. The efficient use of infrastructure – is Sweden pricing traffic on its roads, railways, waters and airways at marginal costs?. CTS Working Paper, 2018(2)(https://www.cts.kth.se/polopoly_fs/1.799167!/CTS2018-2.pdf), pp. 1-34.
Norwegian Coastal Administration, 2018. Pilot Services. [Online] Available at: http://www.kystverket.no/en/EN_Maritime-Services/Pilot-Services/ [Använd 2018].
NOU 2013:18 , 2013. Med los på sjøsikkerhet — Losordningens omfang, organisering og regelverk , u.o.: u.n.
Port of Gothenburg, 2018. Gas supplier named for new LNG facility at the Port of Gothenburg. [Online] Available at: https://www.portofgothenburg.com/news-room/press-releases/gas-supplier-named-for-new-lng-facility-at-the-port-of-gothenburg/
Regeringen, 2018. Regeringens skrivelse 2017/18:238, En klimatstrategi för Sverige. [Online] Available at: https://www.riksdagen.se/sv/dokument-lagar/dokument/skrivelse/en-klimatstrategi-for-sverige_H503238 [Använd 2018].
Regeringskansliet, 2017. Uppdrag att fortsätta att utveckla forskningen om trafikens samhällsekonomiska kostnader (Diarienummer: N2017/01023/TS). [Online] Available at: http://www.regeringen.se/regeringsuppdrag/2017/02/uppdrag-att-fortsatta-att-utveckla-forskningen-om-trafikens/ [Använd 2017].
Ricardo, 2014. Update of the Handbook on External Costs of Transport (Final Report), London: Ricardo-AEA.

VTI rapport 988A 77
Riksrevisjonen, 2018. Riksrevisjonens undersøkelse av overføring av godstransport fra vei til sjø og bane, u.o.: Riksrevisjonen, Dokument 3:7 (2017–2018).
SCB, 2018(b)). Leveranser-av-petroleumprodukter-fordelad-pa-forbrukarkategori-20152/. [Online] Available at: http://www.scb.se/hitta-statistik/statistik-efter-amne/energi/tillforsel-och-anvandning-av-energi/manatlig-bransle-gas-och-lagerstatistik/pong/tabell-och-diagram/tabeller-over-arsvarden/leveranser-av-petroleumprodukter-fordelad-pa-forbrukarkategori-20152/
SCB, 2018(a)). Utsläpp av växthusgaser från inrikes transporter efter växthusgas och transportslag. År 1990 - 2016. [Online] Available at: http://www.statistikdatabasen.scb.se/pxweb/sv/ssd/START__MI__MI0107/MI0107InTransp/?rxid=f45f90b6-7345-4877-ba25-9b43e6c6e299#)
Shippingwatch, 2015. DanPilot går frem på omsætning og overskud. [Online] Available at: https://shippingwatch.dk/Services/article7754286.ece
Shippingwatch, 2018. Torm-skibe indberettet for manglende brug af lods. [Online].
Sjöfartsverket & SMHI, 2017. Sammanfattning av isvintern och isbrytningsverksamheten 2016/2017, Norrköping: u.n.
Sjöfartsverket, 2017(a). Isbrytare 2020, Förstudie - Slutrapport, u.o.: Sjöfartsverket (15-03414-68) 2017-10-30.
Sjöfartsverket, 2017(b). SJÖFS 2017:27, 2017. Sjöfartsverkets föreskrifter om farledsavgift, Norrköping: Sjöfartsverket.
Sjöfartsverket, 2018. Årsredovisning 2017 för Sjöfartsverket, Norrköping: Sjöfartsverket.
SMHI, 2017(a). Modellering av sjöfartens bränslestatistik med shipair, u.o.: SMHI, Rapport 2017:10, Författare Fredrik Windmark, Mattias Jakobsson och David Segersson.
SMHI, 2017(b). Komplettering av sjöfartens bränslestatistik för, u.o.: SMHI, författare Fredrik Windmark.
SSPA, 2016. AIS-underlag till VTI:s regeringsuppdrag "Trafikens samhällsekonomiska kostnader", u.o.: SSPA.
SSPA, 2018. VTI - Bränselförbrukning av olika bränslekategorier, Göteborg: SSPA.
Swedish Environmental Protection, 2017. Sveriges rapportering till FN:s klimatkonvention Agency. [Online] Available at: https://www.naturvardsverket.se/Miljoarbete-i-samhallet/EU-och-internationellt/Internationellt-miljoarbete/miljokonventioner/Klimatkonventionen/Sveriges-rapportering-till-fns-klimatkonvention/
Swedish Transport Administration, 2018. Sjöfartsavgifter 2017 uppdelat på fartygstyper. u.o.:Swedish Transport Administration (Sven Carlsson, 2018-10-01).
Trafikanalys, 2016. Transportsektorns samhällsekonomiska kostnader - Bilagor, u.o.: Trafikanalys (PM 2016:2).
Trafikanalys, 2017. Isbrytningens samhällsekonomiska marginalkostnad, u.o.: Trafikanalys (PM 2017:4).
Trafikanalys, 2018. Transportsektorns samhällsekonomiska kostnader - bilagor (PM 2018:1), u.o.: Trafikanalys.
Trafikverket, 2016(a). Analysmetod och samhällsekonomiska kalkylvärden för transportsektorn: ASEK 6.0 , Kapitel 12 Kostnad för klimateffekter (Version 2016-04-01),

78 VTI rapport 988A
https://www.trafikverket.se/contentassets/4b1c1005597d47bda386d81dd3444b24/12_klimateffekter_a60.pdf: Trafikverket.
Trafikverket, 2016(b). Analysmetod och samhällsekonomiska kalkylvärden för transportsektorn: ASEK 6.0, Kapitel 9 Trafiksäkerhet och olyckskostnader, u.o.: Trafikverket (Version 2016-04-01).
Trafikverket, 2018(a). Analysmetod och samhällsekonomiska kalkylvärden för transportsektorn: ASEK 6.1 (Version 2018-04-01), u.o.: Trafikverket.
Trafikverket, 2018(b). Analysmetod och samhällsekonomiska kalkylvärden för transportsektorn: ASEK 6.1, Kapitel 12 Kostnad för klimateffekter (Version 2018-04-01). [Online] Available at: https://www.trafikverket.se/contentassets/4b1c1005597d47bda386d81dd3444b24/asek-6.1/12_klimateffekter_a61.pdf
Trafikverket, 2018(c). Analysmetod och samhällsekonomiska kalkylvärden för transportsektorn: ASEK 6.1, Kapitel 9 Trafiksäkerhet och olyckskostnader. [Online] Available at: https://www.trafikverket.se/contentassets/4b1c1005597d47bda386d81dd3444b24/asek-6.1/09_trafiksakerhet_a61.pdf
Transportstyrelsen, 2012. Transportstyrelsens författningssamling, TSFS 2012:38. Norrköping: Transportstyrelsen.
Transportstyrelsen, 2018. Införande av riskbaserade regler för lotsplikt - 2017-10-1. [Online] Available at: https://www.transportstyrelsen.se/sv/Regler/Regler-for-sjofart/Pagaenderegelarbete/riskbaserade-regler-for-lotsplikt/
Vierth, I., 2016. Sjöfartens policyrelevanta samhällsekonomiska marginalkostnader, u.o.: VTI (VTI rapport 908/2016).
1. Annex 1: Jørgen Jordal-Jørgensen’s report for Denmark2017 09 10
1.1. Piloting services Denmark The narrow Danish waters are amongst the most densely trafficked waters in the world and at the same time also the passage to and from the Baltic Sea. This fact create a large demand for piloting in Danish waters and the international waters around Denmark.
1.1.1. Organization There is two types of regulation of piloting in Danish waters and in the waters around Denmark.
• In the international waters piloting is regulated by the IMO recommendations
• In the Danish waters piloting is regulated by the Danish Piloting Act, last updated in 2014.
The Danish straits and narrow channels are difficult to navigate. Current, bottom and wind conditions combined with low and variable draughts, high traffic intensity and narrow passages make it difficult and pose a risk for the safe navigation and the environment to transit especially the internal Danish territorial waters without a pilot. The IMO recommendation covers two corridors, the passage Skagen-Gedser and through Oresund (the Sound). These two corridors are international waters and therefore not covered by the Danish regulation.
1.1.1.1. The IMO recommendation To comply with the IMO recommendation ships should use a pilot when transiting internal and external Danish territorial waters (that is, passage without calling Danish port or anchorage etc.) through Route T and the Sound respectively:
• Transit through Route-T (the IMO recommendation)
o All vessels with a draught of 11 metres or more.
o Vessels carrying highly radioactive material (INF code materials).
• Transit through the Sound (the IMO recommendation)
o Loaded oil tankers with a draught of 7 metres or more.
o Loaded chemical -tankers irrespective of size and gas carriers irrespective of size.
o Vessels carrying -highly radio-active material (INF code materials).
1.1.1.2. Danish Pilotage act Passage to and from Danish port and anchorage
It is mandatory to use a pilot for vessels passing to or from Danish port and anchorage in Danish territorial waters according to the Danish Pilotage Act if the vessels
• carry oil or have uncleaned cargo tanks that have not been rendered safe with inert gas,
• carry chemicals,
VTI rapport 988A 79

• carry gases,
• have more than 5,000 t bunker oil onboard or
• are carrying highly radioactive material.
DanPilot is the governmental pilotage service provider. The "Act on DanPilot" was passed by the Danish Parliament in May 2013, which will transform the pilotage service provider to an independent public enterprise with its own Board of Directors and independent economy. As a state organization DanPilot is a part of the public administration but after the transition DanPilot will no longer be a part of the regular administrative hierarchy of the state.1
1.1.2. Piloting services Almost all piloting services in Denmark is carried out by the company Danpilot. As mentioned above, DanPilot is an independent public enterprise under the Ministry of Business and Growth, with the Danish Maritime Authority as the supervising authority. DanPilot handles the public pilotage through Danish territorial waters from any destination in Denmark to all ports in the Baltic Sea.
DanPilot is obliged to deliver pilotage in Denmark and handles all transit pilotage.
DanPilot's fleet presently consists of 29 specialized pilot boats, ensuring fast and efficient transportation of pilots from the 22 pilot stations to the vessels.
Beyond Danpilot there is another small company, DPS, offering piloting services like Danpilot. Only, in a much smaller scale. The DPS has 16 navigators.
Table 1. Volume of service provision (Danpilot).
Number of piloted vessels per service area (see map) 2016
Transit 11.000
Ports 9.000
Services Total 20.000
Beyond Danpilot there is another small company, DPS, offering piloting services like Danpilot. Only, in a much smaller scale. The DPS has 16 navigators.
The figure below shows the piloting areas in Denmark. The green lines are the routes where the IMO regulation is relevant.
1 Source: Danpilot homepage.
80 VTI rapport 988A

Figure 1-1 Piloting routes in Denmark.
1.1.3. Costs of piloting services The average rate per piloting service from Danpilot is approximately 2,700 EUR per service. Since the personnel constitute the major share of the cost, long distance transit piloting is more expensive compared with shorter distance and piloting in harbours.
Table 2. Rate of piloting service provision (Danpilot calculator).
Type of piloting Rate €
Transit: Bornholm – Skagen, 225/45/13, 377 NM 10,811
Transit: Gedser – Skagen, 225/45/13, 278 NM 8,276
Transit: Drogden - Sound N M1, 225/45/13, 39 NM 1.948
Port piloting, Nakskov 805
VTI rapport 988A 81

Table 3. Fuel consumption and CO2 emissions of piloting (Interwiew with Danpilot).*
Diesel (liter)
CO2
(Kg)
Number of services
Transit, per service 9,5 25,4 11,000
Port, per service 7,0 18,7 9,000
Total, total 167,058 447,717 2,000
Source: Estimates, based on interview with Danpilot
The fuel consumption and CO2 emissions includes both passenger car and boat. It does not include air transport and rail transport. The car fuel consumption is a little less than half of the total fuel consumption and CO2 emissions.
1.1.4. Funding Danpilot covers the costs of coastal piloting service provision fully by user fees.
Pilot service fees are not subsidised from the state budget.
In 2017, Danpilot produced a turnover of 55 million euros and made a profit of 1.5 million euros (54 and 0.5 respectively in 2015. Personnel costs is the dominating factor in the cost structure.
There is no public funding, but substantial cross financing from transit piloting to regional and port piloting. This situation makes it difficult for small player to enter the market.
Table 1-1 DanPilot turnover and total costs (Danpilot, Annual Reports, 2016).
Euro 2015 2016
Turnover 54,001,208 55,198,792
Other external cost 9,112,081 9,214,362
Other cost 2,200,537 3,523,893
Personnel 37,817,181 39,403,893
Depreciation 4,322,013 1,590,470
Operating profit 549,396 1,466,174
1.1.5. Development of solutions and experiences so far At present, there is significant cross financing of regional piloting services from the transit piloting services. However, it is still difficult for small service providers to enter the market because it is difficult to earn enough money from the local piloting services.
The Market for piloting services is planned to be fully private by 2020.
82 VTI rapport 988A
Piloting in Denmark is in a process towards fully privatisation in 2020. Although the market in principle is free, there has been only limited interest from other players to enter the market.
1.1.6. Future plans The privatisation of piloting services is ongoing. It is expected that the privatisation will be fully implemented by 2020.
Land based piloting services is a growing service. It is expected that this type of service will be further developed in the future.
1.2. Icebreaking aspects, Denmark
1.2.1. Organization The Governmental organisation Ice Service aims to assist shipping in Danish waters under ice conditions. The service includes ice-breaker service, ice-reporting service and notification of risk of icing.
Ice breaking in Danish waters is subject to free competition. For the help and guidance of the maritime profession, the Navy Operative Command on its website operates an internet-based platform containing an overview of available ice breakers. The Internet-based overview may enable shipping to contact relevant service provider in order to agree on ice breaking services. Such contracts are concluded between 2 parties, which is the requisite ship and the icebreaker. These contracts are irregular to the state's institution.
Within specially designated areas, designated areas of emergency, the state's services will ensure the possibility of activating an ice-breaking preparedness for aid for shipping during the period 15 December to 31 March (referred to as the issuing season). Preparedness is based on public-private cooperation, in which the Operational Command of the Navy is awarded contracts with private operators of icebreakers on the basis of public procurement.
In specially designated emergency areas, the Government Ice Service will maintain the possibility of activating an ice-breaker preparedness for aid for shipping during the period from 15 December to 31 March.
These areas are:
A) Limfjorden west of Aalborg
B) Limfjord between Aalborg and Hals Barre
C) The waters south of Funen
D) Smålandsfarvandet
VTI rapport 988A 83

Figure 1-2 specially designated areas in Denmark
1.2.2. Service provision The Government Ice Service was amended on 4 December 2012 by legislative amendment that led to the Law on Preparedness for Icebreaking. The amendment was implemented with a broad political majority.
The law replaces the state's role as executive party in connection with ice-breaking with public-private cooperation between the state and the maritime industry, in which the ice-breaking itself is outsourced through a number of contingency contracts, and the costs are incurred by user payment from the industry. Through contractual commitment, one or more private operators undertake to provide appropriate ice breaking preparedness in selected waters (preparedness areas), where ice formation is the experience most of the shipping industry experiences. In addition, the Armed Forces have the opportunity to establish a precautionary preparedness in all other waters during the offshore season if the ice conditions imply this. Responsibility for ice breaking in and around the ports is the responsibility of the ports. Additional assistance can be obtained from a database.
A
C
B
D
84 VTI rapport 988A

1.2.3. Competition. Ice breaking in Danish waters is basically subject to free competition. Outside the specially designated areas shipping companies are responsible for contracting and paying for the required ice breaking.
Ice breaking in specially designated areas are performed as preparedness contracts between the Naval Operative Command and private service providers. In principle any service provider may apply for the service contract with the Naval Operative Command.
1.2.4. Costs of ice breaking service The cost of ice breaking serviced varies according to the size of the ice breaker and the area where the ice breaker is operating. The table below shows the cost in the four designated areas.
Figure 1-3 Cost of ice breaking services in Denmark.
EUR / Hour
Limfjorden west of Aalborg 470
Limfjorden mellem Aalborg og Hals Barre
930
Farvandet syd for Fyn 280
Smålandsfarvandet 480
VTI rapport 988A 85

1.2.4.1. Limfjorden west of Aalborg The preparedness area is served by Agger Boatyard. The hourly rate for efficient wreckage is DKK 3.500 excl. VAT.
1.2.4.2. Limfjorden mellem Aalborg og Hals Barre
The emergency response area is served by Em. Z. Svitzer A / S. The hourly rate for efficient wreckage isDKK 6.900 excl. VAT.
1.2.4.3. Farvandet syd for Fyn The emergency response area is served by Stevns Charter & Towage A / S. The hourly rate for efficient wreckage is DKK 2.100 excl. VAT.
1.2.4.4. Smålandsfarvandet The emergency response area is served by the Limfjord shipping company. The hourly rate for efficient wreckage is DKK 3.600 excl. VAT.
86 VTI rapport 988A
1.2.5. Funding The scheme is financed through an annual fee determined by the Icebreaking Council on the basis of the quantities of goods passing through the individual ports. The fee is paid by the port administration, which pays the annual contingency contribution to the defense in relation to the. The Armed Forces continue to carry out the ice-breaking service, and the Naval Operative Command is responsible for the day-to-day operation of the service, including coordination of ice-breaking efforts, implementation of the supply of emergency preparedness contracts, operation of the database of ice breaking capacities and the collection of the ice tax.
The shipping company / ship must pay 25% of the hourly rate for the ice-breaking services within the designated areas. If the requester is a port adjacent to a contingency area whishing to assist in ice-breakage within the port's own area, the port concerned shall pay 100% of the hourly rate for the effective ice-breaking.
1.2.6. Handling of uncertainty (i.e. who takes risks for higher costs in strong winters?)
The responsibility of preparing for harsh winters and maintaining winter navigation’s service quality lies at the public administration and state budget.
1.2.7. International co-operation With regard to international cooperation, it takes place under the direction of Baltic Icebreaker Management.
1.2.8. Development of solutions and experiences so far Until 4 years ago the government owned and operated 3 national ice breakers. Ice breaking in Denmark is now solely bases on preparedness contracts.
1.2.9. Icebreaking aspects, Greenland There is no governmental organisation of ice breaking in Greenland, no obligation to secure free waterways.
Icebreaking in Greenland is mainly on private initiative where companies operating there take care of their own demand for icebreaking.
Furthermore, the Ice Service is providing valuable information on the ice situation in specific areas, there by guiding ships which routes they can take to avoid the ice.
VTI rapport 988A 87

88 VTI rapport 988A
2. Annex 2: Juha Tervonen’s report for Finland 2017 09 24
2.1. Pilotage in Finland
2.1.1. Organization The legislative basis for the provision of pilot services in Finnish waters, compulsory piloting and exemptions, professional requirements of personnel involved etc. are set in the Pilotage Act (940/2003).
Pilotage services are provided by the pilotage company referred to in the Act. This state-owned special assignment company, FinnPilot Pilotage Ltd, is the only actor in piloting services in Finland. The company reports to the Prime Minister’s Office’s Ownership Steering Department. The Act requires, that the company’s service provision and pricing of services is transparent and available for public review.
Any major changes in the organization of pilot service provision require parliamentary decision. Initiated legal changes are prepared by the Prime Minister’s Office or the Ministry of Transport and Communications, and they are discussed and decided upon in the Parliament. Lesser changes listed in the Act can be introduced via Decrees of the Prime Minister’s Office.
The Finnish Transport Safety Agency (Trafi) monitors the implementation of the Pilotage Act (940/2003) and its provisions. Trafi is also responsible for any pilotage duties which have not been legislatively assigned to FinnPilot Pilotage Ltd. These duties consist of granting of pilot licenses, pilotage exemption certificates, exemptions and deep-sea pilot's licenses and related examinations, keeping of a record of pilot licenses, pilotage exemption certificates and exemptions, granting of exemptions from compulsory pilotage and exemptions from the obligation to provide pilotage services, and issuing of pilotage regulations.
2.1.2. Service provision According to the Pilotage Act (940/2003), vessels shall use a pilot in the public fairways located in Finnish waters and the Saimaa Canal, if pilotage is required by the hazardous or harmful nature of the cargo or by the size of the vessel.
According to the Pilotage Act and the Act on Transforming the State Pilotage Enterprise Into a Limited Liability Company (1008/2010), Finnpilot Pilotage Ltd. is obligated to offer piloting and related maritime safety services on all Finnish sea routes and inland routes (fairways).
The company covers its cost by collecting piloting fees. According to the Act, piloting charges shall cover the costs of service provision. A reasonable return (profit) may be also charged. An exemption is made in the case of subsidised piloting in the Lake Saimaa waters and the Saimaa Canal (see chapter 2.4). In 2016, the total volume of piloting on the six service areas was 23 461 piloted vessels and 439 519 nautical miles (Table 1). The share of piloted vessel calls of the total number of vessel calls (vessels of all sizes) in Finnish coastal ports was 31.9 percent in 2016 (32.9 percent in 2015).1
1 Note that the market share of piloting can not be calculated by comparing of the number of piloting instances and the number of vessel calls reported in maritime statistics. Piloting instances take place both in arrival and departure of vessels in international traffic as well as in domestic port to port traffic.
VTI rapport 988A 89
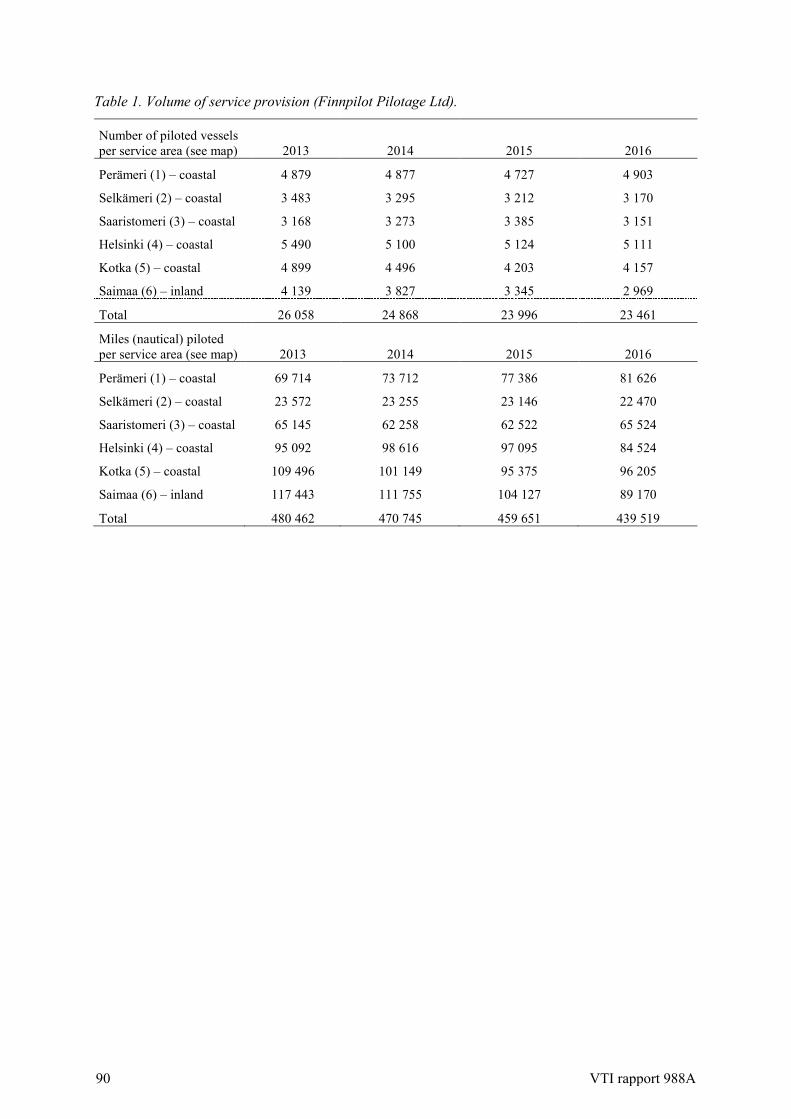
Table 1. Volume of service provision (Finnpilot Pilotage Ltd).
Number of piloted vessels per service area (see map) 2013 2014 2015 2016
Perämeri (1) – coastal 4 879 4 877 4 727 4 903
Selkämeri (2) – coastal 3 483 3 295 3 212 3 170
Saaristomeri (3) – coastal 3 168 3 273 3 385 3 151
Helsinki (4) – coastal 5 490 5 100 5 124 5 111
Kotka (5) – coastal 4 899 4 496 4 203 4 157
Saimaa (6) – inland 4 139 3 827 3 345 2 969
Total 26 058 24 868 23 996 23 461
Miles (nautical) piloted per service area (see map) 2013 2014 2015 2016
Perämeri (1) – coastal 69 714 73 712 77 386 81 626
Selkämeri (2) – coastal 23 572 23 255 23 146 22 470
Saaristomeri (3) – coastal 65 145 62 258 62 522 65 524
Helsinki (4) – coastal 95 092 98 616 97 095 84 524
Kotka (5) – coastal 109 496 101 149 95 375 96 205
Saimaa (6) – inland 117 443 111 755 104 127 89 170
Total 480 462 470 745 459 651 439 519
90 VTI rapport 988A

Figure 1. Piloting areas in Finland (Finnpilot Pilotage Ltd.).
2.1.3. Costs of services Information on the costs of piloting services is available as average total costs per mile and piloting instance (Table 2). These figures do not fully reveal short term average costs. However, the reported average transportation costs per piloting instance reflects short term average costs at least partially.
VTI rapport 988A 91

This infers that short term average transportation costs (621 € in 2016) make up 42 percent of average total costs of a piloting instance.
Table 2. Costs of piloting service provision (Finnpilot Pilotage Ltd’s Annual Reports).
€ 2013 2014 2015 2016
Average total cost per mile 73 74 70 80
Average total cost per piloting instance* 1 491
Average transportation cost per piloting instance 621
* Total cost includes all accounted costs (ie. all running expenditure and capital costs).
External impacts of piloting are reflected in the reported fuel consumption and carbon dioxide emissions (Table 3) of Finnpilot Pilotage Ltd. As fuel consumption has decreased, also total CO2 emissions have decreased during the last few years. Total volume of CO2 emissions of piloting and associated land side operations was approximately 4 000 tonnes in 2016.
Table 3. Fuel consumption and CO2 emissions of piloting (Finnpilot Pilotage Ltd’s Annual Reports).*
2013 2014 2015 2016
Fuel consumption, litres/piloting instance, average 73.5 73.5 70.2 72.6
CO2 emissions/piloting instance, tonnes, average 0.17 0.18 0.17 0.18
Change in fuel consumption, %, per piloting instance -0.10 -4.50 3.40
Fuel consumed, millions of litres 1.92 1.82 1.68 1,7
CO2 emissions, tonnes, total 4 334 4 364 4 057 4 025 * Vessels (63 in 2016), cars (40 in 2016) and buildings.
Emissions costs for carbon dioxide can be separately calculated on the basis of the Finnish Transport Agency’s official guidelines on the unit costs for emissions.2 The unit cost for CO2 is 40 €/tonne in prices of 2013. Thus, total costs for CO2 from piloting service provision add up to 161 000 € for 2016 (in prices of 2013).
Other emissions or other environmental impacts are not reported. Calculation on the volumes and costs for other emissions would require defining emission factors and usage data for each of the company’s vessels.
All Finnpilot Pilotage Ltd.’s vessels and cars are compatible with existing environmental regulation (engines, emissions control and quality of fuels). Finnpilot Pilotage Ltd.’s cars use fuels that are taxed by excise and environmental taxes. For that part external costs are internalised at least partially.
2 Karvonen, T. & Lappalainen, A. (2014): The unit costs of vessel traffic 2013. Finnish Transport Agency, Planning Department. Helsinki 2014. Research reports of the Finnish Transport Agency 41/2014. In Finnish.
92 VTI rapport 988A

Vessels use fuels that are not taxed by excise taxes or environmental taxes. Thus, emission costs are not internalised via taxation for vessel operations.
Finnpilot Pilotage Ltd.’s social impact assessment reports that in 2016 a total of 29 serious vessel accidents were prevented. Their cost could have added up to 52 million €. According to the company’s statement, this sum reflects the value of services to the society and customers. Further benefits (0.2 million €) were gained by improved efficiency in vessel movement (fluency of traffic).
The prevented accident costs are valued by assuming that a serious accident would cause an average of one million euros worth of material damages to the vessels involved. Then, to each case assumed average costs of immediate oil spill protection are added, as well as the average costs of subsequent docking (one month per vessel) and associated extra manoeuvring of the vessel. The impact of more fluent traffic is valued according to saved travel time and vessel costs.
2.1.4. Funding of pilot services Finnpilot Pilotage Ltd covers the costs of coastal piloting service provision fully by user fees. The board of directors of the company decides upon the pricing of services. According to the Act, the fees have to be reasonable with regard to costs of service provision and profit.
The pilotage fee is based on the (net) tonnage of the vessel in question and the distance to be piloted. There is a rising fixed fee and a rising variable fee for 15 different size classes (on the coast); minimum <200 tonnes… maximum >100 000 tonnes (less classes on the Saimaa area). The variable fee rises also by each mile adding to piloting distance; from 1 mile to 80 miles (and an additional fee for distances longer than 80 miles). In 2017 the lowest total fee is 1 146 € for piloting a <200 tonne vessel for 1 mile. The highest total fee is 18 616 € for piloting a >100 000 tonne vessel for 80 miles.
The Lake Saimaa and the Saimaa Canal are an exception to pricing the fee by full cost. Pilot service fees are subsidised from the state budget. According to the Pilotage Act (940/2003), the service fee is capped in relation to the full price, and at the moment the annual state subsidy is capped to 4.2 million €. In recent years the Saimaa fee has been 74 percent lower compared to the standard rates. In 2016 the state subsidy was 3.8 million €.
In 2016, Finnpilot Pilotage Ltd. produced a turnover of 36.5 million euros and made a profit of 1.5 million euros (36.8 and 1.7 respectively in 2015; Table 4). Personnel costs is the dominating factor in the cost structure. In 2016, the company’s combined assets allowed to pay a 4.0 million euros dividend to the owner (the State of Finland).
Table 4. FinnPilot Pilotage Ltd’s turnover and total costs (Finnpilot’s Annual Reports).
Euro 2015 2016
Turnover, total 36 820 913 36 576 044
- pilotage fees and state subsidy - other revenue (e.g. from sales of possessions)
36 808 292 12 621
36 497 012 79 032
Costs, total 35 159 816 35 058 734
- materials (e.g. fuels) and services 2 005 268 (5.7 %) 1 904 981 (5.4 %)
- personnel 25 980 957 (73.9 %) 25 885 337 (73.8 %)
- depreciation 2 406 320 (6.8 %) 2 499 701 (7.1 %)
- other costs 4 767 271 (13.6 %) 4 768 715 (13.6 %)
Operating profit 1 681 548 1 519 870
VTI rapport 988A 93

Figure 2. FinnPilot Pilotage Ltd’s turnover and total costs (Finnpilot’s Annual Reports).
Finnpilot Pilotage Ltd.’s annual report presents a comparison of pilotage fees in selected European countries (Table 5). The comparative fees are calculated for a seven nautical mile pilotage task for all countries. The Finnish fee level is normalised to 100. In the comparison between seven countries, the Danish fee is lowest, and the Finnish fee is the second lowest.
The comparison does not present data on the service level given. Finnpilot Pilotage Ltd. applies a service level target of maximum 3 hour wait time on the coast and 6 hours in the Saimaa area. In 2016 the success rate was 99.8 percent (target threshold was set at 99.0 percent). 47 piloting instances failed to be delivered according to timing targets.
Table 5. Comparison of piloting fees in 2016 (Finnpilot Pilotage Ltd’s Annual Report 2016).
Finland 100
Sweden 121
Norway 182
Denmark 85
Estonia 110
Germany 137
The Netherlands 185
2.1.5. Uncertainty and risks Finnpilot Pilotage Ltd. monitors risks and decides upon reactions independently. Main risks concern changes in the costs structure of service provision and development of service demand. The most risky input cost is the price of fuel for vessels. However, costs do not usually fluctuate unexpectedly, and service demand is set by legislation. Still, independent piloting has eroded service demand as a trend. According to the Annual Report of Finnpilot Pilotage Ltd., the share of fixed costs in service provision has risen. This development can create an economical risk for the company.
94 VTI rapport 988A

2.1.6. Development of solutions and experiences so far Before 2004, the Office of Maritime Administration was the sole provider of piloting services in Finland. From the beginning of 2004 to the end of 2010 piloting services were provided by a legislatively established state-owned public utility enterprise. Due to EU legislation, all state-owned public utility enterprises were abolished in 2010. The piloting enterprise was reconstructed as a fully state-owned company Finnpilot Pilotage Ltd. which started operating on the 1st of January 2011.
The monopoly of the pilotage company is established by the Pilotage Act. According to interpretations of the Finnish Constitution by the Parliament’s Constitutional committee and other legislative experts, piloting is execution of public administration. Furthermore, piloting exists for maintaining public safety, for minimising environmental risks and for providing evenly priced services. Therefore piloting does not have to be opened to competition.
The demand for pilotage has decreased along the years due to licensing of ship personnel for independent piloting. This trend will continue. It is also thought, that computer based information system, geographical positioning systems and associated applications can reduce the need for traditional piloting services. However, all new piloting procedures and exemptions from the use of piloting service have to be incorporated into the Pilotage Act.
2.1.7. Future plans Finnpilot Pilotage Ltd. continues to develop its effectivity measurement and distribution of the results to the authorities and ship-owners for further analysis and safety improvement.
During 2017 Finnpilot Pilotage Ltd. aims to implement a computer based pilot ordering system, Pilot Online. The system will allow real time monitoring of the process of piloting services.
In 2016, Finnpilot Pilotage Ltd. began co-operation with the Danish piloting company in comparing effectivity measurement.
In June 2017, the Ministry of Transportation and Communications proposed legislative changes which would allow experimenting of remote and automated pilotage.3 This means utilization of advanced computer systems in piloting without the pilot’s boarding. The experiments are not allowed by existing law. If the experiments are allowed and the results are promising, this could lead to major changes in the nature of piloting. Integration of piloting services, vessel information services and traffic control services has been proposed e.g. by industrial lobbies. This could lead to changes in organization of service provision, but not in the services themselves or the monopoly. At the moment traffic control services (for roads, railways and maritime) are in the process of being reorganized into a new state-owned company (or a consolidated company).4
In wider perspective, the monopoly of piloting has been challenged from time to time in public debate. It is seen to violate the constitutional freedom of livelihoods. Private companies attempted to enter the market a few years ago, but they were pushed back by legislative fortification of the monopoly. At the moment there are no on-going parliamentary activities for preparing changes to the Act.
3 Legislative amendments to allow remote pilotage. Ministry of Transportation and Communications, News article 28.06.2017. 4 At the moment the Road traffic control service and the Vessel traffic control service are departments of the Finnish Transport Agency. Rail traffic control was moved to a state-owned company Finrail Ltd. in 2015.
VTI rapport 988A 95

2.2. Icebreaking in Finland
2.2.1. Organization According to the Act on the Ice Classes of Ships and Icebreaker Assistance (1121/2005) the Finnish Transport Agency (FTA) is responsible for arranging the availability of icebreaker assistance in Finnish waters when the ice conditions so require.5 FTA is also responsible for the availability of icebreaker assistance outside Finnish waters, if it is necessary to safeguard Finnish foreign trade or it is based on an agreement with another state. In practice, these responsibilities concern winter navigation on FTA’s fairways and sea routes leading to the fairways. FTA fulfills its obligations by tendering the services from icebreaking companies (see section 3.2).6
The level of service is planned by FTA, but the views of stakeholders are taken into consideration. Since the early 1970’s, the fundamental service criteria has been: Assistance is provided in all class 1 fairways with a minimum depth of 8 metres leading to a (coastal) port. Assistance to other ports along and beyond these fairways is only given in relation to class 1 fairways, at least 8 metres deep fairway sections or to other destinations specified by FTA.7
The more detailed criteria for service level (share of un-delayed port calls during the ice period, average service wait time etc.) have been developed along the years by experience. If these criteria were to be changed, it would require stakeholder discussions and approval from the Ministry of Transport and Communications.
During difficult ice periods the FTA’s Winter Navigation Unit imposes regionally specified traffic restrictions for the winter ports. Restrictions are decided upon on the basis of weather and ice conditions and the ship’s ice class and deadweight (ref. the Helcom recommendations). The Saimaa Canal is closed usually between January and April. However, assistance on the Lake Saimaa is provided through the winter. Icebreaker assistance in the approach channel to the Canal on Russian waters in the Bay of Vyborg is the responsibility of Russian icebreakers.
FTA’s Winter Navigation Unit leads and monitors the implementation of the icebreaking services and follows up client satisfaction in cooperation with the vessel traffic services, Baltic Sea icebreaking organizations and the masters of the coordinating icebreakers.
By Finnish law, some icebreakers are obligated to possess capacity for environmental protection tasks, mainly oil spill protection.
2.2.2. Service provision Icebreaking services include keeping routes open, the assistance of vessels when ice conditions so require and necessary towing. The services are provided according to weather conditions throughout Finnish shipping routes and fairways in the Baltic Sea and inland in Lake Saimaa area.
By law, icebreaking services are open to competition. FTA tenders service contract periods in compliance with the Act on Public Contracts (Act 348/2007).8 FTA has contracts with Arctia Icebreaking Ltd, Alfons Håkans AS Finnish Branch and Meriaura Ltd. Also the icebreakers of the Swedish Maritime Administration (Sjöfartsverket) work in this pool by bilateral State agreement.
Arctia is a fully state-owned company with an icebreaker fleet and staff. The other companies are privately owned shipping companies with tugs which possess icebreaking capacity. Arctia supplies
5 Finnish Transport Agency. Finland’s Winter Navigation. Winter 2016–2017. 6 Winter assistance in ports is arranged individually by port companies. 7 Earlier, the Finnish Maritime Administration announced a specific list of winter ports that were served. 8 For example, the Saimaa Area icebreaking service is being tendered during 2017.
96 VTI rapport 988A
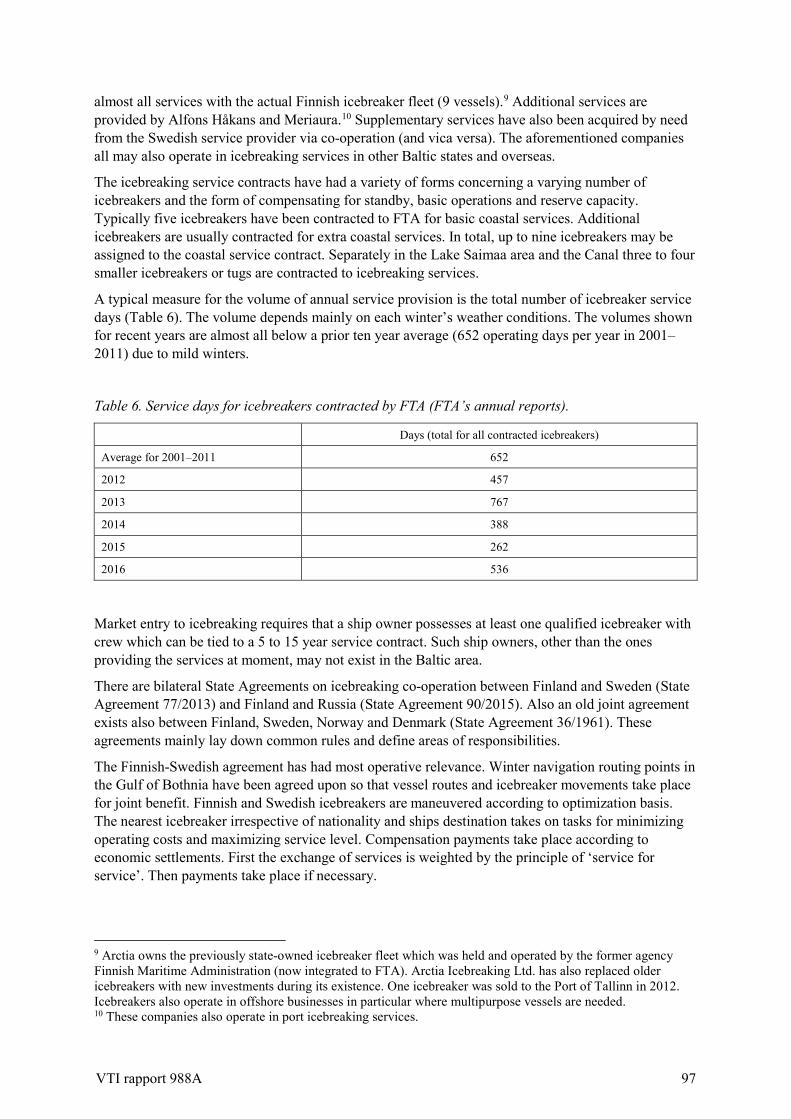
almost all services with the actual Finnish icebreaker fleet (9 vessels).9 Additional services are provided by Alfons Håkans and Meriaura.10 Supplementary services have also been acquired by need from the Swedish service provider via co-operation (and vica versa). The aforementioned companies all may also operate in icebreaking services in other Baltic states and overseas.
The icebreaking service contracts have had a variety of forms concerning a varying number of icebreakers and the form of compensating for standby, basic operations and reserve capacity. Typically five icebreakers have been contracted to FTA for basic coastal services. Additional icebreakers are usually contracted for extra coastal services. In total, up to nine icebreakers may be assigned to the coastal service contract. Separately in the Lake Saimaa area and the Canal three to four smaller icebreakers or tugs are contracted to icebreaking services.
A typical measure for the volume of annual service provision is the total number of icebreaker service days (Table 6). The volume depends mainly on each winter’s weather conditions. The volumes shown for recent years are almost all below a prior ten year average (652 operating days per year in 2001–2011) due to mild winters.
Table 6. Service days for icebreakers contracted by FTA (FTA’s annual reports).
Days (total for all contracted icebreakers)
Average for 2001–2011 652
2012 457
2013 767
2014 388
2015 262
2016 536
Market entry to icebreaking requires that a ship owner possesses at least one qualified icebreaker with crew which can be tied to a 5 to 15 year service contract. Such ship owners, other than the ones providing the services at moment, may not exist in the Baltic area.
There are bilateral State Agreements on icebreaking co-operation between Finland and Sweden (State Agreement 77/2013) and Finland and Russia (State Agreement 90/2015). Also an old joint agreement exists also between Finland, Sweden, Norway and Denmark (State Agreement 36/1961). These agreements mainly lay down common rules and define areas of responsibilities.
The Finnish-Swedish agreement has had most operative relevance. Winter navigation routing points in the Gulf of Bothnia have been agreed upon so that vessel routes and icebreaker movements take place for joint benefit. Finnish and Swedish icebreakers are maneuvered according to optimization basis. The nearest icebreaker irrespective of nationality and ships destination takes on tasks for minimizing operating costs and maximizing service level. Compensation payments take place according to economic settlements. First the exchange of services is weighted by the principle of ‘service for service’. Then payments take place if necessary.
9 Arctia owns the previously state-owned icebreaker fleet which was held and operated by the former agency Finnish Maritime Administration (now integrated to FTA). Arctia Icebreaking Ltd. has also replaced older icebreakers with new investments during its existence. One icebreaker was sold to the Port of Tallinn in 2012. Icebreakers also operate in offshore businesses in particular where multipurpose vessels are needed. 10 These companies also operate in port icebreaking services.
VTI rapport 988A 97

The State Agreement between Finland and Russia enables Finnish icebreakers to operate in the eastern parts of the Gulf of Finland in the territorial waters of Russia in return for compensation. Russian icebreakers can assist vessels operating to Finnish ports in the Gulf of Finland. Operations in territorial waters are always subject to a permit from national authorities.
2.2.3. Costs of services Cost data on icebreaking services is publicly available only as annual totals (Table 7). Short term average costs of icebreaker operations cannot be presented. The standby services make up the majority of the costs. Additionally paid operation and fuel costs depend on the severity of the winter.
According to Arctia Icebreaking Ltd., a total of 1 200 vessels were assisted during the winter of 2016–2017. As simple implication from the comparison of total costs and the number of assisted vessels implies that the average total cost per assistance was in the magnitude of over 40 000 euros.
Table 7. Costs of icebreaker services (FTA’s annual reports, Budget proposal of the Ministry of Transport and Communication).
Million €
2012 – paid for services 35.0
2013 – paid for services 41.4
2014 – paid for services 38.9
2015 – paid for services 34.6
2016 – budget proposal 51.0
2017 – budget proposal 58.8
Arctia Icebreaking Ltd.’s energy use and environmental impacts (emissions) are presented in the annual report (Table 8), but they cannot be parted exclusively for the share from FTA’s icebreaker operations. Arctia serves also global offshore customers, but the volume varies from year to year significantly. The company reports a total of 380 offshore service days for 2015 and 61 for 2016. These figures can be compared to the reported icebreaking service days for the Finnish Transport Agency (Table 6). As a simple conclusion more than half of emissions may have taken place in overseas operations in 2015, whereas in 2016 the majority of emissions took place in Finnish icebreaking. However, emissions may be produced in very different volumes per service day depending on the type of vessel action taking place at each operation.
All vessels are compatible with existing sulphur regulation (emissions control and quality of fuels). The newest icebreaker is a multi-fuel vessel which can use both liquefied natural gas (LNG) and maritime fuel oil.
Information on the emissions of additional icebreaking services provided by other ship owners are not available.
98 VTI rapport 988A

Table 8. Fuel consumption and emissions of Arctia Icebreaking Ltd. (total for all operations; without LNG use of the new icebreaker).
2014 2015 2016
Fuel oil consumption, tonnes
- ultralight 5 738 8 723 1 293
- light 4 161 4 194 7 968
- heavy 1 652 0 0
Emissions, tonnes
- CO2 from vessel fuels (IMOMEPC/Circ. 471) 27 128 42 044 44 948
- HC 18.1 23.8 16.8
- NOx 635 663 589
- Particles 13.6 16.6 12.6
- CH4 2.3 3.0 2.1
- N2O 0.8 1.0 0.7 Emissions costs can be calculated on the basis of the Finnish Transport Agency’s official guidelines on the unit costs for emissions (Table 9). If all emissions are assumed to take place at sea, the total costs for emissions from all icebreaker operations of Arctia add up to 2.0 million € for 2016 (in prices of 2013). The share of CO2 is 1.8 million €. These results should be considered as directional due to rough assumptions and, the share of icebreaking is not parted from all other operations of Arctia.
Table 9. Emissions costs of Arctia Icebreaking Ltd. in the prices of 2013 (total for all operations; without LNG use of the new icebreaker; reporter’s own calculation).
Emissions in 2016,
tonnes Unit cost, €/tonne Total cost, €
CO2 44 948 40 1 797 920
HC 16.8 - -
NOx 589 304 179 056
Particles (at sea) 12.6 3 254 41 000
CH4 2.1 838 1 760
N2O 0.7 12 376 8 663
Total 2 028 399
2.2.4. Funding of icebreaking services Winter navigation assistance is free of charge. The acquisition of services is funded from the State budget (FTA’s grants). However, the Finnish fairways charging system is designed to collect revenue for covering the costs of both the fairway services and winter navigation services. According to Finnish legislation, the fairway charge is de facto a tax collected by the Finnish Customs. The revenue is forwarded to the State’s account. The fairway charge is collected from all maritime commerce irrespective of navigation season. Although the fairway charge is differentiated according to the vessel’s ice class (good class – low charge, weak class – high charge), the actual connection between
VTI rapport 988A 99

paying the charge and receiving winter navigation services is indirect. All vessel calls take part in funding winter navigation services.11
Budget funding is planned by the Ministry of Transportation with assistance from FTA. If revenue from the fairway charge is insufficient for covering the costs of fairway and winter navigation services, the charge can be raised (and vice versa in the case of excessive revenue).
2.2.5. Uncertainty and risks The responsibility of preparing for harsh winters and maintaining winter navigation’s service quality lies at the Finnish Transport Agency. This is met by formulating the service contracts so that sufficient basic icebreaker capacity and extra capacity is always available. The costs of anticipation are taken into account within the fairway charging system and the State’s Budget (see section 3.4). The same applies to other cost increasing factors such as price of fuels and the need to invest into renewing aging icebreakers and obtain new icebreakers.
2.2.6. Development of solutions and experiences so far Icebreaking services have been provided for traffic to the same ports and according to the same basic service level as presented in section 3.1 since the 1970’s. More detailed service criteria have been developed along the years in order to meet the speed and punctuality requirements of today’s logistics.
Continuous efforts take place for improving the efficiency of icebreakers services. These actions include the integration of information systems for predicting of the demand of services as well as for improving the cost efficiency of services. All this saves money, time, fuel and emissions in manoeuvring commercial vessels and the icebreakers.
A renewed free of charge and open to all web service Baltice.org was introduced in 2015 for offering up-to-date information about winter navigation and ice conditions to user groups; ship officers, shipping companies, ports, ship agents, pilots, authorities and private persons. The service includes information about the ice situation, traffic restrictions in ports, icebreaker positions and assistance situations. The service is updated at the beginning of each winter navigation season. The cooperation body of the icebreaking authorities in the Baltic Sea countries BIM (Baltic Icebreaking Management) is responsible for the service.
Further development of winter navigation service quality takes place through Estonian-Finnish-Swedish co-operation of national transport agencies within the EU-/TEN-T-funded WINMOS-project (Winter Navigation Motorways of the Sea). This research and development project and its various actions aims to ensure safe and reliable winter traffic in a cost efficient way by further developing the winter navigation system and ensuring sufficient icebreaking capacity in the Baltic Sea. The first phase, WINMOS I, was completed. The second phase, WINMOS II, is on-going. The list of accomplished and on-going tasks is available on the action’s website.12
A significant case in the WINMOS I project was the EU-subsidy received for building a new icebreaker (Polaris).
Another example of WINMOS I activities is the Icebreaking Network IBNet system. IBNet is an on-line system for monitoring and managing the Finnish-Swedish-Estonian icebreaker fleet optimally. In the system satellite images, AIS-targets, traffic restrictions, port lists, ships registers, weather forecasts, information on other icebreakers’ intentions etc. are integrated to one system aboard the
11 Notice! The fairway charge is halved during a four year period (2015–2018) by governmental decision on the basis of economic relief to industries and compensation for the costs of the sulphur directive. 12 http://www.winmos.eu/ Partners: Swedish Maritime Administration, Estonian Maritime Administration, Finnish Transport Agency among others.
100 VTI rapport 988A
icebreakers and ashore. In a WINMOS II action the system is updated and developed into a web-browser based system which supports modern day mobile devices and touch screen technology.
Icebreaker technology has been developed by ship builders for allowing flexible multipurpose use of vessels also outside winter seasons and beyond the Baltic Sea. This aims at creating revenue for supporting the economy of icebreaking, as well as for expanding the markets for Finnish know-how and ship building services.
2.2.7. Future plans It is expected, that in the future the winter navigation qualities of commercial vessels will weaken due to on-coming environmental regulation and expected rise in fuel costs. The Energy Efficiency Design Index (EEDI) for restricting fuel consumption and CO2 emissions of commercial vessels is expected to lead to downsizing of engines and lightening the structures of newly built vessels. Higher fuel prices would speed up this development. Weaker ice capacities and lesser capabilities for independent travel in ice conditions can increase demand for icebreaking services significantly.
The availability of icebreaking capacity, i.e. sizing of the icebreaker fleet, lied in the past on parliamentary decision-making due to the fact that until now, new investments have been funded from the State Budget. However, the future is more or less uncertain in this respect. The state-owned company’s responsibility in sizing and funding its fleet independently is likely to be discussed as the renewal of the existing fleet’s aging icebreakers becomes topical.
Icebreaking services will be tendered from the market at the pace of existing contracts expiring. Nevertheless, it is not known if new ship owners will appear to offer their services.
It is likely, that new icebreakers will all be multi-fuel vessels with LNG as primary fuel. LNG is considered to be the most cost efficient fuel in the future particularly when environmental regulation for various emission types and energy efficiency needs to be fulfilled.
VTI rapport 988A 101

102 VTI rapport 988A

3. Annex 3: Kenneth Løvold Rødseth’s report for Norway
Draft 2017 09 22
3.1. Pilotage in Norway
3.1.1. Current regulation and administration of pilotage services Pilotage services are governed by the Pilotage Act, which aims to ensure more effective pilotage and to contribute to safeguarding traffic at sea, hence protecting the environment. The Pilotage Act encompasses the legal framwork for compulsory pilotage, the responsibilities of the pilot and the master during pilotage, and the principles of pilotage exemption certificates and pilotage fees. The Compulsory Pilotage Regulations describe which vessels are subject to compulsory pilotage and the geographical areas to which the regulations apply. The general rule is that vessels that are 70 metres or more are subject to compulsory pilotage in waters within the baselines. Stricter rules apply to some vessels, including passenger vessels and vessels carrying dangerous and polluting cargoes.
Pilotage services are organized by the NCA. Pursuant to the Pilotage act, the duties of the NCA are
- organizing the pilot service
- dispatch of pilots
- administration of pilot exemption certificates
- stipulation and collection of fees
- pilot training and licencing
- supervision, control and enforcement functions.
Source: www.kystverket.no
Figure 1: The NCA’s organization of pilotage services
The Department for Maritime Safety, located at NCA’s head office, administrates the pilotage service. This institution governs the development of pilotage services. Its tasks include the development of objectives, strategies, and instructions such as technical standards and procedures for the pilotage service, as well as supervision and control of the service provision. Proposals for amendments to regulations and guidelines are in most cases submitted to the Ministry of Transport and Communications for processing. The Department for Maritime Safety oversees the certification of pilots, and manages the pilot exemption certificate scheme.
NCA head office
Southeastern coastal
administration
Western coastal
administration
Centre for Pilotage and
VTS
Central Norway coastal
administration
Coastal administration
of Nordland
Coastal administration
of Troms & Finnmark
NCA Shipping Company
NCA Pilot Services
Pilot dispatchOslofjorden
losolder-mannskap
Skagerak losolder-
mannskap
Rogaland losolder-
mannskap
Vestlandet losolder-
mannskap
Møre og Trøndelag losolder-
mannskap
Nordland losolder-
mannskap
Troms og Finnmark losolder-
mannskap
Centre for Emergency
Preparedness
VTI rapport 988A 103

The Centre for Pilotage and VTS, subordinate to NCA’s regional office entitled Western coastal administration (Kystverket Vest), executes tasks commissoned by the head office. Issuing of pilot certificats are among them. The Centre functions as a court of first instance, while the Department for Maritime Safety acts as court of appeal in the case of disputes; e.g., in the case of compliants when the pilotage exam is failed.
NCA Pilot Services handles pilotage operations. The branch is managed by the Pilotage Director, who holds the personnel responsibility for the master ship pilots (Losoldermenn) and whose assignments include recruitment and training of pilots. NCA Pilot Services is organized into one sub-branch that handle pilot dispatches and regional offices that execute pilotages (Oslofjorden losoldermannskap; Skagerak losoldermannskap; Rogaland losoldermannskap; Vestlandet losoldermannskap; Møre og Trøndelag losoldermannskap; Nordland losoldermannskap; Troms og Finnmark losoldermannskap). Each regional office is led by a master ship pilot, who has the day-to-day responsibility to oversee that the service is provided in compliance with current rules and regulations.
3.1.2. Service provision The provision of pilotage services encompasses i) pilot dispatch, ii) pilot transport, and iii) pilotage. The Norwegian Coastal Administration operates three pilot dispatch centres, located in Horten, Kvitsøy and Lødingen. They are at all time staffed with two persons, whose main duties are
i) to register and log bookings
ii) to plan the dispatch of pilots and to prioritze assignments (according to the time of booking, the vessels’ deadlines for delivering cargoes, and the available pilots’ license areas and working hours)
iii) to coordinate the transport of pilots
iv) to log the pilots’ working hours and licence coverage
v) to provide information and instructions to pilots and vessels.
The NCA offers pilot transport by boat or helicopter. The latter is only available to vessels carrying dangerous goods and/or pollutive cargos bound for the Kårstø, Sture, Mongstad, Nyhavna, and Melkøya oil and gas terminals. The helicopter service has been outsourced to private operators for a long time, and contracts are issued for a 5-year period. Airlift AS has been responsible for helicopter operations since June 1st this year. According to its web-page, Airlift operates a fleet of 16 helicopters, stationed at its bases at Førde (Sogn og Fjordane), Kinsarvik (Hordaland), Stranda (Møre og Romsdal), Ljosland (Vest-Agder), and Eggemoen (Buskerud).
The pilot transport service by boat has traditionally been provided in-house, but was recently outsourced following a period of high operating costs. The private company Buksér and Berging became responsible for the boat operation on June 1st, 2016. According to Buksér and Berging’s web-page, the company operates a fleet of 25 high performance pilot boats stationed at 16 pilot stations along the Norwegian coast.
NCA’s regional pilot departments (cf. Figure 1) handle day-to-day pilotage operations. Having boarded the ship, the pilot advices the crew on how to navigate to and from ports.
3.1.3. The outsourcing of pilot transport services The invitation to participate in the competition for the provision of pilot transport by boat was issued in September 2014. While the general recommendation concerning the maximal lifespan of framework contracts for public procurement is 4 years, the contract for pilot transport services was awarded for 10
104 VTI rapport 988A
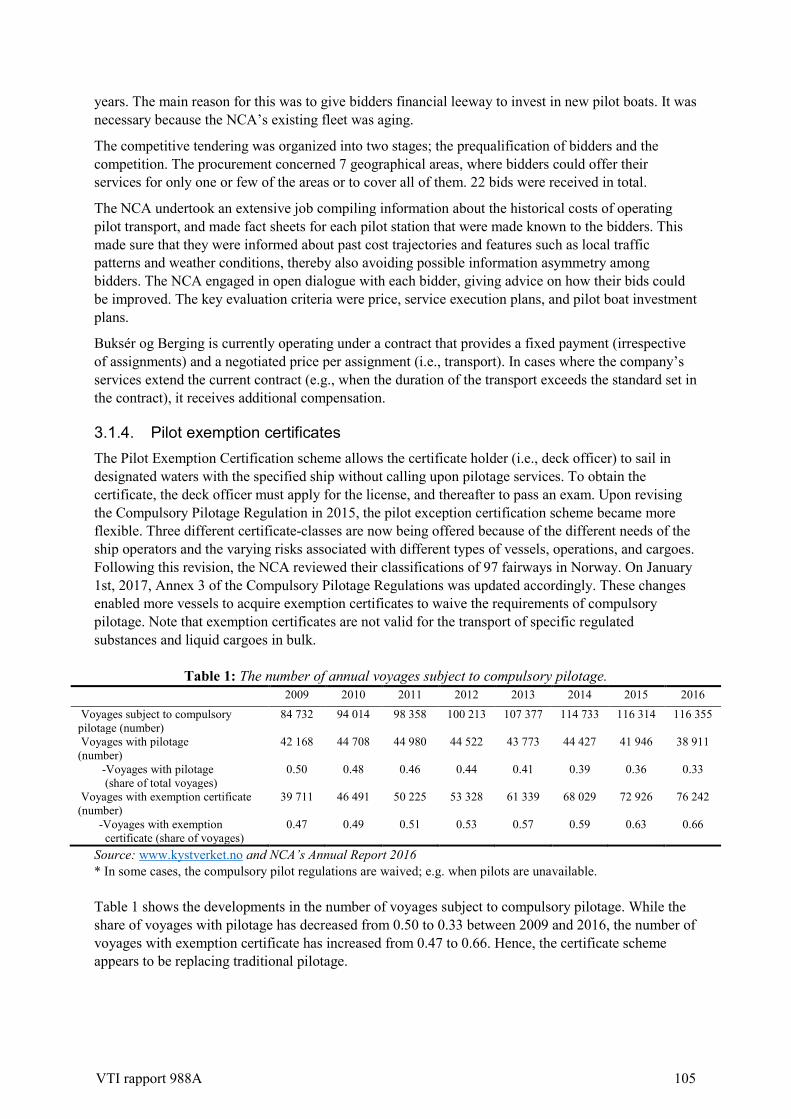
years. The main reason for this was to give bidders financial leeway to invest in new pilot boats. It was necessary because the NCA’s existing fleet was aging.
The competitive tendering was organized into two stages; the prequalification of bidders and the competition. The procurement concerned 7 geographical areas, where bidders could offer their services for only one or few of the areas or to cover all of them. 22 bids were received in total.
The NCA undertook an extensive job compiling information about the historical costs of operating pilot transport, and made fact sheets for each pilot station that were made known to the bidders. This made sure that they were informed about past cost trajectories and features such as local traffic patterns and weather conditions, thereby also avoiding possible information asymmetry among bidders. The NCA engaged in open dialogue with each bidder, giving advice on how their bids could be improved. The key evaluation criteria were price, service execution plans, and pilot boat investment plans.
Buksér og Berging is currently operating under a contract that provides a fixed payment (irrespective of assignments) and a negotiated price per assignment (i.e., transport). In cases where the company’s services extend the current contract (e.g., when the duration of the transport exceeds the standard set in the contract), it receives additional compensation.
3.1.4. Pilot exemption certificates The Pilot Exemption Certification scheme allows the certificate holder (i.e., deck officer) to sail in designated waters with the specified ship without calling upon pilotage services. To obtain the certificate, the deck officer must apply for the license, and thereafter to pass an exam. Upon revising the Compulsory Pilotage Regulation in 2015, the pilot exception certification scheme became more flexible. Three different certificate-classes are now being offered because of the different needs of the ship operators and the varying risks associated with different types of vessels, operations, and cargoes. Following this revision, the NCA reviewed their classifications of 97 fairways in Norway. On January 1st, 2017, Annex 3 of the Compulsory Pilotage Regulations was updated accordingly. These changes enabled more vessels to acquire exemption certificates to waive the requirements of compulsory pilotage. Note that exemption certificates are not valid for the transport of specific regulated substances and liquid cargoes in bulk.
Table 1: The number of annual voyages subject to compulsory pilotage. 2009 2010 2011 2012 2013 2014 2015 2016
Voyages subject to compulsory pilotage (number)
84 732 94 014 98 358 100 213 107 377 114 733 116 314 116 355
Voyages with pilotage (number)
42 168 44 708 44 980 44 522 43 773 44 427 41 946 38 911
-Voyages with pilotage (share of total voyages)
0.50 0.48 0.46 0.44 0.41 0.39 0.36 0.33
Voyages with exemption certificate (number)
39 711 46 491 50 225 53 328 61 339 68 029 72 926 76 242
-Voyages with exemption certificate (share of voyages)
0.47 0.49 0.51 0.53 0.57 0.59 0.63 0.66
Source: www.kystverket.no and NCA’s Annual Report 2016 * In some cases, the compulsory pilot regulations are waived; e.g. when pilots are unavailable. Table 1 shows the developments in the number of voyages subject to compulsory pilotage. While the share of voyages with pilotage has decreased from 0.50 to 0.33 between 2009 and 2016, the number of voyages with exemption certificate has increased from 0.47 to 0.66. Hence, the certificate scheme appears to be replacing traditional pilotage.
VTI rapport 988A 105
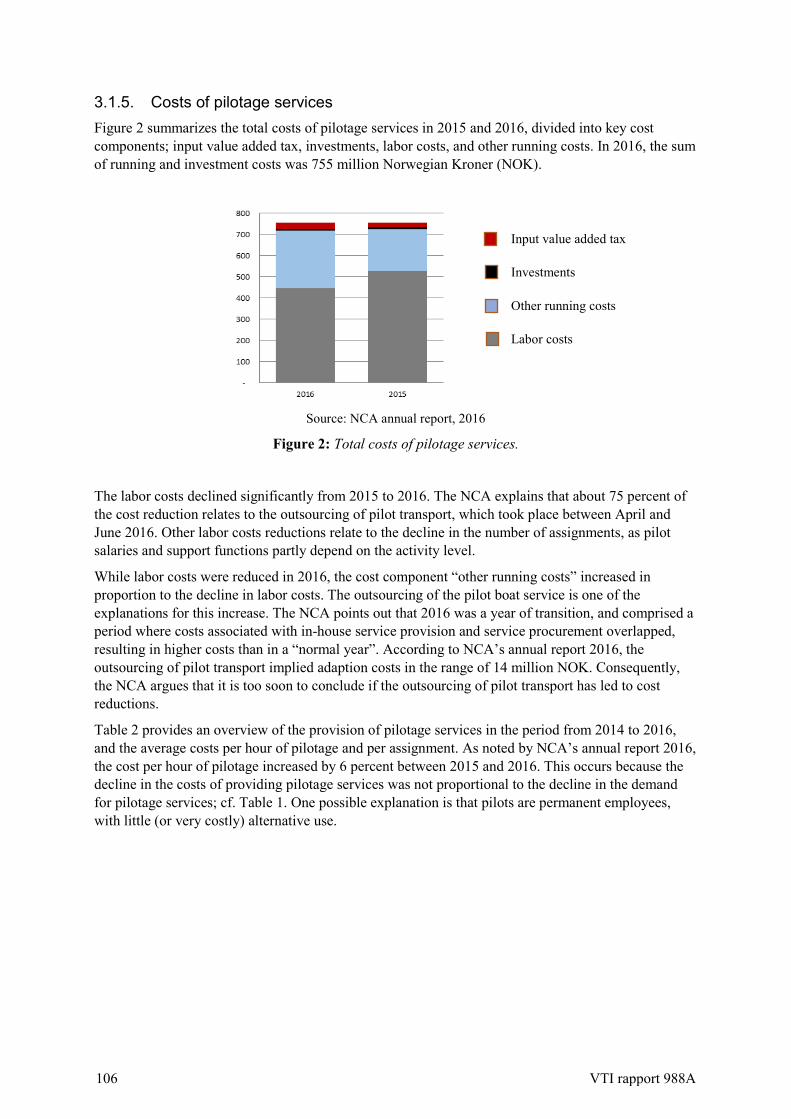
3.1.5. Costs of pilotage services Figure 2 summarizes the total costs of pilotage services in 2015 and 2016, divided into key cost components; input value added tax, investments, labor costs, and other running costs. In 2016, the sum of running and investment costs was 755 million Norwegian Kroner (NOK).
Source: NCA annual report, 2016
Figure 2: Total costs of pilotage services.
The labor costs declined significantly from 2015 to 2016. The NCA explains that about 75 percent of the cost reduction relates to the outsourcing of pilot transport, which took place between April and June 2016. Other labor costs reductions relate to the decline in the number of assignments, as pilot salaries and support functions partly depend on the activity level.
While labor costs were reduced in 2016, the cost component “other running costs” increased in proportion to the decline in labor costs. The outsourcing of the pilot boat service is one of the explanations for this increase. The NCA points out that 2016 was a year of transition, and comprised a period where costs associated with in-house service provision and service procurement overlapped, resulting in higher costs than in a “normal year”. According to NCA’s annual report 2016, the outsourcing of pilot transport implied adaption costs in the range of 14 million NOK. Consequently, the NCA argues that it is too soon to conclude if the outsourcing of pilot transport has led to cost reductions.
Table 2 provides an overview of the provision of pilotage services in the period from 2014 to 2016, and the average costs per hour of pilotage and per assignment. As noted by NCA’s annual report 2016, the cost per hour of pilotage increased by 6 percent between 2015 and 2016. This occurs because the decline in the costs of providing pilotage services was not proportional to the decline in the demand for pilotage services; cf. Table 1. One possible explanation is that pilots are permanent employees, with little (or very costly) alternative use.
• Input value added tax
• Investments
• Other running costs
• Labor costs
106 VTI rapport 988A
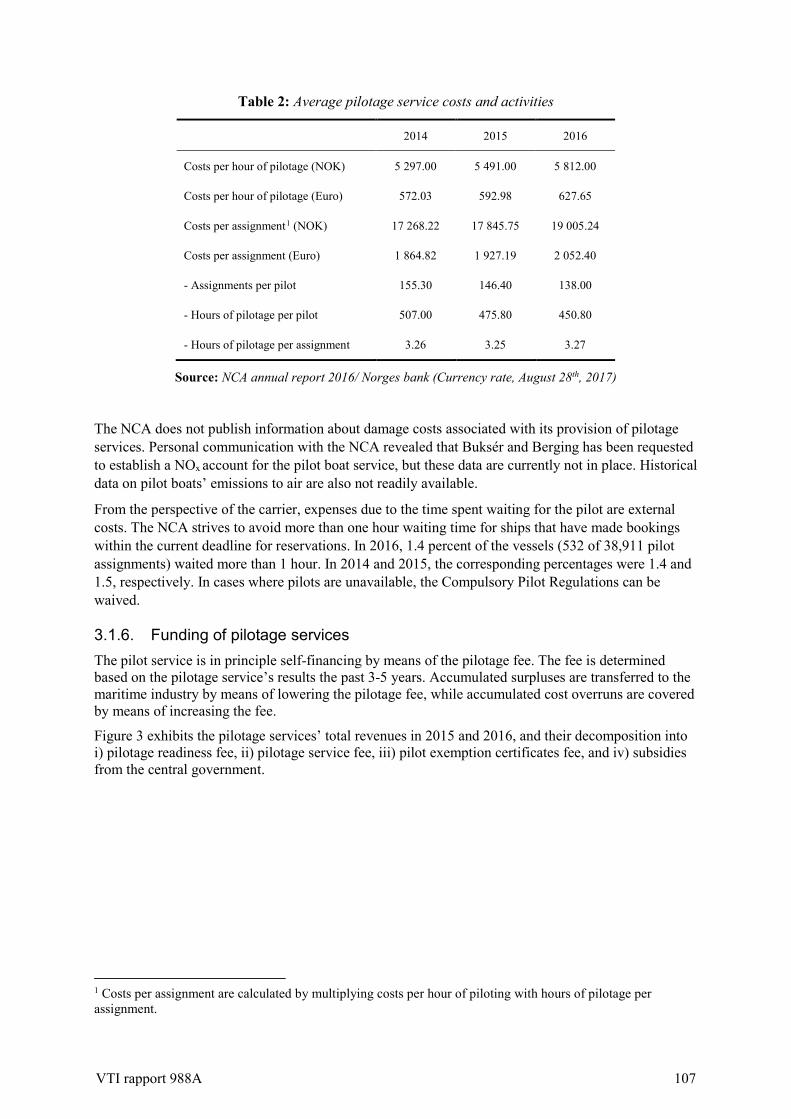
Table 2: Average pilotage service costs and activities
2014 2015 2016
Costs per hour of pilotage (NOK) 5 297.00 5 491.00 5 812.00
Costs per hour of pilotage (Euro) 572.03 592.98 627.65
Costs per assignment1 (NOK) 17 268.22 17 845.75 19 005.24
Costs per assignment (Euro) 1 864.82 1 927.19 2 052.40
- Assignments per pilot 155.30 146.40 138.00
- Hours of pilotage per pilot 507.00 475.80 450.80
- Hours of pilotage per assignment 3.26 3.25 3.27
Source: NCA annual report 2016/ Norges bank (Currency rate, August 28th, 2017)
The NCA does not publish information about damage costs associated with its provision of pilotage services. Personal communication with the NCA revealed that Buksér and Berging has been requested to establish a NOx account for the pilot boat service, but these data are currently not in place. Historical data on pilot boats’ emissions to air are also not readily available.
From the perspective of the carrier, expenses due to the time spent waiting for the pilot are external costs. The NCA strives to avoid more than one hour waiting time for ships that have made bookings within the current deadline for reservations. In 2016, 1.4 percent of the vessels (532 of 38,911 pilot assignments) waited more than 1 hour. In 2014 and 2015, the corresponding percentages were 1.4 and 1.5, respectively. In cases where pilots are unavailable, the Compulsory Pilot Regulations can be waived.
3.1.6. Funding of pilotage services The pilot service is in principle self-financing by means of the pilotage fee. The fee is determined based on the pilotage service’s results the past 3-5 years. Accumulated surpluses are transferred to the maritime industry by means of lowering the pilotage fee, while accumulated cost overruns are covered by means of increasing the fee.
Figure 3 exhibits the pilotage services’ total revenues in 2015 and 2016, and their decomposition into i) pilotage readiness fee, ii) pilotage service fee, iii) pilot exemption certificates fee, and iv) subsidies from the central government.
1 Costs per assignment are calculated by multiplying costs per hour of piloting with hours of pilotage per assignment.
VTI rapport 988A 107

Source: NCA annual report 2016
Figure 3: Total revenues of pilotage services
The regulation REG 1994-12-23 no. 1128 (dating back to 1994) encompasses the legal framework for the pilotage fee. Vessels subject to compulsory pilotage are required to pay the pilotage readiness fee, which is progressive in the size of the ship. Vessels that request pilotage services pay the pilotage service fee in addition to the readiness fee. Ships with deck officers that hold pilot exemption certificates pay the readiness fee only. However, a pilot exemption certificate fee applies upon the completion of the certificate exam, and when a pilot exemption certificate is issued, renewed, or changed.
The pilotage service was self-financing until 2015. In 2016, the pilotage service had a cost overrun of 107 million NOK. It was partly covered by the central government, which allocated 86 million NOK to promote maritime transport.
3.1.7. Uncertainty and risks NCA Pilotage Services is responsible for training and recruiting pilots, and thereby to ensure a sufficient number of pilots to meet the demand. Key risks related to this assignment are:
- The development of maritime transport, and thereby underlying factors such as business cycles and the competitiveness of unimodal road transport
- The development of pilot exemption certificates holders
The training of a pilot takes 5 years. Hence, long-term planning of the recruitment of pilots is essential. Moreover, pilots are permanent employees, and their special salary agreements currently make it too costly to employ them for alternative duties within the NCA in periods with few pilotage assignments. Hence, in periods with low maritime traffic, the pilotage resources become idle. Currently, the pilotage service is over-staffed, and new recruits were therefore not accepted in 2016-2017.
In addition to the employment situation, the general development of the maritime industry – with the introduction of larger and more sophisticated vessels – is also considered a challenge for pilots. They are now being trained to operate new equipment on board modern vessels.
• Subsidy
• Pilotage service fee
• Pilotage readiness fee
• Pilotage exemption certificate fee
108 VTI rapport 988A
3.1.8. Development of solutions and experiences so far As mentioned, the pilotage service was re-organized in 2014. Prior to this reform, the day-to-day responsibilities for handling pilotage operations were subordinate to the NCA’s regional offices (cf. Figure 1), while the Department for Maritime Safety oversaw operations, legislative work, and supervision. The overall objective of the reform was to cut the ties between the administration and the execution of pilotage services. Moreover, the replacement of 5 regional offices by the NCA Pilotage Services was undertaken to ensure a streamlined chain of command and thus more efficient communication.
Sources within the NCA argue that there is now a real division between the legislative and executive bodies, which in turn leads to objectivity in the handling of users (e.g., the handling of complaints due to failed pilotage/exemption certificates exams). Hence, they argue that the maritime industry finds the pilotage service to be more credible after the reform.
While the provision of pilotage services is the responsibility of the NCA and its subcontractors, the NCA is involved in international forums that encompass pilotage. The Baltic Pilotage Authorities Commision (BPAC) is a governmental organization of and a work forum for the pilotage authorities of Norway and the countries adjacent to the Baltic Sea. The forum allows the members to share experiences, to provide recommendations, and ultimately to influence national decision making. IALA is an international, non-governmental, technical organization that seeks to harmonize maritime services and infrastructure, and to develop international guidelines and standards. NCA participates in a number of the IALA's committees and forums, including the Pilotage Authority Forum (PAF) that concerns guidelines and standardization of the pilotage service.
VTI rapport 988A 109

3.1.9. Future plans The NCA has recently reorganized its administration and execution of pilot services, and has revised the pilot exemption certificate scheme. The groundwork for the reform is laid out in NOU 2013:18 Med los på sjøsikkerhet — Losordningens omfang, organisering og regelverk, that includes an historical overview of pilotage in Norway.
The NCA is currently working on a new regulation for the booking of pilot, which will be on hearing from October 2017. The purpose of the new regulation is to make pilotage manning more predictable by means of establishing new deadlines for the booking of pilots in the advent of arriving in waters subject to compulsory pilotage.
Interviews with the NCA revealed that the following issues are also on its agenda:
- The Pilotage Service’s role related to unmanned ships
- The quality of GPS (e.g., whether they can be jammed)
- The training of pilots to handle new types of ships and equipment
The NCA has previously evaluated the scope for remote (i.e., shore-based) pilotage. Based on this experience, plans for remote pilotage were shelved, and are not expected to reappear on NCA’s agenda anytime soon.
3.2. Icebreaking in Norway
3.2.1. Current administration and provision of pilotage services The national ice service is organized by the NCA. Its two main objectives are i) to provide information about the occurrence of ice in Norwegian waters from the Swedish boarder to Kristiansand and ii) icebreaking in main and secondary fairways. Its job description does not encompass icebreaking in ports, which is the responsibility of municipality governments. The national ice service is manned by Senior Engineer Steinar Hansen in a part time position. Hence, it constitutes only a very small part of the NCA’s activities. Publicly available information and statistics about the service are correspondingly scare.
The NCA’s 5 regional offices are in principle responsible for providing ice services. However, since ice is mainly a problem in southern Norway, NCA Region Southeast is in charge of providing the national ice service.
Icebreaking operations are contracted out to private firms. The key operating companies are Buksér og Berging AS and Kragerø Sjøtjenester. Buksér og Berging was established in 1913. It is currently operating 30 vessels for harbour duties and offshore support. Their headquarter is in Oslo, and they also have an office in Stavanger. Kragerø Sjøtjenester was established in 1996. It has 6 permanent employees. Its headquarter is located at Tangen in Kragerø.
The operating companies work on stand-by contracts for the following coastal areas in Norway:
• the Oslo fjord (Kragerø Sjøtjenester)
• the Drammen fjord (Buksér og Berging)
• Halden (Buksér og Berging)
• Moss (the port of Moss)
110 VTI rapport 988A

• The counties of Telemark, East- and West Agder (Kragerø Sjøtjenester)
• The area of Kragerø (Kragerø Sjøtjenester)
The NCA’s web-page explains that icebreaking in Norway is performed by means of tugboats. The market for icebreaking services is limited, and the tugs are consequently aging. The return on investment is considered so low that new vessels are not being built for the purpose of ice removal in Norway.
The tugboats work on contracts with a life-span of 1 year, with the option of prolonging the contract up to 4 years (1+1+1). The procurement process starts with the issuing of the tender documentation parts 1 and 2, where part 2 is the framework contract. The bids are evaluated using a score sheet, where the bidders’ abilities to break ice (i.e., the size of the tugboat), the time to mobilize the tugboats, and the total costs are the main criteria. While Buksér og Berging and Kragerø Sjøtjenester are the dominating bidders, there have on some occasions been up to 5 bidders participating in the tender competition.
3.2.2. Costs of icebreaking services The operating companies work on stand-by contracts, consisting of two components:
• A fixed cost component (i.e., a fixed annual payment)
• A cost reimbursement component, determined by the number of days the vessels are requisitioned for ice-breaking and the agreed day-rates
Clearly, cost reimbursement entails that the level of service is an important determinant of the total costs of icebreaking services. The NCA attempts to keep the level of service at the minimum, and will only deploy icebreakers in the case where cargo ships are obstructed by ice.
Unfortunately, there are no available statistics concerning the requiring of vessels (e.g., operating days), and NCA considered it too labor intensive to compile this information. Consequently, only NCA’s total procurement costs can be provided. When it comes to local provision of icebreaking services, the NCA states that the municipality governments usually have little or no icebreaking costs.
Table 3: The national ice service’s total procurement costs (nominal NOKs).
2014 2015 2016
Total costs (NOK) 9 835 000 6 385 000 7 620 483
Total costs (Euro) 1 062 095 689 525 822 946
Source: NCA’s annual reports 2015 and 2016/ Norges bank (Currency rate, August 28th, 2017)
There are no reports of external costs related to the provision of icebreaking services. As an indicator, we provide the most recent overview of the tugs’ consumption of Marine Diesel Oil (MDO). Damage costs are calculated using current CO2 prices for cost-benefit analysis in Norway, amounting to 354 NOK/ton.
VTI rapport 988A 111

Table 4: Total fuel consumption in 2017, in litres by region
Fuel consumption (l) CO2 emissions (t) Damage costs (NOK)
Damage costs (Euro)
Oslo 300 0.86 304.44 32.88
South coast 4 150 11.84 4 191.36 452.63
Drammen 4 150 11.84 4 191.36 452.63
Halden 3 432 9.79 3 465.66 374.26
Source: Personal communication with the NCA. CO2 emissions are calculated assuming
that MDO converts at 0.9kg/l and by using the emission factor for MDO from Statistics
Norway’s National Emission Inventory (i.e., 3170 kg CO2/t)
3.2.3. Funding of icebreaking services The national ice breaking service is financed by the NCA by means of its overall annual budget, which is partly funded by service users (e.g., pilotage) and by the state budget. In harsh winters, additional grants from the Norwegian Parliament are awarded to cover cost overruns.
According to the Harbor and Fairways Act, municipality governments are obliged to ensure accessibility within their waters. Following the Act, the municipalities can cover their costs related to icebreaking by means of increased fairway charges. The municipality governments must identify the appropriate level of service that is required to avoid disruptions of maritime transports. If the quality of the service exceeds the minimal level required to satisfy the municipalities’ obligations, they cannot cover excess costs based on user fees.
3.2.4. Uncertainty and risks Key risks relate to the extent of icing in winter. The current contracts reimburse the operators for their costs due to icebreaking operations. Thus, the cost risk is with the NCA, and ultimately with the Norwegian taxpayers. As noted by the NCA’s web-page, the current contracts are viewed as “first-aid” in mild winters. In the case of harsh winters, there is need for much more resources than the current contracts hold. This may involve the Coast Guard, the NCA, and private companies. Such occurrences will be challenging because the market for icebreaking is limited. Norway is a member of the Baltic Ice Breaker Management (BIM), which consists of Norway, Sweden, Finland, Russia, Estonia, Latvia, Poland, Germany, and Denmark. This organization aims to improve the members’ competence and to facilitate cooperation among the member states. It is recognized that sharing of icebreaking resources can be particularly important in harsh winters. The NCA is currently working on a contingency plan for harsh winters, that also involves the members of the BIM.
3.2.5. Development of solutions and experiences so far While icebreaking has been handled by private operators working on a contract with the NCA for a long time, competitive procurement was first introduced in 2013. Today, new announcements are made by means of Doffin, which is the Norwegian national notification database for public procurement. The reason for introducing competitive procurement appears first and foremost to ensure compliance with national regulations for the procurement of public services, rather than promoting
112 VTI rapport 988A

cost efficiency. NCA has no opinion on whether the introduction of competitive procurement has lowered the costs of providing icebreaking services.
3.2.6. Future plans BIM is currently working on an international contingency plan for harsh winters. This will include Norway in cooperation with the other members of BIM. Currently, Norway has not required assistance from its neighboring countries, primarily because the extent of icing has so far been manageable.
VTI rapport 988A 113
www.vti.se
VTI, Statens väg- och transportforskningsinstitut, är ett oberoende och internationellt framstående forskningsinstitut inom transportsektorn. Huvuduppgiften är att bedriva forskning och utveckling kring infrastruktur, trafik och transporter. Kvalitetssystemet och miljöledningssystemet är ISO-certifierat enligt ISO 9001 respektive 14001. Vissa provningsmetoder är dessutom ackrediterade av Swedac. VTI har omkring 200 medarbetare och finns i Linköping (huvudkontor), Stockholm, Göteborg, Borlänge och Lund.
The Swedish National Road and Transport Research Institute (VTI), is an independent and internationally prominent research institute in the transport sector. Its principal task is to conduct research and development related to infrastructure, traffic and transport. The institute holds the quality management systems certificate ISO 9001 and the environmental management systems certificate ISO 14001. Some of its test methods are also certified by Swedac. VTI has about 200 employees and is located in Linköping (head office), Stockholm, Gothenburg, Borlänge and Lund.
HEAD OFFICELINKÖPINGSE-581 95 LINKÖPING PHONE +46 (0)13-20 40 00 STOCKHOLM Box 55685 SE-102 15 STOCKHOLM PHONE +46 (0)8-555 770 20
GOTHENBURGBox 8072SE-402 78 GOTHENBURGPHONE +46 (0)31-750 26 00 BORLÄNGE Box 920SE-781 29 BORLÄNGEPHONE +46 (0)243-44 68 60
LUND Medicon Village ABSE-223 81 LUND PHONE +46 (0)46-540 75 00
114 VTI rapport 988A