organizational and staffing framework
TRANSCRIPT

Organizational and Staffing Framework June 2018
Prepared for: Prepared by:

i
Organizational and Staffing Framework
Contents Organizational and Staffing Framework .............................................................................................. 1 Current Organizational and Staffing Framework (2017) ....................................................................... 1
Greater Mankato Transit System Staffing ........................................................................................ 1 Existing Staffing Issues ................................................................................................................. 3
Projected Staffing Needs .................................................................................................................. 4 Labor Force Ratio Assumptions ...................................................................................................... 4
National Comparison - General ................................................................................................... 4 National Comparison – Mechanics ............................................................................................... 5 Peer Agency Comparison ............................................................................................................ 5 Assumed Ratios ......................................................................................................................... 7
Current Staffing Needs .................................................................................................................. 7 Projected Staffing Needs ............................................................................................................... 8
Recommendations ........................................................................................................................... 8 Staffing ........................................................................................................................................ 8 Organizational Framework ........................................................................................................... 12
List of Figures Figure 1: Existing Organization Chart .......................................................................................... 1 Figure 2: Proposed Organization Chart ........................................................................................ 9
List of Tables Table 1: GMTS Employee Counts (2017) ...................................................................................... 2 Table 2: National Labor Force Ratios (2016) ................................................................................ 4 Table 3: Average Hours per Vehicle ............................................................................................ 6 Table 4: Public Sector Transit Provider Ratios of Mechanics to Buses ............................................. 6 Table 5: Peer Agency Labor Ratios (2016) ................................................................................... 5 Table 6: FT and PT Employee Needs Based on Current Service Plan and Cost Neutral Service Plan ... 7 Table 7: FT and PT Employee Needs Based on New Service Expansion Plan ................................... 8 Table 8: FT and PT Employee Needs Based on Illustrative Plan ..................................................... 8 Table 9: Recommended GMTS Staffing Levels .............................................................................. 9 Table 10 Options for GMTS Organizational Framework ................................................................ 12

1
Organizational and Staffing Framework
Organizational and Staffing Framework This Organizational and Staffing Framework describes organizational structure and staffing for the Greater Mankato Transit System (GMTS). It assesses current and future organizational and staffing needs of the system, and includes recommendations on the type and number of employees that may strengthen the GMTS for 2018 through 2022.
2017 Organizational and Staffing Framework The GMTS is a department within the City of Mankato. Figure 1 shows it is part of the Community Development department, and its sister department is the Mankato Area Planning Organization (MAPO), the region’s federally-recognized metropolitan planning organization for transportation. The GMTS receives funding from the City of Mankato, City of North Mankato, Minnesota State University, Mankato (MSU-Mankato), Minnesota Department of Transportation (MnDOT) and the Federal Transit Administration (FTA).
Figure 1: Existing Organization Chart
GMTS Staffing Staffing for the GMTS is lean and has, at times, been challenged to attract and retain staff. As of December 2017, the GMTS has 13 full-time employees (FTEs) and 37 part-time employees (PTEs) (Table 1).

2
Organizational and Staffing Framework
Table 1: GMTS Employee Counts (2017)
LOCATION & LEVEL IN
ORG CHART
FULL-TIME EMPLOYEES
PART-TIME OR SHARED EMPLOYEES
ADDITIONAL NOTES
Transit Superintendent Responsible for oversight of the agency and coordination with other City departments
Transit Superintendent – Manager
1 0
Operations Supervisor Responsible for management of daily street operations
Operations – Supervisor
1 0
Operators Operates revenue vehicles
Operations – Support
7 36-Part Time
Mechanics and Bus Maintenance Interior and exterior cleaning of buses, fuel and repair buses, and maintenance other equipment
Operations – Support
1 2 (Shared)
Temporary staffing support is available from the City’s Central Garage (mechanics) and permanent facilities maintenance support is provided by the City’s Public Works Department
Administrative Supervisor Responsible for management of administrative tasks and personnel
Administrative – Supervisor
1 0 The GMTS had an Administrative Supervisor previously. The position is in the process of being filled.
Schedule Maker Generate fixed route and dial-a-ride schedules
Administrative – Support
0 1-Part Time
Public Information and Marketing
Shared Services - Support
0 2 (Shared)
The public information and marketing staff are shared with the City and the School District
MPO Planner Shared Services - Support
0 1 (Shared)

3
Organizational and Staffing Framework
LOCATION & LEVEL IN
ORG CHART
FULL-TIME EMPLOYEES
PART-TIME OR SHARED EMPLOYEES
ADDITIONAL NOTES
GIS Specialist Responsible for spatial analysis and route map production
Shared Services – Support
0 1 (Shared)
Central Garage Shared Services - Support
0 1 (Shared)
311 Operator Answers public 311 calls for the agency
Shared Services – Support
0 1 (Shared)
Transit Engineer Design and maintain bus shelters and facilities
Shared Services - Support
0 1 (Shared)
The transit engineer is shared with the City’s Public Works Department
Facility Maintenance Shared Services - Support
0 1 (Shared)
TOTAL EMPLOYEES 11 Transit: 37 Part Time
Shared:
10
Existing Staffing Issues No transit development staff. The Transit Superintendent is currently performing transit
development work for the GMTS. These responsibilities include analyzing and evaluating service productivity, and identifying and evaluating emerging service needs, including fare policy and fare media, updating service plans, and securing funding for capital and operating expenditures. The GMTS hired a transit service planner, who left the position recently. The position has not been filled since the employee’s departure.
No procurement staff. The GMTS currently has no staff dedicated to FTA-compliant procurement and documentation of equipment. A procurement staff person coordinates the purchase of new vehicles and equipment to operate transit service plan.
Minimal mechanic staff. One full-time employee currently performs all mechanic services on 17 buses and other garage equipment. When needed, the mechanic is supported by other mechanic staff from the City’s Central Garage (mechanics). Having one person responsible for vehicle and equipment mechanics poses a threat to the system. Successful maintenance is essential to system safety and day-to-day operations. Vacations, sick-leave, or any sudden departure from the maintenance position has an immediate impact on daily operations. The FTA and MnDOT have noted in their formal reviews that GMTS needs more mechanic staff to safely and reliably execute the existing service plan.
No maintenance staff. In addition to performing his mechanic duties, the mechanic also maintains, washes, and fuels all 17 buses and other garage equipment as of December 2017. When needed, the mechanic is supported by other maintenance staff from the City’s Central
4
Organizational and Staffing Framework
Garage (mechanics) and Engineering (facilities maintenance). Having one person responsible for vehicle and equipment maintenance poses a threat to the system. Successful maintenance is essential to system safety and day-to-day operations. Vacations, sick-leave, or any sudden departure from the maintenance position has an immediate impact on daily operations. The FTA and MnDOT have noted in their formal reviews that GMTS needs more committed maintenance staff to safely and reliably execute the existing service plan.
Shared marketing and communications staff. Two public information and marketing staff support the GMTS, the City of Mankato, and the District 77 School District. The transit agency has significant communications and marketing demands, and demands are anticipated to increase beyond 66 percent of a full time equivalent (FTE). These responsibilities include maintaining Title VI-compliant communication and engagement policies and practices, developing and updating transit route maps and schedules, communicating route changes and system modifications, and reviewing customer comments for Title VI concerns.
Managerial-level coordination between GMTS and Managers for Shared Services Staff. A shared-services model can be very effective in efficiently delivering services. Prioritizing efforts can be a major challenge with a shared-services model, requiring regular, proactive coordination between staff, especially management staff making assignments to staff. This kind of coordination can require time that is difficult for transit staff to prioritize as they balance operating the transit system daily. From interviews with transit staff, transit operating priorities became so significant that they could no longer coordinate meaningfully with shared services staff and managers, which resulted in failure to consistently leverage shared services such as public information and marketing, GIS mapping, and facilities engineering and maintenance.
Projected Staffing Needs The National Transit Database (NTD) is the national database of transit statistics by provider. The planning team used the NTD to generate ratios of employees per vehicle, revenue mile, and revenue hour and assessed current and future staffing needs based on GMTS operations.
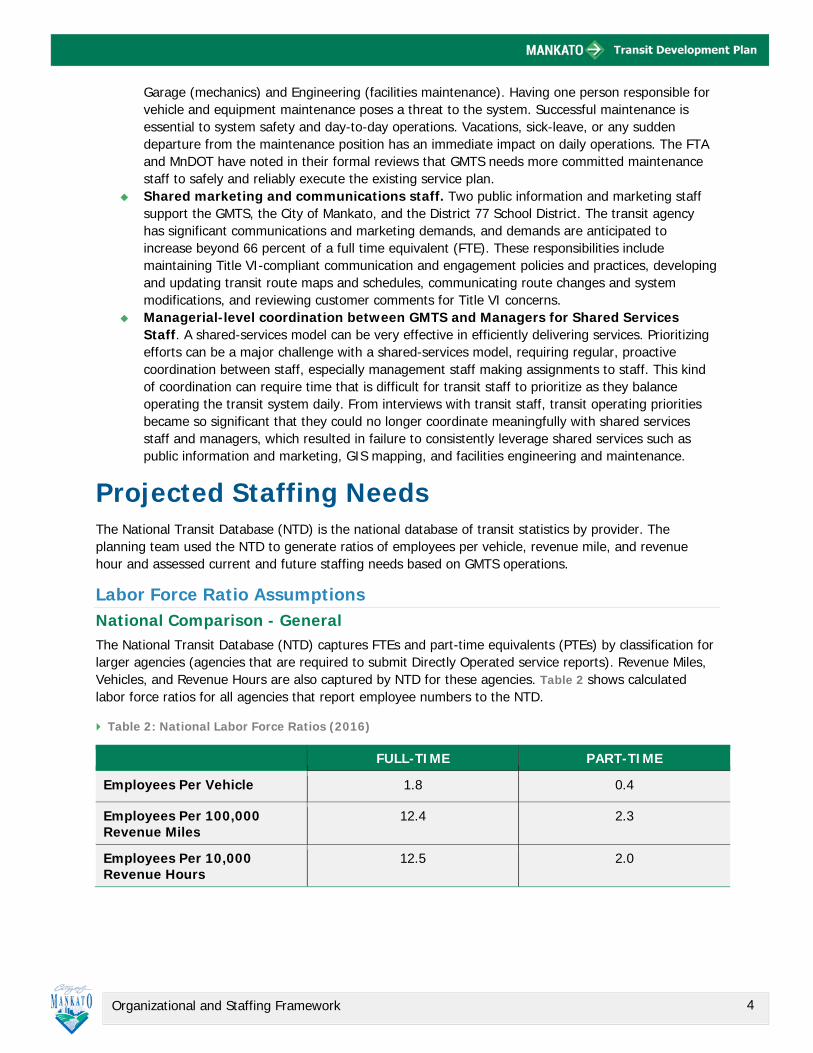
Labor Force Ratio Assumptions National Comparison - General The National Transit Database (NTD) captures FTEs and part-time equivalents (PTEs) by classification for larger agencies (agencies that are required to submit Directly Operated service reports). Revenue Miles, Vehicles, and Revenue Hours are also captured by NTD for these agencies. Table 2 shows calculated labor force ratios for all agencies that report employee numbers to the NTD.
Table 2: National Labor Force Ratios (2016)
FULL-TIME PART-TIME
Employees Per Vehicle 1.8 0.4
Employees Per 100,000 Revenue Miles
12.4 2.3
Employees Per 10,000 Revenue Hours
12.5 2.0

5
Organizational and Staffing Framework
Peer Agency Comparison - General Smaller agencies, including GMTS and two of the five peer agencies in the Existing Services, Ridership, and Standard report, are not required to submit this employee detail to NTD. However, three peer agencies did submit employee counts. The ratios from these peer agencies may be more relevant to the GMTS as their scope and transit context is more similar than the larger systems included in the full national database. Table 3 shows calculated labor force ratios for peer agencies that report employee numbers to the NTD.
Table 3: Peer Agency Labor Ratios (2016)1
2016 FTE PER VEHICLE
PTE PER VEHICLE
FTE PER 100,000
REVENUE MILES
PTE PER 100,000
REVENUE MILES
FTE PER 10,000
REVENUE HOURS
PTE PER 10,000
REVENUE HOURS
Municipal Transit Utility
0.6 0.1 4.3 0.5 5.9 0.7
Go Transit 0.8 0.0 3.3 0.1 5.1 0.2
Shoreline Metro 0.9 1.0 4.2 4.5 6.1 6.5
Average Peer Agency
0.8 0.4 4.0 1.7 5.7 2.5
Greater Mankato Transit System
0.8 2.2 3.8 10.8 4.6 13.0
National Comparison – Mechanics There is no published industry standard for the number of mechanics required for transit agencies based on service or existing capital assets. For planning purposes, a mechanic to bus ratio was developed by reviewing resources provided by the Transit Cooperative Research Program (TCRP Report 184, published 2016) and conducting interviews with public- and private-sector transit providers. The TCRP report and provider interviews show that providers that perform both core maintenance and heavy repair typically employ one mechanic per five to eight vehicles in the fleet. These transit systems typically also employ mechanic technicians that can perform lower-skilled duties such as interior and exterior cleaning of buses and shelters, daily fueling, and repair of other maintenance equipment.
1 Including GMTS, the revenue hours and revenue miles used to calculate the labor force ratios were all from NTD (2016).

6
Organizational and Staffing Framework
Table 4: Average Hours per Vehicle2
PERSON ACTIVITY AVERAGE TECHNICIAN HOURS PER YEAR PER VEHICLE MAINTAINED
Mechanic Core vehicle maintenance 291
Mechanic In-house heavy repair 47
Mechanic Subtotal 338
Mechanic Technicians Cleaning, fueling, minor daily checks and fixes
12
Grand Total 350
Using the TCRP numbers, seventeen (17) vehicles in a fleet would require 5,746 mechanic hours annually (not including technicians). If a full-time mechanic works 2,000 hours per year (which allows for two weeks of paid vacation), a fleet of 17 vehicles would require nearly three full-time mechanics. This results in a ratio of one mechanic per five buses.
Additionally, the study team consulted with Maintenance Design Group, a consulting firm that specializes in transportation operations and maintenance facilities, and confirmed industry standard practice is a ratio of one mechanic per five buses.
PUBLIC SECTOR INTERVIEWS The study team interviewed a diverse set of public sector transit providers to identify their current ratios of mechanics to buses. These providers are in Minnesota, Michigan, Virginia, and Texas, and their ratios are shown in Table 4.
Table 5: Public Sector Transit Provider Ratios of Mechanics to Buses
STATE RATIO OF MECHANICS: BUSES
Michigan 1:5.4
Minnesota 1:6.5 to 1:8
Texas 1:4.3
Virginia 1:3 to 1:4
California 1:3
Mankato GMTS 1:17
PRIVATE SECTOR INTERVIEWS The study team interviewed a diverse set of private sector transit providers to identify their current ratios of mechanics to buses. The private-sector transit providers are in Arizona, do not need to maintain fleets against snow and winter conditions. And employ one mechanic per seven to thirteen buses in the fleet.
First Transit - 1:6.8 2 TCRP Report 184: Maintenance Technician Staffing Levels for Modern Public Transit Fleets (2016) includes Table S-1 (p.2)

7
Organizational and Staffing Framework
Transdev - ranges from 1:8 to 1:13 Assumed Ratios Based on review of the national and peer agencies, the study team identified the following for FTEs:
1 (or more) full-time employees per vehicle 4 (or more) full-time employees per 100,000 revenue miles 6 (or more) full-time employees per 10,000 revenue hours
Based on review of the national and peer agencies, the following ratios were deduced for PTEs:
0.5 part-time employees per vehicle 2 part-time employees per 100,000 revenue miles 2 part-time employees per 10,000 revenue hours
The planning team noted potential for more variance on part-time employee ratios as compared to full-time employee labor ratios. Part-time employee hours and application varied between agencies in the NTD reports.
Current Staffing Needs Table 6 shows the anticipated employee needs of GMTS based on current service statistics. The labor ratios, which are detailed in Table 5 and in the “National Comparison – Mechanics” section, have been rounded here to the nearest 0.5 for clarity.
Table 6: FT and PT Employee Needs Based on Current Service Plan and Cost Neutral Service Plan
STATISTIC CURRENT SERVICE
PLAN3
FT EMPLOYEE LABOR RATIO
FT LABOR NEED
PT LABOR RATIO
PT LABOR NEED
Vehicles 17 1 per vehicle 17.0 0.5 per vehicle 8.5
Revenue Miles
343,263 4 per 100,000 miles
13.7 2 per 100,000 miles
6.9
Revenue Hours
28,492 6 per 10,000 hours
17.1 2 per 10,000 hours
0.6
Mechanic to Bus Ratio
17 (vehicles) 1 per 5 buses 3.4 N/A N/A
Based on national and peer trends and given existing operations, the GMTS should have at least 17 full-time employees, including three mechanics, and 8 part-time employees. The GMTS is currently understaffed by 4 FTEs and overstaffed with PTEs.
3 Revenue Miles and Hours are NTD 2016 Statistics

8
Organizational and Staffing Framework
Projected Staffing Needs Tables 7 and 8 show forecast staffing needs based on the GMTS New Service Expansion Plan (Table 7) and the Illustrative Service Plan (Table 8).
Table 7: FT and PT Employee Needs Based on New Service Expansion Plan
STATISTIC RECOMMENDED SERVICE PLAN
FT EMPLOYEE LABOR RATIO
FT LABOR NEED
PT LABOR RATIO
PT LABOR NEED
Vehicles 22 1 per vehicle 22 0.5 per vehicle 11
Revenue Miles 406,422 4 per 100,000 miles
16.3 2 per 100,000 miles
8.1
Revenue Hours 38,925 6 per 10,000 hours
23.4 2 per 10,000 hours
7.8
Mechanic to Bus Ratio
1 1 per 5 buses 4.4 N/A N/A
Table 8: FT and PT Employee Needs Based on Illustrative Plan
STATISTIC ILLUSTRATIVE PLAN
FT EMPLOYEE LABOR RATIO
FT LABOR NEED
PT LABOR RATIO
PT LABOR NEED
Vehicles 31 1 per vehicle 31 0.5 per vehicle 15.5
Revenue Miles 873,758 4 per 100,000
miles 35 2 per 100,000 miles 17.5
Revenue Hours 66,839 6 per 10,000
hours 40.1 2 per 10,000 hours 13.4
Mechanic to Bus Ratio 1 1 per 5 buses 6.2 N/A N/A
Based on the New Service Expansion Plan, the GMTS should employ 16 to 23 full-time staff, including at least four full-time mechanics, and 8 to 11 part-time staff. When comparing to 2017 staffing levels, the GMTS will be understaffed by 5 full-time staff, including three full-time mechanics, and overstaffed with PTEs if implementing the New Service Expansion Plan.
Based on the Illustrative Plan, the GMTS should employ 31 to 40 full-time staff, including six full-time mechanics, and 13 to 18 part-time employees. When comparing to 2017 staffing levels, the GMTS will be understaffed by 20 to 29 FTEs and overstaffed with PTEs if the Illustrative Plan is implemented.
Recommendations Staffing The GMTS is understaffed for both the existing and the two proposed service plans. Figure 2 shows the proposed organization chart for the GMTS.
9
Organizational and Staffing Framework
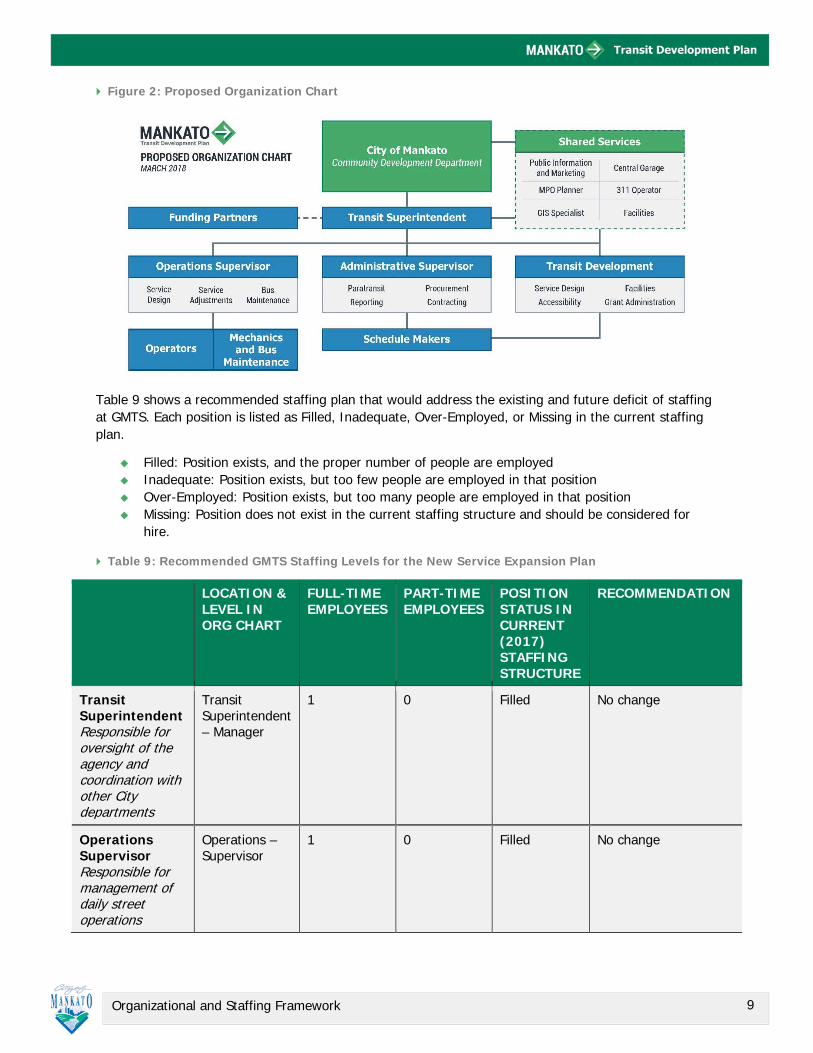
Figure 2: Proposed Organization Chart
Table 9 shows a recommended staffing plan that would address the existing and future deficit of staffing at GMTS. Each position is listed as Filled, Inadequate, Over-Employed, or Missing in the current staffing plan.
Filled: Position exists, and the proper number of people are employed Inadequate: Position exists, but too few people are employed in that position Over-Employed: Position exists, but too many people are employed in that position Missing: Position does not exist in the current staffing structure and should be considered for
hire.
Table 9: Recommended GMTS Staffing Levels for the New Service Expansion Plan
LOCATION & LEVEL IN ORG CHART
FULL-TIME EMPLOYEES
PART-TIME EMPLOYEES
POSITION STATUS IN CURRENT (2017) STAFFING STRUCTURE
RECOMMENDATION
Transit Superintendent Responsible for oversight of the agency and coordination with other City departments
Transit Superintendent – Manager
1 0 Filled No change
Operations Supervisor Responsible for management of daily street operations
Operations – Supervisor
1 0 Filled No change

10
Organizational and Staffing Framework
LOCATION & LEVEL IN ORG CHART
FULL-TIME EMPLOYEES
PART-TIME EMPLOYEES
POSITION STATUS IN CURRENT (2017) STAFFING STRUCTURE
RECOMMENDATION
Operators Operate revenue vehicles
Operations – Support
8 to 154 As needed to provide peak service
FT need Add one to eight full-time operators for the New Service Expansion plan
Mechanics (Buses)
Operations – Support
4 1-Part time
FT need Add at least three full time and one part-time mechanics for the New Expansion plan Make at least one mechanic a Maintenance Supervisor to oversee all daily maintenance operations
Bus Maintenance Interior and exterior cleaning of buses and shelters, fuel and repair buses and other maintenance equipment
Operations – Support
As needed to support Maintenance
As needed to support Maintenance
Need
Administrative Supervisor Responsible for management of administrative tasks and personnel, paratransit reporting, and procurement and contracting
Administrative – Supervisor
1 0 Filled No change
Scheduler Maker Generate fixed route and dial-a-ride schedules
Administrative – Support
0 1-Part time Filled No change
4 Operator numbers should be finalized based on specific service plans and blocking schedule.
11
Organizational and Staffing Framework
LOCATION & LEVEL IN ORG CHART
FULL-TIME EMPLOYEES
PART-TIME EMPLOYEES
POSITION STATUS IN CURRENT (2017) STAFFING STRUCTURE
RECOMMENDATION
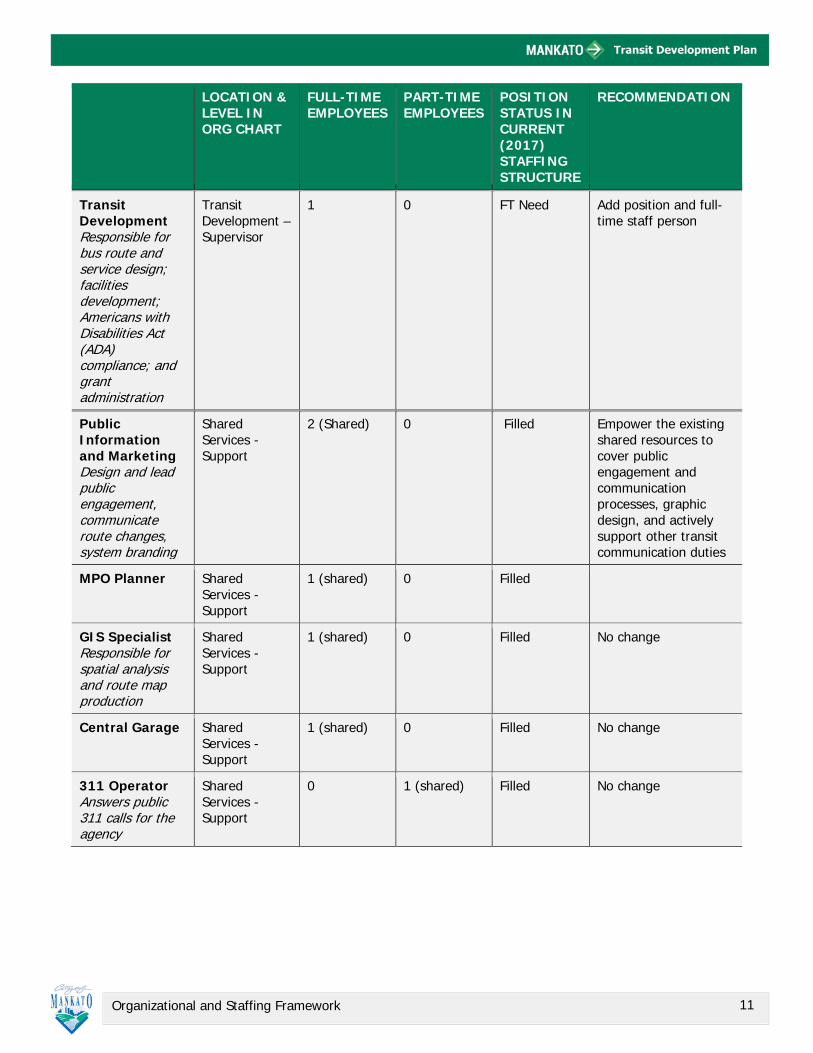
Transit Development Responsible for bus route and service design; facilities development; Americans with Disabilities Act (ADA) compliance; and grant administration
Transit Development – Supervisor
1 0 FT Need Add position and full-time staff person
Public Information and Marketing Design and lead public engagement, communicate route changes, system branding
Shared Services - Support
2 (Shared) 0 Filled Empower the existing shared resources to cover public engagement and communication processes, graphic design, and actively support other transit communication duties
MPO Planner Shared Services - Support
1 (shared) 0 Filled
GIS Specialist Responsible for spatial analysis and route map production
Shared Services - Support
1 (shared) 0 Filled No change
Central Garage Shared Services - Support
1 (shared) 0 Filled No change
311 Operator Answers public 311 calls for the agency
Shared Services - Support
0 1 (shared) Filled No change
12
Organizational and Staffing Framework
LOCATION & LEVEL IN ORG CHART
FULL-TIME EMPLOYEES
PART-TIME EMPLOYEES
POSITION STATUS IN CURRENT (2017) STAFFING STRUCTURE
RECOMMENDATION
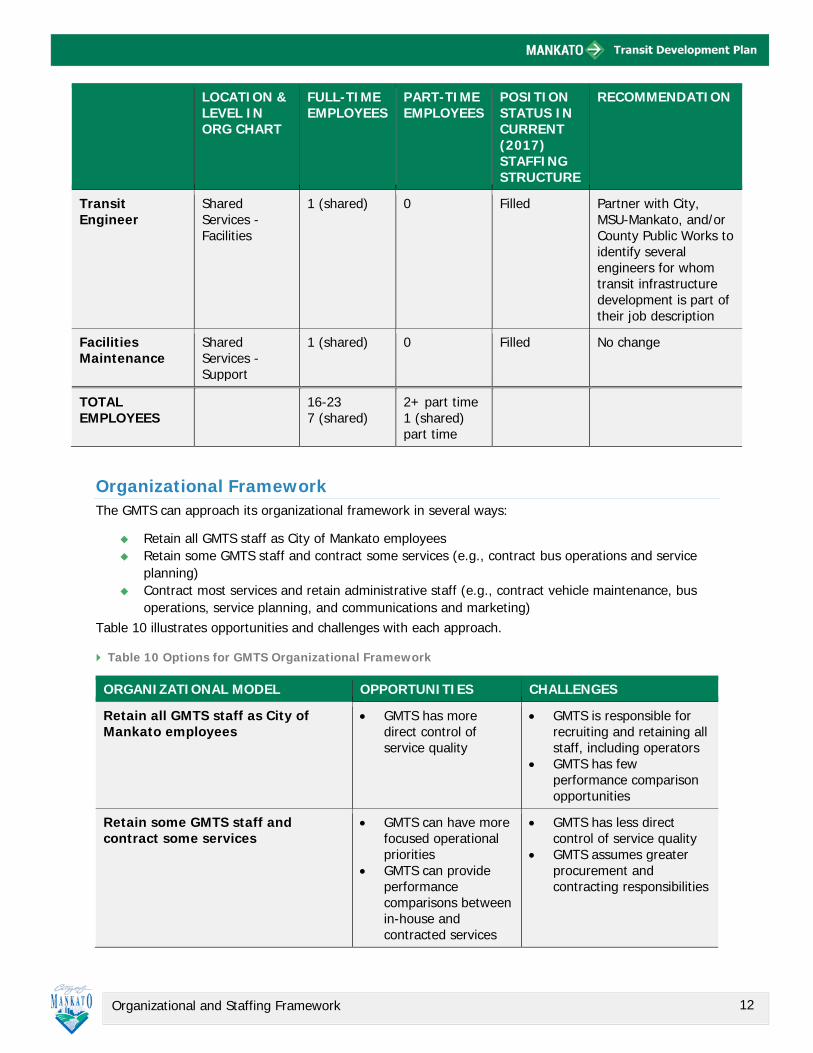
Transit Engineer
Shared Services - Facilities
1 (shared) 0 Filled Partner with City, MSU-Mankato, and/or County Public Works to identify several engineers for whom transit infrastructure development is part of their job description
Facilities Maintenance
Shared Services - Support
1 (shared) 0 Filled No change
TOTAL EMPLOYEES
16-23 7 (shared)
2+ part time 1 (shared) part time
Organizational Framework The GMTS can approach its organizational framework in several ways:
Retain all GMTS staff as City of Mankato employees Retain some GMTS staff and contract some services (e.g., contract bus operations and service
planning) Contract most services and retain administrative staff (e.g., contract vehicle maintenance, bus
operations, service planning, and communications and marketing) Table 10 illustrates opportunities and challenges with each approach.
Table 10 Options for GMTS Organizational Framework
ORGANIZATIONAL MODEL OPPORTUNITIES CHALLENGES
Retain all GMTS staff as City of Mankato employees
• GMTS has more direct control of service quality
• GMTS is responsible for recruiting and retaining all staff, including operators
• GMTS has few performance comparison opportunities
Retain some GMTS staff and contract some services
• GMTS can have more focused operational priorities
• GMTS can provide performance comparisons between in-house and contracted services
• GMTS has less direct control of service quality
• GMTS assumes greater procurement and contracting responsibilities

13
Organizational and Staffing Framework
ORGANIZATIONAL MODEL OPPORTUNITIES CHALLENGES
Contract most services and retain administrative staff
• GMTS can have highly focused operational priorities
• GMTS can request performance comparisons for various contracted services
• GMTS has least direct control of service quality
• GMTS assumes significant procurement and contracting responsibilities
The shared services model used by the GMTS appears to be working and should be maintained. The GMTS organizational framework is similar to other hybrid frameworks including:
Maple Grove Transit (MN), which contracts most services and retains administrative staff only; In May 2018, Metro Transit maintains and operates all Maple Grove Transit routes
Minnesota Valley Transit (MN), which contracts maintenance and operations, but retains service planning and administrative responsibilities; In May 2018, Schmitty & Sons performs all maintenance and operations for MVTA routes
Metropolitan Council (MN), which has two operating divisions – Metro Transit and Metropolitan Transportation Services
Metro Transit performs all activities for its routes and facilities Metropolitan Transportation Services contracts most services and retains administrative staff only CobbLinc (Cobb County, GA), which contracts service planning, maintenance, and operations, but
retains ownership of all vehicles and facilities If maintaining the current shared-services approach, the GMTS and City of Mankato should be more responsive to staffing shortages as they are identified in the future, especially for staff charged with safely and reliably operating and maintaining vehicles and facilities.