organizational behavior and human decision processes · (sterman, 2002) presents participants with...
TRANSCRIPT

Organizational Behavior and Human Decision Processes xxx (2008) xxx–xxx
ARTICLE IN PRESS
Contents lists available at ScienceDirect
Organizational Behavior and Human Decision Processes
journal homepage: www.elsevier .com/ locate/obhdp
Why don’t well-educated adults understand accumulation? A challengeto researchers, educators, and citizens
Matthew A. Cronin a,*, Cleotilde Gonzalez b, John D. Sterman c
a School of Management, George Mason University, Mail Stop 5F5, Fairfax, VA 22030-4444, USAb Dynamic Decision Making Laboratory, Social and Decision Sciences Department, Carnegie Mellon University, 5000 Forbes Ave., Pittsburgh, PA 15213, USAc System Dynamics Group, MIT Sloan School of Management, 30 Wadsworth Street, E53-351, Cambridge, MA 02141, USA
a r t i c l e i n f o a b s t r a c t
Article history:Received 10 December 2006Accepted 31 March 2008Available online xxxx
Accepted by Robyn Dawes
Keywords:Dynamic decision makingCognitive capacityAccumulationStocks and flowsSystem dynamics
0749-5978/$ - see front matter � 2008 Elsevier Inc. Adoi:10.1016/j.obhdp.2008.03.003
* Corresponding author.E-mail addresses: [email protected] (M.A. Cronin)
1 Formally, consider any stock, S, with inflow I and otime, t0, St0. The net inflow to the stock is the differenc
ST ¼Z T
t0
Net inflow dt þ St0 ¼Z T
t0
ðI � OÞ dt þ St0
Equivalently, the rate of change of the stock is the net
dSdt¼ Net inflow ¼ I � O
Note the units of measure: the stock is measured in uniin the stock are measured in units/time period, e.g., li
Please cite this article in press as: Cronin,zational Behavior and Human Decision Proc
Accumulation is a fundamental process in dynamic systems: inventory accumulates production less ship-ments; the national debt accumulates the federal deficit. Effective decision making in such systemsrequires an understanding of the relationship between stocks and the flows that alter them. However,highly educated people are often unable to infer the behavior of simple stock–flow systems. In a seriesof experiments we demonstrate that poor understanding of accumulation, termed stock–flow failure, isa fundamental reasoning error. Persistent poor performance is not attributable to an inability to interpretgraphs, lack of contextual knowledge, motivation, or cognitive capacity. Rather, stock–flow failure is arobust phenomenon that appears to be rooted in failure to appreciate the most basic principles of accu-mulation, leading to the use of inappropriate heuristics. We show that many people, including highlyeducated individuals with strong technical training, use what we term the ‘‘correlation heuristic”, erro-neously assuming that the behavior of a stock matches the pattern of its flows. We discuss the originsof stock–flow failure and implications for management and education.
� 2008 Elsevier Inc. All rights reserved.
Understanding and managing stocks and flows—that is, re-sources that accumulate or deplete and the flows that alterthem—is a fundamental process in society, business, and personallife. At the macroeconomic level, for example, exploration in-creases known petroleum reserves, while oil production reducesthe stock of oil remaining for the future. In turn, petroleum com-bustion increases the stock of carbon dioxide in the atmosphereand contributes to global warming. At the organizational level,firms’ capabilities and competitive advantages arise from the accu-mulation of resources and knowledge. Firms must manage theircash flows to maintain adequate stocks of working capital, and pro-duction must be adjusted as sales vary to maintain sufficientinventory. Individuals, too, face similar stock management chal-
ll rights reserved.
, [email protected] (C. Goutflow O. The stock at any time T, ST
e between inflow and outflow, I �
inflow:
ts, e.g., liters of water in a tub, dollatres/sec, $/month, or people/min.
M. A. et al., Why don’t well-esses (2008), doi:10.1016/j.o
lenges: we manage our bank accounts (stock of funds) to maintaina reasonable balance as our incomes (inflows) and expenses (out-flows) vary, and we struggle to maintain a healthy weight by man-aging the inflow and outflow of calories through diet and exercise.Accumulation is a pervasive process in everyday life, and arises atevery temporal, spatial and organizational scale.
All stock–flow systems share the same underlying structure.The resource level (stock) accumulates the inflows to it less theoutflows from it.1 Although the relationship between stocks andflows is a fundamental concept of calculus, knowledge of calculusis not necessary to understand the behavior of stocks and flows.Any stock can be thought of as the amount of water in a tub. Thewater level accumulates the flow of water into the tub (the inflow)
nzalez), [email protected] (J.D. Sterman)., is the integral of its net inflow over time, plus the quantity in the stock at the initialO:
rs in an account, or people in a store, while the inflow, outflow, and net rate of change
educated adults understand accumulation? A challenge ..., Organi-bhdp.2008.03.003

2 M.A. Cronin et al. / Organizational Behavior and Human Decision Processes xxx (2008) xxx–xxx
ARTICLE IN PRESS
less the flow exiting through the drain (the outflow). The rate ofchange in the water level is the net flow, given by the difference be-tween the inflow and outflow. As everyday experience suggests, thewater level rises only when the inflow exceeds the outflow, falls onlywhen the outflow exceeds the inflow, and remains the same onlywhen the inflow equals the outflow.
Stock–flow problems, even simple ones, are unintuitive and dif-ficult, even for highly educated people with strong mathematicsbackgrounds, including calculus (Booth Sweeney & Sterman,2000; Cronin & Gonzalez, 2007; Sterman & Booth Sweeney,2002). For example, Booth Sweeney and Sterman (2000) presentedgraduate students at an elite university with a picture of a bathtuband graphs showing the inflow and outflow of water, then askedthem to sketch the trajectory of the stock of water in the tub.Although the patterns were simple, fewer than half responded cor-rectly. We denote such difficulties stock–flow (SF) failure.
This paper investigates the sources of and psychological pro-cesses involved in SF failure. We address many commonly citedreasons for poor performance in dynamic decision-making studiesand stock–flow contexts (e.g., Atkins, Wood, & Rutgers, 2002;Booth Sweeney & Sterman, 2000; Jensen & Brehmer, 2003; Ster-man & Booth Sweeney, 2007). Experiments 1–4 test whetherinformation displays (Atkins et al., 2002), the cognitive burdenof required calculations (Roch, Lane, & Samuelson, 2000), inade-quate motivation, unfamiliar task context, or the inability tointerpret or construct graphs (Ossimitz, 2002) contribute to SFfailure. The experiments demonstrate the persistence of SF failureeven when the task is simple, participants are motivated, contextsare familiar, information displays are varied and participants arehighly educated and able to read graphs. The results suggest thatSF failure arises from a deeper and more robust difficulty, analo-gous to the persistent problems people have in probabilistic judg-ment and decision making (Dawes, 1988, 1998; Kahneman &Tversky, 1972).
It appears that many people have difficulty applying the princi-ples of accumulation correctly, failing to grasp that the quantity ofany stock, such as the level of water in a tub, rises (falls) when theinflow exceeds (is less than) the outflow. Rather, it appears thatpeople often use intuitively appealing but erroneous heuristicssuch as assuming that the output of a system is positively corre-lated with its inputs. That is, people assume that the output (thestock) should ‘‘look like” the input (the flow or net flow). We de-note such behavior the correlation heuristic.
Correlational reasoning can be useful and adaptive (e.g., illnessis highly correlated with the consumption of certain mushrooms;the rustling of leaves in the underbrush often heralds a stalkingpredator). Further, in some cases, by accident, the correlation heu-ristic yields the correct response in a stock–flow situation. Specif-ically, when the net inflow to a stock is positive and growingexponentially, the stock will also grow exponentially.2 Many mac-roeconomic variables do have strong exponential trends, for exam-ple, GDP, the federal deficit, and greenhouse gas emissions.However, the fact that the correlation heuristic works when thenet flow is exponential is an accident. The correlation heuristic failswith any departure from a pure exponential growth trend for the netflow.
These failures of the correlation heuristic are highly conse-quential. For example, the US federal deficit and national debthave both risen dramatically in the past half-century, and theyare highly correlated (r = .80 for annual data from 1950 to 2005,p < .001). However, because the national debt is a stock that accu-
2 The only function whose integral is the function itself (that is, whereR
f(x)dt = f(x) ,so that the net flow and stock are perfectly correlated) is the exponential function.Thus, when the net flow into a stock is growing exponentially, Net Flow = exp(gt), thestock follows an exponential path, Stock = exp(gt)/g.
Please cite this article in press as: Cronin, M. A. et al., Why don’t well-zational Behavior and Human Decision Processes (2008), doi:10.1016/j.o
mulates the deficit, it will continue to rise even if the deficitfalls—the debt can fall only if the government runs a surplus. Sim-ilarly, anthropogenic greenhouse gas (GHG) emissions are nowroughly double the rate at which they are removed from theatmosphere by natural processes (Houghton et al., 2001; IPCC,2007). Therefore, atmospheric greenhouse gas concentrations willcontinue to rise even if emissions fall, until emissions fall to therate at which GHGs are removed from the atmosphere. However,experiments show that the vast majority of adults believe GHGconcentrations follow the same pattern as emissions, leadingthem to conclude, erroneously, that atmospheric GHG concentra-tions can be stabilized even as emissions into the atmospherecontinuously exceed removal from it (Sterman & Booth Sweeney2007). Such beliefs are analogous to the assertion that a bathtubcontinuously filled faster than it drains will never overflow. Theyviolate conservation of mass and lead to the erroneous conclusionthat climate change can be mitigated simply by slowing thegrowth of emissions. Correlational reasoning can lead to errone-ous judgments in situations with important public policyimplications.
The paper proceeds as follows: We describe prior work in thecontext of a simple stock–flow problem. Experiments 1–4 testalternative explanations for SF failure including the cognitive bur-den of the task, information display, task context, motivation andfeedback, and priming of prior stock–flow knowledge. Close analy-sis of the data suggest participants use correlational reasoningacross these contexts. In the final experiment we test the correla-tion heuristic directly, showing that the large majority assumethe stock is correlated with the inflow even in extremely simplesituations. We consider limitations and extensions, discuss themanagerial and educational implications of the results, and offersuggestions for research to create interventions that may over-come SF failure.
A simple stock and flow problem
Prior work in dynamic decision making suggests that peoplehave great difficulty understanding and managing systems withhigh levels of dynamic complexity. Dynamic complexity arisesfrom the presence of multiple feedback processes, time delays,nonlinearities, and accumulations (Sterman, 2002). Furthermore,learning in dynamic systems is often slow and weak, even with re-peated trials, unlimited time, and performance incentives (Diehl &Sterman, 1995; Kleinmuntz & Schkade, 1993; Sterman, 1989a,1989b). Many of these studies involved tasks of great complexity,and poor performance was often ascribed to the large number ofentities and interactions, feedback delays, and information over-load (Brehmer, 1990, 1995; Gonzalez, 2005a; Kleinmuntz, 1985;Omodei & Wearing, 1995).
More recent work, however, has shown that people make per-sistent mistakes even in the simplest dynamic systems, includingsystems consisting of one stock, one inflow, and one outflow, withno feedback processes, time delays, or nonlinearities (e.g., BoothSweeney & Sterman, 2000; Cronin & Gonzalez, 2007; Sterman &Booth Sweeney, 2007). To illustrate, the ‘‘department store” task(Sterman, 2002) presents participants with a graph showing thenumber of people entering and leaving a department store eachminute over a 30-min interval (Fig. 1). The system involves a singlestock (the number of people in the store) with one inflow (peopleentering) and one outflow (people leaving). There are no feedbacks,time delays, nonlinearities, or other elements of dynamic complex-ity that proved to be difficult in prior research. Participants areasked four questions. The first two—‘‘When did the most peopleenter the store? When did the most people leave the store”—testwhether participants can read the graph and correctly distinguish
educated adults understand accumulation? A challenge ..., Organi-bhdp.2008.03.003

The graph below shows the number of people entering and leaving a department store over a 30-
minute period.
0
5
10
15
20
25
30
35
40
0 2 8 10 12 14 16 18 20 22 24 26 28 30
Peo
ple
/Min
ute
Minute
Entering Leaving
Please answer the following questions.
Check the box if the answer cannot be determined from the information provided.
1. During which minute did the most people enter the store?
Minute ________ Can’t be determined
2. During which minute did the most people leave the store?
Minute ________ Can’t be determined
3. During which minute were the most people in the store?
Minute ________ Can’t be determined
4. During which minute were the fewest people in the store?
Minute ________ Can’t be determined
64
Fig. 1. Department store task.
3 It might be objected that judging the areas of the irregular shapes defined by thedifference between inflow and outflow in Fig. 1 is difficult. However, the task wascarefully designed to make the determination of the area simple. The area of theregion in which outflow exceeds inflow (after t = 13) was constructed to be twice aslarge as the area in which inflow exceeds outflow (prior to t = 13). To test whetherpeople can determine which area is larger, a convenience sample consisting of 12members of the support staff from the MIT Sloan School of Management were askedwhich area was greater; all correctly identified the larger area.
M.A. Cronin et al. / Organizational Behavior and Human Decision Processes xxx (2008) xxx–xxx 3
ARTICLE IN PRESS
between inflow and outflow. The next questions—‘‘When were themost people in the store? When were the fewest people in thestore?”—test whether participants can infer the behavior of thestock from the behavior of the flows.
To answer one could manually accumulate the stock by findingthe net inflow at each point of time and keep a running tally of thenumber of people in the store (St = St – 1 + It – Ot). This method,however, is tedious, error prone, and unnecessary. One need onlyunderstand that the number of people in the store rises when theflow of people entering is greater than the flow of people leaving(and vice versa), then note that the number entering is greaterthan the number exiting through time 13 and less thereafter.Therefore, one can see—without any calculations—that the mostpeople are in the store when the two curves cross (Minute 13).Furthermore, because the number of people in the store risesthrough Minute 13 and falls thereafter, the fewest people are inthe store either at the beginning or the end of the 30 min. Todetermine which, participants must judge whether more people(net) enter up to Minute 13 than leave afterward. Once again, cal-culation is unnecessary: One can simply judge whether the areabetween the rate of entering and the rate of leaving up to Minute13 is greater or smaller than the area between the two curves fromMinute 14 on. The area between the curves from Minute 14 on is
Please cite this article in press as: Cronin, M. A. et al., Why don’t well-zational Behavior and Human Decision Processes (2008), doi:10.1016/j.o
clearly larger, so the fewest people are in the store at the end ofthe 30 min.3
Method
A total of 173 students enrolled in a graduate course in systemsthinking and simulation at the MIT Sloan School of Managementwere given the department store task in Fig. 1. Participants wereprimarily MBA students and graduate students from other MITdepartments or from Harvard University. The mean age was 29(range 21–46) and 78% were male. All had taken calculus, and mosthad strong mathematics training: 71% had a degree in science,technology, engineering, or mathematics (STEM); 28% had a degreein the social sciences, primarily economics. Fully 40% had a priorgraduate degree, most in technical fields. Students did the task in
educated adults understand accumulation? A challenge ..., Organi-bhdp.2008.03.003
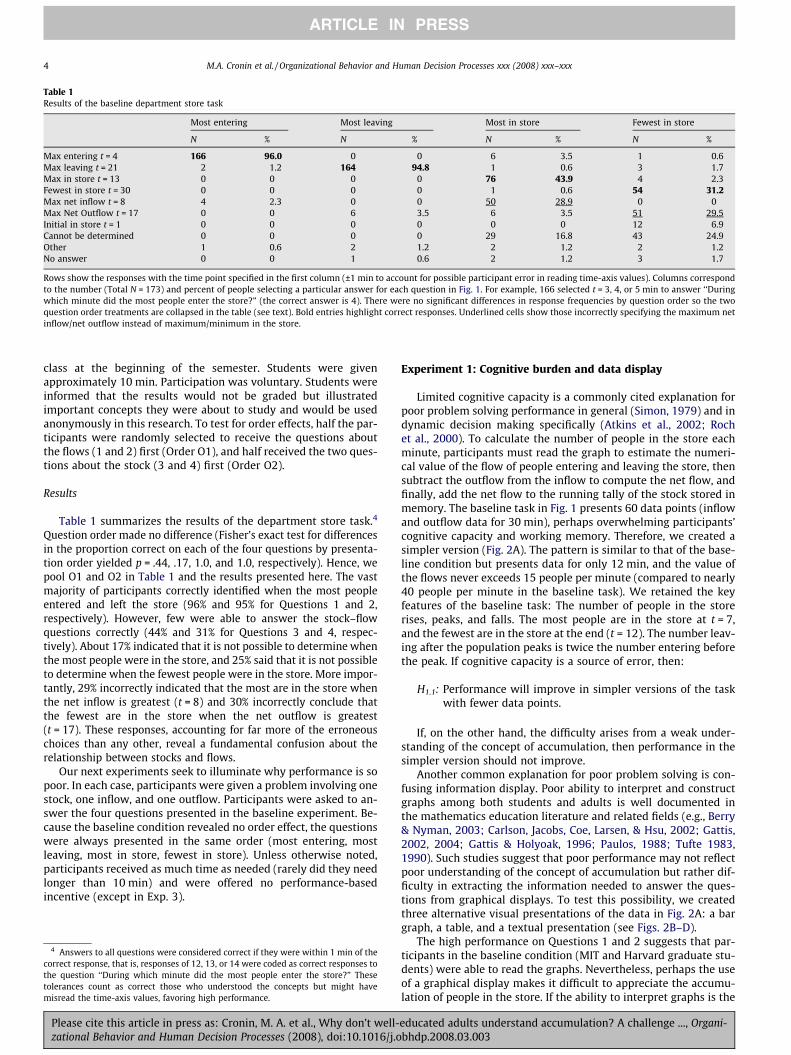
Table 1Results of the baseline department store task
Most entering Most leaving Most in store Fewest in store
N % N % N % N %
Max entering t = 4 166 96.0 0 0 6 3.5 1 0.6Max leaving t = 21 2 1.2 164 94.8 1 0.6 3 1.7Max in store t = 13 0 0 0 0 76 43.9 4 2.3Fewest in store t = 30 0 0 0 0 1 0.6 54 31.2Max net inflow t = 8 4 2.3 0 0 50 28.9 0 0Max Net Outflow t = 17 0 0 6 3.5 6 3.5 51 29.5Initial in store t = 1 0 0 0 0 0 0 12 6.9Cannot be determined 0 0 0 0 29 16.8 43 24.9Other 1 0.6 2 1.2 2 1.2 2 1.2No answer 0 0 1 0.6 2 1.2 3 1.7
Rows show the responses with the time point specified in the first column (±1 min to account for possible participant error in reading time-axis values). Columns correspondto the number (Total N = 173) and percent of people selecting a particular answer for each question in Fig. 1. For example, 166 selected t = 3, 4, or 5 min to answer ‘‘Duringwhich minute did the most people enter the store?” (the correct answer is 4). There were no significant differences in response frequencies by question order so the twoquestion order treatments are collapsed in the table (see text). Bold entries highlight correct responses. Underlined cells show those incorrectly specifying the maximum netinflow/net outflow instead of maximum/minimum in the store.
4 M.A. Cronin et al. / Organizational Behavior and Human Decision Processes xxx (2008) xxx–xxx
ARTICLE IN PRESS
class at the beginning of the semester. Students were givenapproximately 10 min. Participation was voluntary. Students wereinformed that the results would not be graded but illustratedimportant concepts they were about to study and would be usedanonymously in this research. To test for order effects, half the par-ticipants were randomly selected to receive the questions aboutthe flows (1 and 2) first (Order O1), and half received the two ques-tions about the stock (3 and 4) first (Order O2).
Results
Table 1 summarizes the results of the department store task.4
Question order made no difference (Fisher’s exact test for differencesin the proportion correct on each of the four questions by presenta-tion order yielded p = .44, .17, 1.0, and 1.0, respectively). Hence, wepool O1 and O2 in Table 1 and the results presented here. The vastmajority of participants correctly identified when the most peopleentered and left the store (96% and 95% for Questions 1 and 2,respectively). However, few were able to answer the stock–flowquestions correctly (44% and 31% for Questions 3 and 4, respec-tively). About 17% indicated that it is not possible to determine whenthe most people were in the store, and 25% said that it is not possibleto determine when the fewest people were in the store. More impor-tantly, 29% incorrectly indicated that the most are in the store whenthe net inflow is greatest (t = 8) and 30% incorrectly conclude thatthe fewest are in the store when the net outflow is greatest(t = 17). These responses, accounting for far more of the erroneouschoices than any other, reveal a fundamental confusion about therelationship between stocks and flows.
Our next experiments seek to illuminate why performance is sopoor. In each case, participants were given a problem involving onestock, one inflow, and one outflow. Participants were asked to an-swer the four questions presented in the baseline experiment. Be-cause the baseline condition revealed no order effect, the questionswere always presented in the same order (most entering, mostleaving, most in store, fewest in store). Unless otherwise noted,participants received as much time as needed (rarely did they needlonger than 10 min) and were offered no performance-basedincentive (except in Exp. 3).
4 Answers to all questions were considered correct if they were within 1 min of thecorrect response, that is, responses of 12, 13, or 14 were coded as correct responses tothe question ‘‘During which minute did the most people enter the store?” Thesetolerances count as correct those who understood the concepts but might havemisread the time-axis values, favoring high performance.
Please cite this article in press as: Cronin, M. A. et al., Why don’t well-zational Behavior and Human Decision Processes (2008), doi:10.1016/j.o
Experiment 1: Cognitive burden and data display
Limited cognitive capacity is a commonly cited explanation forpoor problem solving performance in general (Simon, 1979) and indynamic decision making specifically (Atkins et al., 2002; Rochet al., 2000). To calculate the number of people in the store eachminute, participants must read the graph to estimate the numeri-cal value of the flow of people entering and leaving the store, thensubtract the outflow from the inflow to compute the net flow, andfinally, add the net flow to the running tally of the stock stored inmemory. The baseline task in Fig. 1 presents 60 data points (inflowand outflow data for 30 min), perhaps overwhelming participants’cognitive capacity and working memory. Therefore, we created asimpler version (Fig. 2A). The pattern is similar to that of the base-line condition but presents data for only 12 min, and the value ofthe flows never exceeds 15 people per minute (compared to nearly40 people per minute in the baseline task). We retained the keyfeatures of the baseline task: The number of people in the storerises, peaks, and falls. The most people are in the store at t = 7,and the fewest are in the store at the end (t = 12). The number leav-ing after the population peaks is twice the number entering beforethe peak. If cognitive capacity is a source of error, then:
H1.1: Performance will improve in simpler versions of the taskwith fewer data points.
If, on the other hand, the difficulty arises from a weak under-standing of the concept of accumulation, then performance in thesimpler version should not improve.
Another common explanation for poor problem solving is con-fusing information display. Poor ability to interpret and constructgraphs among both students and adults is well documented inthe mathematics education literature and related fields (e.g., Berry& Nyman, 2003; Carlson, Jacobs, Coe, Larsen, & Hsu, 2002; Gattis,2002, 2004; Gattis & Holyoak, 1996; Paulos, 1988; Tufte 1983,1990). Such studies suggest that poor performance may not reflectpoor understanding of the concept of accumulation but rather dif-ficulty in extracting the information needed to answer the ques-tions from graphical displays. To test this possibility, we createdthree alternative visual presentations of the data in Fig. 2A: a bargraph, a table, and a textual presentation (see Figs. 2B–D).
The high performance on Questions 1 and 2 suggests that par-ticipants in the baseline condition (MIT and Harvard graduate stu-dents) were able to read the graphs. Nevertheless, perhaps the useof a graphical display makes it difficult to appreciate the accumu-lation of people in the store. If the ability to interpret graphs is the
educated adults understand accumulation? A challenge ..., Organi-bhdp.2008.03.003

A. Line graph
02468
10121416
1 3 9 10 11 12
Peop
le p
er M
inut
e
02468
10121416
Peop
le p
er M
inut
e
Minute
PeopleEntering
PeopleLeaving
C. Table
Minute People
Entering People Leaving
1 9 82 10 53 9 84 14 125 9 86 9 77 8 88 7 99 4 1310 7 1111 10 1512 8 12
B. Bar Graph
People EnteringPeople Leaving
D. Text
In the first minute, 9 people enter and 8 leave. In the second minute, 10 people enter and 5 leave. In the third minute, 9 people enter and 8 leave. In the fourth minute, 14 people enter and 12 leave. In the fifth minute, 9 people enter and 8 leave. In the sixth minute, 9 people enter and 7 leave. In the seventh minute, 8 people enter and 8 leave. In the eighth minute, 7 people enter and 9 leave. In the ninth minute, 4 people enter and 13 leave. In the tenth minute, 7 people enter and 11 leave. In the eleventh minute, 10 people enter and 15 leave. In the twelfth minute, 8 people enter and 12 leave.
2 87654
1 3 9 10 11 12Minute
2 87654
Fig. 2. Experiment 1: Visual isomorphs for the simpler department store task.
M.A. Cronin et al. / Organizational Behavior and Human Decision Processes xxx (2008) xxx–xxx 5
ARTICLE IN PRESS
source of the difficulty, then an alternate data presentation mode,such as a table or text, should improve performance on the stock–flow questions. Similarly, if people attempt to calculate the numberof people in the store by the running total method, then graphicaldisplays will be more difficult than tabular or textual displays be-cause one must first estimate the numerical values of the inflowand outflow from the graph. If the problem is difficulty interpretinggraphical displays, then
H1.2: Performance will improve if the data are presented in tab-ular or textual form.
A more nuanced theory suggests that the form of the informa-tion display leads people to misinterpret the problem. Atkinset al. (2002) review the literature showing how display formats af-fect judgment and decision making, and, following Wickens andCarswell (1995), suggest that information displays can be moreor less compatible with the demands of the task, thus affecting per-formance, even if the information they encode is the same. Vicenteand Rasmussen (1992) show that interface format can lead to deci-sion error and call for ‘‘ecological interface design” where displaytype and content are matched to the decision context; Vicente(1996) provides an example in a dynamic decision task.
The information in Figs. 1 and 2A is presented using a linegraph. Line graphs are often used to represent continuously vary-ing quantities, such as water flowing into a tub. Here, however,the data points represent the total number of discrete individualswho entered or left over the course of each minute, not the instan-taneous rate at each moment. The continuous flow metaphor
Please cite this article in press as: Cronin, M. A. et al., Why don’t well-zational Behavior and Human Decision Processes (2008), doi:10.1016/j.o
suggested by the line graph may conflict with participants’ concep-tion of the discrete event of a person entering or leaving a store.Bar graphs are more commonly used to represent totals over somefinite period and may help people recognize and understand therelationship between the flows and the stock. If so,
H1.3: People will be more successful at judging the behavior ofstocks and flows when discrete quantities are representedwith discrete features (bars instead of lines).
Comparing the table to a textual presentation (Fig. 2C vs. D),participants should find a table more helpful than text becausethe numbers are already aligned, reducing the cognitive burden in-volved in finding the inflow and outflow values and calculating thenet flow. Hence,
H1.4: Presenting the data in a table will improve performancecompared to text.
Method
Participants (N = 271) were students enrolled in a subsequentterm of the same graduate course at the MIT Sloan School of Man-agement used in the baseline experiment. The average age was 29(range 18–38), and 69% were male. Of the participants, 55% weretrained in STEM, 38% were trained in economics or other social sci-ence and 29% held prior advanced degrees. Participants were demo-graphically similar to those who participated in the baseline
educated adults understand accumulation? A challenge ..., Organi-bhdp.2008.03.003

Table 2Experiment 1: Success rates between visual isomorphs
Question 1:Mostentering?
Question 2:Mostleaving?
Question 3:Most instore?
Question 4:Fewest instore?
Overall success rate(N = 264)
89% 83% 56% 46%
A Graph (both lineand bar, N = 127)
94% 91% 61% 48%
No graph (bothtext and table,N = 137)
85% 76% 51% 44%
Exact test (p) 0.015 0.001 0.137 0.537
B Line graph(N = 63)
94% 87% 52% 41%
Bar graph(N = 64)
95% 95% 69% 55%
Exact test (p) 0.718 0.127 0.071 0.157
C Text (N = 59) 86% 75% 47% 42%Table (N = 78) 83% 77% 54% 45%Exact test (p) 0.811 0.841 0.493 0.862
D Baseline(N = 173)
96% 95% 44% 31%
Line graph(N = 63)
94% 87% 52% 41%
Exact test (p) 0.490 0.083 0.302 0.166
6 M.A. Cronin et al. / Organizational Behavior and Human Decision Processes xxx (2008) xxx–xxx
ARTICLE IN PRESS
experiment in gender, age, prior education, and prior advanceddegrees. Participants were randomly assigned to one of the fourdata presentation modes shown in Fig. 2. As in the baseline,responses were considered correct if they were within 1 min ofthe correct answer.
Results
We first consider differences across data display modes. Table 2,Block A compares performance in the two graphic conditions (lineand bar) to the two non-graphic conditions (table and text). Con-trary to the hypothesis that SF failure results from participants’inability to interpret graphs, graphic presentation appears to re-duce errors in data interpretation. Performance on Questions 1and 2 was significantly higher for the graphic displays (p = .015and .001, respectively). Contrary to Hypothesis 1.2, performanceon the two stock–flow questions was no better in the non-graphicconditions. There is no support for the hypothesis that difficultiesin interpreting graphs are responsible for the participants’ poorunderstanding of accumulation.
Table 2, Block B compares the line and bar graph representa-tions. People’s ability to determine when the most people enterand leave the store is not statistically different across the lineand bar graph conditions (p = .72 and .13, respectively). Perfor-mance on Question 3 (when are the most in the store?) wasslightly better in the bar graph condition, but the difference is onlymarginally significant, p = .07, and there was no difference be-tween the bar and line graph condition on Question 4 (when arethe fewest in the store?), p = .16. At best, there is only weak sup-port for Hypothesis 1.3: Participants did not appear to be confusedby the presentation of the data in the line graph format, which sug-gests continuous flows, compared to the bar graph format, whichsuggests discrete flows. There also was no difference betweenthe tabular and textual presentations on any of the questions(Block C), providing no support for H1.4.
Turning now to the issue of cognitive overload, Block D in Table2 compares the performance of participants who received the sim-ple line graph condition (Fig. 2A) to the baseline experiment(Fig. 1).5 Results are similar to the baseline. Performance on Ques-tions 1 and 2 was high (participants correctly interpret the graphs),but performance on the stock–flow questions was poor. Individualsreceiving the simpler version did no better than those receivingthe baseline condition. Like the baseline, many participants in theline graph condition indicated that the answer to the stock questionscould not be determined (21% and 27% for Questions 3 and 4, respec-tively, compared to 17% and 25% in the baseline; p = .44 and .86).Thus, Hypothesis 1.1 is not supported: The simpler version of thetask with far fewer data points did not improve performance onthe stock–flow questions.
One may argue that, although the simplified graph, with 12rather than 30 min of data, reduces the mental burden of the task,it still overwhelms participants’ cognitive capacity. However, evensimpler versions with still fewer data points and even simpler pat-terns do not improve performance, as in Experiment 4 below andin Cronin and Gonzalez (2007). Overall, the results of Exp. 1 donot support the hypotheses that cognitive capacity, the ability tointerpret graphs, or the mode of information display cause poorperformance in stock–flow systems.
5 Because the baseline task in Fig. 1 and the simpler tasks in Fig. 2 wereadministered to students in successive years, it is possible that unmeasured sourcesof variation could confound the interpretation of the results. However, the tasks weregiven to each group by the same instructor (JS), in the same course, at the same pointin the semester, in the same classroom, at the same time of day, and with the sameinstructions and time for completion. The two groups were demographically similar.Nevertheless, we alert the reader to the possibility that the results could reflectunmeasured differences across the two groups.
Please cite this article in press as: Cronin, M. A. et al., Why don’t well-zational Behavior and Human Decision Processes (2008), doi:10.1016/j.o
Experiment 2: Task context
Framing conditions choice. For example, people find the classicWason (1960) confirmation bias task difficult when presented asan abstract test of a logical rule (‘‘if a card has a vowel on one sidethen it must have an even number on the other”), but do much bet-ter when the cover story is a familiar everyday context such as ‘‘ifan employee gets a day off during the week, then that employeemust have worked on the weekend” (Gigerenzer & Hug, 1992).Such results suggest that reasoning is often domain-specific andadapted to specific contexts (but see also Almor & Sloman, 2000).Perhaps people understand the principles of accumulation but failto recognize the stock and flow structure of the situation becausethe task context or cover story does not activate their latentstock–flow knowledge or experience with other accumulation pro-cesses. If so, even those who have studied calculus may not recog-nize the stock–flow structure of the department store context andtherefore may not apply their knowledge of accumulation. There-fore, we created two additional cover stories for the original base-line task outlined in Fig. 1. In the tub condition, the data representthe flow of water into and out of a bathtub, and the stock is thequantity of water in the tub. In the cars condition, the data repre-sent the velocities of two cars traveling in the same direction;the stock is the distance between them.
We hypothesize that the likelihood of activating and applyingthe stock–flow schema depends on the salience and familiarity ofthe accumulation process in the task context. Most people havemore experience and familiarity with bathtubs and driving thanwith the flow of people into and out of stores. Accumulation isthe purpose and focus of attention when filling a container, andpeople directly observe the flows and water level. Similarly, mon-itoring the distance between vehicles is a central task in driving,and the speed and distance between cars are directly observable.In contrast, the flows of people into and out of a store and the pop-ulation of people within it are usually neither observable norimportant in everyday experience. If salience and familiarity areimportant in activating latent stock–flow knowledge, then perfor-mance in the tub and cars conditions will be better than in thestore condition.
educated adults understand accumulation? A challenge ..., Organi-bhdp.2008.03.003

M.A. Cronin et al. / Organizational Behavior and Human Decision Processes xxx (2008) xxx–xxx 7
ARTICLE IN PRESS
The activation of latent stock–flow knowledge may also dependon whether the cover story involves discrete events or continuousflows. Common examples of accumulation used in high schoolmathematics and physics classes, for example, involve continuousquantities and flows, such as water filling a tank or velocity accu-mulating into distance traveled. The store context, however, in-volves discrete individuals entering and leaving at particularmoments, which may prevent participants from recognizing thestock–flow structure. If people’s intuitive understanding of accu-mulation is grounded in schemata that are based on continuousflows, then the store context, with its discrete individuals, maynot activate their latent stock–flow knowledge. Hence, if eitherfamiliarity or continuous flows are important triggering people’sknowledge of accumulation,
H2: Performance in the tub and cars conditions will be betterthan in the store condition.
Method
We recruited 47 undergraduate students from CarnegieMellon University who participated voluntarily and received$5.00 compensation for their time. The average age was 25. Noother demographic information was collected in this case. Partic-ipants were randomly assigned to the tub, cars, or storecondition.
Results
As in prior experiments, this population showed excellent abil-ity to read the graph, while performance on the stock–flow ques-tions was poor (Table 3), with 96% and 94% correctly answeringQuestions 1 and 2, respectively, but only 28% and 26% answeringQuestions 3 and 4 correctly. There were no statistically significantdifferences in performance on the stock questions across the differ-ent task contexts. Hypothesis 2 is not supported: The more familiartub and driving contexts, with continuous rather than discreteflows, do not improve performance. Even if people find it difficultto recognize the stock–flow structure in the cars context, waterflowing into a tub is a canonical example of a stock–flow system.The fact that performance did not differ across these conditionssuggests that people have difficulty applying the principles ofaccumulation even in settings where the presence of accumulationis obvious.
Table 3Experiment 2: Success rates across cover stories
Question 1:Largestinflow
Question 2:Largestoutflow
Question 3:Stockmost full
Question 4:Stock mostempty
Overall successrates (N = 47)
96% 94% 28% 26%
A Store (N = 18) 100% 100% 22% 17%Cars (N = 16) 100% 100% 38% 31%Exact test (p) 1.000 1.000 .457 .429
B Store (N = 18) 100% 100% 22% 17%Tub (N = 13) 85% 77% 23% 31%Exact test (p) .168 .064 1.000 .413
C Tub + cars(N = 29)
93% 90% 31% 31%
Store (N = 18) 100% 100% 22% 17%Exact test (p) .517 .276 .739 .324
D Tub (N = 13) 85% 77% 23% 31%Cars (N = 16) 100% 100% 38% 31%Exact test p= .192 .078 .454 1.000
Please cite this article in press as: Cronin, M. A. et al., Why don’t well-zational Behavior and Human Decision Processes (2008), doi:10.1016/j.o
Experiment 3: Motivation and feedback
Another potential explanation for SF failure is that people lackthe motivation to think deeply about their answers. In the baselinetask (Fig. 1) and in some prior research (Booth Sweeney & Sterman,2000), no incentives were offered for performance, perhaps reduc-ing motivation and effort. The role of incentives in decision makingis complex: incentives sometimes improve performance, some-times have no impact, and sometimes actually worsen perfor-mance (Camerer & Hogarth, 1999 provide a review). However,people who do not have a reason to think hard about a problemtend to rely on simple heuristics instead of solving problems ana-lytically or challenging commonsense frames (Petty & Wegener,1998). Incentives have also been shown to increase motivation tosolve problems analytically (Petty, Wegener, & Fabrigar, 1997).
With low motivation, people may devote insufficient cognitiveeffort to the problem and use the correlation heuristic, quicklyyielding an answer that appears to be correct. Higher motivationshould encourage greater cognitive effort and care in retrievingand applying whatever latent stock–flow knowledge people maypossess. Further, for those who do not understand that any stockrises when inflow exceeds outflow and falls when outflow exceedsinflow—which would allow them to answer correctly without cal-culation—higher motivation should lead more participants to findthe correct response by calculating the running total store popula-tion, improving performance even if they do not understand theprinciples of accumulation. Thus,
H3.1: High motivation will improve performance on the stock–flow questions.
Low motivation may also lead people to fail to check their an-swers, resulting in mistakes that might easily be corrected if peoplereceived outcome feedback. People often assume that their initialintuition about a problem is correct unless they receive feedback(Klayman & Ha, 1987; Raman, 2002). Therefore, if people actuallyunderstand the principles of accumulation but make careless mis-takes due to inattention or low motivation, then feedback alertingpeople to error in their initial judgments should improve perfor-mance by inducing greater cognitive effort in subsequentattempts:
H3.2: Feedback that alerts participants to mistakes will improvethe rate of success on subsequent attempts.
Method
We recruited 69 undergraduate students from the George Ma-son University School of Management, all of whom participatedfor course credit. The treatment group (N = 32) received the moti-vation/feedback condition; the control group (N = 37) received theno motivation/no feedback condition. The average age of the par-ticipants was 23 (range 19–50), and 48% were male. Participantsin both conditions received the standard protocol for the task out-lined in Fig. 3 and were given up to one hour to complete the task.
In the no motivation/no feedback condition, participants onlyhad to answer the four questions and received no performance-based reward. In the motivation/feedback condition, participantswere instructed to bring their papers to the experimenter to findout whether their answers were correct. Incorrect responses weremarked wrong, but no other information was provided. The partic-ipants returned to their seats with the same graph to correct theirresponse(s). Participants then turned in their sheets to the experi-menter and again received feedback, continuing this process untilthey answered all four questions correctly. Motivation was in-
educated adults understand accumulation? A challenge ..., Organi-bhdp.2008.03.003

0
2
4
6
8
10
12
14
16
18
20
1 2 3 4 5 6 7 8 9 10 11 12 13 14 15 16 17 18 19 20 21 22 23 24 25 26 27 28 29 30
Minutes
Peo
ple
per
min
ute
People Entering
People Leaving
Fig. 3. Experiment 2: Graph used in motivation experiments.
Table 4BExperiment 3: Effect of Feedback in the High-Motivation Condition
Question 3: Most in store? Question 4: Fewest in store?
Correct on first try 5 of 32 (15.6%) 4 of 32 (12.5%)Correct on second try 4 of 27 (14.8%) 4 of 28 (14.3%)Exact test (p) 1.00 1.00
8 M.A. Cronin et al. / Organizational Behavior and Human Decision Processes xxx (2008) xxx–xxx
ARTICLE IN PRESS
duced by informing participants that they could leave the sessiononce they answered all questions correctly or after one hour,whichever came first. Participants in the prior experiments nor-mally spend less than 10 min answering the four questions (thiswas also true for the no motivation/no feedback group), so thoseanswering correctly could save the bulk of an hour, motivatingthem to do well on the first attempt.
The effect of motivation was assessed by comparing the perfor-mance of those in the no motivation/no feedback condition to theperformance of those in the motivation/feedback condition on thefirst attempt. The effect of feedback was assessed by comparing thepercentage of people in the motivation/feedback condition whoanswered the question correctly on the first try to the percentageof those who answered correctly on the second try after receivingfeedback.
Results
Results for participants’ first attempt are similar to prior condi-tions: nearly all of the participants read the graph correctly ontheir first attempt (Table 4A), but very few answered the stock–flow questions correctly (16% and 13% for Questions 3 and 4,respectively). Motivation did not significantly improve perfor-mance, thus Hypothesis 3.1 is not supported.
If SF failure was simply a careless mistake that could be eas-ily corrected, then performance should have improved quicklyupon receiving feedback. Yet while feedback did eventually im-prove performance, the rate of improvement did not increaseacross attempts. For example, 5 of 32 participants answeredQuestion 3 correctly the first time (16%). Of the remaining 27participants, 4 answered correctly on the second attempt (15%;see Table 4B). Hypothesis 3.2 is not supported: There is no sta-tistically significant difference in success rates on the stock–flowquestions after the participants received feedback. The cumula-
Table 4AExperiment 3: Effect of motivation and feedback on success rates for task 1
Question 1: Most entering? Question 2
No motivation/no feedback condition(n = 37)
100% 86.5%
Motivation/feedback condition(n = 32): Attempt 1
93.8% 96.9%
Exact test, p .211 .205Attempt 2 100% 100%Attempt 3Attempt 4Attempt 5Attempt 6Attempt 7Attempt 8Attempt 9
Please cite this article in press as: Cronin, M. A. et al., Why don’t well-zational Behavior and Human Decision Processes (2008), doi:10.1016/j.o
tive number of participants who answered the stock–flow ques-tions correctly rose slowly and with a decreasing slope (seeTable 4A): only 28% and 25% correctly answered Questions 3and 4, respectively, on the second attempt, and by the sixth at-tempt, performance reached only 81% and 84%, respectively.There was no further improvement with continued trials; theremaining participants were unable to answer the stock–flowquestions by the end of the hour and were dismissed. The meannumber of attempts required to answer both stock–flow ques-tions correctly was 4.6.
Experiment 4: Priming stock–flow knowledge
In Experiment 4 we take a more direct approach to testing peo-ple’s ability to understand accumulation. We ask people to calcu-late a stock from information on its flows in an extremely simplesetting (constant flows), asking them to provide the value of thestock every period. Doing so should activate people’s latent SFknowledge (if it exists), thus:
H4: Priming participants to notice the presence and behavior ofSF structures will increase performance on subsequentstock–flow tasks.
Method
We recruited 37 undergraduate students at George MasonUniversity, all of whom participated for course credit. Their aver-age age was 23 (range 19–44), and 42% were male. Participantswere first given a priming task showing a constant inflow of 10people per minute and a constant outflow of 5 people per min-ute, over an interval of 5 min (Fig. 4A). Written instructionsasked participants to determine how many people are in thestore each minute, starting with no one in the store. The explicitdirection to record how many are in the store each minuteshould help participants recognize that the number of peoplein the store accumulates the inflow less the outflow withoutexplicitly telling people how to do the calculation. The extremesimplicity of the example reduces the cognitive burden of the re-quired calculations. Immediately after completing the priming
: Most leaving? Question 3: Most in store? Question 4: Fewest in store?
18.9% 21.6%
15.6% 12.5%
.761 .35928.1% 25.0%56.3% 50.0%65.6% 62.5%68.8% 71.9%71.9% 81.3%81.3% 84.4%81.3% 84.4%81.3% 84.4%
educated adults understand accumulation? A challenge ..., Organi-bhdp.2008.03.003

A. Priming Task
0
2
4
6
8
10
12
1Minute
Peo
ple
Entering
Leaving
Write down how many people are in the store each minute:
Minute 1: Minute 2: Minute 3: Minute 4: Minute 5:
B. Simple SF Task (Participants Were Asked the Same Four Questions S
0
5
10
15
20
25
30
35
Peo
ple
Entering
Leaving
5432
1Minute
5432
Fig. 4. Experiment 4.
M.A. Cronin et al. / Organizational Behavior and Human Decision Processes xxx (2008) xxx–xxx 9
ARTICLE IN PRESS
task, participants were given the simple task shown in Fig. 4Band asked to answer the standard four questions.
Results
As in prior experiments, participants did well on the first twoquestions (Table 5), indicating that they could read the graph,but generally did not understand the concepts of accumulation(27% and 38% for Questions 3 and 4, respectively). Success on thestock–flow questions was marginally higher than that of partici-pants who received the task without the priming condition, thebaseline for this population (8% and 16% on an isomorphic 5-pointgraph),6 so priming did have some effect, partially supportingHypothesis 5. Yet priming with did not eliminate the problem.Nearly half (18 of 37) did the priming task incorrectly despite itssimplicity; most of these participants responded that the numberof people in the store each minute was 5, 5, 5, 5, 5—that is, they gavethe net flow of people into the store each minute rather than the to-tal number (5, 10, 15, 20, 25). Those who responded correctly on thepriming task did significantly better on the stock–flow questions inFig. 4B than those who did not: None of those who failed on thepriming task correctly identified when the most people were inthe store, compared to about half of those who did the priming taskcorrectly (p = .0004). Only one of those who failed on the priming
6 Though the baseline graph was given in a different semester, the populationsfrom which all the George Mason University participants were drawn were verysimilar, as were recruitment methods and the manner (room, time, etc.) in which thetasks were administered. Nevertheless, the same caveat as in note 4 applies.
Please cite this article in press as: Cronin, M. A. et al., Why don’t well-zational Behavior and Human Decision Processes (2008), doi:10.1016/j.o
task correctly identified when the fewest people were in the store,compared to 68% of those who got the priming task right (p = .0001).
The results suggest that many (about half the participants) didnot understand the concept of accumulation. However, even forthose who answered the priming question correctly, success rateson the stock–flow questions in Fig. 4B remained discouraginglylow. Many who could accumulate the net flow of people in thestore in the priming task (Fig. 4A) were unable to determine whenthe most and fewest people were in the store in Fig. 4B, despite theextreme simplicity of that task. It appears that many participantsnot only had difficulty applying the principles of accumulationbut also failed to recognize the stock–flow structure, even afterbeing explicitly directed to carry out the accumulation of inflowand outflow into a stock. The results suggest that, for these peopleat least, the problem is not the failure to activate latent knowledgeof accumulation but the lack of such knowledge.
Experiment 5: The correlation heuristic
The experiments reported here verify that SF failure is a robusterror. Many people do not understand the principles of accumula-tion, or fail to apply their knowledge, despite explicit instructions.What heuristics, then, do they use? Prior work (Booth Sweeney &Sterman, 2000) suggests that many people use a ‘‘correlation heu-ristic”, a form of pattern matching in which people assume that theoutput of a system (e.g., the level of water in a tub) should ‘‘looklike” the input (the flow or net flow of water into the tub). BoothSweeney and Sterman (2000) found extensive use of the correla-tion heuristic among erroneous responses to simple tasks such asinferring the level of water in a tub from graphs of the flow inand drain out or inferring the cash balance of a firm from graphsof receipts and expenditures. These results have been replicatedwith diverse student populations (e.g., Atkins et al., 2002; Ossimitz,2002; Pala & Vennix, 2005). However, these studies raise a numberof questions. If people correlate inputs to outputs, what cues dothey select—the inflow, outflow, or net flow—and why? Do peoplefocus on trends or on specific points such as the maximum or min-imum of the flows? How does the information display affect theuse of the correlation heuristic?
To explore these questions, we first coded subject responses inExperiments 1, 2 and 3 for evidence of correlational reasoning.7 Inthese experiments, the correlation heuristic suggests that the maxi-mum of the stock coincides with the maximum of the inflow (or netinflow), and the minimum of the stock with the maximum of theoutflow (or net outflow). Table 6 shows the frequency of particularerroneous responses to the stock–flow questions (when are themost/fewest people in the store?), including: the first point on thegraph (Start); the final point (End); the maximum inflow (Peak In-flow); the maximum outflow (Peak Outflow); the maximum net in-flow (Peak Net Inflow); the maximum net outflow (Peak NetOutflow); the point where inflow and outflow cross (Cross), ‘‘can’tbe determined” (CBD); the minimum of the inflow (Valley); and allothers (Other). The experiments were carefully designed to distin-guish among these options. For example, in the baseline task(Fig. 1, Table 1), the peak inflow occurs at t = 4, peak net inflow att = 8, the crossing point at t = 13, peak net outflow at t = 17 and peakoutflow at t = 21.
The most frequent erroneous response for the maximum stockquestion is the maximum net inflow, and the most frequent erro-neous response for the minimum stock question is the maximumnet outflow (Table 6). The pattern holds across a range of cover sto-ries and protocols and across the participants from MIT, Carnegie
7 Experiment 4 used a graph showing data for only 5 min, so the different criticalpoints cannot be distinguished.
educated adults understand accumulation? A challenge ..., Organi-bhdp.2008.03.003

Table 5Experiment 4: Influence of priming on success
Question 1: Most entering? Question 2: Most leaving? Question 3: Most in store? Question 4: Fewest in store?
Baseline (N = 37) 95% 92% 8% 16%Priming condition (N = 37) 86% 89% 27% 38%Exact test (p) .430 .999 .063 .065
Prime correct (N = 19) 95% 95% 53% 68%Prime incorrect (N = 18) 78% 83% 0% 6%Exact test (p) .180 .340 .0004 .0001
10 M.A. Cronin et al. / Organizational Behavior and Human Decision Processes xxx (2008) xxx–xxx
ARTICLE IN PRESS
Mellon, and George Mason. Few selected the maximum of the grossinflow (outflow) as the point where the most (fewest) are in thestore, indicating that most recognized the importance of the netrate of change in determining the stock. Yet they nevertheless con-cluded that the maximum (minimum) of the stock coincides withthe maximum (minimum) of the net flow, consistent with the cor-relation heuristic.
We hypothesize that the tendency to correlate the maximum ofthe net inflow (outflow) to the maximum (minimum) of the stockdepends on the prominence of these points in the presentation ofthe data. What determines the salience of the maximum net in-flow/net outflow? These points are readily determined in the linegraph format, harder to see in the bar graph format, and still moredifficult to discern in the tabular and text formats where one mustcalculate the net change each minute and then compare them(compare Figs. 2A–D). We therefore expect:
H5.1: The fraction of participants erroneously selecting the max-imum net inflow (outflow) for the maximum (minimum)of the stock, respectively, will be greatest in the line graphformat and lowest in the tabular and text-based formats.
Table 6Frequency of incorrect responses on the stock–flow questions
Maximum value of stock? (%) Minimum value of stock? (%)
Exp. 1MIT
Exp. 2CMU
Exp. 3GMU
Exp. 1MIT
Exp. 2CMU
Exp. 3GMU
Start point 0 0 0 10 3 0End point 1 8 0 * * *
Peak inflow 6 3 15 1 0 4Peak outflow 1 0 4 3 0 4Peak net inflow 52 33 54 0 3 0Peak net outflow 1 18 0 43 18 35Crossing point * * * 3 18 8Valley 0 0 0 0 0 15Cannot be
determined30 40 23 36 53 31
Other 10 0 4 4 0 4
* Correct response; table reports frequencies of incorrect responses.
Table 7Frequency of incorrect responses in Experiment 1
Maximum value of stock? (%)
Line graph Bar graph Table
Start 0 5 13End 0 5 0Max inflow 4 0 6Max outflow 0 0 3Max net inflow 44 16 3Max net outflow 4 0 0Crossing point * * *
CBD 48 68 58Other 0 5 16
* Correct response; table reports frequencies of incorrect responses.
Please cite this article in press as: Cronin, M. A. et al., Why don’t well-zational Behavior and Human Decision Processes (2008), doi:10.1016/j.o
Table 7 shows the results for Experiment 1 (Fig. 2). The propor-tion of those answering incorrectly who assert that the maximum(minimum) of the stock occurs at the maximum net inflow (out-flow) is significantly higher for the line graph compared to thebar graph (exact test p = .016). The proportion of participantsanswering incorrectly who assert that the maximum (minimum)of the stock occurs at the maximum net inflow (outflow) is also sig-nificantly higher in the two graphical conditions (line and bar)compared to the two non-graphical (table and text) conditions (ex-act test p = .0003). H5.1 is supported, indicating that the use of cor-relational reasoning increases with the salience of the maxima inthe net flow data.
The analysis above strongly suggests that participants withweak understanding of the principles of accumulation tend towardsuse of the correlation heuristic. However, in all the experiments re-ported thus far, participants select a value for the time at which thestock reaches its extreme values; these responses do not allow us todetermine whether people believe that the trajectory of the stockmatches that of the flows throughout the time horizon. The finalexperiment directly assesses the prevalence of correlational rea-soning by presenting people with graphs of the inflow and outflowto a stock and asking them to draw the trajectory of the stock.
Method
Participants (N = 282) were students enrolled in a subsequentterm of the same course at the MIT Sloan School of Managementused in the baseline experiment and Experiment 1. The participantswere demographically similar to the prior groups: average age was28 (range 20–44), and 71% were male; 54% were trained in STEM;37% were trained in economics or other social science; and 29% heldprior advanced degrees. The protocol was identical to that of Exper-iment 1, except that participants were randomly assigned to one ofeight treatment conditions (Fig. 5). Each shows a graph displayingthe flow of people entering and leaving a store over 30 min. Partic-ipants were directed to draw the number of people in the storethroughout the 30 min on a blank graph placed directly beneaththe flow graph. The eight flow patterns ranged from the exception-ally simple (constant flows) to more complex shapes. Note that nonumerical scale is provided for the flow data, or for the blank graph
Minimum value of stock? (%)
Text Line graph Bar graph Table Text
0 18 27 16 1412 * * * *
12 0 0 0 00 0 7 3 06 0 3 0 49 29 13 0 18* 3 0 0 4
48 47 47 58 5712 3 3 23 4
educated adults understand accumulation? A challenge ..., Organi-bhdp.2008.03.003

Participants received one of eight patterns for the inflow and outflow to the stock. The example
below shows treatment 4; Figure 6 shows all eight patterns.
The graph below shows the number of people entering and leaving a department store over a 30 minute period.
00 2 4 6 8 10 12 14 16 18 20 22 24 26 28 30
Time (minutes)
Entering
Leaving
In the space below, graph the number of people in the store over the 30 minute interval. You do not need to specify numerical values. The dot at time zero shows the initial number of people in the store.
0 2 4 6 8 10 12 14 16 18 20 22 24 26 28 30
Time (minutes)
Peo
ple
in t
he
Sto
re
Fig. 5. Experiment 5. Testing the correlation heuristic.
M.A. Cronin et al. / Organizational Behavior and Human Decision Processes xxx (2008) xxx–xxx 11
ARTICLE IN PRESS
for their response. The graph for the stock includes a point indicat-ing the initial number of people in the store. To avoid biasing par-ticipant responses, that point is placed at the midpoint of thevertical axis. In all cases, it is possible to answer correctly withoutknowledge of calculus and without carrying out any calculations.
To code the responses, we first determined whether partici-pants sketched a pattern that was qualitatively correct. A patternwas judged qualitatively correct if it was consistent with basicstock–flow principles: (i) the stock is rising, constant, or fallingwhen the net inflow is positive, zero, or negative, respectively;and (ii) the rate of change (slope) of the stock is increasing(decreasing) when the net flow is increasing (decreasing). Partici-pants were not penalized for drawing patterns that were not quan-titatively correct or that did not show the number in the storebeginning at the initial point provided on the graph. We thencoded the erroneous responses to determine whether the path theydrew matched the pattern of the inflow, outflow, or net flow, thatis, whether the correlation between the stock and inflow or netflow was +1 (perfect pattern matching), or �1. A correlation of�1 indicates perfect pattern matching, but with the pattern in-verted; such inversion might occur when the net flow is positivebut falling (e.g., treatment 5); in such a case the participant realizesthat the stock is rising, but still erroneously concludes the stockfollows the shape of the net flow.
Please cite this article in press as: Cronin, M. A. et al., Why don’t well-zational Behavior and Human Decision Processes (2008), doi:10.1016/j.o
The eight flow patterns divide into three groups. Group I con-sists of treatments 1 and 2 and should be the easiest: participantsneed only realize that the net flow is constant, determine whetherit is positive or negative, and draw a straight line with positive ornegative slope. Group II consists of treatments 3, 4 and 5. These allhave constant outflow and linear inflow: participants must deter-mine whether the net flow is positive or negative, note whetherthe net flow is increasing or decreasing, and then draw a curve thatis rising or falling at an increasing or decreasing rate. Group IIIcomprises treatments 6, 7, and 8 and should present the greatestdifficulty: These have constant outflows but nonlinear patternsfor the inflow: participants must determine whether the net flowis positive or negative, then determine whether the net flow isincreasing or decreasing in each part of the 30-min interval, andsketch a path that shows the stock rising or falling with qualita-tively correct changes in slope. Hence:
H5.2: Performance (Group I) > Performance (Group II) > Perfor-mance(Group III).
The more difficult the task, the greater the likelihood peoplewill revert to the use of a heuristic rather than reasoning throughthe task. Here, difficulty increases with the complexity of the pat-terns for the flows. We therefore expect that the use of the corre-
educated adults understand accumulation? A challenge ..., Organi-bhdp.2008.03.003

Res
pons
e S
how
ing
Cor
rela
tion
1. Constant Flows; I < O 2. Linear decline in both I and O, Constant Net Flow, I > O
3. Constant Outflow, Linear increase in Inflow; I O
4. Constant Outflow, Linear increase in inflow; I O
Flo
ws
0 0
Entering
LeavingEntering
Leaving
0
Entering
Leaving
0
Entering
Leaving
Cor
rect
Res
pons
e
Net flow is constant and < 0.Stock falls linearly.
Peo
ple
in t
he
Sto
re
Net flow is constant and < 0.Stock falls linearly.
Peo
ple
in t
he
Sto
re
Net flow ≤ 0, rises linearly to 0 by time 30. Stock falls at decreasing rate, is constant at t=30
Peo
ple
in t
he
Sto
re
Net flow ≥ zero, rises linearly throughout. Stock rises at increasing rate from initial equilibrium.
Peo
ple
in t
he
Sto
re
Peo
ple
in t
he
Sto
re
Peo
ple
in t
he
Sto
re
Peo
ple
in t
he
Sto
re
Peo
ple
in t
he
Sto
re
0 4 8 10 12 14 16 18 20 22 24 26 28 30Time (minutes)
2 6 0 4 8 10 12 14 16 18 20 22 24 26 28 30Time (minutes)
2 6 0 4 8 10 12 14 16 18 20 22 24 26 28 30Time (minutes)
2 6 0 4 8 10 12 14 16 18 20 22 24 26 28 30Time (minutes)
2 6
0 4 8 10 12 14 16 18 20 22 24 26 28 30Time (minutes)
2 6 0 4 8 10 12 14 16 18 20 22 24 26 28 30Time (minutes)
2 6 0 4 8 10 12 14 16 18 20 22 24 26 28 30Time (minutes)
2 6 0 4 8 10 12 14 16 18 20 22 24 26 28 30Time (minutes)
2 6
0 4 8 10 12 14 16 18 20 22 24 26 28 30Time (minutes)
2 6 0 4 8 10 12 14 16 18 20 22 24 26 28 30Time (minutes)
2 6 0 4 8 10 12 14 16 18 20 22 24 26 28 30Time (minutes)
2 6 0 4 8 10 12 14 16 18 20 22 24 26 28 30Time (minutes)
2 6
≤ ≥
5. Constant Flows; I ≥ O O 6. Linear decline in both I and O, Constant Net Flow, I ≤ O
7. Constant Outflow, Linear increase in Inflow; I ≥ O
8. Constant Outflow, Linear increase in inflow; I ≥O
Flo
ws
00 4 8 10 12 14 16 18 20 22 24 26 28 30
Time (minutes)
Entering
Leaving
0Entering
Leaving
0
Entering
Leaving 0
Entering
Leaving
Cor
rect
Res
pons
e
Net flow > 0, falls linearly to 0 by t = 30. Stock rises at decreasing rate, reaches equilibrium at t = 30.
Peo
ple
in t
he
Sto
re
Net flow ≤ 0, rises to 0 at midpoint, then falls. Stock falls at decreasing rate, is flat at midpoint, then falls at increasing rate.
Peo
ple
in t
he
Sto
re
Initially zero, net flow rises to max, then falls. Stock follows s-shape with inflection point at midpoint and equilibrium at start and end.
Peo
ple
in t
he
Sto
re
Net flow ≥ 0, follows S-shape.Stock starts in equilibrium, rises atincreasing rate until last few minutes, where growth is linear.
Peo
ple
in t
he
Sto
reP
eop
le in
th
e S
tore
Res
pons
e S
how
ing
Cor
rela
tion
2 6 0 4 8 10 12 14 16 18 20 22 24 26 28 30Time (minutes)
2 6 0 4 8 10 12 14 16 18 20 22 24 26 28 30Time (minutes)
2 6 0 4 8 10 12 14 16 18 20 22 24 26 28 30Time (minutes)
2 6
0 4 8 10 12 14 16 18 20 22 24 26 28 30Time (minutes)
2 6 0 4 8 10 12 14 16 18 20 22 24 26 28 30Time (minutes)
2 6 0 4 8 10 12 14 16 18 20 22 24 26 28 30Time (minutes)
2 6 0 4 8 10 12 14 16 18 20 22 24 26 28 30Time (minutes)
2 6
0 4 8 10 12 14 16 18 20 22 24 26 28 30Time (minutes)
2 6 0 4 8 10 12 14 16 18 20 22 24 26 28 30Time (minutes)
2 6 0 4 8 10 12 14 16 18 20 22 24 26 28 30Time (minutes)
2 6 0 4 8 10 12 14 16 18 20 22 24 26 28 30Time (minutes)
2 6
Peo
ple
in t
he
Sto
re
Peo
ple
in t
he
Sto
re
Peo
ple
in t
he
Sto
re
Fig. 6. Correct and typical incorrect responses for Experiment 5.
12 M.A. Cronin et al. / Organizational Behavior and Human Decision Processes xxx (2008) xxx–xxx
ARTICLE IN PRESS
Please cite this article in press as: Cronin, M. A. et al., Why don’t well-educated adults understand accumulation? A challenge ..., Organi-zational Behavior and Human Decision Processes (2008), doi:10.1016/j.obhdp.2008.03.003

M.A. Cronin et al. / Organizational Behavior and Human Decision Processes xxx (2008) xxx–xxx 13
ARTICLE IN PRESS
lation heuristic will increase with the difficulty of the tasks. LettingFcorr indicate the fraction of erroneous responses in which partici-pants draw patterns exactly matching the shape of the inflow ornet inflow,
H5.3: Fcorr (Group I) < Fcorr (Group II) < Fcorr (Group III).
Results
Despite the simplicity of the flow patterns, performance waspoor (Table 8). Overall, only 54% drew the correct pattern. The pro-portion correct varies substantially across the treatments, from83% correct in treatment 1, with constant flows, to 19% correct intreatment 8, where the outflow is constant and the inflow followsan S-shape with I P O at all times.
Most interesting, the majority of those responding incorrectlymatched the pattern of the inflow or net flow. Overall, 71% of theincorrect responses show paths for the stock identical in shape tothat of the inflow or net flow (that is, the correlation betweenthe stock and inflow or net flow = +1). Fig. 6 shows the correctpaths for the stock and a typical incorrect response for each ofthe treatments. As hypothesized, treatment 1, where the flowsare constant, yields the highest overall performance (83% correct)and lowest incidence of correlation among incorrect responses(33%). The highest incidence of correlation (89% of incorrect re-sponses) arises in treatments 4 and 8. In both of these the stockrises at an increasing rate as the net flow grows over time, but89% of those responding incorrectly drew patterns that matchedthe net flow (or, equivalently, the inflow). H5.2 is supported: perfor-mance on Group I is significantly better than that for Group II(p = .0005), and performance on Group II is significantly better thanthat for Group III (p = .012). Hypothesis 5.3 is partially supported:In Group I, 47% of erroneous responses are perfectly correlatedwith the inflow or net flow, significantly lower than the 80% oferroneous responses in Group II exhibiting correlation (p = .021).However, the fraction of responses showing correlation in GroupsII and III do not differ significantly.
The individual treatments within the groups provide additionalinsight into the conditions leading people to use the correlationheuristic. Performance on treatment 1 is not significantly betterthan that for treatment 2. Few in this participant pool, with theirstrong technical backgrounds, found these simple patterns, wherethe net flow is constant, to be difficult. Most of those who erred,however, drew a horizontal line, indicating failure to accumulatethe net change into the stock.
Table 8Results of Experiment 5
Treatment % Incorrect % Incorrectexhibitingcorrelation
Corr(stock,inflow) =+1 (%)
Corr(stock,net flow) =+1 (%)
N
1a 16.7 33.3 33.3 33.3 362b 22.2 55.6 11.1 44.4 373 41.7 68.8 43.8 25.0 374 55.6 88.9 88.9 88.9 345 44.4 80.0 33.3 33.3 35
Corr(S, I) =�1: 46.7
Corr(S, N) =�1: 46.7
6 69.4 56.0 24.0 32.0 367 47.2 57.1 57.1 57.1 338 80.6 88.9 88.9 88.9 34All 46.1 70.8 53.1 54.6 282
a Inflow, outflow and net flow are all constant. ‘‘Corr(stock, inflow) = +1” indi-cates that the response was also constant (a horizontal line).
b Inflow and outflow are correlated; net flow is constant. ‘‘Corr(stock, netflow) = +1” indicates that the response was also constant (a horizontal line).
Please cite this article in press as: Cronin, M. A. et al., Why don’t well-zational Behavior and Human Decision Processes (2008), doi:10.1016/j.o
In treatment 3, where the inflow rises but the stock falls be-cause Outflow > Inflow, 42% drew incorrect patterns, with 44% ofthese incorrect responses matching the pattern of the inflow and25% matching the pattern of the net flow (showing a straight linewith negative slope). In treatment 4, 56% gave incorrect responses,nearly all (89%) drawing a positively sloped straight line thatmatched the pattern of the inflow (and net flow), while the stockactually rises at an increasing rate. In treatment 5, where the in-flow falls but the net flow is positive (so the stock rises), 33% ofincorrect responses were straight lines with negative slope, i.e.,were perfectly correlated with the inflow (or net flow). However,47% of incorrect responses were straight lines with positive slope.These participants realized that the stock was increasing, but thenwere not able to apply the principles of accumulation and insteadrelied on correlational reasoning.
Participants receiving treatment 6, where the net flow is neg-ative, outperformed those receiving treatment 7, where the netflow is positive (31% vs. 53% correct; p = .03). The fraction ofincorrect responses matching the pattern of the inflow or netflow in these conditions is nearly equal. Many people incorrectlyfollow the pattern of the inflow or net flow rather than usinginformation on the sign of the net flow to determine whetherthe stock is rising or falling. These erroneous judgments leadto patterns implying that the number of people in the storecan rise even though more people are leaving than entering,or, equivalently, that the level of water in a tub can rise evenwhen water drains out faster than it flows in.
General discussion
Results from the experiments reported here demonstrate animportant and pervasive problem in human reasoning: our inabil-ity to understand stocks and flows, that is, the process by whichthe flows into and out of a stock accumulate over time. Stockand flow structures are pervasive in systems at all scales, fromthe accumulation of water in a tub to the accumulation of green-house gases in the atmosphere. Effective decision making in dy-namic settings requires decision makers to understandaccumulation. Prior work has demonstrated that even highly edu-cated people do poorly on a range of simple stock–flow problems.This research demonstrates that SF failure is not an artifact of thetask, nor is it easily corrected. Rather, the error reflects serious mis-understanding of the basic principles of accumulation.
We tested whether people in fact understand the concepts ofaccumulation, but perform poorly due to information displays,unfamiliar contexts, inadequate motivation, inability to read orconstruct graphs, or limited cognitive capacity. Poor performancepersisted among highly educated individuals with strong trainingin science, technology, engineering and mathematics even whenthe tasks could be done without any calculation, when the numberof data points presented was reduced by 60% and regardless ofwhether the data are displayed in line graphs, bar graphs, tables,or text (Experiment 1). Poor performance was robust to changesin the cover story and to contexts that involved discrete entitiesor continuously varying quantities (Experiment 2). Modest incen-tives to respond correctly did not lead to improvement (Experi-ment 3). Many could not correctly accumulate the quantity inthe stock even when they were explicitly directed to do so in aproblem with constant flows (Experiment 4). Although outcomefeedback indicating when participants had provided an incorrectanswer did improve performance, the improvement was slow,and a number of people never responded correctly, even aftermany trials (Experiment 3). Finally, nearly half of a sample ofhighly educated graduate students with extensive technical train-ing were unable to correctly draw the qualitative path of a stockfrom very simple patterns for its inflow and outflow, and roughly
educated adults understand accumulation? A challenge ..., Organi-bhdp.2008.03.003

14 M.A. Cronin et al. / Organizational Behavior and Human Decision Processes xxx (2008) xxx–xxx
ARTICLE IN PRESS
70% instead drew patterns that matched those of the inflow or netflow (Experiment 5).
Although most of the experiments allowed participants 10 minto finish the task, most of the participants finished much earlier.Many reported high confidence that their answers were correct,even when they were not. For example, in Experiment 3, whereparticipants received performance feedback, many expressed dis-belief when told that their answers were incorrect. These behav-iors, coupled with the persistence of poor performance in theface of large manipulations in task features, context, and so forth,suggest that SF failure shares some features with insight problems(Mayer, 1995). Insight problems are analytically easy—once onerecognizes the proper frame to use. Until then, people tend touse a flawed but intuitively appealing (and hence difficult tochange) problem frame.
People appear to employ heuristics that are intuitively appeal-ing but erroneous—specifically, many use the correlation heuristic,reasoning that the output of the system (here, the stock) should‘‘look like” (be highly correlated with) its inputs (here, the flowsor net inflow). Such individuals fail to grasp the fundamental prin-ciple that any stock rises (falls) when the inflow exceeds (is lessthan) the outflow. The intuitive appeal of the correlation heuristicappears to be quite strong: attempts to activate whatever latentknowledge of accumulation participants may have through coverstories emphasizing familiar contexts with continuously varyingquantities (Experiment 2), through motivation and feedback(Experiment 3), and by explicitly directing people to accumulatea stock prior to doing the task (Experiment 4) had little impact.Most of the erroneous responses are consistent with the use ofthe correlation heuristic. Over a range of experiments and partici-pant populations, a plurality of those asked to identify when astock reaches its maximum (minimum) select the point with thehighest net inflow (net outflow), consistent with correlationalthinking but violating fundamental principles of accumulation.Further, the frequency of use of the correlation heuristic increasesas the flows become more complex than simple straight lines(Experiment 5).
Future work should investigate the cues that trigger or inhibitthe use of the correlation heuristic and the learning processesthrough which individuals acquire and use the deep structure ofthe problem. Verbal protocols, as Chi, Feltovitch, & Glaser, 1981suggest, may help reveal the nature and construction of people’smental representations as they try to discover the relationships be-tween stocks and flows. Other methods may be needed to the ex-tent learning in dynamic tasks is implicit so that individuals areunable to verbalize the ways in which they make decisions (Gonz-alez, 2005b; Gonzalez, Lerch, & Lebiere, 2003). Interactive decision-making environments may be particularly useful in the investiga-tion of the SF failure, both to learn how people make decisionsand to speed learning (Gonzalez & Dutt, 2008; Sterman 2002).Rather than making judgments on a static task, using interactivedecision-making environments, people continuously or periodi-cally make decisions and receive feedback as they observe howthe state of the system responds (Diehl & Sterman 1995; Sterman1989a; 1989b). For example, individuals could make decisionsabout the flows affecting a stock each minute, observe the resultingvalue of the stock, then make flow decisions for the next minute,and so on (Gonzalez & Dutt, 2008).
Research should also explore the extent to which SF failuremight be reinforced by the educational system. Investigatingthe role of formal schooling in the genesis of SF failure is impor-tant for organizational behavior and decision making amongadults: the greater the extent to which early education inadver-tently reinforces SF failure the harder it will be to overcome bythe time people begin to make consequential decisions in sys-tems involving accumulations. Formal education could reinforce
Please cite this article in press as: Cronin, M. A. et al., Why don’t well-zational Behavior and Human Decision Processes (2008), doi:10.1016/j.o
SF failure in two ways: by encouraging the use of correlationalreasoning and by failing to teach the principles of accumulation.Educators have documented errors in mathematics problem solv-ing involving the erroneous use of correlational reasoning (Ben-Zeev & Star, 2001; Harel, Behr, Post, & Lesh, 1992; Van Dooren,De Bock, Hessels, Janssens, & Verschaffel, 2005). Early mathemat-ics education provides students with extensive practice in pro-portional reasoning and they are often encouraged to thinklinearly (Van Dooren et al., 2005). For example, children oftenencounter problems emphasizing proportionality such as ‘if 2cups of water fill one bucket, how many cups fill three buckets?’(van den Brink & Streefland, 1979). Such training may reinforcethe impression that relations between variables are proportional(Van Dooren, De Bock, Janssens, & Verschaffel, 2007). Mathemat-ics education may strengthen any predisposition to use the cor-relation heuristic people have prior to formal schooling. Furtherresearch should help disentangle interactions between innatecognitive structures, schooling, and other experiences in the gen-esis of SF failure and related difficulties in dynamic decisionmaking.
The greatest challenge for future work is to find effective meth-ods to improve performance on SF problems, improving our abilityto understand and manage the complex systems affecting our per-sonal lives, organizations, and society.
Acknowledgments
This research was partially supported by the National ScienceFoundation (Human and Social Dynamics: Decision, Risk, andUncertainty, Award No. 0624228) and by the Army Research Labo-ratory (DAAD19-01-2-0009) awards to Cleotilde Gonzalez. JohnSterman is co-PI of and supported by the Project on Innovationin Markets and Organizations at the MIT Sloan School of Manage-ment. We are grateful to Polina Vanyukov, who helped collectsome of the data reported here. We also thank Jeff Loewenstein,Don Moore, Cathy Tinsley, and anonymous reviewers for theircomments.
References
Almor, A., & Sloman, S. A. (2000). Reasoning versus memory in the Wason selectiontask—A non-deontic perspective on perspective effects. Memory and Cognition,28, 1060–1069.
Atkins, P., Wood, R., & Rutgers, P. (2002). The effects of feedback format on dynamicdecision making. Organizational Behavior and Human Decision Processes, 88,587–604.
Ben-Zeev, T., & Star, J. R. (2001). Spurious correlations in mathematical thinking.Cognition and Instruction, 19(3), 253–275.
Berry, J., & Nyman, M. (2003). Promoting students’ graphical understanding of thecalculus. Journal of Mathematical Behavior, 22, 481–497.
Booth Sweeney, L., & Sterman, J. D. (2000). Bathtub dynamics: Initial results of asystems thinking inventory. System Dynamics Review, 16(4), 249–286.
Brehmer, B. (1990). Strategies in real-time, dynamic decision making. In R. M.Hogarth (Ed.), Insights in decision making (pp. 262–279). Chicago: University ofChicago Press.
Brehmer, B. (1995). Feedback delays in complex dynamic decision tasks. In P. A.Frensch & J. Funke (Eds.), Complex problem solving: The European perspective(pp. 103–130). Hillsdale, NJ: Lawrence Erlbaum Associates.
Carlson, M., Jacobs, S., Coe, E., Larsen, S., & Hsu, E. (2002). Applying covariationalreasoning while modeling dynamic events: A framework and a study. Journal forResearch in Mathematics Education, 33(5), 352–367.
Camerer, C., & Hogarth, R. (1999). The effects of financial incentives in experiments:A review and capital-labor-production framework. Journal of Risk andUncertainty, 19(1–3), 7–42.
Chi, M. T. H., Feltovitch, P. J., & Glaser, R. (1981). Categorization and representationof physics problems by experts and novices. Cognitive Science, 5, 121–152.
Cronin, M., & Gonzalez, C. (2007). Understanding the building blocks of systemdynamics. System Dynamics Review, 23(1), 1–17.
Dawes, R. M. (1988). Rational choice in an uncertain world. Fort Worth, TX: HarcourtBrace.
Dawes, R. M. (1998). Behavioral decision making and judgment. In D. T. Gilbert, S. T.Fiske, & G. Lindzey (Eds.), Handbook of social psychology (4th ed., pp. 497–548).New York: McGraw-Hill.
educated adults understand accumulation? A challenge ..., Organi-bhdp.2008.03.003

M.A. Cronin et al. / Organizational Behavior and Human Decision Processes xxx (2008) xxx–xxx 15
ARTICLE IN PRESS
Diehl, E., & Sterman, J. D. (1995). Effects of feedback complexity on dynamicdecision making. Organizational Behavior and Human Decision Processes, 62(2),198–215.
Gattis, M. (2002). Structure mapping in spatial reasoning. Cognitive Development, 17,1157–1183.
Gattis, M. (2004). Mapping relational structure in spatial reasoning. CognitiveScience, 28, 589–610.
Gattis, M., & Holyoak, K. J. (1996). Mapping conceptual to spatial relations in visualreasoning. Journal of Experimental Psychology: Learning, Memory, & Cognition,22(1), 231–239.
Gigerenzer, G., & Hug, K. (1992). Domain-specific reasoning: Social contracts,cheating, and perspective change. Cognition, 43, 127–171.
Gonzalez, C. (2005a). Decision support for real-time dynamic decision making tasks.Organizational Behavior & Human Decision Processes, 96, 142–154.
Gonzalez, C. (2005b). The relationship between task workload and cognitiveabilities in dynamic decision making. Human Factors, 47(1), 92–101.
Gonzalez, C., & Dutt, V. (2008). On controlling the simplest dynamic system, inpreparation.
Gonzalez, C., Lerch, J. F., & Lebiere, C. (2003). Instance-based learning in dynamicdecision making. Cognitive Science, 27(4), 591–635.
Harel, G., Behr, M., Post, T., & Lesh, R. (1992). The blocks task: Comparative analysesof the task with other proportion tasks and qualitative reasoning skills of 7th-grade children in solving the task. Cognition and Instruction, 9(1), 45–96.
Houghton, J. T., Ding, Y., Griggs, D. J., Noguer, M., van den Linden, P. J., & Dai, X., et al.(Eds.). (2001). Climate change 2001: The scientific basis. Contribution of workinggroup I to the third assessment report of the Intergovernmental Panel on ClimateChange. New York: Cambridge Unviersity Press.
IPCC (2007). Climate change 2007: The physical science basis. Geneva, Switzerland:Intergovernmental Panel on Climate Change. Available from www.ipcc.ch.
Jensen, A., & Brehmer, B. (2003). Understanding and control of a simple dynamicsystem. System Dynamics Review, 19(2), 119–137.
Kahneman, D., & Tversky, A. (1972). Subjective probability: A judgment ofrepresentativeness. Cognitive Psychology, 3(3), 430–454.
Klayman, J., & Ha, Y. (1987). Confirmation, disconfirmation, and information inhypothesis testing. Psychological Review, 94, 211–228.
Kleinmuntz, D. N. (1985). Cognitive heuristics and feedback in a dynamic decisionenvironment. Management Science, 31(6), 680–702.
Kleinmuntz, D. N., & Schkade, D. A. (1993). Information displays and decisionprocesses. Psychological Science, 4(4), 221–227.
Mayer, R. E. (1995). The search for insight: Grappling with Gestalt psychology’sunanswered questions. In R. J. Sternberg & J. E. Davidson (Eds.), The nature ofinsight (pp. 3–32). Cambridge, MA: MIT Press.
Omodei, M., & Wearing, A. (1995). The Fire Chief microworld generating program:An illustration of computer-simulated microworlds as an experimentalparadigm for studying complex decision-making behavior. Behavior ResearchMethods, Instruments, & Computers, 27, 303–316.
Ossimitz, G. (2002). Stock–flow-thinking and reading stock–flow-related graphs: Anemperical investigation in dynamic thinking abilities. Paper presented at theInternational System Dynamics Conference.
Please cite this article in press as: Cronin, M. A. et al., Why don’t well-zational Behavior and Human Decision Processes (2008), doi:10.1016/j.o
Pala, O., & Vennix, J. A. M. (2005). Effect of system dynamics education on systemsthinking inventory task performance. System Dynamics Review, 21(2), 147–172.
Paulos, J. (1988). Innumeracy: Mathematical illiteracy and its consequences. New York:Hill and Wang.
Petty, R. E., & Wegener, D. T. (1998). Matching versus mismatching attitudefunctions: Implications for scrutiny of persuasive messages. Personality andSocial Psychology Bulletin, 24(3), 227–240.
Petty, R. E., Wegener, D. T., & Fabrigar, L. R. (1997). Attitudes and attitude change.Annual Review of Psychology, 48, 609–647.
Raman, M. (2002). Coordinating informal and formal aspects of mathematics:Student behavior and textbook messages. Journal of Mathematical Behavior, 21,135–150.
Roch, S. G., Lane, J. A. S., & Samuelson, C. D. (2000). Cognitive load and the equalityheuristic: A two-stage model of resource overconsumption in small groups.Organizational Behavior and Human Decision Processes, 82, 185–212.
Simon, H. A. (1979). Models of thought. New Haven, CT: Yale University Press.Sterman, J. D. (1989a). Misperceptions of feedback in dynamic decision making.
Organizational Behavior and Human Decision Processes, 43(3), 301–335.Sterman, J. D. (1989b). Modeling managerial behavior: Misperceptions of
feedback in a dynamic decision making experiment. Management Science,35(3), 321–339.
Sterman, J. D. (2002). All models are wrong: Reflections on becoming a systemsscientist. System Dynamics Review, 18, 501–531.
Sterman, J. D., & Booth Sweeney, L. (2002). Cloudy skies: Assessing publicunderstanding of global warming. System Dynamics Review, 18(2), 207–240.
Sterman, J. D., & Booth Sweeney, L. (2007). Understanding public complacencyabout climate change: Adults’ mental models of climate change violateconservation of matter. Climatic Change, 80(3–4), 213–238.
Tufte, E. (1983). The visual display of quantitative information. Cheshire, Connecticut:Graphics Press.
Tufte, E. (1990). Envisioning information. Cheshire, Connecticut: Graphics Press.Van den Brink, J., & Streefland, L. (1979). Young children (6–8)—Ratio and
proportion. Educational Studies in Mathematics, 10, 403–420.Van Dooren, W., De Bock, D., Hessels, A., Janssens, D., & Verschaffel, L. (2005). Not
everything is proportional: Effects of age and problem type on propensities forovergeneralization. Cognition and Instruction, 23(1), 57–86.
Van Dooren, W., De Bock, D., Janssens, D., & Verschaffel, L. (2007). Pupils’ over-reliance on linearity: A scholastic effect? British Journal of EducationalPsychology, 77, 307–321.
Vicente, K. J. (1996). Improving dynamic decision making in complex systemsthrough ecological interface design: A research overview. System DynamicsReview, 12(4), 251–279.
Vicente, K. J., & Rasmussen, J. (1992). Ecological interface design: Theoreticalfoundations. IEEE Transactions of Systems, Man, and Cybernetics, 22(4), 589–606.
Wason, P. C. (1960). On the failure to eliminate hypotheses in a conceptual task.Quarterly Journal of Experimental Psychology, 12, 129–140.
Wickens, C. D., & Carswell, C. M. (1995). The proximity compatibility principle: Itspsychological foundation and relevance to display design. Human Factors, 37(3),473–494.
educated adults understand accumulation? A challenge ..., Organi-bhdp.2008.03.003