organizational benchmark study
TRANSCRIPT
Organizational Benchmark StudyThe Advertiser Report
THE 2019 ADVERTISING RESEARCH FOUNDATION
BY THE ARF ANALYTICS COUNCIL,MARCH 2020
1
CONTENTS
Introduction ............................................................................................. 2
Executive Summary ................................................................................... 2
Methodology ............................................................................................. 3
The Advertiser Report ................................................................................ 7
Department Structure ................................................................................ 8
Media, Marketing and Analytics Expenditures .............................................. 12
Changes in Investment in Research and Analytics ........................................ 13
Key Performance Indicators for Return on Investment .................................. 14
Technical Skills for Future Hiring ................................................................ 16
Tools Used to Analyze Data ....................................................................... 16
Techniques Used to Analyze Data .............................................................. 17
Department Collaboration ......................................................................... 18
Department Satisfaction ........................................................................... 19
Department Strength ............................................................................... 22
Stakeholder Value ................................................................................... 23
Strength of Performance .......................................................................... 25
Summary of Findings ............................................................................... 27
Custom Benchmark Survey ....................................................................... 28

2
Introduction Over the past two years, several of the Advertising Research Foundation’s (ARF) members have expressed concerns about the rapid changes in advertising and marketing research. Key concerns ranged from naming the department (e.g. data science, research department, research and analytics) to the selection of programming languages (Python/R/SAS/SPSS) vis-a-vis best practices. Does “research department” carry the same gravitas as “data science” or “customer experience”? Is it in their best interest to centralize or decentralize the research infrastructure? Moreover, are stakeholders convinced that research provides a positive ROI?
These are just a few of the questions our membership has asked over the past several months. To address these concerns, the ARF, with the support and guidance of the Analytics Council, launched its first Organizational Benchmark Study of the industry with the intention of refreshing the results annually. Furthermore, the ARF will offer an ongoing service to conduct a detailed study of a member’s company, seeking a substantial sample size across all levels of the organization. This will allow for a detailed comparison with the benchmark results.
Executive Summary The major findings of this study include advertisers’ views on a variety of subjects from department structure to stakeholder satisfaction. Names and Structure: There is a wide variety of names by which advertisers’ insights departments are being called. However, “research” or a compound version such as “consumer research” appear about a third of the time. Large advertisers are far more likely to have decentralized structures than small advertisers. About a third of advertisers say that decision-makers are going to different departments for insights compared to three years ago.
Spending and KPIs: Advertisers are spending about the same as last year on market research and data science, with small advertisers spending a bit more and large advertisers spending a bit less. Sales, brand equity and brand lift are the three most important KPIs used respectively, to value research in the organization.
Skills and Tools: Larger advertisers find artificial intelligence, machine learning and advanced analytics the most important skills needed for hiring now and in the future. Smaller advertisers find data visualization, storytelling and behavioral economics the most important skills. All advertisers are using survey analysis software such as SPSS, but larger advertisers are more likely than small ones to use open source programs such as Python and R. Data integration, market mix, media analytics and attribution are the most heavily relied on techniques.
Satisfaction: Generally, satisfaction and stakeholder value are positive. That said, advertisers were less satisfied with their departments’ ability to integrate multiple datasets and their ability to convert data into actionable business recommendations.

3
Methodology The survey was built on a Qualtrics platform, the link to which was first communicated in April 2019 and closed October 2019. The survey itself was authored by the ARF’s Analytics Council. The ARF received responses from 836 respondents from across all levels of member and non-member organizations. Of these, 453 respondents completed 100% of the survey. Responses came from all over the world, but primarily from United States. The sample frame included both an ARF membership list and the wonks community which includes members and non-members.
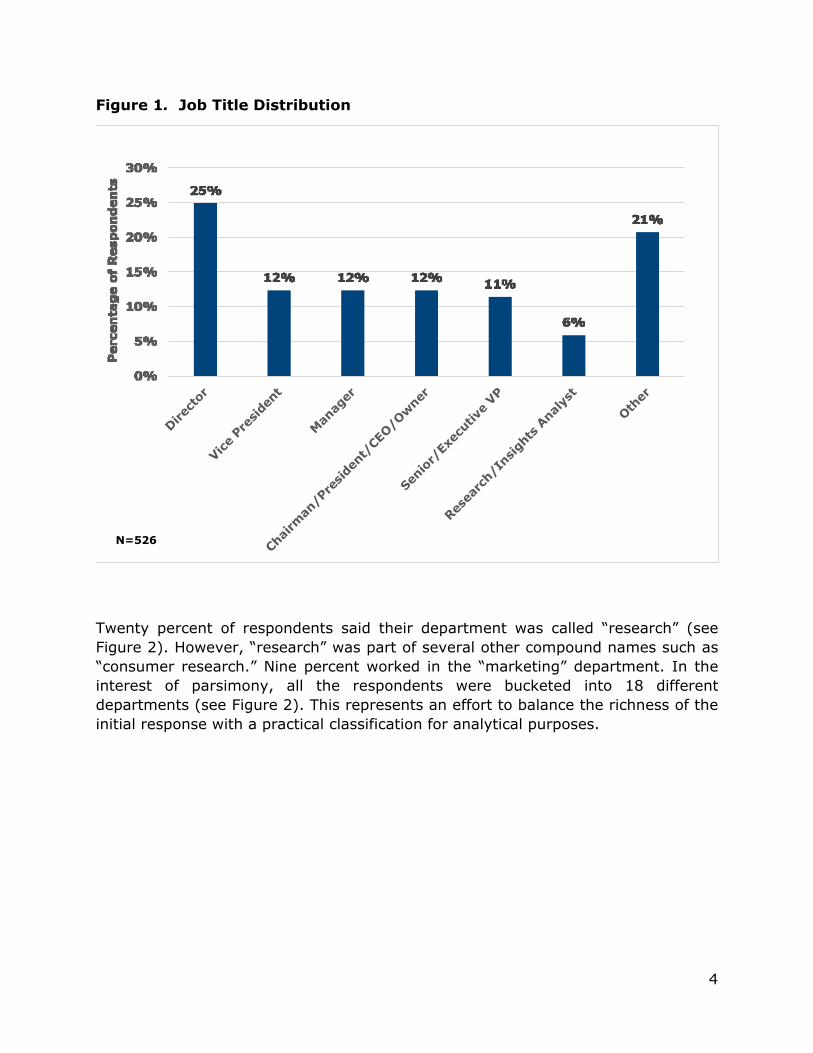
There was a wide distribution of over one hundred job titles (see Figure 1). Twenty-five were at the director level, while vice president (VP) and senior/executive VP constituted another 23%. Twenty-one percent of the respondents held other job titles such as consultant, principal and account executive. For brevity’s sake, these various titles were bucketed into the “other” category.
4
Figure 1. Job Title Distribution
N=526
Twenty percent of respondents said their department was called “research” (see Figure 2). However, “research” was part of several other compound names such as “consumer research.” Nine percent worked in the “marketing” department. In the interest of parsimony, all the respondents were bucketed into 18 different departments (see Figure 2). This represents an effort to balance the richness of the initial response with a practical classification for analytical purposes.

5
Figure 2. In which department do you work?
N=529
Twenty-four percent of the respondents said that research at their company is supervised by the consumer research and insights department (see Figure 3). Data science/analytics and strategy/planning departments oversee research in 12% and 11% of cases. Thirty-six percent reported research oversight by an array of department names, such as analytics and insights, data and insights, and marketplace insights and were coded as “other.”

6
Figure 3. You indicated that market research/insights and/or data science/analytics are overseen by one department. What is this department called?
N=176
We have conducted analyses of major lines of business (LOB) focused on five distinct categories: advertiser, advertising agency, media, research company and other (largely consultancies and adtech). Respondents were instructed to answer for the company they worked for directly and not for a holding company of which their company may be a part.
Additionally, it was evident that there would be substantial differences by organization size. To that end, the sample was segmented by number of employees in order to yield approximately the same number of respondents within each of the size segments. Segmenting by number of employees and business line minimizes the need for weighting or post stratification (It is unclear what we would use as a universal estimate for weighting, as the results reflect responses from both members and non-members). In this report, advertisers with 10,000 employees or more are labeled as “large,” while those with less than 10,000 are labelled as “small.” The results will be reported by this segment where sample sizes permit.

7
The Advertiser Report The remainder of this report will be focused on advertisers, with separate reports being generated for agencies, media, research companies and consultancies in the near future.
Fourty-seven percent of the advertiser respondents are from companies with more than 10,000 employees (see Figure 4).
Figure 4. Distribution of Advertisers’ Employees
N=73
Fewer advertisers answered the question of revenue (see Figure 5). Forty-two percent of the respondents’ company revenue exceeds $20 billion whereas, 44% of respondents’ company revenues are between $1 billion and $20 billion.

8
Figure 5. Company Revenue for Advertisers
N=64
Department Structure The structure of research can have a substantial influence on a company’s business strategy. Studies show that a company’s strategy for using technology to add value is reflected by the structure of its research analytics. 1 Some advertiser members have expressed concern that data-driven marketing could potentially have a dramatic effect on the talents required and the structure of research in their organizations.
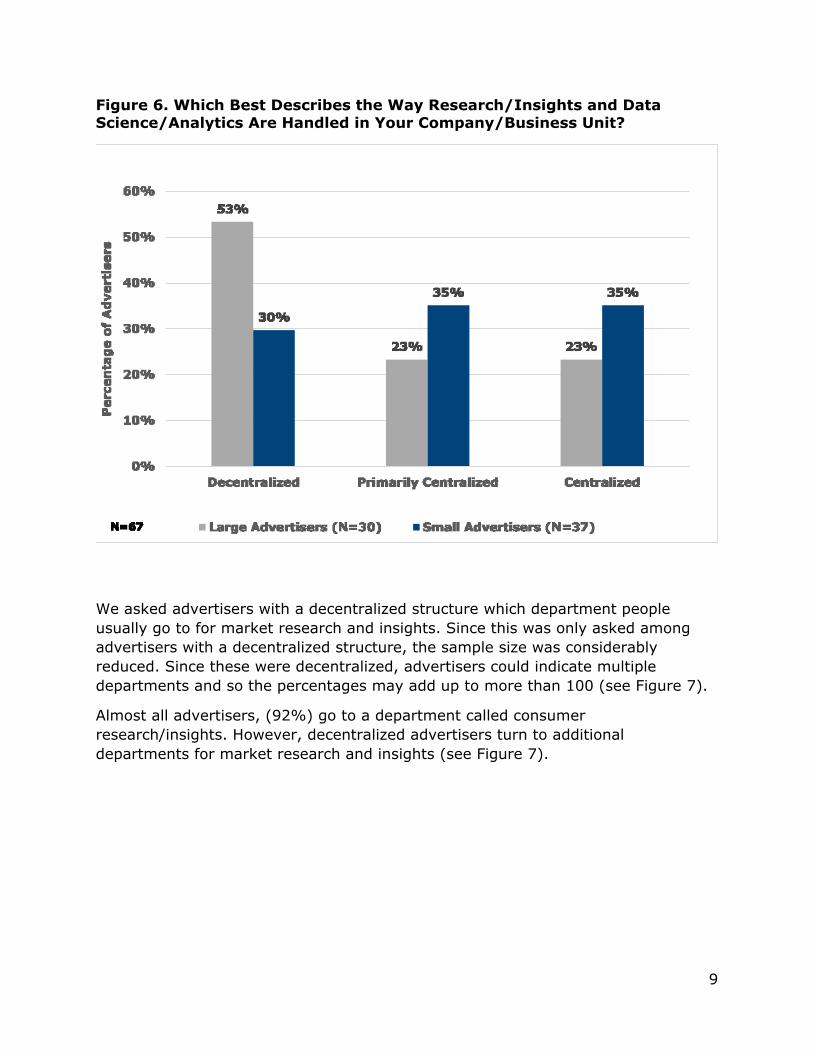
Respondents were asked to describe the way research/insights and data science/analytics are handled in their company/business unit (see Figure 6). Large advertisers were more likely to have a decentralized research structure with multiple centers for research and insights. Small advertisers, on the other hand, were more likely to have a centralized department to conduct data analytics and research. When small advertisers said that all research was overseen or primarily overseen by one department (i.e. centralized), that department was called either consumer research or consumer insights. This occurred 48% of the time for small advertisers but only 17% of the time for large advertisers.
1 Tirpak, T., Miller, R., Schwartz, L., and Kashdan, D. (2006). ‘R&D Structure in a Changing World’, Research and Technology Management. September-October. Pgs. 19-26.
9
Figure 6. Which Best Describes the Way Research/Insights and Data Science/Analytics Are Handled in Your Company/Business Unit?
We asked advertisers with a decentralized structure which department people usually go to for market research and insights. Since this was only asked among advertisers with a decentralized structure, the sample size was considerably reduced. Since these were decentralized, advertisers could indicate multiple departments and so the percentages may add up to more than 100 (see Figure 7).
Almost all advertisers, (92%) go to a department called consumer research/insights. However, decentralized advertisers turn to additional departments for market research and insights (see Figure 7).

10
Figure 7. Which Department Do Decision Makers in Your Company/Business Unit Turn to for Market Research/Insights?
N=25
Note: Total percentages of departments consulted exceed 100%, given decentralized structure of respondents’ firms and the ability to consult multiple departments.
We also asked these decentralized advertisers whether the choice of “go to” departments has changed (see Figure 8). Many of our members have asked whether we have seen a shift from more traditional research and insights departments to those oriented around data science or advanced analytics. The latter two are more often associated with machine learning and techniques such as neural networks.
Among these decentralized advertisers, both large and small, 44% responded there had been no change, while 32% responded that there had been a change. Almost all of the respondents who did not know if there had been a change, came from large advertisers, where they may not have known about changes in the wider organization.
11
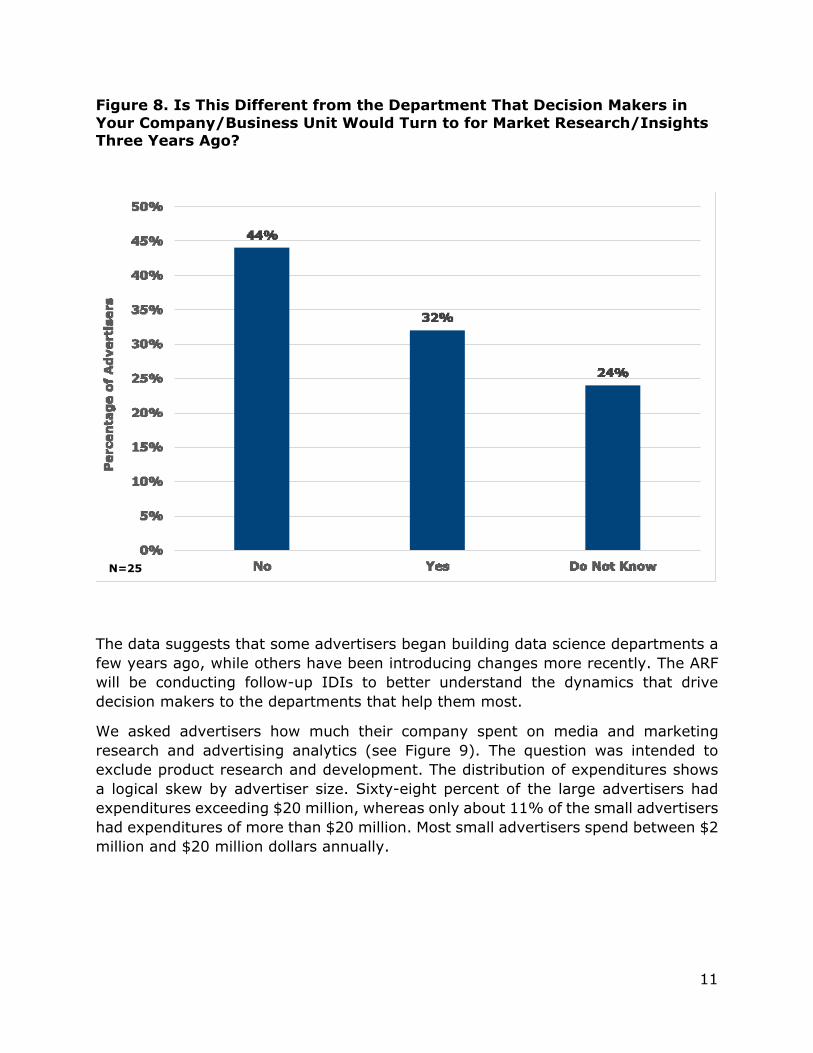
Figure 8. Is This Different from the Department That Decision Makers in Your Company/Business Unit Would Turn to for Market Research/Insights Three Years Ago?
N=25
The data suggests that some advertisers began building data science departments a few years ago, while others have been introducing changes more recently. The ARF will be conducting follow-up IDIs to better understand the dynamics that drive decision makers to the departments that help them most.
We asked advertisers how much their company spent on media and marketing research and advertising analytics (see Figure 9). The question was intended to exclude product research and development. The distribution of expenditures shows a logical skew by advertiser size. Sixty-eight percent of the large advertisers had expenditures exceeding $20 million, whereas only about 11% of the small advertisers had expenditures of more than $20 million. Most small advertisers spend between $2 million and $20 million dollars annually.

12
Media, Marketing and Analytics Expenditures
Figure 9. How Much Did Your Company/Business Unit Spend on Media, Marketing and Advertising Research and Analytics, Including Internal and External Expenditures in 2018?
N=49
Members have expressed interest in research spending as a percent of revenue. Two factors limit our ability to determine this percentage. The first is that the expenditure disclosed included only media, marketing and analytics. The second is that for large advertisers, the distribution of both revenue and research spend skew heavily toward the top categories of $20 billion in revenue and $20 million in research spending.
As a result, we will revise our revenue and spend categories in the 2020 survey in an effort to achieve a normal distribution for both large and small advertisers. Since the distribution for small advertisers is relatively normal, we have estimated the percent of revenue spent on media, market and analytics research to be between 0.1% and 0.2%, under a wide set of assumptions for the top spending and revenue categories. Note, this will not include research and development, or operations research and product development. Simply comparing the distributions for large advertisers suggests that they too, may fall into that range.
13
Changes in Investment in Research and Analytics
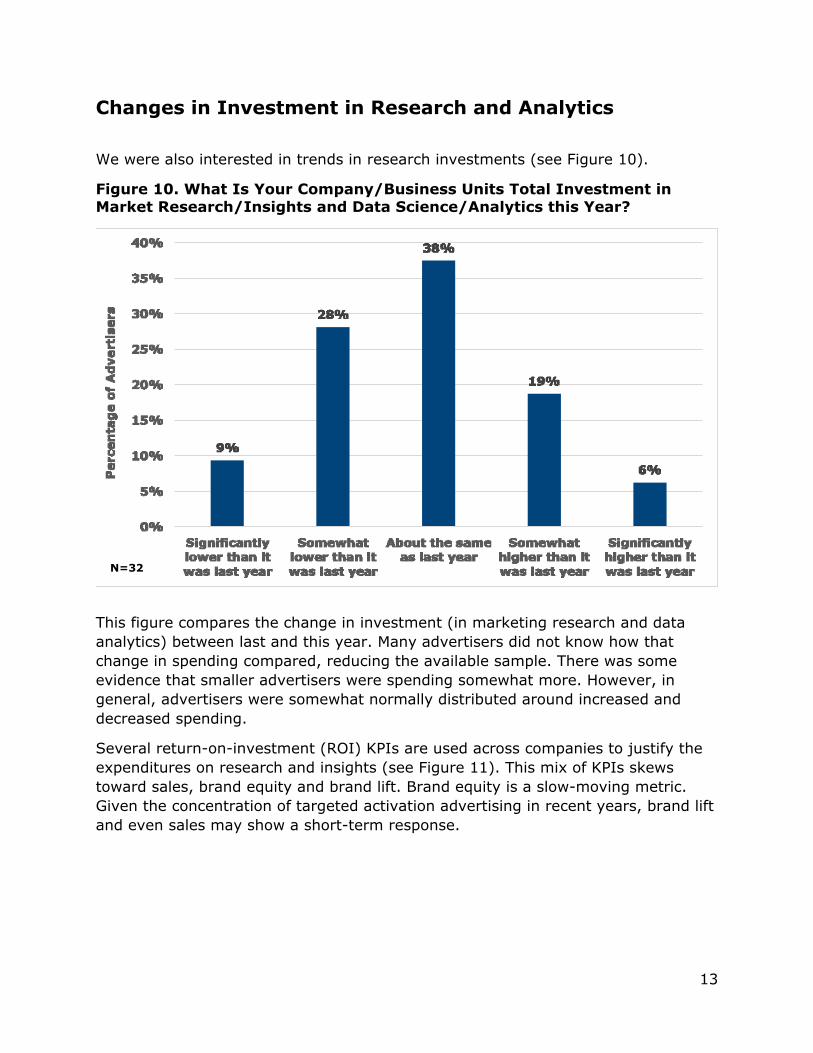
We were also interested in trends in research investments (see Figure 10).
Figure 10. What Is Your Company/Business Units Total Investment in Market Research/Insights and Data Science/Analytics this Year?
N=32
This figure compares the change in investment (in marketing research and data analytics) between last and this year. Many advertisers did not know how that change in spending compared, reducing the available sample. There was some evidence that smaller advertisers were spending somewhat more. However, in general, advertisers were somewhat normally distributed around increased and decreased spending.
Several return-on-investment (ROI) KPIs are used across companies to justify the expenditures on research and insights (see Figure 11). This mix of KPIs skews toward sales, brand equity and brand lift. Brand equity is a slow-moving metric. Given the concentration of targeted activation advertising in recent years, brand lift and even sales may show a short-term response.

14
Key Performance Indicators for Return on Investment
Figure 11. Which KPIs Does Your Company/Business Unit Use to Evaluate the ROI of Your Insight, Analytics and/or Research Department(s)?
N=61
Les Binet and Peter Field have long since argued that, in general, long-term brand advertising should be 60% of the advertising goal and 40% should target sales activation.2 Curiously, our advertising respondents seem to have reversed that focus, at least in so far as the ROI of research is concerned.
Technical Skills for Current Hiring
Advertisers were asked about the preferred skills they have been seeking when hiring (see Figure 12). This figure shows that advanced analytical/statistics were the top choice for both small and large advertisers, followed by basic analytics skills (e.g. Excel).
Brand storytelling is important to many advertisers, and not surprisingly, large advertisers are more likely to employ artificial intelligence and machine learning for segmentation, targeting and other uses. Research conducted by the ARF’s Creative
2 Binet, L. and Field, P. (2018, October). Effectiveness in Context: A Manual for Brand Building. Part 2 of the Marketing Effectiveness in the Digital Age Series.

15
Council suggests that creative professionals still favor qualitative research (e.g. ethnography and focus groups) for preparation of the creative brief.3
Figure 12. Over the Last Two Years, What Technical Skills Have Been Sought After When Staffing Your Department?
N=58
3 The ARF Creative Council. (2019, December). How to Get Better Creative from Better Insights white paper. https://cdn.thearf.org/ARF_Knowledgebase/ARF%20WhitePapers/ARF-BetterCreativeBettInsights-1219-final.pdf

16
Technical Skills for Future Hiring There is general similarity in the skills that large and small advertisers will be seeking in the near future (see Figure 13). Some small differences emerge in that, large advertisers are more likely to seek technical skills, such as artificial intelligence or machine learning, while small advertisers are slightly more likely to seek more traditional skills, such as data visualization (e.g. Tableau), storytelling, qualitative skills and behavioral economics.
Figure 13. Which Skills Do You Believe Your Department Will Have the Greatest Need for in the Near Future?
N=57
Tools Used to Analyze Data Many ask what tools our members are using to analyze CRM and other massive datasets (see Figure 14). Seventy-six percent of large advertisers use some type of survey analysis software, which may include platforms such as SPSS and Qualtrics. Other popular language/tools among respondents are R, SAS, Python and relational databases. We were surprised to see the relative strength of traditional subscription statistical packages, such as SPSS (included in Survey Analysis Software) and SAS. The trend in data science has been moving towards open source software such as R and Python.

17
Figure 14. Which Tool Do You Use to Analyze Data?
N=50
Techniques Used to Analyze Data While tools generally refer to software, techniques refer to what that software is used for (see Figure 15). Data integration, market mix modeling, media analytics and marketing attribution modeling remain the top techniques used by both large and small advertisers to analyze data. This may explain the continued popularity of packages such as SAS and SPSS. Many of the legacy market mix models rely heavily on multivariate techniques such as regression and these packages have been used for these techniques for over 50 Years.

18
Figure 15. What Techniques Does Your Department Use to Analyze Data?
N=56
Department Collaboration Cross collaboration was seen to be prevalent among departments for both large and small advertisers (see Figure 16). Many of the differences observed may be due to that fact that smaller advertisers may not have many of the departments that larger advertisers will have. A higher percentage of large advertisers work with media planning, corporate and media buying departments, probably reflecting the fact that smaller advertisers may not have many of these departments. All advertisers, large and small, will have marketing and brand management departments.

19
Figure 16. Which of These Departments Does Your Department Work Closely With?
N=51
Department Satisfaction We asked several questions about the respondents’ and senior stakeholders’ satisfaction, and the value seen in the research and insights function. We asked about satisfaction with the research & analytics department if the respondent indicated that research was centralized under one department. We asked about satisfaction with the data science & analytics departments and the consumer & insights departments if the respondent said the functions were decentralized. This control by centralization had the effect of reducing available sample for each set of analyses.
When questioned about their satisfaction with the research & analytics department, 91% of the centralized advertisers responded they were very or somewhat satisfied (see Figure 17). A small portion of the small centralized advertisers were dissatisfied with their research & analytic departments.

20
Figure 17. How Satisfied Are You with the Research and Analytics Department?
N=37
However, when we asked advertisers with decentralized departments, they were much more likely to be dissatisfied with their data science operations. The majority of the dissatisfied were large advertisers.
This may reflect a frequent concern that our membership has expressed: the belief that research and data science represent very different skill types. Research is generally thought to hold more subject matter expertise while data science is thought to be better at handling data especially large datasets.
A working theory is that the higher levels of dissatisfaction stem from the tendency for decentralization to yield a less effective working relation between consumer insights and data science. Indeed, one of the sources of dissatisfaction of data science that came out of the survey was that data science is less effective at connecting results with actionable business recommendations.
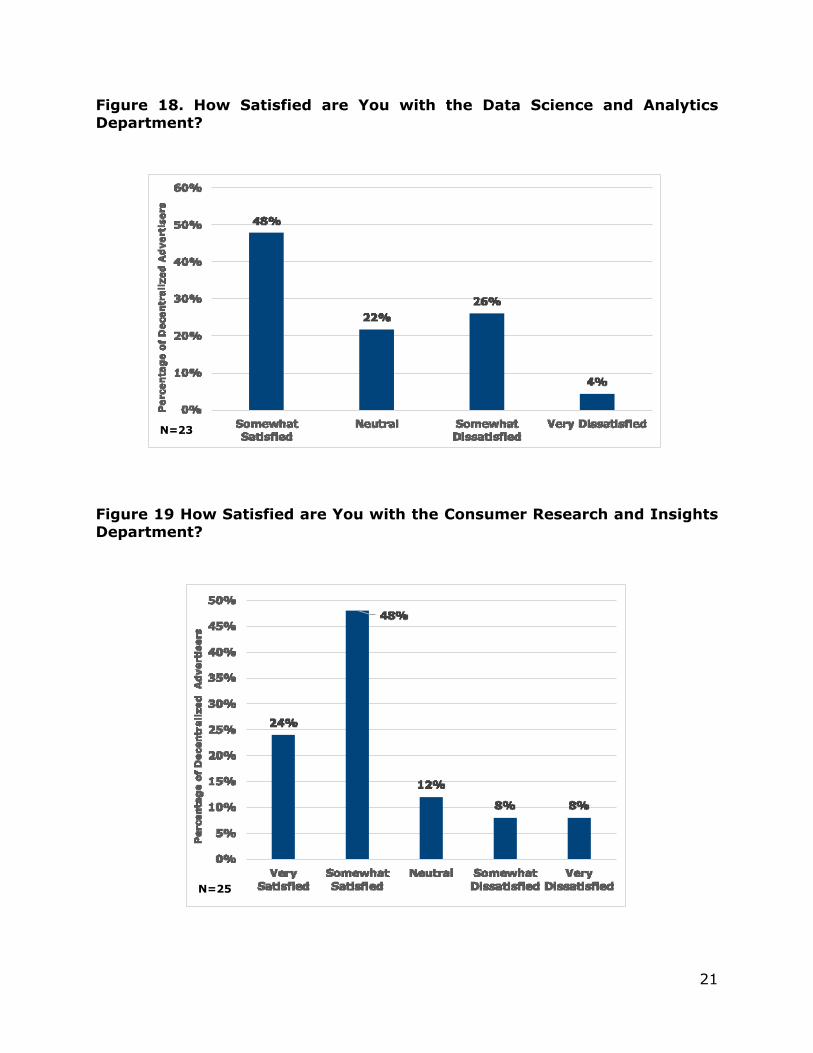
Although there is also some dissatisfaction with the consumer insights department among both large and small advertisers, their responses skew more positive than for their data science departments (see Figures 18 and 19).
21
Figure 18. How Satisfied are You with the Data Science and Analytics Department?
N=23
Figure 19 How Satisfied are You with the Consumer Research and Insights Department?
N=25

22
Department Strength Advertisers’ opinions of the strength of their companies’ ability to translate consumer data and research into consumer insights skew slightly negative (see Figure 20). This may reflect the same concern expressed among advertisers with decentralized research functions, especially where the data science department was viewed as less effective at translating data into actionable recommendations.
Figure 20. How Strongly Does Your Company Translate Consumer Data/Research into Consumer Insights?
N=20
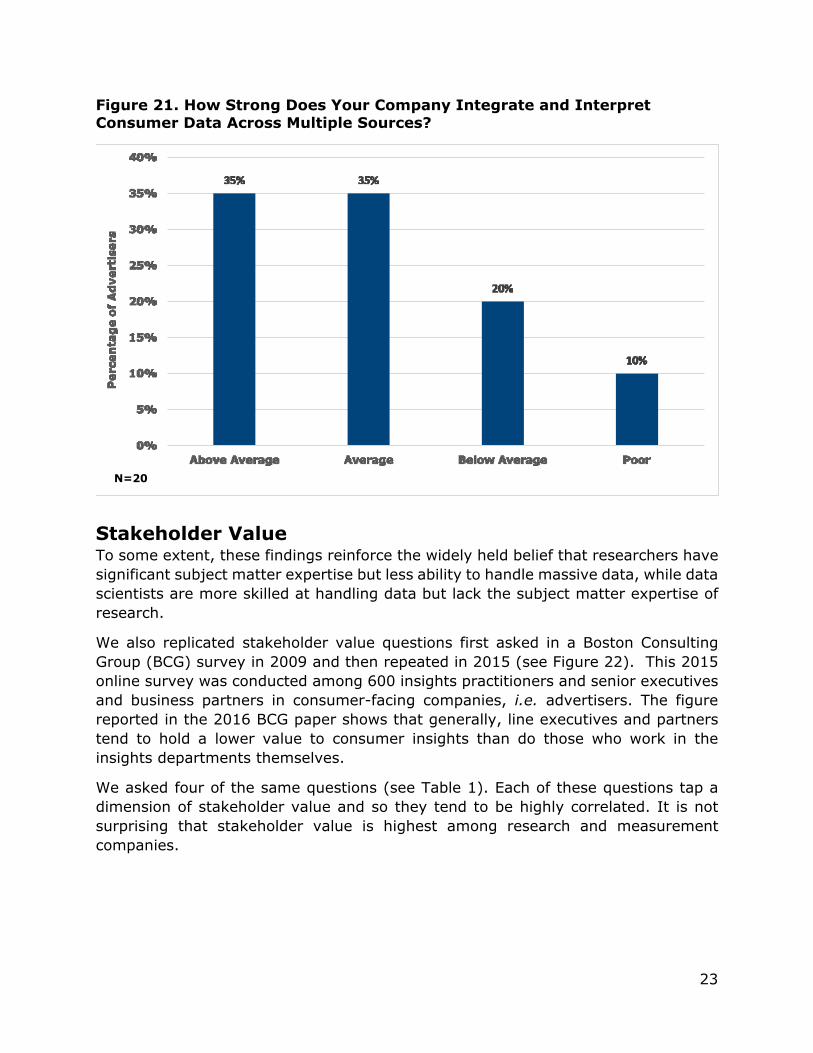
Thirty percent of advertisers said that their research and data science departments were below average or poor with respect to how well their company integrates and interprets data across multiple sources (see Figure 21). This was true of both large and small advertisers.
23
Figure 21. How Strong Does Your Company Integrate and Interpret Consumer Data Across Multiple Sources?
N=20
Stakeholder Value To some extent, these findings reinforce the widely held belief that researchers have significant subject matter expertise but less ability to handle massive data, while data scientists are more skilled at handling data but lack the subject matter expertise of research.
We also replicated stakeholder value questions first asked in a Boston Consulting Group (BCG) survey in 2009 and then repeated in 2015 (see Figure 22). This 2015 online survey was conducted among 600 insights practitioners and senior executives and business partners in consumer-facing companies, i.e. advertisers. The figure reported in the 2016 BCG paper shows that generally, line executives and partners tend to hold a lower value to consumer insights than do those who work in the insights departments themselves.
We asked four of the same questions (see Table 1). Each of these questions tap a dimension of stakeholder value and so they tend to be highly correlated. It is not surprising that stakeholder value is highest among research and measurement companies.

24
It is also not surprising that media stakeholders would score the value of research and analytics as relatively high given the importance of content and sales research. The agency results, where research provides a competitive advantage and are relied on for business decisions, may reflect the use of research in new business pitches and media and brand planning.
Advertiser n~56
Agency n~52
Media n~61
Research n~136
Others n~45
Total n~338
Research & Analytics Department Contribute Materially to Financial
Performance 56% 65% 77% 87% 86% 77%
Relying on Research & Analytics Department to Make Business Decision 62% 72% 79% 71% 71% 71%
Research & Analytics Provides High ROI
61% 69% 64% 81% 83% 73%
Research & Analytics Gives a Competitive
Advantage 64% 83% 82% 88% 95% 83%
Note: LOB = Line of Business
Table 1. Believe that Key Stakeholders in Business Unit Agree (by LOB)
25
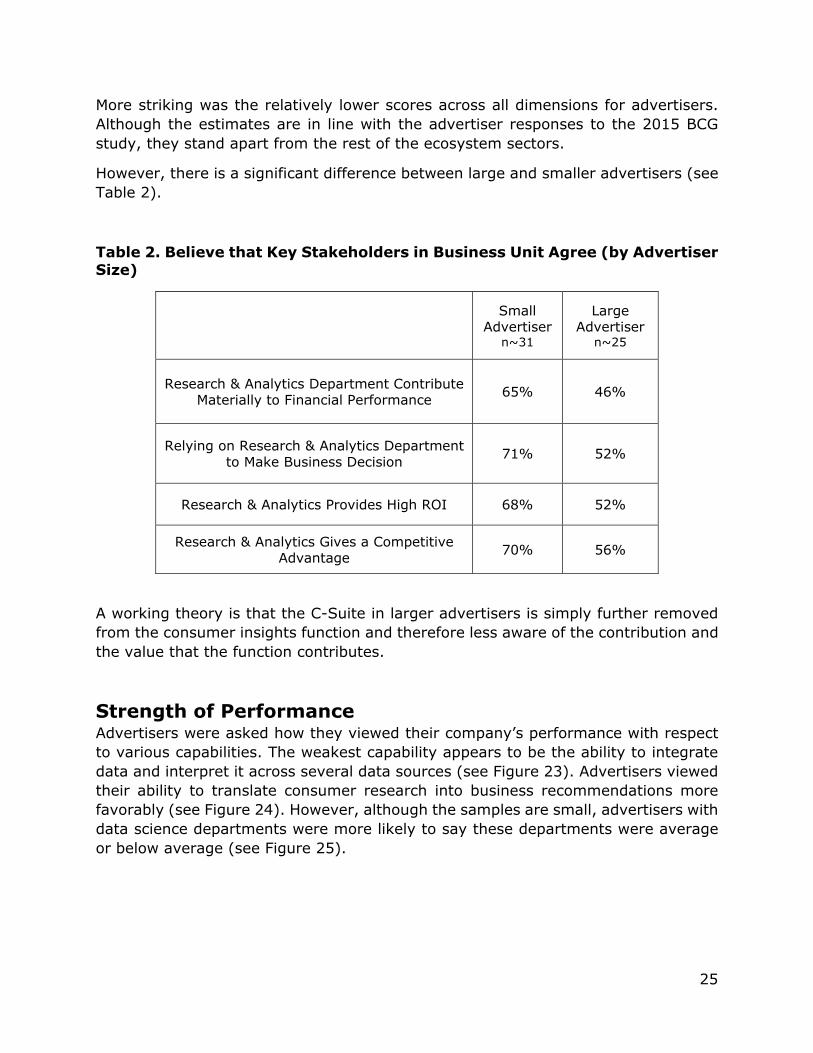
More striking was the relatively lower scores across all dimensions for advertisers. Although the estimates are in line with the advertiser responses to the 2015 BCG study, they stand apart from the rest of the ecosystem sectors.
However, there is a significant difference between large and smaller advertisers (see Table 2).
Table 2. Believe that Key Stakeholders in Business Unit Agree (by Advertiser Size)
Small
Advertiser n~31
Large Advertiser
n~25
Research & Analytics Department Contribute Materially to Financial Performance 65% 46%
Relying on Research & Analytics Department to Make Business Decision 71% 52%
Research & Analytics Provides High ROI 68% 52%
Research & Analytics Gives a Competitive Advantage 70% 56%
A working theory is that the C-Suite in larger advertisers is simply further removed from the consumer insights function and therefore less aware of the contribution and the value that the function contributes.
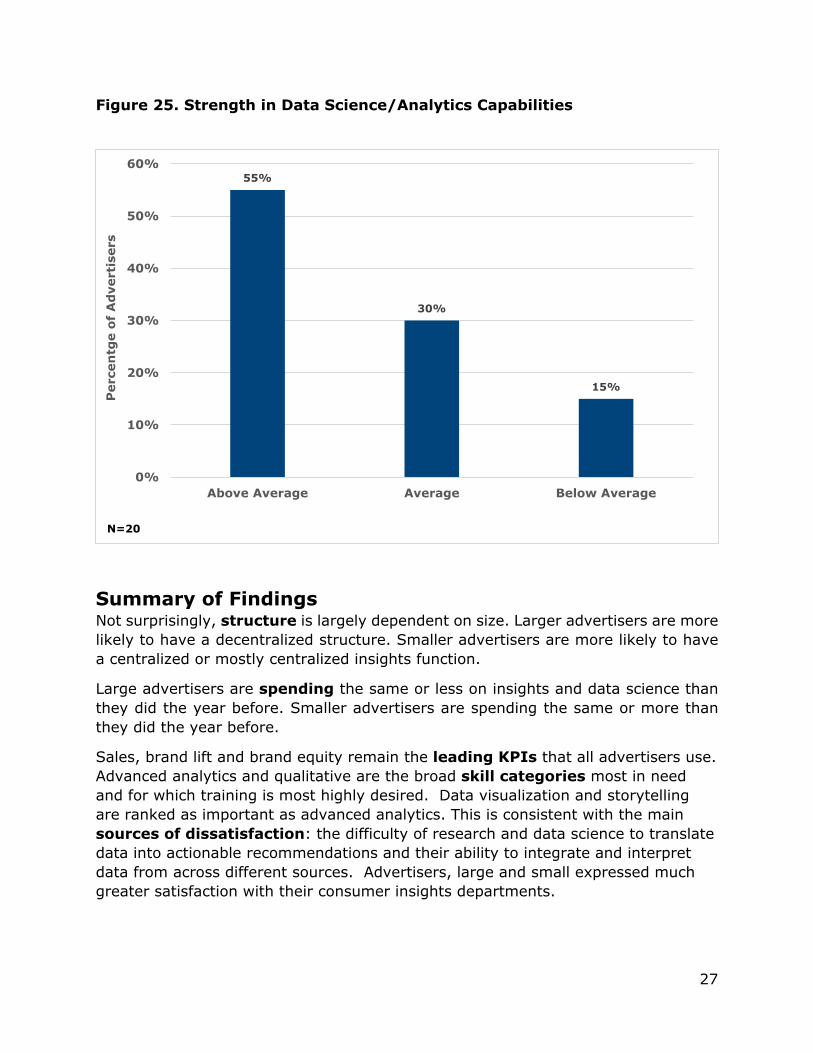
Strength of Performance Advertisers were asked how they viewed their company’s performance with respect to various capabilities. The weakest capability appears to be the ability to integrate data and interpret it across several data sources (see Figure 23). Advertisers viewed their ability to translate consumer research into business recommendations more favorably (see Figure 24). However, although the samples are small, advertisers with data science departments were more likely to say these departments were average or below average (see Figure 25).

26
Figure 23. Strength in Integrating, Synthesizing, and/or Interpreting Consumer Insights Across Multiple Data Sources
N=61
Figure 24. Strength in Translating Consumer Research/Insights into Business Recommendations/Actions
N=61
27
Figure 25. Strength in Data Science/Analytics Capabilities
Summary of Findings Not surprisingly, structure is largely dependent on size. Larger advertisers are more likely to have a decentralized structure. Smaller advertisers are more likely to have a centralized or mostly centralized insights function.
Large advertisers are spending the same or less on insights and data science than they did the year before. Smaller advertisers are spending the same or more than they did the year before.
Sales, brand lift and brand equity remain the leading KPIs that all advertisers use. Advanced analytics and qualitative are the broad skill categories most in need and for which training is most highly desired. Data visualization and storytelling are ranked as important as advanced analytics. This is consistent with the main sources of dissatisfaction: the difficulty of research and data science to translate data into actionable recommendations and their ability to integrate and interpret data from across different sources. Advertisers, large and small expressed much greater satisfaction with their consumer insights departments.
55%
30%
15%
0%
10%
20%
30%
40%
50%
60%
Above Average Average Below Average
Perc
en
tge o
f A
dve
rtis
ers
N=20
28
Stakeholder value is highest for research companies and lowest for advertisers. This is largely driven by company size where it is likely that the C-suite in a large multinational corporation is less aware of what and how research is used.
Custom Benchmark Survey In many companies, no more than one or two executives may have responded to the survey. This makes it difficult to compare an individual company against the benchmarks. As we have seen, there can be significant differences between the views of those in the insight’s organization and other stakeholders. The Advertising Research Foundation does offer a custom benchmark report for a fee. We recommend delivering the survey to at least 30 respondents within any business unit to be reported. Respondents would be preselected to represent different areas of line and stakeholder responsibility.
Results would be reported in contrast to advertisers in general and large and small advertiser. The cost is a function of the number of business units to be studied. If interested or have further questions, please email Chief Research Officer Paul Donato at [email protected] or Director of the ARF Council Program, Jay Mattlin at [email protected].