organizational climate survey results
TRANSCRIPT
Interagency Council on Intermediate Sanctions
Organizational Climate Survey Results
Prepared by Timothy Wong, ICIS Research Analyst
Research & Statistics Branch
Crime Prevention & Justice Assistance Division Department of the Attorney General
State of Hawaii
FINAL
September 2010
I. Introduction 1 II. Key Findings 2 III. Summary of Results, 2009 Survey
Leadership 5 Motivation 6 Communication 7 Decisions 8 Goals 9 Control 10 Ranked Items, by Gap Distance 11 Questions Items, by Classification 12 Gap Distances, by Classification 13
IV. Comparison of 2005 and 2009 Survey Results Organizational Climate Areas (2005 and 2009 surveys) 15 Organizational Climate Areas by Agency (2005 and 2009 surveys) 16 Comparison of 2005 and 2009 Gap Distance (All Agencies) 17 Comparison of 2005 thru 2009 Gap Distance (Adult Probation) 18 Comparison of 2005 thru 2009 Gap Distance (Parole) 19 Comparison of 2005 thru 2009 Gap Distance (ISC) 20 Comparison of 2005 thru 2009 Gap Distance (Department of Public Safety) 21
V. Appendix A
Survey Instrument 23 VI. Appendix B
Gap Levels based on Percentile Distributions 28
Table of Contents

1
In August 2009, the Department of the Attorney General’s Research and Statistics Branch distributed 309 organizational climate surveys to correctional officers and support staff, including probation officers at Adult Probation (hereafter “Probation”); parole officers at the Hawaii Paroling Authority (hereafter “Parole”); social workers at correctional facilities managed by the Department of Public Safety (hereafter “PSD”); and social workers at the Intake Service Centers (hereafter “ISC”) located within the Department of Public Safety, but reported separately for the purposes of this report. The objective and purpose of this study is to assess, through the surveying of corrections professionals, perceived differences between the present and ideal organizational climate conditions, specified along six broad areas: leadership, motivation, communication, decision-making, goals, and control. A cover letter, which accompanied each survey, assured staff members of full confidentiality with respect to their individual responses. The 18-question, 20-point Likert scale survey asked for respondents’ description of their organization now, and as their ideal for the future. Example: “How much confidence Virtually none Some Substantial amount A great deal and trust is shown in subordinates?” 1 2 3 4 5 6 7 8 9 10 11 12 13 14 15 16 17 18 19 20 “X”=Organization at the Present Time “O”=Ideal for the Future
In the example above, the respondent presently believes that there is virtually no trust and confidence shown to subordinates. Therefore, s/he placed an “X” in box number 4. (Had s/he felt the problem was more severe, s/he could have placed an “X” in box number 1 or 2). The respondent also felt that, ideally, and in the future, subordinates should receive “a great deal” of trust. Therefore, s/he placed an “O” in box number 17. The respondent’s “current” and “ideal” scores represent a 13-point gap distance . Theoretically, those items with a large gap between the ideal and present conditions, pose the greatest threat to the efficiency of the various agencies (refer to Appendix A for the survey instruments’ gap distance, by agency). Methodology : This is the third organizational climate survey conducted by ICIS. The earlier surveys reported in the 2002 and 2005 studies included statewide participants from Probation, Parole, and the Department of Public Safety. The 2009 study duplicates the methodology from the two previous studies. For standardization purposes, the gap distance (respondents’ “current” versus “ideal” perceptions of their respective agency’s organizational climate) are in three classified ranges, based on the 2005 and 2009 gap distance distributions. Standardized distributions are useful in making a statistical judgment on whether the gap distances are narrow, moderate, or wide. Appendix B depicts the gap distance cut-off ranges for each of the eighteen questions, and six climate areas. The cut-offs represent individual item and climate area frequency distributions, and where the gap distances represent defined distribution percentiles, e.g., Narrow (<25%ile), Moderate (25-75%ile), and Wide (>75%ile). This report compares the current (2009) results with those from the 2005 study. It reflects “current” versus “ideal” respondent perceptions of the organizational climate. This will determine if the overall organizational climate, by agency, has changed over time and, if so, whether or not the differences are significant. The term “statistically significant,” used throughout this report, demonstrates that the difference in a compared statistic is beyond chance occurrence, e.g., within a .05 margin of error. The gap margins reported throughout this study represent the difference in gap distances between 2005
I. Introduction
X O
Figure 1
2
and 2009, for each question, and for each climate area. A positive sign represents a wide gap disparity, whereas, a negative sign represents a narrow disparity. Tabulations: The Department of the Attorney General received 208 out of 309 (67.3%) completed surveys, and subsequently entered the responses into a statistical database. Depicted below are the following agency response rates:
• Probation – 58.8% (106/180) • Parole – 66.7% (22/33) • PSD – 87.0% (40/46) • Intake Service Center – 76.5% (26/34)
This study also includes summarized descriptions of staff respondents, based on Job Classification and Judicial Circuits. Of the 192 respondents from Probation, Parole, ISC, and PSD, the following represent the number and percent of classified staff: correctional officers (100, 53%); senior-level officers (41, 21%); supervisors (35, 18%); social service assistants (12, 6%); and specialists (4, 2%). Additionally, the staff responded from the following individual counties: City and County of Honolulu (111, 59.0%); Maui County (35, 18.6%); Hawaii County (31, 16.5%); and Kauai County (11, 5.8%). • The gap distance between the ideal and current organizational climate has narrowed from 2005 to
2009 (Table 5): 1. In the 2005 study, the difference in total responses between the current organizational
climates versus what they ideally seek in the future, revealed an 8.7 average gap distance. This represented a statistically significant increase of +1.4 points in the gap distance, from the 7.3 gap distance established in the 2002 study.
2. The 2009 study, for all questions combined, reveals an average gap distance of 6.8,
representing a narrowing gap margin (-1.9 pts.) from 2005 to 2009. 3. An examination of individual agencies showed that the organizational climates of Probation
(Table 6) and Parole (Table 7) have made statistically significant improvements since 2009. The results for PSD and ISC indicate marginal, statistically insignificant change from 2005 to 2009.
• A sizeable gap distance exists between how respondents currently see their organization’s climate,
and how they want it to be, ideally, in the future. Standardized distributions from previous studies (see methodology) classifiy gap distances in the narrow, moderate, and wide ranges, and are depicted in Appendix B. The following three organizational climate areas were problematic in 2009, due to higher than average gap distances (Figure 8):
1. Shared decision-making processes:
The respondents believed that decisions contribute “relatively little” to staff motivation. Policy (top-level) people make decisions, with some delegation. There are only occasional consultations with subordinates regarding work-related decisions. The average gap distance (7.7 pts.) between current beliefs and the ideal is at the moderate level.
II. Key Findings
3
2. Establish organizational goals: The respondents believed that management establishes organizational goals, with only some staff input invited. The average gap distance between current beliefs and the ideal is at the moderate level (7.6).
3. Maintain review and control functions:
The respondents believed that top-level administrators maintain organizational and decision-making control, although there is an informal organization that usually resists the formal one. The staff believed that management uses reward and punishment for the purposes of cost, productivity, and control. The average gap distance between current beliefs and the ideal is at the moderate level (6.9).
• In terms of agency type, the gap distance in 2009 between how respondents currently perceive
their organizational climate versus their ideal is highest for PSD (7.9) and lowest for Parole (5.6). The following numbered items rank the agencies by average gap distance for all questions combined in 2009 (Table 2):
1. Parole (Gap Distance =5.6) 2. Probation (Gap Distance=6.6) 3. Intake Service Centers (Gap Distance=7.0) 4. Department of Public Safety (Gap Distance=7.9)
• With respect to organizational climate areas of interest, by agencies in 2009 (Table 4); Parole had
the narrowest gap distance in the areas of Communication Processes (4.9), Managerial Leadership (5.0), and Managerial Decision Making (5.8). PSD had the widest gap distance in the areas of Managerial Decision Making (9.0), Staff Resistance to Goal Setting (8.6), Control (8.1), and Motivation (7.8).
• The 2009 study revealed narrowing gap distances over time for Probation (Table 6), Parole (Table
7), and PSD (Table 9). Parole had the largest decline in gap distance (11.7 to 5.6) from 2005 to 2009, followed by Probation (8.7 to 6.6), and PSD (8.1 to 7.9). On the other hand, the Intake Service Center (ISC) had an increase in the gap distance (6.5 to 7.0) from 2005 to 2009. Of the four agencies, only Parole and Probation experienced statistically significant declines in gap margins, from the 2005 to 2009 studies. These two agencies showed reduced disparities and a narrowing gap between the current and ideal perceptions of their respective agency’s organizational climate from 2005 to 2009. The following average gap margins (2009 Gap Distance – 2005 Gap Distance) are reported by agency:
1. Parole (Gap Margin= -6.1) 2. Probation (Gap Margin= -2.1) 3. Intake Service Centers (Gap Margin= +0.5) 4. Department of Public Safety (Gap Margin= -0.2)
• The following depicts the top three climate areas that reported the greatest narrowing of gap distances (reduced disparities) from 2005 to 2009 (Figure 8):
1. Increase Staff Motivation: Gap distance declined from 8.5 to 6.4 (gap margin=-2.1) 2. Maintain Review & Control Functions: Gap distance declined from 8.9 to 6.9 (gap
margin=-2.0) 3. Shared Decision-Making Processes: Gap distance declined from 9.7 to 7.7 (gap
margin=-2.0)
4
III. Summary of Results,
2009 Organizational Climate Survey
5
Leadership Questions, 2009 Survey
Figure 2: LEADERSHIP
15.9
17.3
16.8
9.4
12.4
10.4
0 5 10 15 20
3.) How often aresubordinates' ideas
sought and usedconstructively?
2.) How free do theyfeel to talk to
superiors about job?
1.) How muchconfidence and trust is
shown insubordinates?
Ideal Present ∆= Gap Distance
} ∆= 6.4
} ∆=6.5
} ∆= 4.9
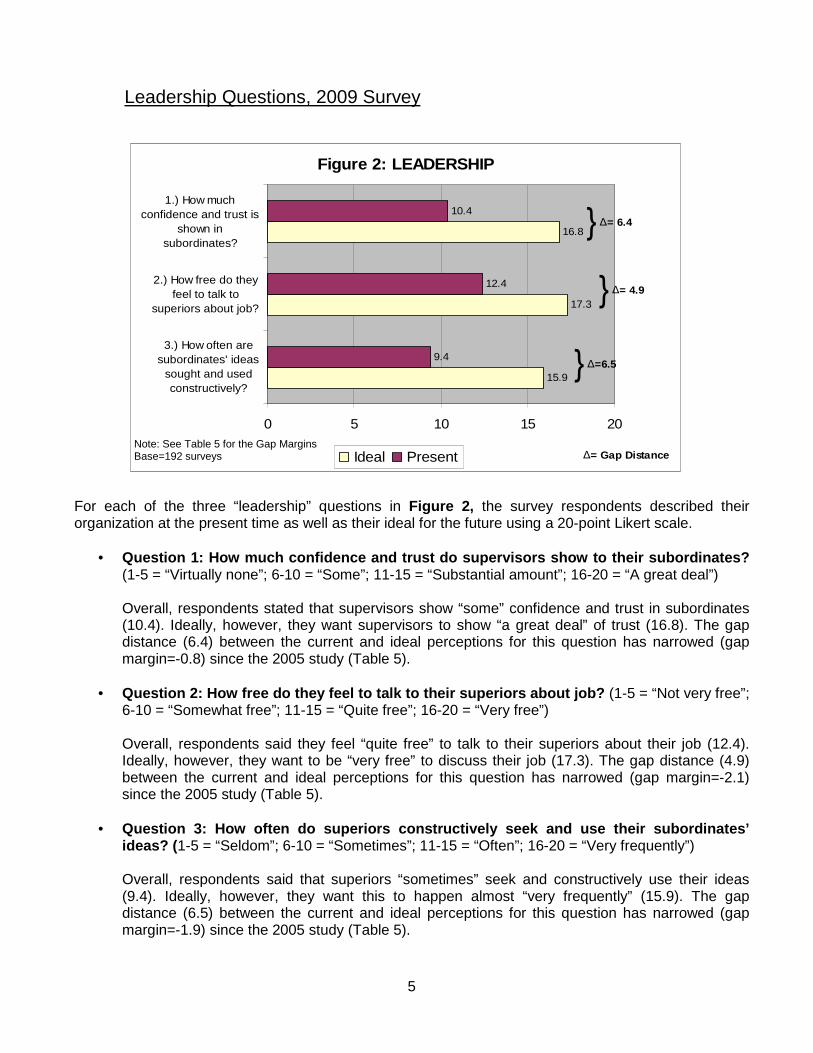
For each of the three “leadership” questions in Figure 2, the survey respondents described their organization at the present time as well as their ideal for the future using a 20-point Likert scale.
• Question 1: How much confidence and trust do superv isors show to their subordinates? (1-5 = “Virtually none”; 6-10 = “Some”; 11-15 = “Substantial amount”; 16-20 = “A great deal”)
Overall, respondents stated that supervisors show “some” confidence and trust in subordinates (10.4). Ideally, however, they want supervisors to show “a great deal” of trust (16.8). The gap distance (6.4) between the current and ideal perceptions for this question has narrowed (gap margin=-0.8) since the 2005 study (Table 5).
• Question 2: How free do they feel to talk to their superiors about job? (1-5 = “Not very free”;
6-10 = “Somewhat free”; 11-15 = “Quite free”; 16-20 = “Very free”)
Overall, respondents said they feel “quite free” to talk to their superiors about their job (12.4). Ideally, however, they want to be “very free” to discuss their job (17.3). The gap distance (4.9) between the current and ideal perceptions for this question has narrowed (gap margin=-2.1) since the 2005 study (Table 5).
• Question 3: How often do superiors constructiv ely seek and use their subordinates’ ideas? ( 1-5 = “Seldom”; 6-10 = “Sometimes”; 11-15 = “Often”; 16-20 = “Very frequently”)
Overall, respondents said that superiors “sometimes” seek and constructively use their ideas (9.4). Ideally, however, they want this to happen almost “very frequently” (15.9). The gap distance (6.5) between the current and ideal perceptions for this question has narrowed (gap margin=-1.9) since the 2005 study (Table 5).
Note: See Table 5 for the Gap Margins Base=192 surveys
6
Figure 3: MOTIVATION
17.2
16.6
16.2
10.7
9.8
10.4
0 5 10 15 20
6.) How muchcooperative teamwork
exists?
5.) Where isresponsibility felt for
achieving organization'sgoals?
4.) Is predominant usemade of fear, threats,punishment, rewards,
involvement?
Ideal Present ∆= Gap Distance
} ∆= 5.8
} ∆=6.8
} ∆=6.5
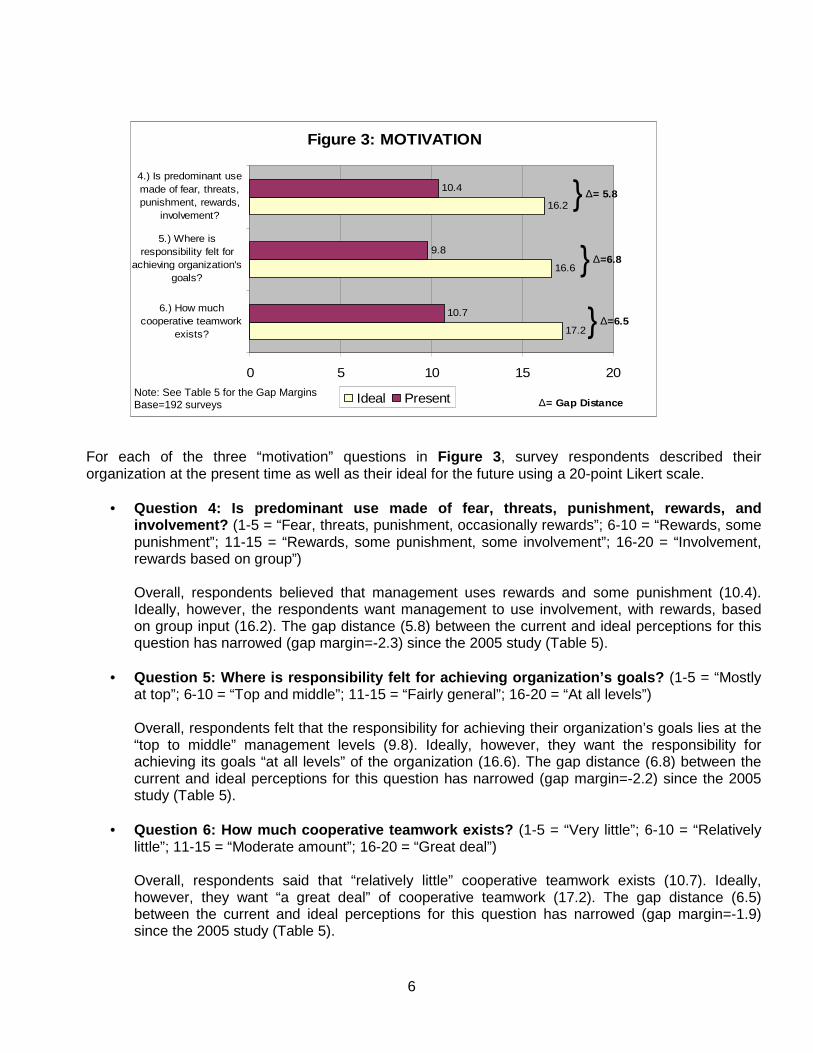
For each of the three “motivation” questions in Figure 3 , survey respondents described their organization at the present time as well as their ideal for the future using a 20-point Likert scale.
• Question 4: Is predominant use made of fear, threat s, punishment, rewards, and involvement? (1-5 = “Fear, threats, punishment, occasionally rewards”; 6-10 = “Rewards, some punishment”; 11-15 = “Rewards, some punishment, some involvement”; 16-20 = “Involvement, rewards based on group”)
Overall, respondents believed that management uses rewards and some punishment (10.4). Ideally, however, the respondents want management to use involvement, with rewards, based on group input (16.2). The gap distance (5.8) between the current and ideal perceptions for this question has narrowed (gap margin=-2.3) since the 2005 study (Table 5).
• Question 5: Where is responsibility felt for achiev ing organization’s goals? (1-5 = “Mostly at top”; 6-10 = “Top and middle”; 11-15 = “Fairly general”; 16-20 = “At all levels”)
Overall, respondents felt that the responsibility for achieving their organization’s goals lies at the “top to middle” management levels (9.8). Ideally, however, they want the responsibility for achieving its goals “at all levels” of the organization (16.6). The gap distance (6.8) between the current and ideal perceptions for this question has narrowed (gap margin=-2.2) since the 2005 study (Table 5).
• Question 6: How much cooperative teamwork exists? (1-5 = “Very little”; 6-10 = “Relatively little”; 11-15 = “Moderate amount”; 16-20 = “Great deal”)
Overall, respondents said that “relatively little” cooperative teamwork exists (10.7). Ideally, however, they want “a great deal” of cooperative teamwork (17.2). The gap distance (6.5) between the current and ideal perceptions for this question has narrowed (gap margin=-1.9) since the 2005 study (Table 5).
Note: See Table 5 for the Gap Margins Base=192 surveys

7
Communication Questions, 2009 Survey
Figure 4: COMMUNICATION
16.8
16.9
17.4
16.3
9.1
11.7
11.1
9.0
0 2 4 6 8 10 12 14 16 18 20
10.) How well do superiorsknow problems faced by
subordinates?
9.) How accurate is upwardcommunication?
8.) How is downwardcommunication accepted?
7.) What is the usualdirection of information flow?
Ideal Present∆= Gap Distance
} ∆= 7.3
} ∆= 6.3
} ∆= 5.2
} ∆= 7.7
Decisions Questions, 2009 Survey
For each of the four “communication” questions in Figure 4 , survey respondents described their organization at the present time as well as their ideal for the future using a 20-point Likert scale.
• Question 7: What is the usual direction of informat ion flow? (1-5 = “Downward”; 6-10 = “Mostly downward”; 11-15 = “Down and up”; 16-20 = “Down, up, and sideways”)
Overall, respondents believed that information flow is “mostly downward” (9.0). Ideally, however, staff want information to flow “down, up, and sideways” (16.3). The gap distance (7.3) between the current and ideal perceptions for this question has narrowed (gap margin=-2.0) since the 2005 study (Table 5).
• Question 8: How is downward communication accepted? (1-5 = “With suspicion”; 6-10 = “Possibly
with suspicion”; 11-15 = “With caution”; 16-20 = “With a receptive mind”)
Overall, respondents felt that downward communication is accepted “with caution” by staff (11.1). Ideally, however, they want staff to accept downward communication “with a receptive mind” (17.4). The gap distance (6.3) between the current and ideal perceptions for this question has narrowed (gap margin=-1.9) since the 2005 study (Table 5).
• Question 9: How accurate is upward communication? (1-5 = “Usually inaccurate”; 6-10 = “Often inaccurate”; 11-15 = “Often accurate”; 16-20 = “Almost always accurate”)
Overall, respondents believed that upward communication is “often accurate” (11.7). Ideally, however, they want “almost always accurate” upward communication (16.9). The gap distance (5.2) between the current and ideal perceptions for this question has narrowed (gap margin=-0.9) since the 2005 study (Table 5).
• Question 10: How well do superiors know problems fa ced by subordinates? (1-5 = “Not very well”; 6-10 = “Rather well”; 11-15 = “Quite well”; 16-20 = “Very well”)
Overall, respondents believed that superiors know, “rather well” (9.1), the problems faced by their subordinates. Ideally, however, they want superiors to know the problems “very well” (16.8). The gap distance (7.7) between the current and ideal perceptions for this question has narrowed (gap margin=-2.3) since the 2005 study (Table 5).
Note: See Table 5 for the Gap Margins Base=192 surveys
8
Decision Questions, 2009 Survey
Figure 5: DECISIONS
16.8
16.5
15.8
9.6
9.9
6.5
0 5 10 15 20
11.) What does decisionmaking process
contribute to motivation?
13.) Are subordinatesinvolved in decisionsrelated to their work?
12.) At what level aredecisions made?
Ideal Present ∆= Gap Distance
} ∆=9.3
} ∆= 6.6
} ∆= 7.2
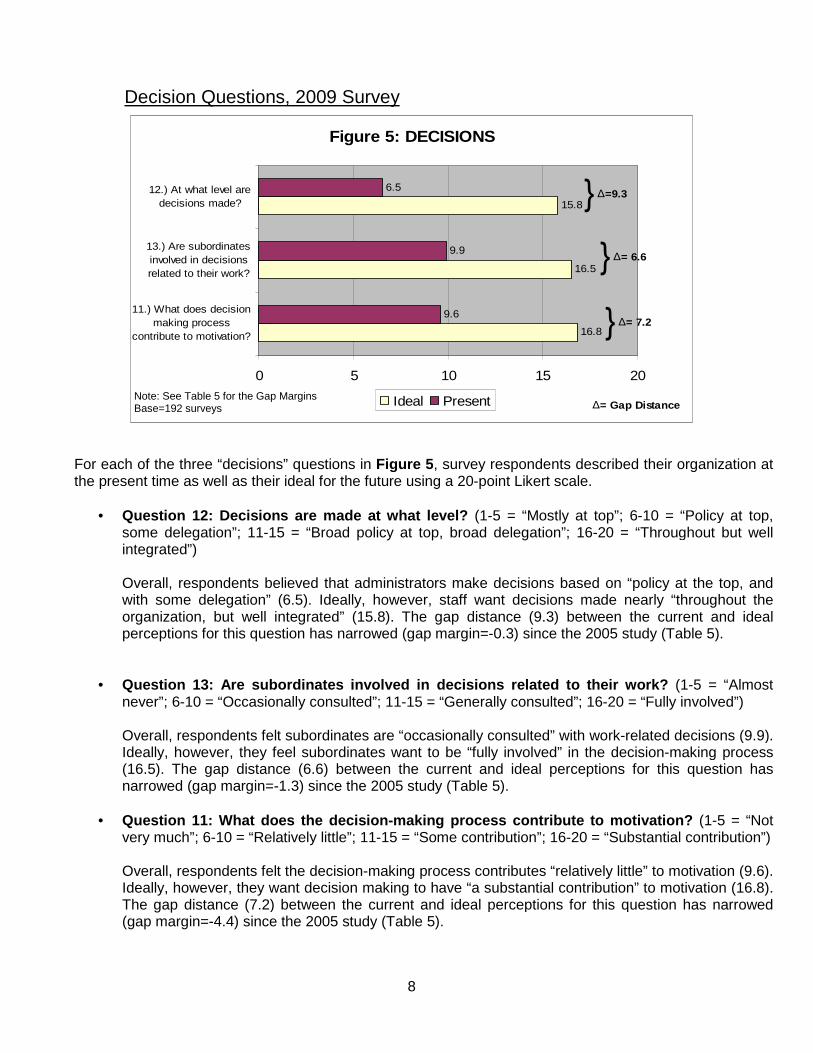
For each of the three “decisions” questions in Figure 5 , survey respondents described their organization at the present time as well as their ideal for the future using a 20-point Likert scale.
• Question 12: Decisions are made at what level? (1-5 = “Mostly at top”; 6-10 = “Policy at top, some delegation”; 11-15 = “Broad policy at top, broad delegation”; 16-20 = “Throughout but well integrated”)
Overall, respondents believed that administrators make decisions based on “policy at the top, and with some delegation” (6.5). Ideally, however, staff want decisions made nearly “throughout the organization, but well integrated” (15.8). The gap distance (9.3) between the current and ideal perceptions for this question has narrowed (gap margin=-0.3) since the 2005 study (Table 5).
• Question 13: Are subordinates involved in decisions related to their work? (1-5 = “Almost
never”; 6-10 = “Occasionally consulted”; 11-15 = “Generally consulted”; 16-20 = “Fully involved”)
Overall, respondents felt subordinates are “occasionally consulted” with work-related decisions (9.9). Ideally, however, they feel subordinates want to be “fully involved” in the decision-making process (16.5). The gap distance (6.6) between the current and ideal perceptions for this question has narrowed (gap margin=-1.3) since the 2005 study (Table 5).
• Question 11: What does the decision-making process contribute to motivation? (1-5 = “Not very much”; 6-10 = “Relatively little”; 11-15 = “Some contribution”; 16-20 = “Substantial contribution”)
Overall, respondents felt the decision-making process contributes “relatively little” to motivation (9.6). Ideally, however, they want decision making to have “a substantial contribution” to motivation (16.8). The gap distance (7.2) between the current and ideal perceptions for this question has narrowed (gap margin=-4.4) since the 2005 study (Table 5).
Note: See Table 5 for the Gap Margins Base=192 surveys

9
Goals Questions, 2009 Survey
Figure 6: GOALS
16.5
15.7
9.2
7.9
0 5 10 15 20
15.) How much covertresistance to goals is
present?
14.) How areorganizational goals
established?
Ideal Present∆= Gap Distance
} ∆= 7.8
} ∆= 7.3
For each of the two “goals” questions in Figure 6 , survey respondents described their organization at the present time as well as their ideal for the future using a 20-point Likert scale.
• Question 14: How are organizational goals establish ed? (1-5 = “Orders issued”; 6-10 = “Orders, some comments invited”; 11-15 = “After discussion, by orders”; 16-20 = “By group action (except in crisis”)
Overall, respondents stated that administration established organizational goals through “orders, with some comments invited” (7.9). Ideally, however, respondents appear to want administration to establish organizational goals “by group action” (15.7). The gap distance (7.8) between the current and ideal perceptions for this question has narrowed (gap margin=-2.5) since the 2005 study (Table 5).
• Question 15: How much covert resistance to goals is present? (1-5 = “Strong
resistance”; 6-10 = “Moderate resistance”; 11-15 = “Some resistance at times”; 16-20 = “Little or none”)
Overall, respondents believed that “moderate resistance” to goals is currently present (9.2). Ideally, however, they want “little or no” resistance (16.5). The gap distance (7.3) between the current and ideal perceptions for this question has narrowed (gap margin=-1.1) since the 2005 study (Table 5).
Note: See Table 5 for the Gap Margins Base=192 surveys

10
Control Questions, 2009 Survey Figure 7: CONTROL
16.9
16.6
15.4
9.6
10.4
8.2
0 5 10 15 20
18.) What are cost,productivity and othercontrol data used for?
17.) Is there an informalorganization resisting the
formal one?
16.) How concentratedare review and control
functions?
Ideal Present ∆= Gap Distance
} ∆= 7.2
} ∆= 6.2
} ∆= 7.3
For each of the three “control” questions in Figure 7 , survey respondents described their organization at the present time as well as their ideal for the future using a 20-point Likert scale.
• Question 16: How concentrated are review and contro l functions? (1-5 = “Very highly at top”; 6-10 = “Quite highly at top”; 11-15 = “Delegation to lower levels”; 16-20 = “Widely shared”)
Overall, respondents stated that review and control functions are concentrated “quite highly at the top” of the organization (8.2). Ideally, however, they want control functions to be “widely shared” (15.4). The gap distance (7.2) between the current and ideal perceptions for this question has narrowed (gap margin=-2.5) since the 2005 study (Table 5).
• Question 17: Is there an informal organization resi sting the formal one? (1-5 = “Yes”; 6-10 = “Usually”; 11-15 = “Sometimes”; 16-20 = “No, same goals as formal”)
Overall, respondents believed there is “usually” an informal organization resisting the formal one (10.4). Ideally, however, they do not want an informal organization (16.6). The gap distance (6.2) between the current and ideal perceptions for this question has narrowed (gap margin=-1.9) since the 2005 study (Table 5).
• Question 18: What are cost, productivity, and other control data used for? (1-5 = “Policing, punishment”; 6-10 = “Reward and punishment”; 11-15 = “Reward, some self guidance”; 16-20 = “Self-guidance, problem solving”)
Overall, respondents believed that administration used cost, productivity, and other control data for “reward and punishment” purposes (9.6). Ideally, however, they want the data for self-guidance and problem-solving purposes (16.9). The gap distance (7.3) between the current and ideal perceptions for this question has narrowed (gap margin=-1.7) since the 2005 study (Table 5).
Note: See Table 5 for the Gap Margins Base=192 surveys
11
Table 1: Ranking of Questions by Gap Distance, 2009 Survey Table 1: Ranked Items, by Gap Distance, 2009 Survey
Question Area Present IdealPresent--Ideal
(Description)
Gap Distance
2.) How free do subordinates feel talking to superiors about their work? Leadership 12.4 17.3 Quite free -- Very free 4.9
9.) How accurate is upward communication? Communication 11.7 16.9Often accurate -- Almost
always accurate 5.24.) Do superiors primarily use (1)fear, (2)threats, (3)punishment, (4)rewards, (5)involvement? Motivation 10.4 16.2
Some punishment/rewards -- rewards/involvment 5.8
17.) Is there an informal organization resisting the formal one? Control 10.4 16.6Usually -- No, same goals
as formal 6.2
8.) How is downward communication accepted? Communication 11.1 17.4With Caution -- With a
receptive mind 6.31.) How much confidence and trust is shown in subordinates? Leadership 10.4 16.8 Some -- A great deal 6.43.) How often are subordinates' ideas sought and used constructively? Leadership 9.4 15.9 Sometimes -- Often 6.56.) How much cooperative teamwork exists? Motivation 10.7 17.2 Relatively little -- Great deal 6.5
13.) Are subordinates involved in decisions related to their work? Decisions 9.9 16.5Occationally consulted --
Fully involved 6.6
5.) Where is the responsibility felt for achieving the organization's goals? Motivation 9.8 16.6Top and middle -- At all
levels 6.8
11.) What does decision making process contribute to motivation? Decisions 9.7 16.8Relatively little -- Substantial
contribution 7.1
16.) How concentrated are review and control functions? Control 8.2 15.4Quite highly at top --
Deelegation to lower levels 7.2
18.) What are cost, productivity and other control data used for? Control 9.6 16.9
Reward and punishment -- Self-guidance, problem-
solving 7.3
7.) What is the usual direction of information flow? Communication 9.0 16.3Mostly downward -- Down,
up and sideways 7.3
15.) How much covert resistance to goals is present? Goals 9.2 16.5Moderate resistance -- Little
or none 7.310.) How well do superiors know the problems faced by subordinates? Communication 9.1 16.8 Rather well -- Very well 7.7
14.) How are organizational goals established? Goals 7.9 15.7
Orders, some comments invited -- After discussion,
by orders 7.8
12.) At what level are decisions made? Decisions 6.5 15.8
Policy at top, some delegation -- Broad policy at
top, broad delegation 9.3Total Average for all Questions: 9.7 16.5 6.8
Base=192 surveys
Table 2: Gap Distances by Agency, 2009 Survey
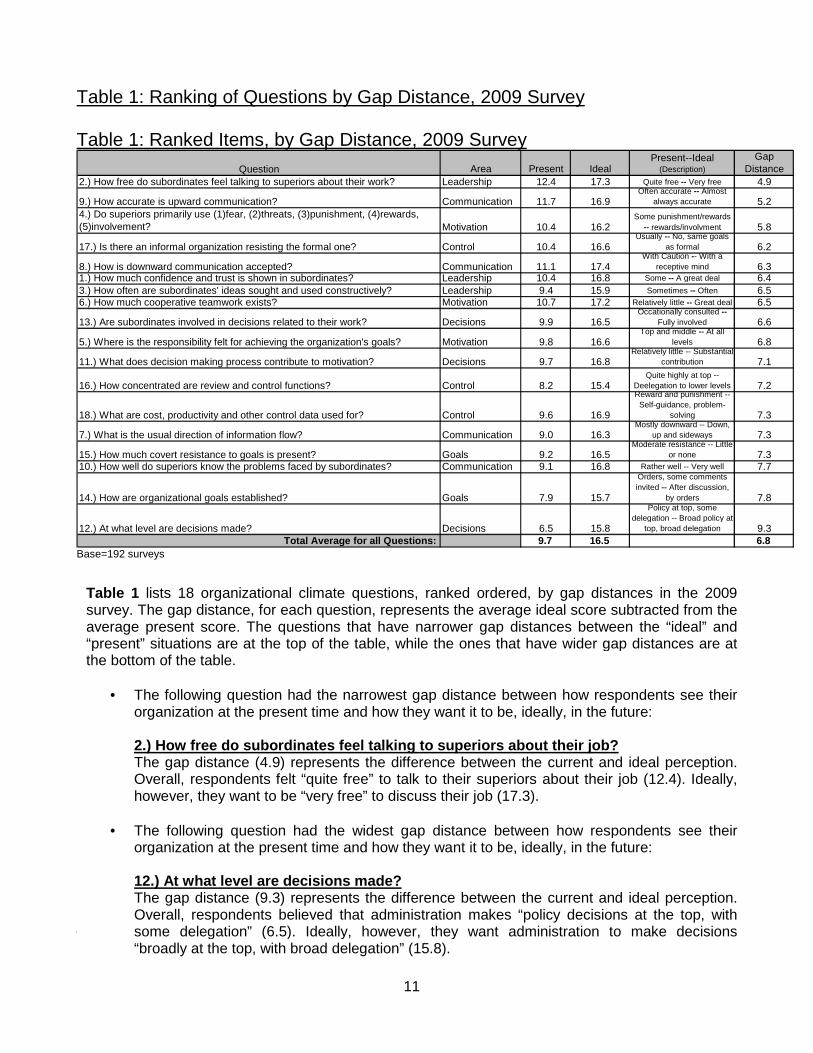
Table 1 lists 18 organizational climate questions, ranked ordered, by gap distances in the 2009 survey. The gap distance, for each question, represents the average ideal score subtracted from the average present score. The questions that have narrower gap distances between the “ideal” and “present” situations are at the top of the table, while the ones that have wider gap distances are at the bottom of the table.
• The following question had the narrowest gap distance between how respondents see their organization at the present time and how they want it to be, ideally, in the future:
2.) How free do subordinates feel talking to superi ors about their job? The gap distance (4.9) represents the difference between the current and ideal perception. Overall, respondents felt “quite free” to talk to their superiors about their job (12.4). Ideally, however, they want to be “very free” to discuss their job (17.3).
• The following question had the widest gap distance between how respondents see their
organization at the present time and how they want it to be, ideally, in the future:
12.) At what level are decisions made? The gap distance (9.3) represents the difference between the current and ideal perception. Overall, respondents believed that administration makes “policy decisions at the top, with some delegation” (6.5). Ideally, however, they want administration to make decisions “broadly at the top, with broad delegation” (15.8).
12
Table 2: Question Items, by Classification, 2009 Survey Question Probation Parole ISC PSD
1.) How much confidence and trust is shown in subordinates? 6.1 5.7 6.2 7.92.) How free do they feel to talk to superiors about job? 5.0 4.2 5.7 4.63.) How often are subordinates' ideas sought and used constructively? 6.6 4.9* 6.8 7.44.) Is predominant use made of fear, threats, punishment, rewards, involvement? 5.0 5.3 5.5 8.05.) Where is responsibility felt for achieving organization's goals? 6.4 6.9 6.7 8.16.) How much cooperative teamwork exists? 6.0 7.1 6.5 7.37.) What is the usual direction of information flow? 7.7 3.5* 7.6 8.28.) How is downward communication accepted? 5.9 6.3 6.9 6.79.) How accurate is upward communication? 5.5 3.9* 4.5 5.710.) How well do superiors know problems faced by subordinates? 7.1 5.7 8.2 9.611.) What does decision making process contribute to motivation? 6.9 5.3 7.0 8.812.) At what level are decisions made? 9.4 7.2 9.7 10.113.) Are subordinates involved in decisions related to their work? 6.3 5.0 6.9 8.114.) How are organizational goals established? 7.8 6.3 7.4 9.215.) How much covert resistance to goals is present? 7.3 5.5 7.6 8.016.) How concentrated are review and control functions? 7.0 5.5 8.0 8.317.) Is there an informal organization resisting the formal one? 5.6 6.3 6.6 7.418.) What are cost, productivity and other control data used for? 6.9 5.6 8.5 8.6
Total Average for all Questions: 6.6 5.6 7.0 7.9Note: All gap distances in individual classification groups are in the "moderate" gap distance range, except when indicated by an asterik.
*Narrow range (<25%ile) Second Note: Gaps calculated for each question subtracts the total average score for “present” from the total average score for “ideal.”
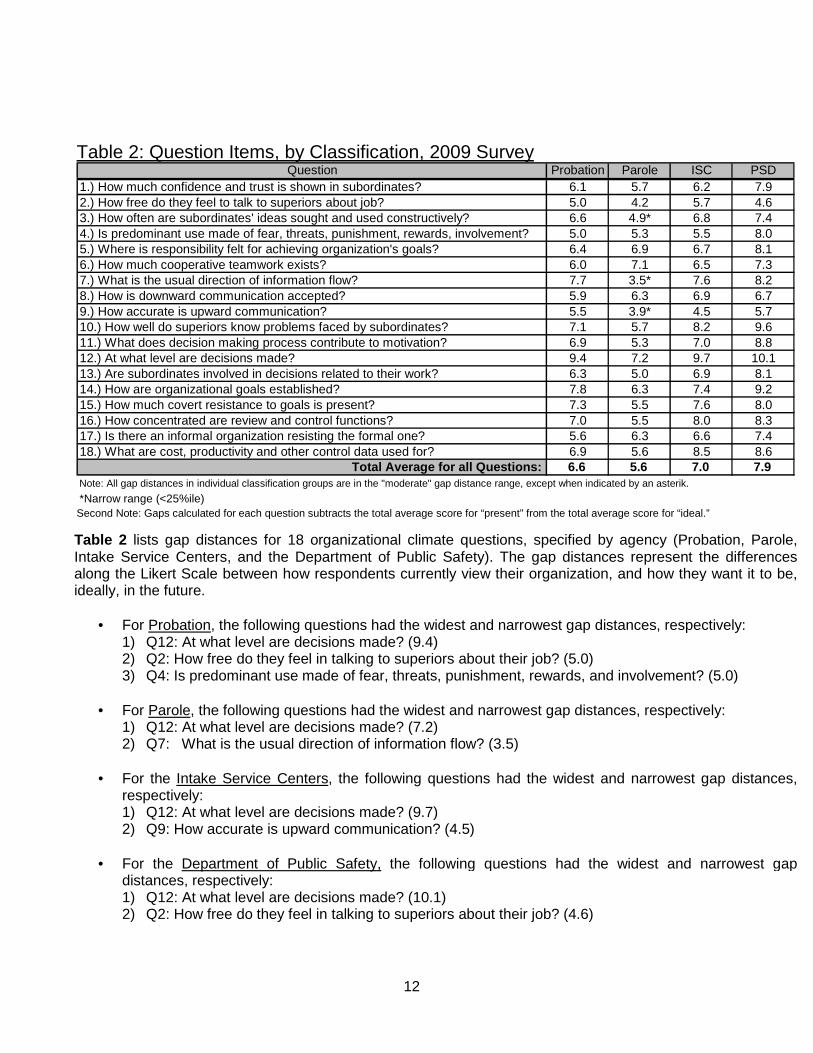
Table 2 lists gap distances for 18 organizational climate questions, specified by agency (Probation, Parole, Intake Service Centers, and the Department of Public Safety). The gap distances represent the differences along the Likert Scale between how respondents currently view their organization, and how they want it to be, ideally, in the future.
• For Probation, the following questions had the widest and narrowest gap distances, respectively: 1) Q12: At what level are decisions made? (9.4) 2) Q2: How free do they feel in talking to superiors about their job? (5.0) 3) Q4: Is predominant use made of fear, threats, punishment, rewards, and involvement? (5.0)
• For Parole, the following questions had the widest and narrowest gap distances, respectively: 1) Q12: At what level are decisions made? (7.2) 2) Q7: What is the usual direction of information flow? (3.5)
• For the Intake Service Centers, the following questions had the widest and narrowest gap distances,
respectively: 1) Q12: At what level are decisions made? (9.7) 2) Q9: How accurate is upward communication? (4.5)
• For the Department of Public Safety, the following questions had the widest and narrowest gap
distances, respectively: 1) Q12: At what level are decisions made? (10.1) 2) Q2: How free do they feel in talking to superiors about their job? (4.6)

13
Table 3: Gap Distances, by Classification, 2009 Survey
Question OfficerSenior Officer Supervisor SSA
1.) How much confidence and trust is shown in subordinates? 6.5 6.6 0.2* 5.42.) How free do they feel to talk to superiors about job? 5.1 4.6 -0.1* 5.83.) How often are subordinates' ideas sought and used constructively? 7.2 6.6 -0.1* 6.94.) Is predominant use made of fear, threats, punishment, rewards, involvement? 5.1 6.0 0.6* 5.35.) Where is responsibility felt for achieving organization's goals? 7.0 7.2 5.9 6.26.) How much cooperative teamwork exists? 6.3 6.8 6.5 6.27.) What is the usual direction of information flow? 7.3 7.3 7.1 7.08.) How is downward communication accepted? 6.2 6.2 6.3 6.49.) How accurate is upward communication? 5.3 5.2 4.1 5.210.) How well do superiors know problems faced by subordinates? 8.0 7.6 8.2 6.411.) What does decision making process contribute to motivation? 7.6 6.8 7.1 6.612.) At what level are decisions made? 9.4 9.6 9.8 8.613.) Are subordinates involved in decisions related to their work? 5.3 7.3 6.3 6.614.) How are organizational goals established? 8.2 8.4 6.2 6.615.) How much covert resistance to goals is present? 6.4 7.5 5.9 7.516.) How concentrated are review and control functions? 7.7 7.5 5.4 6.917.) Is there an informal organization resisting the formal one? 6.0 5.9 5.1 6.918.) What are cost, productivity and other control data used for? 7.3 7.5 7.5 6.6
Total Average for all Questions: 6.8 6.9 5.1 6.5Note: All gap distances in individual classification groups are in the "moderate" gap distance range, except when indicated by an asterik.
*The gap distance for Supervisors, who answered questions 1 thru 4, is classifed in the "narrow" gap distance range. Table 3 lists gap distances for 18 organizational climate questions specified by position classification (Officer, Senior Officer, Supervisor, and SSA (Social Services Aide). The gap distances represent the differences along the Likert Scale between how respondents presently see their organization, and how they want it to be, ideally, in the future.
• For Officers, the following questions had the widest and narrowest gap distance, respectively: 1) Q12: At what level are decisions made? (9.4) 2) Q2: How free do they feel in talking to superiors about their job? (5.1) 3) Q4: Is predominant use made of fear, threats, punishment, rewards, and involvement? (5.1)
• For Senior Officers, the following questions had the widest and narrowest gap distance,
respectively: 1) Q12: At what level are decisions made? (9.6) 2) Q2: How free do they feel in talking to superiors about their job? (4.6)
• For Supervisors, the following questions had the widest and narrowest gap distance,
respectively: 1) Q12: At what level are decisions made? (9.8) 2) Q2: How free do they feel in talking to superiors about their job? (-0.1) 3) Q3: How often are subordinates’ ideas sought and used constructively: (-0.1)
• For SSAs, the following questions had the widest and narrowest gap distance, respectively:
1) Q12: At what level are decisions made? (8.6) 2) Q9: How accurate is upward communication? (5.2)
14
IV. Comparison of 2002, 2005, and 2009
Organizational Climate Survey Results, by Agency
15
Gap Distances, by Organizational Climate Areas, 2005 & 2009 Surveys
Figure 8: Organizational Climate Areas, by Gap Distances and Margins
7.5
8.5
8.4
9.7
9.4
8.9
5.9
6.4
6.6
7.7
7.6
6.9
0 2 4 6 8 10 12
Leadership
Motivation
Communication
Decisions
Goals
Control
Gap Distance
2005 2009
2005: n=148
2009: n=208 ∆= Gap Margin
} ∆= -1.8
} ∆= -2.0
} ∆= -2.0
} ∆= -1.8
} ∆= -2.1
} ∆= -1.6
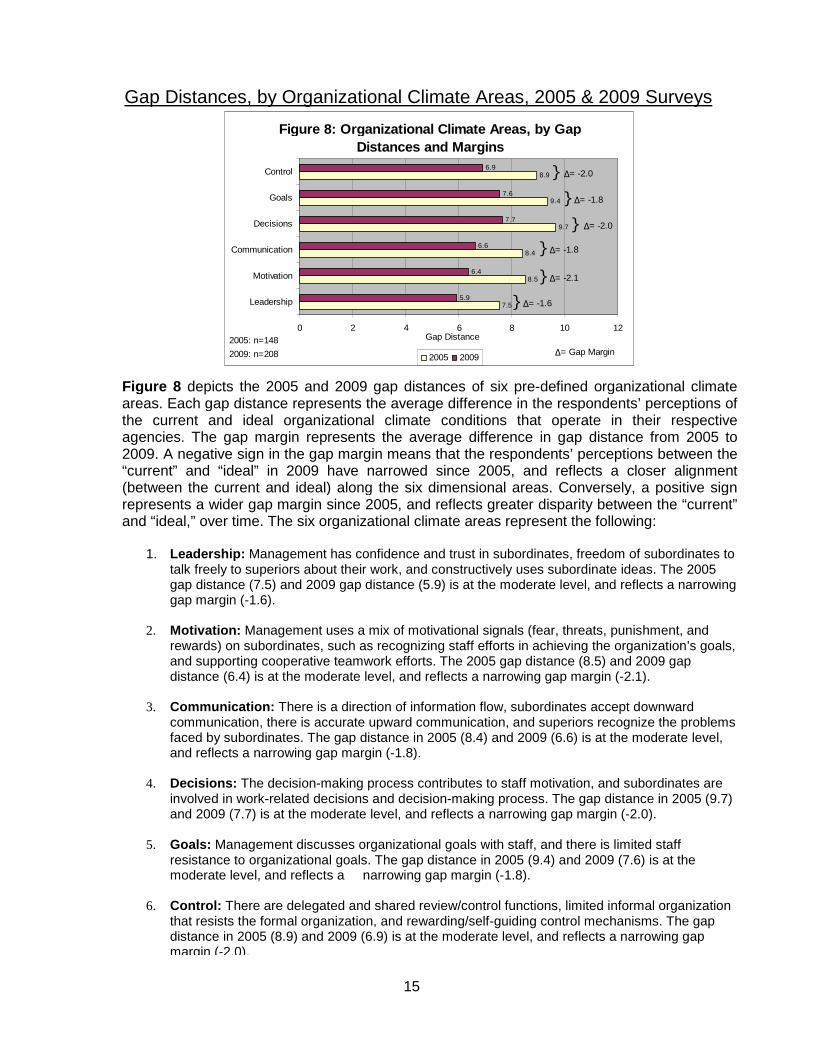
Figure 8 depicts the 2005 and 2009 gap distances of six pre-defined organizational climate areas. Each gap distance represents the average difference in the respondents’ perceptions of the current and ideal organizational climate conditions that operate in their respective agencies. The gap margin represents the average difference in gap distance from 2005 to 2009. A negative sign in the gap margin means that the respondents’ perceptions between the “current” and “ideal” in 2009 have narrowed since 2005, and reflects a closer alignment (between the current and ideal) along the six dimensional areas. Conversely, a positive sign represents a wider gap margin since 2005, and reflects greater disparity between the “current” and “ideal,” over time. The six organizational climate areas represent the following:
1. Leadership: Management has confidence and trust in subordinates, freedom of subordinates to talk freely to superiors about their work, and constructively uses subordinate ideas. The 2005 gap distance (7.5) and 2009 gap distance (5.9) is at the moderate level, and reflects a narrowing gap margin (-1.6).
2. Motivation: Management uses a mix of motivational signals (fear, threats, punishment, and
rewards) on subordinates, such as recognizing staff efforts in achieving the organization’s goals, and supporting cooperative teamwork efforts. The 2005 gap distance (8.5) and 2009 gap distance (6.4) is at the moderate level, and reflects a narrowing gap margin (-2.1).
3. Communication: There is a direction of information flow, subordinates accept downward
communication, there is accurate upward communication, and superiors recognize the problems faced by subordinates. The gap distance in 2005 (8.4) and 2009 (6.6) is at the moderate level, and reflects a narrowing gap margin (-1.8).
4. Decisions: The decision-making process contributes to staff motivation, and subordinates are
involved in work-related decisions and decision-making process. The gap distance in 2005 (9.7) and 2009 (7.7) is at the moderate level, and reflects a narrowing gap margin (-2.0).
5. Goals: Management discusses organizational goals with staff, and there is limited staff
resistance to organizational goals. The gap distance in 2005 (9.4) and 2009 (7.6) is at the moderate level, and reflects a narrowing gap margin (-1.8).
6. Control: There are delegated and shared review/control functions, limited informal organization
that resists the formal organization, and rewarding/self-guiding control mechanisms. The gap distance in 2005 (8.9) and 2009 (6.9) is at the moderate level, and reflects a narrowing gap margin (-2.0).
16
Table 4: Gap Distance, by Organizational Climate Areas and Agency, 2005 & 2009 Surveys
2005 (n=85)
2009 (n=104)
2005 (n=17)
2009 (n=22)
2005 (n=20)
2009 (n=26)
2005 (n=17)
2009 (n=40)
Leadership 7.3 5.9 11.5 5.0 5.8 6.2 6.9 6.6Motivation 8.2 5.8 12.3 6.5 5.9 6.2 9.7 7.8Communication 8.5 6.6 11.4 4.9 6.8 6.8 7.6 7.5Decisions 10.0 7.5 11.3 5.8 7.4 7.9 9.0 9.0Goals 9.6 7.6 11.3 5.9 6.7 7.5 9.1 8.6Control 8.9 6.5 12.2 5.8 6.2 7.7 9.0 8.1
Probation Parole Intake Service Center Dept. of Public Safety
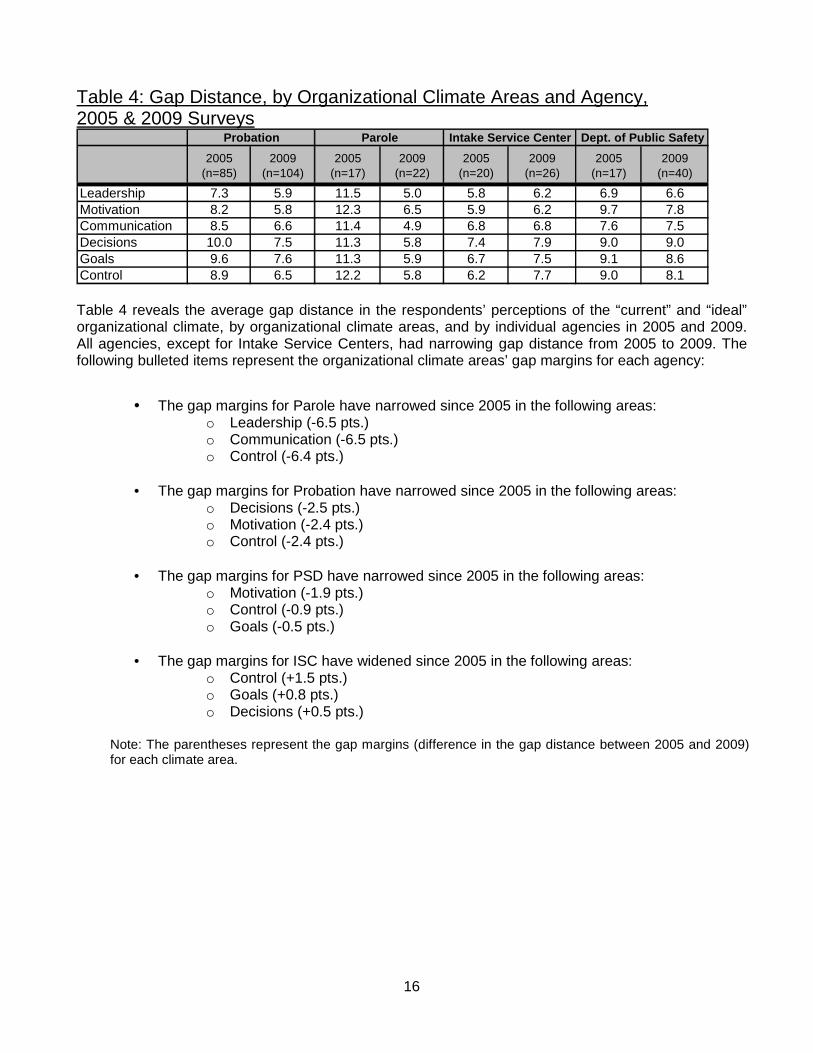
Table 4 reveals the average gap distance in the respondents’ perceptions of the “current” and “ideal” organizational climate, by organizational climate areas, and by individual agencies in 2005 and 2009. All agencies, except for Intake Service Centers, had narrowing gap distance from 2005 to 2009. The following bulleted items represent the organizational climate areas’ gap margins for each agency:
• The gap margins for Parole have narrowed since 2005 in the following areas: o Leadership (-6.5 pts.) o Communication (-6.5 pts.) o Control (-6.4 pts.)
• The gap margins for Probation have narrowed since 2005 in the following areas: o Decisions (-2.5 pts.) o Motivation (-2.4 pts.) o Control (-2.4 pts.)
• The gap margins for PSD have narrowed since 2005 in the following areas:
o Motivation (-1.9 pts.) o Control (-0.9 pts.) o Goals (-0.5 pts.)
• The gap margins for ISC have widened since 2005 in the following areas:
o Control (+1.5 pts.) o Goals (+0.8 pts.) o Decisions (+0.5 pts.)
Note: The parentheses represent the gap margins (difference in the gap distance between 2005 and 2009) for each climate area.
17
Table 5: Comparisons of Gap Distances and Margins - All Agencies (2002-2009)
Question
2002 Gap
Distance
2005 Gap
Distance
2009 Gap
Distance
2005 Gap Margin
2009 Gap Margin
1.) How much confidence and trust is shown in subordinates? 5.9 7.2 6.4 1.3 -0.82.) How free do they feel to talk to superiors about job? 6.1 7.0 4.9 0.9 -2.13.) How often are subordinates' ideas sought and used constructively? 7.3 8.4 6.5 1.1 -1.94.) Is predominant use made of fear, threats, punishment, rewards, involvement? 6.8 8.1 5.8 1.3 -2.35.) Where is responsibility felt for achieving organization's goals? 7.5 9.0 6.8 1.5 -2.26.) How much cooperative teamwork exists? 6.7 8.4 6.5 1.7 -1.97.) What is the usual direction of information flow? 7.3 9.3 7.3 2.0 -2.08.) How is downward communication accepted? 6.4 8.2 6.3 1.8 -1.99.) How accurate is upward communication? 5.1 6.1 5.2 1.0 -0.910.) How well do superiors know problems faced by subordinates? 8.4 10.0 7.7 1.6 -2.311.) At what level are decisions made? 9.9 11.5 7.1 1.6 -4.412.) Are subordinates involved in decisions related to their work? 7.3 9.6 9.3 2.3 -0.313.) What does decision making process contribute to motivation? 7.3 7.9 6.6 0.6 -1.314.) How are organizational goals established? 8.8 10.3 7.8 1.5 -2.515.) How much covert resistance to goals is present? 7.6 8.4 7.3 0.8 -1.116.) How concentrated are review and control functions? 8.1 9.7 7.2 1.6 -2.517.) Is there an informal organization resisting the formal one? 6.9 8.1 6.2 1.2 -1.918.) What are cost, productivity and other control data used for? 7.4 9.0 7.3 1.6 -1.7
Base: 107 148 192Total Average Gap for all Questions: 7.3 8.7 6.8 1.4 -1.9
*The difference is statistically significant. t (311) =-4.64; p<.001 Note: Gaps calculated for each question subtracts the total average score for “current” from the total average score for “ideal.”
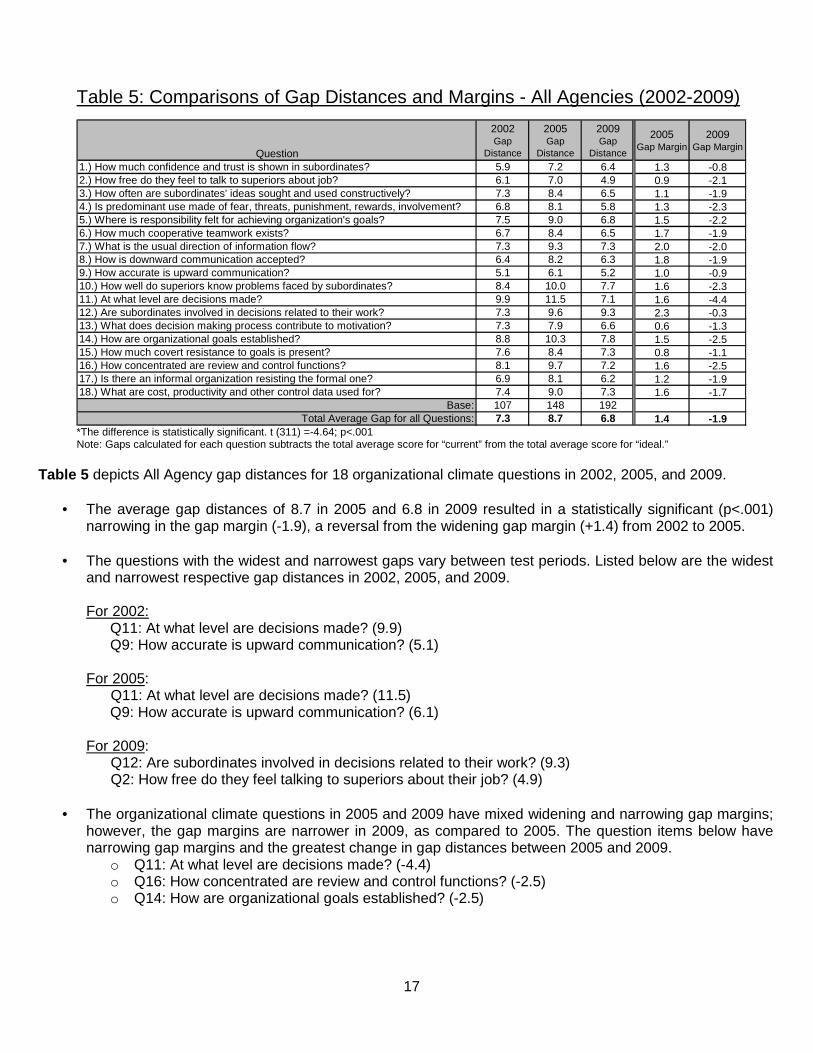
Table 5 depicts All Agency gap distances for 18 organizational climate questions in 2002, 2005, and 2009.
• The average gap distances of 8.7 in 2005 and 6.8 in 2009 resulted in a statistically significant (p<.001) narrowing in the gap margin (-1.9), a reversal from the widening gap margin (+1.4) from 2002 to 2005.
• The questions with the widest and narrowest gaps vary between test periods. Listed below are the widest
and narrowest respective gap distances in 2002, 2005, and 2009.
For 2002: Q11: At what level are decisions made? (9.9) Q9: How accurate is upward communication? (5.1)
For 2005: Q11: At what level are decisions made? (11.5)
Q9: How accurate is upward communication? (6.1)
For 2009: Q12: Are subordinates involved in decisions related to their work? (9.3) Q2: How free do they feel talking to superiors about their job? (4.9)
• The organizational climate questions in 2005 and 2009 have mixed widening and narrowing gap margins;
however, the gap margins are narrower in 2009, as compared to 2005. The question items below have narrowing gap margins and the greatest change in gap distances between 2005 and 2009.
o Q11: At what level are decisions made? (-4.4) o Q16: How concentrated are review and control functions? (-2.5) o Q14: How are organizational goals established? (-2.5)
18
Table 6: Comparisons of Gap Distances and Margins - Probation (2002-2009)
Question
2002 Gap
Distance
2005 Gap
Distance
2009 Gap
Distance
2005 Gap Margin
2009 Gap Margin
1.) How much confidence and trust is shown in subordinates? 5.4 6.8 6.1 1.4 -0.72.) How free do they feel to talk to superiors about job? 6.8 6.6 5.0 -0.2 -1.63.) How often are subordinates' ideas sought and used constructively? 7.9 8.6 6.6 0.7 -2.04.) Is predominant use made of fear, threats, punishment, rewards, involvement? 6.3 7.5 5.0 1.2 -2.55.) Where is responsibility felt for achieving organization's goals? 7.2 8.9 6.4 1.7 -2.56.) How much cooperative teamwork exists? 6.6 8.2 6.0 1.6 -2.27.) What is the usual direction of information flow? 8.1 9.8 7.7 1.7 -2.18.) How is downward communication accepted? 6.6 8.2 5.9 1.6 -2.39.) How accurate is upward communication? 5.7 6.2 5.5 0.5 -0.710.) How well do superiors know problems faced by subordinates? 8.4 9.6 7.1 1.2 -2.511.) At what level are decisions made? 10.9 11.7 6.9 0.8 -4.812.) Are subordinates involved in decisions related to their work? 7.9 10.1 9.4 2.2 -0.713.) What does decision making process contribute to motivation? 7.2 8.2 6.3 1.0 -1.914.) How are organizational goals established? 9.3 10.6 7.8 1.3 -2.815.) How much covert resistance to goals is present? 7.5 8.5 7.3 1.0 -1.216.) How concentrated are review and control functions? 8.0 10.1 7.0 2.1 -3.117.) Is there an informal organization resisting the formal one? 6.9 7.7 5.6 0.8 -2.118.) What are cost, productivity and other control data used for? 7.3 9.0 6.9 1.7 -2.1
Base: 38 85 104 47Total Average Gap for all Questions: 7.4 8.7 6.6 1.3 -2.1
*The difference is statistically significant. t (174) =-3.75; p<.001 Note: Gap distance for each question subtracts the total average score for “current” from the total average score for “ideal.”
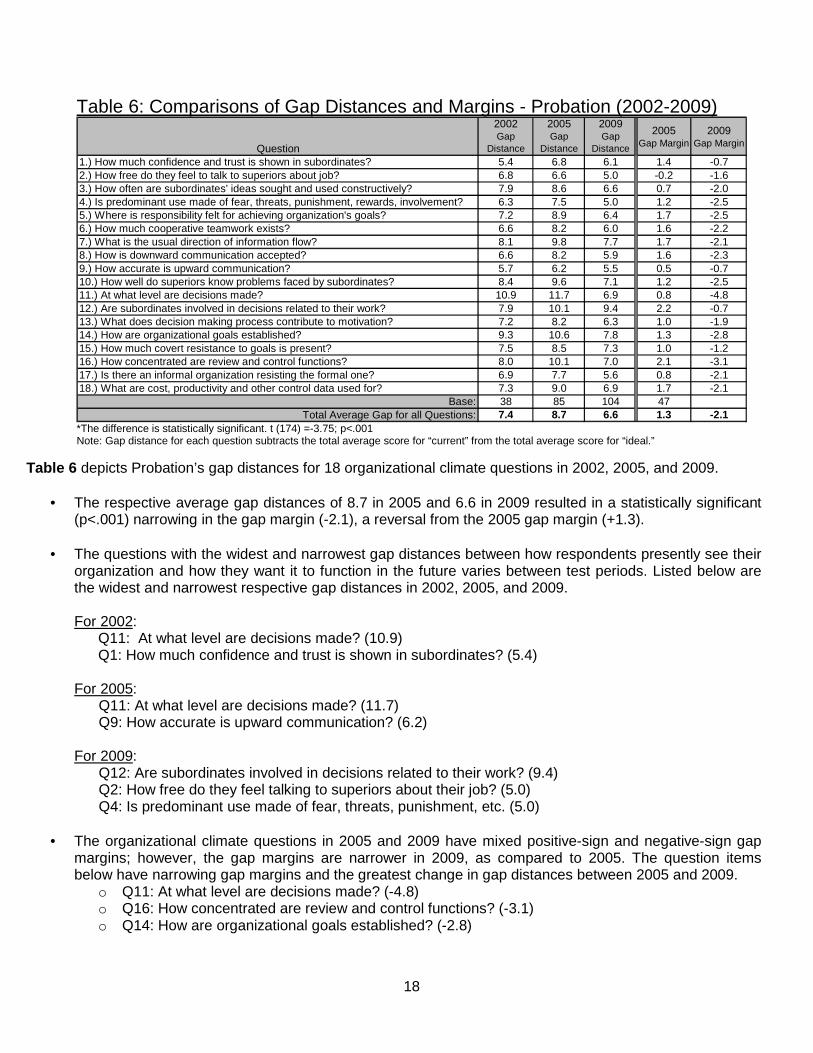
Table 6 depicts Probation’s gap distances for 18 organizational climate questions in 2002, 2005, and 2009.
• The respective average gap distances of 8.7 in 2005 and 6.6 in 2009 resulted in a statistically significant (p<.001) narrowing in the gap margin (-2.1), a reversal from the 2005 gap margin (+1.3).
• The questions with the widest and narrowest gap distances between how respondents presently see their
organization and how they want it to function in the future varies between test periods. Listed below are the widest and narrowest respective gap distances in 2002, 2005, and 2009.
For 2002:
Q11: At what level are decisions made? (10.9) Q1: How much confidence and trust is shown in subordinates? (5.4)
For 2005: Q11: At what level are decisions made? (11.7) Q9: How accurate is upward communication? (6.2) For 2009: Q12: Are subordinates involved in decisions related to their work? (9.4) Q2: How free do they feel talking to superiors about their job? (5.0) Q4: Is predominant use made of fear, threats, punishment, etc. (5.0)
• The organizational climate questions in 2005 and 2009 have mixed positive-sign and negative-sign gap margins; however, the gap margins are narrower in 2009, as compared to 2005. The question items below have narrowing gap margins and the greatest change in gap distances between 2005 and 2009.
o Q11: At what level are decisions made? (-4.8) o Q16: How concentrated are review and control functions? (-3.1) o Q14: How are organizational goals established? (-2.8)

19
Table 7: Comparisons of Gap Distances and Margins for Parole (2005-2009)
Question
2005 Gap
Distance
2009 Gap
Distance
2009 Gap Margin
1.) How much confidence and trust is shown in subordinates? 11.8 5.7 -6.12.) How free do they feel to talk to superiors about job? 11.5 4.2 -7.33.) How often are subordinates' ideas sought and used constructively? 11.2 4.9 -6.34.) Is predominant use made of fear, threats, punishment, rewards, involvement? 12.6 5.3 -7.35.) Where is responsibility felt for achieving organization's goals? 12.0 6.9 -5.16.) How much cooperative teamwork exists? 12.2 7.1 -5.17.) What is the usual direction of information flow? 11.0 3.5 -7.58.) How is downward communication accepted? 12.5 6.3 -6.29.) How accurate is upward communication? 7.9 3.9 -4.010.) How well do superiors know problems faced by subordinates? 14.0 5.7 -8.311.) At what level are decisions made? 13.2 5.3 -7.912.) Are subordinates involved in decisions related to their work? 11.5 7.2 -4.313.) What does decision making process contribute to motivation? 9.3 5.0 -4.314.) How are organizational goals established? 12.3 6.3 -6.015.) How much covert resistance to goals is present? 10.2 5.5 -4.716.) How concentrated are review and control functions? 11.1 5.5 -5.617.) Is there an informal organization resisting the formal one? 14.1 6.3 -7.818.) What are cost, productivity and other control data used for? 11.5 5.6 -5.9
Base: 17 22Total Average Gap for all Questions: 11.7 5.6 -6.1
*The difference is statistically significant. t (32) =-5.57; p<.001 Note: Gap distance for each question subtracts the total average score for “current” from the total average score for “ideal.”
Table 7 depicts Parole’s gap distances for 18 organizational climate questions in 2005 and 2009.
• The respective average gap distances of 11.7 in 2005 and 5.6 in 2009 resulted in a statistically significant (p<.001) narrowing in the gap margin (-6.1).
• The questions with the widest and narrowest gap distances between how respondents presently see
their organization and how they want it to function in the future varies between test periods. Listed below are the two questions that have the widest and narrowest respective gap distances from 2005 to 2009.
For 2005: Q17. Is there an informal organization resisting the formal one? (14.1) Q9: How accurate is upward communication? (7.9) For 2009: Q12. Are subordinates involved in decisions related to their work? (7.2) Q7: What is the usual direction of information flow? (3.5)
• The organizational climate questions in 2009 have all negative-sign gap margins. The question
items below have narrowing gap margins and the greatest change in gap distances between 2005 and 2009.
o Q10: How well do superiors know problems faced by subordinates? (-8.3) o Q11: At what level are decisions made? (-7.9) o Q17: Is there an informal organization resisting the formal one? (-7.8)
20
Table 8: Comparisons of Gap Distances and Margins for ISCs (2005-2009)
Question
2005 Gap
Distance
2009 Gap
Distance
2009 Gap Margin
1.) How much confidence and trust is shown in subordinates? 5.1 6.2 1.12.) How free do they feel to talk to superiors about job? 5.6 5.7 0.13.) How often are subordinates' ideas sought and used constructively? 6.8 6.8 0.04.) Is predominant use made of fear, threats, punishment, rewards, involvement? 5.9 5.5 -0.45.) Where is responsibility felt for achieving organization's goals? 6.4 6.7 0.36.) How much cooperative teamwork exists? 5.5 6.5 1.07.) What is the usual direction of information flow? 6.1 7.6 1.58.) How is downward communication accepted? 6.3 6.9 0.69.) How accurate is upward communication? 5.6 4.5 -1.110.) How well do superiors know problems faced by subordinates? 9.1 8.2 -0.911.) At what level are decisions made? 9.8 7.0 -2.812.) Are subordinates involved in decisions related to their work? 7.0 9.7 2.713.) What does decision making process contribute to motivation? 5.4 6.9 1.514.) How are organizational goals established? 7.1 7.4 0.315.) How much covert resistance to goals is present? 6.3 7.6 1.316.) How concentrated are review and control functions? 6.6 8.0 1.417.) Is there an informal organization resisting the formal one? 5.7 6.6 0.918.) What are cost, productivity and other control data used for? 6.2 8.5 2.3
Base: 20 26Total Average Gap for all Questions: 6.5 7.0 0.5
*No statistical difference found. Note: Gap distance for each question subtracts the total average score for “current” from the total average score for “ideal.”
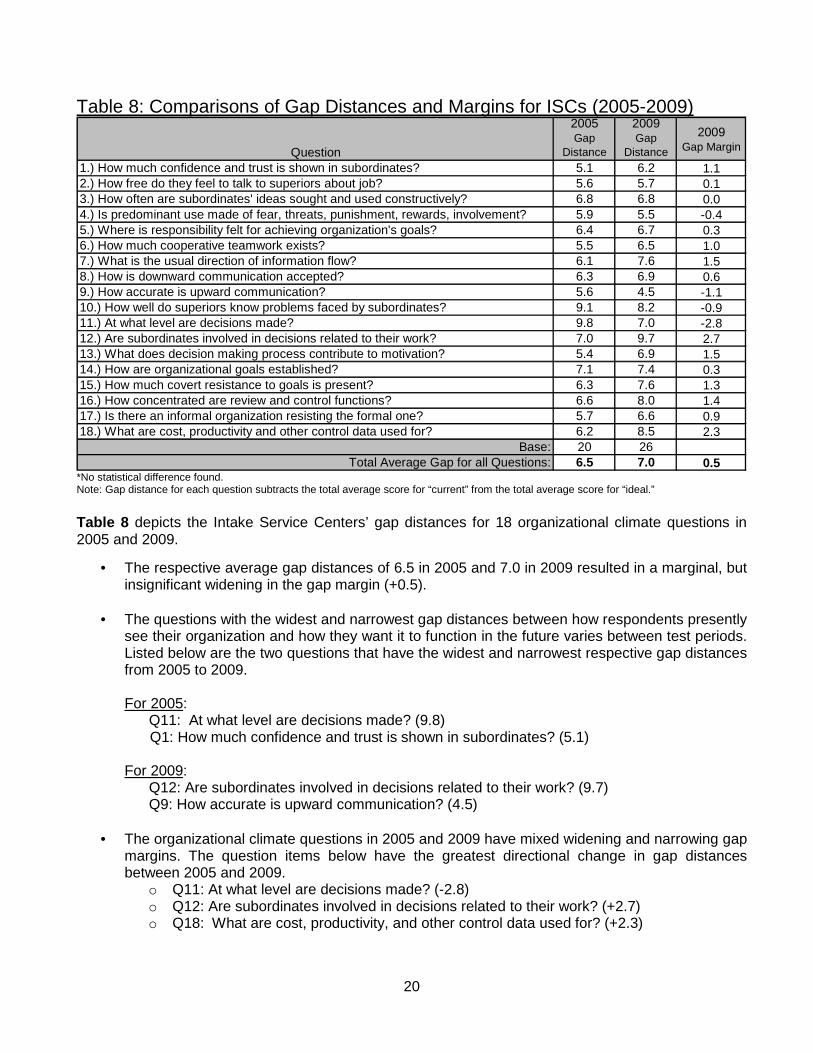
Table 8 depicts the Intake Service Centers’ gap distances for 18 organizational climate questions in 2005 and 2009.
• The respective average gap distances of 6.5 in 2005 and 7.0 in 2009 resulted in a marginal, but insignificant widening in the gap margin (+0.5).
• The questions with the widest and narrowest gap distances between how respondents presently
see their organization and how they want it to function in the future varies between test periods. Listed below are the two questions that have the widest and narrowest respective gap distances from 2005 to 2009. For 2005: Q11: At what level are decisions made? (9.8)
Q1: How much confidence and trust is shown in subordinates? (5.1) For 2009: Q12: Are subordinates involved in decisions related to their work? (9.7) Q9: How accurate is upward communication? (4.5)
• The organizational climate questions in 2005 and 2009 have mixed widening and narrowing gap margins. The question items below have the greatest directional change in gap distances between 2005 and 2009.
o Q11: At what level are decisions made? (-2.8) o Q12: Are subordinates involved in decisions related to their work? (+2.7) o Q18: What are cost, productivity, and other control data used for? (+2.3)
21
Table 9: Comparisons of Gap Sizes for the Department of Public Safety (2002-2009)
Question
2002 Gap
Distance
2005 Gap
Distance
2009 Gap
Distance
2005 Gap Margin
2009 Gap Margin
1.) How much confidence and trust is shown in subordinates? 6.3 7.2 7.9 0.9 0.72.) How free do they feel to talk to superiors about job? 5.7 6.0 4.6 0.3 -1.43.) How often are subordinates' ideas sought and used constructively? 7.4 7.6 7.4 0.2 -0.24.) Is predominant use made of fear, threats, punishment, rewards, involvement? 7.3 8.7 8.0 1.4 -0.75.) Where is responsibility felt for achieving organization's goals? 8.4 9.4 8.1 1.0 -1.36.) How much cooperative teamwork exists? 7.2 9.4 7.3 2.2 -2.17.) What is the usual direction of information flow? 7.4 8.0 8.2 0.6 0.28.) How is downward communication accepted? 6.8 6.9 6.7 0.1 -0.29.) How accurate is upward communication? 5.2 4.6 5.7 -0.6 1.110.) How well do superiors know problems faced by subordinates? 8.8 9.1 9.6 0.3 0.511.) At what level are decisions made? 9.7 10.6 8.8 0.9 -1.812.) Are subordinates involved in decisions related to their work? 6.9 8.3 10.1 1.4 1.813.) What does decision making process contribute to motivation? 7.4 6.9 8.1 -0.5 1.214.) How are organizational goals established? 8.6 9.3 9.2 0.7 -0.115.) How much covert resistance to goals is present? 7.9 7.9 8.0 0.0 0.116.) How concentrated are review and control functions? 8.6 10.0 8.3 1.4 -1.717.) Is there an informal organization resisting the formal one? 7.7 7.0 7.4 -0.7 0.418.) What are cost, productivity and other control data used for? 7.8 9.3 8.6 1.5 -0.7
Base: 58.0 17.0 40.0Total Average Gap for all Questions: 7.5 8.1 7.9 0.6 -0.2
*No statistical difference found. Note: Gap distance for each question subtracts the total average score for “current” from the total average score for “ideal.”
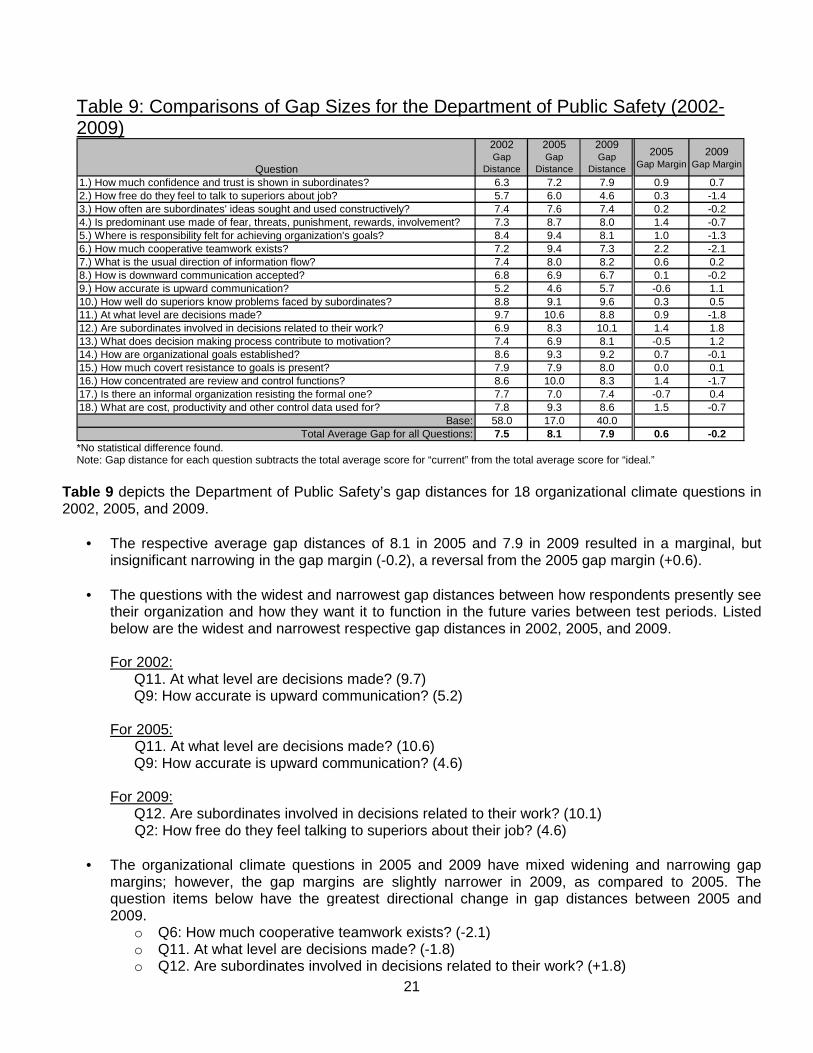
Table 9 depicts the Department of Public Safety’s gap distances for 18 organizational climate questions in 2002, 2005, and 2009.
• The respective average gap distances of 8.1 in 2005 and 7.9 in 2009 resulted in a marginal, but insignificant narrowing in the gap margin (-0.2), a reversal from the 2005 gap margin (+0.6).
• The questions with the widest and narrowest gap distances between how respondents presently see
their organization and how they want it to function in the future varies between test periods. Listed below are the widest and narrowest respective gap distances in 2002, 2005, and 2009. For 2002:
Q11. At what level are decisions made? (9.7) Q9: How accurate is upward communication? (5.2)
For 2005: Q11. At what level are decisions made? (10.6)
Q9: How accurate is upward communication? (4.6) For 2009:
Q12. Are subordinates involved in decisions related to their work? (10.1) Q2: How free do they feel talking to superiors about their job? (4.6)
• The organizational climate questions in 2005 and 2009 have mixed widening and narrowing gap margins; however, the gap margins are slightly narrower in 2009, as compared to 2005. The question items below have the greatest directional change in gap distances between 2005 and 2009.
o Q6: How much cooperative teamwork exists? (-2.1) o Q11. At what level are decisions made? (-1.8) o Q12. Are subordinates involved in decisions related to their work? (+1.8)

22
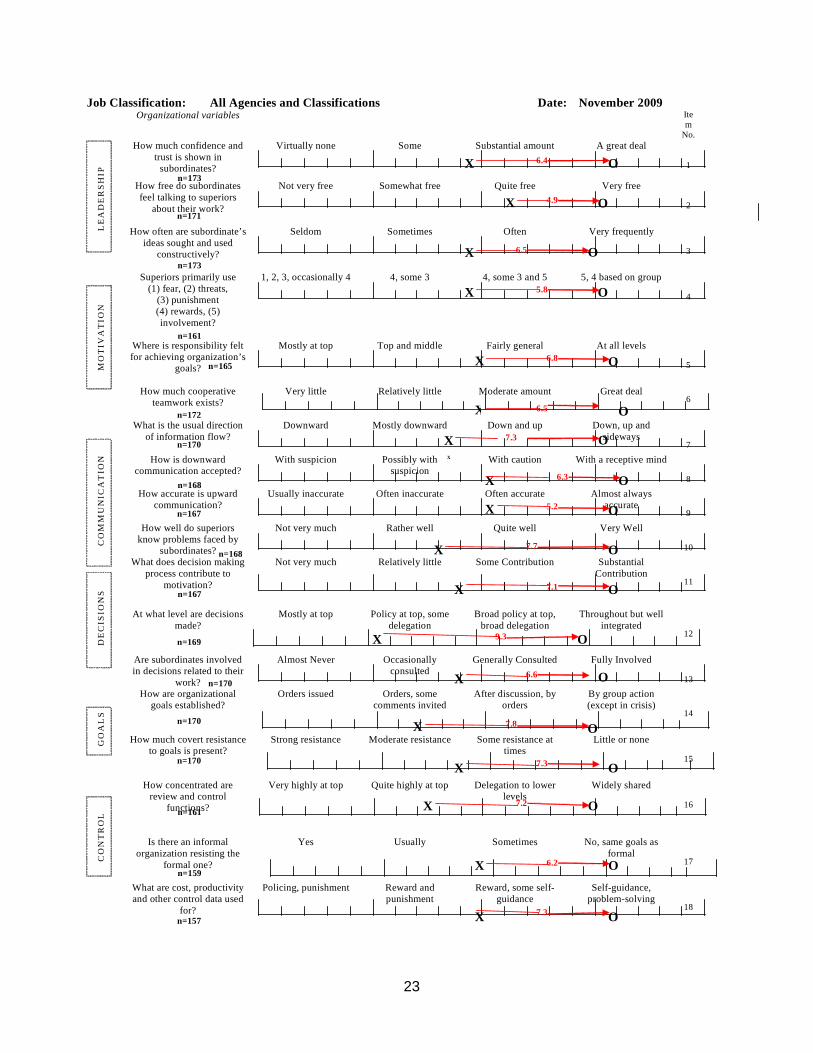
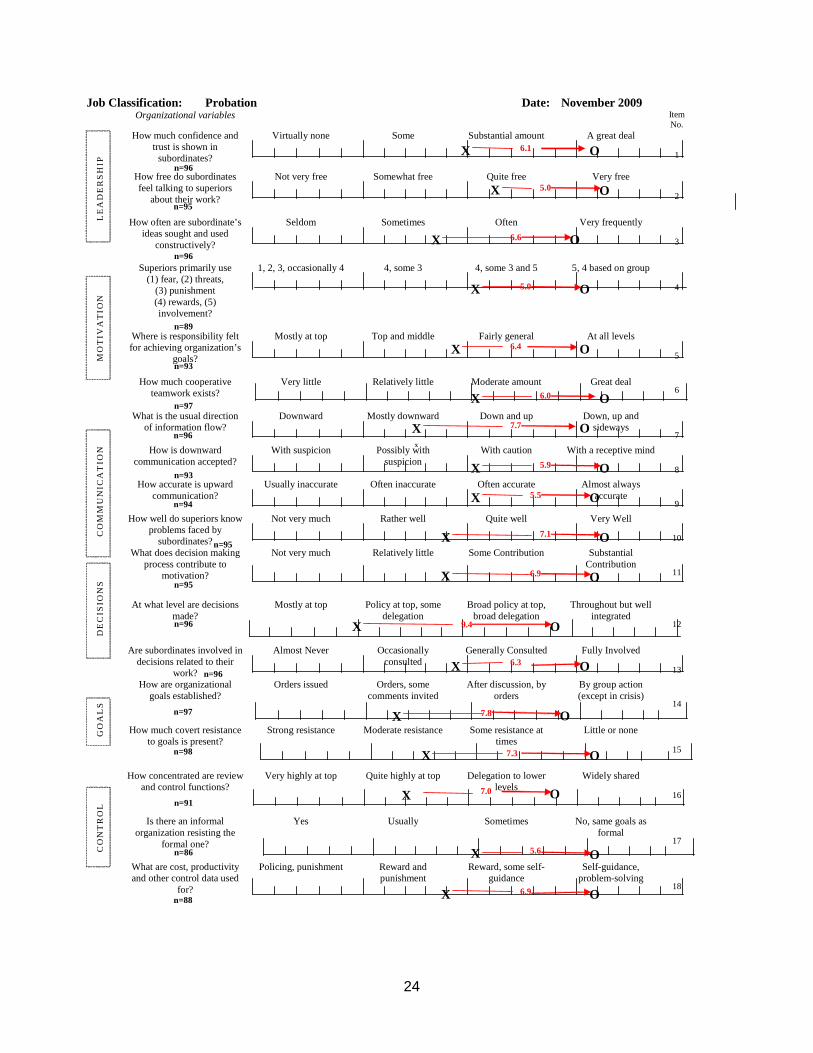
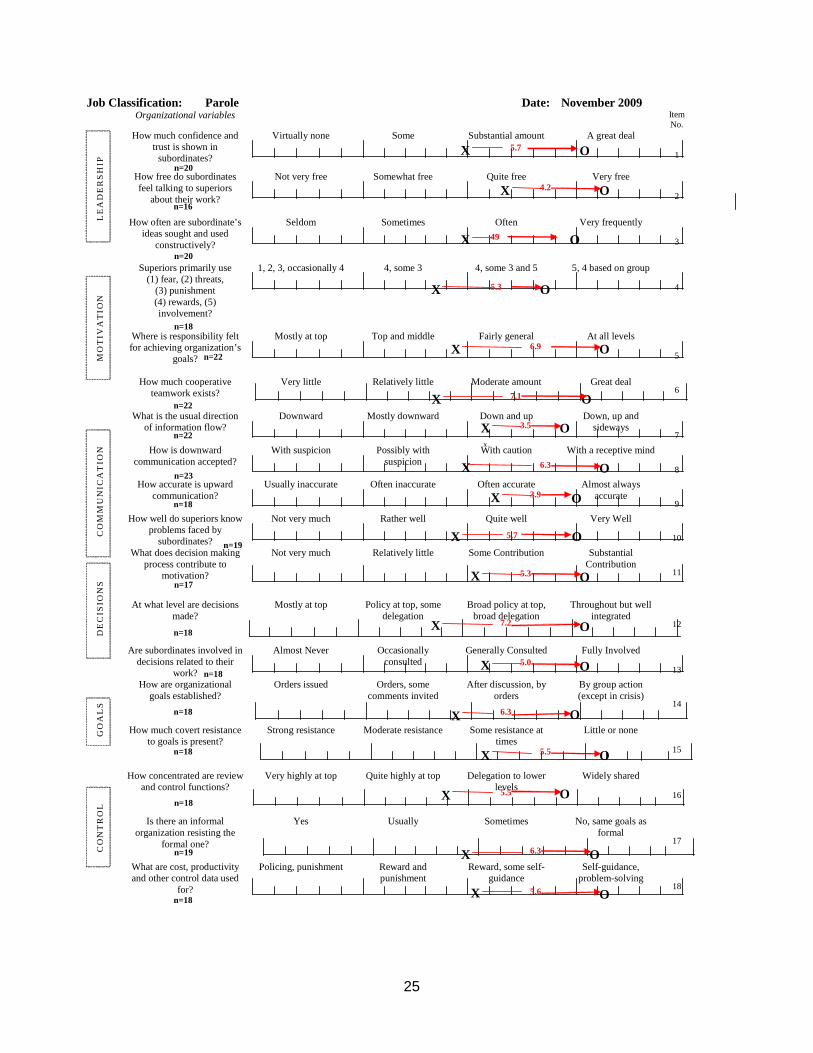
V. Appendix A: Survey Instrument Results, by Agency
23
Job Classification: All Agencies and Classifications Date: November 2009 Organizational variables Ite
m No.
How much confidence and trust is shown in
subordinates?
Virtually none Some Substantial amount A great deal 1
How free do subordinates feel talking to superiors
about their work?
Not very free Somewhat free Quite free Very free 2
How often are subordinate’s ideas sought and used
constructively?
Seldom Sometimes Often Very frequently 3
Superiors primarily use (1) fear, (2) threats,
(3) punishment (4) rewards, (5) involvement?
1, 2, 3, occasionally 4 4, some 3 4, some 3 and 5 5, 4 based on group 4
Where is responsibility felt for achieving organization’s
goals?
Mostly at top Top and middle Fairly general At all levels 5
How much cooperative
teamwork exists?
Very little
Relatively little
Moderate amount
Great deal
6
What is the usual direction of information flow?
Downward Mostly downward Down and up Down, up and sideways
7
How is downward communication accepted?
With suspicion Possibly with suspicion
With caution With a receptive mind 8
How accurate is upward communication?
Usually inaccurate Often inaccurate Often accurate Almost always accurate
9
How well do superiors know problems faced by
subordinates?
Not very much Rather well Quite well Very Well
10
What does decision making process contribute to
motivation?
Not very much
Relatively little Some Contribution Substantial Contribution
11
At what level are decisions made?
Mostly at top Policy at top, some delegation
Broad policy at top, broad delegation
Throughout but well integrated
12
Are subordinates involved in decisions related to their
work?
Almost Never Occasionally consulted
Generally Consulted Fully Involved
13
How are organizational goals established?
Orders issued Orders, some comments invited
After discussion, by orders
By group action (except in crisis)
14
How much covert resistance to goals is present?
Strong resistance Moderate resistance Some resistance at times
Little or none
15
How concentrated are review and control
functions?
Very highly at top Quite highly at top Delegation to lower levels
Widely shared
16
Is there an informal organization resisting the
formal one?
Yes Usually Sometimes No, same goals as formal
17
What are cost, productivity and other control data used
for?
Policing, punishment Reward and punishment
Reward, some self-guidance
Self-guidance, problem-solving
18
LE
AD
ER
SH
IP
MO
TIV
AT
ION
C
OM
MU
NIC
AT
ION
D
EC
ISIO
NS
G
OA
LS
C
ON
TR
OL
X
O
X
X
X
X X
X
X
X
X
X
X
X
X
X
X
X
X
O
O
O
O
O
O
O
O
O
O
O
O
O
O
O
O
O
X
6.4
6.2
4.9
6.5
5.8
7.3
7.3
7.8
6.6
9.3
7.1
7.7
5.2
6.3
6.83
6.5
7.3
7.2
n=173
n=172
n=165
n=161
n=171
n=173
n=170
n=168
n=167
n=168
n=167
n=169
n=170
n=170
n=170
n=161
n=159
n=157
24
Job Classification: Probation Date: November 2009 Organizational variables Item
No. How much confidence and
trust is shown in subordinates?
Virtually none Some Substantial amount A great deal 1
How free do subordinates feel talking to superiors
about their work?
Not very free Somewhat free Quite free Very free 2
How often are subordinate’s ideas sought and used
constructively?
Seldom Sometimes Often Very frequently 3
Superiors primarily use (1) fear, (2) threats,
(3) punishment (4) rewards, (5) involvement?
1, 2, 3, occasionally 4 4, some 3 4, some 3 and 5 5, 4 based on group 4
Where is responsibility felt for achieving organization’s
goals?
Mostly at top Top and middle Fairly general At all levels 5
How much cooperative
teamwork exists?
Very little
Relatively little
Moderate amount
Great deal
6
What is the usual direction of information flow?
Downward Mostly downward Down and up Down, up and sideways
7
How is downward communication accepted?
With suspicion Possibly with suspicion
With caution With a receptive mind 8
How accurate is upward communication?
Usually inaccurate Often inaccurate Often accurate Almost always accurate
9
How well do superiors know problems faced by
subordinates?
Not very much Rather well Quite well Very Well
10
What does decision making process contribute to
motivation?
Not very much
Relatively little Some Contribution Substantial Contribution
11
At what level are decisions made?
Mostly at top Policy at top, some delegation
Broad policy at top, broad delegation
Throughout but well integrated
12
Are subordinates involved in decisions related to their
work?
Almost Never Occasionally consulted
Generally Consulted Fully Involved
13
How are organizational goals established?
Orders issued Orders, some comments invited
After discussion, by orders
By group action (except in crisis)
14
How much covert resistance to goals is present?
Strong resistance Moderate resistance Some resistance at times
Little or none
15
How concentrated are review and control functions?
Very highly at top Quite highly at top Delegation to lower levels
Widely shared
16
Is there an informal organization resisting the
formal one?
Yes Usually Sometimes No, same goals as formal
17
What are cost, productivity and other control data used
for?
Policing, punishment Reward and punishment
Reward, some self-guidance
Self-guidance, problem-solving
18
LE
AD
ER
SH
IP
MO
TIV
AT
ION
C
OM
MU
NIC
AT
ION
D
EC
ISIO
NS
G
OA
LS
C
ON
TR
OL
X
O
X
X
X
X X
X
X
X
X
X
X
X
X
X
X
X
X
O
O
O
O
O
O
O
O
O
O
O
O
O
O
O
O
O
X
6.1
5.6
5.0
6.6
5.0
7.3
6.9
7.8
6.3
9.4
6.9
7.1
5.5
5.9
6.4
6.0
7.7
7.0
n=96
n=97
n=93
n=89
n=95
n=96
n=96
n=93
n=94
n=95
n=95
n=96
n=96
n=97
n=98
n=91
n=86
n=88
25
Job Classification: Parole Date: November 2009 Organizational variables Item
No. How much confidence and
trust is shown in subordinates?
Virtually none Some Substantial amount A great deal 1
How free do subordinates feel talking to superiors
about their work?
Not very free Somewhat free Quite free Very free 2
How often are subordinate’s ideas sought and used
constructively?
Seldom Sometimes Often Very frequently 3
Superiors primarily use (1) fear, (2) threats,
(3) punishment (4) rewards, (5) involvement?
1, 2, 3, occasionally 4 4, some 3 4, some 3 and 5 5, 4 based on group 4
Where is responsibility felt for achieving organization’s
goals?
Mostly at top Top and middle Fairly general At all levels 5
How much cooperative
teamwork exists?
Very little
Relatively little
Moderate amount
Great deal
6
What is the usual direction of information flow?
Downward Mostly downward Down and up Down, up and sideways
7
How is downward communication accepted?
With suspicion Possibly with suspicion
With caution With a receptive mind 8
How accurate is upward communication?
Usually inaccurate Often inaccurate Often accurate Almost always accurate
9
How well do superiors know problems faced by
subordinates?
Not very much Rather well Quite well Very Well
10
What does decision making process contribute to
motivation?
Not very much
Relatively little Some Contribution Substantial Contribution
11
At what level are decisions made?
Mostly at top Policy at top, some delegation
Broad policy at top, broad delegation
Throughout but well integrated
12
Are subordinates involved in decisions related to their
work?
Almost Never Occasionally consulted
Generally Consulted Fully Involved
13
How are organizational goals established?
Orders issued Orders, some comments invited
After discussion, by orders
By group action (except in crisis)
14
How much covert resistance to goals is present?
Strong resistance Moderate resistance Some resistance at times
Little or none
15
How concentrated are review and control functions?
Very highly at top Quite highly at top Delegation to lower levels
Widely shared
16
Is there an informal organization resisting the
formal one?
Yes Usually Sometimes No, same goals as formal
17
What are cost, productivity and other control data used
for?
Policing, punishment Reward and punishment
Reward, some self-guidance
Self-guidance, problem-solving
18
LE
AD
ER
SH
IP
MO
TIV
AT
ION
C
OM
MU
NIC
AT
ION
D
EC
ISIO
NS
G
OA
LS
C
ON
TR
OL
X
O
X
X
X
X X
X
X
X
X
X
X
X
X
X
X
X
X
O
O
O
O
O
O
O
O
O
O
O
O
O
O
O
O
O
X
5.7
6.3
4.2
49
5.3
5.5
5.6
6.3
5.0
7.2
5.3
5.7
3.9
6.3
6.9
7.1
3.5
5.5
n=20
n=22
n=22
n=18
n=16
n=20
n=22
n=23
n=18
n=19
n=17
n=18
n=18
n=18
n=18
n=18
n=19
n=18

26
Job Classification: ISC Date: November 2009 Organizational variables Item
No. How much confidence and
trust is shown in subordinates?
Virtually none Some Substantial amount A great deal 1
How free do subordinates feel talking to superiors
about their work?
Not very free Somewhat free Quite free Very free 2
How often are subordinate’s ideas sought and used
constructively?
Seldom Sometimes Often Very frequently 3
Superiors primarily use (1) fear, (2) threats,
(3) punishment (4) rewards, (5) involvement?
1, 2, 3, occasionally 4 4, some 3 4, some 3 and 5 5, 4 based on group 4
Where is responsibility felt for achieving organization’s
goals?
Mostly at top Top and middle Fairly general At all levels 5
How much cooperative
teamwork exists?
Very little
Relatively little
Moderate amount
Great deal
6
What is the usual direction of information flow?
Downward Mostly downward Down and up Down, up and sideways
7
How is downward communication accepted?
With suspicion Possibly with suspicion
With caution With a receptive mind 8
How accurate is upward communication?
Usually inaccurate Often inaccurate Often accurate Almost always accurate
9
How well do superiors know problems faced by
subordinates?
Not very much Rather well Quite well Very Well
10
What does decision making process contribute to
motivation?
Not very much
Relatively little Some Contribution Substantial Contribution
11
At what level are decisions made?
Mostly at top Policy at top, some delegation
Broad policy at top, broad delegation
Throughout but well integrated
12
Are subordinates involved in decisions related to their
work?
Almost Never Occasionally consulted
Generally Consulted Fully Involved
13
How are organizational goals established?
Orders issued Orders, some comments invited
After discussion, by orders
By group action (except in crisis)
14
How much covert resistance to goals is present?
Strong resistance Moderate resistance Some resistance at times
Little or none
15
How concentrated are review and control functions?
Very highly at top Quite highly at top Delegation to lower levels
Widely shared
16
Is there an informal organization resisting the
formal one?
Yes Usually Sometimes No, same goals as formal
17
What are cost, productivity and other control data used
for?
Policing, punishment Reward and punishment
Reward, some self-guidance
Self-guidance, problem-solving
18
LE
AD
ER
SH
IP
MO
TIV
AT
ION
C
OM
MU
NIC
AT
ION
D
EC
ISIO
NS
G
OA
LS
C
ON
TR
OL
X
O
X
X
X
X X
X
X
X
X
X
X
X
X
X
X
X
X
O
O
O
O
O
O
O
O
O
O
O
O
O
O
O
O
O
X
6.2
6.6
5.7
6.8
5.5
7.6
8.5
7.4
6.9
9.7
7.0
8.2
4.5
6.9
6.73
6.5
7.6
8.0
n=24
n=22
n=22
n=23
n=24
n=24
n=22
n=23
n=23
n=23
n=23
n=23
n=24
n=23
n=24
n=22
n=23
n=21
27
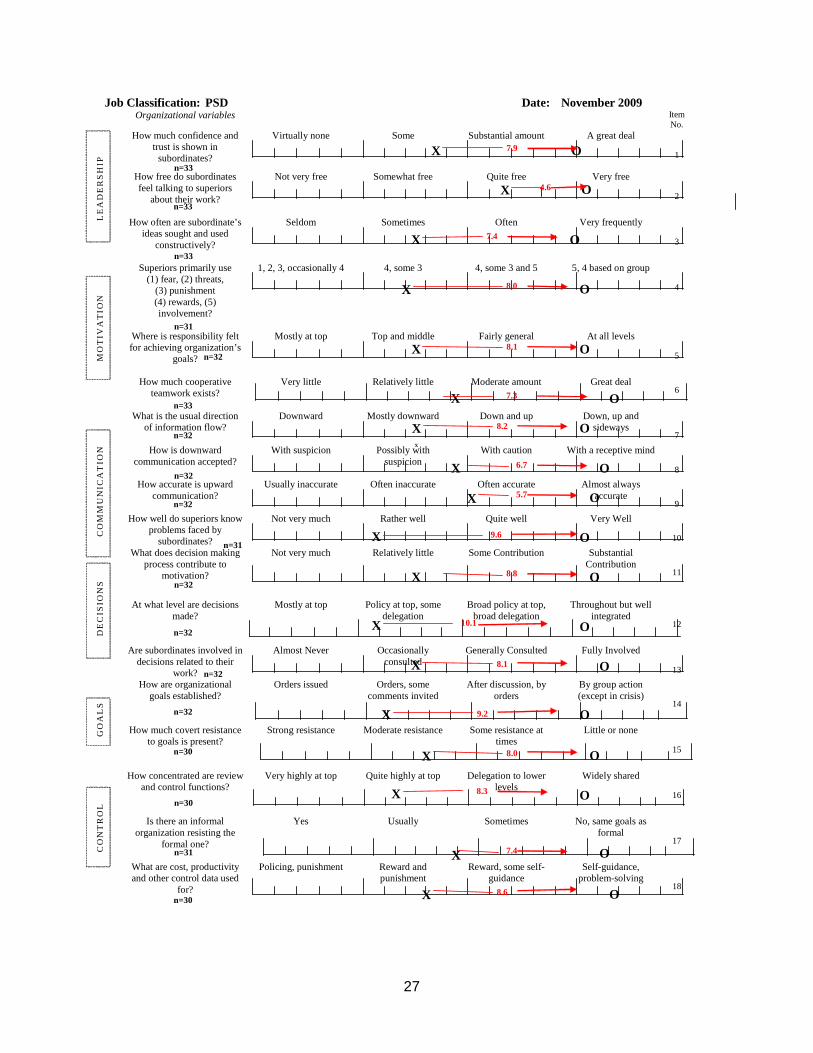
Job Classification: PSD Date: November 2009 Organizational variables Item
No. How much confidence and
trust is shown in subordinates?
Virtually none Some Substantial amount A great deal 1
How free do subordinates feel talking to superiors
about their work?
Not very free Somewhat free Quite free Very free 2
How often are subordinate’s ideas sought and used
constructively?
Seldom Sometimes Often Very frequently 3
Superiors primarily use (1) fear, (2) threats,
(3) punishment (4) rewards, (5) involvement?
1, 2, 3, occasionally 4 4, some 3 4, some 3 and 5 5, 4 based on group 4
Where is responsibility felt for achieving organization’s
goals?
Mostly at top Top and middle Fairly general At all levels 5
How much cooperative
teamwork exists?
Very little
Relatively little
Moderate amount
Great deal
6
What is the usual direction of information flow?
Downward Mostly downward Down and up Down, up and sideways
7
How is downward communication accepted?
With suspicion Possibly with suspicion
With caution With a receptive mind 8
How accurate is upward communication?
Usually inaccurate Often inaccurate Often accurate Almost always accurate
9
How well do superiors know problems faced by
subordinates?
Not very much Rather well Quite well Very Well
10
What does decision making process contribute to
motivation?
Not very much
Relatively little Some Contribution Substantial Contribution
11
At what level are decisions made?
Mostly at top Policy at top, some delegation
Broad policy at top, broad delegation
Throughout but well integrated
12
Are subordinates involved in decisions related to their
work?
Almost Never Occasionally consulted
Generally Consulted Fully Involved
13
How are organizational goals established?
Orders issued Orders, some comments invited
After discussion, by orders
By group action (except in crisis)
14
How much covert resistance to goals is present?
Strong resistance Moderate resistance Some resistance at times
Little or none
15
How concentrated are review and control functions?
Very highly at top Quite highly at top Delegation to lower levels
Widely shared
16
Is there an informal organization resisting the
formal one?
Yes Usually Sometimes No, same goals as formal
17
What are cost, productivity and other control data used
for?
Policing, punishment Reward and punishment
Reward, some self-guidance
Self-guidance, problem-solving
18
LE
AD
ER
SH
IP
MO
TIV
AT
ION
C
OM
MU
NIC
AT
ION
D
EC
ISIO
NS
G
OA
LS
C
ON
TR
OL
X
O
X
X
X
X X
X
X
X
X
X
X
X
X
X
X
X
X
O
O
O
O
O
O
O
O
O
O
O
O
O
O
O
O
O
X
7.9
7.4
4.6
7.4
8.0
8.0
8.6
9.2
8.1
10.1 11
8.8
9.6
5.7
6.7
8.1
7.3
8.2
8.3
n=33
n=33
n=32
n=31
n=33
n=33
n=32
n=32
n=32
n=31
n=32
n=32
n=32
n=32
n=30
n=30
n=31
n=30

28
Gap Distances Cut Off Values for Climate AreasNarrow
(<25 %ile)Moderate (25-75 %ile)
Wide (>75%ile)
Leadership 3 or less 4-9 10 or moreMotivation 3 or less 4-10 11 or moreCommunication 3 or less 4-10 11 or moreDecision-Making 4 or less 5-13 14 or moreGoal 4 or less 5-12 13 or moreControl 4 or less 5-11 12 or more
Gap Distances Cut Off Values by Likert QuestionsNarrow
(<25 %ile)Moderate (25-75 %ile)
Wide (>75%ile)
Q1 3 or less 4-9 10 or moreQ2 2 or less 3-9 10 or moreQ3 4 or less 5-11 12 or moreQ4 2 or less 3-11 11 or moreQ5 3 or less 4-10 12 or moreQ6 4 or less 5-10 11 or moreQ7 4 or less 5-12 13 or moreQ8 3 or less 4-9 10 or moreQ9 3 or less 4-7 8 or moreQ10 4 or less 5-12 13 or moreQ11 4 or less 5-13 14 or moreQ12 5 or less 6-14 15 or moreQ13 3 or less 4-11 12 or moreQ14 4 or less 5-13 14 or moreQ15 4 or less 5-10 11 or moreQ16 4 or less 5-11 12 or moreQ17 3 or less 4-10 11 or moreQ18 4 or less 5-12 13 or more
VI. Appendix B: Discrete Gap Levels Based on 2005 a nd 2009 Gap Studies - Percentile Distributions, by Organiza tional
Climate Areas and Individual Survey Questions
This report can also be viewed at the Interagency Council on Intermediate Sanctions website:
http://cpja.ag.state.hi.us/icis/