organizing growth - world...
TRANSCRIPT

Organizing Growth�
Luis Garicano
LSE and University of Chicago
Esteban Rossi-Hansberg
Princeton University
September 9, 2008
Abstract
After many years of large drops in the cost of information and communi-cation technology (ICT), the evidence on its impact on aggregate productivitygrowth continues to be mixed. We argue that this may be the result of com-peting economic forces. To do so, we propose a framework to study the impactof ICT on growth through its impact on organization and innovation. Agentsaccumulate knowledge to use available technologies and invent new ones. Theuse of a technology requires the development of organizations to coordinate thework of experts, which takes time. The costs and bene�ts of such organizationsdepend on the cost of ICT. We �nd that while advances in information technol-ogy always increase growth, improvements in communication technology maylead to lower growth and even to stagnation, as the payo¤ to exploiting avail-able technologies through organizations increases relative to the payo¤ frominnovations.
�A �rst draft of this paper was prepared for the Conference in honor of Robert E. Lucas Jr. atClemson University, September 2007. We thank Lorenzo Caliendo for excellent research assistanceand Philip Aghion, Tim Besley, Xiao Chen, Boyan Jovanovic, Per Krusell, Bob Lucas, TorstenPersson, Andrea Prat, Nancy Stokey and seminar participants at Chicago GSB, Clemson, ECARES,Erasmus School of Economics, LSE, Northwestern and Princeton for useful comments. Garicanoacknowledges the �nancial support of the Toulouse Network on Information Technology. Rossi-Hansberg acknowledges the generous support of the Sloan Foundation.

1. INTRODUCTION
Advances in information and communication technology (ICT) have been perhapsthe most talked about technological improvement in the last three decades. Economieshave invested massive amounts of money in setting up the necessary infrastructure toaccess and use these new technologies. Naturally, the empirical literature has tried to�nd a consistent e¤ect of improvements in ICT on productivity growth over time andaccross countries. Surprisingly, no consensus on the size and magnitude of the e¤ecthas emerged, particularly outside of the ICT producing sectors.1 In this paper weargue that the e¤ect of ICT on growth is complex and not necessarily positive. To doso, we propose a theory of economic growth through organization that incorporatesICT explicitly.ICT a¤ects how individuals acquire and use their knowledge of existing technologies
to produce goods. The development of a new technology brings with it a new set ofproduction challenges that must be dealt with for production to take place. Tacklingthese new problems requires individuals to acquire specialized expertise and to workwith each other. The cost of such specialization is that it requires communicationand coordination among di¤erent individuals. That is, it requires �organization�. In-formation and communication technology a¤ect the costs and bene�ts of organizationand, through them, the extent to which a new technology can be exploited. Thusinformation technology is a �meta-technology�: a technology that a¤ects the costsand bene�ts of investing in a new technology. We study how the cost of acquir-ing and communicating information a¤ects growth through its e¤ect on organizationand innovation. We will show that the interaction between ICT and organizationsdetermines the direction (positive or negative) of the impact of ICT on growth.When a new technology is introduced agents learn only the most common problems
associated with it. As times passes, organizations, in the form of knowledge-basedhierarchies (Garicano, 2000) are created. In them, some agents (�problem solvers�orexperts) specialize in dealing with exceptional problems and other agents specialize in
1Pilat et al, (2002) conclude that: "... the United States and Australia are almost the onlyOECD countries where there is evidence at the sectoral level that ICT use can strengthen labourproductivity and MFP growth. For most other OECD countries, there is little evidence that ICT-using industries are experiencing an improvement in labour productivity growth, let alone any changein MFP growth.�. A 2004 update arrives to the same conclusion. Jogenson (2005) also concludesthat the e¤ect of ICT on productivity growth has been postive, while Basu et al, (2003) argue thatthe same was not true for the UK. Timmer and van Ark (2005) and Gust and Marquez argue thatthe impact of ICT on productivity growth in Europe has been small or inexistent.
1

production and learn the routine problems. We model this process as the emergenceof a collection of markets for expert services (referral markets) where agents sellthe problems they cannot solve to other agents. These referral markets could beequivalently seen as consulting market arrangements or inside-the-�rm hierarchies, aswe have shown elsewhere (Garicano and Rossi-Hansberg, 2006). The dynamics of ourmodel result from the time to build these markets. As we discuss later, in our view itis critical to growth dynamics that multiple complementary specialists do not emergeinstantaneously, but that they take time to emerge. Speci�cally, we assume agentshave to see the problems that remain unsolved at some moment in time before theydecide to specialize in those problems. Thus, only one expert market can be createdper period.Our model di¤erentiates two knowledge generating activities: exploiting existing
technology and innovating to develop new technologies. First, exploitation takes placeas organizations undertake production over time and add new layers (new markets)of experts. By allowing these new experts to leverage their knowledge about unusualproblems, the new layers allow for more knowledge to be acquired and make pro-duction more e¢ cient under the current technology. This process exhibits decreasingreturns, as eventually most problems are well known and the knowledge acquired isless and less valuable.Second, innovation is the result of agent�s decisions of how much to invest to create
radically new technologies. This investment process exhibits adjustment costs, sothat the investment, if it happens, takes place smoothly over time. Of course, theability of the economy to exploit the new technology through organization determinesthe pro�tability of innovation investments. The rate of innovation, the extent ofexploitation, and the amount of organization in the economy are jointly determinedin our theory, and depend on the cost of acquiring and communicating knowledge.2
If it happens, progress in our model takes place in leaps and bounds. After a newtechnology is adopted, investment in innovation decreases and agents concentrate inexploitation as �rst the more productive pieces of knowledge about this technology
2Throughout, we assume that knowledge is appropriable. In the case of problem solving andproduction knowledge because communicating it takes time, and individual�s time is limited. In thecase of innovation knowledge, we assume individuals invest because they will appropriate the resultsof their investment by selling or using the future technologies. Alternatively, we could assume thatthere are externalities and that, for example, radical innovations are a by-product of the accumulationof production knowledge. This would also result in an endogenous growth theory, but one in whichbetter communication technology trivially leads to faster growth as it incentivates agents to acquiremore production knowledge.
2

and then the rarer ones are acquired. Radical innovation will not take place againuntil the current innovation has been exploited to a certain degree. Both the timingof the switch to a new technology, and the size of the jump in the technology areendogenous, as agents must choose how much and when to invest in radical inno-vation. As long as the value of continuing on an existing innovation is su¢ cientlyhigh, the switch to the new technological generation does not take place. Adoptingthe new technology makes the knowledge acquired about the previous technologyobsolete, and thus requires agents to start accumulating new knowledge and startbuilding new organizations.3 Thus inherent in new knowledge is a process of creativedestruction (Schumpeter, 1942) whereby adopting a radical innovation makes the ex-isting organization obsolete.4 That is, we built on the insight of Arrow (1974) thatorganizations are speci�c to a particular technology.Progress may also come to a halt if agents decide not to invest in radical innovation.
Speci�cally, the payo¤ of exploiting existing technologies may be such that agentsoptimally create very large organizations, composed of a large set of referral marketsand a large number of di¤erent specialized occupations. Such organizations take along time to build, and thus agents choose to postpone forever the moment in whicha new technology would be exploited. That is, the radical innovation process nevergets started. When the current technology is fully exploited, agents do not have anydevelopment in the alternative radical technology to build on, and prefer to placetheir e¤orts on small advances of the existing technology. The result is stagnation.Information and communication technology determines the depth to which an in-
novation is exploited, and thus the rate of growth. Consider �rst information tech-nology. The main bene�t of organization is that individuals can leverage their costof acquiring knowledge over a larger set of problems, increasing the utilization rateof knowledge. Information technology advances that reduce the cost of acquiring andaccessing knowledge (e.g. databases), decrease the need for organizational complexity,shorten the exploitation process, and unambiguously increase growth. Alternatively,
3Indeed, empirically, new technologies are usually associated with new organizations. For exam-ple, associated with the arrival of the electricity at the end of the XIX century were notably EdisonGeneral Electric (now GE) and Westinghouse; associated with the development of the automobile afew years later were Ford and General Motors; with the development of �lm, Kodak; with the arrivalof the computer and microprocessors �rst IBM and then Intel; with the development of the WorldWide Web, Google, Yahoo, Amazon and E-Bay. We discuss these stylized facts in the next section.
4Previous models of creative destruction, following on the pioneering work of Aghion and Howitt(1992) and Grossman and Helpman (1991) do not take organizations into account�new productssubstitute the old, but organizations play no role.
3
increases in the cost of acquiring and accessing knowledge may dramatically slow longrun growth, maybe to the extend of stopping it, as they require the creation of large,complex organizations with a long time to build.Better communication technology reduces the time spent by agents communicat-
ing with others. This unambiguously increases welfare, but has an ambiguous e¤ecton growth. Lower communication costs increase the value of both current technolo-gies (which are more deeply exploited as organizations are more e¢ cient) and offuture technologies. If agents value the future su¢ ciently (because either they donot discount it much, or because their ability to sell their innovations is limited: �ap-propiability�) this increases the value of innovation. However, if individuals do notvalue the future much, particularly when communication is costly, better communi-cation technology makes investment in exploiting current technology more appealingwhich means that organizations spend more e¤ort on the process of deepening theirproduction knowledge. But this postpones the moment when future technology willreap its rewards and may lead to lower investment in radical innovations and lessfuture growth. In fact, it may lead to stagnation. In other words, making organiza-tions more e¢ cient may shift the balance of economic activity from investing in newinnovations to exploiting better existing innovations, and that may reduce economicgrowth, potentially to zero. Thus improvements in communication technology couldleave a less developed country, where communication costs and discount rates arehigh, with a lower rate of innovation, whereas they would tend to have a positivee¤ect on the growth of more developed countries. Eventually, su¢ ciently large orcontinuous drops in communication costs are favorable to growth, as spans of controlbecome very large and organizations very simple.The idea that large organizations are detrimental to radical (as opposed to incre-
mental) innovation, which is the key causal mechanism that may lead to the negativeimpact of ICT on growth, is supported by two main stylized facts.5 First, radicalinnovations often take place outside existing �rms. Second, successful �rms grow fast�rst but their growth slows down as their innovation is exploited. Consider the �rstone. If organizations are about acquiring knowledge, and knowledge is technologyspeci�c, we expect radical innovation to take place outside of existing organizations
5The two following stylized facts concerns �rms; our model is broader than that, as it appliesto organizations mediated through markets, as well as �rms. Firm birth and growth is easier tomeasure than the birth and growth of specialized consultants and experts in related technologies,and that is why this is the evidence that exists. To the extent that changes inside �rms and outsideare correlated, the evidence is still illuminating.
4

and to replace them. Microsoft, Apple, E-Bay and Google, are all recent examples ofnew and large organizations that started small, have grown, and have replaced the oldlarge organizations. An expression of this phenomenon are the famous stories (suchas Hewlett-Packard) where founders (in HP�s case, Bill Hewlett and Dave Packard)developed the idea that was the germ of a large �rm in their garage.Some systematic evidence in this respect is provided by a study by Rebecca Hen-
derson (1993), where she shows that, in the photolitographic equipment industry(producing pieces of capital equipment to manufacture solid-state semiconductors),each stage of technological change was brought about by a new set of �rms. Table 1,taken from her work, shows the evolution of market shares of �rms in this market asthe technology changed.
Contact Proximity Scanner S&R (1) S&R (2)
Cobilt 44 <1Kasper 17 8 7Canon 67 21 9PElmer 78 10 <1GCA 55 12Nikon 70Total 61 75 99+ 81 82+
Cumulate share of sales of photolithographic alignmentequipment, 19621986, by generation
Table 1: Evolution of Market Shares in Photolitographic Equipment Industry bytype of technology. S&R is Step and Repeat �rst and second generations. Source:
Rebecca Henderson (1993).
Second, �rm growth is fast as the new innovation takes place and slows down as itis exploited. Among other, Luttmer (2007) documents that �rm growth declines as�rms become old and large. Hence, large �rms delay organization by exploiting oldtechnologies more e¢ ciently and for longer periods of time.Our work has several precedents on top of the seminal endogenous growth theo-
ries of Lucas (1988), Romer (1990), Grossman and Helpman (1991), and Aghion andHowitt (1992). Becker and Murphy (1992) �rst studied the connection between co-ordination costs and growth through economic organization. Unlike in their model,we speci�cally take into account the knowledge accumulation process and the occu-pational distribution and organization that results. We also depart in di¤erentiating
5

between exploitation and innovation. Second, Jovanovic and Rob (1990) develop atheory in which growth is generated by small innovations within a technology andlarge innovations across technologies. In their framework, alternative technologies arerandom and are not a¤ected by the choices made within the current technology. Inthis sense, our theory endogenizes the quality of alternative technologies and addsorganization as a source of growth. Jovanovic and Rob (1989) present a model inwhich communication technology also a¤ects growth through the search process, not,again, through organizations. Our theory also builds on the work of Penrose (1959)who �rst (informally) identi�ed the role of �rms in inducing growth through their im-pact on knowledge accumulation, and emphasized how the constraints on the growthof managerial hierarchies constrain �rm growth.Our work is also related to the literature on vintage human capital (Chari and
Hopenhyn, 1991) where older individuals operate in old vintages of technologies; ifskilled and unskilled labor are complementary, it is hard to switch to a new technology.Also, Comin and Hobijn (2007) present a model where a technology must not justbe discovered, but it must also be implemented in order to be bene�cial and learningmust take place after implementation. Organization does not play any role in thismodel, nor does information technology a¤ect how far can organization exploit thenew technology. Firms only choose where to start the implementation process; fromthen on it is exogenous. Organization does play a role in Legros, Newman and Proto(2007) where, like in our work, the division of labor is endogenously determinedwith the growth path. The approach in that paper is di¤erent, and complementary,to ours. While the key organizational issue in their paper is to monitor workers,the purpose of organization in our work is to increase the utilization of knowledge.The idea that information and communication technology is a �meta-technology�(atechnology to implement technology) so that better information technology a¤ects,through organization, the e¢ ciency of exploitation is, we believe, novel.Our theory can explain why some economies stagnate. It shares this feature with
Krusell and Rios-Rull (1996) and Jovanovic and Nyarko (1996). In both of thosepapers increased incentives to exploit the current technology may lead to stagnation.In the former paper due to the political economy problem of insider versus outsiderrents and in the latter because of the cost implied by the loss of expertise whenswitching technologies. We argue that stagnation can also be the result of a lengthyproses of building organizations to exploit the current technology.
6
The rest of the paper is organized as follows. In Section 2 we present the model,where we �rst focus on the creation of organizations given a technology and thenproceed to introduce innovation and growth. Section 3 characterizes the equilibriumand analyzes the e¤ect of ICT on growth. Section 4 concludes. An appendix includeall technical proofs not in the text.
2. THE MODEL
2.1. Preferences and Technology
The economy is populated by a mass of size 2 of ex-ante identical agents that livefor two periods. Every period an identical set of agents is born. Agents work whenthey are young only and they have linear preferences so they maximize the discountedsum of income or consumption of the unique good produced in the economy. Thatis, agents preferences are given by U (ct; ct+1) = ct + �ct+1:
At the start of the period agents choose an occupation and a level of knowledgeto perform their job. Agents can either work in organizations that use the currentprevalent technology, or they can decide to implement a new technology. The qualityof the new technology will depend on past investments in innovation knowledge whichwill be the only technology available to save for the retirement period.A technology is a method to produce goods using labor and knowledge. One unit of
labor generates a project or problem. To produce, agents need to have the knowledgeto solve the problem. If they do, they solve the problem and output is produced. If theworker does not know the solution to the problem, she has the possibility to transferor sell the problem or project to another agent that may have the knowledge to solveit. Organizations are hierarchical, they have one layer of workers and potentiallymany layers of problem solvers (as in Garicano and Rossi-Hansberg, 2006). Problemsolvers have more advanced knowledge than workers and so are able to solve moreadvanced problems, but they need to �buy�these problems from workers or lower layerproblem solvers since they do not spend time producing but communicating existingproblems.The key assumption in our model is that specialization requires organization and
organization cannot be built instantly. Organization takes time to build (see Kyd-land and Prescott (1983) for a similar argument for the case of physical capital).For people to specialize in di¤erent types of problems, they must have mechanisms
7

that allow them to know who knows what and to ask the right question from theright person� specialization requires organization. Two main factors prevent the si-multaneous development of specialists in many di¤erent areas who can work togetherinstantly. First, it is impossible to know what are the problems that will prove impor-tant in the next cycle of innovation, and the types of expertise that will be required.For example, experts in internet marketing or sophisticated wireless networks be-came available only after the internet was developed and there was a demand fortheir services. Second, agents have to be trained in the basic knowledge of the cur-rent technology before others can be trained in the more advanced knowledge; in fact,learning how to deal with the rare and advanced problems may not be useful if thereare no agents specialized in simple tasks who can actually ask the right questions. Theappearance of sophisticated radiologist who specialize in some speci�c kinds of tumorsrequires the previous appearance of normal radiologists, and of cancer specialists whocan use the information obtained in these X-rays.A technology is used more intensely the more layers in the organization. In the �rst
period a technology is in use, agents learn basic knowledge to develop it and they workas production workers. Since higher layers of management have not been developed,the problems they cannot solve go to waste. In the next period, agents observe thatin the last period some valuable problems were thrown away and some of them decideto work as �rst layer problem solvers. These problem solvers, in turn, learn to solvesome problems and throw away those that they cannot solve. This induces the entryof second layer experts in the next period. This process goes on making the hierarchytaller as time proceeds and the use of the prevalent technology more e¢ cient througha better allocation of workers. Of course, the knowledge acquired by agents in alllayers will depend on the number of layers in the organization as well as the fees orprices for transferring problems. The price at which an agent with a particular levelof knowledge can sell a problem is a measure of the e¢ ciency of the organizationalstructure in exploiting a technology. As we will see, the more organizational layers,the higher the price and so the more e¢ cient is the organization in allocating laborand knowledge.As emphasized in Garicano and Rossi-Hansberg (2006) there are many equivalent
ways of decentralizing these organizations. First, as here, there can be a marketfor problems and agents sell and buy problems for each other at a market price.Alternatively, there can also be �rms that optimally organize these hierarchies and
8
hire workers and managers for particular positions at a wage given their knowledgelevel. Finally, organizations can also be decentralized as consulting markets in whichworkers hire knowledgeable agents as consultants to solve problems for them for afee. All of these interpretations are equivalent and can exists at the same time. Inall of them agents obtain the same earnings and perform the same roles. In whatfollows we model these hierarchies as markets for experts services �there are marketsfor problems and problem solvers buy them, but we may as well talk about �rms andmanagers.We now turn to the description of the formation of organization and the use of a
technology. We then study the decisions of agents to drop the technology currentlyin use and make a radical innovation instead of going deeper in the development ofthe current technology (add a new layer).
2.2. Organizing a Technology
Suppose a new technology A � 1 is put in place at time t = 0. The evolutionof this technology will be our main concern in the next section. For now we justkeep it �xed and focus on how it is exploited. Obtaining A units of output fromthis technology requires a unit of time and a random level of knowledge. An agentspecialized in production uses his unit of time to generate one problem, which is adraw from the probability distribution f (z). We assume that f (z) is continuous anddecreasing, f 0(z) < 0; with cumulative distribution function F (z). The assumptionthat f 0(z) < 0 guarantees that agents will always start by learning how to solve themost basic and common problems.6 In order to produce, the problem drawn must bewithin the workers�knowledge set, if it is not, then no output is generated. Knowledgecan be acquired at a constant cost ec > 0; so that acquiring knowledge about problemsin [0; z] costs ecz: Denote the wage of an agent working in layer ` 2 f0; 1; ::::g of anorganization with highest layer L (or in period L since the highest layer is, throughoutthis section, the time period) by w`L: Then, the earnings of a production worker (layer0) working on a new idea (so the highest layer in the organization is L = 0) at time0 are:
6That is, f 0(z) < 0 will be chosen by agents if they can sequence the knowledge acquiredoptimally.
9

w00 = maxzAF (z)� ecz;
where AF (z) is total output by workers with ability z (they solve a fraction F (z) ofproblems each of which produces A units of output) and ecz is the cost of acquiringknowledge z. Denote by z00 the level of knowledge that solves the problem above(where the notation is analogous to the one for wages). Note that an organization withonly workers of layer zero will leave unsolved a fraction of problems 1�F (z00) : Theseproblems, if solved, would produce output A(1�F (z00)): But this simple organization,where workers only work by themselves, chooses optimally to discard them.In order to take advantage of the discarded problems next period, t = 1, some
agents will decide to buy the discarded problems from workers as long as they canthen solve some of them and obtain higher earnings. The assumption is that theseagents need to �rst see that valuable problems are discarded to enter next period andtake advantage of them. Agents can communicate the problems they did not solve inexchange for a fee or price. If communication is cheaper than drawing new problems,then some agents may �nd it in their interest to specialize in learning about unsolvedproblems; they pay a price for these problems, but in exchange they can solve many ofthem as they do not need to spend time generating the problems, only communicatingwith the seller. Organization makes it, potentially, optimal to learn unusual problems,as agents can amortize this knowledge over a larger set of problems.Thus at time t = 1 agents have a choice between becoming production workers or
specialized problem solvers. If they become production workers they earn
w01 = maxzAF (z) + (1� F (z))r01 � ecz (1)
where r01;1 is the equilibrium price at which workers in layer 0 sell their problems. Asproblem solvers they need to spend their time communicating with workers to �ndout about the problems they are buying. The number of problems a manager canbuy is given by the communication technology. Let h be the time a problem solverneeds to communicate with a worker about a problem. Then, a problem solver hastime to �nd out, and therefore buy, 1=h problems. Clearly h is a key parameter of themodel that determines the quality of communication technology. The manager knowsthat workers only sell problems that they cannot solve, so he knows that all problemssold by workers will require knowledge z > z01;1 (where z
01;1 solves the problem above).
10

Hence, the manager acquires knowledge about the more frequent problems above z01;1.The wage of the layer one problem solver is then given by
w11 = maxz
1
h
�AF (z01 + z)� F (z01)
1� F (z01)� r01
�� ecz:
Namely, they buy 1=h problems at price r0 and solve a fraction (F (z01 + z11)� F (z01))
= (1� F (z01)) of them, each of which produces A units of output. On top of this, theypay the cost of learning the problems in [z01 ; z
01 + z11 ] : As long as r
01 > 0; the value of
the problems that were being thrown out was positive, and so w00 < w01 = w11; wherethe last equality follows from all agents being identical ex-ante. Hence, if r01 > 0
adding the �rst layer of problem solvers is optimal at time t = 1. We will show belowthat in equilibrium under some assumptions on F; r01 is in fact positive. Note also thatagents in layer 0 will choose to acquire less knowledge as we add a layer of problemsolvers: It is not worth it to learn as much since unsolved problems can now be soldat a positive price.Next period, t = 2, agents observe that some valuable problems were thrown away
last period. Namely, a fraction 1 � F (z01 + z11) of problems. Hence, some agentsenter as managers of layer 2 to buy these problems from problem solvers of layer1. This process continues, adding more layers each period, as long as some valuableproblems are thrown away and agents can acquire enough knowledge to solve themand earn higher wages. Hence, each period this economy potentially adds anotherlayer of problem solvers. More unusual and specialized problems are solved andsociety acquires a larger and larger range of knowledge.To avoid repetition, we write the problem for period t = L when the hierarchy has
a maximum layer L. As described above, production workers earn
w0L = maxzAF (z) + (1� F (z))r0L � ecz:
Call Z`L the cumulative knowledge of agents up to layer `; in period L where the
maximum number of layers is L : Z`L =
Pi<` z
iL: A problem solver of layer ` where
0 < ` < L earns
w`L = maxz
1
h
A�F (Z`�1
L + z)� F (Z`�1L )
�+�1� F (Z`�1
L + z)�r`L�
1� F (Z`�1L )
� � r`�1L
!� ecz;
11

where r`L is the price of a problem sold by an agent in layer ` in an economy withorganizations of L+ 1 layers at time t. Note that intermediate problem solvers bothsell and buy problems. They buy 1=h problems at price r`�1L and sell the problems theycould not solve (a fraction
�1� F (Z`�1
L + z)�=�1� F (Z`�1
L )�at price r`L: Problem
solvers in the highest layer L cannot sell their problems as there are no buyers, sotheir earnings are just given by
wLL = maxz
1
h
�AF (ZL�1
L + z)� F (ZL�1L )
1� F (ZL�1L )
� rL�1L
�� ecz:
In what follows we will use an exponential distribution of problems. This will allowus to simplify the problem above substantially and will guarantee that the prices ofproblems at all layers are positive. Hence, absent a new technology, as time goes toin�nity the number of layers also goes to in�nity. In the next section we will introduceradical innovations that will prevent this from happening. For the moment, however,we continue with our technology A.Let F (z) = 1 � e��z. Then the earnings of agents in the di¤erent layers can be
simpli�ed to
w0L = maxz
�A� e��z
�A� r0L
��� ecz; (2)
w`L = maxz
1
h
��A� r`�1L
�� e��z
�A� r`L
��� ecz for 0 < ` < L;
wLL = maxz
1
h
��A� rL�1L
�� e��zA
�� ecz:
Thus, in a period where there are organizations with layer L as their highest layer(or organizations with L + 1 layers), given prices, agents choose knowledge so as tomaximize their earnings as stated above. The �rst order conditions from this problemsimply that
z0L = �1
�ln
ec� (A� r0L)
; (3)
z`L = �1
�ln
ech��A� r`L
� for 0 < ` < L;
zLL = �1
�lnech�A
:
Note that the knowledge acquired is increasing in A and decreasing in ec, h (forproblem solvers) and the price obtained for selling problems. The intuition for the
12

e¤ect of A and ec is immediate. For h, remember that a higher h implies a worsecommunication technology. So a higher h implies that problem solvers can buy fewerproblems and so they can span their knowledge over less problems. Knowledge be-comes less useful. As the price at which agents sell problems increases, agents havean incentive to sell their problems instead of learning more to squeeze all their value,which creates incentives to learn less.At any point in time t an economy with technology A and organizations with L+1
layers is in equilibrium if the knowledge levels of agents solve Equations (3) and
w`L = w`+1L � ~w (A;L) for all ` = 0; :::; L� 1: (4)
This condition is equivalent to an equilibrium condition requiring that the supplyand demand of problems at every layer equalize at the equilibrium prizes
�r`LL�1`=0.
The reason is that when wages are equalized, agents are indi¤erent as to their role inthe organization, and thus they are willing to supply and demand positive amountsof the problems in all layers. Equilibrium in the markets for problems given L thenimplies that there are a number
n`L = h�1� F (Z`�1
L )�n0L = he��Z
`�1L n0L
of agents working in layer `. Since the economy is populated by a unit mass of agents,the number of workers is given by
n0L =1
1 + hPL
`=1
�1� F (Z`�1
L )� :
So given t, A, and L an equilibrium for one generation of agents is a collection of Lprices
�r`LL�1`=0
and L + 1 knowledge levels�z`LL`=0
that solve the 2L + 1 equationsin (3) and (4). Before we move on to characterize the solution to this system ofequations consider the solutions of the system as L!1: In this case, since there isno �nal layer, the system has a very simple solution. Guess that r`1 = r1 for all `:Then, the �rst order conditions in (3) imply that
z01 = �1
�ln
ec� (A� r1)
;
z`1 = �1
�ln
ech� (A� r1)
for all ` > 0:
13

Note that, since h < 1, z01 < z`1 for ` > 1: That is, in the limit as the number oflayers goes to in�nity workers learn less than all other agents in the economy. Wagesare then given by,
w01 = A� ec�
�1� ln ec
� (A� r1)
�;
w`1 =A� r
h� ec�
�1� ln ech
� (A� r1)
�for all ` > 0:
Since r1 is not a function of `; earnings of problem solvers are identical as is theamount of knowledge they learn. This veri�es our guess if we can �nd an r such thatw1 � w01 = w`1. It is easy to see that
r1 = A (1� h) +ech�lnh
solves this equation. Hence, earnings as L!1 are given by
w1 = A� ec�
�1 + ln
�A�hec � h lnh
��;
and the knowledge acquired by agents is given by
z01 =1
�lnh
�A�ec � lnh
�;
z`1 =1
�ln
�A�ec � lnh
�for all ` > 0:
The case of L!1 is helpful since it is evident that the economy will converge to itas the number of layers increases. Furthermore, when L ! 1 no valuable problemsare thrown away. Thus w1 bounds the level of earnings agents can achieve withtechnology A: We now turn to the characterization of an equilibrium given t, A andL �nite. The next proposition shows that an equilibrium given A and L �nite exists,is unique, r`L is decreasing in `; and z
`L is increasing in `: The logic is straightforward.
Start with layer L. These problem solvers cannot resell the problems to a higherlayer. Hence, relative to agents one layer below, who can resell their problems, agentin L are willing to pay less for them than agents in layer L� 1 are willing to pay forthe problems they buy. Similarly, agents in layer L� 1 are willing to pay less for theproblems they buy than agents in layer L � 2 as they can sell them for a low priceto agent in layer L: This logic goes through for all layers. The more layers on top
14

of an agent the more valuable the problem, as it can potentially be sold to all thelayers above, up to L. Now consider the amount of knowledge acquired by agents.Agents in layer L cannot sell their problems and so they have an incentive to learn asmuch as possible to extract as much value as possible from each problem. In contrast,agents in layer L� 1 are less willing to learn as they can sell their problems to agentsin layer L. Agents in layer L � 2 get a higher price for their unsolved problems sotheir incentives to learn are smaller than the agents above them. Again, this logicapplies to all layers in the hierarchy, including layer 0 where the fall in knowledge iseven larger since worker can span their knowledge over only one problem instead of1=h of them (since they use their time to produce). Of course, as L ! 1 this logicdoes not apply and all prices and knowledge levels of problem solvers are constant,since there is no �nal layer in which prices are equal to zero.To prove the next proposition we will use the following parameter restriction which
is necessary and su¢ cient for z`L > 0 for all ` and L:
Condition 1 A � 1, h < 1 and A; �;ec and h satisfyA�ec >
1
h+ lnh:
Proposition 2 Under Condition 1; for any A; and L �nite, there exists a uniqueequilibrium determined by a set of prices
�r`LL�1`=0
and a set of knowledge levels�z`LL`=0
such that r`L > 0 is strictly decreasing in ` and z`L > 0 is strictly increasing
in `:
Proof. See the Appendix.We now turn to the properties of this economy as we change the highest layer
L. Note that for now, without radical innovations, changes in L happen as timeevolves and so studying the properties of our economy as we change the number oflayers is equivalent to studying the properties of our economy as time evolves. Thisequivalence will change in the next section once we introduce radical innovations aswe will have organizations evolving for di¤erent technologies across time. The nextproposition shows that as the number of layers increases so do wages (or output percapita if knowledge cost are considered forgone output). Furthermore since wages arebounded by w1, there are eventual decreasing returns in the number of organizationallayers. This is just the result of higher layers dealing with less problems as they aremore rare. So adding an extra layer contributes to output per capita (since more
15

problems are solved) but it contributes less the higher the layer since there are fewerand fewer problems that require such specialized knowledge.The proposition also shows that as time evolves and the number of layers increases,
r`L increases and z`L decreases for all `. The �rst result is a direct consequence of
the logic used in the previous proposition. As time elapses and the number of layersincreases the number of layers above a given ` increases, which implies that r`L in-creases, since the problems can be resold further if not solved. In turn, higher pricesin turn imply less knowledge acquisition as the opportunity to resell problems is asubstitute for solving them.
Proposition 3 Under Condition 1; for any technology A; as the number of layers Lincrease, wt increases and limL!1 ~w (A;L) = w1. Furthermore, as the number oflayers L increase, prices r`L increase for all ` = 0; :::; L � 1 and knowledge levels z`Ldecrease for all ` = 0; :::; L: As L!1; r`L ! r1 for all ` = 0; :::; L� 1 and z`L ! z01all ` = 0; :::; L:
Proof. See the Appendix.
0 1 2 3 4 5 6 7 8 9 100.23
0.235
0.24
0.245
0.25
0.255
0.26
0.265
0.27
Layer / Time
Ou
tpu
t pe
r A
ge
nt (
w)
Figure 1
0 1 2 3 4 50
10
20
30
40
50
60
70
80
Layer / Time
Nu
mb
er
of A
ge
nts
Each color represents one layer
Figure 2
The previous proposition shows that our economy will grow. But it also shows thatthe level of wages is bounded. Hence, growth in wages (or per capita output) will
16

converge to zero. That is, the economy does not exhibit permanent growth. We nowturn to embed this evolution over time of organizations with a given technology A ina growth model in which agents will have a choice to switch to better technologiesas they learn. This will yield a long-run growth model that will exhibit permanentgrowth and where this growth will be driven by the ability of agents to organize.The following graphs illustrate the results proven in the previous propositions.
Figure 1 shows an example of a wage path. The properties we have proven are easyto identify: wages increase at a decreasing rate and have an asymptote at w1: Figure2 shows the evolution of the size of a typical hierarchy. The top layer size is normalizeto one. Clearly, as the economy adds more markets for expertise, or layers, the lowerlayers expand more than proportionally.
0 1 2 3 4 5 60
0.01
0.02
0.03
0.04
0.05
0.06
0.07
Problem's Layer
Pro
ble
m's
Pri
ce
5 layer' hierarchy
7 layer' hierarchy
Figure 3
0 1 2 3 4 5 60.42
0.43
0.44
0.45
0.46
0.47
0.48
0.49
0.5
0.51
0.52
Agent's Layer
Ag
en
t's K
no
wle
dg
e
5 layer' hierarchy
7 layer' hierarchy
Figure 4
Figure 3 illustrates the problem for prices for an economy with 5 layers and aneconomy with 7 layers. As proven above, prices of problems are higher in an economywith a higher maximum number of layers: Problems can be exploited further andso conditional on someone having tried to solve them and failed, they preserve morevalue. Prices of problems at the highest layer are equal to zero by assumption, sincethere is no higher layer to sell them to. The price of problem is also decreasing
17
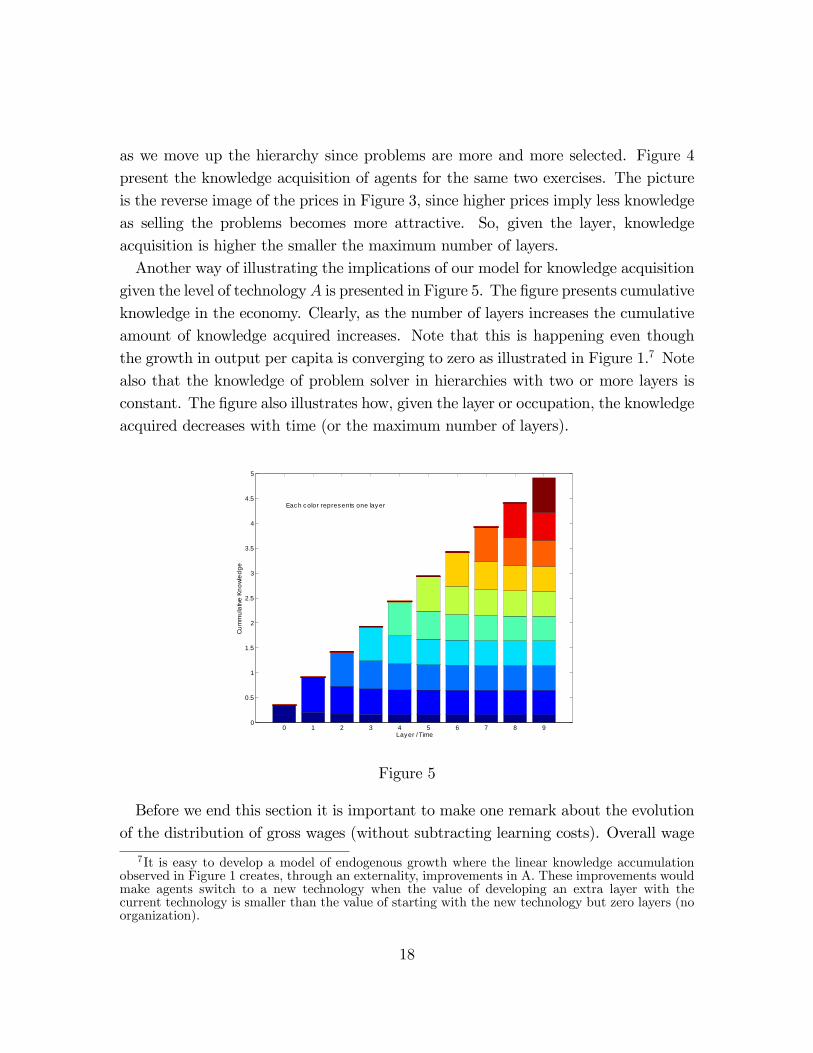
as we move up the hierarchy since problems are more and more selected. Figure 4present the knowledge acquisition of agents for the same two exercises. The pictureis the reverse image of the prices in Figure 3, since higher prices imply less knowledgeas selling the problems becomes more attractive. So, given the layer, knowledgeacquisition is higher the smaller the maximum number of layers.Another way of illustrating the implications of our model for knowledge acquisition
given the level of technologyA is presented in Figure 5. The �gure presents cumulativeknowledge in the economy. Clearly, as the number of layers increases the cumulativeamount of knowledge acquired increases. Note that this is happening even thoughthe growth in output per capita is converging to zero as illustrated in Figure 1.7 Notealso that the knowledge of problem solver in hierarchies with two or more layers isconstant. The �gure also illustrates how, given the layer or occupation, the knowledgeacquired decreases with time (or the maximum number of layers).
0 1 2 3 4 5 6 7 8 90
0.5
1
1.5
2
2.5
3
3.5
4
4.5
5
Layer / Time
Cum
mul
ative
Kno
wled
ge
Eac h c olor represents one lay er
Figure 5
Before we end this section it is important to make one remark about the evolutionof the distribution of gross wages (without subtracting learning costs). Overall wage
7It is easy to develop a model of endogenous growth where the linear knowledge accumulationobserved in Figure 1 creates, through an externality, improvements in A. These improvements wouldmake agents switch to a new technology when the value of developing an extra layer with thecurrent technology is smaller than the value of starting with the new technology but zero layers (noorganization).
18

inequality, as measured by the ratio of the gross wages of the highest level problemsolvers to the gross wages of workers, increases over time as a technology is moree¢ ciently organized. To see this note that everyone gains the same net of learningcosts, and knowledge levels of workers decrease with the number of layers, whileknowledge levels of entrepreneurs at the highest layer are constant. In contrast, thedistribution of gross wages among problem solvers becomes less dispersed. The reasonis that more layers are added and knowledge levels of intermediate problem solversconverge to z1. Thus, as organizations develop over time, inequality between workersand managers increases while inequality within problem solvers decreases.
2.3. Technological Innovation
In the previous section we studied how an economy organizes given a technologicallevel A. In our economy, as organizations grow and become more complex, societylearns how to solve a wider set of problems faced when using this technology. Thisknowledge is fully appropriable and society invests optimally, conditionally on A; onthe development of this problem solving knowledge. We now turn to the evolution ofthe technology A that we kept �xed in the previous section. For this, we will assumethat the technology is a fully private and rival good. Agents can invest in improvingtheir technology and sell their technology to other agents (in fact, this will be theonly savings technology of an agent). However, a technology has to be used in orderto be productive and organizations have to be developed to exploit it. Of course, onlyagents that use the same technology can work with each other.We studied above the problem of exploiting a given technology. This problem
produced the equilibrium earnings that all agents in the economy working with aparticular technology receive in equilibrium. These earnings changed every period asnew layers of expertise develop in the economy to exploit this technology. As in theprevious section, denote the equilibrium earnings of agents working with technologyA in an economy with L+1 layers of expertise by ~w (A;L) : ~w (A;L) contains all theinformation we need about the organization of the economy to study the decisions ofagents to invest in innovation.The cost of learning new technologies, measured in terms of foregone income, in-
creases with the level of the new technologies � the more productive the technologythe higher the cost of spending time learning to solve problems. Thus we specifythe learning cost of the new technology as ec = cA: Then the cost of learning how
19

to solve problems in an interval of size z is equal to Acz where A is the technologycurrently in use (not necessarily the best one). All the analysis in the previous sectionremains unchanged apart from the parameter ec now becoming Ac:8 Then, it is easyto see from Equations (2) and the equilibrium conditions in (4) that the prices ofproblems are proportional to the level of technology A so r`L=A satis�es the problemin the previous section with A = 1. Thus, earnings are proportional to the level oftechnology. Namely, ~w(A;L) = Aw(L), where w(L) is the equilibrium wage giventhat the economy has organized L+1 layers and A = 1: So earnings are linear in thelevel of the technology in use. This is a property that we will exploit heavily below.An agents with technology A faces a cost of A �2 of improving the best technology
he can use to (1 + �)A. So we are assuming that there are quadratic adjustmentcost of improving the frontier technology. The frontier technology is not necessarilythe technology in use, since changing technology implies wasting the organizationscreated to exploit the older technology. So agents will improve the frontier technologyand, once it is good enough and the bene�ts from developing the old technology havedied out, agents will switch to the frontier technology and will start creating neworganizations to exploit this technology. The role of the quadratic adjustments costsis to have smooth investments in the frontier technology. Without them, agents wouldinvest in the new technology only the period before a new technology is put in place.As discussed before, agents order consumption using a linear utility function with
discount factor �. Because of this preference speci�cation, the marginal utility ofconsumption in every period and for every agent in the economy is equal to one.Hence, the solution to the problem of a sequence of two period lived agents that workwhen they are young, is identical to the solution to the problem of an in�nitely livedagent, up to consumption transfers between generations. Thus, the solution to thein�nitely lived agent problem will lead to innovation levels and a timing of radicalinnovation that are identical to the solution to the two period lived agents problem.That is, both problems will maximize the discounted sum of consumption. The actualconsumption levels every period will, however, depend on the level of prices at whichindividuals can sell their technology. In what follows we discuss the in�nite horizonproblem to analyze the equilibrium allocation of this economy. We then discuss theprice of technology and the consumption pattern across generations.
8Note that if we do not scale c by the level of technology, as the economy grows the cost ofacquiring knowledge relative to output will converge to zero. This would introduce an obvious scalee¤ect in the model.
20

The problem of an in�nitely lived agent (or a sequence of two period lived agentsthat sell each other their technology) is therefore given by
~V (A;A0; L) =
24max24 max� ~w (A;L) + � ~V (A;A00; L+ 1)� A �2;
~V (A0; A0; 0)
3535where
A00 = A0 (1 + �) :
~V (A;A0; L) denote the value function of an agent using technology A, with a frontiertechnology A0 in an economy with maximum layer L. Note that we are assuming thatall individuals (or sequence of individuals) have the same technology so their technol-ogy, and the frontier technology, are the same for ever agent in the economy (moreon this below). An agent can work using the current technology A with organizationsof L + 1 layers (remember that there is a layer zero) and receive ~w (A;L), invest� at cost A �2, and tomorrow repeat the problem with a new frontier technologyA00 = A0 (1 + �) and organizations with L + 2 layers. He can also decide to drop theavailable organizations and do a radical innovation, in which case he uses the frontiertechnology with zero layers and gets value ~V (A0; A0; 0) :We are assuming that everyone in this economy has the same A and A0 and there-
fore, as agents are identical they choose the same pattern of innovations. This requiresthat, at period zero, all agents start with the same frontier technology. If this is thecase, then no agent would want to deviate by himself since this would force him towork on his own, therefore reducing his reliance on organization and therefore his in-come.9 Of course, if we allow the economy to start with agents that are heterogenousin their level of technology, there may be other non-symmetric equilibria. The studyof these equilibria may be interesting, but we leave it for future research and, in thispaper, focus on symmetric equilibria only.The fact that ~w (A;L) = Aw(L) implies that ~V (A;A0; L) is also homogenous of
degree one in A and so ~V (A;A0; L) = A ~V�1; A
0
A; L�= AV
�A0
A; L�where
V (G;L) = max
24 max� w (L) + �V (G0; L+ 1)� �2;
GV (1; 0)
359This follows immediately from w (A; 0) � w (A0; L) for all L and A � A0 and our assumption
that production knowledge is speci�c to the technology in use.
21
where andG0 = G (1 + �) :
Note that G = A0=A know has the interpretation of the technological gap. The ratioof the frontier technology to the technology in use. This is the only state of technologythat is relevant for our problem.Now remember that as L!1, w (L)! w1=A = 1� c
�� c
�ln��hc� h lnh
�: Hence,
for L large the discounted bene�t of developing an extra layer converges to zero.Similarly, the bene�ts of innovation also converge to zero as L becomes large since theyare proportional to �LV (1; 0)! 0 as L!1: This implies that there are two casesthat we need to consider. First, the case where there exists a unique �nite L� suchthat next period a new technology is put in place, namely, V (G;L� + 1) = GV (1; 0)
for all G. This is the case in which the value of innovation converges to zero moreslowly that the value of an extra layer. Second, a case where the value of innovationconverges to zero faster than the value of an extra layer and so L� is in�nity. In thiscase a new technology is never put in place and so the economy stagnates and thegrowth rate converges to zero as we will discuss below.Since, given a �nite L�; the problem of choosing an innovation level � is a well
behaved concave problem by design, an optimal innovation level exits and is unique.Denote it by �� (L). Of course, if L� = 1, �� (L) = 0 all L, since there are noincentives to invest in innovation capital.In any case, we can write the value function as
V (G;L) =L�X`=L
�`�L�w (`)� �� (`)2
�+ �L
�+1�LV (1; 0)GL�Y`=L
(1 + �� (`))
and so
V (1; 0) =
L�X`=0
�`�~w (`)� �� (`)2
�+ �L
�+1V (1; 0)L�Y`=0
(1 + �� (`))
or
V � = V (1; 0) =
PL�
`=0 �`�w (`)� �� (`)2
�1� �L�+1
QL�
`=0 (1 + �� (`))
:
So we can just restate the original problem in sequential form as �nding L� and �� (`)for ` = 0; ::::; L� that solve
V � = maxL;f�(`)gL`=0
PL`=0 �
`�w (`)� � (`)2
�1� �L+1
QL`=0 (1 + � (`))
; (5)
22

where we are assuming that is high enough to guarantee that �L+1QL
`=0 (1 + � (`)) <
1: A su¢ cient condition to guarantee this condition is that innovation costs are suchthat > (�= (1� �))2 (w1=A) :
The investment in innovation are driven by the adjustment cost technology thatwe have assumed. The �rst order conditions with respect to � (l) are given byPL
`=0 �`�w (`)� �� (`)2
�1� �L+1
QL`=0 (1 + �
� (`))=
�l 2�� (l)
�L+1QL
`=0;` 6=l (1 + �� (`))
all `
so
V ��L�+1
L�Y`=0
(1 + �� (`)) = �l 2�� (l) (1 + �� (l)) all ` (6)
Clearly, the left hand side does not depend on l and so since
@� (l) + � (l)2
@� (l)= 1 + 2� (l) > 0
and �l decreases with l as � < 1;
�� (l) � �� (l0) all l < l0;
with equality when �� (l) = 0 all l in the case of stagnation when L� =1: Note thatthe fact that the investment is positive in all periods (when there is no stagnation) isonly the result of discounting and the adjustment costs. Without adjustment costs wewould only invest in the last period before the switch to a new technology. Note alsothat the above equation implies that � (0) > 0 if L� is �nite. That is, the economywill invest positive amounts in innovation capital, as long as it eventually switches toa new technology. Innovation is positive every period in the case of no stagnation. Inthe stagnation case �L
�+1 = 0 and so the left hand side of the �rst order conditionis equal to zero and so �� (l) = 0. Note that even in this case the solution to theinnovation knowledge problem satis�es the �rst order condition since the marginalcost of zero investment is zero.It is optimal to add another layer of expertise as long asPL
`=0 �`�w (`)� ��L (`)
2�1� �L+1
QL`=0 (1 + �
�L (`))
�PL�1
`=0 �`�w (`)� ��L�1 (`)
2�1� �L
QL�1`=0
�1 + ��L�1 (`)
� > 0 (7)
where ��L in the �rst term denotes the optimal innovation policy given that we switchtechnologies every L + 1 periods. Note the two compensating e¤ect. First, as we
23

increase the number of periods we exploit a given technology we increase the totalincome we obtain from it. Second, as we delay the switch of technology we discountfor a further period and have one extra period to invest in innovation. Since w (`)is monotone in ` we know that the di¤erence in (7) is monotone too which impliesthat there is a unique L� as we conjectured above (see the upper-left panel of Figure6 below). Note however, that this di¤erence being monotone does not rule out thepossibility that L� = 1. This is the case where the second e¤ect (the discountinge¤ect) dominates the �rst (each technology is more valuable because it is exploited formore periods) for all layers and so only one technology is put in place. As discussedabove in this case there is no investment in innovation capital and so the long-rungrowth rate is zero.We summarize our �ndings in the next proposition:
Proposition 4 Given a common technology in period zero, A0, there exists a uniquecompetitive equilibrium of one of two types:
1. Permanent Growth: The equilibrium exhibits technological cycles of �nite length.This cycles repeat themselves at output per capita that is
QL�
`=0 (1 + �� (`)) times
higher each cycle. Investments in innovation increase with the number of layersin the organization, �� (l) < �� (l0) all l < l0. Furthermore �� (0) > 0; so theeconomy exhibits positive permanent growth. The average long-run growth rate
is given by L�qQL�
`=0 (1 + �� (`)):
2. Stagnation: The equilibrium exhibits decreasing growth rates that converge tozero. Output per worker converges to w1: Investment in innovation is equal tozero each period and the long run growth rate is equal to zero as well.
Figure 6 presents one example of an equilibrium allocation with positive permanentgrowth (�rst type of equilibrium). In the upper-left corner we show the total value ofswitching technologies every certain number of layers. The maximum of this curve isV � and is obtained at L�. The plot stops at layer 21, and reaches a maximum at L� =20: So the equilibrium allocation for these parameter values (� = :87, h = :5, c = :9;
and = 50 (we keep this value constant throughout the paper)) exhibits technologicalcycles every 21 periods. Note how the value increases the most when we lengthen thetechnology cycles from zero to one period, as developing the �rst organizational layerimplies the largest gains. The lower-left panel shows the investment in innovation
24
during the 21 periods this technology is exploited. At the beginning when only afew layers of organization have been formed, the switch to the boundary technologyis far away in the future, so agents invest little in innovation. As the time of theswitch approaches, agents invest progressively more. As Equations (6) reveal, thispath is driven essentially by the discount factor �. The higher � the more even areinvestment over the cycle. Note that agents invest a positive amount each period sothe frontier technology is constantly improving.
0 5 10 15 20 251.5
2
2.5
3
Max Layer
V
0 50 100 150 200 250 3002
1
0
1
2
3
T ime
Log
(wt)
0 5 10 15 200
0.01
0.02
0.03
0.04
Layer
ζ
0 10 20 30 40 502
1.5
1
0.5
T ime
Log
(wt)
β = 0.87, h = .5, c = .9
Figure 6
The right column of Figure 6 presents the natural logarithm of output per capita orwages ( ~w (A;L)). The upper panel presents the long term view of this variable over300 periods. It is clear that although output per capita grows in cycles the economyexhibits constant long term growth as we formalized in the previous proposition. Thelower panel present a close up of equilibrium wages for two technological cycles. Inthe previous section we discussed the general shape of ~w (A;L). This �gure illustrates
25

the time of the switch between technologies. As it is clear from the period, wages fallfor at least a period before recovering and surpassing the old technology wages. Thereason for the drop in wages is that the economy is losing the stock of organization (theold markets for expertise are not longer used). This implies a short term reductionin output per capita, although, of course, the economy wins in the long run, as thetiming of the switch is optimal.The second type of equilibrium, the one with stagnation, start similarly to the
equilibrium in Figure 6, but instead of the value function reaching a maximum, thevalue function is strictly increasing but at a decreasing rate. Increases in the valuefunction are always positive but converge to zero as we increase the maximum numberof layers. Hence, the economy stays with the same technology forever, and ln ~w (A;L)converges, so growth rates go to zero.We can now come back to the problem of a two period lived agent. Such an agent
will buy a frontier technology (which allows him to produce with any technology belowthat) when his young and wants to produce. He will invest in innovation and improvehis frontier technology and will sell it when he is old. In fact, the way in which wehave setup the problem implies that the only way in which this agent can save is viatechnology (Of course, we could also add physical capital to the model in a standardway.) A technology includes all innovation knowledge acquired by society up to thatpoint. In particular, it allows the agent to use the technology currently in place, butit also gives the agent the state of the art technology. The price of technology will bea function of the level of alternative technology being bought, the technology beingused, and the number of layers in the current organization (the three state variablesin our problem). Hence, the price of a technology is given by ~P (A;A0; L) : Note that,as we argued for the value function above, this function needs to be homogenous ofdegree one in A and A0: Hence,
~P (A;A0; L) = A ~P
�1;A0
A;L
�� AP
�A0
A;L
�:
The problem of the agent is then
max
24 max� w (L) + �P (G0; L+ 1)� P (G;L)� �2;
max� G0 (w (0) + �P (G0; 1))� P (G;L)� �2;
35where
G0 = G (1 + �) :
26
Note that this problem is identical to the one we solved above if we let P (G;L) =p+V (G;L) for any constant p. That is, prices will be identical to the value functionup to lump sum transfers between generations. If p = 0 and we let prices be identicalto the value function we are letting the �rst generation extract all the surplus thatcan be generated from the initial technology they own. If p = �V (1; 0) then this�rst generation does not get any of this surplus. For our purpose what is importantis that this transfers do not change the equilibrium allocation in this economy apartfrom consumption. Hence, they do not a¤ect growth, the length of cycles, or theorganization of production.Nevertheless, formulating the problem above is useful because it allows us to under-
stand the role that technology appropiability plays in this economy. By appropiabilitywe refer to the fraction of the payment for technology done by future generations thatthe owner of the technology obtains. That is, suppose that appropiability is very low,since we are modelling a country in which markets for technology are either taxed orvery ine¢ cient. Then there will be a gap between the price paid for technology byfuture generations and the price received by the old generation that owns the tech-nology. The higher appropiability is in an economy, the more incentives agents haveto innovate, since they will receive a higher price in return for their technology in thefuture. It is easy to see from the previous equation that the level of appropiability istechnically equivalent to the discount factor �. So this parameter plays a double role,as a discount factor and as the level of appropiability in an economy. The higher � thehigher appropiability and the more incentives do agents have to invest in innovatingthe current technology. It is immediate from Equation (5) and the envelope theoremthat a higher � (an economy where technology is more appropriable) implies a higherwelfare level. As we will discuss in the next section, a higher � also implies a smallerset of parameter values for which the economy stagnates.
3. THE EFFECT OF INFORMATION AND COMMUNICATIONTECHNOLOGY ON GROWTH
In this section we study the e¤ect of information and communication technology(ICT) on growth. We start by discussing the e¤ect of ICT on growth in the case wherethe economy never stagnates. In the next subsection we study the circumstances inwhich economies never switch technologies and stagnate.
27

3.1. The Permanent Growth Case
We explore the model numerically, since as we will show some of the e¤ect ofinformation technology are quite complex. First note that the e¤ect of the costof acquiring information c and the cost of communication h change innovation andgrowth in the economy only through their e¤ect on the wage schedule w (L). This isevident from the problem in (5), as c and h do not enter directly in the problem. SoICT a¤ects the dynamic technology innovation process only by changing the bene�tsof exploiting the current and future technologies. Essentially ICT is a technology thatallows society to exploit other technologies. So better ICT, either through reductionsin c or reductions in h, implies increases in ~w (L) that, if we apply the envelopetheorem to (5), result in increases in welfare. That is,
dV �
dc�
PL�
`=0 �` dw(`)
dc
1� �L+1QL
`=0 (1 + �� (`))
< 0
since d ~w (`) =dc < 0 and
dV �
dh�
PL�
`=0 �` dw(`)dh
1� �L+1QL
`=0 (1 + �� (`))
� 0
since dw (`) =dh � 0 with equality if L� = 0. The expressions are only approxi-mate since L is a discreet variable so the envelope theorem does not apply exactly.These expressions then imply that welfare always increases with improvements of ICTindependently of the source (unless L� = 0 in which case welfare is unaltered).Even though the e¤ect of ICT on welfare is to unambiguously increase it, the same
is not necessarily true for growth. Note that welfare could be increased by consumingmore early and investing less in the future, as the future is discounted because of thestandard reasons and, as we argue above, limits to the appropiability of technology.However, this is never the case for reductions in the cost of acquiring information c.As Figure 7, where we �x h = :8; illustrates, a reduction in c leads to shorter cyclesand less organization, but faster growth. A reduction of c makes organization lessnecessary as acquiring information is cheaper and so agents acquire more. Hence,the number of layers of organization built to exploit a technology decreases. Eventhough there is less organization in the economy, growth increases as each technologyis more valuable since solving problems is more a¤ordable. This increases the value ofpresent and future technologies which incentivates agents to innovate more since their
28

innovations will be exploited more e¢ ciently. Note also that if the value of futureinnovations is discounted less (or is more appropiable) the growth rate increases.
0.5 0.55 0.6 0.65 0.7 0.75 0.8 0.85 0.9 0.95 10
0.01
0.02
0.03
0.04
0.05
0.06
c
Gro
wth
Rat
e
0.5 0.55 0.6 0.65 0.7 0.75 0.8 0.85 0.9 0.95 10
5
10
15
20
25
30
c
Max
Lay
er
β = .87β = .88β = .89β = .90
β = .87β = .88β = .89β = .90
Figure 7
Figure 8 shows two examples of the simulations presented in Figure 7. We �x� = :87 and change c from :9 to :7: Figure 7 shows how the value function increasesalmost proportionally as we decrease c, but the maximum number of layers decreasesas organization is less useful since knowledge is cheaper. As c decreases investmentsin innovation increase in all periods although innovations are accumulated for lessperiods as the technology cycles are shorter. The net e¤ect is an increase in thegrowth rate as can be seen in the upper-right panel. Note how reductions in c increaseoutput per capita almost proportionally given a technology.The e¤ect of changes of communication technology on growth is more complicated.
The main reason is that a reduction in h changes the output per capita extractedfrom a given technology more, the more organized is the technology. That is, themore heavily intensive is the exploitation of technology on communication. Hence,
29
when agents are self-employed and there is no organization, changes in h do not a¤ectoutput per capita.
0 2 4 6 8 10 121
1.5
2
2.5
3
Max Layer
V
0 50 100 150 200 250 3002
0
2
4
6
T ime
Log
(wt)
0 2 4 6 8 10 120
0.005
0.01
0.015
0.02
0.025
0.03
Layer
ζ
0 5 10 15 20 251.8
1.6
1.4
1.2
1
0.8
T ime
Log
(wt)
β = .87, c = .7β = .87, c = .9
Figure 8
Figure 9 illustrates the e¤ect of reductions of h on growth. Note that reductionsin h increase the length of technology cycles and the use of organization when com-munication costs a high. This is intuitive, as smaller communication costs implythat building organizations is less costly. Agents can leverage their knowledge more,since they can deal with more problems as their span of control increases. However, astechnology can be exploited more e¢ ciently because building organizations is cheaper,the value of current and future technologies increases. On the one hand, increasesin the value of present technologies reduce the incentives to innovate. On the other,increases in the value of future technologies increase the incentives to innovate. Notehowever, that since value is added by building larger organizations, the e¤ects onfuture technologies are discounted more. So if � is small, the increase in the value ofthe present technology dominates, reduces investments in innovation and decreases
30

growth. In contrast if � is large, the second e¤ect dominates and the increase in thevalue of future technologies leads to more innovation and growth.10 Figure 9 showsthat reductions in h can reduce the length of the cycles if h is small (we let c = 0:9).This is because when h is small the value of organizing is concentrated more heavilyin the �rst few layers.
0.2 0.3 0.4 0.5 0.6 0.7 0.8 0.9 10
0.02
0.04
0.06
0.08
0.1
h
Gro
wth
Rat
e
0.2 0.3 0.4 0.5 0.6 0.7 0.8 0.9 10
5
10
15
20
25
h
Max
Lay
er
β = 0.87β = 0.88β = 0.89β = 0.90
β = 0.87β = 0.88β = 0.89β = 0.90
Figure 9
Figure 10 illustrates the point that improvements in communication technology canhave negative e¤ects on growth when appropiability is low (� is low). It shows thee¤ect of a reduction in communication costs when appropiability is high and whenappropiability is low. It is clear from the picture that h does not a¤ect wages in the�rst period, as we argued above. It is also clear that for both ��s, investments ininnovation are higher when h is high. However, agents also invest for fewer periods.The total accumulated e¤ect is larger for lower h only when appropiability is high.
10Note that changes in h do not change the speed at which one layer of organization can be built.If it did, decreases in h would lead to increases in growth for a wider range of parameter values.
31

This exercise illustrates what we believe is an important point about the e¤ectof communication technology on growth. Communication technology can improvecurrent technology and perpetuate its use for longer as it makes organization moree¢ cient. This will increase welfare but reduce growth if appropiability is low. Hence,what the model tells us is that countries where technology markets are not welldeveloped and appropiability is low or de�cient will experience negative e¤ect ofimprovements in communication technology on their growth rates. However, as theyimprove communication technology, their technology cycles will eventually becomeshorter and growth will start to increase.
0 5 10 15 201.5
2
2.5
3
Max Layer
V
0 50 100 150 200 250 3002
0
2
4
6
T ime
Log
(wt)
0 5 10 15 200
0.01
0.02
0.03
0.04
Layer
ζ
0 5 10 15 20 25
1.6
1.4
1.2
1
T ime
Log
(wt)
β = .87, h = .7β = .87, h = .9β = .90, h = .7β = .90, h = .9
Figure 10
3.2. Stagnation
As we discussed in the previous section, there are cases in which the economy stag-nates as agents decide optimally not to invest in innovation. The reason is that agents
32

prefer to extract more from the current technology in the near future through the de-velopment of organizations than to invest and innovate in the long term. Buildingorganizations takes time and so there is a trade-o¤ between exploiting technologiesbetter and long term innovation.It is easy to understand the e¤ect of on the possibility of stagnation. Clearly, the
higher the larger the set of parameters for which the economy will stagnate. Thiscan be seen from the fact that the value of an agent in period zero is decreasing in for all �nite L; namely,
d
�PL`=0 �
`(w(`)� �(`)2)1��L+1
QL`=0(1+�(`))
�d
< 0
by the envelope theorem but the value of never switching, given byP1
`=0 �`w (`) is
independent of c:The e¤ect of the other three parameters is more complicated and cannot be signed
analytically so we proceed with numerical simulations. Figure 11 shows a graphsimilar to Figure 7 but for a range of c�s that includes larger values and for smallervalues of �. As in Figure 7 we can see that a larger c implies a lower growth rate:The cost of acquiring knowledge has a negative e¤ect on growth. However, now theFigure also illustrates how there is a threshold of c over which economic growth dropsto zero. Further increases in the cost of knowledge have no e¤ect on growth that staysat zero. That is, numerically we �nd a threshold for c over which there is stagnation.The lower panel of Figure 11 shows how the number of layers explodes to in�nity
as we approximate the threshold.11 The logic for this result is straightforward. As cincreases knowledge acquisition becomes more expensive which implies that organiza-tion becomes more useful to exploit technologies: Agents want to leverage knowledgemore since knowledge is more costly. However, as agents increase the number of lay-ers to leverage their knowledge, they also push back the date at which innovationswould happen and so investing in innovation becomes less attractive. At some pointthe gains from innovation are so low (given that it will happen only in the very longrun and agents discount the future) that it is better to keep exploiting the currenttechnology. Of course, the more agents discount the future (or the less they can ap-propriate the value of innovation) the less valuable are future innovations and so thelower the threshold of c for which the economy stagnates.
11We calculate the equilibrium allowing for a maximum of 100 layers. If the value function isstrictly increasing for all 100 layers we set L� =1 and the growth rate to zero.
33

0.8 0.85 0.9 0.95 1 1.05 1.10
0.005
0.01
0.015
0.02
0.025
c
Gro
wth
Rat
e
h = 0.8
0.8 0.85 0.9 0.95 1 1.05 1.10
20
40
60
80
c
Max
Lay
er
β = .87β = .86β = .88β = .89
β = .87β = .86β = .88β = .89
Figure 11
This exercise as well as the one in the previous subsection indicates how in ourmodel the growth rate of an economy and the cost of acquiring knowledge are related.However, the model also indicates why, in a cross-section of countries with di¤erentc�s, output, knowledge acquisition and investments in innovation are not perfectlycorrelated.The e¤ect of communication technology on the set of parameters for which we
obtain stagnation is more complicated. The reason is, essentially, the non-monotonee¤ect of h on the length of the technology cycle. For large values of h the maximumnumber of layers organized for a given technology is relatively low as the span ofcontrol of agents is small (and therefore their ability to leverage their knowledgethrough organizations). For small values of h the value of creating the �rst layers oforganization is so large, that it is more valuable to keep innovating and organizing onlythese �rst set of expertise markets. For intermediate values of h the e¤ect the number
34

of layer is large as organization is useful because spans of controls are relatively largebut the di¤erence between the value of the �rst and later layers is not large enoughto want to only organize the �rst layers and innovate quickly. Hence, it is for theintermediate values of h for which the number of layers might explode and we canobtain a stagnating economy. This is illustrated in Figure 12 which parallels Figure 8but includes lower values of the discount factor or appropiability level �. The �gureshows how as we decrease � the set of values of h for which we obtain appropiabilityincreases. As we have argued, and as the lower panel shows, these are the parametervalues for which L� =1.
0.2 0.3 0.4 0.5 0.6 0.7 0.8 0.9 10
20
40
60
80
h
Max
Lay
er
0.2 0.3 0.4 0.5 0.6 0.7 0.8 0.9 10
0.01
0.02
0.03
0.04
h
Gro
wth
Rat
e
c = .9
β = .860β = .865β = .870
β = .860β = .865β = .870
Figure 12
The welfare e¤ects still hold. Decreases in h always increase welfare in this econ-omy, independently of whether the economy stagnates or not. However, h will a¤ectthe growth rate dramatically. Communication technology is a technology to exploittoday�s and future�s technologies, and the cost of using it is that it takes time sincesociety has to organize these markets for expertise. If this technology is good, but
35

not great, the value of organizing many of these markets is very large and so societyprefers to do that than to invest in innovations that will bene�t output only in thevery far future. But how can an economy with zero growth maximize welfare? Thekey is that we are maximizing welfare from today�s perspective of an in�nitely livedagent (or a dynasty of two period lived agents). These agents value a lot the sav-ings from not investing in innovation today and value little the fact that output percapita does not go up in the future. So, in this economy, stagnation is a choice ofthe country�s ancestors. Current agents do not change the choice because the level oftechnology is too low relative to output (given the large organizations) to start invest-ing in innovation; it would take too long (or it would be too expensive) to improvethe alternative technology enough to make a technological switch valuable.
4. CONCLUSIONS
Change is a fundamental aspect of growth. Growth is not a smooth continuousprocess of accumulation. As the �new growth literature�has recognized, it involvesthe creation and destruction of products and, as we underscore, of organizations.Each new idea requires a particular type of knowledge, and new organizations � withexperts in the relevant sets of knowledge� gradually emerge to exploit this knowl-edge. When technology is revolutionized, knowledge becomes obsolete and so do theorganizations that have developed to allocate it and exploit the existing technology.Our paper provides a new framework to think about this process.Our theory is useful to understand the e¤ect of ICT on productivity growth. De-
creases in communication costs that allow for the establishment of deeper hierarchiespermit more exploitation of existing knowledge and may increase the rate of inno-vation. However, by making exploitation more attractive, they may also, if agentsdo not value the future enough, decrease the rate of growth, even to the extent ofstopping the growth process altogether. In contrast, reductions in the cost of acquir-ing information always increase growth, as organizations become less valuable sinceknowledge is less expensive. In sum, the e¤ect of ICT on productivity growth de-pends crucially on whether ICT increases or decreases the value of organization. If itdecreases it, we will see organizations with less layers, faster innovation and growth.Otherwise, we will see larger organizations with more layers and slower growth orstagnation.An interesting avenue for future research concerns the dynamics of switching to
36

entirely new technologies. In our analysis, given that agents are homogeneous, allagents switch at the same time. An analysis with heterogeneous agents would bringabout deeper, game theoretical, considerations to the switching decision that maybe of interest. Agents need to form expectations on when and who will switch tonew technologies; such expectations will a¤ect their own investment paths and themoment of their own switching. We believe our framework is simple and �exibleenough to permit an analysis of such issues.This paper studies a one good economy, and thus when a radical innovation is in-
troduced all the existing knowledge, and the existing organization, is made obsolete.Clearly, this is an extreme conclusion. While it is quite reasonable that the develop-ment of the automobiles wiped out the stagecoach industry, it is clearly not the case,in a multi-good economy, that all existing �rms disappear. Thus another avenue forfuture research may generalize the model to a world with di¤erentiated commodities,which would yield a smoother prediction.To conclude, we view our analysis as the start of an e¤ort to understand, at a
deeper micro-economic level, the use of the labor input usually introduced in aggregateproduction functions. What matters for development is not how many units of laborare used, but how these units are organized, and how this changes over time. We areconvinced that, in a world where the sources of growth are the creativity and the ideasof individuals, understanding the way individuals organize to produce is fundamentalto our understanding of the observed income di¤erences across countries.
37
5. APPENDIX
5.1 Proof of Proposition 2
Use (3) to obtain the knowledge of each agent as a function of the price the agentreceives for a problem passed. Letting � � ech
�and � � A� ech
�and using (2 we obtain
the following recursion for the set of prices:
rL�1L = � � hwLL + � ln�
A
r`�1L = � � hw`L + � ln��
A� r`L� for 0 < ` < L:
Imposing (4) for ` = 1; :::; L� 1 we obtain that
rL�1L = � � h ~w (A;L) + � ln�
A(8)
r`�1L = � � h ~w (A;L) + � ln��
A� r`L� for 0 < ` < L:
For a given ~w (A;L) there exists at most one r0L > 0 such that the whole systemholds. Speci�cally, note that given ~w (A;L) we can determine rL�1L : So choose some~w (A;L) > 0 such that the resulting price rL�1L > 0 (and abusing notation slightlydenote by r`L ( ~w) the solution of the system above given ~w). It is easy to see that,since rL�1L > 0; rL�2L ( ~w) > rL�1L ( ~w) : Repeating this argument we can conclude that�r`L ( ~w)
L�1`=0
is decreasing in `. It is also immediate from (3) that the higher the price
the lower the corresponding knowledge level, so�z`L ( ~w)
L`=0
is increasing in ` (notethat for z0L there is an extra e¤ect coming from the fact that workers cannot spantheir knowledge over many problems, a missing h in (3)). Condition 1 guaranteesthat the resulting values
�z`L ( ~w)
L`=0
are positive, as r`L ( ~w) < r1 since when L!1all prices are positive (as opposed to zero in layer L) and, as can be readily observedin the system of equations above, prices in layer `� 1 are increasing in prices in layer`: Note also that as the price at which agents in layer L can sell problems is equal tozero, the prices for all other layers are strictly positive.Note that r0L ( ~w) is decreasing in ~w as
dr0L ( ~w)
d ~w= �h+ �
A� r1L ( ~w)
dr1L ( ~w)
d ~w
38

anddrL�1L ( ~w)
d ~w= �h;
sodr0L ( ~w)
d ~w= �h
1 +
L�1X`=1
Yk=1
�
A� rkL ( ~w)
!< 0;
and we can therefore invert it to obtain wsL (r0L) which is also a continuous and strictly
decreasing function.Now consider the equation determining the wages of production workers and de�ne
wpL�r0L�= A� ec
�
�1� ln ec
� (A� r0L)
�(9)
which is a continuous and strictly increasing in r0L:The last equilibrium condition is given by (4) for ` = 0; and so wsL (r
0L) = wpL (r
0L)
for the equilibrium r0L: Since wsL is strictly increasing and w
pL is strictly decreasing, if
a crossing exists it is unique. But note that at r0L = A�ec=�; wpL (A� ec=�) = A�ec=�and
wsL (A) =ec�h� ec�+ec�ln
ech��A� r`L
�<ec�
�1
h+ lnh� 1
�< A� ec=�
by Condition 1 and r0L > r1L: Hence, wpL (A� ec=�) > wsL (A� ec=�) :
Now let r0L = 0: Then
wpL(0) = A� ec�+ec�lnec�A
and note that
wsL (0) =A
h� ec�+ec�ln
ech� (A� r1L)
>A
h� ec�+ec�lnec�A
since h < 1 and r1L � 0. Thus, wpL (0) < wsL (0) : The Intermediate Value Theoremthen guarantees that there exists a unique value r0L such that w
sL (r
0L) = wpL (r
0L) and
so a unique equilibrium exists.�
39

5.1 Proof of Proposition 3
Consider the individual incentives of an agent in period t to form layer L+1 giventhat the economy�s highest layer is L. Such an agent can use the problems thrownaway by the agents in layer L: The wage such an agent in layer L+1 would commandis given by
A
h� ec�
�1� ln ech
�A
�which is always greater than the equilibrium wage in the economy given by
wt =A� rL�1L
h� ec�
�1� ln ech
�A
�;
since as shown in the previous proposition rL�1L > 0. Therefore, in the next periodsuch an agent has incentives to enter and form layer L+1: Of course, once he enters,agents in layer L will demand a positive price for their problems and so some of thesurplus will be distributed to other agents in the economy. However, the economy asa whole will produce more output as the higher price is only a redistribution of wealthbetween agents. Agents will also re-optimize and choose di¤erent levels of knowledge�z`LL`=0
which will increase the surplus, as they have the option to choose the samelevel of knowledge they chose before. Hence, ~w (A;L) > ~w (A;L+ 1) for all L.This result can be formally proven as follows. Consider r0L ( ~w) de�ned in the proof
of Proposition 2. As rLL = 0 (the last layer throws problems away) but rLL+1 > 0
and since for a given w; by Equations (8), r`�1L+1 is increasing in r`L+1; we obtainthat r0L (w) < r0L+1 (w) : Now de�ne the function r
p using Equation (9), the price ofproblems sold by workers, as
rp (w) � A� ec�e�ec (A�w)�1:
In an equilibrium with L layers we know that rp ( ~w (A;L)) = r0L ( ~w (A;L)) and inan equilibrium with L + 1 layers rp ( ~w (A;L+ 1)) = r0L+1 ( ~w (A;L)) : Since r
0L (w) <
r0L+1 (w) and r0p (w) > 0 and r00L (w) < 0, this implies that ~w (A;L+ 1) > ~w (A;L)
and that r0L+1 > r0L: By (8) this in turn implies that r`L+1 > r`L for all ` < L� 1: Note
also that by (3) this implies that z`L+1 < z`L for all ` < L� 1:Note that as we have shown in Proposition 2, r`L < r1 for all ` and L �nite. Hence,
since�r`L1L=0
is a strictly increasing and bounded sequence it has to converge for all
40

`: Since the equilibrium is unique as shown in Proposition 2 the limit is r1. Hence, asL!1,
�r`L1L=0
approaches r1 from below. Equations (3) then imply that�z`L1L=0
converges to z`1 from above.�
41

REFERENCES
[1] Acemoglu, Daron and Robinson, James, 2005a. �Institutions as the FundamentalCause of Long Run Growth,�, Handbook of Economic Growth. North Holland.
[2] Acemoglu, Daron and Robinson, James, 2005b. �Unbundling Institutions,�Journalof Political Economy, 113: 5, 949-995.
[3] Aghion, Philippe and Howitt, Peter, 1992. �A Model of Growth Through CreativeDestruction,�Econometrica, 60:2, 23-351.
[4] Arrow, Kenneth J., 1974. The Limits of Organization. Norton, New York.
[5] Susanto Basu, John G. Fernald, Nicholas Oulton and Sylaja Srinivasan, 2003. �TheCase of the Missing Productivty Growth: Or, Does Information Technology Ex-plain why Productivity Accelerated in the US but not the UK?,�NBERWorkingPaper 10010.
[6] Chari, V V and Hopenhayn, Hugo, 1991. �Vintage Human Capital, Growth, and theDi¤usion of New Technology,�Journal of Political Economy, 99:6, 1142-65.
[7] Comin, Diego and Bart Hobijn, 2007. �Implementing Technology,�NBER WorkingPapers 12886.
[8] Garicano, Luis, 2000. �Hierarchies and the Organization of Knowledge in Produc-tion,�Journal of Political Economy, 108:5, 874-904.
[9] Garicano, Luis and Rossi-Hansberg, Esteban, 2006. �Organization and Inequality ina Knowledge Economy,�Quarterly Journal of Economics, 121:4, 1383-1435.
[10] Granger, Clive W.J. �The Typical Spectral Shape of an Economic Variable,�Econo-metrica, 1966: ,150-161,
[11] Grossman, Gene M. and Helpman, Elhanan, 1991. �Quality Ladders in the Theoryof Growth,�Review of Economic Studies, 59:1, 43-61.
[12] Gust Christopher and Jaime Marquez, 2004. �International comparisons of productiv-ity growth: the role of information technology and regulatory practices,�LabourEconomics, 11(1).
42

[13] Jorgenson, Dale, 2005. �Accounting for Growth in the Information Age,�in PhilippeAghion and Steven Durlauf, eds., Handbook of Economic Growth, Volume 1A,North-Holland: Amsterdam, 743-815.
[14] Jovanovic, Boyan and Nyarko, Yaw, 1996. �Learning by Doing and the Choice ofTechnology,�Econometrica, 64:6, 1299-1310.
[15] Jovanovic, Boyan and Rob, Rafael, 1990. �Long Waves and Short Waves: Growththrough Intensive and Extensive Search,�Econometrica, 58:6, 1391-1409.
[16] Jovanovic, Boyan and Rob, Rafael, 1989. �The Growth and Di¤usion of Knowledge,�Review of Economic Studies, 56:4, 569-82.
[17] Krusell, Per and Ríos-Rull, José-Víctor, 1996. �Vested Interests in a Positive Theoryof Stagnation and Growth,�Review of Economic Studies, 63:2, 301-329.
[18] Kuznets, Simon., 1940. �Schumpeter�s Business Cycles,�American Economic Review,30:2, 257-271.
[19] Kydland, Finn E. and Prescott, Edward C. 1982. �Time to Build and AggregateFluctuations,�Econometrica, 50:6, 1345-70.
[20] Legros, Patrick Legros, Andrew F. Newman and Eugenio Proto, 2007. �SmithianGrowth through Creative Organization,�mimeo, ECARES.
[21] Lucas, Robert Jr., 1988. �On the Mechanics of Economic Development,�Journal ofMonetary Economics, 22:1, 3-42.
[22] Luttmer, Erzo, G. J., 2007. �On the Mechanics of Firm Growth,�mimeo, Universityof Minnesota.
[23] North, Douglass C., 1981. Structure and Change in Economic History, New York;W.W. Norton & Co.
[24] Penrose, Edith T., 1959. The Theory of the Growth of the Firm, Oxford, OxfordUniversity Press.
[25] Pilat, Dirk, Frank Lee and Bart Van Ark, 2002. �Production and the Use of ICT; Asectoral perspective on productivity growth in the OECD area�OECD EconomicStudies, N35, 2002/2.
43
[26] Pilat, Dirk and Anita Wolf, 2004.�ICT Production and ICT Use: What is the Rolein Aggregate Productivity Growth?�, in OECD The Economic Impact of ICT:Measurement, Evidence and Implications, OECD Publishing, 85-104.
[27] Romer, Paul M, 1990. �Endogenous Technological Change,�Journal of Political Econ-omy, 98:5, S71-102.
[28] Schumpeter, Joseph A., 1939. Business Cycles: A Theoretical, Historical, and Statis-tical Analysis of the Capitalist Process, Vols. I and 11. New York: McGraw-Hill.
[29] Schumpeter, Joseph A., 1942. Capitalism, Socialism and Democracy. New York:Harper and Brothers.
[30] Timmer, Marcel P. and Bart van Ark, 2005, �Does information and communicationtechnology drive EU-US productivity growth di¤erentials?,�Oxford EconomicPapers Advance Access, 57: 693-716.
[31] Young, Allyn A., 1928. �Increasing Returns and Economic Progress,�The EconomicJournal, 38, 527-542.
44