orientation and location dependency of the mechanical ... · sinterização direta de metais por...
TRANSCRIPT

Orientation and location dependency of the mechanical properties of an AlSi10Mg part produced using direct metal
laser sintering (DMLS)
–
a microsample approach
André Diogo Roberto de Sousa
Master thesis
UMBC advisor:
Dr. Marc Zupan
UMBC co-advisor:
Dr. Richard Everett
FEUP advisor:
Dr. Abel Santos
Integrated Master in Mechanical Engineering
Porto, 15 of October 2017


Orientation and location dependency of the mechanical properties of an AlSi10Mg part produced using direct
metal laser sintering (DMLS) – a microsample approach
To my parents and family.


Orientation and location dependency of the mechanical properties of an AlSi10Mg part produced using direct
metal laser sintering (DMLS) – a microsample approach
i
Abstract
Additive manufacturing (AM) has the potential to revolutionize the way the industry and
government agencies design, manufacture, inventory, and deliver countless currently and future
parts utilized in engineering systems. While the rapid evolution of AM has promoted numerous
innovative processes and machines, AM has grown with minimal understanding of the impact
of processing parameters on global part properties making it difficult for industry and the
department of defense to take full advantage of the technology. To realize the full potential of
AM, each AM part must demonstrate a set of minimum performance characteristics. These
characteristics are generally assured by qualifying manufacturing processes and certifying said
processes were followed by competent operators. Currently there is a gap/disconnect between
material processing and part performance that precludes AM parts insertion.
The layer-by-layer approach used by almost all AM machines to build these novel parts has
direct definite ramifications for the microstructures and mechanical properties of these parts.
Layers introduce a build direction anisotropy and synthesis parameter variability, and create
opportunities for defects (e.g., voids) adding complexity to materials microstructures which, in
turn, influence the mechanical properties. Despite the recent interest in additive manufacturing,
the property variations in an AM build are still not known or understood. This is because
conventional mechanical characterization techniques usually measure an average property and
cannot resolve the important variations tied to specific microstructural and defect features
present in the sample. This work uses microtensile testing to reveal how the mechanical
properties of the AM structure vary with orientation, possible defects and location in the build.
In this work microtensile testing, with specimens having a footprint of 1 x 3 mm and a gage
section of ≈250 x 250 μm, has been successfully applied to additively manufactured materials
to determine location- and orientation-specific mechanical properties. A microsample approach
was used to explore and characterize the inhomogeneous performance of an AlSi10Mg
aluminum alloy part produced using direct metal laser sintering (DMLS). The part was
produced using standard EOS process parameters and microsamples were extracted along the
part and oriented along three different directions: two directions parallel to the powder
deposition plane (x and y directions, perpendicular to each other) and one direction parallel to
the build direction (z direction). Microsamples were afterwards prepared for tensile testing and
tested using a microsample tensile testing system. Engineering and true stress-strain responses
Orientation and location dependency of the mechanical properties of an AlSi10Mg part produced using direct
metal laser sintering (DMLS) – a microsample approach
ii
were obtained and Young’s modulus, yield strength and ultimate tensile strength (UTS) values
were determined.
Mechanical properties values showed variability along the part and higher for different
orientations, including along two different orientations parallel to the powder deposition plane,
in contradiction to what is reported in literature. For a given orientation, the Young’s modulus
variability along the part suggests the different prevalence of grains with a specific
crystallographic orientation for each microsample.
Higher values of yield strength were obtained on the y direction, followed by the x and z
directions, respectively. Similarly, UTS values showed to be higher for the z direction, followed
by the y and x direction respectively. The small size of microsamples allowed to explore the
material inhomogeneities, which is not achievable using large size standard samples as in
literature, since they are usually only capable of measuring an average property.
A fractographic analysis to the fracture surface of the tested microsamples using scanning
electron microscopy (SEM) showed that the AM manufactured materials have a mixed mode
deformation, which is in accordance with the observed strains to failure. Necking was not
evident. The SEM images also showed the presence of processing defects, suggesting localized
lack of overlap between melt pools, which is an indicative that an as-fabricated material has
wide spread defects. By working to eliminate the processing defects and improving melt pool
boundary strength, these materials show potential to have increased toughness.

iii
Dependência das propriedades mecânicas com a orientação e a localização
numa peça de liga de alumínio AlSi10Mg produzida por sinterização direta
de metais por laser (DMLS) – uma abordagem usando microprovetes
Resumo
Os processos de fabrico aditivo (do inglês, additive manufacturing) têm o potencial para
revolucionar a forma como a indústria e as agências governamentais projetam, produzem e
disponibilizam inúmeros componentes utilizados em sistemas de engenharia. Ainda que a
rápida evolução do fabrico aditivo tenha proporcionado o aparecimento de vários processos e
máquinas inovadores, tal foi conseguido com um conhecimento e compreensão mínimos da
influência dos parâmetros dos processos nas propriedades globais dos materiais produzidos,
dificultando a possibilidade de beneficiar por completo do potencial desta tecnologia. Para tirar
o maior partido dos processos de fabrico aditivo, cada componente produzido deve apresentar
um conjunto mínimo de requisitos a nível de desempenho. Estes requisitos são geralmente
assegurados com a qualificação dos processos de fabrico e com a certificação da aptidão dos
operadores. Atualmente existe uma falta de conhecimento da relação processamento do
componente – características do componente que impede a inserção de componentes fabricados
por fabrico aditivo.
O fabrico de peças por sobreposição de camadas, usado pela maior parte das máquinas de
fabrico aditivo, tem uma influência direta na microestrutura e, por consequência, nas
propriedades mecânicas dos materiais produzidos. A sobreposição de camadas introduz
anisotropia ao longo da direção de construção e variabilidade de parâmetros, proporcionando
ainda o aparecimento de defeitos, que contribuem para a complexidade da microestrutura dos
materiais obtidos. Apesar do atual interesse nos processos de fabrico aditivo, as variações das
propriedades num material produzido desta forma ainda não são perfeitamente conhecidas ou
compreendidas. Isto deve-se essencialmente ao facto de que as técnicas convencionais usadas
para caracterizar o comportamento mecânico dos materiais apenas medem uma propriedade
média, não possuindo capacidade para explorar as variações importantes associadas às
particularidades microestruturais e de presença de defeitos. Neste trabalho recorre-se ao uso de
microprovetes para explorar e para melhor compreender como as propriedades mecânicas de

iv
um material produzido por um processo de fabrico aditivo variam com a orientação, localização
e presença de possíveis defeitos numa peça.
Neste trabalho, testes de tração a microprovetes com dimensões de 1 x 3 mm e uma secção de
teste com ≈250 x 250 μm foram realizados com sucesso para estudar a dependência das
propriedades mecânicas com a orientação e a localização numa peça produzida por fabrico
aditivo. A abordagem que consiste no uso destes microprovetes foi usada para explorar e
caracterizar a heterogeneidade de uma peça de liga de alumínio AlSi10Mg, produzida por
sinterização direta de metais por laser (DMLS). A peça foi produzida usando parâmetros de
processo padrão de uma máquina EOS e os microprovetes foram extraídos ao longo desta e
para três diferentes orientações: duas direções paralelas ao plano de deposição dos pós
metálicos (direções x e y, perpendiculares entre si) e uma direção paralela à direção de
construção (direção z). Posteriormente, os microprovetes foram preparados para poderem ser
testados à tração e foram tracionados usando uma máquina especialmente concebida para este
efeito. Como resultado dos testes de tração, as curvas de tração de engenharia e reais foram
obtidas e os valores do módulo de Young, tensão limite de elasticidade e tensão de rotura foram
determinados.
Os valores das propriedades mecânicas demonstraram variabilidade ao longo da peça e para
diferentes orientações, tendo sido mais alta no segundo caso. Foram ainda verificadas
diferenças entre as propriedades mecânicas relativas às duas orientações paralelas ao plano de
deposição dos pós metálicos, ao contrário do reportado na literatura. Para uma dada orientação,
a variabilidade do módulo de Young ao longo da peça sugere uma diferente prevalência de
grãos com uma dada orientação da estrutura cristalina para cada microprovete.
Valores superiores de tensão limite de elasticidade foram obtidos para a direção y, seguido das
direções x e z, respetivamente. De uma forma semelhante, valores de tensão de rotura superiores
foram observados para a direção z, seguido das direções y e x, respetivamente. A pequena escala
dos microprovetes permitiu explorar a heterogeneidade do material, o que de outra forma não
é possível com o uso de provetes standard de maiores dimensões, tal como reportado na
literatura. Provetes standard de maiores dimensões são geralmente apenas capazes de medir
uma propriedade média do material.
Uma análise às superfícies dos microprovetes após a rotura foi realizada usando microscopia
eletrónica de varrimento (SEM) e permitiu concluir que os materiais produzidos por fabrico
aditivo possuem um modo misto de deformação, o que está de acordo com os valores de

v
extensão após rotura obtidos. Estricção dos microprovetes não foi visível. Foi ainda possível
observar a presença de defeitos resultantes do fabrico, relacionados com falhas localizadas na
ligação e/ou sobreposição entre cordões de fusão dos pós metálicos. Trabalhando no sentido de
eliminar a presença de defeitos decorrentes do fabrico e melhorando a resistência na ligação
entre cordões de fusão, estes materiais demonstram potencial para possuir valores superiores
de tenacidade.

vi

vii
Acknowledgments
I want to first thank my parents Fátima and Toni for all the support they gave me throughout
my life, including in my academic career. It was thanks to an enormous effort from them in
every way that I could conduct research for my thesis at the University of Maryland, Baltimore
County, in the USA. Moreover, it allowed me to realize my long childhood dream of going to
the US. Thank you for cheering me up in my worst moments, for being so patient with me and
my crazy ideas, and for being always by my side. Thank you for being who you are.
I would also like to thank all my family and friends for all the support and understanding over
the years. Not referring any name intending to not leave anyone apart, each one of them will
know who I am speaking of. Thank you both for the understanding and for always being there
when I need you the most. Love you all.
Thank you to my UMBC advisor, Dr. Marc Zupan. I have learned a lot from and thanks to you.
Thank you for your guidance, patience and great energy. Also, thank you to my UMBC co-
advisor, Dr. Richard Everett, for all your support and all you have taught me. Thank you both
for reviewing my thesis and for all the suggestions given. Finally, thank you to my advisor at
the Faculty of Engineering of the University of Porto (FEUP), Dr. Abel Santos for all the ideas,
understanding and support given.
I also want to thank my lab mates Duffy, Keith and João, from the Micromaterials Laboratory
at UMBC, for all the knowledge and support given which was indispensable for the realization
of this thesis. Particularly Keith, thank you for being the person you are and I wish you the best
of luck in this new step of your life.
The opportunity and possibility to conduct research at UMBC to develop my thesis was possible
thanks to my parents and to the MOBILE + project scholarship, coordinated by the University
of Porto, to which I owe my gratitude.
This research was funded by the Johns Hopkins Applied Physics Lab contract number 140391,
Dr. Steven Storck program manager, and the UMBC-TRIPOS Global Engineering Partnership
to which I also owe my thankfulness.
I would finally like to thank Dr. Lucas da Silva and Ms. Mónica Faria for the understanding
and support, without whom this would not be possible.

viii

ix
Table of Contents
Abstract ..................................................................................................................................................... i
Resumo ................................................................................................................................................... iii
Acknowledgments .................................................................................................................................. vii
List of Acronyms ...................................................................................................................................... xi
List of Figures ........................................................................................................................................ xiii
List of Tables ......................................................................................................................................... xix
1 Motivation ....................................................................................................................................... 1
1.1 Motivation .................................................................................................................................................. 1
1.2 Thesis context and linkage to UMBC ......................................................................................................... 3
1.3 Thesis overview ......................................................................................................................................... 4
2 Literature Review ............................................................................................................................ 7
2.1 Additive Manufacturing .............................................................................................................................. 7
2.2 Direct metal laser sintering (DMLS) ......................................................................................................... 22
2.3 Aluminum alloys - AlSi10Mg .................................................................................................................... 25
2.4 Scanning electron microscopy (SEM) ...................................................................................................... 29
2.5 Summary ................................................................................................................................................. 32
3 Material Production ....................................................................................................................... 35
3.1 Introduction .............................................................................................................................................. 35
3.2 AlSi10Mg part production ........................................................................................................................ 36
4 Microsample Testing..................................................................................................................... 41
4.1 Introduction .............................................................................................................................................. 41
4.2 Microsample extraction and preparation .................................................................................................. 46
4.3 Microsample testing ................................................................................................................................. 54
4.4 Strain measurement – Digital image correlation ...................................................................................... 58
4.5 Summary ................................................................................................................................................. 61
5 Results and analysis ..................................................................................................................... 63
5.1 AlSi10Mg mechanical properties analysis ............................................................................................... 64
5.2 Statistical significance.............................................................................................................................. 80
5.3 Fractographic analysis - scanning electron microscopy (SEM) ............................................................... 82

x
5.3.1 Microsample preparation for SEM imaging and parameters used ............................................... 82
5.3.2 Fractographic analysis ................................................................................................................. 83
5.3.3 Final remarks ............................................................................................................................... 94
6 Conclusions and Future Work ...................................................................................................... 97
6.1 Conclusions ............................................................................................................................................. 97
6.2 Future research ....................................................................................................................................... 99
References .......................................................................................................................................... 101

xi
List of Acronyms
AM – Additive manufacturing
ASTM – American Society for Testing and Materials
CAD – Computer-aided drafting
CCD – Charge-coupled device
CNC – Computer numerical control
DED – Direct energy deposition
DIC – Digital image correlation
DMLS – Direct metal laser sintering
EDM – Electric discharge machining
EVA – Extra Vehicular Activities
FCC – Face-centered cubic
FEF – Freeze-form extrusion fabrication
FEUP – Faculty of Engineering of the University of Porto
FGM – Functionally graded materials
FSW – Friction stir welding
ISDG – Interferometric strain/displacement gage
MML – Micromaterials Laboratory
PBF – Powder bed fusion
SEM – Scanning Electron Microscopy
STL – Stereolithography
UMBC – University of Maryland, Baltimore County
UTS – Ultimate tensile strength
YS – Yield strength

xii

xiii
List of Figures
Figure 1 – Schematic representation of the typical building strategy used to fabricate a part by means
of additive manufacturing technologies (Diego Manfredi 2013). ............................................................. 2
Figure 2 – Biomedical hip stems implants in a mesh, hole and solid configurations of Ti6Al4V, fabricated
using EBM (Nannan GUO 2013). ........................................................................................................... 7
Figure 3 – Stereolithography model of a human cranium, used to effectively plan a surgical treatment,
using a photosensitive resin (Gebhardt and Hötter 2016, Flaviana Calignano 2017). ........................... 7
Figure 4 – Alumina and silica ceramic cores for investment casting of turbine blades, among others,
produced using SLS (Nannan GUO 2013). ............................................................................................. 8
Figure 5 – Airbus A320 titanium nacelle hinge bracket with optimized topology made by using DMLS
technology (EOS) (Nickels 2015). ........................................................................................................... 8
Figure 6 – Functionally graded material part produced using a triple-extruder freeze-form extrusion
fabrication (FEF) process, with a gradient from 100 % Al2O3 to 50 % Al2O3 and 50% ZrO2 (Nannan GUO
2013). ...................................................................................................................................................... 8
Figure 7 – Two major additive manufacturing categories and the associated AM technologies and
commercial machine supplier names (Seifi 2016). ............................................................................... 11
Figure 8 – Data flow representation in the STL file creation (Hernandez 2012). .................................. 13
Figure 9 – Schematic representation of the steps involved in a part production through an additive
manufacturing process. ......................................................................................................................... 14
Figure 10 – Schematic representation of the powder deposition plane and build direction orientations,
on the fabrication of a part through direct metal laser sintering (DMLS) (Diego Manfredi 2013). ........ 14
Figure 11 - Optical micrographs of vertical (z direction) and horizontal (xy direction) cross-sections of an
AlSi10Mg part obtained through the direct metal laser sintering (DMLS) technology, showing the
presence of melting pools and their geometry (D. Manfredi 2013). ...................................................... 15
Figure 12 – Field emission scanning electron microscope (FESEM) micrograph of an AlSi10Mg part
obtained through the direct metal laser sintering (DMLS) technology, at increased magnification (D.
Manfredi 2013). ..................................................................................................................................... 16
Figure 13 – Schematic representation of two adjacent melt pools and correspondent important
dimensions and regions, in the fabrication of a part using an additive manufacturing technology. ...... 17
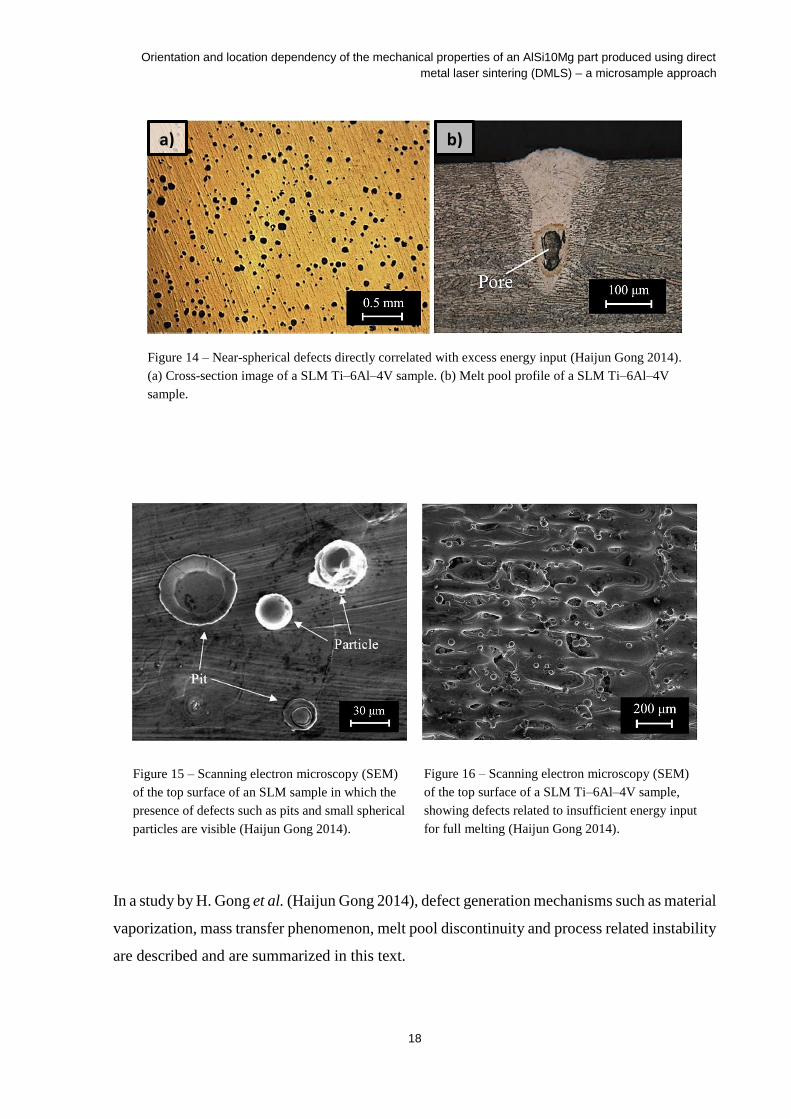
Figure 14 – Near-spherical defects directly correlated with excess energy input (Haijun Gong 2014). (a)
Cross-section image of a SLM Ti–6Al–4V sample. (b) Melt pool profile of a SLM Ti–6Al–4V sample. 18
Figure 15 – Scanning electron microscopy (SEM) of the top surface of an SLM sample in which the
presence of defects such as pits and small spherical particles are visible (Haijun Gong 2014). ......... 18
xiv
Figure 16 – Scanning electron microscopy (SEM) of the top surface of a SLM Ti–6Al–4V sample,
showing defects related to insufficient energy input for full melting (Haijun Gong 2014). .................... 18
Figure 17 – Representation of the four types of melting zones in relation to the laser power and scan
speed for SLM Raymor Ti–6Al–4V powder (Haijun Gong 2014). ......................................................... 19
Figure 18 – Schematic representation of the formation of pits process (Haijun Gong 2014). .............. 21
Figure 19 – EOSINT M 280 machine, by EOS GmbH (GmbH 2010). .................................................. 22
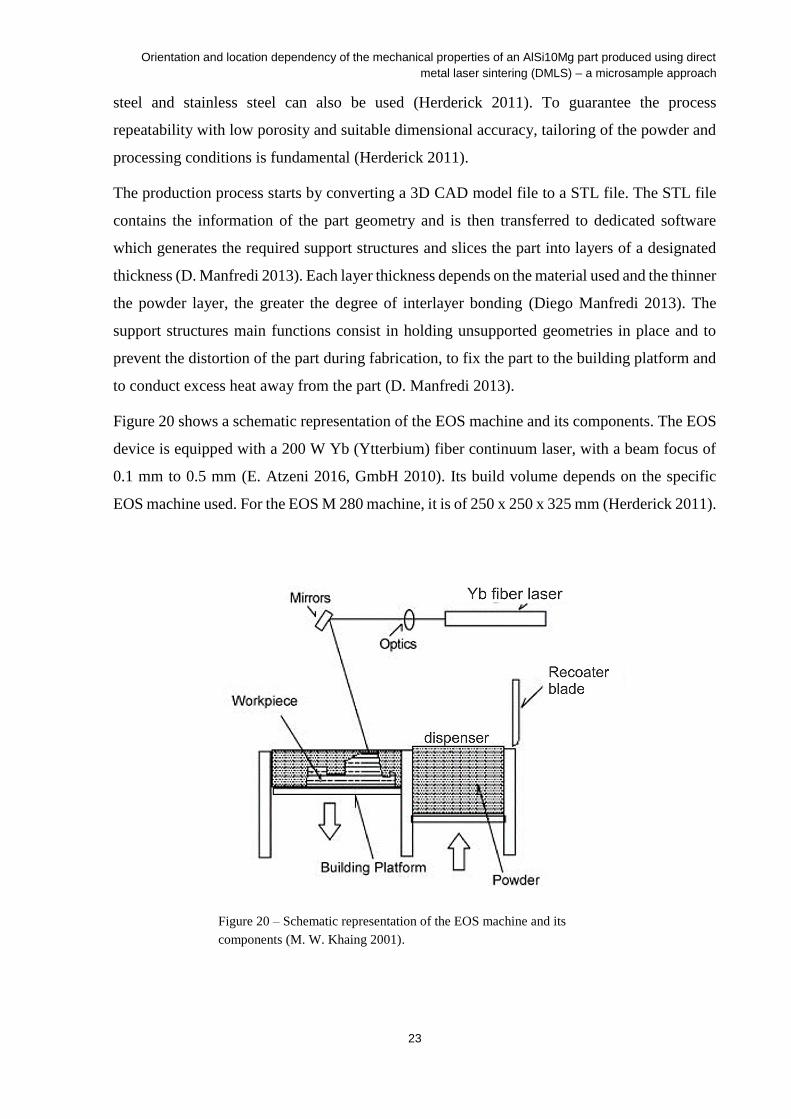
Figure 20 – Schematic representation of the EOS machine and its components (M. W. Khaing 2001).
............................................................................................................................................................... 23
Figure 21 – Schematic representation of 3 consecutive layers and their contour, scan lines over the
inner area and correspondent 67-degree rotation for each new layer, and hatching distance. ............ 25
Figure 22 – Lightweight finger exoskeleton concept, made of AlSi10Mg using DMLS technology (D.
Manfredi 2013). ..................................................................................................................................... 27
Figure 23 – Lightweight AlSi10Mg lattice structures, produced using DMLS technology (D. Manfredi
2013). .................................................................................................................................................... 27
Figure 24 – Field emission scanning electron microscopy (FESEM) at different magnifications of the
fracture surface of an aluminum alloy produced using DMLS technology (Diego Manfredi 2013). ...... 31
Figure 25 – SEM image of the fracture surface of a Ti-5111 specimen taken from the retreating interface
in the middle of the weld produced using friction stir welding (FSW) (Nimer 2011). ............................ 31
Figure 26 – SEM image of an irregularly shaped pore of a Laser Engineered Net Shaping (LENS) Ti–
6Al–4V specimen fracture surface (Amanda J. Sterling 2015). ............................................................ 32
Figure 27 – Schematic representation of the powder deposition plane and build direction orientations,
on the fabrication of a part through direct metal laser sintering (DMLS) (Diego Manfredi 2013). ........ 36
Figure 28 – Representation of the AlSi10Mg rectangular prism part produced using DMLS. .............. 37
Figure 29 – Schematic representation of the three steps involved in the scanning of one layer. ......... 38
Figure 30 – Schematic representation of the different AM process parameters employed for different
zones in the production of a part (each color represents a specific set of parameters) (Diego Manfredi
2013). .................................................................................................................................................... 38
Figure 31 – Examples of standard uniaxial tensile samples: (a) ASTM standard pin-loaded tension test
specimen (ASTM International. 100 Barr Harbour Dr.); (b) EN ISO standard cylindrical tension test
specimen (E. Balducci 2017). ................................................................................................................ 41
Figure 32 – (left) Picture of a microsample in a finger-tip and (right) schematic representation of a
microsample used for tensile testing and correspondent dimensions and geometry. .......................... 42
Figure 33 – Dimensions comparison between a microsample and a EN ISO standard cylindrical tension
test specimen (E. Balducci 2017). ......................................................................................................... 43

xv
Figure 34 – Schematic representation of the weld region and base metal of friction stir welding (FSW)
and the location of the extracted microsamples (Nimer 2016). ............................................................ 44
Figure 35 – (a) Schematic representation of a copper bullet jacket and location of the microsamples to
be extracted. (b) Image of the copper jacket with removed microsamples (Cheng 2008).................... 45
Figure 36 – SEM image of a nanocrystalline copper microsample with a cross-section of 0.5 x 0.015
mm2 (Y.M. Wang 2003). ........................................................................................................................ 45
Figure 37 – Gold tensile specimen used to represent the silicon dioxide tensile specimen, which by
being transparent makes it difficult to be photographed (D.S. Gianola and W.N. Sharpe 2004). ........ 45
Figure 38 – Glowing polysilicon microsample ready to be tested at 670 °C, resistively heated (K.J.
Hemker and W.N. Sharpe 2007). .......................................................................................................... 45
Figure 39 – Example of microsamples being cut using EDM (Nimer 2016). ........................................ 47
Figure 40 – Spur microgear (3.58 mm diameter, 17 teeth, 6 mm height, 660 µm pitch, 70 μm fillet radius)
of copper, produced using conventional wire EDM (Mohammad 2008). .............................................. 47
Figure 41 – Silicon microstructure produced using EDM (Masuzawa 2000). ....................................... 47
Figure 42 – Microsample geometry and dimensions (all units in mm) (Nimer 2016). ........................... 48
Figure 43 – Representation of the location of the ≈1 mm thick slices removed from the part obtained
through additive manufacturing, on each of the building directions. ..................................................... 49
Figure 44 – Simplified representation of the location and direction of the specimens removed from the
slices. ..................................................................................................................................................... 50
Figure 45 – Image of the result of microsamples machined using EDM, oriented along the x direction.
............................................................................................................................................................... 50
Figure 46 – (a) Simplified representation of the microsamples correspondent to the x and z directions
and their identification (b) Simplified representation of the microsamples correspondent to the y direction
and their identification. .......................................................................................................................... 51
Figure 47 – Picture of glass discs being heated on a hot plate, to posteriorly mount the microsamples
and polishing guides pins using Crystalbond™, as schematically represented on the image on the right.
............................................................................................................................................................... 52
Figure 48 – Microsample surface polished to a mirror finish, observed through the Olympus BX51
microscope. ........................................................................................................................................... 52
Figure 49 – Microsample gage section surface after the application of the speckle pattern, observed
through the Olympus BX51 microscope. ............................................................................................... 54
Figure 50 – Overview and detailed view of the microsample testing system designed and developed by
Nimer (Nimer 2016) at UMBC. (a) camera, lens and light source used for DIC measurement and (b)
heating system and load frame (Nimer 2016). ...................................................................................... 56

xvi
Figure 51 – Image of the detail of a bow-tie-shaped microsample held in self-aligning tapered grips (K.J.
Hemker and W.N. Sharpe 2007). .......................................................................................................... 57
Figure 52 – Schematic of a typical system used for the digital image correlation method (Bing Pan 2009).
............................................................................................................................................................... 59
Figure 53 – Schematic representation of the orientation of the microsamples tested, from a part
produced through AM. ........................................................................................................................... 63
Figure 54 – Schematic indicating the identification used for the microsamples tested in this work and
correspondent location on the additive manufactured part, for each orientation. ................................. 64
Figure 55 – Schematic showing the relation between locations of the microsamples oriented along the
x direction to the ones oriented along the y direction. ........................................................................... 65
Figure 56 – Stress-strain responses of the microsamples oriented along the x direction, on the powder
deposition plane. ................................................................................................................................... 66
Figure 57 – Stress-strain responses of the microsamples oriented along the y direction, on the powder
deposition plane. ................................................................................................................................... 67
Figure 58 – Stress-strain responses of the microsamples oriented along the z direction, on the build
direction. ................................................................................................................................................ 67
Figure 59 – Young’s modulus values of the microsamples tested oriented along the x, y and z directions,
as a function of the sample location on the additive manufactured part. .............................................. 69
Figure 60 – Yield strength values of the microsamples tested oriented along the x, y and z directions,
as a function of the sample location on the additive manufactured part. .............................................. 70
Figure 61 – Ultimate tensile strength (UTS) values of the microsamples tested oriented along the x, y
and z directions, as a function of the sample location on the additive manufactured part.................... 71
Figure 62 – Young’s modulus values and respective means for each orientation on the part produced
through additive manufacturing. ............................................................................................................ 74
Figure 63 – Schematic of a polycrystalline material microstructure, showing different crystallographic
orientations for different grains (Silva 2012 ). ....................................................................................... 74
Figure 64 – Yield strength values and respective means for each orientation on the part produced
through additive manufacturing. ............................................................................................................ 75
Figure 65 – Ultimate tensile strength (UTS) values and respective means for each orientation on the
part produced through additive manufacturing. ..................................................................................... 76
Figure 66 – Optical micrograph of a cross-section parallel to the powder deposition plane (xy plane) of
an AlSi10Mg part obtained through direct metal laser sintering (DMLS) (D. Manfredi 2013). .............. 77
Figure 67 – Schematic representation of the layers of the additive manufactured part on a microsample
oriented along the x or y directions. ...................................................................................................... 77
xvii
Figure 68 – Representation of the microsamples microstructures: (a) oriented along the x direction, (b)
oriented along the y direction and (c) oriented along the z direction (D. Manfredi 2013). .................... 79
Figure 69 – Schematic representation of a microsample mounted in a block for fractographic analysis
using SEM. ............................................................................................................................................ 82
Figure 70 – SEM images of the fracture surfaces of the microsamples used for fractographic analysis,
with respective identification number and orientation on the AM part. .................................................. 83
Figure 71 – Schematic representation of the microsamples oriented along the x direction on a part
produced using AM. .............................................................................................................................. 84
Figure 72 – SEM image of the fracture surface of the microsample number 13, oriented along the x
direction. ................................................................................................................................................ 85
Figure 73 – SEM image of the fracture surface of the microsample number 14, oriented along the x
direction. (a) and (b) Higher magnifications of the fracture surface. .................................................... 85
Figure 74 – SEM image of the fracture surface of the microsample number 16, oriented along the x
direction. ................................................................................................................................................ 86
Figure 75 – Schematic representation of the microsamples oriented along the y direction on a part
produced using AM. .............................................................................................................................. 88
Figure 76 – SEM image of the fracture surface of the microsample number 18, oriented along the y
direction. ................................................................................................................................................ 88
Figure 77 – SEM image of the fracture surface of the microsample number 20, oriented along the y
direction. ................................................................................................................................................ 89
Figure 78 – SEM image of the fracture surface of the microsample number 23, oriented along the y
direction and (a) higher magnification of the fracture surface. .............................................................. 89
Figure 79 – Schematic representation of the microsamples oriented along the z direction on a part
produced using AM. .............................................................................................................................. 91
Figure 80 – SEM image of the fracture surface of the microsample number 14, oriented along the z
direction. ................................................................................................................................................ 91
Figure 81 – SEM image of the fracture surface of the microsample number 16, oriented along the z
direction and (a) higher magnification of the fracture surface. .............................................................. 92
Figure 82 – SEM image of the fracture surface of the microsample number 21, oriented along the z
direction. ................................................................................................................................................ 92

xviii

xix
List of Tables
Table 1 – Composition of the AlSi10Mg aluminum alloy powder (Systems 2014). .............................. 26
Table 2 – Mechanical properties of the EOS aluminum AlSi10Mg, as stated by EOS (Systems 2014).
............................................................................................................................................................... 28
Table 3 – DIC analysis settings used, using VIC-2D 6 software. .......................................................... 60
Table 4 – Values of mean and standard deviation of Young’s modulus, yield strength and UTS, for each
orientation. ............................................................................................................................................. 72
Table 5 – Mechanical properties means of a DMLS AlSi10Mg obtained through: microsample tensile
tests; large standard samples tensile tests, presented in literature (Diego Manfredi 2013). Also,
mechanical properties mean values of the correspondent as-fabricated A360.0 F casting alloy. ........ 73
Table 6 – Summary of the t-test analysis results, applied to the mean values of yield strength (YS) and
UTS for each one of the orientations on the AM part. ........................................................................... 81

xx

Orientation and location dependency of the mechanical properties of an AlSi10Mg part produced using direct
metal laser sintering (DMLS) – a microsample approach
1
1 Motivation
1.1 Motivation
Objects and devices all around are subject to some sort of manufacturing process in order to be
obtained. Fabrication processes date as far back as 8000 – 3000 B.C. (Groover 2007) and have
been evolving since then. New technologies have emerged, allowing for more complex
geometries, lighter structures and stronger materials to be developed. Manufacturing provides
the necessary and most wanted goods for society and it represents an important technological,
economical and historical activity (Jorge Rodrigues 2005).
The strategic development and utilization of materials has enabled the technological advance
of mankind, but given the warming climate and the need to lift millions out of poverty, the
world spends too much energy, carbon, time, and resources on making materials. Globally
humans consume roughly 10 billion metric tons of engineering materials per year, an average
of 1.5 metric tons per person. Making materials consumes about 21% of global energy and is
responsible for about the same fraction of carbon emitted to the atmosphere. For example, in
2012 the total global energy consumed was estimated to be about 5x10²⁰ Joules/year and it is,
of course, rising (Ashby 2015).
A significant fraction of this energy is used inefficiently for transportation and simple melting.
Bauxite (the principle ore for aluminum) is routinely transported to Iceland, from locations as
far away as Australia, because the low cost of geothermal energy there makes such a laborious
path economical. Once turned into metal, it gets sent around the globe again to be made into
objects, which will travel the world yet again to eventually end up in landfills (Ashby 2015).
This work will take a proactive posture to address key high-energy demands needed to
manufacture materials, while providing improved material performance.
The fabrication of a product up to its ready-to-use state usually requires several successive
intermediate operations or manufacturing processes. The amount of processes necessary to
create a product directly influences the energy, time and costs involved (Jorge Rodrigues 2005).
In addition to that, the product design is limited by the processing capabilities of the
manufacturing processes available.
On the contrary, additive manufacturing enables to create a product in a single processing
operation, possibly only requiring little final machining or surface finishing treatment. It

Orientation and location dependency of the mechanical properties of an AlSi10Mg part produced using direct
metal laser sintering (DMLS) – a microsample approach
2
consists in the addition of layers of material along the intended geometry of the final part
defined by a 3D CAD model, as seen in Figure 1, reason why minimal waste is produced.
Moreover, it allows for complex and optimized shaped structures to be produced, with little or
no design restrictions. Therefore, high strength and light-weight structures can be produced.
The advantages associated to this manufacturing process makes it very desired and needed in
the industry.
Additive manufacturing first emerged as rapid prototyping, developed in the 1980s (Hernandez
2012). This technology was primarily used to produce prototypes and models for applications
such as product design evaluation and validation and medicine purposes. It has recently begun
to be used as an important commercial manufacturing technology. However, it is still a very
young technology subject to and in the need of plenty of research. AM has grown with minimal
understanding of the impact of processing parameters on resultant defects and global part
properties making it difficult for industry and government agencies to take full advantage of
the technology.
The part fabrication using additive manufacturing processes involves local complex thermal
evolutions of the material, which influence its microstructure and consequently its mechanical
Figure 1 – Schematic representation of the typical building strategy used to
fabricate a part by means of additive manufacturing technologies (Diego
Manfredi 2013).
Orientation and location dependency of the mechanical properties of an AlSi10Mg part produced using direct
metal laser sintering (DMLS) – a microsample approach
3
behavior. The layer-by-layer approach of AM technologies, Figure 1, results in microstructural
anisotropies and inhomogeneities of the produced material. Layers introduce a build direction
anisotropy and synthesis parameter variability, and create opportunities for defects (e.g., voids)
adding complexity to materials microstructures which, in turn, influence the mechanical
properties. It is thus important to understand and characterize how the AM process parameters
affects materials behaviors.
Despite the recent interest in additive manufacturing, the property variations in an additive
manufactured part are still not known or understood. Efforts to characterize additive
manufactured materials mechanical behaviors have essentially turned to the use of standard
large size samples for tensile testing (Diego Manfredi 2013). However, tensile tests at this
length scale will average across the inhomogeneities of the material and cannot resolve the
important variations tied to specific microstructural and defect features present in the sample,
making this an ineffective method to fully characterize an AM material. Therefore, a novel
approach consisting in microsample tensile testing is used in this work. Studies using this
technique on parts produced using additive manufacturing are still very limited.
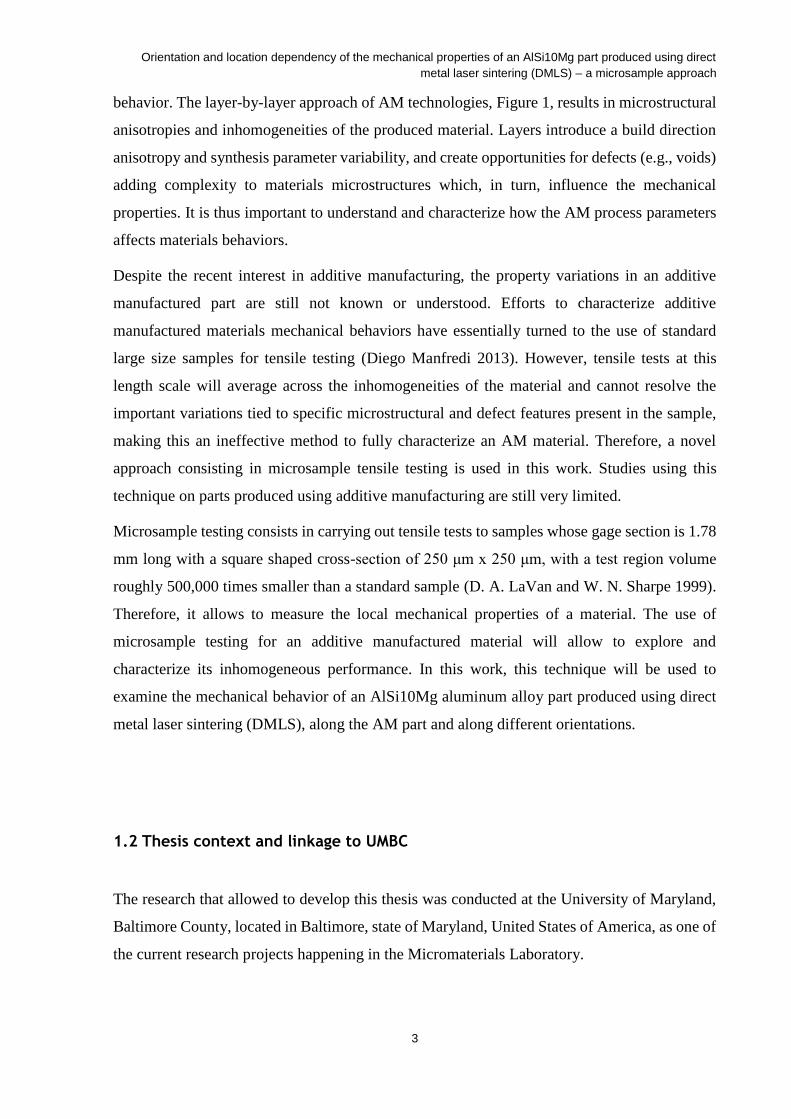
Microsample testing consists in carrying out tensile tests to samples whose gage section is 1.78
mm long with a square shaped cross-section of 250 μm x 250 μm, with a test region volume
roughly 500,000 times smaller than a standard sample (D. A. LaVan and W. N. Sharpe 1999).
Therefore, it allows to measure the local mechanical properties of a material. The use of
microsample testing for an additive manufactured material will allow to explore and
characterize its inhomogeneous performance. In this work, this technique will be used to
examine the mechanical behavior of an AlSi10Mg aluminum alloy part produced using direct
metal laser sintering (DMLS), along the AM part and along different orientations.
1.2 Thesis context and linkage to UMBC
The research that allowed to develop this thesis was conducted at the University of Maryland,
Baltimore County, located in Baltimore, state of Maryland, United States of America, as one of
the current research projects happening in the Micromaterials Laboratory.

Orientation and location dependency of the mechanical properties of an AlSi10Mg part produced using direct
metal laser sintering (DMLS) – a microsample approach
4
Additive manufacturing technologies allow to obtain objects directly from 3D CAD models
through the addition of consecutive layers of material along the intended geometry. This
manufacturing process involves complex local material evolutions on the fabrication of the part,
which influences its microstructure and thus its mechanical properties. Due to the knowledge
gap existent in literature about the material characterization and the mechanical properties
variation as a function of location and orientation on an additive manufactured part, the
application of a novel technique consisting in microsample tensile testing thrives to answer
these problems.
The Micromaterials Laboratory at UMBC has already a high practice in the area of microsample
tensile testing, with several published works. It thus allowed to better apply this technique to
fulfil the main purpose of this study. Moreover, the existent strong coalition between the
different departments in this University was also important for the realization of this work,
inasmuch the application of other techniques such as scanning electron microscopy (SEM) was
possible.
1.3 Thesis overview
The purpose of this work consists in using microsample testing to investigate and explore the
orientation and location dependency of the mechanical properties of an AlSi10Mg part,
produced using direct metal laser sintering (DMLS).
Chapter 2 provides the reader an introduction and the state of the art on additive manufacturing
with an overview, a description of the process and the process parameters influence on the
material microstructure, together with the defect generation mechanisms. Posteriorly, a
description of the specific AM process used to fabricate the part studied in this work, direct
metal laser sintering (DMLS), is made. It also provides with information on the composition
and mechanical properties reported in literature for the aluminum alloy used, AlSi10Mg. Finally,
an introduction to scanning electron microscopy (SEM) is made, together with a description of
its advantages to this work.
In chapter 3, the production of the material used in this work is described, including the process
parameters used.

Orientation and location dependency of the mechanical properties of an AlSi10Mg part produced using direct
metal laser sintering (DMLS) – a microsample approach
5
Chapter 4 presents an introduction to microsample testing and the details of its application for
the present study. A description of how the microsamples were extracted from the fabricated
part and afterwards prepared for tensile testing is made. An overview of the microsample tensile
testing system and testing variables used is also referred. It also provides with an introduction
to digital image correlation (DIC), used for strain measurement of microsamples, and the VIC-
2D 6 software settings used.
Chapter 5 provides the results from microsample testing and a detailed analysis of their
relationship to the additive manufacturing process. Also, a comparison to the mechanical
properties values reported in literature is made. Afterwards, the statistical significance t-test
carried out to determine the statistical significance of the difference between each of the
mechanical properties for different orientations is reported. Finally, the fractographic analysis
made to explain the measured mechanical response deformation and failure mechanisms is
described.
Finally, the conclusions taken from this study are presented in chapter 6.

Orientation and location dependency of the mechanical properties of an AlSi10Mg part produced using direct
metal laser sintering (DMLS) – a microsample approach
6

Orientation and location dependency of the mechanical properties of an AlSi10Mg part produced using direct
metal laser sintering (DMLS) – a microsample approach
7
2 Literature Review
2.1 Additive Manufacturing
Additive manufacturing (AM) is, as defined by the American Society of Testing and Materials
(ASTM), “The process of joining materials to make objects from 3D model data, usually layer
upon layer, as opposed to subtractive manufacturing methodologies” (Flaviana Calignano
2017). It is also often referred as 3D printing, additive fabrication, additive process, additive
techniques, additive layer manufacturing, layer manufacturing and freeform fabrication
(Flaviana Calignano 2017, Herderick 2011).
Although it was developed in the 1980s, it was first used as rapid prototyping and only recently
has begun to be used as an important commercial manufacturing technology in response to
modern industry demands on costs and manufacturing times reduction and on the ability to
produce complex and light-weight structures (Frazier 2014, Herderick 2011, Flaviana
Calignano 2017, Nesma T. Aboulkhair 2014). However, the technology and its utilization is
still very young and currently subject of plenty of research. Figure 2 to Figure 6 show examples
of parts of different materials produced using varied AM technologies, specifically applied to
medicine and in the industry.
Figure 3 – Stereolithography model of a human
cranium, used to effectively plan a surgical
treatment, using a photosensitive resin (Gebhardt
and Hötter 2016, Flaviana Calignano 2017).
1) 2)
3) 4)
Figure 2 – Biomedical hip stems implants in a
mesh, hole and solid configurations of
Ti6Al4V, fabricated using EBM (Nannan
GUO 2013).

Orientation and location dependency of the mechanical properties of an AlSi10Mg part produced using direct
metal laser sintering (DMLS) – a microsample approach
8
Additive manufacturing was first used in the production of polymer material objects (Figure 3)
(M. Fera 2016) and the majority of its current global activity consists in using polymer-based
systems (Herderick 2011). Currently, materials such as metals (Figure 2 and Figure 5), ceramics
(Figure 4 and Figure 6), composites, biological systems (Figure 2) and functionally graded
materials (FGM) (Figure 6) (Nannan GUO 2013) can also be used for this manufacturing
process (Flaviana Calignano 2017, Frazier 2014). However, not all commonly used
manufacturing materials are possible to be used in AM (Hernandez 2012).
Figure 5 – Airbus A320 titanium nacelle
hinge bracket with optimized topology
made by using DMLS technology (EOS)
(Nickels 2015).
Figure 4 – Alumina and silica ceramic cores for
investment casting of turbine blades, among others,
produced using SLS (Nannan GUO 2013).
Figure 6 – Functionally graded material part produced using a triple-
extruder freeze-form extrusion fabrication (FEF) process, with a
gradient from 100 % Al2O3 to 50 % Al2O3 and 50% ZrO2 (Nannan
GUO 2013).

Orientation and location dependency of the mechanical properties of an AlSi10Mg part produced using direct
metal laser sintering (DMLS) – a microsample approach
9
Its first applications, as referred, were for rapid prototyping (Figure 3) and tooling (Flaviana
Calignano 2017). However, the continuous development of additive manufacturing capabilities
is making it possible for this manufacturing process to be increasingly used for the direct
production of parts. It is well suited for a wide group of industries including marine, land and
aerospace vehicles. Research is being made to improve its reliability and applicability, while
being currently in use (Flaviana Calignano 2017, Hernandez 2012). It has also its applications
in the medical sector such as enabling the production of rapid prototypes and models of
damaged bones for analysis and high-quality bone transplants (Figure 2) (Hernandez 2012).
Furthermore, it is also suitable for several other purposes such as the manufacturing of parts no
longer being produced by its original manufacturers (Herderick 2011) and in the automotive
industry (Hernandez 2012), radio-frequency field (Flaviana Calignano 2017), architectural
modeling, fuel cell manufacturing and art (Hernandez 2012).
Additive manufacturing presents several advantages to conventional manufacturing techniques.
It allows to quickly manufacture ready-to-use geometrically complex objects without the need
of tooling through simplified manufacturing logistics at a low cost (Flaviana Calignano 2017).
Usually, it requires little final machining or finishing (Lawrence E. Murr 2012). Unlike
subtractive manufacturing processes such as machining, that removes up to 95% of material
from the original as-bought bulk material, AM produces minimal waste since unmelted powder
is recovered and in some cases can be recycled (Lawrence E. Murr 2012).
However, the influence on the microstructure and properties of the material of different AM
technologies is currently not well characterized or understood (Bartłomiej Wysocki 2016). The
intrinsic characteristics of this process, the layer by layer addition of material, may result in
discontinuities in as-built materials which could and does develop mechanical anisotropies,
dimensional inaccuracy and inacceptable finishing and structural state (Sofiane Guessasma
2015). The source of the materials anisotropy produced using AM is starting to receive
additional attention by the AM community (Frazier 2014). Anisotropy can be reduced or at least
managed by selecting an appropriate orientation of the part during its manufacturing (Sofiane
Guessasma 2015) or by postprocessing the as-built part using a heat treatment, although it
affects the cost-effectiveness of the process (Frazier 2014).
Although additive manufacturing global activity uses in its majority polymer-based systems,
further attention and importance is being given to metallic part fabrication (Herderick 2011).
The direct fabrication without the need for tooling or machining of net or near-net shaped
(Herderick 2011), lightweight and extremely complex metallic parts allows for a wide range of

Orientation and location dependency of the mechanical properties of an AlSi10Mg part produced using direct
metal laser sintering (DMLS) – a microsample approach
10
new design possibilities on numerous extremely critical and important applications. The
possibility to fabricate high performance parts at a reduced overall cost has been of particular
interest in the biomedical and aerospace industries (Figure 2 and Figure 5 respectively)
(Herderick 2011).
Numerous metal additive manufacturing technologies are presently available, characterized by
the heat source and on how the material is supplied (Seifi 2016). According to ASTM, additive
manufacturing technologies of metal parts are classified into categories such as binder jetting,
material jetting, direct energy deposition, sheet laminations, material extrusion, powder bed
fusion and vat photo-polymerization (Flaviana Calignano 2017). Figure 7 shows two major
categories from the ones referred previously, powder bed fusion (PBF) and direct energy
deposition (DED), and the associated AM technologies and commercial machine supplier
names.

Orientation and location dependency of the mechanical properties of an AlSi10Mg part produced using direct
metal laser sintering (DMLS) – a microsample approach
11
Figure 7 – Two major additive manufacturing categories and the associated AM technologies
and commercial machine supplier names (Seifi 2016).

Orientation and location dependency of the mechanical properties of an AlSi10Mg part produced using direct
metal laser sintering (DMLS) – a microsample approach
12
Typically, additive manufacturing takes the information from a computer-aided design (CAD)
file and converts it to a stereolithography (STL) file that contains information of each layer to
be printed. In the conversion process between the CAD file to a STL file, the continuous
geometry of the drawing made in the CAD software is approximated through a series of small
triangles and sliced (Hernandez 2012). Both approximations from the conversion process
introduce inaccuracy on the intended part geometry, since the continuous contours are replaced
by discrete ones. The smaller the triangles, the more accurate and closer to the intended design
the final part will be (Hernandez 2012). Moreover, the creation of separate STL files and
posterior combination of both may be done to reduce the inaccuracy introduced when the
material is sliced (Hernandez 2012). A representation of the data flow in the STL file creation
software is shown in Figure 8.

Orientation and location dependency of the mechanical properties of an AlSi10Mg part produced using direct
metal laser sintering (DMLS) – a microsample approach
13
It then uses a heat source such as electron beam, laser or arc to melt a material supplied via
powder or wire feed, layer upon layer and over specific regions, to form the final object (Seifi
2016). A schematic representation of the typical additive manufacturing process steps is shown
in Figure 9.
Layer boundary
polyline comparison
STL file
CAD file
Triangles creation
Sort triangles in Z
Boundary polylines
creation
Edge compensation
Smooth boundaries
Edge compensation
Index every section
until finish
Figure 8 – Data flow representation in the STL
file creation (Hernandez 2012).

Orientation and location dependency of the mechanical properties of an AlSi10Mg part produced using direct
metal laser sintering (DMLS) – a microsample approach
14
Different combinations of absorbed power (P) and beam velocity (V) are used to melt the metal
powder, which then solidifies. During this process, the material is subjected to cooling rates
that depend on P-V combinations, hatching space (i.e. laser overlap) (D. Manfredi 2013) and
on any preheating of the substrate, resulting in complex thermal cycles which accordingly
affects the microstructure of the part (Seifi 2016).
As for the terminology used by most references in literature, the xy plane corresponds to the
powder deposition plane and the z direction to the building direction, upon which subsequent
layers are superimposed, as it can be observed in Figure 10.
3D CAD modeling
CAD to STL file
conversion
Part production
Machine process
parameters
Auxiliary geometry
Figure 9 – Schematic representation of the steps involved in a part production through an additive
manufacturing process.
Figure 10 – Schematic representation of the powder deposition
plane and build direction orientations, on the fabrication of a
part through direct metal laser sintering (DMLS) (Diego
Manfredi 2013).

Orientation and location dependency of the mechanical properties of an AlSi10Mg part produced using direct
metal laser sintering (DMLS) – a microsample approach
15
An example on how the process parameters of an additive manufacturing technology and the
resulting thermal cycles involved affect the microstructure of the part is shown in Figure 11 for
an AlSi10Mg part produced using direct metal laser sintering (DMLS), in which it is evident
the presence of melt pools and their geometry. It is also possible to observe that very fine
microstructures are generated by the rapid and localized melting and cooling rates (Diego
Manfredi 2013).
For the z direction cross-section, the melt pools borders are all sequentially overlaid as a result
of the superimposition of the different layers during the fabrication of the part (D. Manfredi
2013). As for the xy direction cross-section, the melt pool contour lines are shown as irregular
geometric figures which could be attributed to the scanning rotation between consecutive layers
and to the partial re-melting of the different layers, which are cross-sectioned at different
heights and widths (D. Manfredi 2013). For this cross-section, two lines following the supposed
scanning path for different layers were drawn. The angle between them was measured,
corresponding to 67 degrees, as expected to this AM process. Parameters such as laser power,
hatching distance and scanning strategy, corresponding essentially to the scan orientation,
dictate the melt pools dimensions (D. Manfredi 2013).
For a more profound investigation on the influence of this thermal cycles on the microstructure
of a part, higher magnifications are required such as in Figure 12 (D. Manfredi 2013).
Figure 11 - Optical micrographs of vertical (z direction) and horizontal (xy direction) cross-sections of an
AlSi10Mg part obtained through the direct metal laser sintering (DMLS) technology, showing the
presence of melting pools and their geometry (D. Manfredi 2013).

Orientation and location dependency of the mechanical properties of an AlSi10Mg part produced using direct
metal laser sintering (DMLS) – a microsample approach
16
There are essentially two different forms of grain structure (Nesma T. Aboulkhair 2014). The
inside of the melt pool, namely its core, is characterized by a fine microstructure whereas at the
melt pool boundary coarser and elongated grains are found, as seen in Figure 12. At the melt
pool borders, overlapping of the scan passages and consequent re-melting might occur. The
coarser form of the grains located at this region is directly related to the longer time this region
stays at higher temperatures, resulting in a slower solidification rate (Nesma T. Aboulkhair
2014, D. Manfredi 2013). In most cases, a heated affected zone is also distinguished close to
the overlaps of the melting pools (Wei Pei 2017, Nesma T. Aboulkhair 2014).
The amount of overlapping of the scan and therefore the amount of coarse and fine regions will
be affected by the AM process parameters. As seen in Figure 13, overlapping is directly related
to the beam focus size, hatching distance and the scan power. By separately varying these
parameters: the overlapping between the melt pools is increased by increasing the beam focus
size or the scan power and by reducing the hatching distance.
Figure 12 – Field emission scanning electron microscope (FESEM)
micrograph of an AlSi10Mg part obtained through the direct metal laser
sintering (DMLS) technology, at increased magnification (D. Manfredi
2013).

Orientation and location dependency of the mechanical properties of an AlSi10Mg part produced using direct
metal laser sintering (DMLS) – a microsample approach
17
The different complex and localized thermal cycles present on the fabrication of a part due to
the inherent characteristics and process parameters of an additive manufacturing technology,
results in a distinctive microstructure thus affecting the material mechanical properties.
One additional aspect of extreme importance that often occurs in the fabrication of parts through
additive manufacturing is the existence of defects, internal or at the surface, which have an
extremely important role on the mechanical properties of the final part. Defect generation is
also influenced by the process parameters and by the correct calibration of the system’s
performance and metallic powder properties (Haijun Gong 2014).
In a part produced through AM processes, defects are usually present in the form of pores, voids
or unmelted powder. The overall presence of defects can be estimated by measuring the porosity
of a sample, through the comparison of its density to the nominal density value indicated for
the material to be studied (Haijun Gong 2014). Examples of defects can be observed in Figure
14 to Figure 16.
Figure 13 – Schematic representation of two adjacent melt pools
and correspondent important dimensions and regions, in the
fabrication of a part using an additive manufacturing technology.
Orientation and location dependency of the mechanical properties of an AlSi10Mg part produced using direct
metal laser sintering (DMLS) – a microsample approach
18
In a study by H. Gong et al. (Haijun Gong 2014), defect generation mechanisms such as material
vaporization, mass transfer phenomenon, melt pool discontinuity and process related instability
are described and are summarized in this text.
Figure 14 – Near-spherical defects directly correlated with excess energy input (Haijun Gong 2014).
(a) Cross-section image of a SLM Ti–6Al–4V sample. (b) Melt pool profile of a SLM Ti–6Al–4V
sample.
Figure 16 – Scanning electron microscopy (SEM)
of the top surface of a SLM Ti–6Al–4V sample,
showing defects related to insufficient energy input
for full melting (Haijun Gong 2014).
Figure 15 – Scanning electron microscopy (SEM)
of the top surface of an SLM sample in which the
presence of defects such as pits and small spherical
particles are visible (Haijun Gong 2014).
a) b)

Orientation and location dependency of the mechanical properties of an AlSi10Mg part produced using direct
metal laser sintering (DMLS) – a microsample approach
19
Energy density is usually used to describe the average applied energy per volume of material
during a powder bed fusion AM process (Haijun Gong 2014). It basically corresponds to the
energy available to melt a certain volume of metallic powder and it can be expressed by the
following equation (Haijun Gong 2014).
𝐸 = 𝑃
𝑉 ∙ ℎ ∙ 𝑡 [𝐽 ∙ 𝑚𝑚−3]
In this equation, P [W] corresponds to the scan power, V [mm∙s-1] is the scan speed, h [mm] is
the hatch spacing and t [mm] is the layer thickness.
In this study, it was shown that the process parameters influence the level of porosity and
therefore the level of defects on a sample. Upon the generation of porosity or not in relation to
process parameters such as scan power and speed, four types of melting zones can be defined,
as in Figure 17 (Haijun Gong 2014).
Figure 17 – Representation of the four types of melting zones in relation to the laser power and
scan speed for SLM Raymor Ti–6Al–4V powder (Haijun Gong 2014).

Orientation and location dependency of the mechanical properties of an AlSi10Mg part produced using direct
metal laser sintering (DMLS) – a microsample approach
20
Usually, only parts built using the combination of parameters in the over melting and
incomplete melting zones contain measurable porosity, which implies the presence of defects.
The defects generated by the over melting zone parameters are associated to excess energy,
while the defects generated by the incomplete melting zone parameters are associated to
insufficient energy (Haijun Gong 2014). Samples cannot be built using parameters on the
overheating zone due to serious deformation caused by the excess heating of the samples
(Haijun Gong 2014).
The excess energy input from the over melting zone parameters results in near-spherical defects
as seen in Figure 14 and is described as the material vaporization defect generation mechanism.
These defects can be attributed to gas bubbles formation when a higher laser energy is applied
to the melt pool (Haijun Gong 2014). In a keyhole geometry melt pool, it was shown that gas
bubbles may be formed far beneath the surface, as observed in Figure 14 b), due to vaporization
of low melting point constituents of the alloy (Haijun Gong 2014). These defects are therefore
trapped in the lower regions of the melt pool, since its rapid solidification does not give time
for these bubbles to rise and escape (Haijun Gong 2014).
In addition to vaporization inside the melt pool as referred, molten material on the top surface
can also be evaporated due to the intense thermal energy generated by excessive laser irradiation
(Haijun Gong 2014). The evaporation process generates a recoil pressure on the melt pool and
molten metal is ejected, rapidly solidifies and finally lands and gets welded as a spherical
particle on the molten top surface (Haijun Gong 2014). This is described as the mass transfer
phenomenon defect generation mechanism and it can be observed for the fully dense and over
melting zones parameters (Haijun Gong 2014). Particles whose size is smaller than the layer
thickness remain welded to the surface upon spreading of the subsequent layer, whereas
particles larger than the layer thickness are removed by the recoating blade, as demonstrated in
Figure 18 (Haijun Gong 2014).

Orientation and location dependency of the mechanical properties of an AlSi10Mg part produced using direct
metal laser sintering (DMLS) – a microsample approach
21
In these cases, pits are created on the surface of the layer and large enough pits could become
as defects underneath the new layer to be formed (Haijun Gong 2014). Defects generated
through this mechanism can be observed in Figure 15.
Moreover, defects such as pores and voids with entrapped powder particles can be formed due
to melt pool discontinuities and lack of melt pool overlap, described as the melt pool
discontinuity defect generation mechanism (Haijun Gong 2014). The insufficient or lack of
overlap between hatch lines and/or by failing to wet the previous layer is a direct consequence
where a lower energy density (incomplete melting zone parameters), large hatch spacing or
even increased scan focus is used (Haijun Gong 2014). Examples of these defects can be seen
in Figure 16.
Besides the defect generation mechanisms referred, defects can also occur if the system’s
performance and metallic powder properties are not correctly calibrated, thus referring to the
process instability (Haijun Gong 2014). As an example, un-melted powder particles may
become entrapped underneath the melt pool, caused by the reduced penetration depth of the
scan as a result of power fluctuations (Haijun Gong 2014).
By understanding the mechanisms involved in the generation of defects and their relationship
to the AM process parameters, it is therefore extremely important to correctly control these
parameters values in order to avoid the generation of unwanted defects which will influence the
final part mechanical and physical properties.
Figure 18 – Schematic representation of the formation of pits
process (Haijun Gong 2014).
Orientation and location dependency of the mechanical properties of an AlSi10Mg part produced using direct
metal laser sintering (DMLS) – a microsample approach
22
2.2 Direct metal laser sintering (DMLS)
Direct metal laser sintering (DMLS) is an additive manufacturing technology developed by
EOS GmbH (Herderick 2011, E. Atzeni 2016) of Munich, Germany, and has been
commercially available since 1995 (M. W. Khaing 2001). It offers a good balance between
investment costs, range of materials and part quality (E. Atzeni 2016) by allowing high
performance parts to be produced in just one fully automated production step (E. Atzeni 2016)
without the need for tooling and posterior machining and/or thermal treatments to be applied.
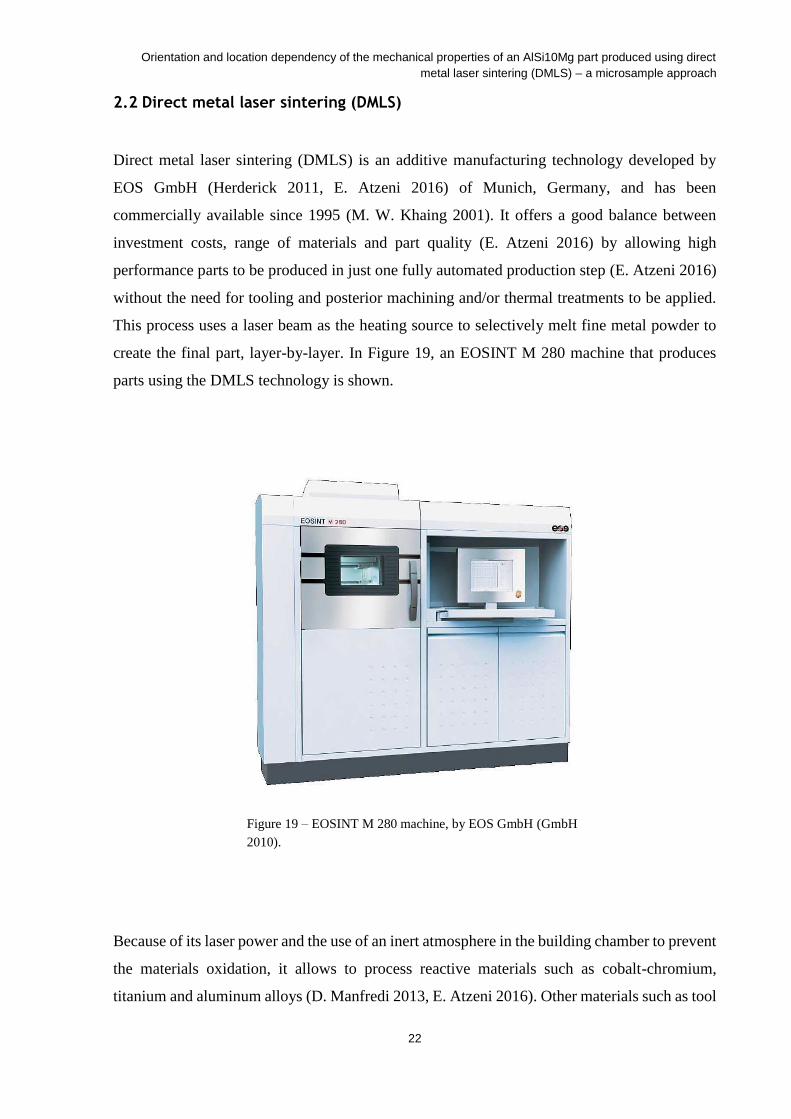
This process uses a laser beam as the heating source to selectively melt fine metal powder to
create the final part, layer-by-layer. In Figure 19, an EOSINT M 280 machine that produces
parts using the DMLS technology is shown.
Because of its laser power and the use of an inert atmosphere in the building chamber to prevent
the materials oxidation, it allows to process reactive materials such as cobalt-chromium,
titanium and aluminum alloys (D. Manfredi 2013, E. Atzeni 2016). Other materials such as tool
Figure 19 – EOSINT M 280 machine, by EOS GmbH (GmbH
2010).
Orientation and location dependency of the mechanical properties of an AlSi10Mg part produced using direct
metal laser sintering (DMLS) – a microsample approach
23
steel and stainless steel can also be used (Herderick 2011). To guarantee the process
repeatability with low porosity and suitable dimensional accuracy, tailoring of the powder and
processing conditions is fundamental (Herderick 2011).
The production process starts by converting a 3D CAD model file to a STL file. The STL file
contains the information of the part geometry and is then transferred to dedicated software
which generates the required support structures and slices the part into layers of a designated
thickness (D. Manfredi 2013). Each layer thickness depends on the material used and the thinner
the powder layer, the greater the degree of interlayer bonding (Diego Manfredi 2013). The
support structures main functions consist in holding unsupported geometries in place and to
prevent the distortion of the part during fabrication, to fix the part to the building platform and
to conduct excess heat away from the part (D. Manfredi 2013).
Figure 20 shows a schematic representation of the EOS machine and its components. The EOS
device is equipped with a 200 W Yb (Ytterbium) fiber continuum laser, with a beam focus of
0.1 mm to 0.5 mm (E. Atzeni 2016, GmbH 2010). Its build volume depends on the specific
EOS machine used. For the EOS M 280 machine, it is of 250 x 250 x 325 mm (Herderick 2011).
Figure 20 – Schematic representation of the EOS machine and its
components (M. W. Khaing 2001).

Orientation and location dependency of the mechanical properties of an AlSi10Mg part produced using direct
metal laser sintering (DMLS) – a microsample approach
24
Prior to the building process, the metal powder is sieved to ensure a maximum particle size in
agreement with the layer thickness (Diego Manfredi 2013) and then placed in the dispenser
inside of the building chamber. The chamber is then filled with an inert gas, namely argon,
preventing the material to suffer from oxidation (D. Manfredi 2013, E. Atzeni 2016).
Once the process starts, a layer of powder is deposited onto the building platform using a
recoater blade, preheated at 35 °C (D. Manfredi 2013). The laser beam then melts the powder
according to the layer geometry in three consecutive steps: the laser starts by melting the
contour of the section; it then melts the inner area by scanning it with parallel scan lines; to
conclude, the contour is traced again to make sure that the part edges correspond exactly to the
STL file data (Diego Manfredi 2013). Its intensity is defined so that the melted powder lightly
penetrates the previous layer, to ensure at the same time a good connection between layers (D.
Manfredi 2013).
Posteriorly to each layer formation, the building platform is lowered vertically by a distance
equal to the layer thickness. The layer formation process is then repeated until the final part is
formed. For each new layer to be formed, the direction of the scan lines over the inner area is
rotated by 67 degrees, like observed in Figure 21, since a certain degree of rotation between
layers leads to a better overlapping of these (Diego Manfredi 2013). The distance between two
consecutive scan lines corresponds to the hatching distance. The same way as for the layer
thickness, the process parameters such as scan power, velocity and hatching distance are also
selected according to the material to be processed (E. Atzeni 2016).

Orientation and location dependency of the mechanical properties of an AlSi10Mg part produced using direct
metal laser sintering (DMLS) – a microsample approach
25
After to the building process, any excess powder is removed and a thermal treatment is applied
to the part still in the platform to relieve stress (E. Atzeni 2016, M. W. Khaing 2001). Finally,
the part can be removed from the platform after removing all the support structures (if existing)
(D. Manfredi 2013).
2.3 Aluminum alloys - AlSi10Mg
Aluminum and its alloys are materials with broad applications due to their excellent balance of
physical and mechanical properties. Examples of common applications of these materials
include the airspace and automotive industries, beverage cans and cooking utensils (William D.
Callister 2001).
They feature a high strength-to-weight and stiffness-to-weight ratios ( 𝜎𝜌⁄ and 𝐸
𝜌⁄
respectively), with densities of around 3 times less than for steel (2.7 g/cm3), high electrical and
thermal conductivities and resistance to corrosion in some environments such as the ambient
atmosphere (William D. Callister 2001). They are also characterized by its high ductility and
its low melting temperature of around 660 °C (1220 °F), as being aluminum and aluminum
Figure 21 – Schematic representation of 3 consecutive layers and their contour, scan lines over the inner area
and correspondent 67-degree rotation for each new layer, and hatching distance.

Orientation and location dependency of the mechanical properties of an AlSi10Mg part produced using direct
metal laser sintering (DMLS) – a microsample approach
26
alloys main limitation (William D. Callister 2001). The mechanical strength of aluminum can
be improved by cold work and by alloying with elements such as magnesium, silicon, copper,
manganese and zinc (William D. Callister 2001).
As referred previously, to ensure the additive manufacturing process repeatability with low
porosity and suitable dimensional accuracy, tailoring of the powder and processing conditions
is fundamental (Herderick 2011).
EOS aluminum AlSi10Mg (Al, 10 wt-% Si, 0.3 wt-% Mg) is a specially tailored aluminum
alloy powder to be used by EOS machines to create parts by direct metal laser sintering. Its
chemical composition is comparable to the one of the correspondent typical casting alloy
AlSi10Mg, which has good casting properties and is typically used for cast parts with complex
shape (Systems 2014). Its composition is presented in Table 1.
Table 1 – Composition of the AlSi10Mg aluminum alloy powder (Systems 2014).
Al Si Fe Cu Mn Mg Ni Zn Pb Sn Ti
(balance) 9.0 – 11.0
wt-% ≤ 0.55 wt-%
≤ 0.05 wt-%
≤ 0.45 wt-%
0.2 – 0.45 wt-%
≤ 0.05 wt-%
≤ 0.10 wt-%
≤ 0.05 wt-%
≤ 0.05 wt-%
≤ 0.15 wt-%
The combination of silicon and magnesium improve the alloy mechanical properties and
hardness (GmbH 2010). It has good strength, hardness and dynamic properties which allow the
alloy to be used for parts subject to high loads. Parts made of this material are ideal for
applications in which low weight, good thermal properties and a combination of high
mechanical properties and low specific weight is required (Systems 2014). Typical applications
include the direct manufacture of functional prototypes, small series products and spare parts
(GmbH 2010).
The development and fabrication in a single step of a lightweight finger exoskeleton concept
including joints, as reported by D. Manfredi (D. Manfredi 2013) and shown in Figure 22, is an
example of an application of this aluminum alloy. The purpose of this concept consisted in the
development of a system to overcome the EVA (Extra Vehicular Activities) glove stiffness of
an astronaut, while strength, endurance and dexterity are maintained (D. Manfredi 2013).
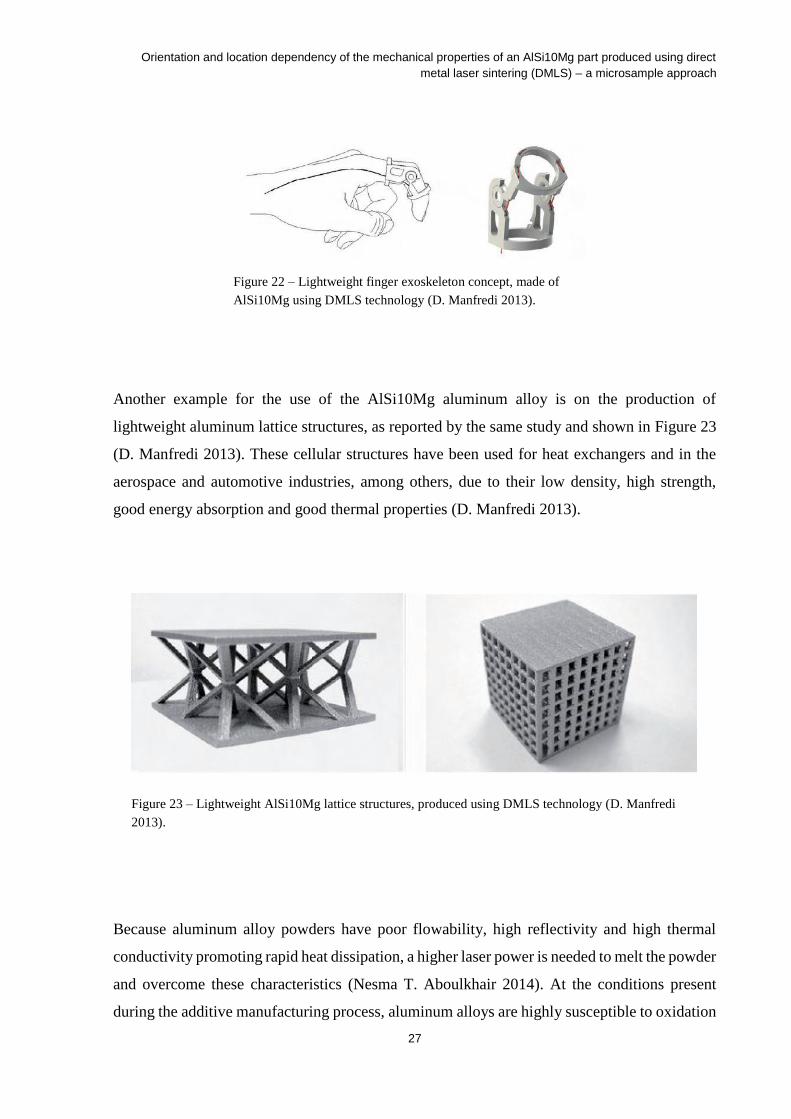
Orientation and location dependency of the mechanical properties of an AlSi10Mg part produced using direct
metal laser sintering (DMLS) – a microsample approach
27
Another example for the use of the AlSi10Mg aluminum alloy is on the production of
lightweight aluminum lattice structures, as reported by the same study and shown in Figure 23
(D. Manfredi 2013). These cellular structures have been used for heat exchangers and in the
aerospace and automotive industries, among others, due to their low density, high strength,
good energy absorption and good thermal properties (D. Manfredi 2013).
Because aluminum alloy powders have poor flowability, high reflectivity and high thermal
conductivity promoting rapid heat dissipation, a higher laser power is needed to melt the powder
and overcome these characteristics (Nesma T. Aboulkhair 2014). At the conditions present
during the additive manufacturing process, aluminum alloys are highly susceptible to oxidation
Figure 22 – Lightweight finger exoskeleton concept, made of
AlSi10Mg using DMLS technology (D. Manfredi 2013).
Figure 23 – Lightweight AlSi10Mg lattice structures, produced using DMLS technology (D. Manfredi
2013).

Orientation and location dependency of the mechanical properties of an AlSi10Mg part produced using direct
metal laser sintering (DMLS) – a microsample approach
28
(Nesma T. Aboulkhair 2014). As referred previously, an inert atmosphere is then used inside
the building chamber to prevent it.
Heat treatment is frequently applied to a cast part produced using this alloy, to improve the
mechanical properties. However, the laser-sintering process in AM is characterized by
extremely fast melting and solidification which produces a metallurgy and consequent
mechanical properties in the as-built part which are similar to the heat-treated cast parts. For
this reason, such hardening heat treatments are not recommended or currently finding wide
spread applications for parts produced through additive manufacturing. Instead, only a stress-
relieving thermal treatment is done (Systems 2014).
Currently, there is limited published data on the mechanical properties of materials used in
additive manufacturing. Most of the published mechanical properties have been reported for
Ti-6Al-4V alloy (Seifi 2016). The mechanical properties of the EOS aluminum AlSi10Mg, as
stated by EOS except for hardness values, are presented in Table 2. Hardness values were
determined in a study by D. Manfredi (Diego Manfredi 2013) through Vickers microhardness
measurements using a Leitz instrument with a load of 50 g for 30 s.
Table 2 – Mechanical properties of the EOS aluminum AlSi10Mg, as stated by EOS (Systems 2014).
As built Heat treated: stress relieve
Ultimate tensile strength (MPa)
Horizontal direction (xy) 460 ± 20 345 ± 10
Vertical direction (z) 460 ± 20 350 ± 10
Yield strength (Rp 0.2 %) (MPa)
Horizontal direction (xy) 270 ± 10 230 ± 15
Vertical direction (z) 240 ± 10 230 ± 15
Young’s modulus (GPa)
Horizontal direction (xy) 75 ± 10 70 ± 10
Vertical direction (z) 70 ± 10 60 ± 10
Strain to failure (%)
Horizontal direction (xy) 9 ± 2 12 ± 2
Vertical direction (z) 6 ± 2 11 ± 2
Hardness (HV) Approx. 107 ± 4

Orientation and location dependency of the mechanical properties of an AlSi10Mg part produced using direct
metal laser sintering (DMLS) – a microsample approach
29
As already stated, the production of a part using an additive manufacturing process involves
local and complex thermal cycles which will influence the microstructure of the material and
therefore its mechanical properties. Different microstructures are formed for the powder
deposition plane (xy plane) and build direction (z direction), as observed in Figure 11. From
the literature values presented in Table 2 and except for the material hardness, it is evident that
the mechanical properties values are slightly different on the powder deposition plane and on
the build direction, as expected.
Furthermore, as previously referred, the chemical composition of the EOS aluminum AlSi10Mg
aluminum alloy powder is comparable to the one of the correspondent typical casting alloy
AlSi10Mg, namely the A360.0 alloy (Systems 2014, Diego Manfredi 2013). However, due
essentially to the very fine microstructure formed on the additive manufacturing process by the
rapid and localized melting and cooling rates (Diego Manfredi 2013), the EOS AlSi10Mg alloy
shows different values of mechanical properties. When compared to the as-fabricated A360.0
cast alloy, it shows higher values of yield strength corresponding to an increase of about 43 %
for the xy plane and 36 % along the z direction (Diego Manfredi 2013, D. Manfredi 2013).
Moreover, ultimate tensile strength shows little higher values, whereas the elongation at break
is higher for the xy plane but slightly lower along the z direction (Diego Manfredi 2013, D.
Manfredi 2013).
2.4 Scanning electron microscopy (SEM)
Scanning electron microscopy (SEM) is a technique used for the visualization and
characterization of material surfaces, capable of conduct examinations at a very high
magnification (Silva 2012 , Joseph Goldstein 2012). It is believed that the first contribution to
the idea of a scanning electron microscope was made by H. Stintzing in 1927 (Reichelt 2007,
Silva 2012 ). However, just in 1942 SEM was truly described and developed by Zworykin and
only in 1965 the prototype for the first commercial SEM was developed by Pease and Nixon
(A. Bogner 2006).
SEM is now a well-established method for the visualization and characterization of surfaces in
many fields such as materials and surface sciences, semiconductor research and industry, life

Orientation and location dependency of the mechanical properties of an AlSi10Mg part produced using direct
metal laser sintering (DMLS) – a microsample approach
30
sciences, mineralogy, geology, the oil industry, archaeology and food research, among others
(Reichelt 2007).
It consists in the emission of a fine probe of electrons, with energies typically up to 40 KeV,
focused on the specimen surface to be analyzed and scanned along a pattern of parallel lines (A.
Bogner 2006). This process occurs inside of a vacuum chamber (de Assumpção Pereira-da-
Silva and Ferri 2017, Silva 2012 ) with pressure typically to about 10-4 Pa, allowing the beam
of electrons to travel to the specimen with little interaction with residual gas molecules (Reichelt
2007). It then collects the several signals generated as a result of the impact of the incident
electrons on the specimen, to form an image or to analyze its surface (A. Bogner 2006).
These generated signals correspond mainly to high-energy electrons backscattered from the
primary beam, secondary electrons with energy levels of just a few tens of eV and characteristic
X-rays (A. Bogner 2006). Due to the low energy of the secondary electrons, these can be bent
round corners and thus allow for the topographic contrast (R. E. Smallman 1999). On the other
hand, the emission of X-rays characteristic of the material being bombarded with high-energy
electrons allows to gather information on the chemical composition of the material.
The use of this technique has shown to be extremely useful for fractographic analysis to
evaluate, study and determine the correspondent failure mechanisms of materials produced
using additive manufacturing processes. Correlating fractography with measured mechanical
properties such as yield strength (YS), ultimate tensile strength (UTS) and strain to failure (εf),
conclusions on the controlling deformation mechanisms, their significance on properties and
linkages to microstructures and processing can be made.
A good example of a typical ductile failure is shown in Figure 24. In this fracture surface and
at higher magnifications (Figure 24 b) and c)), it is possible to observe that very fine dimples
completely cover the surface which reveals a great ability to dissipate the energy of the fracture
(Diego Manfredi 2013). In fact, for samples that failed by ductile fracture, microvoid size as
seen on the fracture surface is inversely proportional to strain to failure, meaning that smaller
void diameters are an indicative of higher strain to failure values (Nimer 2011). In addition to
microvoid dimples on the fracture surface, ductile fracture can be preceded by necking,
corresponding to a decrease of the sample cross-sectional area at the point of failure (Nimer
2016).

Orientation and location dependency of the mechanical properties of an AlSi10Mg part produced using direct
metal laser sintering (DMLS) – a microsample approach
31
A brittle fracture can also occur, as seen in Figure 25, due to the lack of dimples present and
instead the presence of a smooth fracture surface and slip bands (Nimer 2011). This image
shows cleavage failure (Nimer 2011).
Figure 24 – Field emission scanning electron microscopy (FESEM) at different magnifications
of the fracture surface of an aluminum alloy produced using DMLS technology (Diego
Manfredi 2013).
Figure 25 – SEM image of the fracture surface of
a Ti-5111 specimen taken from the retreating
interface in the middle of the weld produced using
friction stir welding (FSW) (Nimer 2011).
a) b)
c)

Orientation and location dependency of the mechanical properties of an AlSi10Mg part produced using direct
metal laser sintering (DMLS) – a microsample approach
32
In addition to ductile and brittle failure mechanisms, defects can also be seen in fracture surfaces
using the SEM technique (Amanda J. Sterling 2015, Ming Tang 2016), which allows to evaluate
their possible influence on the failure of a specimen. Although most pores are spherical,
irregularly shaped pores can also be formed (Amanda J. Sterling 2015). Specially pores with
sharp angles and pointed cavities, such as in Figure 26 pointed with an arrow, can be detrimental
for the mechanical behavior of a part by producing large stress concentrations (Amanda J.
Sterling 2015).
The size, shape and topology of the fracture surface explains how the microstructure is
controlling microscale properties.
2.5 Summary
This review of the state of the art showed the importance of process parameters of an additive
manufacturing technology on the microstructure of the final part and thus on its macroscale
properties, due to the complex and localized thermal cycles deriving from this process.
However, the influence on the microstructure and properties of the material of different AM
technologies is currently not well characterized, understood or controlled.
Figure 26 – SEM image of an irregularly shaped pore
of a Laser Engineered Net Shaping (LENS) Ti–6Al–
4V specimen fracture surface (Amanda J. Sterling
2015).

Orientation and location dependency of the mechanical properties of an AlSi10Mg part produced using direct
metal laser sintering (DMLS) – a microsample approach
33
The purpose of this work consists in studying the orientation-dependency of the mechanical
properties of parts made of an aluminum alloy, specifically AlSi10Mg, produced using additive
manufacturing. For this study, a novel technique consisting in microsample testing (using
samples whose gage section is 1.78 mm long with a square shaped cross-section of 250 μm x
250 μm) was used to directly measure the mechanical properties of this alloy at a length scale
that will explore the inhomogeneous material performance.
To produce the part to be analyzed, direct metal laser sintering (DMLS) was used by means of
an EOS machine in collaboration with Johns Hopkins University Applied Physics laboratory.
Microsample testing was carried out using a custom-built elevated temperature microsample
testing system designed and developed by Nimer (Nimer 2016) in the Micromaterials
Laboratory at the University of Maryland, Baltimore County (UMBC). Posteriorly, fracture
surfaces of the tested microsamples were analyzed using a scanning electron microscope FEI
Nova NanoSEM 450 in the department of physics at UMBC.

Orientation and location dependency of the mechanical properties of an AlSi10Mg part produced using direct
metal laser sintering (DMLS) – a microsample approach
34

Orientation and location dependency of the mechanical properties of an AlSi10Mg part produced using direct
metal laser sintering (DMLS) – a microsample approach
35
3 Material Production
3.1 Introduction
Additive manufacturing is a technology used to create parts from a 3D CAD model,
consecutively adding layers of material until the final part is formed. It is starting to be widely
used due to its proposed advantages such as reduced component lead time, reduced material
waste, energy usage and carbon footprint (Herderick 2011), among others.
However, it is a manufacturing process still in development and while AM has great promise it
is far from its potential. Notable characterization and understanding of the mechanical behavior
of the produced materials is limited (Nimer 2016). The process parameters of AM such as laser
scan power and focus, scan velocity, hatching distance and layer thickness are highly influential
on the resultant material microstructure and on the creation of defects in the final part. The
microstructures defect formation involves local complex thermal evolutions on the layer being
scanned and on the adjacent previous layers. Consequently, the process parameters local build
geometry as well as the macro build location all directly affect the mechanical properties of the
as-built part.
For this reason, characterization and understanding of the mechanical and physical behaviors
of materials produced using this manufacturing process is necessary. Currently, there is limited
published data on the mechanical properties of materials used in AM. Most of the published
mechanical properties have been reported for Ti-6Al-4V alloy (Seifi 2016). Moreover, studies
to characterize the mechanical behavior of materials produced with AM technologies have been
made using standard sized samples in short databases for design (Diego Manfredi 2013).
In this work, a novel technique designated as microsample testing was employed to characterize
the local mechanical behavior of an AlSi10Mg aluminum alloy part produced using direct metal
laser sintering (DMLS). The test results are linked to material process parameters as well as to
build geometry. This technique was carried out to determine the final part mechanical properties
in the three different building directions (Figure 27): x and y (parallel to the powder deposition
plane) and z (parallel to the build direction). Afterwards, a scanning electron microscope was
used to analyze the microsamples fracture surface.

Orientation and location dependency of the mechanical properties of an AlSi10Mg part produced using direct
metal laser sintering (DMLS) – a microsample approach
36
Although microsample testing has been carried out for several material studies as referred in
the literature, the use of this novel technique on parts produced through additive manufacturing
is still very limited. The relevant information that can be obtained through microscale tensile
testing and the correspondent fracture analyses of microsamples makes this a unique technique
that can be used for this purpose.
In this chapter, a description of the manufacturing steps necessary to produce the DMLS
AlSi10Mg aluminum alloy part to be posteriorly analyzed is made.
3.2 AlSi10Mg part production
In order to be able to study the local mechanical behavior through microscale tensile testing of
an AlSi10Mg aluminum alloy part manufactured using DMLS, a simple rectangular prism part
as represented in Figure 28 was produced using an EOSINT M 280 (Figure 19) in collaboration
with the Johns Hopkins University Applied Physics laboratory. In this work, standard EOS
process parameters defined for AlSi10Mg parts production were used.
Figure 27 – Schematic representation of the powder
deposition plane and build direction orientations, on
the fabrication of a part through direct metal laser
sintering (DMLS) (Diego Manfredi 2013).

Orientation and location dependency of the mechanical properties of an AlSi10Mg part produced using direct
metal laser sintering (DMLS) – a microsample approach
37
The production of this part started by converting the 3D CAD model to an STL file, which
contains the information of the part geometry and the correspondent information of each layer
to be printed.
The EOS aluminum AlSi10Mg powder was supplied by EOS GmbH, being sieved to ensure a
maximum particle size in agreement with the layer thickness and placed in the dispenser inside
of the building chamber (Figure 20). The chamber was afterwards filled with argon, which is
in accordance to the material being processed, to prevent the material to suffer from oxidation
during its fabrication (D. Manfredi 2013, E. Atzeni 2016).
Once the process started, a layer of powder was spread over the building platform, preheated at
35 °C, using a recoater blade. The layer thickness depends on the material used and for
AlSi10Mg powder it corresponds to 30 μm. The thinner the powder layer, the greater the degree
of interlayer bonding.
Then, a 200 W Yb fiber laser, with a beam focus of 0.1 mm to 0.5 mm, melted the powder
according to the layer geometry in three consecutive steps (Figure 29): the laser starts by
melting the contour of the section (step 1); it then melts the inner area by scanning it with
parallel scan lines (step 2); to conclude, the contour is traced again (step 3).
Figure 28 – Representation of the AlSi10Mg rectangular prism part produced using
DMLS.

Orientation and location dependency of the mechanical properties of an AlSi10Mg part produced using direct
metal laser sintering (DMLS) – a microsample approach
38
At the end of the formation of each layer, the building platform was lowered vertically by a
distance equal to the layer thickness of the part and the process was repeated until the final part
was obtained. For each new layer formed, the direction of the scan lines on the inner area was
rotated by 67 degrees (Figure 21) leading to a better overlap between layers (Diego Manfredi
2013).
The same way as for the layer thickness, the process parameters such as scan power, velocity
and hatching distance are also material dependent and corresponded to the standard EOS
parameters for the AlSi10Mg powder (E. Atzeni 2016). The EOS machine uses different
parameters for the core of a part, for its lower and upper surfaces parallel to the powder
deposition plane (down-skin and up-skin) and for the contour, as it can be observed in Figure
30 (Diego Manfredi 2013).
Figure 29 – Schematic representation of the three steps involved in the scanning of one layer.
Figure 30 – Schematic representation of the different AM process
parameters employed for different zones in the production of a part (each
color represents a specific set of parameters) (Diego Manfredi 2013).

Orientation and location dependency of the mechanical properties of an AlSi10Mg part produced using direct
metal laser sintering (DMLS) – a microsample approach
39
Once the part was made, excess powder was removed and a thermal treatment of 2 hours at
300 °C was applied to the part still mounted on the building platform to relieve stress (D.
Manfredi 2013), preventing the bending of the part due to the high residual thermal stresses
resultant from the high thermal gradients at which it was subjected (Diego Manfredi 2013). The
referred thermal treatment parameters employed were also specifically indicated for the
aluminum alloy powder used in this study. Finally, the part was removed from the platform and
was ready for posterior microsample extraction and mechanical behavior study.

Orientation and location dependency of the mechanical properties of an AlSi10Mg part produced using direct
metal laser sintering (DMLS) – a microsample approach
40
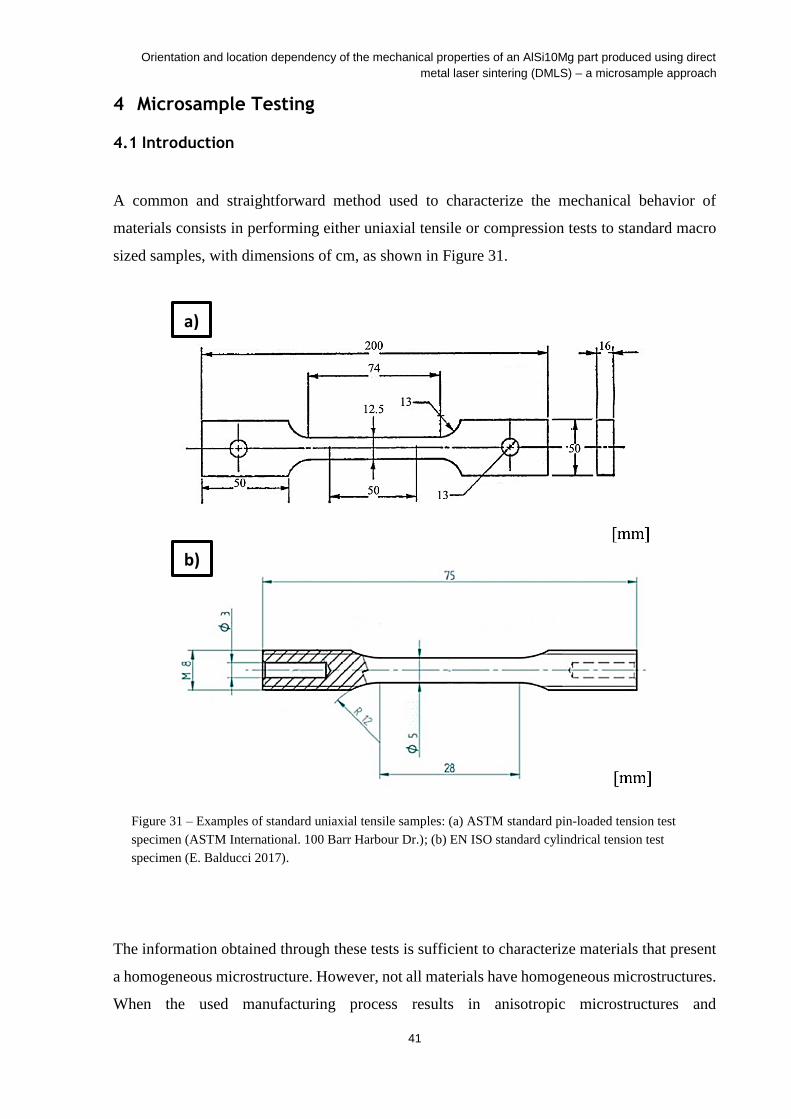
Orientation and location dependency of the mechanical properties of an AlSi10Mg part produced using direct
metal laser sintering (DMLS) – a microsample approach
41
4 Microsample Testing
4.1 Introduction
A common and straightforward method used to characterize the mechanical behavior of
materials consists in performing either uniaxial tensile or compression tests to standard macro
sized samples, with dimensions of cm, as shown in Figure 31.
The information obtained through these tests is sufficient to characterize materials that present
a homogeneous microstructure. However, not all materials have homogeneous microstructures.
When the used manufacturing process results in anisotropic microstructures and
Figure 31 – Examples of standard uniaxial tensile samples: (a) ASTM standard pin-loaded tension test
specimen (ASTM International. 100 Barr Harbour Dr.); (b) EN ISO standard cylindrical tension test
specimen (E. Balducci 2017).
a)
b)
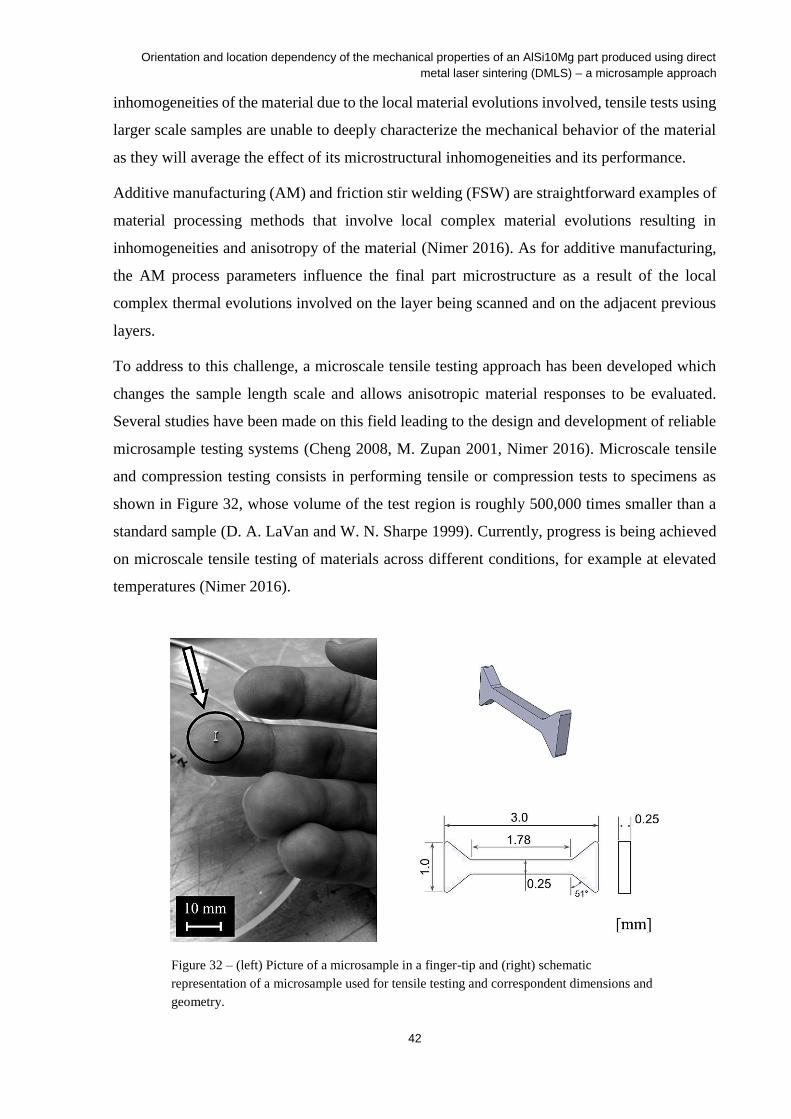
Orientation and location dependency of the mechanical properties of an AlSi10Mg part produced using direct
metal laser sintering (DMLS) – a microsample approach
42
inhomogeneities of the material due to the local material evolutions involved, tensile tests using
larger scale samples are unable to deeply characterize the mechanical behavior of the material
as they will average the effect of its microstructural inhomogeneities and its performance.
Additive manufacturing (AM) and friction stir welding (FSW) are straightforward examples of
material processing methods that involve local complex material evolutions resulting in
inhomogeneities and anisotropy of the material (Nimer 2016). As for additive manufacturing,
the AM process parameters influence the final part microstructure as a result of the local
complex thermal evolutions involved on the layer being scanned and on the adjacent previous
layers.
To address to this challenge, a microscale tensile testing approach has been developed which
changes the sample length scale and allows anisotropic material responses to be evaluated.
Several studies have been made on this field leading to the design and development of reliable
microsample testing systems (Cheng 2008, M. Zupan 2001, Nimer 2016). Microscale tensile
and compression testing consists in performing tensile or compression tests to specimens as
shown in Figure 32, whose volume of the test region is roughly 500,000 times smaller than a
standard sample (D. A. LaVan and W. N. Sharpe 1999). Currently, progress is being achieved
on microscale tensile testing of materials across different conditions, for example at elevated
temperatures (Nimer 2016).
Figure 32 – (left) Picture of a microsample in a finger-tip and (right) schematic
representation of a microsample used for tensile testing and correspondent dimensions and
geometry.

Orientation and location dependency of the mechanical properties of an AlSi10Mg part produced using direct
metal laser sintering (DMLS) – a microsample approach
43
Figure 33 gives to the reader a better perspective on the dimensions difference between a
microsample and a standard sample, used for uniaxial tensile testing.
In addition to this technique, efforts to characterize the mechanical behavior of small volumes
of materials have led to the development and use of other test methodologies like Vickers and
nanoindentation hardness tests, thermal cycling experiments, in situ X-ray diffraction
experiments, thin film bulge testing, resonance tests of thin film cantilevers and M-test
electronic measure (K.J. Hemker and W.N. Sharpe 2007).
Nevertheless, the use of microsample tensile testing presents several advantages to these test
methodologies, making it a more simple and powerful method used to characterize the local
mechanical behavior of a material. This method allows for collection of samples from bulk
materials, not being limited to thin films, and it is a direct method since stress and strain values
(σ and ε respectively) are measured without having to imply stress state. The measured values
correspond to absolute measurements and not to relative values, i.e. vickers hardness values are
often relative within a single alloy. It enables to obtain the stress-strain responses of the material,
from which mechanical properties such as Young’s modulus (E), yield strength (σy), ultimate
tensile strength (UTS) and strain to failure (εf) can be determined. Furthermore, the data
obtained from microsample tensile tests is directly comparable to hand books and familiar to
designers. Moreover, the resultant stress and strain measurements scale with the power of one,
being less affected by possible small experimental errors.
Figure 33 – Dimensions comparison between a microsample and a EN ISO standard
cylindrical tension test specimen (E. Balducci 2017).

Orientation and location dependency of the mechanical properties of an AlSi10Mg part produced using direct
metal laser sintering (DMLS) – a microsample approach
44
In a more general point of view, microsample tensile testing holds several other advantages. As
already referred, the use of this technique makes it possible to study and characterize the local
mechanical behavior of materials with anisotropic microstructures and inhomogeneities. It also
enables one to build a strong database on the mechanical properties of a material with small
amounts of material. Moreover, the mechanical behavior of expensive materials or materials
obtained through extremely rigorous, expensive and difficult to replicate processes can be
studied.
Microsample testing has proven to be more than effective for a wide range of material analysis,
including but not limited to base metal, heat affected zones and different weld regions of
weldments (Figure 34) (Nimer 2011, Rafal M. Molak 2008, Nimer 2016), copper bullet jacket
(Figure 35) (Cheng 2008), nanocrystalline copper (Figure 36) (Y.M. Wang 2003), silicon
dioxide thin films (Figure 37) (D.S. Gianola and W.N. Sharpe 2004) and elevated temperatures
materials behavior (Figure 38) (Nimer 2016, M. Zupan 2001, K.J. Hemker and W.N. Sharpe
2007). However, there are significant challenges related to the preparation, handling, testing
and strain measurement of microsamples due to its small size and fragility.
Figure 34 – Schematic representation of the weld region and base metal of friction stir welding
(FSW) and the location of the extracted microsamples (Nimer 2016).

Orientation and location dependency of the mechanical properties of an AlSi10Mg part produced using direct
metal laser sintering (DMLS) – a microsample approach
45
Figure 37 – Gold tensile specimen used to represent the silicon dioxide tensile specimen, which by being
transparent makes it difficult to be photographed (D.S. Gianola and W.N. Sharpe 2004).
Figure 35 – (a) Schematic representation of a copper bullet
jacket and location of the microsamples to be extracted. (b)
Image of the copper jacket with removed microsamples
(Cheng 2008).
Figure 36 – SEM image of a nanocrystalline copper
microsample with a cross-section of 0.5 x 0.015 mm2
(Y.M. Wang 2003).
Figure 38 – Glowing polysilicon microsample ready to be tested at 670 °C,
resistively heated (K.J. Hemker and W.N. Sharpe 2007).
a)
b)

Orientation and location dependency of the mechanical properties of an AlSi10Mg part produced using direct
metal laser sintering (DMLS) – a microsample approach
46
Although microsample testing has been carried out for several material studies as referred,
studies using this novel technique on parts produced through additive manufacturing are still
very limited.
According to ASTM, additive manufacturing is “The process of joining materials to make
objects from 3D model data, usually layer upon layer, as opposed to subtractive manufacturing
methodologies” (Flaviana Calignano 2017). For that purpose, several AM technologies are
available such as direct metal laser sintering (DMLS), selective laser melting (SLM) and
selective laser sintering (SLS), among others.
The AM process parameters such as scan power, velocity and hatching distance are highly
influential on the microstructure, porosity and quality of the part, as it involves local complex
thermal evolutions on the layer being scanned and on the adjacent previous layers, which
influence the mechanical properties of the as-built part.
Therefore, characterization and understanding of the mechanical behavior of materials
produced using this manufacturing process is of extreme importance. The relevant information
that can be obtained through microscale tensile testing and the correspondent fracture analyses
of microsamples makes this a unique technique that can be used for this purpose.
In this work, microsample testing was carried out to determine the mechanical properties in the
three different building directions x and y (parallel to the powder deposition plane) and z
(parallel to the build direction) of an AlSi10Mg aluminum alloy part produced using additive
manufacturing.
4.2 Microsample extraction and preparation
There are significant challenges related to the preparation, handling, testing and strain
measurement of microsamples due to the small size and fragility. To produce accurate and
repeatable microsample specimens, specialized machining methods such as Electrical discharge
machining (EDM) are used as an alternative to normal mechanical machining. Traditional
machining methods are not well suited for microsample since they can produce a damaged layer
that is comparable to the volume of material to be tested (K.J. Hemker and W.N. Sharpe 2007).

Orientation and location dependency of the mechanical properties of an AlSi10Mg part produced using direct
metal laser sintering (DMLS) – a microsample approach
47
EDM is a machining method that involves a thermal process and that overcomes the challenges
associated with microsamples extraction. It consists in removing metal by applying a series of
carefully controlled and rapidly recurring electric discharges between an electrode and the
workpiece in the presence of a direct fluid, vaporizing a small volume of metal in front of the
electrode (Cheng 2008, D. A. LaVan and W. N. Sharpe 1999). The workpiece is machined to a
high degree of precision achieved through the control of its position by a computer numerical
control (CNC) system, also allowing for repeatability in production (Cheng 2008). Figure 39 to
Figure 41 show examples of the use of EDM.
Figure 39 – Example of microsamples being cut
using EDM (Nimer 2016). Figure 40 – Spur microgear (3.58 mm diameter, 17
teeth, 6 mm height, 660 µm pitch, 70 μm fillet radius)
of copper, produced using conventional wire EDM
(Mohammad 2008).
Figure 41 – Silicon microstructure produced
using EDM (Masuzawa 2000).

Orientation and location dependency of the mechanical properties of an AlSi10Mg part produced using direct
metal laser sintering (DMLS) – a microsample approach
48
The microsample geometry and dimensions used in this work are shown in Figure 42. It has a
nominal over all foot print of 3 mm long and 1 mm wide, with a gage length of 1.78 mm long
and 0.25 mm wide.
The bow-tie-shaped microsample geometry used is directly related to its functionality. It fits
into tapered grips on the tensile testing system, is self-aligning and requires no clamping or
gluing of the sample in order to be tested (D. A. LaVan and W. N. Sharpe 1999).
As seen in Figure 43, the microsamples are extracted by first slicing the bulk material obtained
through additive manufacturing into ≈1 mm thick sections along the build direction (z direction)
and along the powder deposition plane (xy plane). One slice of material was cut along the build
direction and two slices were cut parallel to the powder deposition plane. The full extraction
process in this work was accomplished using a Fanuc Alpha OiE wire electric discharge
machine at Johns Hopkins University.
Figure 42 – Microsample geometry and dimensions (all units in mm) (Nimer
2016).

Orientation and location dependency of the mechanical properties of an AlSi10Mg part produced using direct
metal laser sintering (DMLS) – a microsample approach
49
By introducing the CAD file of the microsample design into the EDM machine, they were
afterwards sequentially machined on the slices using a finishing pass setting resulting in a slow
and controlled cutting process with minimal damage to the material (Nimer 2016). The
microsamples initial thickness corresponded to the thickness of the slices they were machined
from. A simplified representation of the location and direction of the specimens removed from
the slices referred previously is presented in Figure 44.
Figure 43 – Representation of the location of the ≈1 mm thick slices removed from the part obtained
through additive manufacturing, on each of the building directions.

Orientation and location dependency of the mechanical properties of an AlSi10Mg part produced using direct
metal laser sintering (DMLS) – a microsample approach
50
Although the sample is not subjected to mechanical stress during this process, some molten
metal redeposits on the cut surface forming a recast layer (D. A. LaVan and W. N. Sharpe 1999).
However, as indicated by LaVan and Sharpe (D. A. LaVan and W. N. Sharpe 1999) and showed
by Nimer (Nimer 2016), the EDM settings used allows for the recast layer to be reduced to less
than a micrometer or not visible through the cross-section examination of the sample,
respectively. It has been proven through testing that any EDM machining artifacts does not
affect the measured microsample mechanical results. Figure 45 shows the result from
machining the microsamples using EDM.
Figure 45 – Image of the result of microsamples
machined using EDM, oriented along the x direction.
Figure 44 – Simplified representation of the location and direction of the specimens removed from
the slices.

Orientation and location dependency of the mechanical properties of an AlSi10Mg part produced using direct
metal laser sintering (DMLS) – a microsample approach
51
To keep track of the microsamples, they were duly identified with a number as shown in Figure
46 simplified. The numeration of each microsample correspondent to the x and z directions
increases from the left of the slice to its right. The same happens to the y direction microsamples,
however the numeration will also increase from upper to lower samples.
Each microsample was removed from the respective slice using a diamond saw. Following the
identification above, the 10 middle samples from each direction were utilized in this study.
After extraction, the microsamples require preparation prior to testing. Microsamples were
mechanically polished using typical metallographic methods to a mirror finish using 320, 600,
800 and 1200 grit SiC paper (Nimer 2016), followed by a final polish using 1 μm
deagglomerated alumina suspension. Due to the small size and challenges associated with
handling the samples, a special procedure is used to assist on the polishing process for each of
their sides. The microsamples and 4 polishing guides pins are mounted on a circular glass disc
using Crystalbond™ and the heat from a hot plate, as it can be observed in Figure 47.
Figure 46 – (a) Simplified representation of the microsamples correspondent to the x and z directions and
their identification (b) Simplified representation of the microsamples correspondent to the y direction and
their identification.
a)
b)

Orientation and location dependency of the mechanical properties of an AlSi10Mg part produced using direct
metal laser sintering (DMLS) – a microsample approach
52
The glass disc makes it easier to hold the samples throughout the polishing process and the
polishing guides enables to control their thickness during this same process, with the use of a
caliper. Since the polishing guides are mounted on the outermost part of the glass disc and the
samples on the inside part of it, the polishing guides thickness dictates the samples thickness.
To make sure the samples have a planar polished surface the polishing guides thickness should
all be the same. Moreover, several samples can be polished at the same time. Figure 48 shows
a microsample after it has been polished to completion.
Figure 47 – Picture of glass discs being heated on a hot plate, to posteriorly mount the microsamples and
polishing guides pins using Crystalbond™, as schematically represented on the image on the right.
Figure 48 – Microsample surface polished to a mirror finish, observed through the
Olympus BX51 microscope.
Orientation and location dependency of the mechanical properties of an AlSi10Mg part produced using direct
metal laser sintering (DMLS) – a microsample approach
53
After the polishing process is completed for one side, the samples are removed from the glass
disc and then cleaned, repeating afterwards the mounting and polishing processes for the
opposite side. Posteriorly to complete the polishing process, a final thickness of ≈250 μm was
targeted to achieve a gage section of an approximated square shaped cross-section. After
polishing, the samples were cleaned in an ultrasonic cleaner.
In addition to the actual preparation of the microsamples, the samples gage section thickness
and width were measured using the AmScope 3.7 software, through the observation on the
Olympus BX51 microscope. This method allows the as fabricated microsample dimensions to
be determined.
Due to the small size of microsamples, directly contacting the sample for strain measuring
would result in parasitic measurements. Traditional strain measurement gages are often bigger
or of the same scale as the sample and would act to reinforce the material giving rise to errors
both in strain and stress. Because of the small size of the samples, any rigid body motion or
machine compliance would be a comparatively large amount of the total displacement that
would be measured if cross head displacement was used to measure strain.
Therefore, non-contact methods such as digital image correlation (DIC) are used. This method
requires the application of a speckle pattern to the surface of the microsample that must meet
certain requirements to ensure its good quality (Nimer 2016). The quality of the speckle pattern
is ensured by painting a random pattern that provides a high contrast with the background and
each speckle should be nominally the same size and small enough to measure the desired
deformations on a microscale (Nimer 2016).
As observed in Figure 49, high heat white spray paint was applied to the sample, fully covering
it, to create a high contrast background. Posteriorly, the speckle was painted using an airgun
with a 45 psi air pressure and a black paint mixture of acetone and high heat black paint in a
6:5 ratio.

Orientation and location dependency of the mechanical properties of an AlSi10Mg part produced using direct
metal laser sintering (DMLS) – a microsample approach
54
When applying the paint speckles using an airgun, both air pressure and dilution are two of four
major factors that influence the pattern and the values used were optimized to get the best
speckle results. The two other factors such as airflow setting and spraying distance were
adjusted to the best results over trial and error (Nimer 2016).
4.3 Microsample testing
Unlike the ASTM standard tensile tests, one cannot simply place a microsample in a
commercial test machine and test it in a predefined way (K.J. Hemker and W.N. Sharpe 2007).
Because of their microscale size, there are challenges associated to the application of small
forces, stress and strain measurement and elevated temperature testing (K.J. Hemker and W.N.
Sharpe 2007). In a microscale, frictional forces may be on the same order of magnitude as the
loading forces and so must be considered to understand the true material response (Nimer 2016).
In terms of sample loading, an appropriated high-resolution method for applying displacements
must be used such as picomotors, piezoelectric actuators and atomic force microscopes. Also,
suitable sensors to measure force at small levels must be used (Nimer 2016). As referred
Figure 49 – Microsample gage section surface after the application of the speckle pattern,
observed through the Olympus BX51 microscope.

Orientation and location dependency of the mechanical properties of an AlSi10Mg part produced using direct
metal laser sintering (DMLS) – a microsample approach
55
previously, a non-contact method to measure strain such as digital image correlation must be
used.
A custom-built tensile testing machine has been developed to face and meet these requirements.
In this work, an elevated temperature microsample testing system designed and developed by
Nimer (Nimer 2016) in the Micromaterials Laboratory at UMBC, University of Maryland,
Baltimore County was used. Figure 50 shows pictures of an overview and a more detailed view
of this testing machine and its components.

Orientation and location dependency of the mechanical properties of an AlSi10Mg part produced using direct
metal laser sintering (DMLS) – a microsample approach
56
Figure 50 – Overview and detailed view of the microsample testing system designed and developed
by Nimer (Nimer 2016) at UMBC. (a) camera, lens and light source used for DIC measurement and
(b) heating system and load frame (Nimer 2016).

Orientation and location dependency of the mechanical properties of an AlSi10Mg part produced using direct
metal laser sintering (DMLS) – a microsample approach
57
This machine comprises a load frame with a piezoelectric actuator controlled by software
producing a quasi-static strain rate of 10-4 s-1 and a maximum strain rate of 1 s-1. It also provides
an axial load capacity of up to 120 N and a stroke of 25 mm total (Nimer 2016). A load cell is
placed in line between the actuator and a linear air bearing, as seen in Figure 50, used to
overcome any friction during the test and ensures uniaxial loading (Nimer 2016, D. A. LaVan
and W. N. Sharpe 1999).
It has tapered grips capable to fit bow-tie-shaped microsamples (Figure 51). As it was referred
previously, the geometry of the sample is directly related to its functionality. It results from a
series of considerations on how to hold the sample to perform the tensile test. Although gripping
or gluing is possible, it presents several challenges. Gripping small samples can easily destroy
them and small misalignments create large bending strains. On the other hand, gluing prevents
rapid successive tests due to the long cure and debonding times of appropriate adhesives. To
overcome these concerns, a bow-tie-shaped specimen was adopted that fits into tapered grips,
is self-aligning, i.e. upon initial loading the sample will move into place and eliminate any
misalignment, and requires no clamping or gluing of the sample (D. A. LaVan and W. N. Sharpe
1999).
The samples are illuminated using a white LED source and their images are taken with a lens
and a camera mounted on top of where the testing is taking place (Figure 50), as the method
employed to further perform DIC analysis. It is essential to check the accuracy of the alignment
of the camera and its focus on the sample’s surface since these are factors that can affect the
Figure 51 – Image of the detail of
a bow-tie-shaped microsample
held in self-aligning tapered grips
(K.J. Hemker and W.N. Sharpe
2007).

Orientation and location dependency of the mechanical properties of an AlSi10Mg part produced using direct
metal laser sintering (DMLS) – a microsample approach
58
DIC results (Nimer 2016). Load, displacement and temperature values are recorded at the same
rate as pictures are being taken, whereat each value is synced with each image. To measure
strain, a DIC analysis is carried out to the samples previously coated with a speckle using the
commercial software VIC-2D 6 by Correlated Solutions (Nimer 2016).
Even though the tensile tests were carried out at room temperature, this testing system is also
equipped with a tubular gas heater (Figure 50) allowing for microsamples to be tested at high
temperatures. It uses argon gas as the heating media to prevent oxidation of the microsamples,
a pure titanium mesh on the heater nozzle that serves as a getter as the hot argon passes across
it and a cooling unit used to ensure the electronics of the load frame remain at a safe temperature
(Nimer 2016).
Tensile tests were carried out at a quasi-static strain rate of 10-3 s-1 until the fracture of the
sample, while images of its surface were captured. Values of stress, load and displacement were
obtained. Stress values were directly calculated by inserting the microsample cross-sectional
area values into the data acquisition software.
4.4 Strain measurement – Digital image correlation
The knowledge of the strain values of a microsample associated to a tensile test is essential for
material property determination such as Young’s modulus, yield strength and strain to failure.
Due to the small size of microsamples, directly contacting the sample for strain measuring is
impossible (Nimer 2016). Therefore, non-contact methods must be used. Non-contact methods
such as the interferometric strain/displacement gage (ISDG) and digital image correlation (DIC)
are being used to measure strain (Nimer 2016, D. A. LaVan and W. N. Sharpe 1999).
ISDG is a method that uses two reflective markers on the sample surface to reflect the light
from a laser, creating an interference pattern that is captured by two charge-coupled device
(CCD) cameras. As the microsample suffers deformation, the indents move apart and the
corresponding fringe movement can be analyzed to measure strain (Nimer 2011, Cheng 2008).
Although this technique works well, it has a limited maximum strain range as the optical signal
gets degraded by the deformation of the sample surface (Nimer 2016).

Orientation and location dependency of the mechanical properties of an AlSi10Mg part produced using direct
metal laser sintering (DMLS) – a microsample approach
59
Digital image correlation (DIC) has gained popularity as a result of the improvement of imaging
technology (Nimer 2016) and has been commonly used for the surface deformation
measurement (Bing Pan 2009). It is the non-contact optical method used in this study to measure
strain of the microsamples.
When compared to the interferometric optical techniques this method is of simple application.
It involves a simple experimental setup and specimen preparation as it only requires one fixed
CCD camera to record the digital images of the test sample surface during the test, as in Figure
52, and the microsample preparation can be made by simply spraying paint against its surface
(Figure 49). Also, a white light source can be used to illuminate the sample during the test,
instead of using a laser source, and a wide range of measurement sensitivity and resolution is
possible (Bing Pan 2009).
To perform DIC analysis, the application of a speckle pattern to the surface of the microsample
by paint or gold deposition is needed and must meet certain requirements to ensure its good
quality (Nimer 2016). The quality of the speckle pattern is the parameter that affects the
accuracy of DIC strain measurement the most (Nimer 2016). It should be a random pattern that
provides a high contrast with the background and each speckle should be nominally the same
size and small enough to measure the desired deformations on a microscale (Nimer 2016).
Posteriorly to the speckle application to the microsample, digital images of the sample are
recorded during its testing. It is necessary to check the accuracy of the alignment of the camera
and its focus as well as the illumination variation on the sample’s surface since these are other
Figure 52 – Schematic of a typical system used for the digital image correlation method
(Bing Pan 2009).

Orientation and location dependency of the mechanical properties of an AlSi10Mg part produced using direct
metal laser sintering (DMLS) – a microsample approach
60
factors that can affect the DIC analysis results (Nimer 2016). Full-field bi-axial displacements
and strains are then obtained by comparing the images captured during the test to the un-
deformed initial state image (reference image) (Bing Pan 2009), with the use of a dedicated
software. In this study, the commercial software VIC-2D 6 by Correlated Solutions was used.
For image processing purposes on the DIC analysis using the VIC-2D 6 software, a region of
interest in the images is selected, specifically at the microsamples gage section. This region
comprises numerous smaller regions called subsets, each one of them containing a distribution
of speckles that is exclusive to it. By this mean, the motion and deformation of each subset is
tracked and the displacements of each subset measured. By differentiating the displacements,
strain can be obtained (Nimer 2016). Each subset must be sufficiently large so that it contains
enough speckles for it to be unique. However, a balance must be done when deciding the subset
size, since a smaller subset can result in less error due to the increased spatial resolution (Nimer
2016).
To analyze all the samples strains with VIC-2D 6 software, the settings listed in Table 3 were
used.
Table 3 – DIC analysis settings used, using VIC-2D 6 software.
Subset size 41
Step 4
Subset weights Gaussian
Interpolation Optimized 4-Tap
Low-Pass filters Enabled
Incremental correlation Enabled
Exhaustive search Enabled
Prediction margin (pixel) 0.02
Confidence interval (pixel) 0.1
Matchability (pixel) 0.1
Strain filter size 15
Finally, the average strain values are measured for each image by placing a line “extensometer”
across the microsamples gage section length, at the center of its width (Nimer 2016).

Orientation and location dependency of the mechanical properties of an AlSi10Mg part produced using direct
metal laser sintering (DMLS) – a microsample approach
61
4.5 Summary
In this chapter, the application of a novel technique consisting in microsample tensile testing
was described, including the samples extraction and preparation required to be able to use it.
Values of load and displacement were directly obtained through the microsample tensile tests
and the engineering stress values were determined by inserting the measured microsample
initial cross-sectional area values into the data acquisition software. Afterwards, a DIC analysis
was applied to the captured images during the tensile tests of the microsample gage section
surface to determine the strain values involved in these tests.
Microsample testing allowed to obtain the engineering stress and strain values (σ and ε
respectively) for different build directions, parallel to the powder deposition plane and parallel
to the build direction, of an additively manufactured part of AlSi10Mg. The obtained results
from the microtensile tests and from the posterior fracture surface analyses using SEM are going
to be presented and discussed in the following chapter.

Orientation and location dependency of the mechanical properties of an AlSi10Mg part produced using direct
metal laser sintering (DMLS) – a microsample approach
62
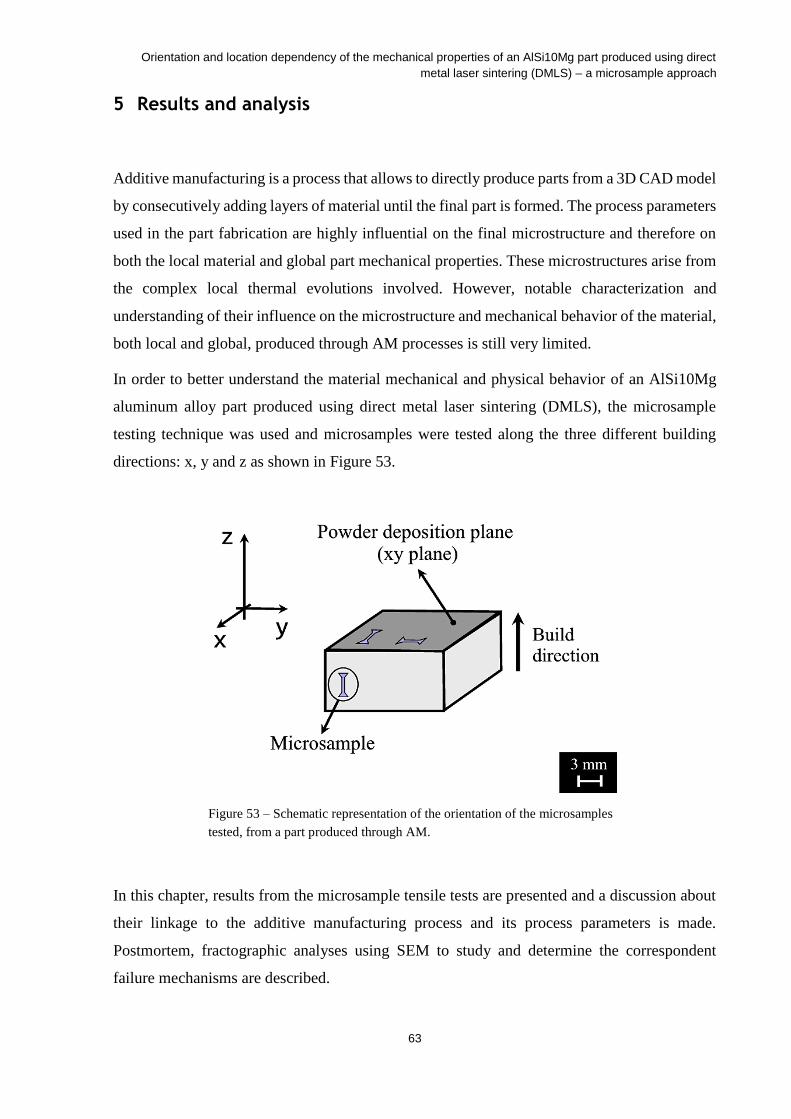
Orientation and location dependency of the mechanical properties of an AlSi10Mg part produced using direct
metal laser sintering (DMLS) – a microsample approach
63
5 Results and analysis
Additive manufacturing is a process that allows to directly produce parts from a 3D CAD model
by consecutively adding layers of material until the final part is formed. The process parameters
used in the part fabrication are highly influential on the final microstructure and therefore on
both the local material and global part mechanical properties. These microstructures arise from
the complex local thermal evolutions involved. However, notable characterization and
understanding of their influence on the microstructure and mechanical behavior of the material,
both local and global, produced through AM processes is still very limited.
In order to better understand the material mechanical and physical behavior of an AlSi10Mg
aluminum alloy part produced using direct metal laser sintering (DMLS), the microsample
testing technique was used and microsamples were tested along the three different building
directions: x, y and z as shown in Figure 53.
In this chapter, results from the microsample tensile tests are presented and a discussion about
their linkage to the additive manufacturing process and its process parameters is made.
Postmortem, fractographic analyses using SEM to study and determine the correspondent
failure mechanisms are described.
Figure 53 – Schematic representation of the orientation of the microsamples
tested, from a part produced through AM.
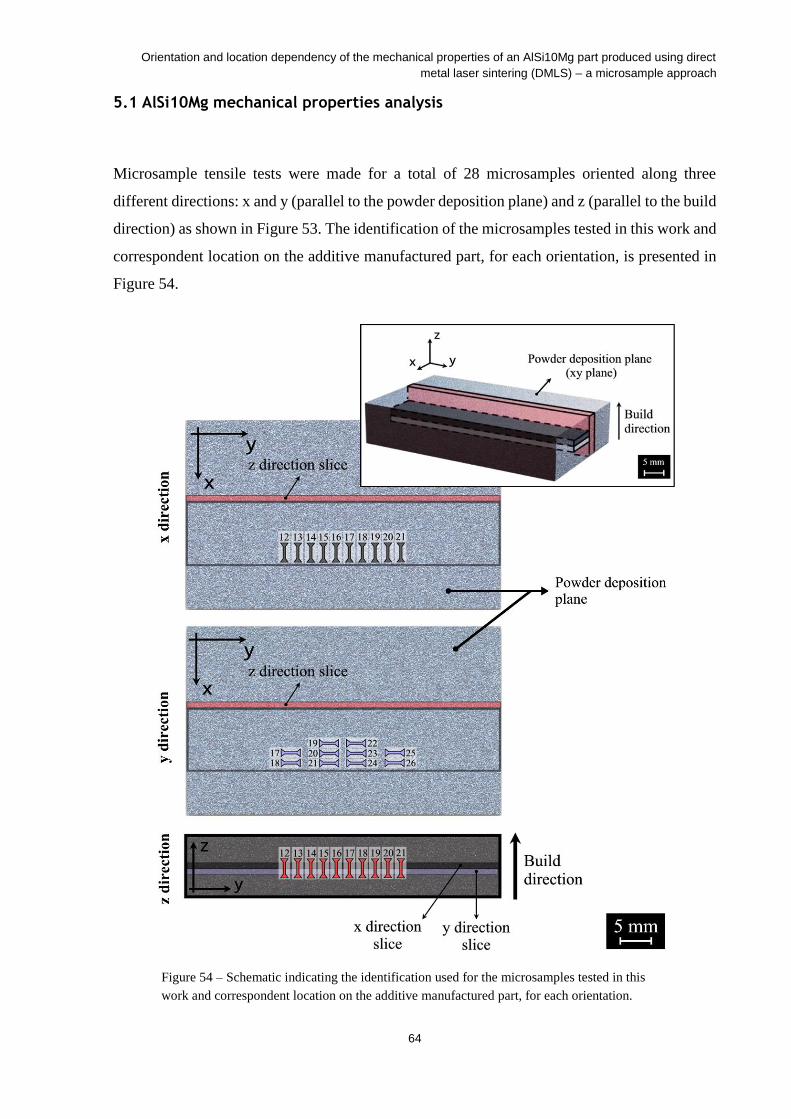
Orientation and location dependency of the mechanical properties of an AlSi10Mg part produced using direct
metal laser sintering (DMLS) – a microsample approach
64
5.1 AlSi10Mg mechanical properties analysis
Microsample tensile tests were made for a total of 28 microsamples oriented along three
different directions: x and y (parallel to the powder deposition plane) and z (parallel to the build
direction) as shown in Figure 53. The identification of the microsamples tested in this work and
correspondent location on the additive manufactured part, for each orientation, is presented in
Figure 54.
Figure 54 – Schematic indicating the identification used for the microsamples tested in this
work and correspondent location on the additive manufactured part, for each orientation.

Orientation and location dependency of the mechanical properties of an AlSi10Mg part produced using direct
metal laser sintering (DMLS) – a microsample approach
65
Moreover, Figure 55 shows how the location of the microsamples oriented along the x direction
is related to the location of the microsamples oriented along the y direction, with a superposition
of these two sets.
Values of load and displacement were directly obtained through the microsample tensile tests
and engineering stress values were determined. Post test, DIC analysis was applied to images
captured during the testing of the microsamples gage to determine the corresponding
engineering strain for a given stress. The collected data was then organized and used to generate
the engineering stress-strain responses for each microsample.
It was observed that the microsamples were subjected to plastic strain, for which it is more
meaningful to represent the true stress-strain curves (William D. Callister 2001, Fonseca 2014)
to further characterize the strain behavior of the material (R. E. Smallman 1999). Therefore,
true stress and strain values were determined using the following relationships, valid to the
onset of necking (William D. Callister 2001).
𝜎𝑇 = 𝜎(1 + 𝜀)
𝜀𝑇 = ln (1 + 𝜀)
These equations relate the true stress and true strain, σT and εT respectively, to the engineering
stress and strain values, σ and ε.
Figure 55 – Schematic showing the relation between locations of the microsamples oriented along the
x direction to the ones oriented along the y direction.

Orientation and location dependency of the mechanical properties of an AlSi10Mg part produced using direct
metal laser sintering (DMLS) – a microsample approach
66
The true stress and strain responses of all the microsamples tested oriented along each direction
are presented in Figure 56 to Figure 58.
Figure 56 – Stress-strain responses of the microsamples oriented along the x direction, on the powder
deposition plane.
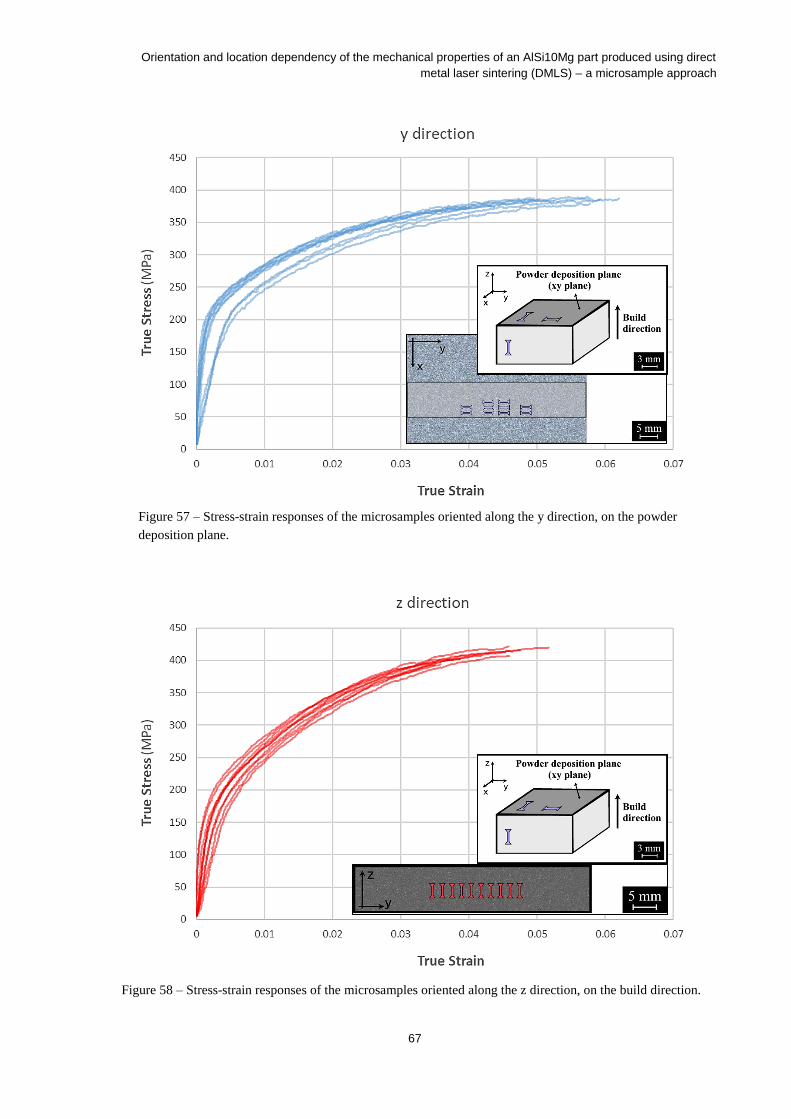
Orientation and location dependency of the mechanical properties of an AlSi10Mg part produced using direct
metal laser sintering (DMLS) – a microsample approach
67
Figure 58 – Stress-strain responses of the microsamples oriented along the z direction, on the build direction.
Figure 57 – Stress-strain responses of the microsamples oriented along the y direction, on the powder
deposition plane.

Orientation and location dependency of the mechanical properties of an AlSi10Mg part produced using direct
metal laser sintering (DMLS) – a microsample approach
68
For each microsample tested, the Young’s modulus values, E, were determined through the
analysis of the linear elastic region slope on each of the stress-strain responses. Yield strength
values at a 0.2% offset yield method were also determined through the direct analysis of the
stress-strain responses. A parallel line to the elastic region distanced by 0.002 of strain was
drawn and the stress value of the intersection of that line to the response curve was recorded,
corresponding to the yield strength value at a 0.2% offset. On the other hand, ultimate tensile
strength (UTS) values were determined by analyzing the maximum stress values for each
microsample over the entire data obtained from the tensile tests.
Figure 59 to Figure 61 shows the determined Young’s modulus, yield strength and UTS values
for the tested microsamples oriented along the x, y and z directions as a function of the sample
identification number, i.e. its location on the part. On the yield strength and UTS plots, the
difference between the maximum and minimum values of the respective mechanical property
is also presented, as a percentage of the maximum mechanical property value.

Orientation and location dependency of the mechanical properties of an AlSi10Mg part produced using direct
metal laser sintering (DMLS) – a microsample approach
69
Fig
ure
59
– Y
oung
’s m
od
ulu
s val
ues
of
the
mic
rosa
mp
les
test
ed o
rien
ted
alo
ng t
he
x,
y a
nd
z d
irec
tio
ns,
as
a fu
nct
ion o
f th
e sa
mp
le l
oca
tio
n o
n t
he
add
itiv
e m
anu
fact
ure
d
par
t.

Orientation and location dependency of the mechanical properties of an AlSi10Mg part produced using direct
metal laser sintering (DMLS) – a microsample approach
70
Fig
ure
60
– Y
ield
str
ength
val
ues
of
the
mic
rosa
mp
les
test
ed o
rien
ted
alo
ng t
he
x,
y a
nd
z d
irec
tio
ns,
as
a fu
ncti
on o
f th
e s
am
ple
lo
cati
on o
n t
he
add
itiv
e m
an
ufa
ctu
red
par
t.
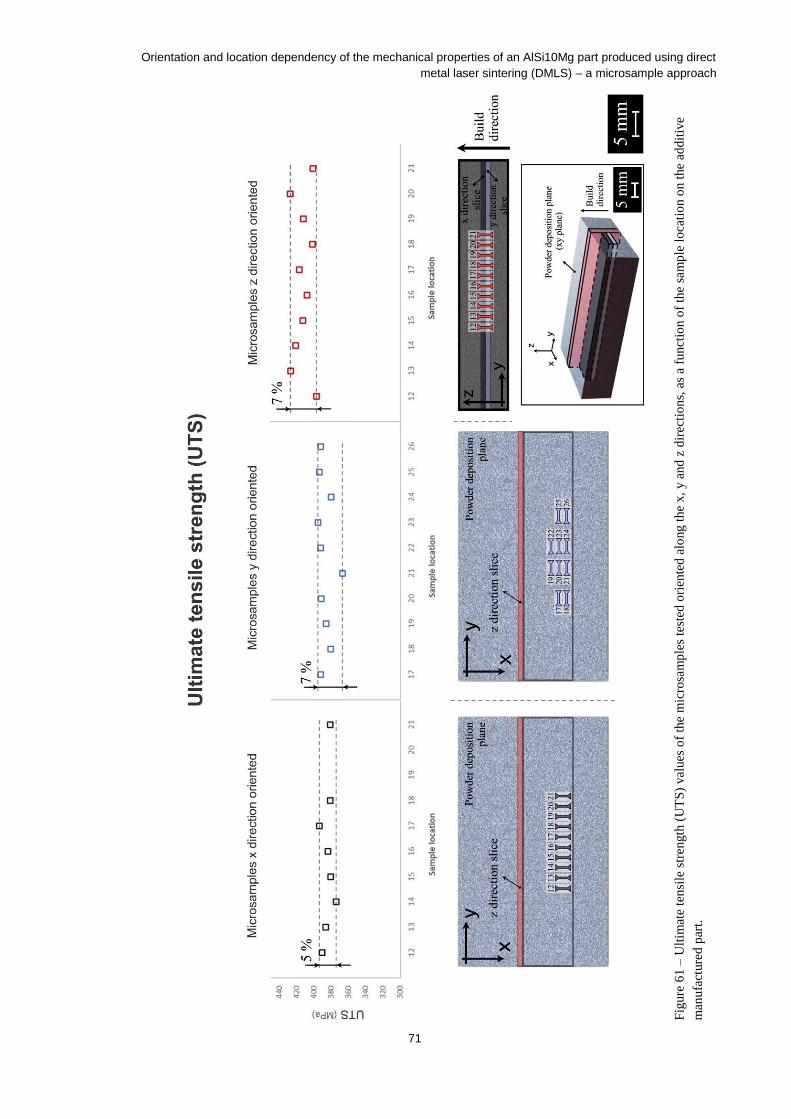
Orientation and location dependency of the mechanical properties of an AlSi10Mg part produced using direct
metal laser sintering (DMLS) – a microsample approach
71
Fig
ure
61
– U
ltim
ate
ten
sile
str
ength
(U
TS
) val
ues
of
the
mic
rosa
mp
les
test
ed o
rien
ted
alo
ng t
he
x,
y a
nd
z d
irec
tio
ns,
as
a fu
nct
ion o
f th
e sa
mp
le l
oca
tio
n o
n t
he
add
itiv
e
man
ufa
cture
d p
art.

Orientation and location dependency of the mechanical properties of an AlSi10Mg part produced using direct
metal laser sintering (DMLS) – a microsample approach
72
Moreover, mean and standard deviation of the Young’s modulus, yield strength and UTS values
for each orientation were determined and are presented in Table 4.
Table 4 – Values of mean and standard deviation of Young’s modulus, yield strength and UTS, for each
orientation.
Orientation
x y z
Young’s modulus
Mean (MPa)
70.42 81.24 87.52
Standard deviation (MPa)
26.00 29.45 25.25
Yield Strength
Mean (MPa)
225.07 237.46 207.67
Standard deviation (MPa)
3.97 7.47 5.78
UTS
Mean (MPa)
384.03 387.34 412.34
Standard deviation (MPa)
6.24 8.85 10.69
Table 5 shows a comparison between the mechanical properties mean values obtained from the
microsample tensile tests to the ones presented in literature obtained using larger sized samples
(Diego Manfredi 2013). Also, a comparison to the mechanical properties means of the
correspondent typical casting alloy A360.0 is shown (Diego Manfredi 2013).

Orientation and location dependency of the mechanical properties of an AlSi10Mg part produced using direct
metal laser sintering (DMLS) – a microsample approach
73
Table 5 – Mechanical properties means of a DMLS AlSi10Mg obtained through: microsample tensile tests; large
standard samples tensile tests, presented in literature (Diego Manfredi 2013). Also, mechanical properties mean
values of the correspondent as-fabricated A360.0 F casting alloy.
Material Orientation
Young’s modulus (GPa)
Yield strength (MPa)
UTS (MPa)
Means Means Means
DMLS AlSi10Mg (microsamples)
x 70.42 225.07 384.03
y 81.24 237.46 387.34
z 87.52 207.67 412.34
DMLS AlSi10Mg (large size samples)
xy plane 73 244.22 343.20
z 72 231.69 340.52
A360.0 F (as-fabricated)
- 71 170 317
As seen in Table 5, the mechanical properties values obtained do not match the ones presented
in literature, obtained using large size samples. Inclusively, measurable differences were
obtained for the x and y directions, while in literature the material is considered to have isotropic
properties along the xy plane (powder deposition plane, Figure 53). The inherent small size of
microsamples allowed therefore to obtain information that could not otherwise be obtained
through the use of standard size samples, as expected.
The Young's modulus values show a relatively high variation throughout the part (Figure 59),
for each orientation, featuring high standard deviation values. Young’s modulus values vary
from 36 GPa to 122 GPa for the x direction oriented microsamples, from 34 GPa to 123 GPa
on the y direction and from 45 GPa to 122 GPa on the z direction. However, values of this
mechanical property and correspondent variations along the part shows similarities when
comparing the three different orientations analyzed, as seen in Figure 62.

Orientation and location dependency of the mechanical properties of an AlSi10Mg part produced using direct
metal laser sintering (DMLS) – a microsample approach
74
Resulting from the material fabrication, a polycrystalline material microstructure is constituted
by several grains, each one with a specific associated crystallographic orientation (Silva 2012 ),
as demonstrated in Figure 63. The variation of Young’s modulus values along the part, for a
given orientation, suggests that the microsample elastic deformation is locally controlled by
grains with a given FCC crystal structure orientation which prevail over grains with crystal
structures oriented differently.
Figure 63 – Schematic of a polycrystalline material microstructure, showing different
crystallographic orientations for different grains (Silva 2012 ).
Figure 62 – Young’s modulus values and respective means for each orientation on the part produced
through additive manufacturing.

Orientation and location dependency of the mechanical properties of an AlSi10Mg part produced using direct
metal laser sintering (DMLS) – a microsample approach
75
As for the Young’s modulus, yield strength values also show measurable variations along the
part, for a given orientation (Figure 60), as observable from the percentage values represented
in the plots and standard deviations. When comparing the yield strength values of each of the
studied orientations, as shown in Figure 64, differences of this mechanical property values are
also evident.
Yield strength values show to be different for the x and y directions (parallel to the powder
deposition plane), in contradiction to what is referred in literature. Higher values were obtained
on the y direction, followed by the x and z directions, respectively.
In line with what is observable from the yield strength values, ultimate tensile strength (UTS)
values within the same orientation also show measurable variations, as seen in Figure 61. These
variations are highlighted with the indication of the correspondent percentage of variation,
Figure 61, and standard deviations. Furthermore, differences of UTS values are noticeable when
compared between different orientations, as shown in Figure 65.
Figure 64 – Yield strength values and respective means for each orientation on the part produced through
additive manufacturing.

Orientation and location dependency of the mechanical properties of an AlSi10Mg part produced using direct
metal laser sintering (DMLS) – a microsample approach
76
Ultimate tensile strength (UTS) values show to be higher for the z direction, followed by the y
and x direction respectively. However, UTS values for the y direction are only slightly higher
than the ones observed for the x direction.
As shown in literature for parts produced through additive manufacturing, different
microstructures are formed for the powder deposition plane and for the build direction (Figure
11), due to the building strategy used and the complex local thermal evolutions involved in the
process of the part fabrication. As seen in Figure 66, melt pool lines resultant from the metallic
powder melting during the part fabrication are parallel to the powder deposition plane and
oriented along several directions, corresponding to the 67 degrees scanning path rotation for
each consecutive layer formed. Furthermore, melt pools present similar dimensions due to the
use of the same process parameters on the fabrication of the core of a part, from where
microsamples were removed.
Figure 65 – Ultimate tensile strength (UTS) values and respective means for each orientation on the part
produced through additive manufacturing.
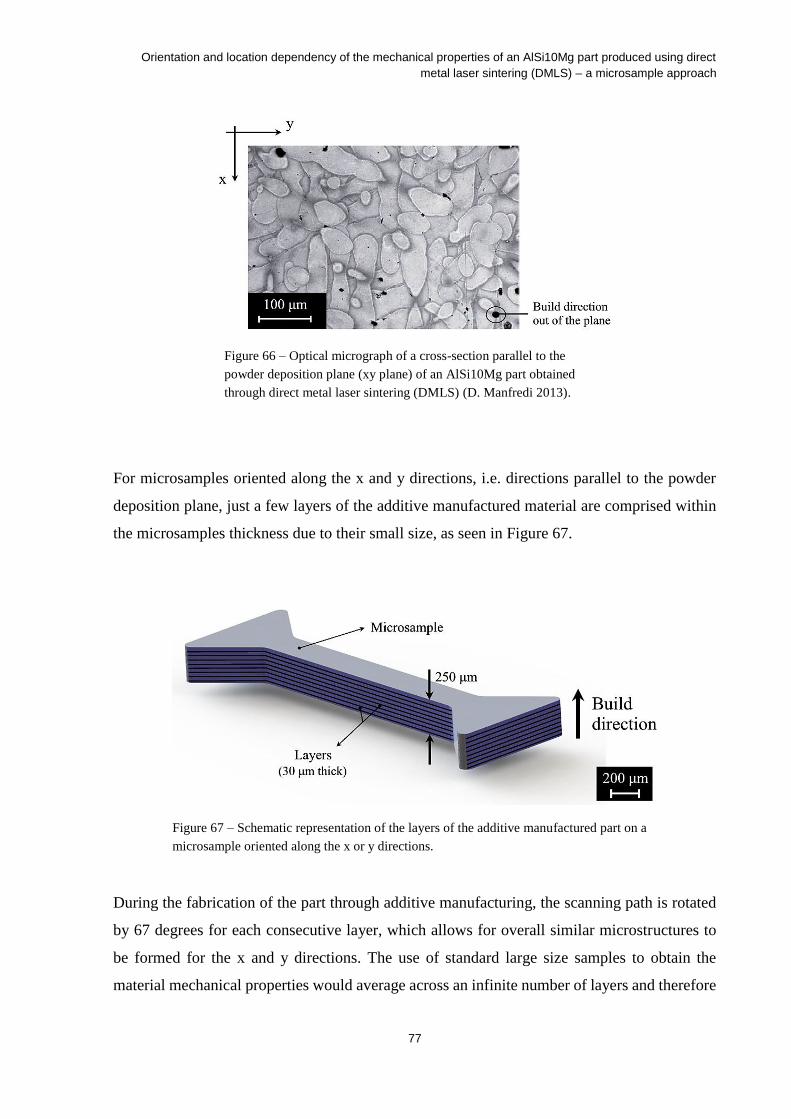
Orientation and location dependency of the mechanical properties of an AlSi10Mg part produced using direct
metal laser sintering (DMLS) – a microsample approach
77
For microsamples oriented along the x and y directions, i.e. directions parallel to the powder
deposition plane, just a few layers of the additive manufactured material are comprised within
the microsamples thickness due to their small size, as seen in Figure 67.
During the fabrication of the part through additive manufacturing, the scanning path is rotated
by 67 degrees for each consecutive layer, which allows for overall similar microstructures to
be formed for the x and y directions. The use of standard large size samples to obtain the
material mechanical properties would average across an infinite number of layers and therefore
Figure 67 – Schematic representation of the layers of the additive manufactured part on a
microsample oriented along the x or y directions.
Figure 66 – Optical micrograph of a cross-section parallel to the
powder deposition plane (xy plane) of an AlSi10Mg part obtained
through direct metal laser sintering (DMLS) (D. Manfredi 2013).

Orientation and location dependency of the mechanical properties of an AlSi10Mg part produced using direct
metal laser sintering (DMLS) – a microsample approach
78
similar mechanical properties values would be obtained for these two directions. However, the
finite number of layers within the microsample thickness can stand for locally slightly different
microstructures for the x and y directions, which has a direct and measurable influence on the
mechanical behavior of the material. It therefore justifies the difference observed between the
yield strength and UTS values for the x and y directions (Figure 64 and Figure 65, respectively).
The observed variations of yield strength and UTS values along the part (Figure 60 and Figure
61, respectively), for a given orientation, can also be justified by the small size of microsamples.
Even though the microsamples tested were removed from locations subject to the same
scanning strategy and process parameters, the order of magnitude of their cross-sectional area
(≈ 250 μm x 250 μm) is sufficiently small so that locally different microstructures can be present.
Therefore, slightly different mechanical properties were obtained.
On the other hand, the mechanical behaviors differences observed between the microsamples
oriented along x and y directions (parallel to the powder deposition plane) to the microsamples
oriented along the z direction (parallel to the build direction) can be justified by the different
microstructures formed for these directions during the production of the part, as seen in Figure
11.
Whereas the tensile characteristics of the x and y directions oriented microsamples are dictated
in its majority by the very fine microstructure of the melt pool core (Figure 68 a) and b)), the
tensile characteristics of the z direction oriented microsamples are dictated by the coarser and
elongated grains of the melt pool boundaries and overlaps (Figure 68 c)). When comparing the
microsamples along the z direction to the ones along the x and y directions, this results in higher
yield strength values for the microsamples oriented along the x and y directions, but lower
ultimate tensile strength (UTS). Furthermore, strain to failure values have shown to be higher
for the x and y direction microsamples.
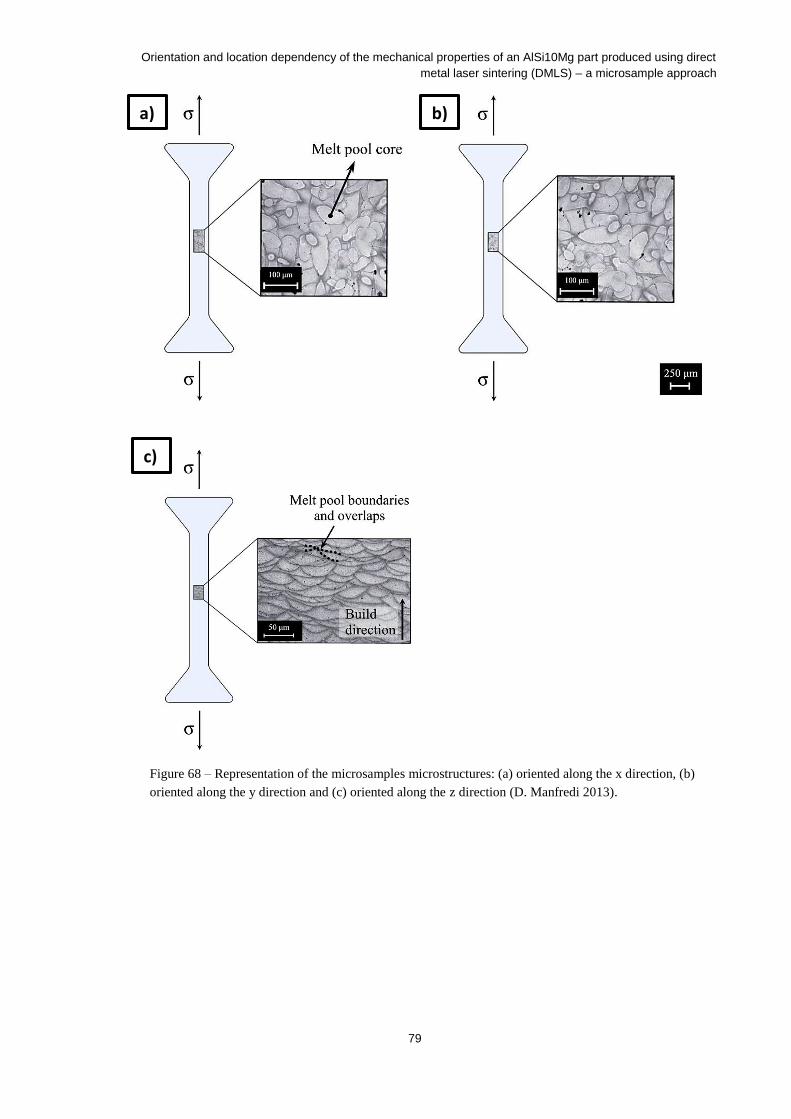
Orientation and location dependency of the mechanical properties of an AlSi10Mg part produced using direct
metal laser sintering (DMLS) – a microsample approach
79
Figure 68 – Representation of the microsamples microstructures: (a) oriented along the x direction, (b)
oriented along the y direction and (c) oriented along the z direction (D. Manfredi 2013).
a) b)
c)
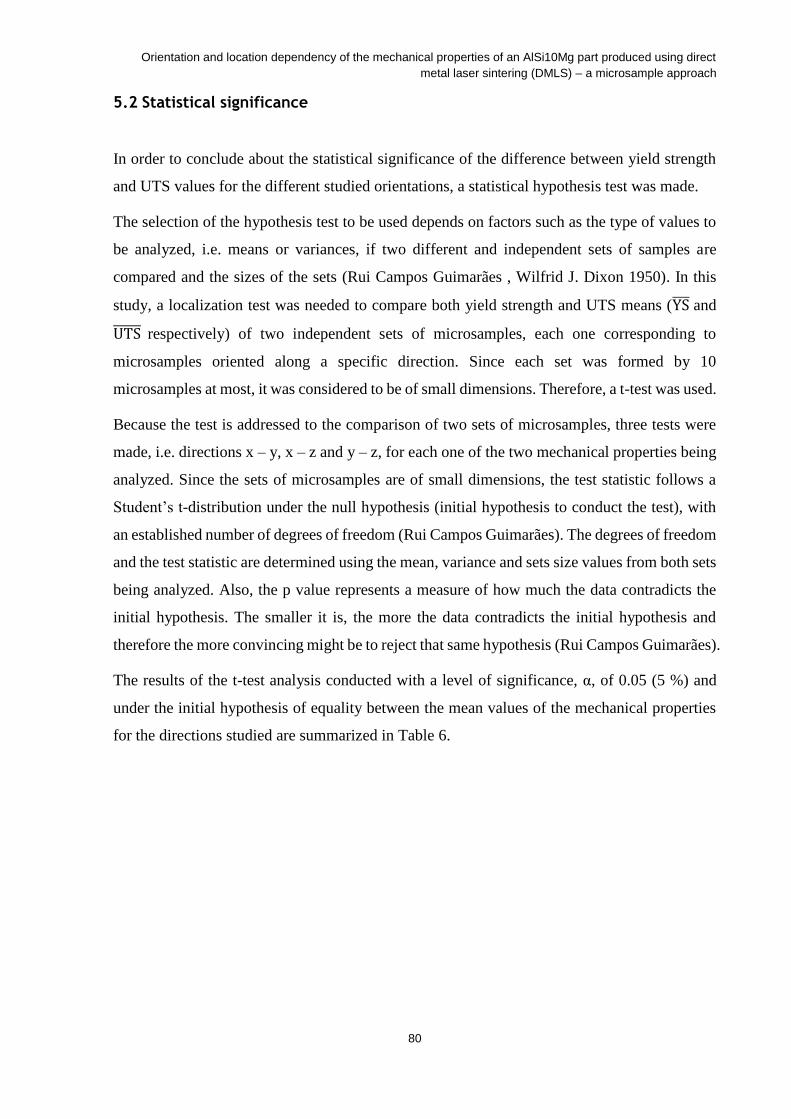
Orientation and location dependency of the mechanical properties of an AlSi10Mg part produced using direct
metal laser sintering (DMLS) – a microsample approach
80
5.2 Statistical significance
In order to conclude about the statistical significance of the difference between yield strength
and UTS values for the different studied orientations, a statistical hypothesis test was made.
The selection of the hypothesis test to be used depends on factors such as the type of values to
be analyzed, i.e. means or variances, if two different and independent sets of samples are
compared and the sizes of the sets (Rui Campos Guimarães , Wilfrid J. Dixon 1950). In this
study, a localization test was needed to compare both yield strength and UTS means (YS̅̅ ̅ and
UTS̅̅ ̅̅ ̅ respectively) of two independent sets of microsamples, each one corresponding to
microsamples oriented along a specific direction. Since each set was formed by 10
microsamples at most, it was considered to be of small dimensions. Therefore, a t-test was used.
Because the test is addressed to the comparison of two sets of microsamples, three tests were
made, i.e. directions x – y, x – z and y – z, for each one of the two mechanical properties being
analyzed. Since the sets of microsamples are of small dimensions, the test statistic follows a
Student’s t-distribution under the null hypothesis (initial hypothesis to conduct the test), with
an established number of degrees of freedom (Rui Campos Guimarães). The degrees of freedom
and the test statistic are determined using the mean, variance and sets size values from both sets
being analyzed. Also, the p value represents a measure of how much the data contradicts the
initial hypothesis. The smaller it is, the more the data contradicts the initial hypothesis and
therefore the more convincing might be to reject that same hypothesis (Rui Campos Guimarães).
The results of the t-test analysis conducted with a level of significance, α, of 0.05 (5 %) and
under the initial hypothesis of equality between the mean values of the mechanical properties
for the directions studied are summarized in Table 6.

Orientation and location dependency of the mechanical properties of an AlSi10Mg part produced using direct
metal laser sintering (DMLS) – a microsample approach
81
Table 6 – Summary of the t-test analysis results, applied to the mean values of yield strength (YS) and UTS for
each one of the orientations on the AM part.
The t-test results showed that there was no statistical significant difference between UTS values
for the x and y directions. In fact, UTS values for the y direction are only slightly higher than
the ones observed for the x direction. However, the t-test showed that there was a statistical
significant difference between the yield strength values for the x and y orientations, as already
seen from the results.
Furthermore, the statistical test results showed that there was also statistical significant
difference between yield strength and UTS values, respectively, of the build direction to the
ones from the orientations parallel to the powder deposition plane (Figure 53). As referred
previously, the different mechanical properties observed for the powder deposition plane
orientations and for the build direction can be justified by the different microstructures formed
during the part fabrication (Figure 11), due to the additive manufacturing process building
strategy. Yield strength values showed to be lower for the build direction, however ultimate
tensile strength values showed to be higher.
Yield Strength UTS
Initial hypothesis
YSx̅̅ ̅̅ ̅
= YSy̅̅ ̅̅ ̅
YSx̅̅ ̅̅ ̅
= YSz̅̅ ̅̅̅
YSy̅̅ ̅̅ ̅
= YSz̅̅ ̅̅̅
UTSx̅̅ ̅̅ ̅̅ ̅
= UTSy̅̅ ̅̅ ̅̅ ̅
UTSx̅̅ ̅̅ ̅̅ ̅
= UTSz̅̅ ̅̅ ̅̅ ̅
UTSy̅̅ ̅̅ ̅̅ ̅
= UTSz̅̅ ̅̅ ̅̅ ̅
α 0.05
p value (2 tailed)
6.47E-04 1.99E-06 9.26E-09 3.85E-01 5.88E-06 2.10E-05
Acceptance Rejected.
Statistically different
Rejected. Statistically
different
Rejected. Statistically
different
Not rejected. Statistically
equal
Rejected. Statistically
different
Rejected. Statistically
different

Orientation and location dependency of the mechanical properties of an AlSi10Mg part produced using direct
metal laser sintering (DMLS) – a microsample approach
82
5.3 Fractographic analysis - scanning electron microscopy (SEM)
In order to study and better understand the failure mechanisms of materials produced using
additive manufacturing, a fractographic analysis was made to the fracture surfaces of 3
microsamples for each orientation using scanning electron microscopy (SEM). For that, a
scanning electron microscope FEI Nova NanoSEM 450 in the department of physics at UMBC
was used.
5.3.1 Microsample preparation for SEM imaging and parameters used
After microsamples were tested, their preparation to perform a fractographic analysis using
SEM was required. Microsamples were cleaned in an ultrasonic cleaner to remove the painted
speckle from their surface, which was previously used to perform a DIC analysis for strain
measurement. They were afterwards glued to a block, as seen in Figure 69, to make it easier for
microsamples to be handled in the scanning electron microscope.
SEM images were obtained by the means of backscattered electrons. They were taken at a 4.3
to 5 mm distance from the microsamples surfaces, with magnifications ranging from 1,000x to
5,000x. Moreover, 20 – 30 kV of the emitted probe of electrons energies were used.
Figure 69 – Schematic representation of a microsample mounted in a block for
fractographic analysis using SEM.

Orientation and location dependency of the mechanical properties of an AlSi10Mg part produced using direct
metal laser sintering (DMLS) – a microsample approach
83
5.3.2 Fractographic analysis
Figure 70 shows SEM images of the fracture surfaces of the microsamples used for
fractographic analysis, for different locations and orientations on the additive manufactured part
in accordance with Figure 54.
Figure 70 – SEM images of the fracture surfaces of the microsamples used for fractographic analysis,
with respective identification number and orientation on the AM part.

Orientation and location dependency of the mechanical properties of an AlSi10Mg part produced using direct
metal laser sintering (DMLS) – a microsample approach
84
The review of the microsamples fracture surfaces angles in Figure 70 shows that the samples
harvested from the x and y orientations, in which the fracture surfaces make ≈ 37 - 38 degrees
to the tensile axis. The two mimic each other and the deviation from 45 degrees is attributed to
microstructural texturing that results from the AM processing. It is noted that the z oriented
microsamples present a fracture surface that is closer to 45 degrees and has more out of plane
features. These angle variations and out of plane features are attributed to the fact that the z
oriented microsamples are composed of processed material layers that are loaded in tensions
(Figure 68 c)). The shape of these layers expresses themselves on the materials fracture surface.
Powder deposition plane – x direction
Figure 72 to Figure 74 shows SEM images of the fracture surfaces of microsamples oriented
along the x direction, parallel to the powder deposition plane. Also, Figure 71 shows a
schematic representation of a microsample oriented along the x direction on a part produced
using additive manufacturing.
Figure 71 – Schematic representation of the
microsamples oriented along the x direction on a part
produced using AM.

Orientation and location dependency of the mechanical properties of an AlSi10Mg part produced using direct
metal laser sintering (DMLS) – a microsample approach
85
a)
b)
b)
Figure 72 – SEM image of the fracture surface of the
microsample number 13, oriented along the x direction.
Figure 73 – SEM image of the fracture surface of the microsample number 14, oriented along the x
direction. (a) and (b) Higher magnifications of the fracture surface.

Orientation and location dependency of the mechanical properties of an AlSi10Mg part produced using direct
metal laser sintering (DMLS) – a microsample approach
86
For the x oriented microsamples, all fracture surfaces seen in the SEM images (Figure 72 to
Figure 74) show ductile failure mainly due to the presence of very fine dimples, which can be
observed at higher magnifications as in Figure 73 b). Necking of the microsamples was not
evident. The fracture surfaces also show river like patterns that rise out of the plane, which can
be attributed to deformation in the boundaries of the melt pools resulting in step cleavages, as
indicated in Figure 72. These step cleavage features are a brittle response.
The distinctive features of the AM process create a unique microstructure in the AlSi10Mg
parts and microtensile samples. The characteristics of the resultant microstructure are
dependent on the thermal gradient G and the growth rate R (Yan et al. 2015, Thijs et al. 2013).
G is determined by the difference of the temperature over a certain distance and varies with the
time and place inside the melt track, R depends on the laser scanning speed and angle between
the laser moving direction and the growth direction of the solidifying material. The G over R
ratio (G/R) determines the morphology of the microstructure.
An equiaxed dendritic, columnar dendritic, cellular and planar are successively expected when
the G/R ratio continuously changes from low to high value. The fineness of the microstructure
is determined by the cooling rate (T = G x R). The higher cooling rate will lead to greater
undercooling, and thus the finer microstructure. The AM processed used in this study is capable
of generating a high cooling rate, due to the rapid scanning velocity of the laser beam and high
thermal gradient (about 105 °C/m) of the processing (Thijs et al. 2013). Because of these
Figure 74 – SEM image of the fracture surface of the
microsample number 16, oriented along the x direction.

Orientation and location dependency of the mechanical properties of an AlSi10Mg part produced using direct
metal laser sintering (DMLS) – a microsample approach
87
processing features, the fine microstructure of the as-built AM AlSi10Mg material is achieved.
This fine microstructure controls the deformation and is expressed by the small ductile facture
dimples on the fracture surface, as in Figure 73 b).
The SEM image in Figure 73 shows a peculiar detail on the fracture surface of the microsample.
Its observation at higher magnifications, as in Figure 73 a), suggests that the failure within that
region might have started next to the defect that is nearby the out of plane feature. It must have
then extended across the coarser grains from a melt pool overlap, forming the local observable
out of plane feature.
In Figure 74, a melt pool shape with a height of 30 μm, i.e. same as the layer thickness, can be
noticed at the fracture surface. During deformation along the tensile axis, the melt pool core
must have deformed slightly less than the melt pool overlaps, i.e. being pulled on deformation
of the microsample, originating the melt pool shape on the fracture surface.
Because of the Gauss distribution of the laser energy, the under cooling changes over the melt
track, which reaches the maximum at the centerline, then gradually decreases along the cross-
section and finally goes to the minimum at the boundary of the melt track. From this point of
view, the cellular size attains the minimum at the center of the melt track, and the maximum
value on the boundary of the melt track. Because of this, incomplete and nonuniform features
will present themselves in the microstructure. This is acutely apparent by the number of inherent
defects found within each of the samples evaluated in the scanning electron microscope, seen
in Figure 72 to Figure 74.

Orientation and location dependency of the mechanical properties of an AlSi10Mg part produced using direct
metal laser sintering (DMLS) – a microsample approach
88
Powder deposition plane – y direction
Furthermore, Figure 76 to Figure 78 shows SEM images of the fracture surfaces of
microsamples oriented along the y direction, also parallel to the powder deposition plane.
Figure 75 shows a schematic representation of a microsample oriented along the y direction on
a part produced using additive manufacturing.
Figure 75 – Schematic representation of the
microsamples oriented along the y direction on a part
produced using AM.
Figure 76 – SEM image of the fracture surface of the
microsample number 18, oriented along the y direction.

Orientation and location dependency of the mechanical properties of an AlSi10Mg part produced using direct
metal laser sintering (DMLS) – a microsample approach
89
Figure 77 – SEM image of the fracture surface of the
microsample number 20, oriented along the y direction.
Figure 78 – SEM image of the fracture surface of the microsample number 23, oriented along the y
direction and (a) higher magnification of the fracture surface.
a) b)
b)

Orientation and location dependency of the mechanical properties of an AlSi10Mg part produced using direct
metal laser sintering (DMLS) – a microsample approach
90
The same way as for the x oriented microsamples, the fracture surfaces of the microsamples
oriented along the y direction seen in the SEM images (Figure 76 to Figure 78) all show ductile
failure in its majority due to the presence of very fine dimples. These fine dimples can be
observed at higher magnifications in Figure 78 b) and their overall size is of 680 nm. As referred
previously, the small ductile facture dimples visible on the fracture surface are an indication of
the fine microstructure, formed due to the AM process characteristics, which controls the
deformation of the material. Apart from that, necking of the microsamples was also not evident
and step cleavages are visible in the fracture surfaces, as indicated in Figure 76. These step
cleavage features are a brittle response.
The observable out of plane deformation in Figure 78 and a higher magnification of it in Figure
78 a) suggests that the deformation of a melt pool overlap prevailed over the deformation of the
melt pool core. It might be justified by the presence of a defect deep in the slope, which might
have given rise to a failure extended across the coarser and larger grains of a melt pool overlap
on that region.
In addition to this, a small defect can be found in the SEM image of the fracture surface of the
microsample in Figure 76, which can be associated to localized lack of overlap between melt
pools.

Orientation and location dependency of the mechanical properties of an AlSi10Mg part produced using direct
metal laser sintering (DMLS) – a microsample approach
91
Build direction – z direction
SEM images of the fracture surfaces of microsamples oriented along the z direction, parallel to
the build direction, are show in Figure 80 to Figure 82. Also, Figure 79 shows a schematic
representation of a microsample oriented along the z direction on a part produced using additive
manufacturing.
Figure 79 – Schematic representation of the
microsamples oriented along the z direction on a part
produced using AM.
Figure 80 – SEM image of the fracture surface of the
microsample number 14, oriented along the z direction.
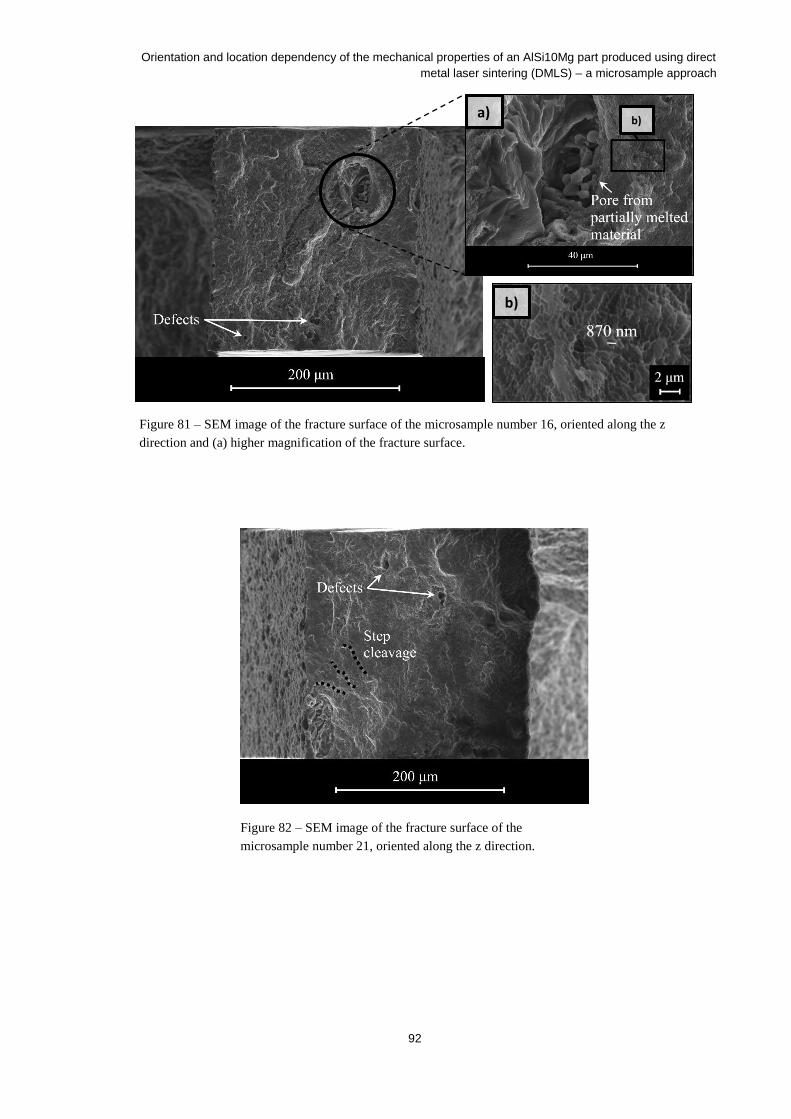
Orientation and location dependency of the mechanical properties of an AlSi10Mg part produced using direct
metal laser sintering (DMLS) – a microsample approach
92
Figure 81 – SEM image of the fracture surface of the microsample number 16, oriented along the z
direction and (a) higher magnification of the fracture surface.
Figure 82 – SEM image of the fracture surface of the
microsample number 21, oriented along the z direction.
a) b)
b)

Orientation and location dependency of the mechanical properties of an AlSi10Mg part produced using direct
metal laser sintering (DMLS) – a microsample approach
93
The fracture surfaces of the microsamples oriented along the build direction, i.e. z direction,
seen in the SEM images in Figure 80 to Figure 82, all show ductile failure mainly due to the
presence of fine dimples, as seen in Figure 81 b). These fine dimples overall size is of 870 nm
and, as mentioned previously, they are an indication of the fine microstructure formed due to
the AM process features. This fine microstructure thus controls the deformation of the material.
Necking of the microsamples was not evident and step cleavages are visible in the fracture
surfaces, as indicated in Figure 82. These step cleavage features are a brittle response.
The size differences of the fine dimples observable on the fracture surfaces of microsamples
oriented along the powder deposition plane directions (Figure 78 b)), to the ones observed for
the build direction (Figure 81 b)) is correlated to the fact that strain to failure was lower for the
build direction. As referred in literature for a ductile failure, dimples size is inversely
proportional to strain to failure. In comparison to the results for the x and y directions, dimples
size was higher for the z direction and therefore it explains the lower strain to failure values for
this direction.
As it happened for some of the other fracture surfaces already studied, the one observed in
Figure 81 also presents a peculiar detail. A magnified SEM image of this detail can be seen in
Figure 81 a) and unlike the out of plane features observed in Figure 73 and Figure 78, this
presents a smooth surface on the left side of the slope and on its core. This might be due to the
fact that there was no deformation of the material in that region, suggesting it is a large defect.
It is possibly justified by a lack of overlap between melt pools caused by a momentary process
instability.
Furthermore, small defects can be found in the SEM images of the fracture surfaces seen in
Figure 81 and Figure 82, while larger defects can be seen in Figure 80. The reason behind their
formation, as already stated, might be related to localized lack of overlap between melt pools.
It is known that the microstructure of the AlSi10Mg alloy can be influenced by superheating
(Li et al. 2015, Wang et al. 2003). The underlying reason can be attributed to the existence of
two temperatures, usually denoted by the dissolution temperature Td and the branching
temperature Tb (Li et al. 2015, I.G. Brodova 2002). At the temperature below Td, the Al and Si-
rich particles which have been inherited from the solid AlSi10Mg alloy exist in the liquid phase.
Once the temperature exceeds Td, these particles begin to be melted. When the temperature is
over Tb, molten Al and Si can be considered to mix homogenously (Li et al. 2015, I.G. Brodova
2002).

Orientation and location dependency of the mechanical properties of an AlSi10Mg part produced using direct
metal laser sintering (DMLS) – a microsample approach
94
According to previous studies, Td and Tb of AlSi10Mg alloy should be around 1020 ± 130 °C
and 1170 ± 30 °C, respectively (Li et al. 2015, Calvo-Dahlborg et al. 2013), which are much
higher than the eutectic temperature of Al-Si alloys (577 °C). During the direct laser AM
process, the temperature of a large part of the melt track exceeds Td but does not reach Tb (Li
et al. 2015, I.G. Brodova 2002). Hence, a large part of the AlSi10Mg alloy melt track undergoes
a superheating condition, which will lead to an inhomogeneous microstructure of the direct
laser AM processed AlSi10Mg alloy. Therefore, an inhomogeneous Al-rich and Si-rich
microstructure is expected, which is helpful to form heterogeneous deformation features. This
peculiar process from the direct laser AM, results in a microstructure which works in
competition during the deformation.
5.3.3 Final remarks
SEM images in Figure 72 to Figure 82 show the fracture surfaces of microsamples oriented
along the x, y and z directions on the additive manufactured part. Inspection of these images
highlights three major features which are present for the orientations. Firstly, the fracture
surfaces are covered in small dimples resulting from the ductile fracture process. The nominal
void sizes are presented in Figure 78 b) and Figure 81 b). It shows that the ductile facture
process was active but the small dimples formed did not grow during this process, which are
indicative of moderate strains to failure as observed in the stress-strain responses. Secondly, the
fracture surfaces express river like patterns that rise out of plane. These river like patterns are
attributed to deformation manifesting itself in the boundaries of the melt pools resulting in step
cleavage. These step cleavage features are a brittle response and would have been the
mechanism of separation precluding extensive plastic deformation. These observations
conclude that the AM manufactured materials have a mixed mode deformation.
Thirdly, the microsamples examined express direct processing defects on the fracture surface.
The material volume sampled by the microsamples is relatively small compared to a work part.
The observations of defects on the microsamples is telltale that the as-fabricated material has
wide spread defects.
Collectively, this characterization of the material provides guidance on a fruitful path for
improvement. By working to eliminate the direct defects, i.e. inconsistent solidification, etc.,

Orientation and location dependency of the mechanical properties of an AlSi10Mg part produced using direct
metal laser sintering (DMLS) – a microsample approach
95
and improving melt pool boundary strength/robustness, these materials show potential to have
increased toughness.

Orientation and location dependency of the mechanical properties of an AlSi10Mg part produced using direct
metal laser sintering (DMLS) – a microsample approach
96

Orientation and location dependency of the mechanical properties of an AlSi10Mg part produced using direct
metal laser sintering (DMLS) – a microsample approach
97
6 Conclusions and Future Work
6.1 Conclusions
In this work, the mechanical behavior of an AlSi10Mg aluminum alloy part produced using
direct metal laser sintering (DMLS) is investigated and characterized along the part, for three
different orientations: x, y and z (Figure 53). The results show that mechanical properties values
varied along the part and for the different orientations studied.
For each orientation studied, the Young’s modulus presents a relatively high variability along
the part, suggesting the different prevalence of grains with a specific crystallographic
orientation for each microsample. Young’s modulus values vary from 36 GPa to 122 GPa for
the x direction oriented microsamples, from 34 GPa to 123 GPa on the y direction and from 45
GPa to 122 GPa on the z direction. Furthermore, similar variations and range of values of this
mechanical property along the part are found when comparing the three different orientations.
Yield strength and ultimate tensile strength (UTS) show variations along the part, for a given
orientation. These variations can be justified by local slightly different microstructures formed
along a specific orientation, resulting from the AM process.
As opposed to the referred in literature, values of yield strength and UTS have shown
measurable differences for the x and y orientations, i.e. directions parallel to the powder
deposition plane. Comparing these two orientations, yield strength differences showed to be
higher than UTS differences. Yield strength as well as UTS values are higher for the y
orientation. For a finite number of layers of the AM part, the rotation of the scanning path by
67 degrees for consecutive layers and the melt pool overlaps is not sufficient to generate an
isotropic microstructure along the powder deposition plane. If not taken into consideration in
structural design, the wrong assumptions can be made specially for thin features with the
smallest dimension parallel to the build direction.
When comparing these mechanical properties values between the powder deposition plane
directions and the build direction, yield strength and ultimate tensile strength (UTS) values also
showed to be different. Yield strength showed to be lower for the build direction and UTS
higher. The microstructural anisotropy introduced by means of the layer-by-layer approach of
the additive manufacturing process justifies these mechanical properties variations. Tensile
characteristics of the material along the powder deposition plane directions are dictated mainly
by the very fine microstructure of melt pool cores. However, tensile characteristics of the

Orientation and location dependency of the mechanical properties of an AlSi10Mg part produced using direct
metal laser sintering (DMLS) – a microsample approach
98
material along the build direction are dictated mainly by the coarser and elongated grains of the
melt pool boundaries and overlaps. Therefore, higher yield strength values are associated to the
powder deposition plane orientations, but lower ultimate tensile strength (UTS). Furthermore,
strain to failure have shown to be higher for the powder deposition plane directions.
The mechanical properties values obtained do not match the ones reported in literature, obtained
using standard large sized samples for tensile testing. The use of microsamples allowed to
explore the material inhomogeneities and understand the influence of the AM process
parameters on the additive manufactured part mechanical properties. This know-how is
essential to fill the knowledge gap existent in literature about the mechanical properties
variation in an additive manufactured part.
A fractographic analysis to the fracture surface of the tested microsamples using scanning
electron microscopy (SEM) showed that the AM manufactured materials have a mixed mode
deformation, while necking was not evident. The existent small dimples indicate that the ductile
fracture process was active, but their overall size indicates that they did not grow during this
process resulting in moderate strains to failure. On the contrary, step cleavage features are a
brittle response and would have been the mechanism of separation preventing for extensive
plastic deformation to occur.
Microsamples fracture angles showed that the samples harvested from the x and y orientations
and that the two mimic each other. The deviation from 45 degrees with the tensile axis is
attributed to microstructural texturing that results from the AM processing. Microsamples
oriented along the z direction present angle variations and out of plane features that are
attributed to the tensioned processed material layers. The shape of these layers expresses
themselves on the materials fracture surface.
The SEM images of the fracture surfaces also showed the presence of processing defects,
suggesting localized lack of overlap between melt pools. Due to the small volume of material
sampled by microsamples, the observations of defects on the microsamples is telltale that the
as-fabricated material has wide spread defects.
Collectively, this characterization of the material provides guidance on a fruitful path for
improvement. By working to eliminate the direct defects, i.e. inconsistent solidification, etc.,
and improving melt pool boundary strength/robustness, these materials show potential to have
increased toughness.

Orientation and location dependency of the mechanical properties of an AlSi10Mg part produced using direct
metal laser sintering (DMLS) – a microsample approach
99
6.2 Future research
To complement the present work on studying the orientation and location dependency of
mechanical properties on an AlSi10Mg aluminum alloy part produced using direct metal laser
sintering (DMLS), the following studies should be done:
• Analyze cross-sectional and longitudinal, i.e. over the microsample gage length,
microstructures of the microsamples tested, along the part and for each of the three
orientations.
Moreover, the study on the mechanical properties variation on an additive manufactured part
using a microsample approach could be expanded:
• As in typical structural applications, the material from certain sections of a part is
solicited along directions other than the horizontal and vertical directions, i.e. powder
deposition plane and build direction respectively. A study to understand how the
mechanical properties of an additive manufactured part vary for different orientations
other than along the powder deposition plane and build direction could be made, using
a microsample approach;
• Different additive manufacturing technologies using different scanning strategies and
processing parameters could also be investigated.

Orientation and location dependency of the mechanical properties of an AlSi10Mg part produced using direct
metal laser sintering (DMLS) – a microsample approach
100

Orientation and location dependency of the mechanical properties of an AlSi10Mg part produced using direct
metal laser sintering (DMLS) – a microsample approach
101
References
A. Bogner, P.-H. Jouneau, G. Thollet, D. Basset, C. Gauthier. 2006. "A history of scanning
electron microscopy developments: Towards ‘‘wet-STEM’’ imaging."
Amanda J. Sterling, Brian Torries, Nima Shamsaei, Scott M. Thompson, Denver W. Seely.
2015. "Fatigue behavior and failure mechanisms of direct laser deposited Ti–6Al–4V."
Ashby, Michael. 2015. Materials and Sustainable Development. 1st Edition ed.
ASTM International. 100 Barr Harbour Dr., PO Box C700 West Conshohocken Pennsylvania
19428-2959, United States. "Standard Test Methods for Tension Testing of Metallic
Materials. Designation: E8/E8M – 09."
Bartłomiej Wysocki, Piotr Maj, Agnieszka Krawczy´nska, Krzysztof Ro˙zniatowski, Joanna
Zdunek, Krzysztof Jan Kurzydłowski, Wojciech´Swi˛eszkowski. 2016.
"Microstructure and mechanical properties investigation of CPtitanium processed by
selective laser melting (SLM)."
Bing Pan, Kemao Qian, Huimin Xie and Anand Asundi. 2009. "Two-dimensional digital
image correlation for in-plane displacement and strain measurement: a review."
Calvo-Dahlborg, M., P. S. Popel, M. J. Kramer, M. Besser, J. R. Morris, and U. Dahlborg.
2013. "Superheat-dependent microstructure of molten Al–Si alloys of different
compositions studied by small angle neutron scattering." Journal of Alloys and
Compounds 550 (Supplement C):9-22. doi:
https://doi.org/10.1016/j.jallcom.2012.09.086.
Cheng, Christopher Lee. 2008. "Mechanical and Microstructural Characterization of Copper
Microsamples After Cold Drawing." Master of Science in Mechanical Engineering,
University of Maryland, Baltimore County.
D. A. LaVan and W. N. Sharpe, Jr. 1999. "Tensile Testing of Microsamples."
D. Manfredi, F. Calignano, E. P. Ambrosio, M.Krishnan, R. Canali, S. Biamino, M. Pavese,
E. Atzeni, L. Iuliano, P. Fino, C. Badini. 2013. "Direct Metal Laser Sintering: an
additive manufacturing technology ready to produce lightweight structural parts for
robotic applications."
D.S. Gianola and W.N. Sharpe, Jr. 2004. "Techniques for testing thin films in tension."
de Assumpção Pereira-da-Silva, Marcelo, and Fabio A. Ferri. 2017. "1 - Scanning Electron
Microscopy A2 - Róz, Alessandra L. Da." In Nanocharacterization Techniques, edited
by Marystela Ferreira, Fabio de Lima Leite and Osvaldo N. Oliveira, 1-35. William
Andrew Publishing.
Diego Manfredi, Flaviana Calignano, Manickavasagam Krishnan, Riccardo Canali, Elisa
Paola Ambrosio and Eleonora Atzeni. 2013. "From Powders to Dense Metal Parts:
Characterization of a Commercial AlSiMg Alloy Processed through Direct Metal
Laser Sintering."
E. Atzeni, M. Barletta, F. Calignano, L. Iuliano, G. Rubino, V. Tagliaferri. 2016. "Abrasive
Fluidized Bed (AFB) finishing of AlSi10Mg substrates manufactured by Direct Metal
Laser Sintering (DMLS)."
E. Balducci, L. Ceschini, S. Messieri, S. Wenner, R. Holmestad. 2017. "Thermal stability of
the lightweight 2099 Al-Cu-Li alloy: Tensile tests and microstructural investigations
after overaging."
Flaviana Calignano, Diego Manfredi, Elisa Paola Amb rosio, Sara Biamino, Mariangela
Lomb ardi, Eleonora Atzeni, Alessandro Salmi, Paolo Minetola, Luca Iuliano, and
Paolo Fino. 2017. "Overview on Additive Manufacturing Technologies."

Orientation and location dependency of the mechanical properties of an AlSi10Mg part produced using direct
metal laser sintering (DMLS) – a microsample approach
102
Fonseca, Iván Darío Romero. 2014. "Correction of the post – necking true stress – strain data
using instrumented nanoindentation." University of North Carolina at Charlotte.
Frazier, William E. 2014. "Metal Additive Manufacturing: A Review." Journal of Materials
Engineering and Performance.
Gebhardt, Andreas, and Jan-Steffen Hötter. 2016. "4 - Rapid Prototyping." In Additive
Manufacturing, 291-352. Hanser.
GmbH, EOS. 2010. Technical Description EOSINT M 280.
Groover, Mikell P. 2007. Fundamentals of Modern Manufacturing - Materials, Processes and
Systems. Third Edition ed.
Haijun Gong, Khalid Rafi, Hengfeng Gu, Thomas Starr, Brent Stucker. 2014. "Analysis of
defect generation in Ti–6Al–4V parts made using powder bed fusion additive
manufacturing processes."
Herderick, E. 2011. "Additive Manufacturing of Metals: A Review."
Hernandez, Kaufui V.Wong and Aldo. 2012. "A Review of Additive Manufacturing."
I.G. Brodova, P.S. Popel, G.I. Eskin. 2002. Liquid Metal Processing: Application to
Aluminium Alloy Production.
Jorge Rodrigues, Paulo Martins. 2005. Tecnologia Mecânica - Tecnologia da Deformação
Plástica. Vol. I - Fundamentos Teóricos.
Joseph Goldstein, Dale E. Newbury, Patrick Echlin, David C. Joy, Alton D. Romig Jr.,
Charles E. Lyman, Charles Fiori, Eric Lifshin. 2012. Scanning Electron Microscopy
and X-Ray Microanalysis: A Text for Biologists, Materials Scientists, and Geologists:
Springer Science & Business Media.
K.J. Hemker and W.N. Sharpe, Jr. 2007. "Microscale Characterization of Mechanical
Properties."
Lawrence E. Murr, Edwin Martinez, Krista N. Amato, Sara M. Gaytan, Jennifer Hernandez,
Diana A. Ramirez, Patrick W. Shindo, Frank Medina, Ryan B. Wicker. 2012.
"Fabrication of Metal and Alloy Components by Additive Manufacturing: Examples
of 3D Materials Science."
Li, X. P., X. J. Wang, M. Saunders, A. Suvorova, L. C. Zhang, Y. J. Liu, M. H. Fang, Z. H.
Huang, and T. B. Sercombe. 2015. "A selective laser melting and solution heat
treatment refined Al–12Si alloy with a controllable ultrafine eutectic microstructure
and 25% tensile ductility." Acta Materialia 95 (Supplement C):74-82. doi:
https://doi.org/10.1016/j.actamat.2015.05.017.
M. Fera, F. Fruggiero, A. Lambiase and R. Macchiaroli. 2016. "State of the art of additive
manufacturing: Review for tolerances, mechanical resistance and production costs."
M. W. Khaing, J. Y. H. Fuh, L. Lu. 2001. "Direct metal laser sintering for rapid tooling:
processing and characterisation of EOS parts." Journal of Materials Processing
Technology.
M. Zupan, M. J. Hayden, C. J. Boehlert and K. J. Hemker. 2001. "Development of High-
temperature Microsample Testing."
Masuzawa, T. 2000. "State of the Art of Micromachining."
Ming Tang, P. Chris Pistorius. 2016. "Oxides, porosity and fatigue performance of AlSi10Mg
parts produced by selective laser melting."
Mohammad, Mohammad Yeakub Ali & Ammar Sami. 2008. "Experimental Study of
Conventional Wire Electrical Discharge Machining for Microfabrication."
Nannan GUO, Ming C. LEU. 2013. "Additive manufacturing: technology, applications and
research needs."
Nesma T. Aboulkhair, Nicola M. Everitt, Ian Ashcroft, Chris Tuck. 2014. "Reducing porosity
in AlSi10Mg parts processed by selective laser melting."
Nickels, Liz. 2015. "AM and aerospace: an ideal combination."

Orientation and location dependency of the mechanical properties of an AlSi10Mg part produced using direct
metal laser sintering (DMLS) – a microsample approach
103
Nimer, Salahudin M. 2011. "Local Property Characterization of Friction Stir Welded
Titanium 5111." Master of Science in Mechanical Engineering, University of
Maryland, Baltimore County.
Nimer, Salahudin M. 2016. "Microscale mechanical experiments at elevated temperatures:
System development and material characterization." Doctor of Philosophy in
Mechanical Engineering, University of Maryland, Baltimore County.
R. E. Smallman, R. J. Bishop. 1999. Modern Physical Metallurgy & Materials Engineering.
Sixth edition ed.
Rafal M. Molak, Krystian Paradowski, Tomasz Brynk, Lukasz Ciupinski, Zbigniew Pakiela,
Krzysztof J. Kurzydlowski. 2008. "Measurement of mechanical properties in a 316L
stainless steel welded joint." International Journal of Pressure Vessels and Piping.
Reichelt, Rudolf. 2007. "Scanning Electron Microscopy." In Science of Microscopy, edited by
Peter W. Hawkes and John C. H. Spence, 133-272. New York, NY: Springer New
York.
Rui Campos Guimarães, José A. Sarsfield Cabral. Estatística, 2.ª edição.
Seifi, John J. Lewandowski and Mohsen. 2016. "Metal Additive Manufacturing: A Review of
Mechanical Properties."
Silva, Lucas Filipe Martins da. 2012 Comportamento mecânico dos materiais. Edited by
Publindústria.
Sofiane Guessasma, Weihong Zhang, Jihong Zhu, Sofiane Belhabib, and Hedi Nouri. 2015.
"Challenges of additive manufacturing technologies from an optimisation
perspective."
Systems, EOS GmbH - Electro Optical. 2014. EOS Aluminium AlSi10Mg - material data
sheet.
Thijs, Lore, Karolien Kempen, Jean-Pierre Kruth, and Jan Van Humbeeck. 2013. "Fine-
structured aluminium products with controllable texture by selective laser melting of
pre-alloyed AlSi10Mg powder." Acta Materialia 61 (5):1809-1819. doi:
https://doi.org/10.1016/j.actamat.2012.11.052.
Wang, Jun, Shuxian He, Baode Sun, Qixin Guo, and Mitsuhiro Nishio. 2003. "Grain
refinement of Al–Si alloy (A356) by melt thermal treatment." Journal of Materials
Processing Technology 141 (1):29-34. doi: https://doi.org/10.1016/S0924-
0136(02)01007-5.
Wei Pei, Wei Zhengying, Chen Zhen, Du Jun, He Yuyang, Li Junfeng, Zhou Yatong. 2017.
"The AlSi10Mg samples produced by selective laser melting: single track,
densification, microstructure and mechanical behavior."
Wilfrid J. Dixon, Frank J. Massey. 1950. Introduction to Statistical Analysis. Edited by INC.
McGRAW-HILL BOOK COMPANY.
William D. Callister, Jr. 2001. Fundamentals of Materials Science and Engineering. Fifth
edition ed.
Y.M. Wang, K. Wang, D. Pan, K. Lu, K.J. Hemker, E. Ma. 2003. "Microsample tensile
testing of nanocrystalline copper."
Yan, Chunze, Liang Hao, Ahmed Hussein, Philippe Young, Juntong Huang, and Wei Zhu.
2015. "Microstructure and mechanical properties of aluminium alloy cellular lattice
structures manufactured by direct metal laser sintering." Materials Science and
Engineering: A 628 (Supplement C):238-246. doi:
https://doi.org/10.1016/j.msea.2015.01.063.