orientation and size-dependent mechanical modulation … · orientation and size-dependent...
TRANSCRIPT
on February 11, 2013rsif.royalsocietypublishing.orgDownloaded from
rsif.royalsocietypublishing.org
ResearchCite this article: Carnelli D, Vena P, Dao M,
Ortiz C, Contro R. 2013 Orientation and size-
dependent mechanical modulation within
individual secondary osteons in cortical bone
tissue. J R Soc Interface 10: 20120953.
http://dx.doi.org/10.1098/rsif.2012.0953
Received: 20 November 2012
Accepted: 11 January 2013
Subject Areas:biomechanics
Keywords:hierarchical structure, anisotropy, length-scale
effect, nanoindentation, secondary osteons
Author for correspondence:Davide Carnelli
e-mail: [email protected]
†Present Address: Complex Materials,
Department of Materials, ETH Zurich,
Wolfgang-Pauli-Strasse 10, 8093 Zurich,
Switzerland.
& 2013 The Author(s) Published by the Royal Society. All rights reserved.
Orientation and size-dependentmechanical modulation within individualsecondary osteons in cortical bone tissue
Davide Carnelli1,3,†, Pasquale Vena2,4, Ming Dao3, Christine Ortiz3
and Roberto Contro1
1Department of Structural Engineering, and 2Department of Chemistry, Material and Chemical Engineering,LaBS-Laboratory of Biological Structure Mechanics, Politecnico di Milano, P.zza L. da Vinci 32, 20133 Milan, Italy3Department of Materials Science and Engineering, Massachusetts Institute of Technology, 77 MassachusettsAvenue, Cambridge, MA 02139, USA4IRCCS, Istituto Ortopedico Galeazzi, P.zza R. Galeazzi 4, 20161 Milano, Italy
Anisotropy is one of the most peculiar aspects of cortical bone mechanics;
however, its anisotropic mechanical behaviour should be treated only
with strict relationship to the length scale of investigation. In this study,
we focus on quantifying the orientation and size dependence of the spatial
mechanical modulation in individual secondary osteons of bovine cortical
bone using nanoindentation. Tests were performed on the same osteonal
structure in the axial (along the long bone axis) and transverse (normal
to the long bone axis) directions along arrays going radially out from
the Haversian canal at four different maximum depths on three secondary
osteons. Results clearly show a periodic pattern of stiffness with
spatial distance across the osteon. The effect of length scale on lamellar
bone anisotropy and the critical length at which homogenization of
the mechanical properties occurs were determined. Further, a laminate-
composite-based analytical model was applied to the stiffness trends
obtained at the highest spatial resolution to evaluate the elastic constants
for a sub-layer of mineralized collagen fibrils within an osteonal lamella
on the basis of the spatial arrangement of the fibrils. The hierarchical
arrangement of lamellar bone is found to be a major determinant for
modulation of mechanical properties and anisotropic mechanical
behaviour of the tissue.
1. IntroductionCortical bone is a heterogeneous, hierarchical composite material with
important structural features spanning multiple length scales, each of which
contributes to macroscopic biomechanical function [1–5]. At the microstruc-
tural level, both in humans and in many other large vertebrates, a
particularly critical determinant of the mechanical properties of the whole
tissue are concentric lamellar cylindrical structures called secondary osteons
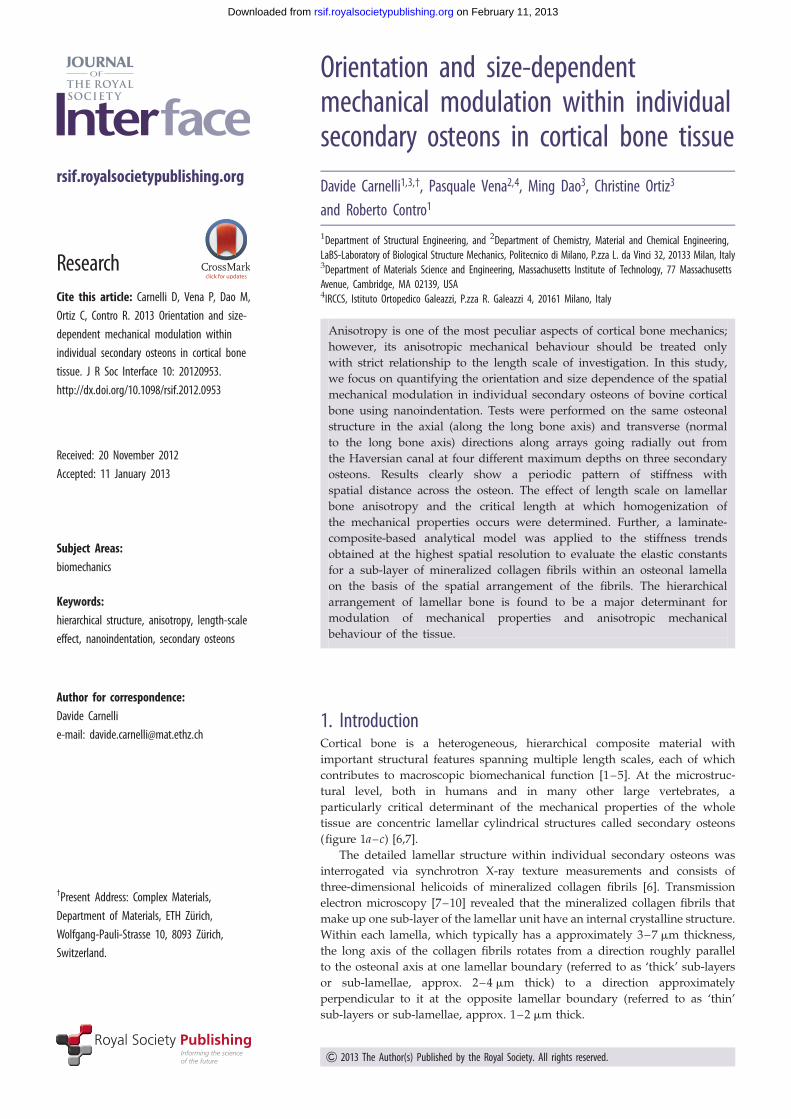
(figure 1a–c) [6,7].
The detailed lamellar structure within individual secondary osteons was
interrogated via synchrotron X-ray texture measurements and consists of
three-dimensional helicoids of mineralized collagen fibrils [6]. Transmission
electron microscopy [7–10] revealed that the mineralized collagen fibrils that
make up one sub-layer of the lamellar unit have an internal crystalline structure.
Within each lamella, which typically has a approximately 3–7 mm thickness,
the long axis of the collagen fibrils rotates from a direction roughly parallel
to the osteonal axis at one lamellar boundary (referred to as ‘thick’ sub-layers
or sub-lamellae, approx. 2–4 mm thick) to a direction approximately
perpendicular to it at the opposite lamellar boundary (referred to as ‘thin’
sub-layers or sub-lamellae, approx. 1–2 mm thick.
50 mm(a) (b)
(c)
(d) (e)
50 mm
10 mm
Haversian canal
Haversian canal
lacunae
lamellae
osteon
osteon
T1
T1T2 T2A
A
T1
T1
T1
T2
T2
T2
2 mm 2 mm
A
AA
w
Figure 1. (a) Optical microscopy image of osteonal bovine bone tissue parallel to the osteonal axis (axial direction). (b) Optical microscopy image of osteonal bovinebone tissue normal to the osteonal axis (transverse direction). (c) Scanning electron microscopy image of a region surrounding an individual osteon parallel to theosteonal axis. (d ) Home-built sample stage enabling the testing of two orthogonal orientations within the same osteon. (e) Illustration of the indentation testdirections (A and T1) with respect to the osteonal microstructure (in red). (Online version in colour.)
rsif.royalsocietypublishing.orgJR
SocInterface10:20120953
2
on February 11, 2013rsif.royalsocietypublishing.orgDownloaded from
The mechanical characterization of individual osteons
was performed in tension, compression and torsion [11–
13], as well as with ultrasound [14]. Instrumented indentation
was also applied to evaluate the elastic properties of lamellar
bone within the osteonal structure along multiple orien-
tations [15–17]. These studies identified anisotropic
elasticity of individual osteons, where the axial direction
was stiffer than the transverse direction with an anisotropic
ratio (axial/transverse) of approximately 1.5, similar to the
value found for macroscopic cortical bone [2,3] and lower
than the expected value for individual mineralized collagen
fibrils (approx. 2.0) [18].
Table 1. Nomenclature.
A axial indentation direction w.r.t. the global coordinate system
A, T1, T2 global coordinate system (osteons)
a1, a2 semi-axes lengths of the elliptical projected area of contact
a1, a2, a3 indentation coordinate system for the Swadener – Pharr model
B Barnett – Lothe tensor
C stiffness tensor
Cijhk stiffness tensor coefficients
E uniaxial Young’s modulus
EL uniaxial Young’s modulus along the mineralized collagen fibrils long axis direction
EP uniaxial Young’s modulus perpendicular to the mineralized collagen fibril long axis for a transversely isotropic material model
EP 1, EP 2 uniaxial Young’s moduli perpendicular to the mineralized collagen fibril long axis for an orthotropic material model
GLP shear modulus for a mineralized collagen fibril in the L – P plane for a transversely isotropic material model
GLP1 ; GLP2 ; GP 1 P 2 shear moduli for a mineralized collagen fibril in the L – P1, L – P2 and P1 – P2 planes for an orthotropic material model
L longitudinal indentation direction w.r.t. the local coordinate system
L, P1, P2 local coordinate system (mineralized collagen fibrils)
M indentation modulus
MA indentation modulus in the axial direction
MT indentation modulus in the transverse direction
M0 oscillatory function mean value
Mexp experimental indentation modulus
Mcomp indentation modulus computed with the Swadener – Pharr method
P perpendicular indentation direction w.r.t. the local coordinate system
T transverse indentation direction w.r.t. the global coordinate system
r radial position across the osteon
ri locations corresponding to the peaks and valleys of the stiffness modulation in the axial and transverse directions
r, s, t orthogonal reference system for the Swadener – Pharr model
w lamellar width
g angle between the direction t and the a1 axis
DM oscillatory function amplitude
u angle between the long axis of the mineralized collagen fibrils and the loading direction
nLP, nPP Poisson’s ratios for a mineralized collagen fibril in the L – P and perpendicular (P – P) planes for a transversely isotropic
material model
nP 1L; nP 2L; nP 2P1;
nLP1; nLP2 ; nP1P2
Poisson’s ratios for a mineralized collagen fibril in the L – P1, L – P2 and P1 – P2 planes for an orthotropic material model
rsif.royalsocietypublishing.orgJR
SocInterface10:20120953
3
on February 11, 2013rsif.royalsocietypublishing.orgDownloaded from
Considering the hierarchical structural features of bone
[6], different characteristic sizes which may also play func-
tional roles in bone exist at different length scales [19–21].
In a recent study, Yao et al. [21] adopted AFM-based
nanoindentation to identify a characteristic length scale of
approximately 200 nm within one sub-layer of the lamellar
unit; at a higher level, spatially controlled nanoindentation
experiments within individual osteons allowed Gupta et al.[19] to identify a larger characteristic length scale owing
to the periodicity of the osteonal lamellae, with thicker
sub-lamellae of higher stiffness alternating with thinner
sub-lamellae of lower stiffness. The spatial variation of
indentation modulus within a lamella was attributed to
the rotation of the inherently anisotropic collagen fibrils
[19,22] and variations in the mineral content [19].
Nevertheless, an experimentally validated analytical
model that directly links the nano-scale rotational arrange-
ments of collagen fibrils and the corresponding anisotropic
elasticity is still missing.
In this study, we focus on quantifying the orientation and
size dependence of the spatial mechanical modulation in
individual secondary osteons of bovine cortical bone using
nanoindentation. Experiments were carried out in two
orthogonal orientations within the same individual osteon.
Tests were performed at four different maximum penetration
depths to study the effect of indentation area on mechanical
modulation. An analytical model that assumes the inherent
anisotropy of the mineralized collagen fibrils as well as
their orientation was introduced to estimate the elastic
constants of a sub-layer of mineralized collagen fibrils.
Table 2. Summary of the indentation tests carried out in this work. Theprocedure explained below has been performed in both the axial (A) andtransverse (T1) directions on three secondary osteons.
number of indentationsrows 3 columns
maximumdepth (nm)
spacing(mm)
41 � 3 50 0.5
31 � 3 100 1
21 � 3 200 2
21 � 3 300 3
rsif.royalsocietypublishing.orgJR
SocInterface10:20120953
4
on February 11, 2013rsif.royalsocietypublishing.orgDownloaded from
2. Material and methodsIn the following, the Haversian canal axis is referred to as the ‘axial’
direction (A), whereas the plane perpendicular to this axis is referred
to as the ‘transverse’ direction (T1, T2). Similarly, the long axis of
the mineralized collagen fibrils is herein referred to as the ‘longi-
tudinal’ direction (L), while the plane perpendicular to this axis is
referred to as the ‘perpendicular’ direction (P1, P2). Thus, A, T1, T2
represents a global coordinate system based on the whole secondary
osteon; whereas, L, P1, P2 represents a local coordinate system
related to the mineralized collagen fibrils (table 1).
2.1. Sample preparation and characterizationSamples were kept under conditions close to the physiological
one until the tests; to this purpose no alcohol dehydration, freez-
ing, embedding, thermal drying, long-term storage in ambient
conditions or chemical fixation were used. Adult lamellar bone
obtained from a 30 month old cow was harvested from between
the tibial metaphysis and diaphysis. Approximately 5 mm cubic
specimens were obtained using a diamond-impregnated annular
wafering saw (Isomet 5000, Buehler, Inc., Lake Bluff, IL, USA)
running at 400–600 r.p.m. under constant water irrigation. In
order to expose the osteons’ Haversian canal, the first two cuts
were performed along the transverse directions and the second
ones along the axial directions. The samples were then polished
using a metallographic polishing wheel and adhesive papers
with successively smaller Al2O3 particle grit sizes. Samples
were rinsed copiously with de-ionized (DI) water followed by
ultrasonication in DI water between polishing intervals.
The cutting and polishing procedures were performed the day
after harvesting.
From optical (Nikon Eclipse L150, figure 1a,b) and scanning
electron microscopy (JEOL SEM 6320FV, figure 1c), the average
osteonal diameter was found to be approximately 200 mm and
the average thickness of the first four or five individual lamellae
around the Haversian canal is 5.01 + 0.10 mm. Contact mode
atomic force microscope (AFM, MFP-3D, Asylum Research, Inc.,
Santa Barbara, CA, USA) imaging was performed to assess the
r.m.s. surface roughness achieved with the polishing procedure,
which was quantified as 6.0 + 0.7 nm on several 2 � 2 mm areas
in different locations on the three osteonal structures.
Finally, samples were fixed into the groove of a home-built
sample holder that allows for mechanical testing of the same
osteonal structure in different directions with respect to the
osteonal axis (figure 1d,e).
2.2. Nanoindentation experimentsAll instrumented indentation experiments were conducted in the
osteonal region of cortical bone shortly after harvesting and over
a short enough time period so that no significant modification of
the sample state was ensured; to this purpose the statistical invar-
iance of experimental data over time (the whole time span of the
testing period) was checked (data not shown). The effect of
hydration state was neglected at this stage, as the bone samples
were tested in ambient conditions (208C and 50% relative humid-
ity). A Triboindenter (Hysitron, Inc., Minneapolis, MN, USA)
was used with a Berkovich diamond tip. The tip area function
and machine compliance were calibrated on a fused silica refer-
ence sample by performing 100 indentations between 100 to
10 000 mN maximum forces [23].
Experiments were performed in displacement control along
arrays going radially out from the Haversian canal edge to the
external region of the osteon at four different maximum
depths: 50, 100, 200 and 300 nm. The experimental procedure is
detailed in table 2. The displacement rates of the indentation
experiments were 20 and 100 nm s21 in the loading and unload-
ing branches of the indentation curve, respectively. An automatic
preliminary thermal drift correction was applied before each
indentation. Preliminary investigations were performed to
ensure that time-dependent effects were minimal (see [24] for
further details). This experimental procedure was used on three
secondary osteons in both the axial and transverse directions
(A and T1, respectively, in figure 1a–e). A total of approximately
2000 indentations were carried out.
The Oliver–Pharr method [25] was adopted to obtain the
indentation modulus M from the unloading portion of each
test. An unloading segment range between 95 and 40 per cent
of maximum load was chosen for data fitting.
2.3. Empirical formulation for stiffness modulationThe oscillatory function
MðrÞ ¼ DM2
sin2prwþ c
� �þM0 ð2:1Þ
was adopted to fit the stiffness modulation along the inden-
tation paths. In equation (2.1), r is the radial position across
the osteon, r ¼ 0 being the Haversian canal inner edge; w is the
mean value of the experimentally observed lamellar width
(5.01 mm); DM is the oscillatory function amplitude; M0 is its
mean value.
2.4. Anisotropic analytical modelsThe spatial modulation of stiffness at the lowest maximum
indentation depth probed (50 nm) was fitted to an analytical
model that assumes the inherent anisotropy of the mineralized
collagen fibrils and allows for the evaluation of the effective stiff-
ness of the sub-lamellae as a function of collagen fibril
orientation. The orientation-dependent uniaxial Young’s mod-
ulus E of an individual sub-lamella was obtained by applying
the rotation formula [19,26,27]
EðuÞ ¼ cos4ðuÞEL
þ sin4ðuÞEP
þ 1
GLP� 2
nLP
EL
� �cos2ðuÞ sin2ðuÞ
� ��1
;
ð2:2Þ
where u is the angle between the long axis of the mineralized
collagen fibrils (longitudinal direction, L) and the loading direc-
tion, EL is the uniaxial Young’s modulus along the mineralized
collagen fibrils long axis direction (longitudinal direction, L), EP
is the uniaxial Young’s modulus perpendicular to the mineralized
collagen fibril axis (perpendicular directions, P1 and P2), GLP is the
shear modulus and nLP is the Poisson’s ratio. The model assumes
that individual collagen fibrils and uniformly oriented planar
layers of fibrils are transversely isotropic (P1 ¼ P2 ¼ P) [28–30].
The uniaxial Young’s moduli were directly estimated from
the experimental nanoindentation loading–unloading curves
by using the analytical model for anisotropic elastic contact intro-
duced by Delafargue & Ulm [31]. This model relates the
2000(a)
(b)
1500
load
(mN
)lo
ad (
mN)
1000
500
0
2000
1500
1000
500
0 100 200 300penetration depth (nm)
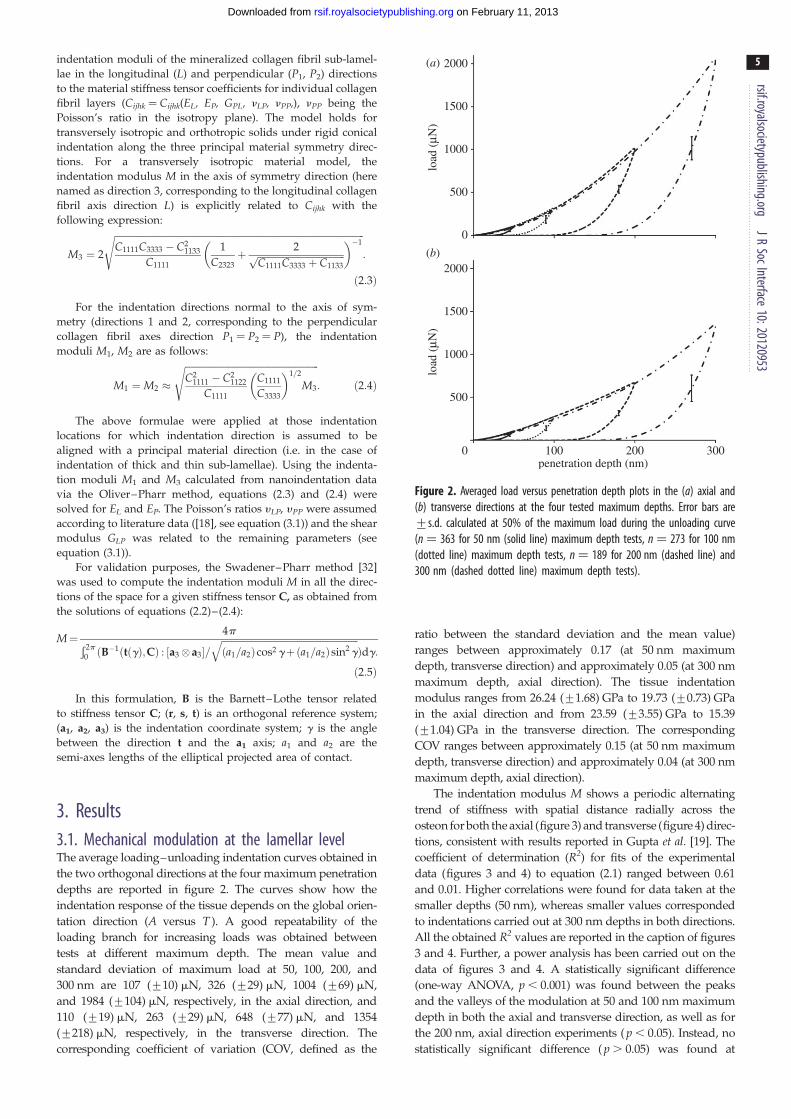
Figure 2. Averaged load versus penetration depth plots in the (a) axial and(b) transverse directions at the four tested maximum depths. Error bars are+s.d. calculated at 50% of the maximum load during the unloading curve(n ¼ 363 for 50 nm (solid line) maximum depth tests, n ¼ 273 for 100 nm(dotted line) maximum depth tests, n ¼ 189 for 200 nm (dashed line) and300 nm (dashed dotted line) maximum depth tests).
rsif.royalsocietypublishing.orgJR
SocInterface10:20120953
5
on February 11, 2013rsif.royalsocietypublishing.orgDownloaded from
indentation moduli of the mineralized collagen fibril sub-lamel-
lae in the longitudinal (L) and perpendicular (P1, P2) directions
to the material stiffness tensor coefficients for individual collagen
fibril layers (Cijhk ¼ Cijhk(EL, EP, GPL, nLP, nPP,), nPP being the
Poisson’s ratio in the isotropy plane). The model holds for
transversely isotropic and orthotropic solids under rigid conical
indentation along the three principal material symmetry direc-
tions. For a transversely isotropic material model, the
indentation modulus M in the axis of symmetry direction (here
named as direction 3, corresponding to the longitudinal collagen
fibril axis direction L) is explicitly related to Cijhk with the
following expression:
M3 ¼ 2
ffiffiffiffiffiffiffiffiffiffiffiffiffiffiffiffiffiffiffiffiffiffiffiffiffiffiffiffiffiffiffiffiffiffiffiffiffiffiffiffiffiffiffiffiffiffiffiffiffiffiffiffiffiffiffiffiffiffiffiffiffiffiffiffiffiffiffiffiffiffiffiffiffiffiffiffiffiffiffiffiffiffiffiffiffiffiffiffiffiffiffiffiffiffiffiffiffiffiffiffiffiffiffiffiffiffiC1111C3333 � C2
1133
C1111
1
C2323þ 2ffiffiffiffiffiffiffiffiffiffiffiffiffiffiffiffiffiffiffiffiffiffiffiffiffiffiffiffiffiffiffiffiffiffiffiffiffi
C1111C3333 þ C1133
p� ��1
s:
ð2:3Þ
For the indentation directions normal to the axis of sym-
metry (directions 1 and 2, corresponding to the perpendicular
collagen fibril axes direction P1 ¼ P2 ¼ P), the indentation
moduli M1, M2 are as follows:
M1 ¼M2 �
ffiffiffiffiffiffiffiffiffiffiffiffiffiffiffiffiffiffiffiffiffiffiffiffiffiffiffiffiffiffiffiffiffiffiffiffiffiffiffiffiffiffiffiffiffiffiffiffiffiffiffiffiffiffiffiffiffiC2
1111 � C21122
C1111
C1111
C3333
� �1=2
M3
s: ð2:4Þ
The above formulae were applied at those indentation
locations for which indentation direction is assumed to be
aligned with a principal material direction (i.e. in the case of
indentation of thick and thin sub-lamellae). Using the indenta-
tion moduli M1 and M3 calculated from nanoindentation data
via the Oliver–Pharr method, equations (2.3) and (2.4) were
solved for EL and EP. The Poisson’s ratios yLP, yPP were assumed
according to literature data ([18], see equation (3.1)) and the shear
modulus GLP was related to the remaining parameters (see
equation (3.1)).
For validation purposes, the Swadener–Pharr method [32]
was used to compute the indentation moduli M in all the direc-
tions of the space for a given stiffness tensor C, as obtained from
the solutions of equations (2.2)–(2.4):
M¼ 4pÐ 2p0 ðB
�1ðtðgÞ;CÞ : ½a3�a3�=ffiffiffiffiffiffiffiffiffiffiffiffiffiffiffiffiffiffiffiffiffiffiffiffiffiffiffiffiffiffiffiffiffiffiffiffiffiffiffiffiffiffiffiffiffiffiffiffiffiffiffiffiffiffiffiffiffiffiða1=a2Þcos2 gþða1=a2Þsin2g
qÞdg:ð2:5Þ
In this formulation, B is the Barnett–Lothe tensor related
to stiffness tensor C; (r, s, t) is an orthogonal reference system;
(a1, a2, a3) is the indentation coordinate system; g is the angle
between the direction t and the a1 axis; a1 and a2 are the
semi-axes lengths of the elliptical projected area of contact.
3. Results3.1. Mechanical modulation at the lamellar levelThe average loading–unloading indentation curves obtained in
the two orthogonal directions at the four maximum penetration
depths are reported in figure 2. The curves show how the
indentation response of the tissue depends on the global orien-
tation direction (A versus T ). A good repeatability of the
loading branch for increasing loads was obtained between
tests at different maximum depth. The mean value and
standard deviation of maximum load at 50, 100, 200, and
300 nm are 107 (+10) mN, 326 (+29) mN, 1004 (+69) mN,
and 1984 (+104) mN, respectively, in the axial direction, and
110 (+19) mN, 263 (+29) mN, 648 (+77) mN, and 1354
(+218) mN, respectively, in the transverse direction. The
corresponding coefficient of variation (COV, defined as the
ratio between the standard deviation and the mean value)
ranges between approximately 0.17 (at 50 nm maximum
depth, transverse direction) and approximately 0.05 (at 300 nm
maximum depth, axial direction). The tissue indentation
modulus ranges from 26.24 (+1.68) GPa to 19.73 (+0.73) GPa
in the axial direction and from 23.59 (+3.55) GPa to 15.39
(+1.04) GPa in the transverse direction. The corresponding
COV ranges between approximately 0.15 (at 50 nm maximum
depth, transverse direction) and approximately 0.04 (at 300 nm
maximum depth, axial direction).
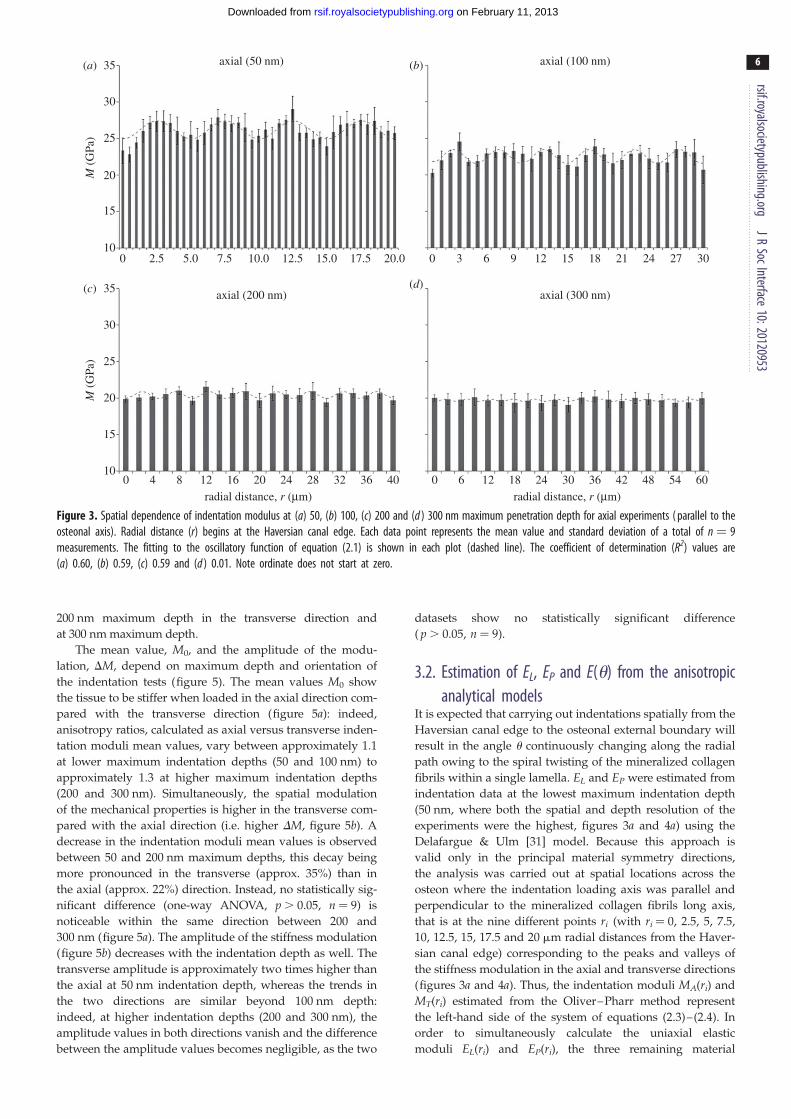
The indentation modulus M shows a periodic alternating
trend of stiffness with spatial distance radially across the
osteon for both the axial (figure 3) and transverse (figure 4) direc-
tions, consistent with results reported in Gupta et al. [19]. The
coefficient of determination (R2) for fits of the experimental
data (figures 3 and 4) to equation (2.1) ranged between 0.61
and 0.01. Higher correlations were found for data taken at the
smaller depths (50 nm), whereas smaller values corresponded
to indentations carried out at 300 nm depths in both directions.
All the obtained R2 values are reported in the caption of figures
3 and 4. Further, a power analysis has been carried out on the
data of figures 3 and 4. A statistically significant difference
(one-way ANOVA, p , 0.001) was found between the peaks
and the valleys of the modulation at 50 and 100 nm maximum
depth in both the axial and transverse direction, as well as for
the 200 nm, axial direction experiments ( p , 0.05). Instead, no
statistically significant difference ( p . 0.05) was found at
(a)
(c)
(b)
(d)
30
35
25
M (
GPa
)M
(G
Pa)
20
15
10
30
35
25
20
15
10
0
0 4 8 12 16 20radial distance, r (mm) radial distance, r (mm)
24 28 32 36 40 0 6 12 18 24 30 36 42 48 54 60
0 3 6 9 12 15 18 21 24 27 302.5 5.0 7.5 10.0 12.5 15.0 17.5 20.0
axial (50 nm)
axial (200 nm) axial (300 nm)
axial (100 nm)
Figure 3. Spatial dependence of indentation modulus at (a) 50, (b) 100, (c) 200 and (d ) 300 nm maximum penetration depth for axial experiments ( parallel to theosteonal axis). Radial distance (r) begins at the Haversian canal edge. Each data point represents the mean value and standard deviation of a total of n ¼ 9measurements. The fitting to the oscillatory function of equation (2.1) is shown in each plot (dashed line). The coefficient of determination (R2) values are(a) 0.60, (b) 0.59, (c) 0.59 and (d ) 0.01. Note ordinate does not start at zero.
rsif.royalsocietypublishing.orgJR
SocInterface10:20120953
6
on February 11, 2013rsif.royalsocietypublishing.orgDownloaded from
200 nm maximum depth in the transverse direction and
at 300 nm maximum depth.
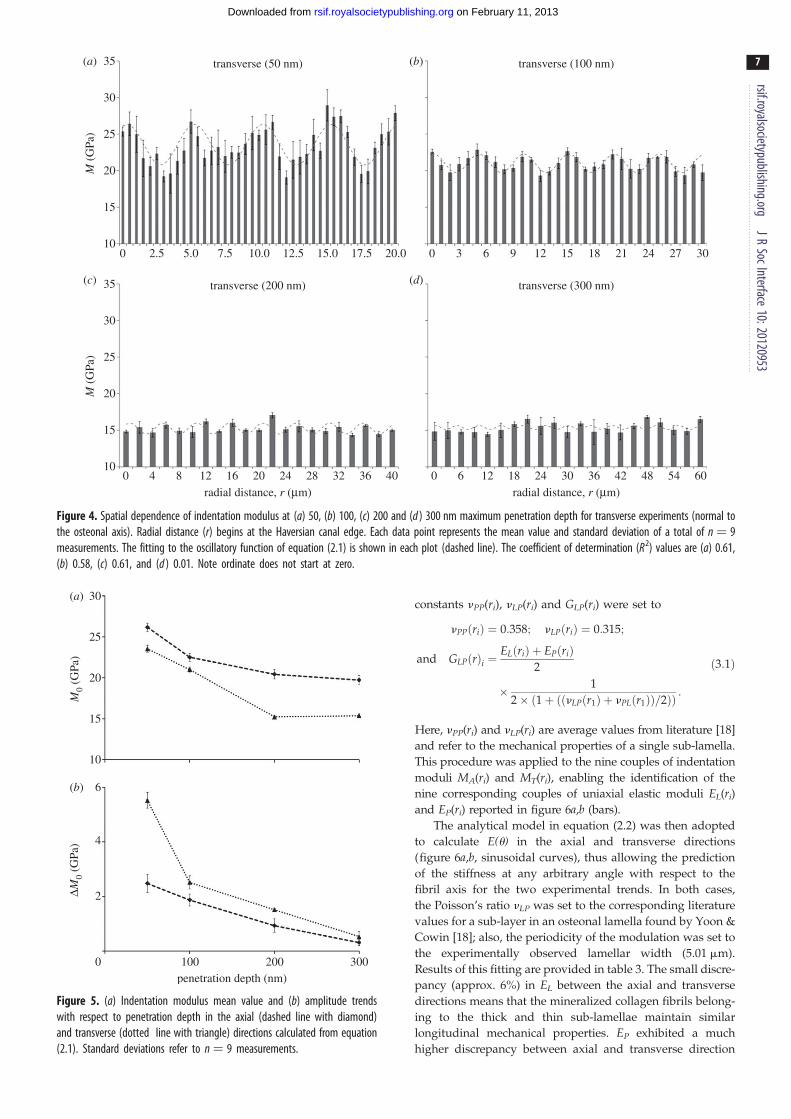
The mean value, M0, and the amplitude of the modu-
lation, DM, depend on maximum depth and orientation of
the indentation tests (figure 5). The mean values M0 show
the tissue to be stiffer when loaded in the axial direction com-
pared with the transverse direction (figure 5a): indeed,
anisotropy ratios, calculated as axial versus transverse inden-
tation moduli mean values, vary between approximately 1.1
at lower maximum indentation depths (50 and 100 nm) to
approximately 1.3 at higher maximum indentation depths
(200 and 300 nm). Simultaneously, the spatial modulation
of the mechanical properties is higher in the transverse com-
pared with the axial direction (i.e. higher DM, figure 5b). A
decrease in the indentation moduli mean values is observed
between 50 and 200 nm maximum depths, this decay being
more pronounced in the transverse (approx. 35%) than in
the axial (approx. 22%) direction. Instead, no statistically sig-
nificant difference (one-way ANOVA, p . 0.05, n ¼ 9) is
noticeable within the same direction between 200 and
300 nm (figure 5a). The amplitude of the stiffness modulation
(figure 5b) decreases with the indentation depth as well. The
transverse amplitude is approximately two times higher than
the axial at 50 nm indentation depth, whereas the trends in
the two directions are similar beyond 100 nm depth:
indeed, at higher indentation depths (200 and 300 nm), the
amplitude values in both directions vanish and the difference
between the amplitude values becomes negligible, as the two
datasets show no statistically significant difference
( p . 0.05, n ¼ 9).
3.2. Estimation of EL, EP and E(u) from the anisotropicanalytical models
It is expected that carrying out indentations spatially from the
Haversian canal edge to the osteonal external boundary will
result in the angle u continuously changing along the radial
path owing to the spiral twisting of the mineralized collagen
fibrils within a single lamella. EL and EP were estimated from
indentation data at the lowest maximum indentation depth
(50 nm, where both the spatial and depth resolution of the
experiments were the highest, figures 3a and 4a) using the
Delafargue & Ulm [31] model. Because this approach is
valid only in the principal material symmetry directions,
the analysis was carried out at spatial locations across the
osteon where the indentation loading axis was parallel and
perpendicular to the mineralized collagen fibrils long axis,
that is at the nine different points ri (with ri ¼ 0, 2.5, 5, 7.5,
10, 12.5, 15, 17.5 and 20 mm radial distances from the Haver-
sian canal edge) corresponding to the peaks and valleys of
the stiffness modulation in the axial and transverse directions
(figures 3a and 4a). Thus, the indentation moduli MA(ri) and
MT(ri) estimated from the Oliver–Pharr method represent
the left-hand side of the system of equations (2.3)–(2.4). In
order to simultaneously calculate the uniaxial elastic
moduli EL(ri) and EP(ri), the three remaining material
transverse (50 nm)(a)
(c)
(b)
(d)
transverse (100 nm)
transverse (200 nm) transverse (300 nm)
30
35
25
M (
GPa
)M
(G
Pa)
20
15
10
30
35
25
20
15
10
0
0 4 8 12 16 20radial distance, r (mm) radial distance, r (mm)
24 28 32 36 40 0 6 12 18 24 30 36 42 48 54 60
0 3 6 9 12 15 18 21 24 27 302.5 5.0 7.5 10.0 12.5 15.0 17.5 20.0
Figure 4. Spatial dependence of indentation modulus at (a) 50, (b) 100, (c) 200 and (d ) 300 nm maximum penetration depth for transverse experiments (normal tothe osteonal axis). Radial distance (r) begins at the Haversian canal edge. Each data point represents the mean value and standard deviation of a total of n ¼ 9measurements. The fitting to the oscillatory function of equation (2.1) is shown in each plot (dashed line). The coefficient of determination (R2) values are (a) 0.61,(b) 0.58, (c) 0.61, and (d ) 0.01. Note ordinate does not start at zero.
30(a)
(b)
25
20
M0
(GPa
)DM
0 (G
Pa)
15
10
6
4
2
0 100penetration depth (nm)
200 300
Figure 5. (a) Indentation modulus mean value and (b) amplitude trendswith respect to penetration depth in the axial (dashed line with diamond)and transverse (dotted line with triangle) directions calculated from equation(2.1). Standard deviations refer to n ¼ 9 measurements.
rsif.royalsocietypublishing.orgJR
SocInterface10:20120953
7
on February 11, 2013rsif.royalsocietypublishing.orgDownloaded from
constants nPP(ri), nLP(ri) and GLP(ri) were set to
nPPðriÞ ¼ 0:358; nLPðriÞ ¼ 0:315;
and GLPðrÞi ¼ELðriÞ þ EPðriÞ
2
� 1
2� ð1þ ððnLPðr1Þ þ nPLðr1ÞÞ=2ÞÞ :
ð3:1Þ
Here, nPP(ri) and nLP(ri) are average values from literature [18]
and refer to the mechanical properties of a single sub-lamella.
This procedure was applied to the nine couples of indentation
moduli MA(ri) and MT(ri), enabling the identification of the
nine corresponding couples of uniaxial elastic moduli EL(ri)
and EP(ri) reported in figure 6a,b (bars).
The analytical model in equation (2.2) was then adopted
to calculate E(u) in the axial and transverse directions
(figure 6a,b, sinusoidal curves), thus allowing the prediction
of the stiffness at any arbitrary angle with respect to the
fibril axis for the two experimental trends. In both cases,
the Poisson’s ratio nLP was set to the corresponding literature
values for a sub-layer in an osteonal lamella found by Yoon &
Cowin [18]; also, the periodicity of the modulation was set to
the experimentally observed lamellar width (5.01 mm).
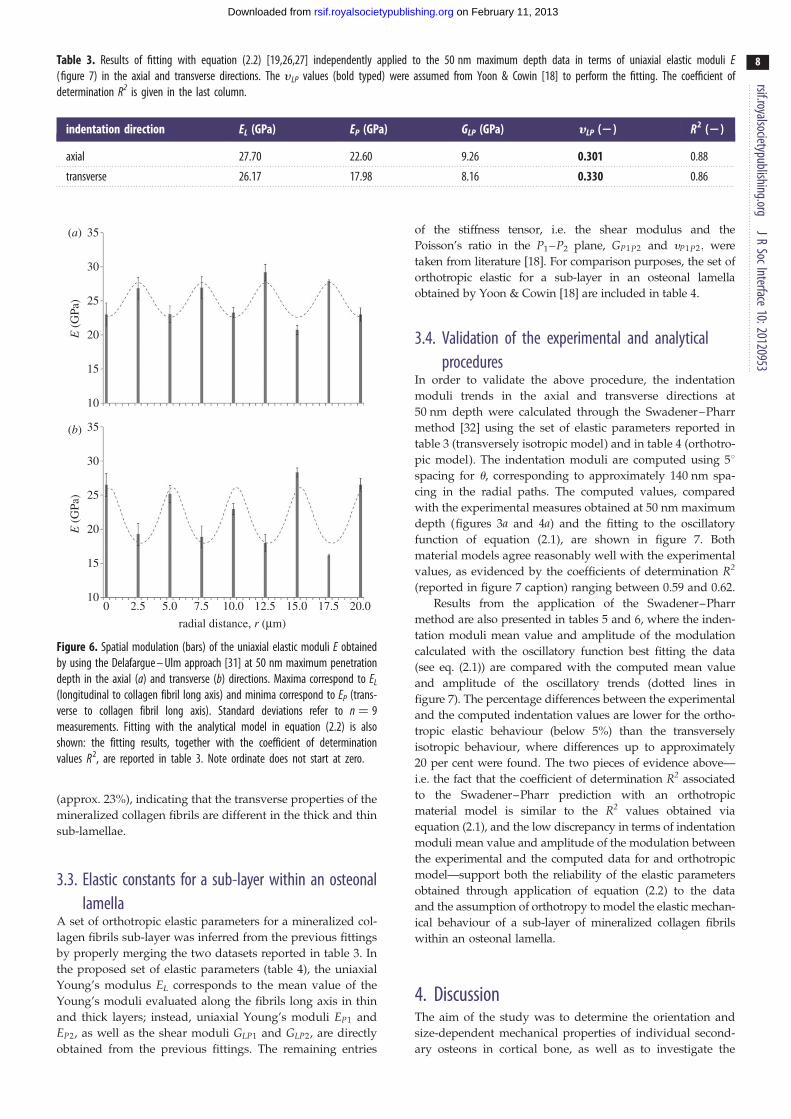
Results of this fitting are provided in table 3. The small discre-
pancy (approx. 6%) in EL between the axial and transverse
directions means that the mineralized collagen fibrils belong-
ing to the thick and thin sub-lamellae maintain similar
longitudinal mechanical properties. EP exhibited a much
higher discrepancy between axial and transverse direction
30
35
radial distance, r (mm)
0 2.5 5.0 7.5 10.0 12.5 15.0 17.5 20.0
(a)
25
20E (
GPa
)
15
10
30
35(b)
25
20E (
GPa
)
15
10
Figure 6. Spatial modulation (bars) of the uniaxial elastic moduli E obtainedby using the Delafargue – Ulm approach [31] at 50 nm maximum penetrationdepth in the axial (a) and transverse (b) directions. Maxima correspond to EL
(longitudinal to collagen fibril long axis) and minima correspond to EP (trans-verse to collagen fibril long axis). Standard deviations refer to n ¼ 9measurements. Fitting with the analytical model in equation (2.2) is alsoshown: the fitting results, together with the coefficient of determinationvalues R2, are reported in table 3. Note ordinate does not start at zero.
Table 3. Results of fitting with equation (2.2) [19,26,27] independently applied to the 50 nm maximum depth data in terms of uniaxial elastic moduli E(figure 7) in the axial and transverse directions. The y LP values (bold typed) were assumed from Yoon & Cowin [18] to perform the fitting. The coefficient ofdetermination R2 is given in the last column.
indentation direction EL (GPa) EP (GPa) GLP (GPa) yLP (2) R2 (2)
axial 27.70 22.60 9.26 0.301 0.88
transverse 26.17 17.98 8.16 0.330 0.86
rsif.royalsocietypublishing.orgJR
SocInterface10:20120953
8
on February 11, 2013rsif.royalsocietypublishing.orgDownloaded from
(approx. 23%), indicating that the transverse properties of the
mineralized collagen fibrils are different in the thick and thin
sub-lamellae.
3.3. Elastic constants for a sub-layer within an osteonallamella
A set of orthotropic elastic parameters for a mineralized col-
lagen fibrils sub-layer was inferred from the previous fittings
by properly merging the two datasets reported in table 3. In
the proposed set of elastic parameters (table 4), the uniaxial
Young’s modulus EL corresponds to the mean value of the
Young’s moduli evaluated along the fibrils long axis in thin
and thick layers; instead, uniaxial Young’s moduli EP1 and
EP2, as well as the shear moduli GLP1 and GLP2, are directly
obtained from the previous fittings. The remaining entries
of the stiffness tensor, i.e. the shear modulus and the
Poisson’s ratio in the P1–P2 plane, GP1P2 and yP1P2; were
taken from literature [18]. For comparison purposes, the set of
orthotropic elastic for a sub-layer in an osteonal lamella
obtained by Yoon & Cowin [18] are included in table 4.
3.4. Validation of the experimental and analyticalprocedures
In order to validate the above procedure, the indentation
moduli trends in the axial and transverse directions at
50 nm depth were calculated through the Swadener–Pharr
method [32] using the set of elastic parameters reported in
table 3 (transversely isotropic model) and in table 4 (orthotro-
pic model). The indentation moduli are computed using 58spacing for u, corresponding to approximately 140 nm spa-
cing in the radial paths. The computed values, compared
with the experimental measures obtained at 50 nm maximum
depth (figures 3a and 4a) and the fitting to the oscillatory
function of equation (2.1), are shown in figure 7. Both
material models agree reasonably well with the experimental
values, as evidenced by the coefficients of determination R2
(reported in figure 7 caption) ranging between 0.59 and 0.62.
Results from the application of the Swadener–Pharr
method are also presented in tables 5 and 6, where the inden-
tation moduli mean value and amplitude of the modulation
calculated with the oscillatory function best fitting the data
(see eq. (2.1)) are compared with the computed mean value
and amplitude of the oscillatory trends (dotted lines in
figure 7). The percentage differences between the experimental
and the computed indentation values are lower for the ortho-
tropic elastic behaviour (below 5%) than the transversely
isotropic behaviour, where differences up to approximately
20 per cent were found. The two pieces of evidence above—
i.e. the fact that the coefficient of determination R2 associated
to the Swadener–Pharr prediction with an orthotropic
material model is similar to the R2 values obtained via
equation (2.1), and the low discrepancy in terms of indentation
moduli mean value and amplitude of the modulation between
the experimental and the computed data for and orthotropic
model—support both the reliability of the elastic parameters
obtained through application of equation (2.2) to the data
and the assumption of orthotropy to model the elastic mechan-
ical behaviour of a sub-layer of mineralized collagen fibrils
within an osteonal lamella.
4. DiscussionThe aim of the study was to determine the orientation and
size-dependent mechanical properties of individual second-
ary osteons in cortical bone, as well as to investigate the
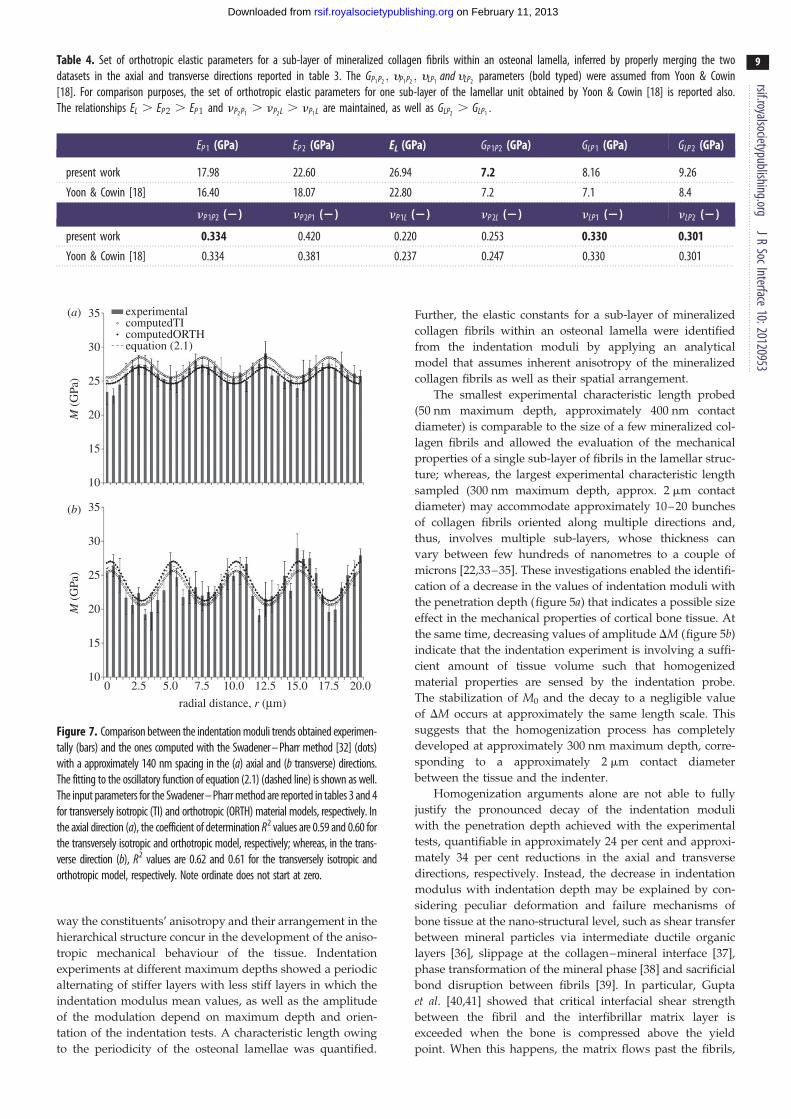
Table 4. Set of orthotropic elastic parameters for a sub-layer of mineralized collagen fibrils within an osteonal lamella, inferred by properly merging the twodatasets in the axial and transverse directions reported in table 3. The GP1 P2 ; yP1 P2 ; yLP1 and yLP2 parameters (bold typed) were assumed from Yoon & Cowin[18]. For comparison purposes, the set of orthotropic elastic parameters for one sub-layer of the lamellar unit obtained by Yoon & Cowin [18] is reported also.The relationships EL . EP 2 . EP 1 and nP2 P1 . nP2 L . nP1 L are maintained, as well as GLP2 . GLP1 :
EP 1 (GPa) EP 2 (GPa) EL (GPa) GP 1P2 (GPa) GLP 1 (GPa) GLP 2 (GPa)
present work 17.98 22.60 26.94 7.2 8.16 9.26
Yoon & Cowin [18] 16.40 18.07 22.80 7.2 7.1 8.4
nP 1P2 (2) nP 2P1 (2) nP 1L (2) nP 2L (2) nLP1 (2) nLP2 (2)
present work 0.334 0.420 0.220 0.253 0.330 0.301
Yoon & Cowin [18] 0.334 0.381 0.237 0.247 0.330 0.301
30
35
radial distance, r (mm)
0 2.5 5.0 7.5 10.0 12.5 15.0 17.5 20.0
(a)
25
20M (
GPa
)
15
10
30
35(b)
25
20M (
GPa
)
15
10
experimentalcomputedTIcomputedORTHequation (2.1)
Figure 7. Comparison between the indentation moduli trends obtained experimen-tally (bars) and the ones computed with the Swadener – Pharr method [32] (dots)with a approximately 140 nm spacing in the (a) axial and (b transverse) directions.The fitting to the oscillatory function of equation (2.1) (dashed line) is shown as well.The input parameters for the Swadener – Pharr method are reported in tables 3 and 4for transversely isotropic (TI) and orthotropic (ORTH) material models, respectively. Inthe axial direction (a), the coefficient of determination R2 values are 0.59 and 0.60 forthe transversely isotropic and orthotropic model, respectively; whereas, in the trans-verse direction (b), R2 values are 0.62 and 0.61 for the transversely isotropic andorthotropic model, respectively. Note ordinate does not start at zero.
rsif.royalsocietypublishing.orgJR
SocInterface10:20120953
9
on February 11, 2013rsif.royalsocietypublishing.orgDownloaded from
way the constituents’ anisotropy and their arrangement in the
hierarchical structure concur in the development of the aniso-
tropic mechanical behaviour of the tissue. Indentation
experiments at different maximum depths showed a periodic
alternating of stiffer layers with less stiff layers in which the
indentation modulus mean values, as well as the amplitude
of the modulation depend on maximum depth and orien-
tation of the indentation tests. A characteristic length owing
to the periodicity of the osteonal lamellae was quantified.
Further, the elastic constants for a sub-layer of mineralized
collagen fibrils within an osteonal lamella were identified
from the indentation moduli by applying an analytical
model that assumes inherent anisotropy of the mineralized
collagen fibrils as well as their spatial arrangement.
The smallest experimental characteristic length probed
(50 nm maximum depth, approximately 400 nm contact
diameter) is comparable to the size of a few mineralized col-
lagen fibrils and allowed the evaluation of the mechanical
properties of a single sub-layer of fibrils in the lamellar struc-
ture; whereas, the largest experimental characteristic length
sampled (300 nm maximum depth, approx. 2 mm contact
diameter) may accommodate approximately 10–20 bunches
of collagen fibrils oriented along multiple directions and,
thus, involves multiple sub-layers, whose thickness can
vary between few hundreds of nanometres to a couple of
microns [22,33–35]. These investigations enabled the identifi-
cation of a decrease in the values of indentation moduli with
the penetration depth (figure 5a) that indicates a possible size
effect in the mechanical properties of cortical bone tissue. At
the same time, decreasing values of amplitude DM (figure 5b)
indicate that the indentation experiment is involving a suffi-
cient amount of tissue volume such that homogenized
material properties are sensed by the indentation probe.
The stabilization of M0 and the decay to a negligible value
of DM occurs at approximately the same length scale. This
suggests that the homogenization process has completely
developed at approximately 300 nm maximum depth, corre-
sponding to a approximately 2 mm contact diameter
between the tissue and the indenter.
Homogenization arguments alone are not able to fully
justify the pronounced decay of the indentation moduli
with the penetration depth achieved with the experimental
tests, quantifiable in approximately 24 per cent and approxi-
mately 34 per cent reductions in the axial and transverse
directions, respectively. Instead, the decrease in indentation
modulus with indentation depth may be explained by con-
sidering peculiar deformation and failure mechanisms of
bone tissue at the nano-structural level, such as shear transfer
between mineral particles via intermediate ductile organic
layers [36], slippage at the collagen–mineral interface [37],
phase transformation of the mineral phase [38] and sacrificial
bond disruption between fibrils [39]. In particular, Gupta
et al. [40,41] showed that critical interfacial shear strength
between the fibril and the interfibrillar matrix layer is
exceeded when the bone is compressed above the yield
point. When this happens, the matrix flows past the fibrils,
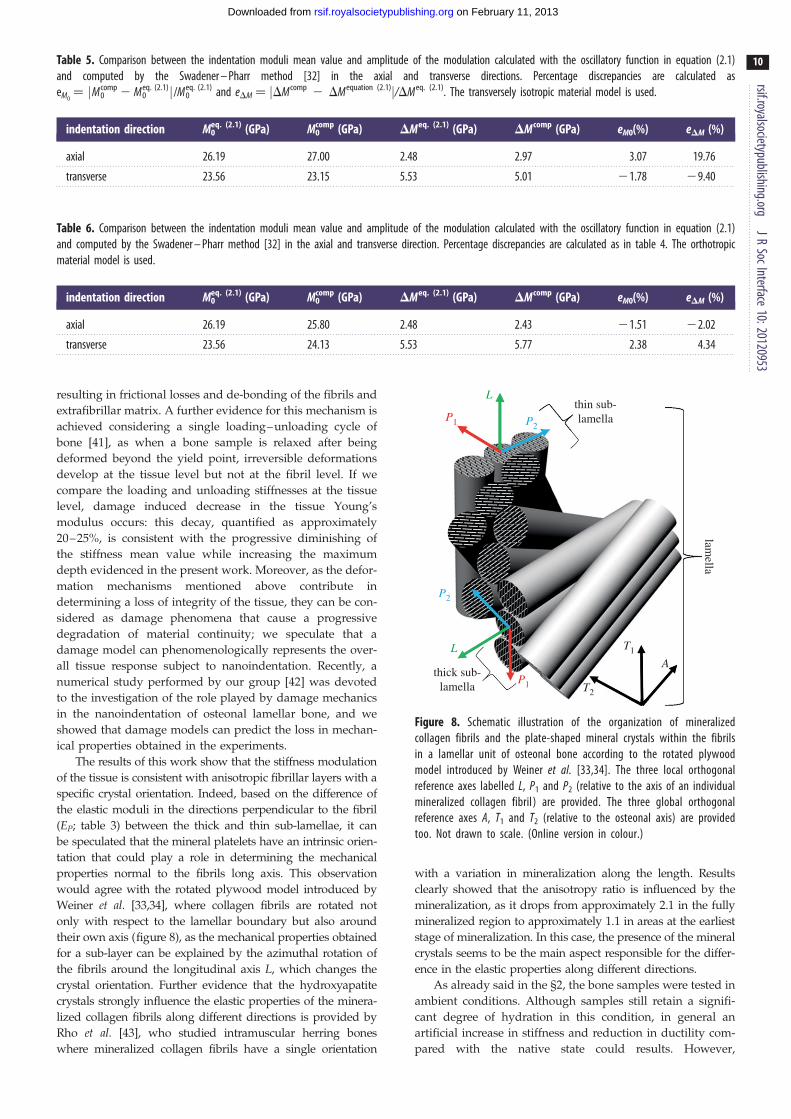
Table 6. Comparison between the indentation moduli mean value and amplitude of the modulation calculated with the oscillatory function in equation (2.1)and computed by the Swadener – Pharr method [32] in the axial and transverse direction. Percentage discrepancies are calculated as in table 4. The orthotropicmaterial model is used.
indentation direction M0eq. (2.1) (GPa) M0
comp (GPa) DMeq. (2.1) (GPa) DMcomp (GPa) eM0(%) eDM (%)
axial 26.19 25.80 2.48 2.43 21.51 22.02
transverse 23.56 24.13 5.53 5.77 2.38 4.34
Table 5. Comparison between the indentation moduli mean value and amplitude of the modulation calculated with the oscillatory function in equation (2.1)and computed by the Swadener – Pharr method [32] in the axial and transverse directions. Percentage discrepancies are calculated aseMO¼ jMcomp
0 2 Meq. (2.1)0 j/Meq. (2.1)
0 and eDM ¼ jDMcomp 2 DMequation (2.1)j/DMeq. (2.1). The transversely isotropic material model is used.
indentation direction M0eq. (2.1) (GPa) M0
comp (GPa) DMeq. (2.1) (GPa) DMcomp (GPa) eM0(%) eDM (%)
axial 26.19 27.00 2.48 2.97 3.07 19.76
transverse 23.56 23.15 5.53 5.01 21.78 29.40
P1
P1
L
L
P2
P2
T2
T1
thin sub-lamella
lamella
thick sub-lamella
A
Figure 8. Schematic illustration of the organization of mineralizedcollagen fibrils and the plate-shaped mineral crystals within the fibrilsin a lamellar unit of osteonal bone according to the rotated plywoodmodel introduced by Weiner et al. [33,34]. The three local orthogonalreference axes labelled L, P1 and P2 (relative to the axis of an individualmineralized collagen fibril ) are provided. The three global orthogonalreference axes A, T1 and T2 (relative to the osteonal axis) are providedtoo. Not drawn to scale. (Online version in colour.)
rsif.royalsocietypublishing.orgJR
SocInterface10:20120953
10
on February 11, 2013rsif.royalsocietypublishing.orgDownloaded from
resulting in frictional losses and de-bonding of the fibrils and
extrafibrillar matrix. A further evidence for this mechanism is
achieved considering a single loading–unloading cycle of
bone [41], as when a bone sample is relaxed after being
deformed beyond the yield point, irreversible deformations
develop at the tissue level but not at the fibril level. If we
compare the loading and unloading stiffnesses at the tissue
level, damage induced decrease in the tissue Young’s
modulus occurs: this decay, quantified as approximately
20–25%, is consistent with the progressive diminishing of
the stiffness mean value while increasing the maximum
depth evidenced in the present work. Moreover, as the defor-
mation mechanisms mentioned above contribute in
determining a loss of integrity of the tissue, they can be con-
sidered as damage phenomena that cause a progressive
degradation of material continuity; we speculate that a
damage model can phenomenologically represents the over-
all tissue response subject to nanoindentation. Recently, a
numerical study performed by our group [42] was devoted
to the investigation of the role played by damage mechanics
in the nanoindentation of osteonal lamellar bone, and we
showed that damage models can predict the loss in mechan-
ical properties obtained in the experiments.
The results of this work show that the stiffness modulation
of the tissue is consistent with anisotropic fibrillar layers with a
specific crystal orientation. Indeed, based on the difference of
the elastic moduli in the directions perpendicular to the fibril
(EP; table 3) between the thick and thin sub-lamellae, it can
be speculated that the mineral platelets have an intrinsic orien-
tation that could play a role in determining the mechanical
properties normal to the fibrils long axis. This observation
would agree with the rotated plywood model introduced by
Weiner et al. [33,34], where collagen fibrils are rotated not
only with respect to the lamellar boundary but also around
their own axis (figure 8), as the mechanical properties obtained
for a sub-layer can be explained by the azimuthal rotation of
the fibrils around the longitudinal axis L, which changes the
crystal orientation. Further evidence that the hydroxyapatite
crystals strongly influence the elastic properties of the minera-
lized collagen fibrils along different directions is provided by
Rho et al. [43], who studied intramuscular herring bones
where mineralized collagen fibrils have a single orientation
with a variation in mineralization along the length. Results
clearly showed that the anisotropy ratio is influenced by the
mineralization, as it drops from approximately 2.1 in the fully
mineralized region to approximately 1.1 in areas at the earliest
stage of mineralization. In this case, the presence of the mineral
crystals seems to be the main aspect responsible for the differ-
ence in the elastic properties along different directions.
As already said in the §2, the bone samples were tested in
ambient conditions. Although samples still retain a signifi-
cant degree of hydration in this condition, in general an
artificial increase in stiffness and reduction in ductility com-
pared with the native state could results. However,
rsif.royalsocietypublishing.orgJR
SocInterface10:
11
on February 11, 2013rsif.royalsocietypublishing.orgDownloaded from
Hengsberger et al. [44] adopted instrumented indentation to
compare dry and wet samples at different length scales,
which are comparable to the ones investigated here. Basically,
what they found is that: (i) thick lamellae exhibited a signifi-
cant decrease in indentation modulus with increasing
indentation depth, as reported in this study and (ii) the com-
parative trends of indentation depth and lamella type were
similar for dry and physiological conditions. Thus, the
effect of testing dry instead of wet samples seems the same
at multiple length scales. Therefore, relative modulations in
mechanical properties are expected to remain valid, as well
as the comparison between the mechanical properties at the
different experimental characteristic length probed and
along different directions. Anyway, future developments
will consider the application of the present experimental–
analytical procedure to tests in conditions closer to the
physiological ones.
20120953
5. ConclusionIn this work, the hierarchical arrangement of lamellar bonewas found to be a major determinant for modulation of
mechanical properties and anisotropic mechanical behaviour
of the tissue. In more detail:
— the size effect on lamellar bone anisotropic mechanical be-
haviour, evidenced by the decline of indentation modulus
versus probe size, and the critical length at which hom-
ogenization of the mechanical properties occurs were
determined by measuring the spatial modulation of
indentation response;
— by using a laminate-composite-based analytical model,
the elastic constants for a sub-layer of mineralized col-
lagen fibrils within an osteonal lamella were determined
on the basis of their spatial arrangements and were vali-
dated through direct comparison of the experimental
indentation moduli and the predicted ones computed by
the Swadener–Pharr model.
The structural complexity of bone tissue requires that the
assessment of its mechanical properties involves multiple
hierarchical levels, from the macroscopic scale down to the
micro- and nano-structural level till the most basic com-
ponents. Understanding structure–property relationships
and the effects of structural features on the biomechanical
properties of bone would enable not only the development
of more accurate models for analysis of implants and poten-
tial bone-replacement materials, but also the progress in
designing bioinspired structural materials that take advan-
tage of the mechanical design principles found in nature.
These latter topics undoubtedly represent fascinating
long-term scientific goals in the materials science and
engineering field.
The authors would like to thank the MIT-Italy Programme for sup-porting the research and the Progetto Rocca for supporting DavideCarnelli’s scholarship at the MIT. The DMSE Nanomechanical Tech-nology Laboratory and the Institute for Soldier Nanotechnologies(ISN) at the MIT are gratefully acknowledged for use of equipmentand facilities. M.D. acknowledges support by the ONR grant no.N00014-08-1-0510, and by the Advanced Materials for Micro andNano Systems Programme of the Singapore-MIT Alliance (SMA).
References
1. Weiner S, Wagner HD. 1998 The material bone:structure mechanical function relations. Annu. Rev.Mater. Sci. 28, 271 – 298. (doi:10.1146/annurev.matsci.28.1.271)
2. Currey JD. 2002 Bones: structure and mechanics.Princeton, NJ: Princeton University Press.
3. Cowin SC. 2001 Bone mechanics handbook. BocaRaton, FL: CRC Press Inc.
4. Currey JD. 1984 The mechanical adaptations ofbones. Princeton, NJ: Princeton University Press.
5. Rho JY, Kuhn-Spearing L, Zioupos P. 1998Mechanical properties and the hierarchical structureof bone. Med. Eng. Phys. 20, 92 – 102. (doi:10.1016/S1350-4533(98)00007-1)
6. Fratzl P, Weinkamer R. 2007 Nature’s hierarchicalmaterials. Prog. Mater. Sci. 52, 1263 – 1334. (doi:10.1016/j.pmatsci.2007.06.001)
7. Fratzl P, Gupta HS, Paschalis EP, Roschger P. 2004Structure and mechanical quality of the collagen-mineral nano-composite in bone. J. Mater. Chem.14, 2115 – 2123. (doi:10.1039/B402005G)
8. Fratzl P, Gupta HS. 2007 Nanoscale mechanisms ofbone deformation and fracture. Weinheim, Germany:Wiley-VCH Verlag GmbH.
9. Wagermaier W, Gupta HS, Gourrier A, BurghammerM, Roschger P, Fratzl P. 2006 Spiral twisting of fiber
orientation inside bone lamellae. Biointerphases 1,1 – 5. (doi:10.1116/1.2178386)
10. Wagermaier W, Gupta HS, Gourrier A, Paris O,Roschger P, Burghammer M, Riekel C, Fratzl P. 2007Scanning texture analysis of lamellar bone usingmicrobeam synchrotron X-ray radiation. J. Appl.Crystall. 40, 115 – 120. (doi:10.1107/S0021889806044888)
11. Reilly DT, Burstein AH. 1975 The elastic andultimate properties of compact bone tissue.J. Biomech. 6, 393 – 396. (doi:10.1016/0021-9290(75)90075-5)
12. Ascenzi A, Baschieri P, Benvenuti A. 1994 Thetorsional properties of single selected osteons.J. Biomech. 27, 875 – 884. (doi:10.1016/0021-9290(94)90260-7)
13. Ascenzi A, Ascenzi MG, Benvenuti A, Mango F. 1997Pinching in longitudinal and alternate osteonsduring cyclic loading. J. Biomech. 30, 689 – 695.(10.1016/S0021-9290(97)00002-X)
14. Rho JY. 1996 An ultrasonic method for measuringthe elastic properties of human tibial cortical andcancellous bone. Ultrasonics 34, 777 – 783. (doi:10.1016/S0041-624X(96)00078-9)
15. Fan Z, Swadener JG, Rho JY, Roy ME, Pharr GM. 2002Anisotropic properties of human tibial cortical bone as
measured by nanoindentation. J. Orthop. Res. 20,806 – 810. (doi:10.1016/S0736-0266(01)00186-3)
16. Rho JY, Currey JD, Zioupos P, Pharr GM. 2001 Theanisotropic young’s modulus of equine secondaryosteones and interstitial bone determined bynanoindentation. J. Exp. Biol. 204, 1775 – 1781.
17. Franzoso G, Zysset PK. 2009 Elastic anisotropy ofhuman cortical bone secondary osteons measuredby nanoindentation. J. Biomech. Eng. 131,021001.1 – 021001.11. (doi:10.1115/1.3005162)
18. Yoon YJ, Cowin SC. 2008 The estimated elasticconstants for a single bone osteonal lamella.Biomech. Model. Mechanobiol. 7, 1 – 11. (doi:10.1007/s10237-006-0072-8)
19. Gupta HS, Stachewicz U, Wagermaier W, Roschger P,Wagner HD, Fratzl P. 2006 Mechanical modulationat the lamellar level in osteonal bone. J. Mater. Res.21, 1913 – 1921. (doi:10.1557/jmr.2006.0234)
20. Kasiri S, Taylor D. 2008 A critical distance study ofstress concentrations in bone. J. Biomech. 41,603 – 609. (doi:10.1016/j.jbiomech.2007.10.003)
21. Yao H, Dao M, Carnelli D, Tai K, Ortiz C. 2011 Size-dependent heterogeneity benefits themechanical performance of bone. J. Mech.Phys. Solid 59, 64 – 74. (doi:10.1016/j.jmps.2010.09.012)
rsif.royalsocietypublishing.orgJR
SocInterface10:20120953
12
on February 11, 2013rsif.royalsocietypublishing.orgDownloaded from
22. Hofmann T, Heyroth F, Meinhard H, Franzel W,Raum K. 2006 Assessment of composition andanisotropic elastic properties of secondary osteonlamellae. J. Biomech. 39, 2282 – 2294. (doi:10.1016/j.jbiomech.2005.07.009)
23. Oliver WC, Pharr GM. 2004 Measurement ofhardness and elastic modulus by instrumentedindentation: advances in understanding andrefinements to methodology. J. Mater. Res. 19,3 – 20. (doi:10.1557/jmr.2004.19.1.3)
24. Tai K, Qi HJ, Ortiz C. 2005 Effect of mineral contenton the nanoindentation properties and nanoscaledeformation mechanisms of bovine tibial corticalbone. J. Mater. Sci. Mater. Med. 16, 947 – 959.(doi:10.1007/s10856-005-4429-9)
25. Oliver WC, Pharr GM. 1992 An improved techniquefor determining hardness and elastic modulus usingload and displacement sensing indentationexperiments. J. Mater. Res. 7, 1564 – 1583. (doi:10.1557/JMR.1992.1564)
26. Currey JD. 1969 The relationship between thestiffness and the mineral content of bone.J. Biomech. 2, 477 – 480. (doi:10.1016/0021-9290(69)90023-2)
27. Seto J, Gupta HS, Zaslansky P, Wagner HD, Fratzl P.2008 Tough lessons from bone: extreme mechanicalanisotropy at the mesoscale. Adv. Funct. Mater. 18,1905 – 1911. (doi:10.1002/adfm.200800214)
28. Fritsch A, Hellmich C. 2007 Universal microstructuralpatterns in cortical and trabecular, extracellular andextravascular bone materials: micromechanics-basedprediction of anisotropic elasticity. J. Theor. Biol.244, 597 – 620. (doi:10.1016/j.jtbi.2006.09.013)
29. Hellmich C, Ulm FJ. 2002 Are mineralized tissuesopen crystal foams reinforced by crosslinked
collagen? Some energy arguments. J. Biomech. 35,1199 – 1212. (doi:10.1016/S0021-9290(02)00080-5)
30. Hellmich C, Barthelemy J-F, Dormieux L. 2004Mineral – collagen interactions in elasticity of boneultrastructure-a continuum micromechanicsapproach. Eur. J. Mech. A Solids 23, 783 – 810.(doi:10.1016/j.euromechsol.2004.05.004)
31. Delafargue A, Ulm FJ. 2004 Explicit approximationsof the indentation modulus of elastically orthotropicsolids for conical indenters. Int. J. Solids Struct. 41,7351 – 7360. (doi:10.1016/j.ijsolstr.2004.06.019)
32. Swadener JG, Pharr GM. 2001 Indentation ofelastically anisotropic half-spaces by cones andparabolas of revolution. Phil. Mag. A 81, 447 – 466.(doi:10.1080/01418610108214314)
33. Weiner S, Arad T, Sabanay I, Traub W. 1997 Rotatedplywood structure of primary lamellar bone in the rat:orientations of the collagen fibril arrays. Bone 20,509 – 514. (doi:10.1016/S8756-3282(97)00053-7)
34. Weiner S, Traub W, Wagner HD. 1999 Lamellarbone: structure – function relations. J. Struct. Biol.126, 241 – 255. (doi:10.1006/jsbi.1999.4107)
35. Akiva U, Wagner HD, Weiner S. 1998 Modelling thethree-dimensional elastic constants of parallel-fibredand lamellar bone. J. Mater. Sci. 33, 1497 – 1509.(doi:10.1023/A:1004303926771)
36. Jager I, Fratzl P. 2000 Mineralized collagen fibrils: amechanical model with a staggered arrangement ofmineral particles. Biophys. J. 79, 1737 – 1746.(doi:10.1016/S0006-3495(00)76426-5)
37. Mercer C, He MY, Wang R, Evans AG. 2006Mechanisms governing the inelastic deformation ofcortical bone and application to trabecular bone.Acta Biol. 2, 59 – 68. (doi:10.1016/j.actbio.2005.08.004)
38. Carden A, Rajachar RM, Morris MD, Kohn DH. 2003Ultrastructural changes accompanying themechanical deformation of bone tissue: a ramanimaging study. Calcif. Tissue Int. 72, 166 – 175.(doi:10.1007/s00223-002-1039-0)
39. Fantner G et al. 2005 Sacrificial bonds and hiddenlength dissipate energy as mineralized fibrilsseparate during bone fracture. Nat. Mater. 4,612 – 616. (doi:10.1038/nmat1428)
40. Gupta HS, Wagermaier W, Zickler GA, AroushDRB, Funari SS, Roschger P, Wagner HD, Fratzl P.2005 Nanoscale deformation mechanisms in bone.Nano Lett. 5, 2108 – 2111. (doi:10.1021/nl051584b)
41. Gupta HS, Wagermaier W, Zickler GA, Hartmann J,Funari SS, Roschger P, Wagner HD, Fratzl P. 2006Fibrillar level fracture in bone beyond the yieldpoint. Int. J. Fracture 139, 425 – 436. (doi:10.1007/s10704-006-6635-y)
42. Lucchini R, Carnelli D, Ponzoni M, Bertarelli E,Gastaldi D, Vena P. 2011 Role of damage mechanicsin nanoindentation of lamellar bone at multiplesizes: experiments and numerical modeling.J. Mech. Behav. Biomed. Mater. 4, 1852 – 1863.(doi:10.1016/j.jmbbm.2011.06.002)
43. Rho JY, Mishra SR, Chung K, Bai J, Pharr GM. 2001Relationship between ultrastructure and thenanoindentation properties of intramuscular herringbones. Ann. Biomed. Eng. 29, 1082 – 1088. (doi:10.1114/1.1424913)
44. Hengsberger S, Kulik A, Zysset P. 2002Nanoindentation discriminates the elastic propertiesof individual human bone lamellae under dry andphysiological conditions. Bone 30, 178 – 184.(doi:10.1016/S8756-3282(01)00624-X)