oriflame capital markets day 2017 -...
TRANSCRIPT
Oriflame Capital Markets Day 2017Celebrating 50 years and looking forward
February 16, 2017
2
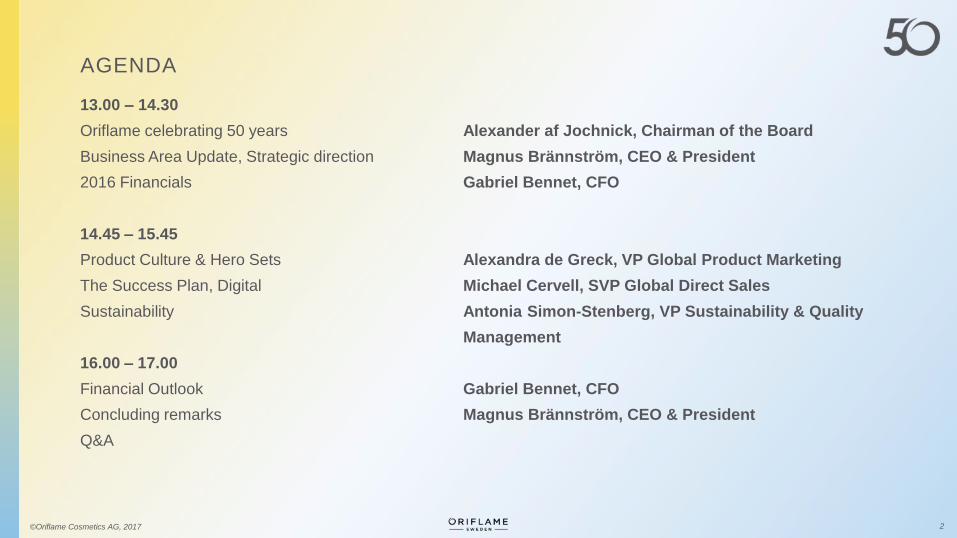
13.00 – 14.30
Oriflame celebrating 50 years Alexander af Jochnick, Chairman of the Board
Business Area Update, Strategic direction Magnus Brännström, CEO & President
2016 Financials Gabriel Bennet, CFO
14.45 – 15.45
Product Culture & Hero Sets Alexandra de Greck, VP Global Product Marketing
The Success Plan, Digital Michael Cervell, SVP Global Direct Sales
Sustainability Antonia Simon-Stenberg, VP Sustainability & Quality
Management
16.00 – 17.00
Financial Outlook Gabriel Bennet, CFO
Concluding remarks Magnus Brännström, CEO & President
Q&A
AGENDA
©Oriflame Cosmetics AG, 2017
Alexander af Jochnick, Chairman of the Board
February 16, 2017
Oriflame celebrating
50 years

Magnus Brännström, CEO & President
February 16, 2017
Oriflame celebrating
50 years
5©Oriflame Cosmetics AG, 2017
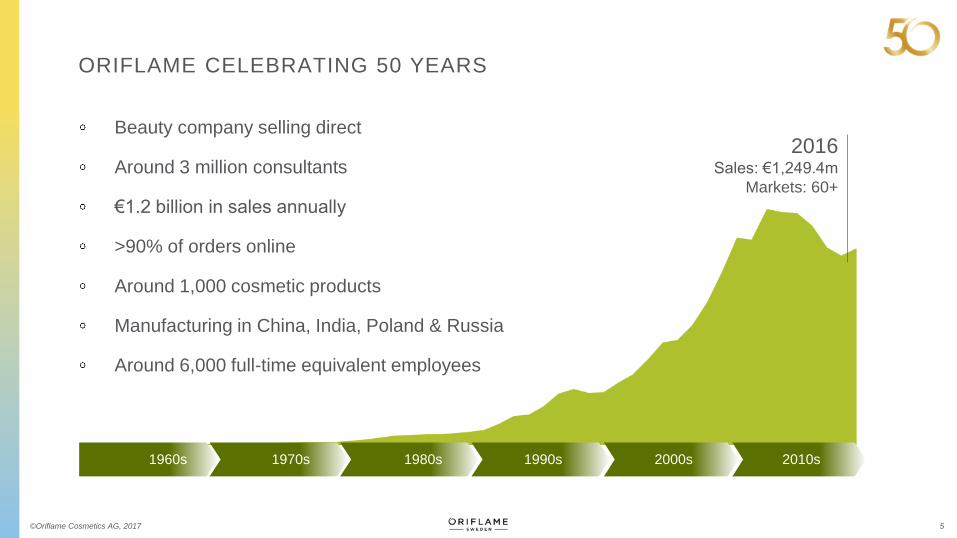
1960s 1970s 1980s 1990s 2000s 2010s
ORIFLAME CELEBRATING 50 YEARS
2016Sales: €1,249.4m
Markets: 60+
Beauty company selling direct
Around 3 million consultants
€1.2 billion in sales annually
>90% of orders online
Around 1,000 cosmetic products
Manufacturing in China, India, Poland & Russia
Around 6,000 full-time equivalent employees

6©Oriflame Cosmetics AG, 2017
LONG-TERM FINANCIAL TARGETS
-5%
5%
15%
25%
2004 2005 2006 2007 2008 2009 2010 2011 2012 2013 2014 2015 2016
Lc sales growth Target
10%LOCAL SALES
DEVELOPMENT
15%OPERATING MARGIN
0.0%
5.0%
10.0%
15.0%
2004 2005 2006 2007 2008 2009 2010* 2011* 2012 2013* 2014* 2015* 2016
Operating margin Target
* Adjusted Operating margin
©Oriflame Cosmetics AG, 2017 7
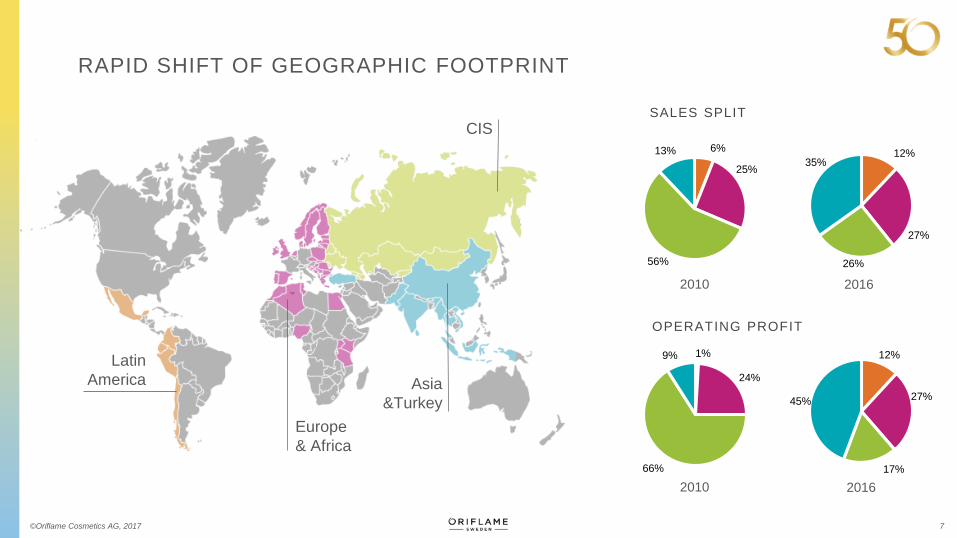
RAPID SHIFT OF GEOGRAPHIC FOOTPRINT
Asia
&Turkey
Europe
& Africa
CIS
Latin
America
SALES SPLIT
2010
OPERATING PROFIT
2016
2010 2016
12%
27%
26%
35%
6%
25%
56%
13%
12%
27%
17%
45%
1%
24%
66%
9%
©Oriflame Cosmetics AG, 2017 8
BUSINESS AREA UPDATE
©Oriflame Cosmetics AG, 2017 9
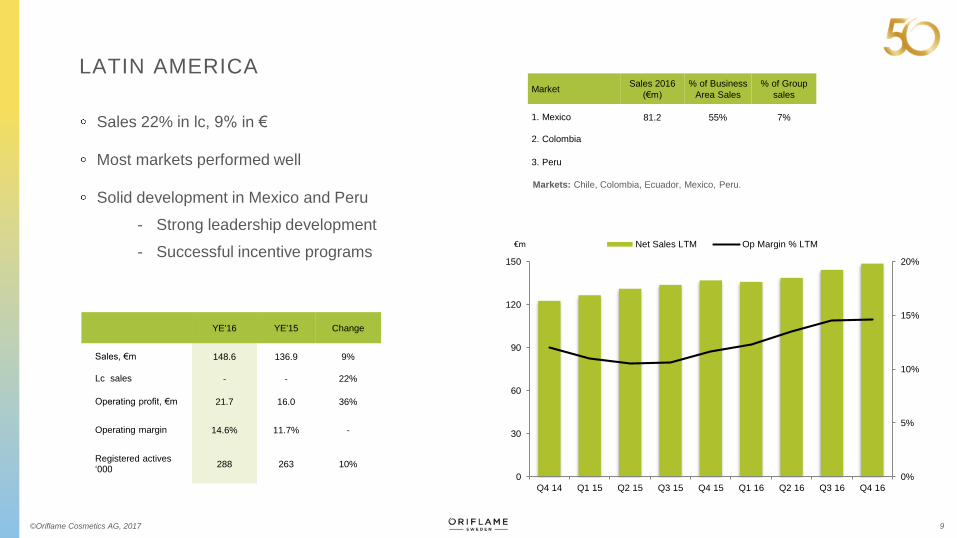
LATIN AMERICA
0%
5%
10%
15%
20%
0
30
60
90
120
150
Q4 14 Q1 15 Q2 15 Q3 15 Q4 15 Q1 16 Q2 16 Q3 16 Q4 16
Net Sales LTM Op Margin % LTM€m
YE'16 YE'15 Change
Sales, €m 148.6 136.9 9%
Lc sales - - 22%
Operating profit, €m 21.7 16.0 36%
Operating margin 14.6% 11.7% -
Registered actives ‘000
288 263 10%
Sales 22% in lc, 9% in €
Most markets performed well
Solid development in Mexico and Peru
- Strong leadership development
- Successful incentive programs
MarketSales 2016
(€m)
% of Business
Area Sales
% of Group
sales
1. Mexico 81.2 55% 7%
2. Colombia
3. Peru
Markets: Chile, Colombia, Ecuador, Mexico, Peru.
©Oriflame Cosmetics AG, 2017 10
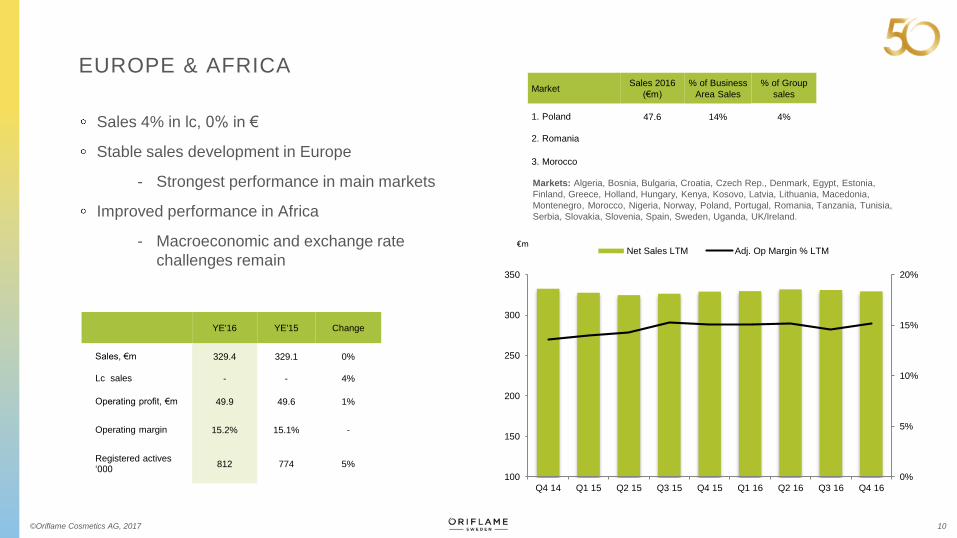
EUROPE & AFRICA
0%
5%
10%
15%
20%
100
150
200
250
300
350
Q4 14 Q1 15 Q2 15 Q3 15 Q4 15 Q1 16 Q2 16 Q3 16 Q4 16
Net Sales LTM Adj. Op Margin % LTM€m
Sales 4% in lc, 0% in €
Stable sales development in Europe
- Strongest performance in main markets
Improved performance in Africa
- Macroeconomic and exchange rate
challenges remain
YE'16 YE'15 Change
Sales, €m 329.4 329.1 0%
Lc sales - - 4%
Operating profit, €m 49.9 49.6 1%
Operating margin 15.2% 15.1% -
Registered actives ‘000
812 774 5%
MarketSales 2016
(€m)
% of Business
Area Sales
% of Group
sales
1. Poland 47.6 14% 4%
2. Romania
3. Morocco
Markets: Algeria, Bosnia, Bulgaria, Croatia, Czech Rep., Denmark, Egypt, Estonia,
Finland, Greece, Holland, Hungary, Kenya, Kosovo, Latvia, Lithuania, Macedonia,
Montenegro, Morocco, Nigeria, Norway, Poland, Portugal, Romania, Tanzania, Tunisia,
Serbia, Slovakia, Slovenia, Spain, Sweden, Uganda, UK/Ireland.
©Oriflame Cosmetics AG, 2017 11
CIS
0%
5%
10%
15%
20%
0
100
200
300
400
500
600
Q4 14 Q1 15 Q2 15 Q3 15 Q4 15 Q1 16 Q2 16 Q3 16 Q4 16
Net Sales LTM Adj. Op Margin % LTM€m
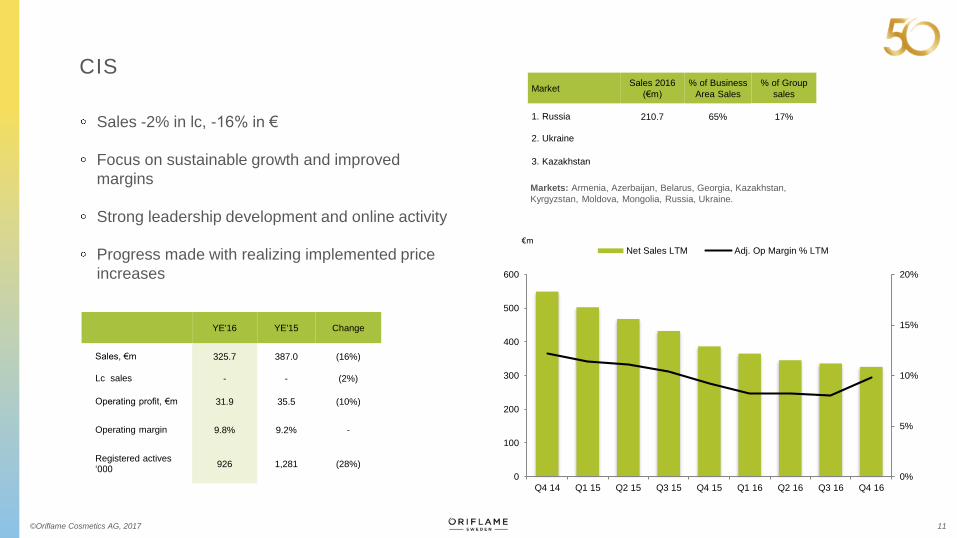
Sales -2% in lc, -16% in €
Focus on sustainable growth and improved
margins
Strong leadership development and online activity
Progress made with realizing implemented price
increases
YE'16 YE'15 Change
Sales, €m 325.7 387.0 (16%)
Lc sales - - (2%)
Operating profit, €m 31.9 35.5 (10%)
Operating margin 9.8% 9.2% -
Registered actives ‘000
926 1,281 (28%)
Markets: Armenia, Azerbaijan, Belarus, Georgia, Kazakhstan,
Kyrgyzstan, Moldova, Mongolia, Russia, Ukraine.
MarketSales 2016
(€m)
% of Business
Area Sales
% of Group
sales
1. Russia 210.7 65% 17%
2. Ukraine
3. Kazakhstan
©Oriflame Cosmetics AG, 2017 12
ASIA & TURKEY
0%
5%
10%
15%
20%
0
50
100
150
200
250
300
350
400
450
500
Q4 14 Q1 15 Q2 15 Q3 15 Q4 15 Q1 16 Q2 16 Q3 16 Q4 16
Net Sales LTM Op Margin % LTM€m
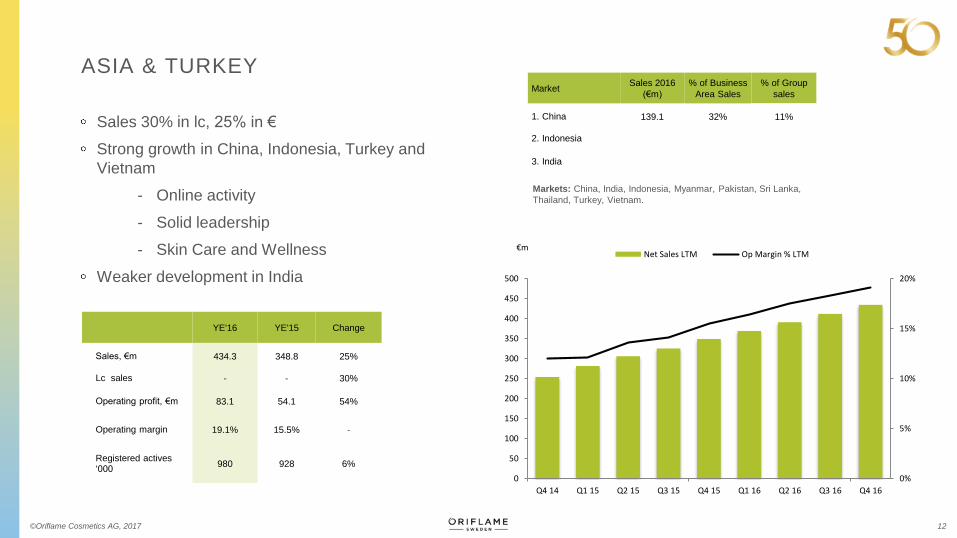
Sales 30% in lc, 25% in €
Strong growth in China, Indonesia, Turkey and
Vietnam
- Online activity
- Solid leadership
- Skin Care and Wellness
Weaker development in India
YE'16 YE'15 Change
Sales, €m 434.3 348.8 25%
Lc sales - - 30%
Operating profit, €m 83.1 54.1 54%
Operating margin 19.1% 15.5% -
Registered actives ‘000
980 928 6%
Markets: China, India, Indonesia, Myanmar, Pakistan, Sri Lanka,
Thailand, Turkey, Vietnam.
MarketSales 2016
(€m)
% of Business
Area Sales
% of Group
sales
1. China 139.1 32% 11%
2. Indonesia
3. India

Gabriel Bennet, CFO
February 16, 2017
2016 Financials
14©Oriflame Cosmetics AG, 2017
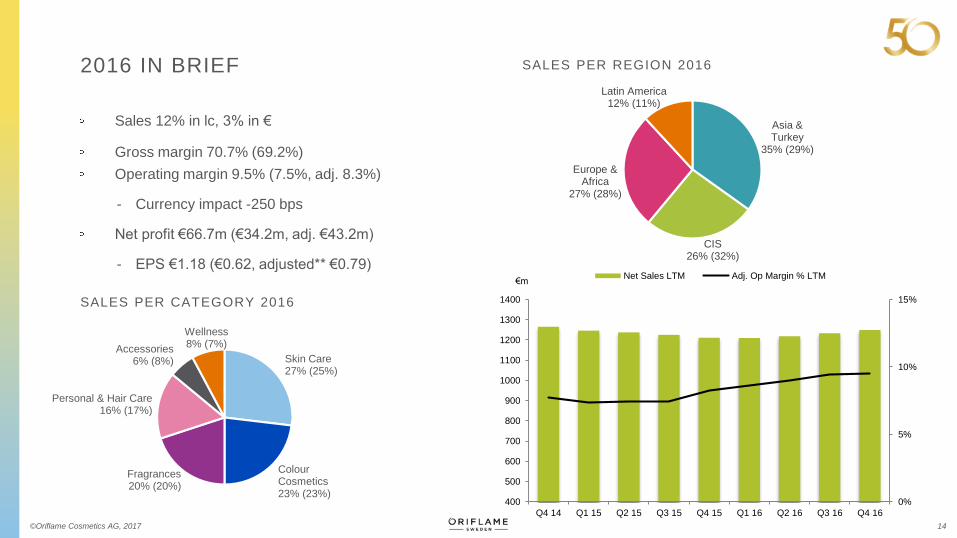
SALES PER CATEGORY 2016
2016 IN BRIEF
Skin Care27% (25%)
Colour Cosmetics23% (23%)
Fragrances20% (20%)
Personal & Hair Care16% (17%)
Accessories 6% (8%)
Wellness8% (7%)
SALES PER REGION 2016
0%
5%
10%
15%
400
500
600
700
800
900
1000
1100
1200
1300
1400
Q4 14 Q1 15 Q2 15 Q3 15 Q4 15 Q1 16 Q2 16 Q3 16 Q4 16
Net Sales LTM Adj. Op Margin % LTM€m
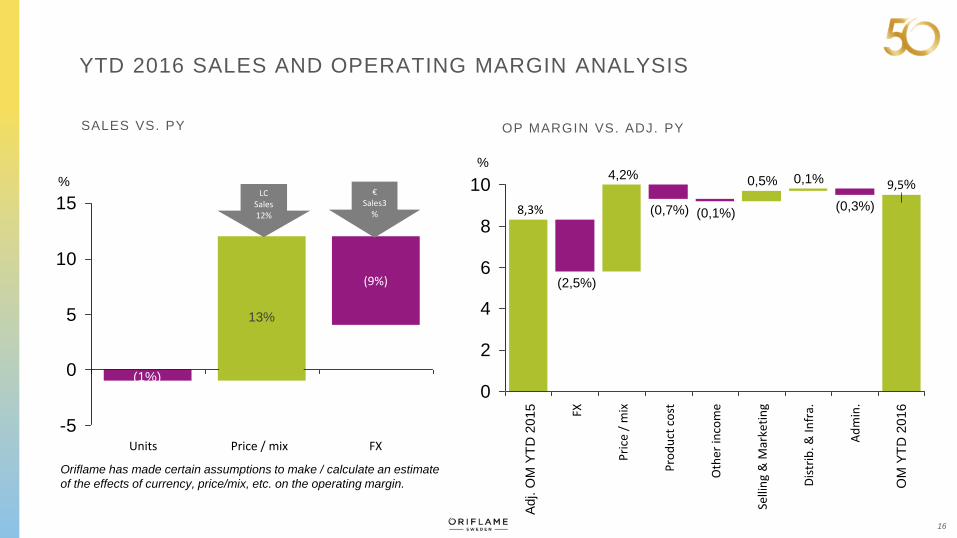
Sales 12% in lc, 3% in €
Gross margin 70.7% (69.2%)
Operating margin 9.5% (7.5%, adj. 8.3%)
- Currency impact -250 bps
Net profit €66.7m (€34.2m, adj. €43.2m)
- EPS €1.18 (€0.62, adjusted** €0.79)
Asia & Turkey
35% (29%)
CIS26% (32%)
Europe & Africa
27% (28%)
Latin America12% (11%)
15©Oriflame Cosmetics AG, 2017
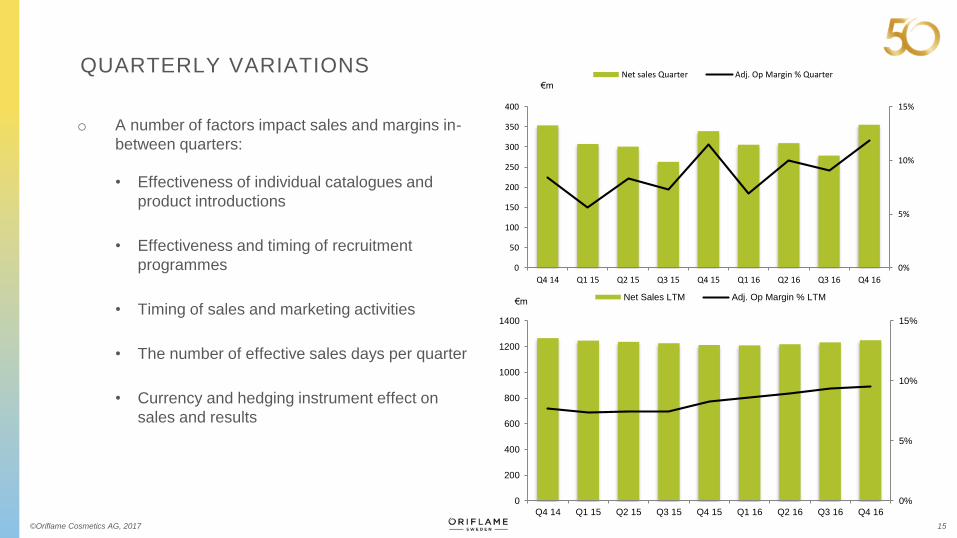
QUARTERLY VARIATIONS
0%
5%
10%
15%
0
200
400
600
800
1000
1200
1400
Q4 14 Q1 15 Q2 15 Q3 15 Q4 15 Q1 16 Q2 16 Q3 16 Q4 16
Net Sales LTM Adj. Op Margin % LTM€m
0%
5%
10%
15%
0
50
100
150
200
250
300
350
400
Q4 14 Q1 15 Q2 15 Q3 15 Q4 15 Q1 16 Q2 16 Q3 16 Q4 16
Net sales Quarter Adj. Op Margin % Quarter€m
o A number of factors impact sales and margins in-
between quarters:
• Effectiveness of individual catalogues and
product introductions
• Effectiveness and timing of recruitment
programmes
• Timing of sales and marketing activities
• The number of effective sales days per quarter
• Currency and hedging instrument effect on
sales and results
16
YTD 2016 SALES AND OPERATING MARGIN ANALYSIS
Oriflame has made certain assumptions to make / calculate an estimate
of the effects of currency, price/mix, etc. on the operating margin.
-5
0
5
10
15
FX
(9%)
Price / mixUnits
13%
€ Sales3
%
LC Sales 12%
%
(1%)
0
2
4
6
8
10
(2,5%)
Adj. O
M Y
TD
2015
8,3%
Selli
ng
& M
arke
tin
g
0,1%0,5%4,2%
FX
Pro
du
ct c
ost
(0,1%)
Oth
er in
com
e
Pri
ce /
mix
(0,7%)
Dis
trib
. & In
fra.
9,5%
(0,3%)
Ad
min
.
OM
YT
D 2
016
%
SALES VS. PY OP MARGIN VS. ADJ. PY
17©Oriflame Cosmetics AG, 2017
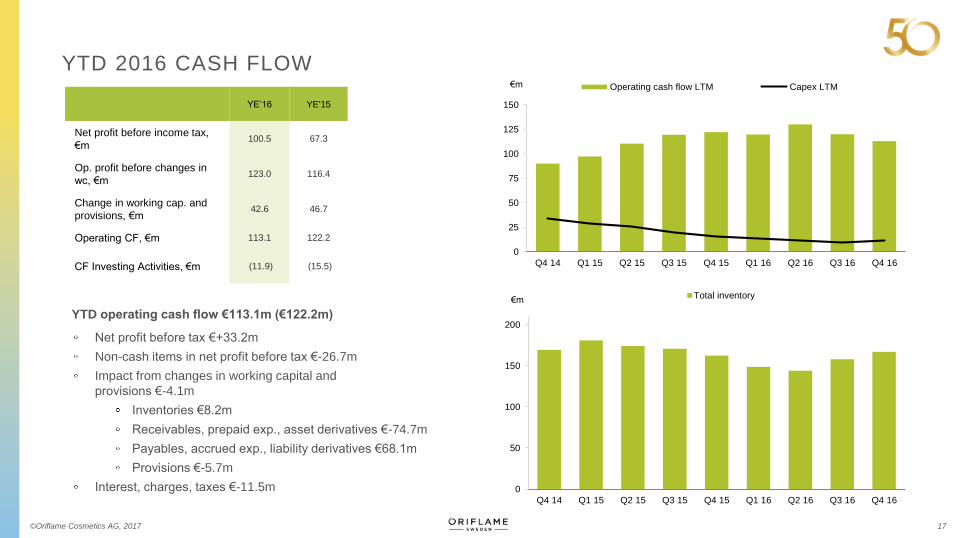
YTD operating cash flow €113.1m (€122.2m)
Net profit before tax €+33.2m
Non-cash items in net profit before tax €-26.7m
Impact from changes in working capital and
provisions €-4.1m
Inventories €8.2m
Receivables, prepaid exp., asset derivatives €-74.7m
Payables, accrued exp., liability derivatives €68.1m
Provisions €-5.7m
Interest, charges, taxes €-11.5m
YE’16 YE'15
Net profit before income tax,
€m100.5 67.3
Op. profit before changes in
wc, €m123.0 116.4
Change in working cap. and
provisions, €m42.6 46.7
Operating CF, €m 113.1 122.2
CF Investing Activities, €m (11.9) (15.5)
YTD 2016 CASH FLOW
0
50
100
150
200
Q4 14 Q1 15 Q2 15 Q3 15 Q4 15 Q1 16 Q2 16 Q3 16 Q4 16
Total inventory€m
0
25
50
75
100
125
150
Q4 14 Q1 15 Q2 15 Q3 15 Q4 15 Q1 16 Q2 16 Q3 16 Q4 16
Operating cash flow LTM Capex LTM€m
18©Oriflame Cosmetics AG, 2017
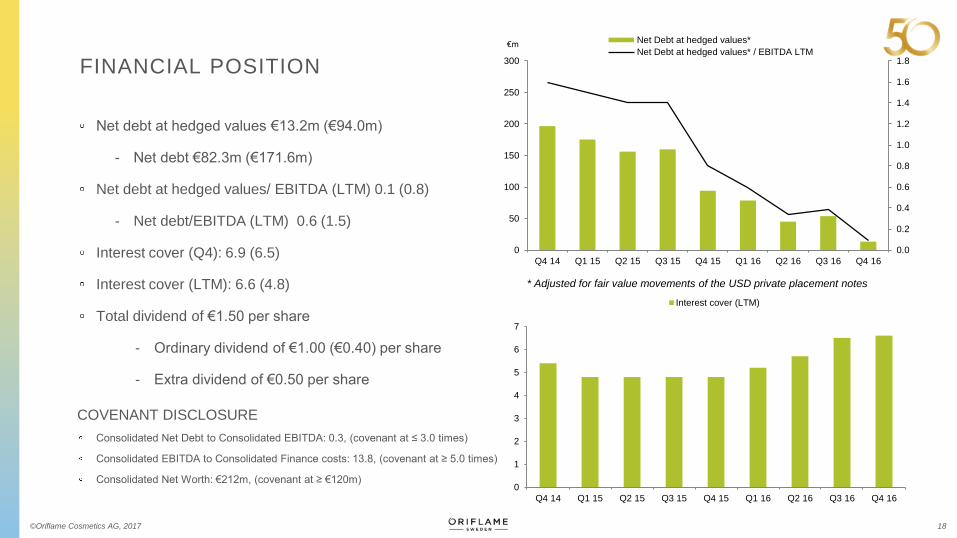
FINANCIAL POSITION
0.0
0.2
0.4
0.6
0.8
1.0
1.2
1.4
1.6
1.8
0
50
100
150
200
250
300
Q4 14 Q1 15 Q2 15 Q3 15 Q4 15 Q1 16 Q2 16 Q3 16 Q4 16
Net Debt at hedged values*
Net Debt at hedged values* / EBITDA LTM
* Adjusted for fair value movements of the USD private placement notes
0
1
2
3
4
5
6
7
Q4 14 Q1 15 Q2 15 Q3 15 Q4 15 Q1 16 Q2 16 Q3 16 Q4 16
Interest cover (LTM)
Net debt at hedged values €13.2m (€94.0m)
- Net debt €82.3m (€171.6m)
Net debt at hedged values/ EBITDA (LTM) 0.1 (0.8)
- Net debt/EBITDA (LTM) 0.6 (1.5)
Interest cover (Q4): 6.9 (6.5)
Interest cover (LTM): 6.6 (4.8)
Total dividend of €1.50 per share
- Ordinary dividend of €1.00 (€0.40) per share
- Extra dividend of €0.50 per share
COVENANT DISCLOSURE
Consolidated Net Debt to Consolidated EBITDA: 0.3, (covenant at ≤ 3.0 times)
Consolidated EBITDA to Consolidated Finance costs: 13.8, (covenant at ≥ 5.0 times)
Consolidated Net Worth: €212m, (covenant at ≥ €120m)
€m
Magnus Brännström, CEO & President
February 16, 2017
Looking forward
20
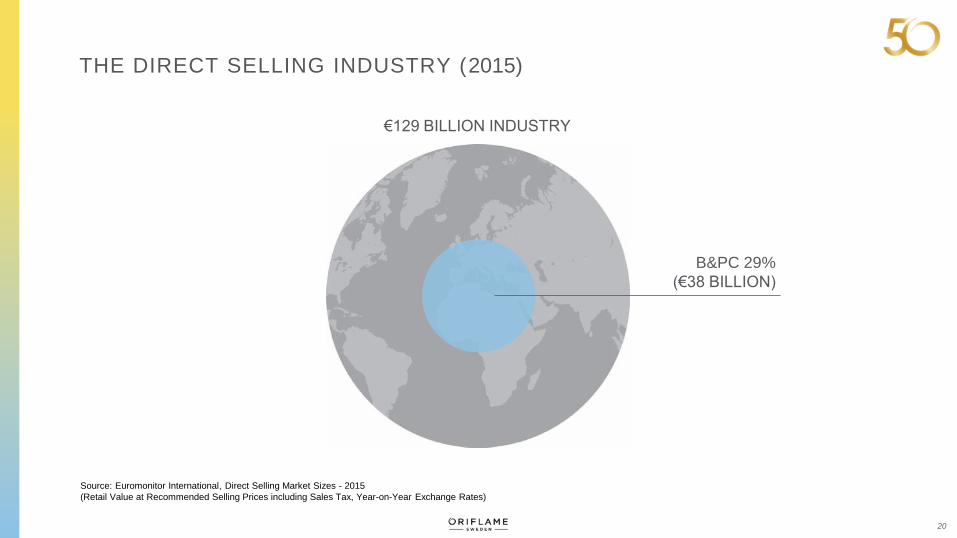
€129 BILLION INDUSTRY
B&PC 29%
(€38 BILLION)
THE DIRECT SELLING INDUSTRY (2015)
Source: Euromonitor International, Direct Selling Market Sizes - 2015
(Retail Value at Recommended Selling Prices including Sales Tax, Year-on-Year Exchange Rates)
©Oriflame Cosmetics AG, 2017 21
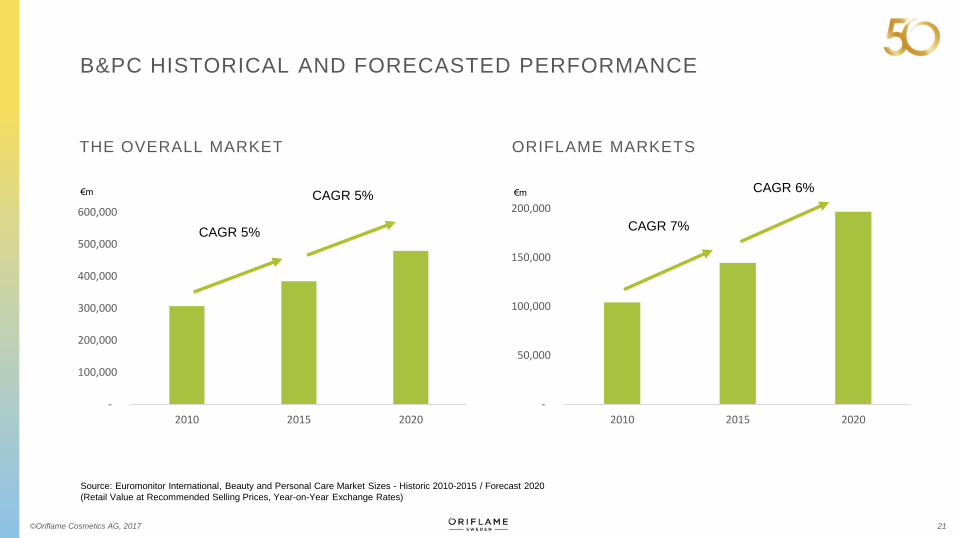
B&PC HISTORICAL AND FORECASTED PERFORMANCE
-
100,000
200,000
300,000
400,000
500,000
600,000
2010 2015 2020
€m
CAGR 5%
CAGR 5%
THE OVERALL MARKET
-
50,000
100,000
150,000
200,000
2010 2015 2020
€m
CAGR 7%
CAGR 6%
ORIFLAME MARKETS
Source: Euromonitor International, Beauty and Personal Care Market Sizes - Historic 2010-2015 / Forecast 2020
(Retail Value at Recommended Selling Prices, Year-on-Year Exchange Rates)
©Oriflame Cosmetics AG, 2017 22
AlgeriaBelarus
China
Czech Republic
ColombiaEgypt
Greece
India Indonesia
Kazakhstan
Mexico
MoroccoPeru
Poland
Romania
Russia
Spain
Sweden
Turkey
Ukrai…
United Kingdom
USA
Brazil
0
100
200
300
400
500
600
700
800
0 10,000 20,000 30,000 40,000 50,000 60,000
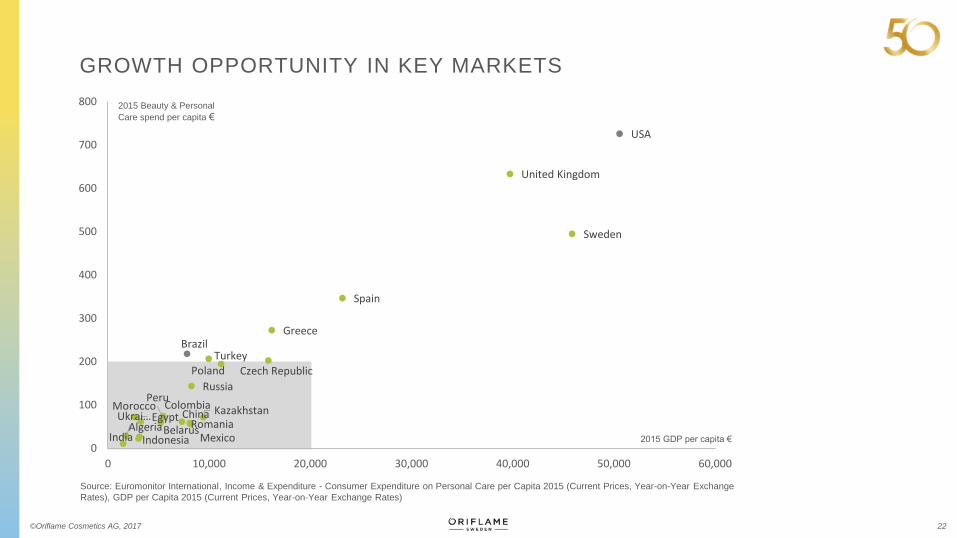
2015 GDP per capita €
2015 Beauty & Personal
Care spend per capita €
GROWTH OPPORTUNITY IN KEY MARKETS
Source: Euromonitor International, Income & Expenditure - Consumer Expenditure on Personal Care per Capita 2015 (Current Prices, Year-on-Year Exchange
Rates), GDP per Capita 2015 (Current Prices, Year-on-Year Exchange Rates)
23
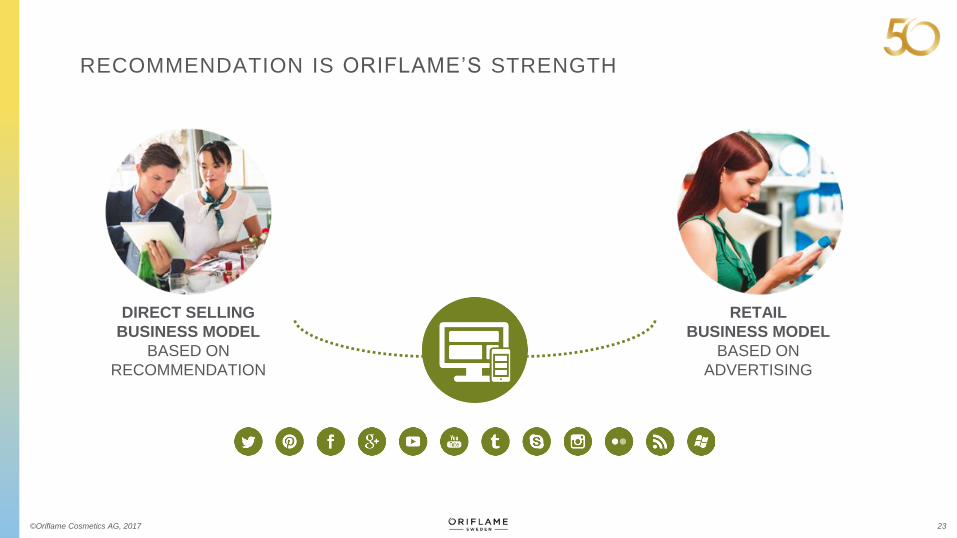
RETAIL
BUSINESS MODEL
BASED ON
ADVERTISING
DIRECT SELLING
BUSINESS MODEL
BASED ON
RECOMMENDATION
RECOMMENDATION IS ORIFLAME’S STRENGTH
©Oriflame Cosmetics AG, 2017
24
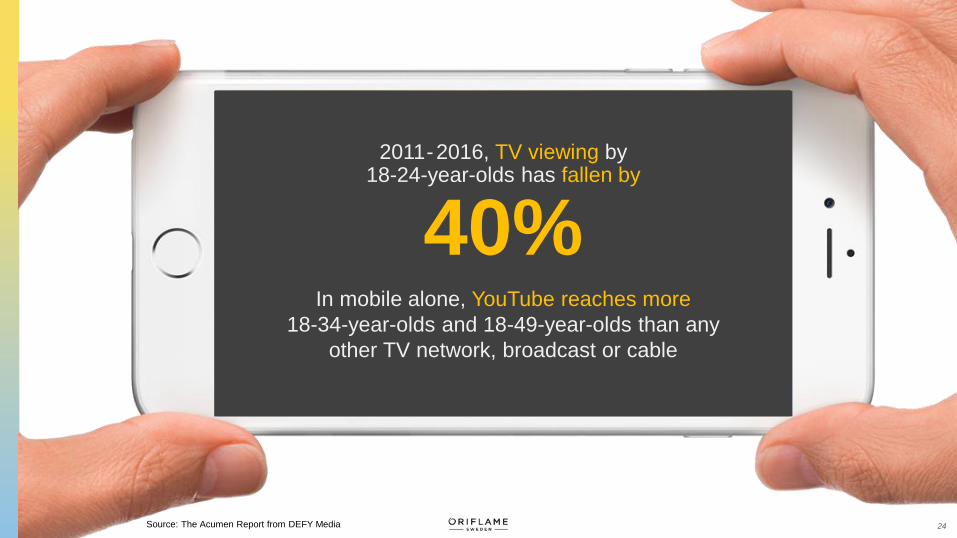
2011-2016, TV viewing by 18-24-year-olds has fallen by
40%In mobile alone, YouTube reaches more
18-34-year-olds and 18-49-year-olds than any
other TV network, broadcast or cable
Source: The Acumen Report from DEFY Media
25
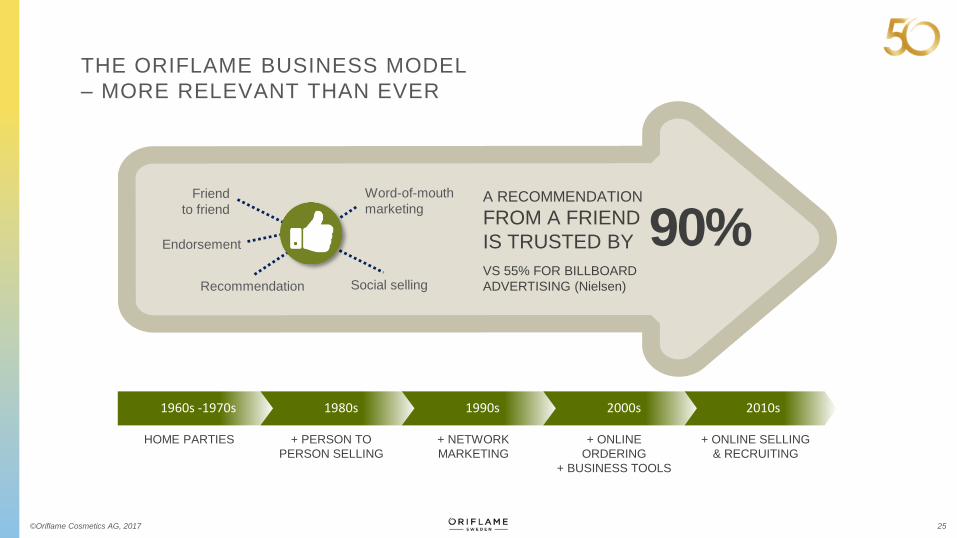
1960s -1970s 1980s 1990s 2000s
HOME PARTIES + PERSON TO
PERSON SELLING
+ NETWORK
MARKETING
+ ONLINE
ORDERING
+ BUSINESS TOOLS
2010s
+ ONLINE SELLING
& RECRUITING
A RECOMMENDATION
FROM A FRIEND
IS TRUSTED BY
VS 55% FOR BILLBOARD
ADVERTISING (Nielsen)
90%Word-of-mouth
marketing
Recommendation
Endorsement
Friend
to friend
Social selling
THE ORIFLAME BUSINESS MODEL
– MORE RELEVANT THAN EVER
©Oriflame Cosmetics AG, 2017
26
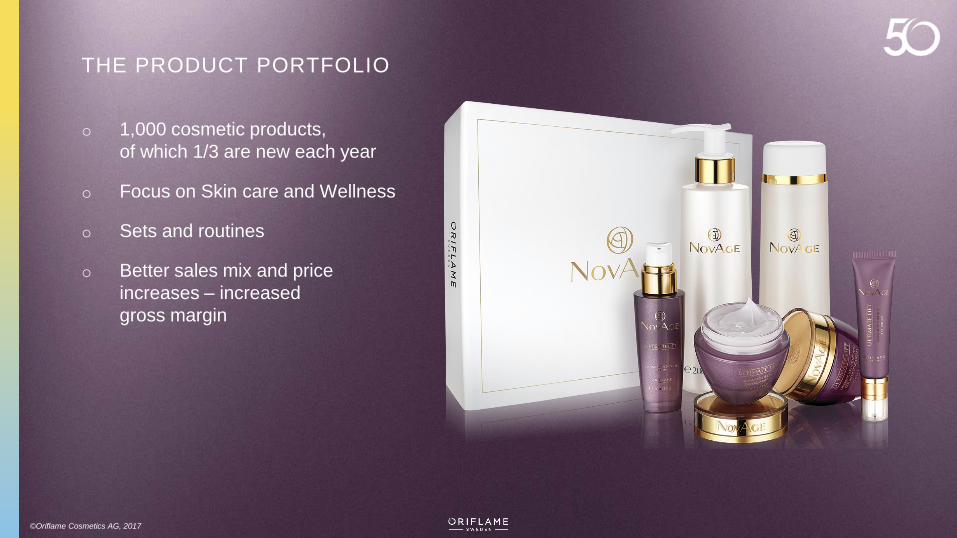
THE PRODUCT PORTFOLIO
o 1,000 cosmetic products,
of which 1/3 are new each year
o Focus on Skin care and Wellness
o Sets and routines
o Better sales mix and price
increases – increased
gross margin
©Oriflame Cosmetics AG, 2017
27
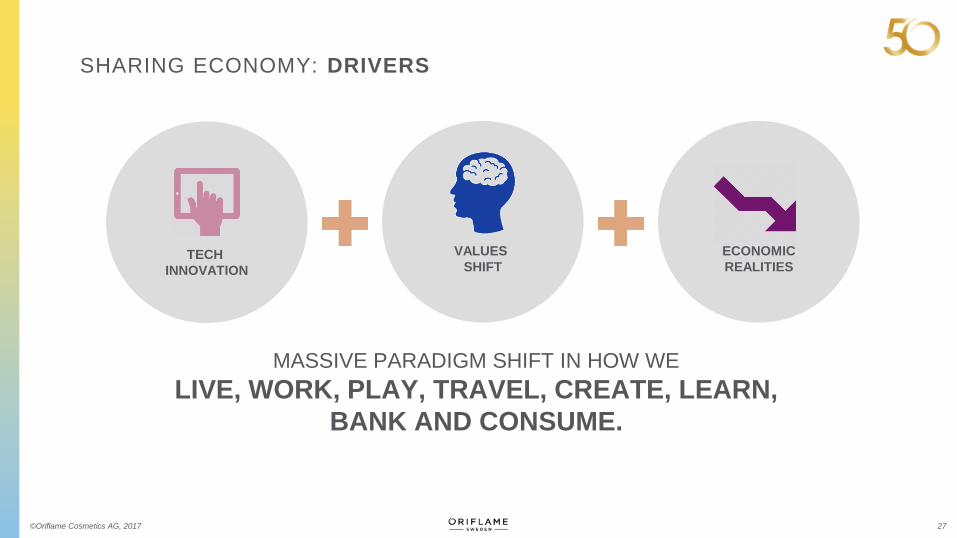
MASSIVE PARADIGM SHIFT IN HOW WE
LIVE, WORK, PLAY, TRAVEL, CREATE, LEARN,
BANK AND CONSUME.
TECH
INNOVATION
VALUES
SHIFT
ECONOMIC
REALITIES
SHARING ECONOMY: DRIVERS
©Oriflame Cosmetics AG, 2017
28
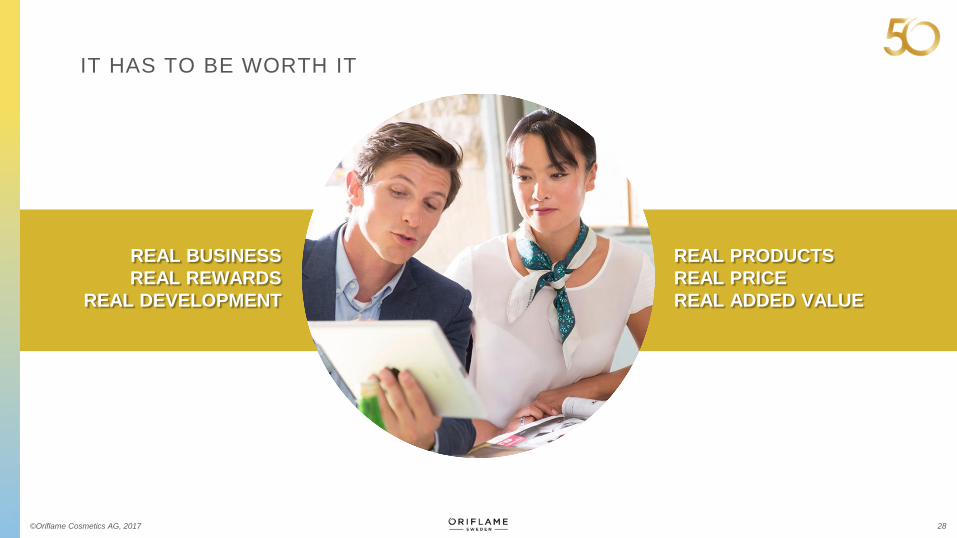
REAL BUSINESS
REAL REWARDS
REAL DEVELOPMENT
REAL PRODUCTS
REAL PRICE
REAL ADDED VALUE
IT HAS TO BE WORTH IT
©Oriflame Cosmetics AG, 2017
29
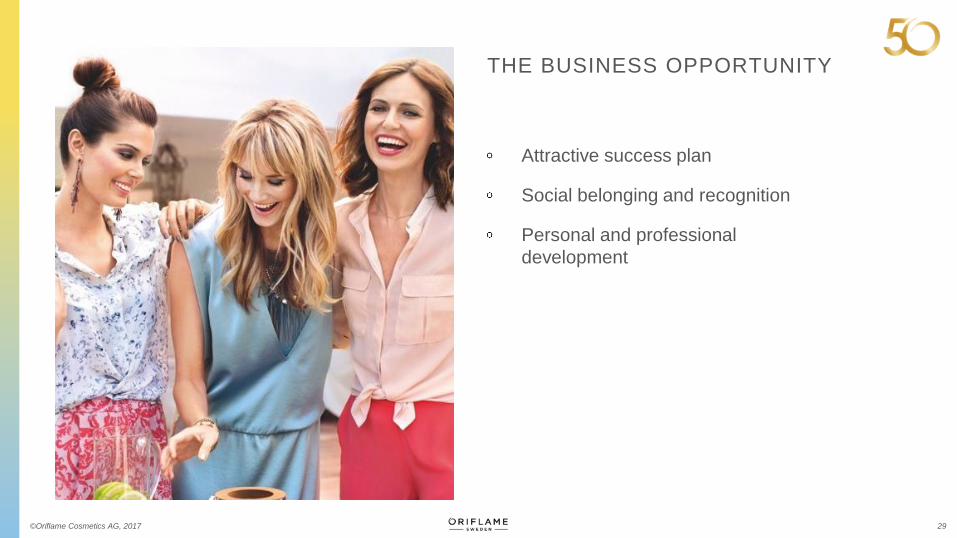
Attractive success plan
Social belonging and recognition
Personal and professional
development
©Oriflame Cosmetics AG, 2017
THE BUSINESS OPPORTUNITY
30©Oriflame Cosmetics AG, 2017
31
”ECONOMY BASED ON HUMAN
INTERACTION”
SHARING ECONOMY
©Oriflame Cosmetics AG, 2017
32
MORE THAN A BUSINESS
FUN BELIEF
AMBITION
CURIOUSITY
LEADERSHIP
CULTURE©Oriflame Cosmetics AG, 2017
33©Oriflame Cosmetics AG, 2017

34
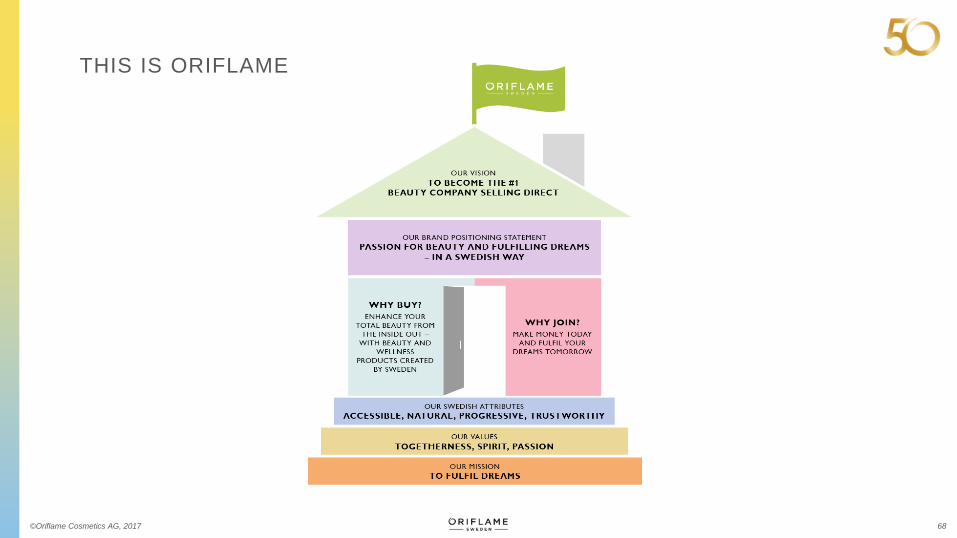
THIS IS ORIFLAME
©Oriflame Cosmetics AG, 2017
©Oriflame Cosmetics AG, 2017 35
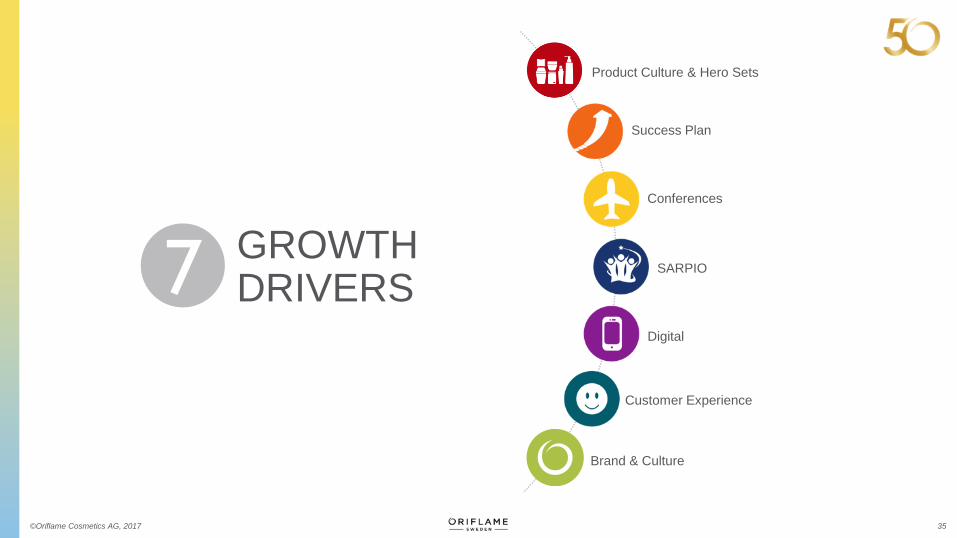
GROWTHDRIVERS7
Product Culture & Hero Sets
Success Plan
Conferences
SARPIO
Digital
Customer Experience
Brand & Culture
Alexandra de Greck
Michael Cervell
Antonia Simon-Stenberg
February 16, 2017
Selected growth drivers
©Oriflame Cosmetics AG, 2017 37
PRODUCT CULTURE & HERO SETS
Alexandra de Greck, VP Global Product Marketing
February 16, 2017
©Oriflame Cosmetics AG, 2017 38
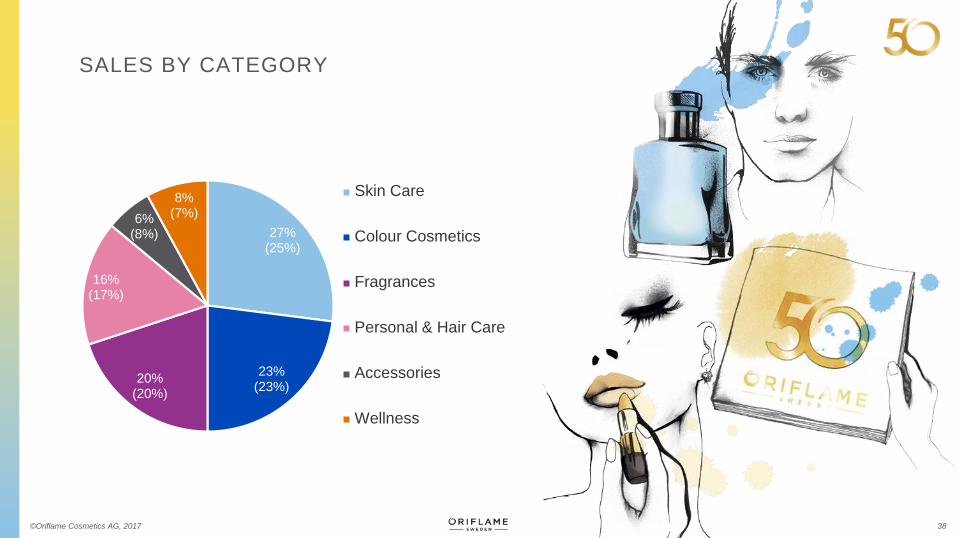
27%(25%)
23%(23%)
20%(20%)
16%(17%)
6%(8%)
8%(7%)
Skin Care
Colour Cosmetics
Fragrances
Personal & Hair Care
Accessories
Wellness
SALES BY CATEGORY
39©Oriflame Cosmetics AG, 2017
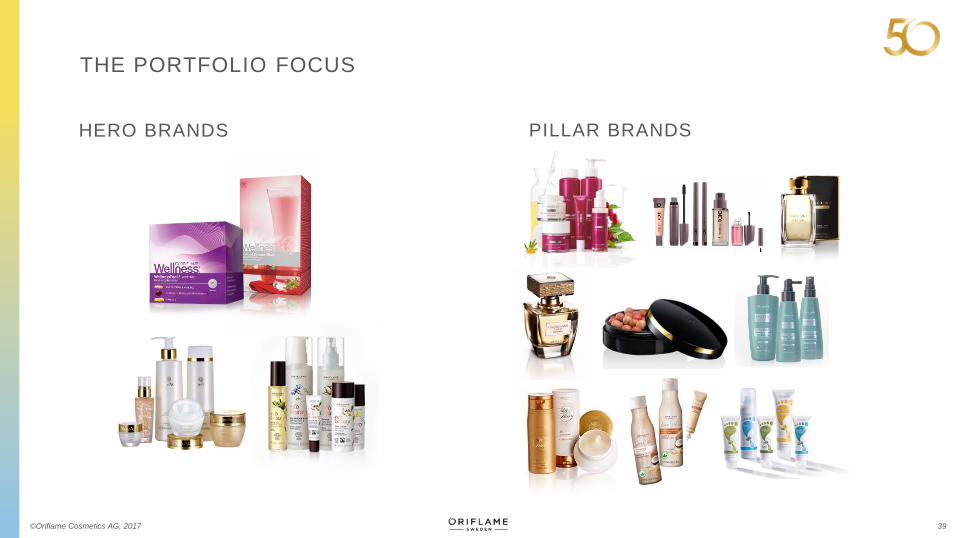
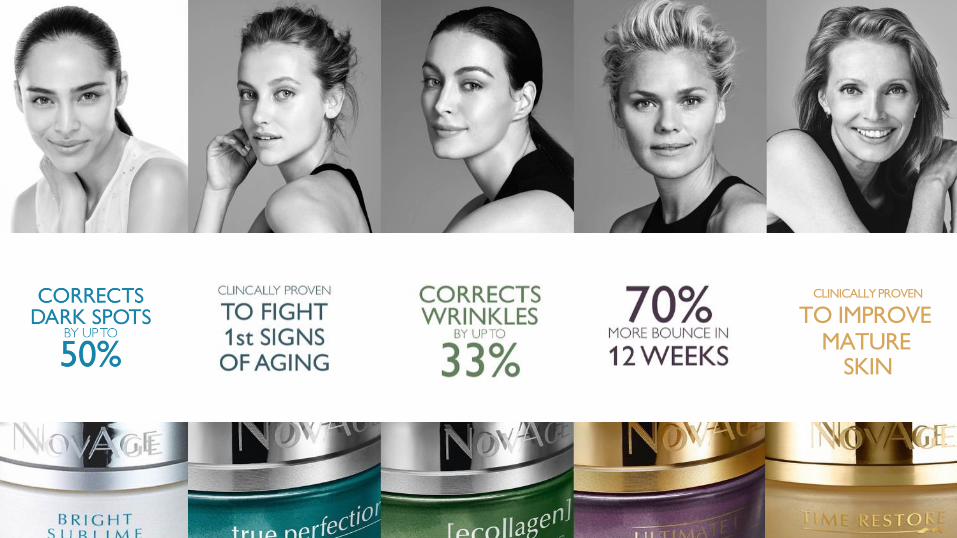
HERO BRANDS PILLAR BRANDS
THE PORTFOLIO FOCUS
40
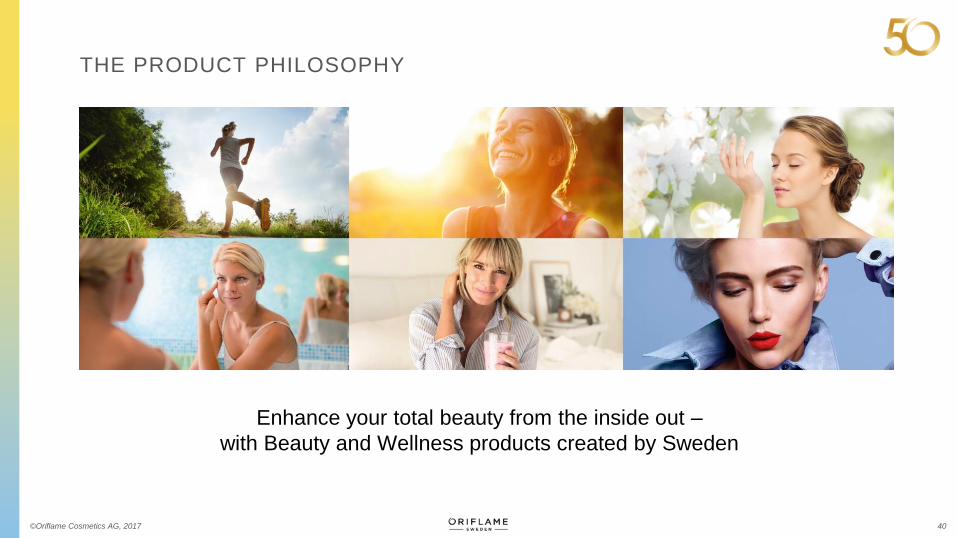
Enhance your total beauty from the inside out –
with Beauty and Wellness products created by Sweden
THE PRODUCT PHILOSOPHY
©Oriflame Cosmetics AG, 2017

41
THE PRODUCT PHILOSOPHY
©Oriflame Cosmetics AG, 2017
42
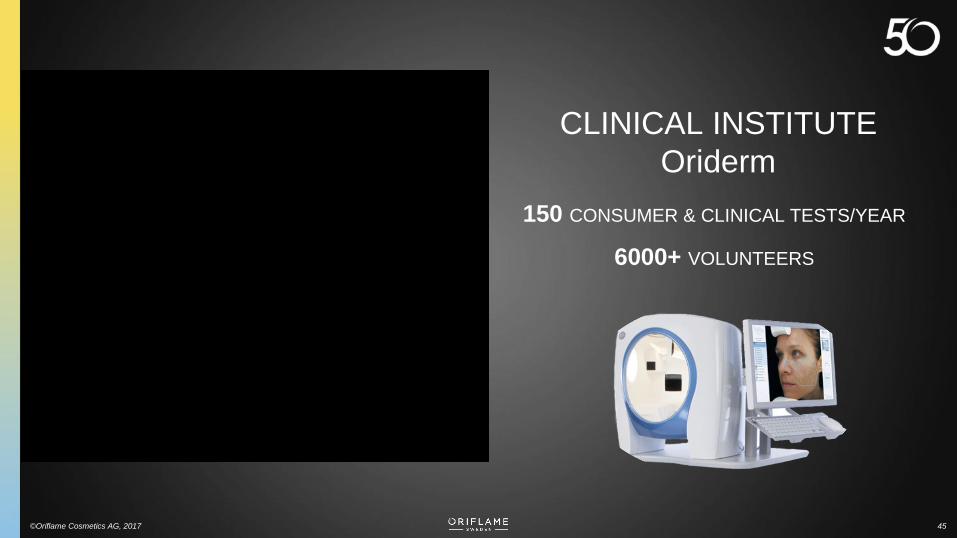
150 CONSUMER & CLINICAL TESTS/YEAR
6000+ VOLUNTEERS
CLINICAL INSTITUTE
Oriderm
©Oriflame Cosmetics AG, 2017 45
4343
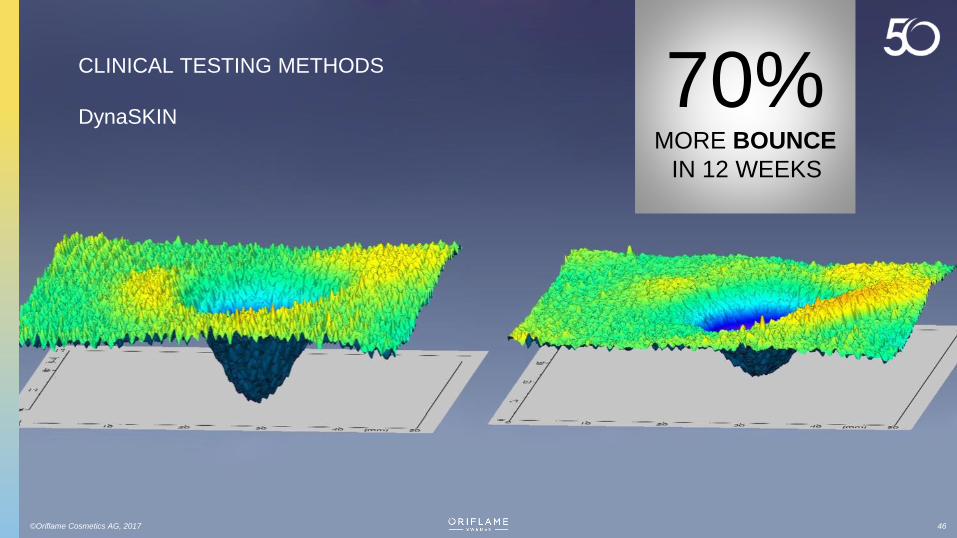
70%MORE BOUNCE
IN 12 WEEKS
CLINICAL TESTING METHODS
DynaSKIN
©Oriflame Cosmetics AG, 2017 46
444444
CLINICALLY PROVEN
TO IMPROVE MATURE
SKIN
45
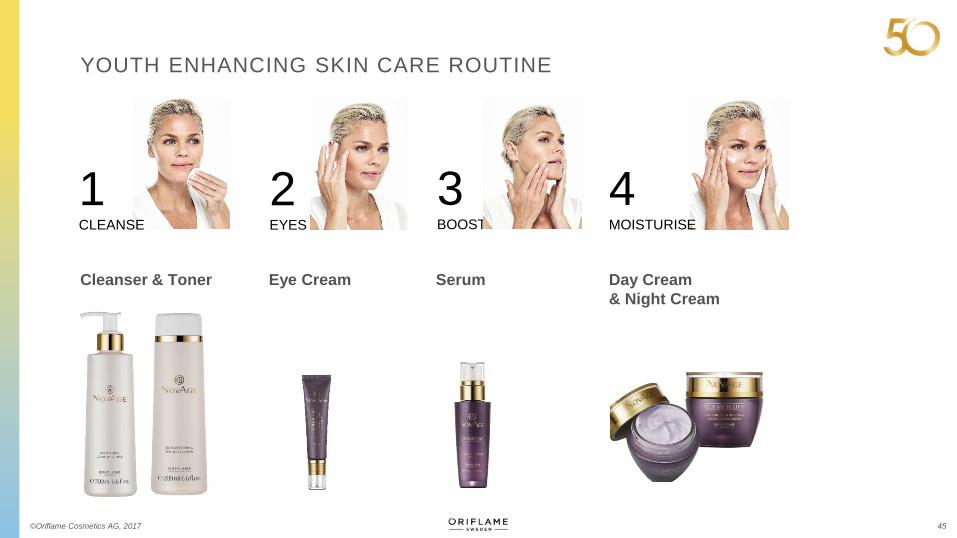
1CLEANSE
4MOISTURISE
2EYES
3BOOST
Cleanser & Toner Eye Cream Serum Day Cream
& Night Cream
YOUTH ENHANCING SKIN CARE ROUTINE
©Oriflame Cosmetics AG, 2017
46©Oriflame Cosmetics AG, 2017
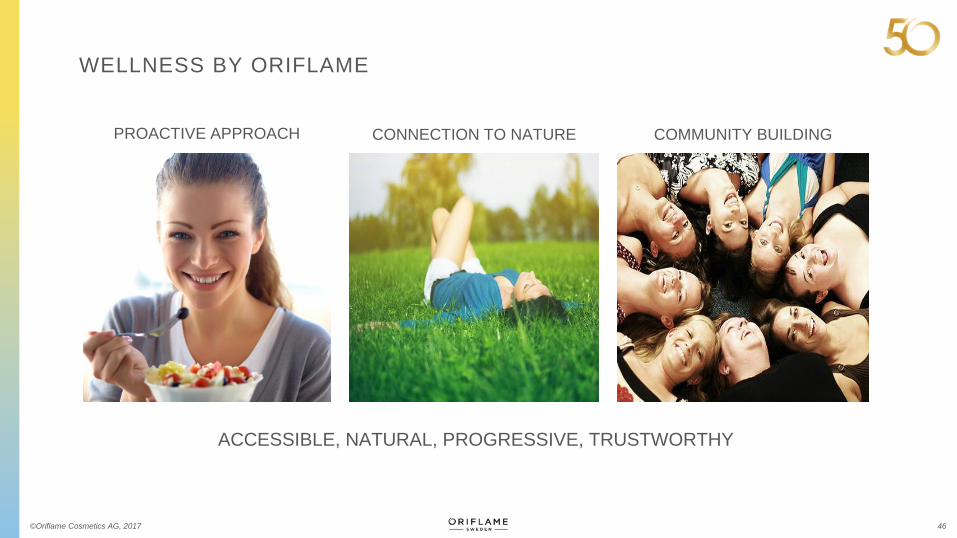
PROACTIVE APPROACH CONNECTION TO NATURE COMMUNITY BUILDING
ACCESSIBLE, NATURAL, PROGRESSIVE, TRUSTWORTHY
WELLNESS BY ORIFLAME

47
©Oriflame Cosmetics AG, 2017 48
1. COMPANY – Business Growth
2. CONSUMER – Best Result & Best Value
3. SELLER – Added Value Proposition
4. LEADER – Recruitment & Business Growth
SKIN CARE AND WELLNESS SETS
©Oriflame Cosmetics AG, 2017 49
Michael Cervell, SVP Global Direct Sales
February 16, 2017
SUCCESS PLAN
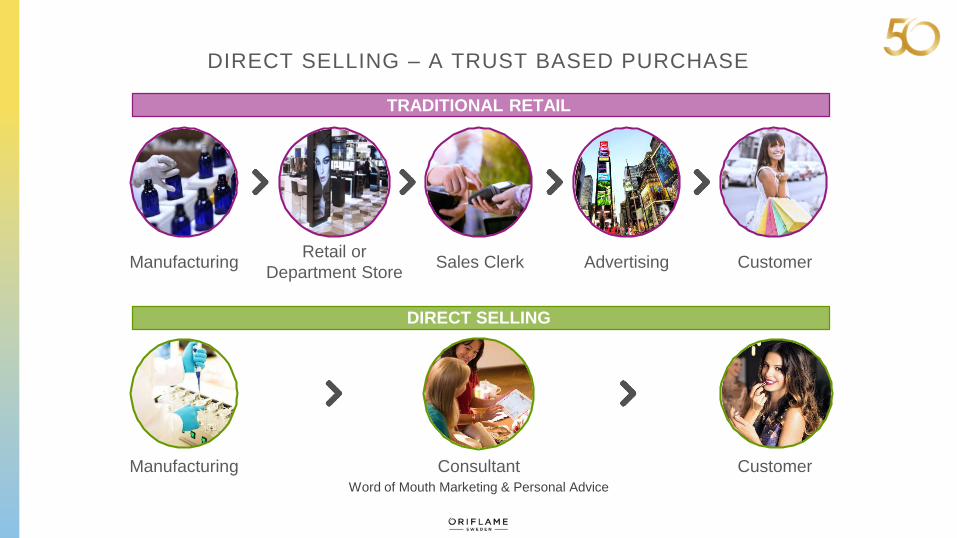
ManufacturingRetail or
Department StoreSales Clerk Advertising Customer
TRADITIONAL RETAIL
DIRECT SELLING
Manufacturing Consultant CustomerWord of Mouth Marketing & Personal Advice
DIRECT SELLING – A TRUST BASED PURCHASE
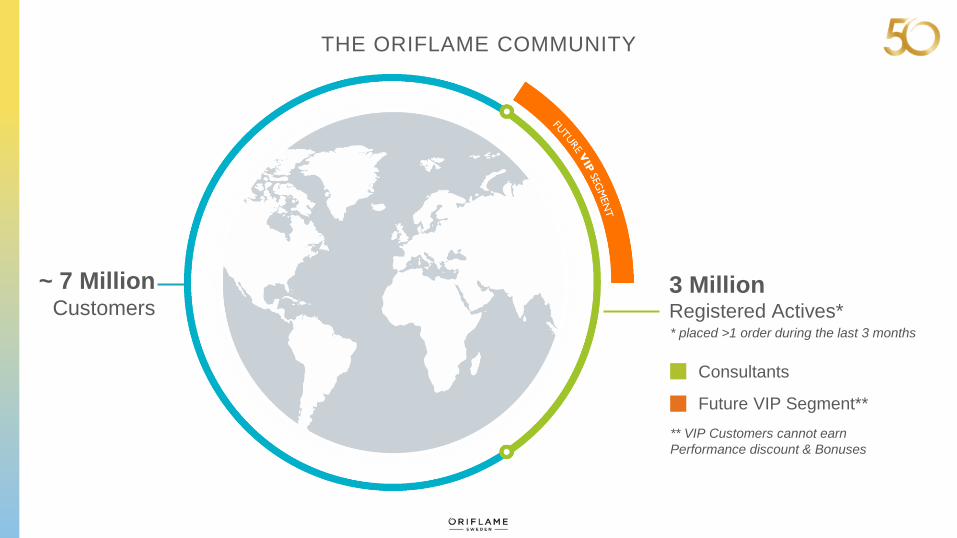
~ 7 MillionCustomers
3 MillionRegistered Actives* * placed >1 order during the last 3 months
Future VIP Segment**
Consultants
** VIP Customers cannot earn
Performance discount & Bonuses
THE ORIFLAME COMMUNITY
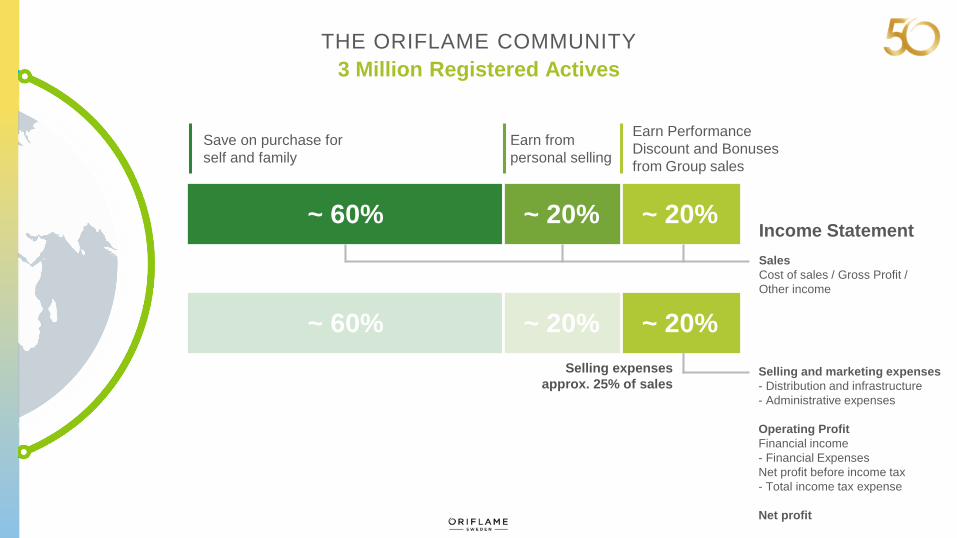
THE ORIFLAME COMMUNITY
3 Million Registered Actives
~ 60% ~ 20% ~ 20%
Save on purchase for
self and family
Earn from
personal selling
Earn Performance
Discount and Bonuses
from Group sales
Income Statement
Sales
Cost of sales / Gross Profit /
Other income
Selling and marketing expenses
- Distribution and infrastructure
- Administrative expenses
Operating Profit
Financial income
- Financial Expenses
Net profit before income tax
- Total income tax expense
Net profit
Selling expenses
approx. 25% of sales
~ 60% ~ 20% ~ 20%
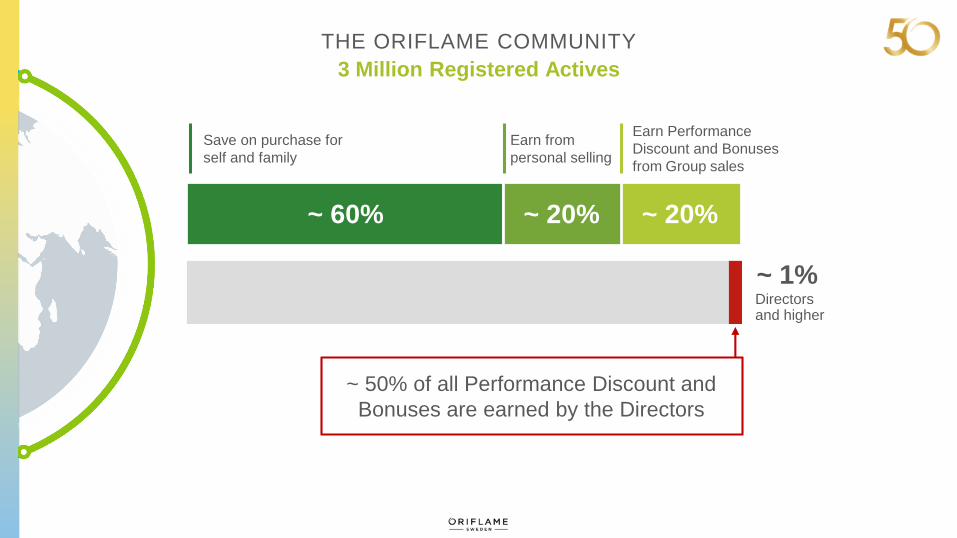
THE ORIFLAME COMMUNITY
3 Million Registered Actives
~ 60% ~ 20% ~ 20%
Save on purchase for
self and family
Earn from
personal selling
Earn Performance
Discount and Bonuses
from Group sales
~ 1%Directorsand higher
~ 50% of all Performance Discount and
Bonuses are earned by the Directors
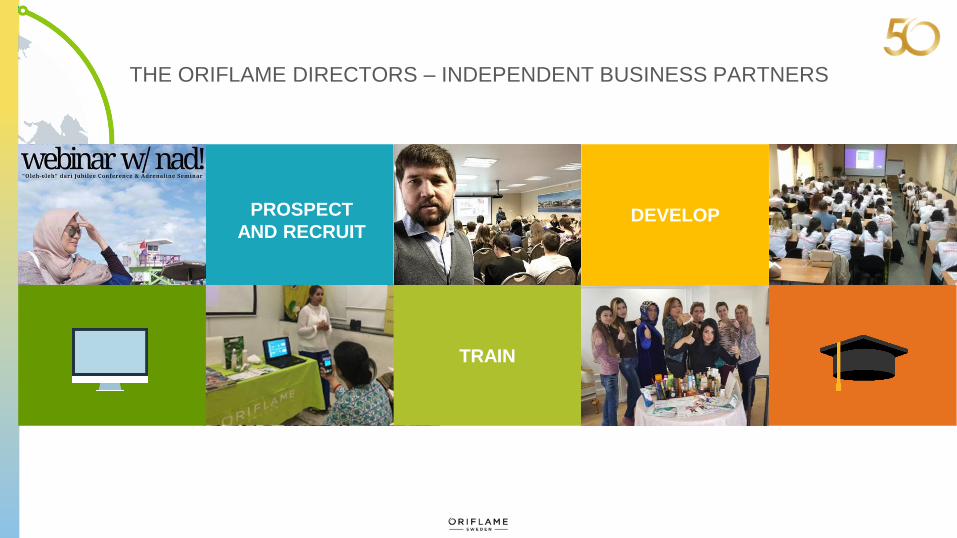
PROSPECT
AND RECRUIT
TRAIN
DEVELOP
THE ORIFLAME DIRECTORS – INDEPENDENT BUSINESS PARTNERS
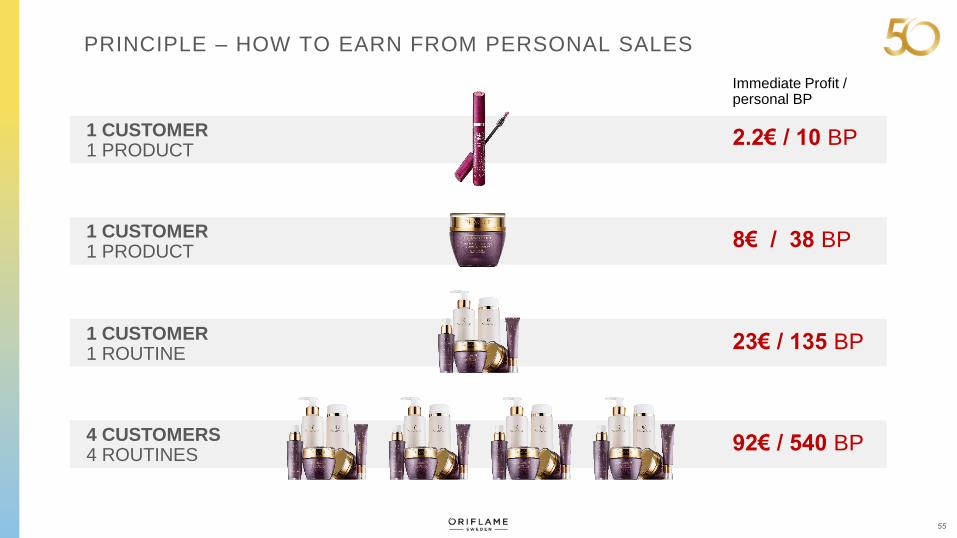
55
Immediate Profit / personal BP
1 CUSTOMER1 PRODUCT
2.2€ / 10 BP
1 CUSTOMER1 PRODUCT
8€ / 38 BP
1 CUSTOMER1 ROUTINE
23€ / 135 BP
4 CUSTOMERS4 ROUTINES
92€ / 540 BP
PRINCIPLE – HOW TO EARN FROM PERSONAL SALES
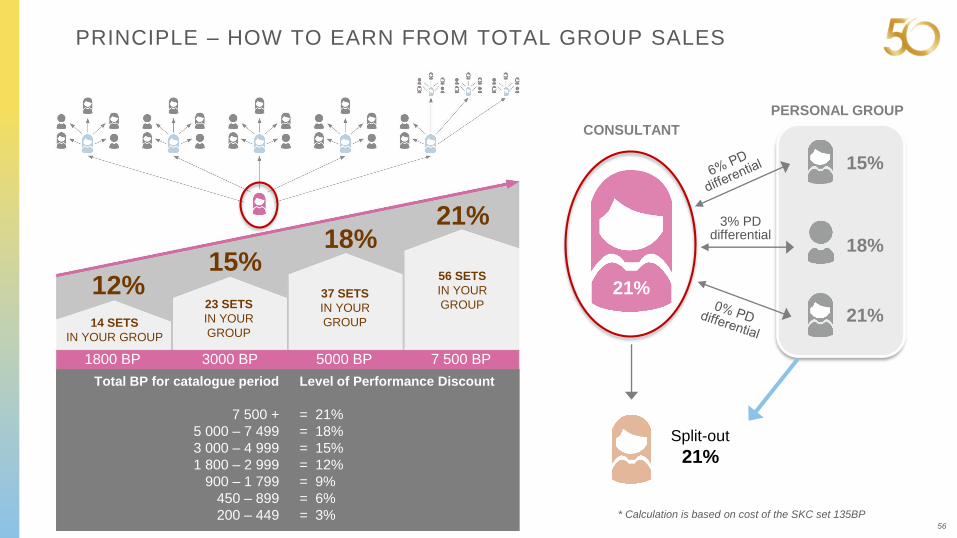
56
12%15%
18%21%
1800 BP 3000 BP 5000 BP 7 500 BP
14 SETS
IN YOUR GROUP
23 SETS
IN YOUR
GROUP
37 SETS
IN YOUR
GROUP
56 SETS
IN YOUR
GROUP
Total BP for catalogue period
7 500 +
5 000 – 7 499
3 000 – 4 999
1 800 – 2 999
900 – 1 799
450 – 899
200 – 449
Level of Performance Discount
= 21%
= 18%
= 15%
= 12%
= 9%
= 6%
= 3%
Split-out
21%
21%
CONSULTANT
PERSONAL GROUP
* Calculation is based on cost of the SKC set 135BP
PRINCIPLE – HOW TO EARN FROM TOTAL GROUP SALES
3% PDdifferential
15%
18%
21%
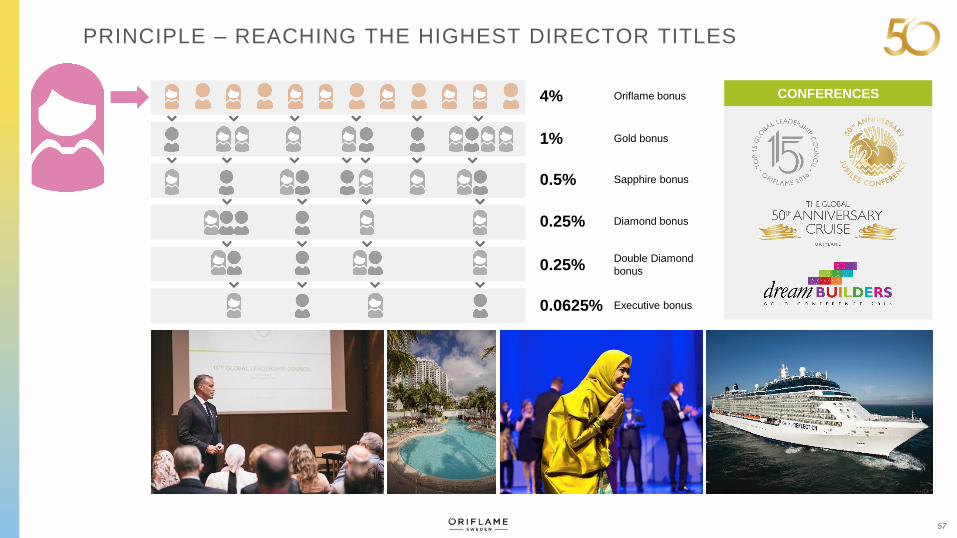
57
CONFERENCES
PRINCIPLE – REACHING THE HIGHEST DIRECTOR TITLES
Oriflame bonus4%
0.0625%
0.25%
0.25%
0.5%
1% Gold bonus
Executive bonus
Double Diamond
bonus
Diamond bonus
Sapphire bonus
58
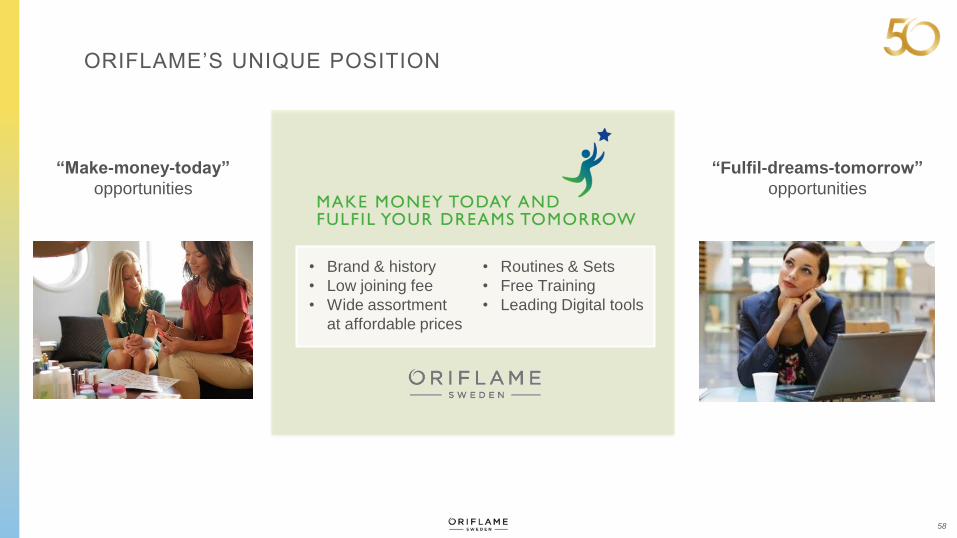
• Brand & history
• Low joining fee
• Wide assortment
at affordable prices
• Routines & Sets
• Free Training
• Leading Digital tools
“Make-money-today”
opportunities
“Fulfil-dreams-tomorrow”
opportunities
ORIFLAME’S UNIQUE POSITION
©Oriflame Cosmetics AG, 2017 59
Michael Cervell, SVP Global Direct Sales
February 16, 2017
DIGITAL
60
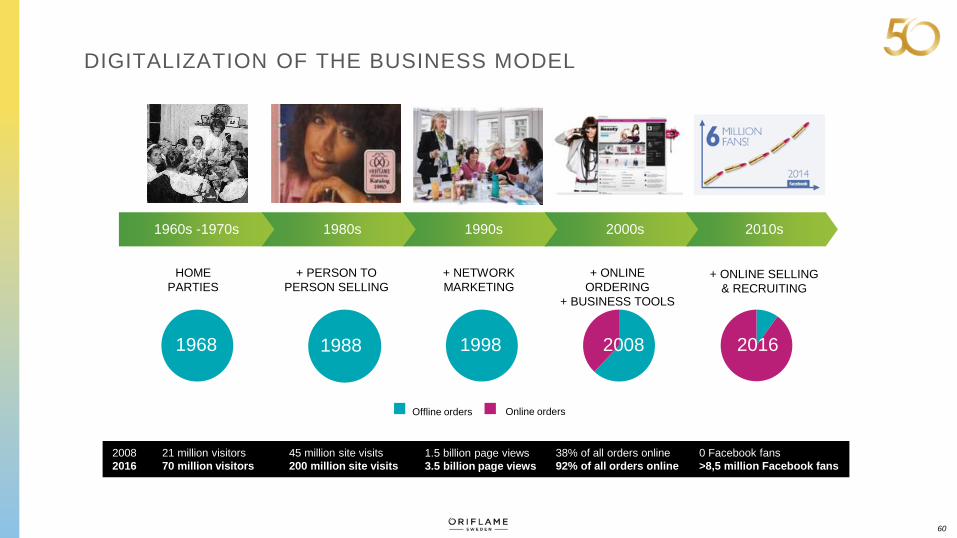
+ ONLINE SELLING
& RECRUITING
Offline orders Online orders
1968 1998 2008 2016
1960s -1970s 1980s 1990s 2000s
HOME
PARTIES
+ PERSON TO
PERSON SELLING
+ NETWORK
MARKETING
+ ONLINE
ORDERING
+ BUSINESS TOOLS
2010s
1988
2008
2016
0 Facebook fans
>8,5 million Facebook fans
38% of all orders online
92% of all orders online
1.5 billion page views
3.5 billion page views
21 million visitors
70 million visitors
45 million site visits
200 million site visits
DIGITALIZATION OF THE BUSINESS MODEL
62
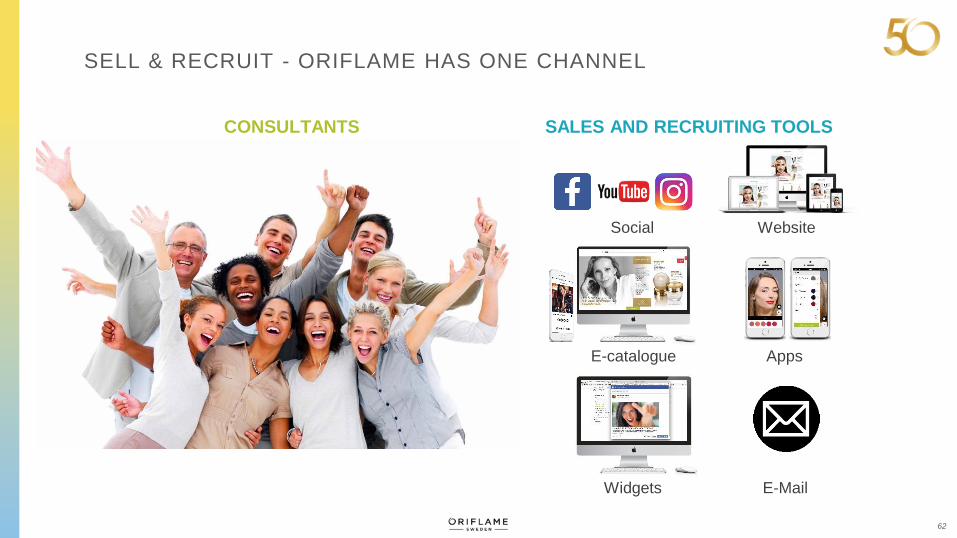
CONSULTANTS SALES AND RECRUITING TOOLS
Website
Apps
Social
Widgets
E-catalogue
SELL & RECRUIT - ORIFLAME HAS ONE CHANNEL
63
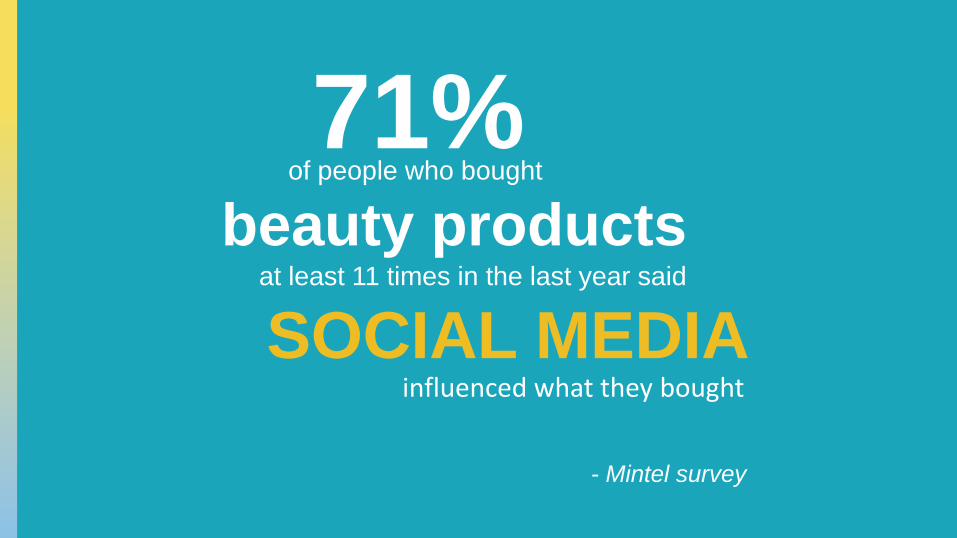
71%of people who bought
beauty productsat least 11 times in the last year said
SOCIAL MEDIAinfluenced what they bought
- Mintel survey
64©Oriflame Cosmetics AG, 2017
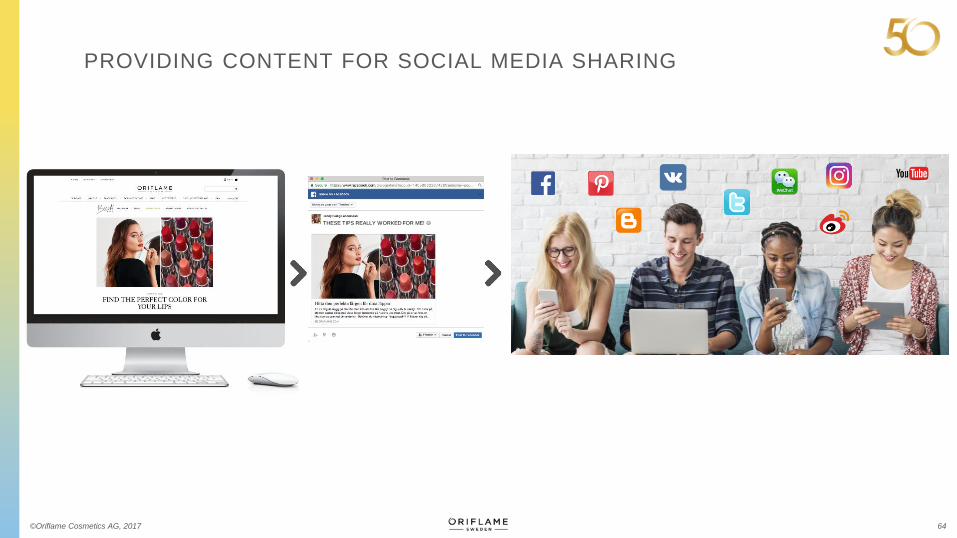
THESE TIPS REALLY WORKED FOR ME!
PROVIDING CONTENT FOR SOCIAL MEDIA SHARING
65©Oriflame Cosmetics AG, 2017
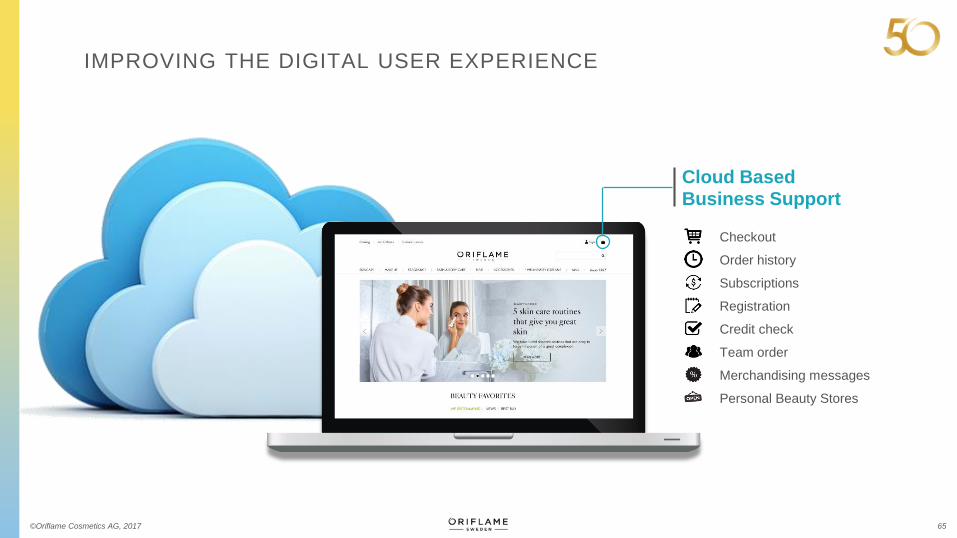
Cloud BasedBusiness Support
Checkout
Subscriptions
Personal Beauty Stores
Registration
Order history
Team order
Credit check
Merchandising messages
IMPROVING THE DIGITAL USER EXPERIENCE
66
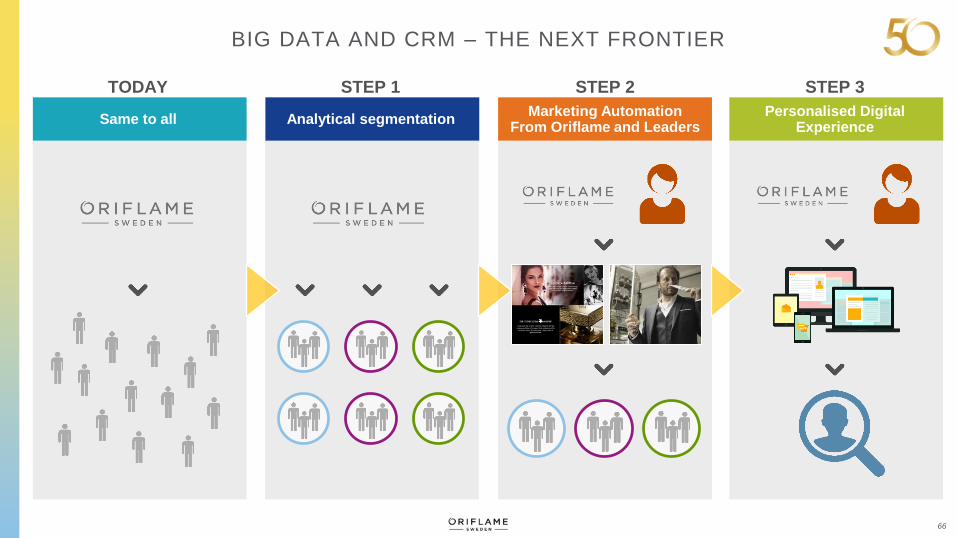
BIG DATA AND CRM – THE NEXT FRONTIER
TODAY
Same to all Analytical segmentation
STEP 1
Marketing AutomationFrom Oriflame and Leaders
STEP 2
Personalised Digital Experience
STEP 3
©Oriflame Cosmetics AG, 2017 67
Antonia Simon-Stenberg, VP Sustainability & Quality Management
February 16, 2017
SUSTAINABILITY
68
THIS IS ORIFLAME
©Oriflame Cosmetics AG, 2017
69©Oriflame Cosmetics AG, 2017
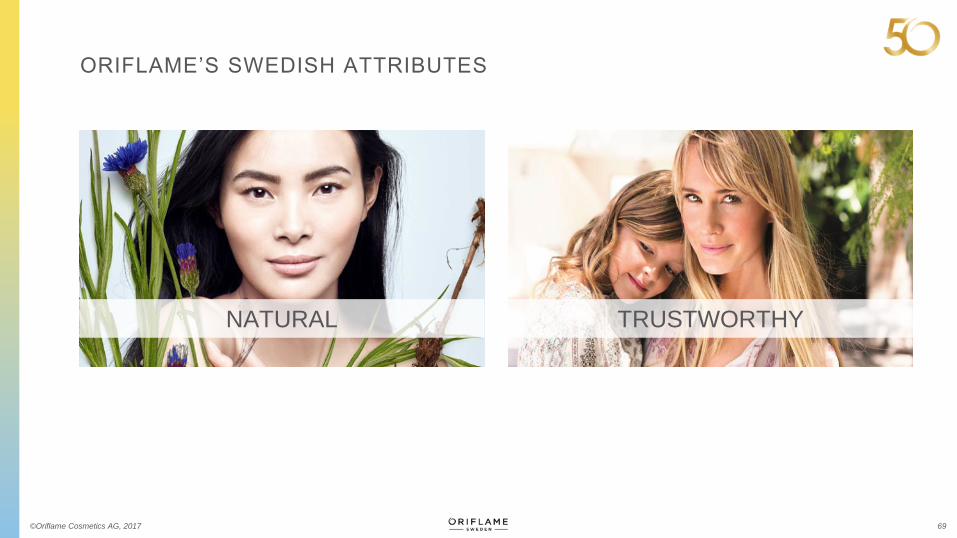
NATURAL TRUSTWORTHY
ORIFLAME’S SWEDISH ATTRIBUTES
7077
71
PEOPLE PRODUCTS PLANET
©Oriflame Cosmetics AG, 2017
72
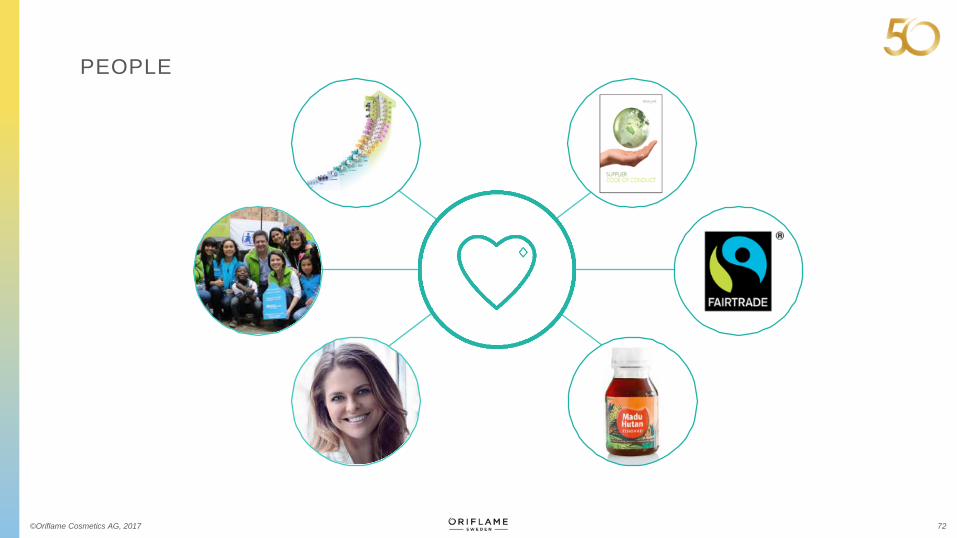
PEOPLE
©Oriflame Cosmetics AG, 2017
73
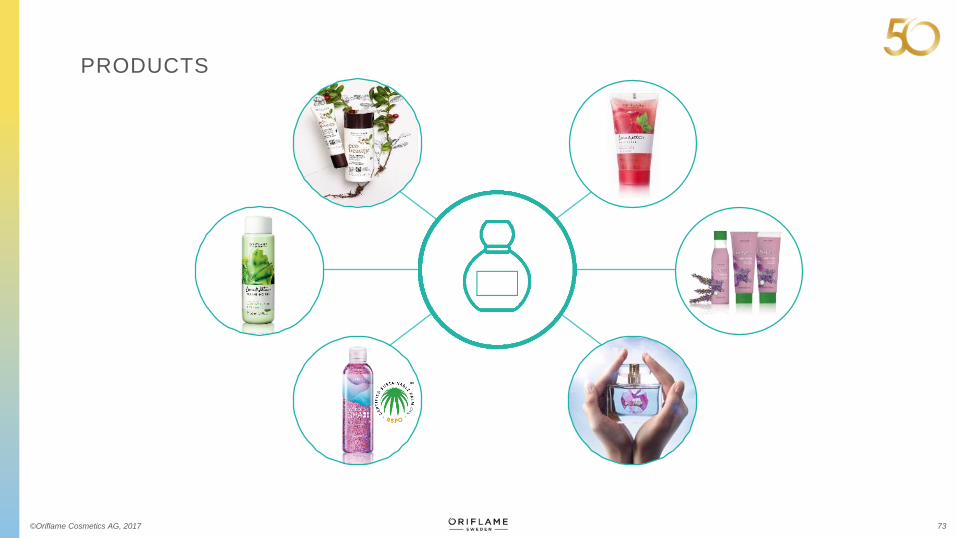
PRODUCTS
©Oriflame Cosmetics AG, 2017
74
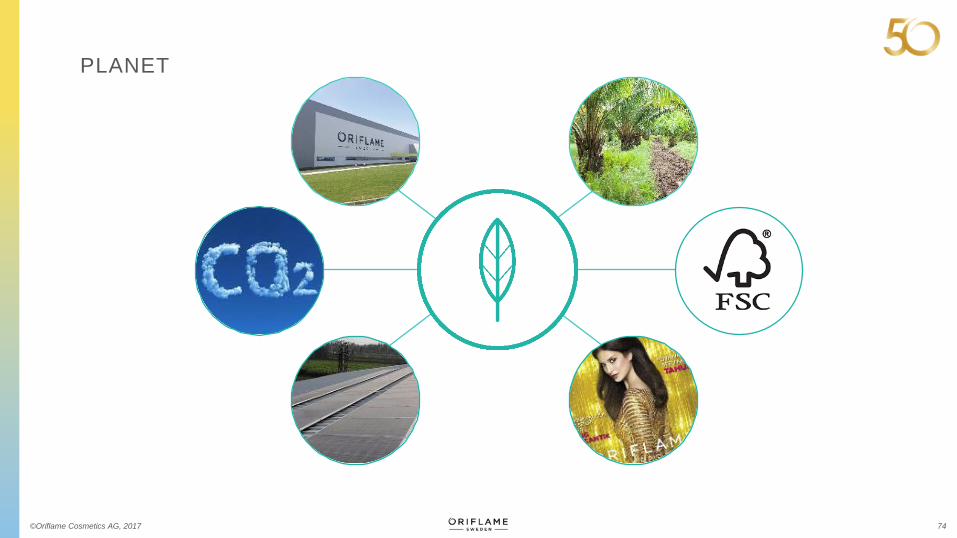
PLANET
©Oriflame Cosmetics AG, 2017
75
COMMUNICATION
©Oriflame Cosmetics AG, 2017
Magnus Brännström, CEO & President
Gabriel Bennet, CFO
February 16, 2017
Financial outlook & Concluding remarks
77©Oriflame Cosmetics AG, 2017
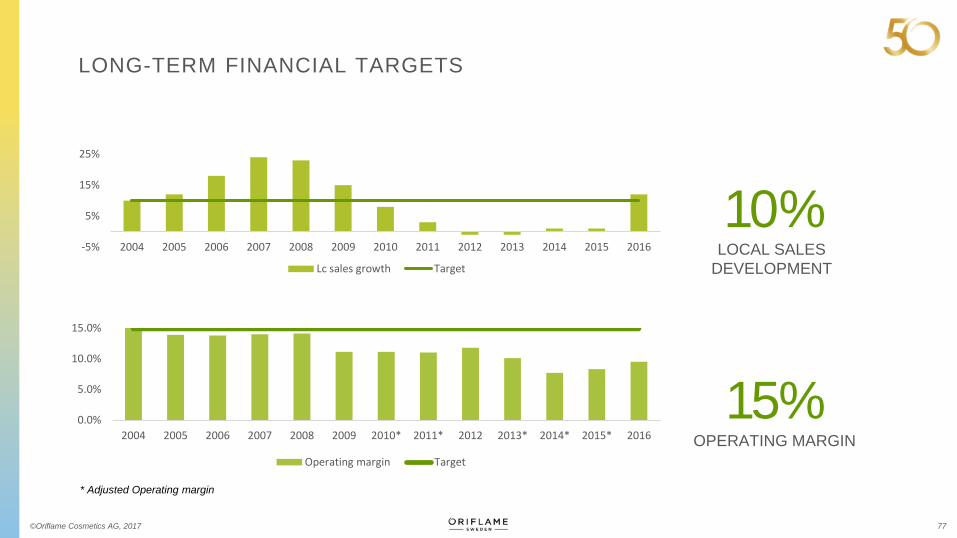
LONG-TERM FINANCIAL TARGETS
-5%
5%
15%
25%
2004 2005 2006 2007 2008 2009 2010 2011 2012 2013 2014 2015 2016
Lc sales growth Target
10%LOCAL SALES
DEVELOPMENT
15%OPERATING MARGIN
0.0%
5.0%
10.0%
15.0%
2004 2005 2006 2007 2008 2009 2010* 2011* 2012 2013* 2014* 2015* 2016
Operating margin Target
* Adjusted Operating margin
©Oriflame Cosmetics AG, 2017 78
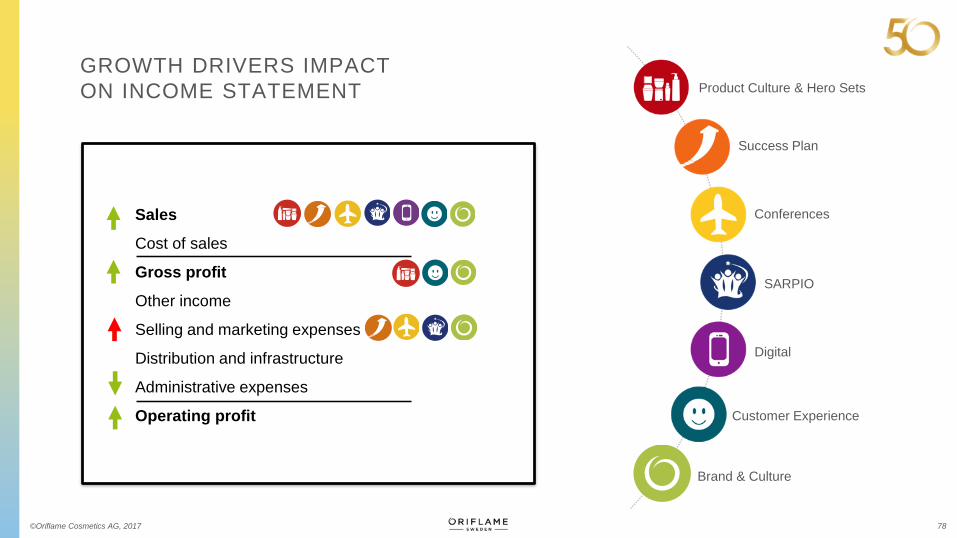
Sales
Cost of sales
Gross profit
Other income
Selling and marketing expenses
Distribution and infrastructure
Administrative expenses
Operating profit
GROWTH DRIVERS IMPACT
ON INCOME STATEMENT Product Culture & Hero Sets
Success Plan
Conferences
SARPIO
Digital
Customer Experience
Brand & Culture
©Oriflame Cosmetics AG, 2017 79
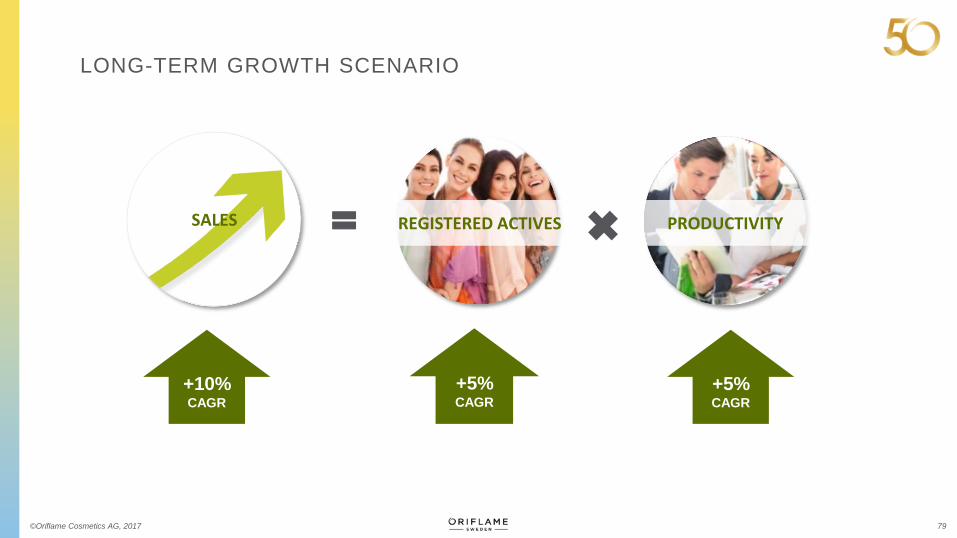
LONG-TERM GROWTH SCENARIO
REGISTERED ACTIVES PRODUCTIVITY
+10%CAGR
+5%CAGR
+5%CAGR
SALES =
80
0
2
4
6
8
10
12
14
16
18
20
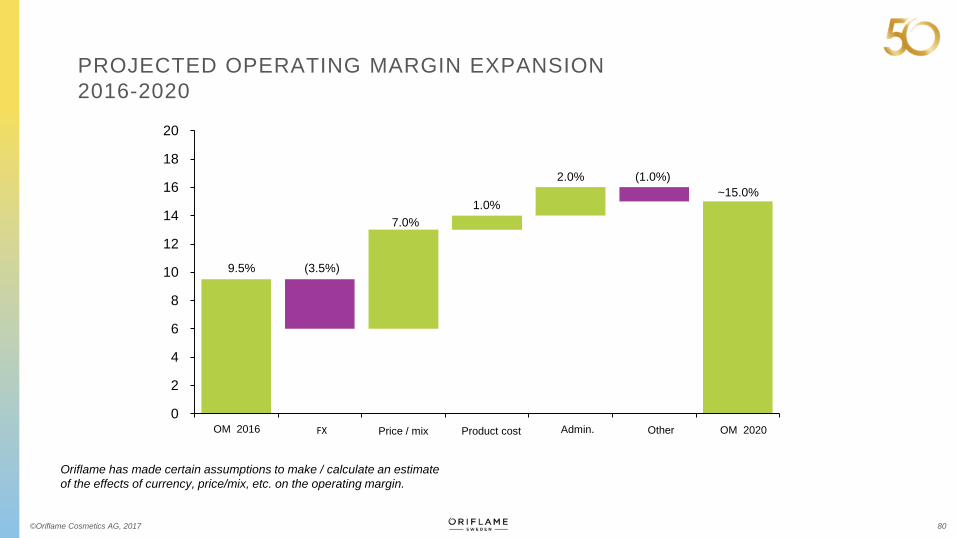
OM 2016
9.5% (3.5%)
FX OM 2020
7.0%
Price / mix Product cost Admin.
1.0%
2.0%
~15.0%
Other
PROJECTED OPERATING MARGIN EXPANSION
2016-2020
(1.0%)
©Oriflame Cosmetics AG, 2017
Oriflame has made certain assumptions to make / calculate an estimate
of the effects of currency, price/mix, etc. on the operating margin.
81
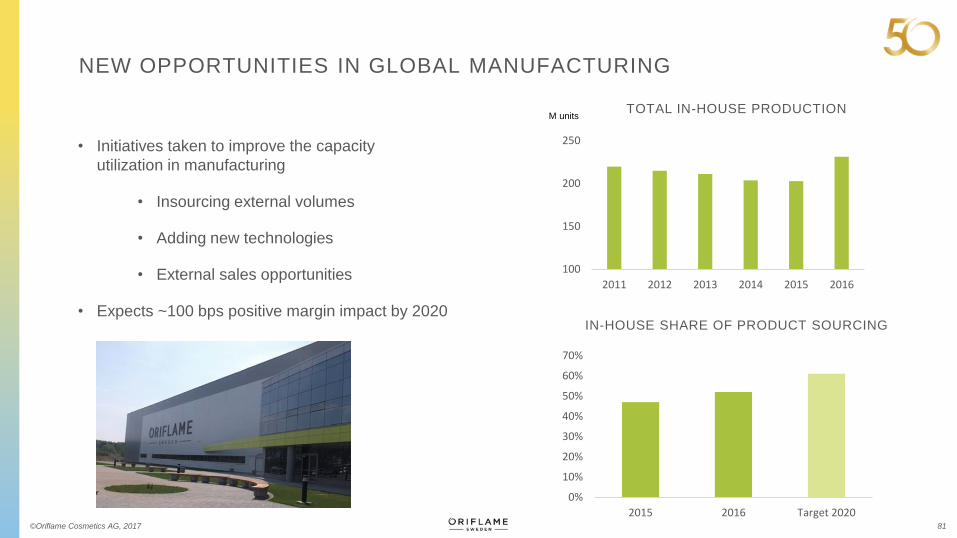
NEW OPPORTUNITIES IN GLOBAL MANUFACTURING
IN-HOUSE SHARE OF PRODUCT SOURCING
0%
10%
20%
30%
40%
50%
60%
70%
2015 2016 Target 2020
TOTAL IN-HOUSE PRODUCTIONM units
©Oriflame Cosmetics AG, 2017
• Initiatives taken to improve the capacity
utilization in manufacturing
• Insourcing external volumes
• Adding new technologies
• External sales opportunities
• Expects ~100 bps positive margin impact by 2020
100
150
200
250
2011 2012 2013 2014 2015 2016
82
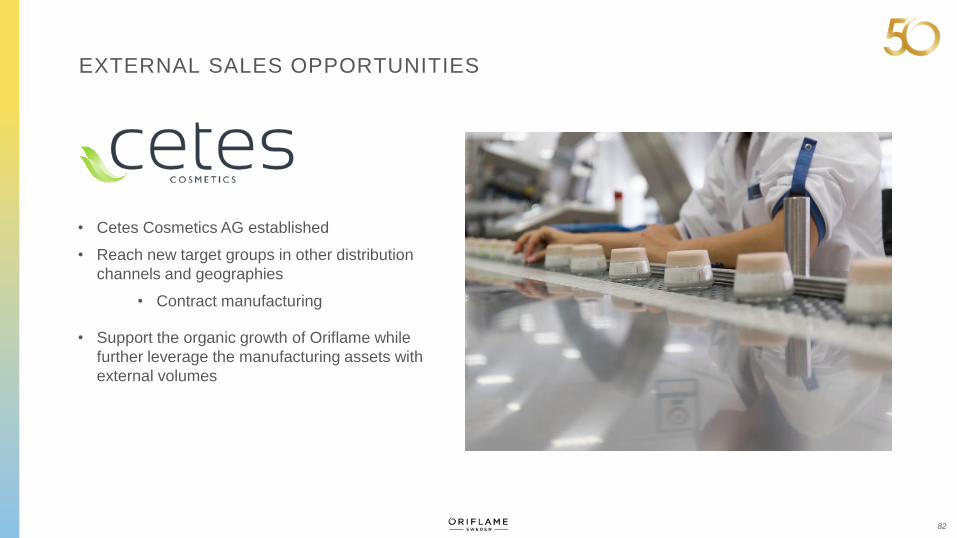
EXTERNAL SALES OPPORTUNITIES
• Cetes Cosmetics AG established
• Reach new target groups in other distribution
channels and geographies
• Contract manufacturing
• Support the organic growth of Oriflame while
further leverage the manufacturing assets with
external volumes
83
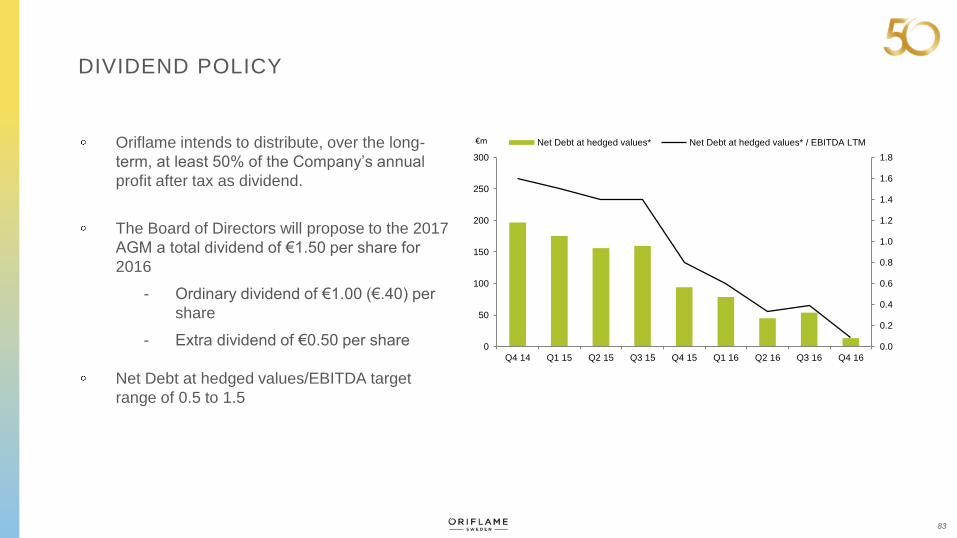
DIVIDEND POLICY
Oriflame intends to distribute, over the long-
term, at least 50% of the Company’s annual
profit after tax as dividend.
The Board of Directors will propose to the 2017
AGM a total dividend of €1.50 per share for
2016
- Ordinary dividend of €1.00 (€.40) per
share
- Extra dividend of €0.50 per share
Net Debt at hedged values/EBITDA target
range of 0.5 to 1.5
0.0
0.2
0.4
0.6
0.8
1.0
1.2
1.4
1.6
1.8
0
50
100
150
200
250
300
Q4 14 Q1 15 Q2 15 Q3 15 Q4 15 Q1 16 Q2 16 Q3 16 Q4 16
Net Debt at hedged values* Net Debt at hedged values* / EBITDA LTM€m
©Oriflame Cosmetics AG, 2017 84
CONCLUDING REMARKS
85
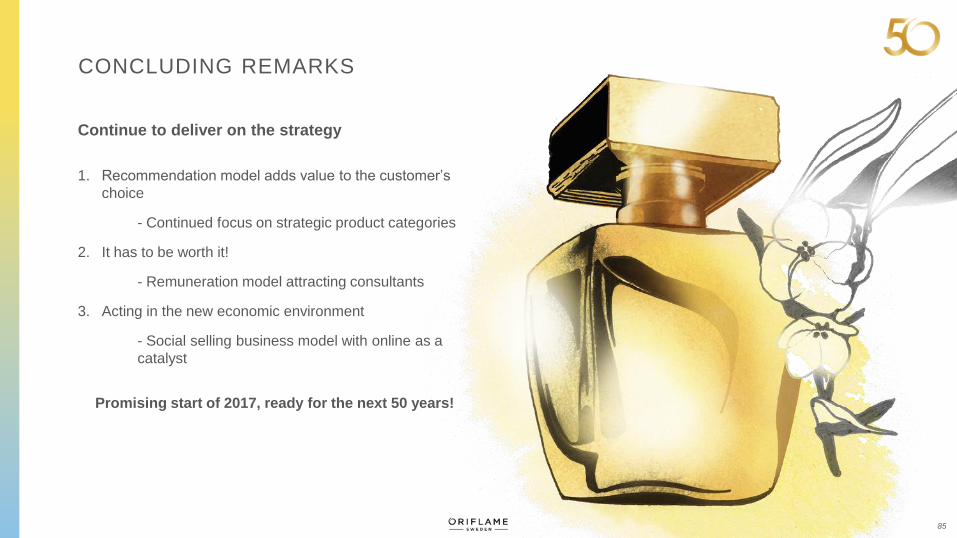
CONCLUDING REMARKS
Continue to deliver on the strategy
1. Recommendation model adds value to the customer’s
choice
- Continued focus on strategic product categories
2. It has to be worth it!
- Remuneration model attracting consultants
3. Acting in the new economic environment
- Social selling business model with online as a
catalyst
Promising start of 2017, ready for the next 50 years!
Q&A
©Oriflame Cosmetics AG, 2017 88
Some statements herein are forward-looking and the actual outcome could be materially different.
In addition to the factors explicitly commented upon, the actual outcome could be materially affected by other factors like,
for example, the effect of economic conditions, exchange-rate and interest-rate movements, political risks,
impact of competing products and their pricing, product development, commercialisation and supply disturbances.
CAUTIONARY STATEMENT