original article - pdfs.semanticscholar.org to hiroshi nakagawa, md, phd, heart rhythm institute,...
TRANSCRIPT

1174
Several experimental studies have shown that electrode-tis-sue contact force (CF) is a major determinant of lesion size
during radiofrequency ablation.1–7 Until recently, CF could not be measured directly by ablation catheters. As a result, surro-gate measures of CF have been proposed, including electrogram amplitude, preablation impedance, and changes during ablation in electrode temperature and impedance.1,3,4 The accuracy of these surrogate measures has not been extensively validated.
Clinical Perspective on p 1180
Recently, two designs of ablation catheters have been devel-oped to measure real-time catheter-tissue CF during catheter mapping and radiofrequency ablation. One type of catheter uses 3 optical fibers to measure CF as the microdeformation of a deformable body in the catheter tip (TactiCath, St. Jude Medical).8–12 The other catheter incorporates a small spring
connecting the ablation tip electrode to the catheter shaft and uses a magnetic transmitter and location sensors to measure CF as the microdeflection of the spring (THERMOCOOL SMARTTOUCH, Biosense Webster, Inc).13,14 In bench testing, both systems have a CF resolution of <1 g.8–14
Although clinical practice is suggesting that increasing CF improves radiofrequency lesion formation,11,12 there are no studies correlating radiofrequency lesion size to CF in the beating heart. The purpose of this study was to determine, in the canine beating heart: (1) the relationship between CF and radiofrequency lesion size, as well as the incidence of steam pop; and (2) the accuracy of predicting CF and radiofrequency lesion size by the surrogate measures of CF, ie, intracardiac electrogram amplitude and downstroke slope, preablation impedance, and the change in electrode temperature and impedance during radiofrequency delivery.
© 2014 American Heart Association, Inc.
Circ Arrhythm Electrophysiol is available at http://circep.ahajournals.org DOI: 10.1161/CIRCEP.113.001094
Original Article
Background—Electrode-tissue contact force (CF) is believed to be a major factor in radiofrequency lesion size. The purpose of this study was to determine, in the beating canine heart, the relationship between CF and radiofrequency lesion size and the accuracy of predicting CF and lesion size by measuring electrogram amplitude, impedance, and electrode temperature.
Methods and Results—Eight dogs were studied closed chest. Using a 7F catheter with a 3.5 mm irrigated electrode and CF sensor (TactiCath, St. Jude Medical), radiofrequency applications were delivered to 3 separate sites in the right ventricle (30 W, 60 seconds, 17 mL/min irrigation) and 3 sites in the left ventricle (40 W, 60 seconds, 30 mL/min irrigation) at (1) low CF (median 8 g); (2) moderate CF (median 21 g); and (3) high CF (median 60 g). Dogs were euthanized and lesion size was measured. At constant radiofrequency and time, lesion size increased significantly with increasing CF (P<0.01). The incidence of a steam pop increased with both increasing CF and higher power. Peak electrode temperature correlated poorly with lesion size. The decrease in impedance during the radiofrequency application correlated well with lesion size for lesions in the left ventricle but less well for lesions in the right ventricle. There was a poor relationship between CF and the amplitude of the bipolar or unipolar ventricular electrogram, unipolar injury current, and impedance.
Conclusions—Radiofrequencylesion size and the incidence of steam pop increase strikingly with increasing CF. Electrogram parameters and initial impedance are poor predictors of CF for radiofrequency ablation. (Circ Arrhythm Electrophysiol. 2014;7:1174-1180.)
Key Words: atrial fibrillation ◼ catheter ablation ◼ radiofrequency ◼ ventricular tachycardia
Received September 17, 2013; accepted September 24, 2014.From the Heart Rhythm Institute (A.I., H.N., T.S., R.L., W.M.J.) and Department of Pathology, Veterans Administration Medical Center (J.V.P.),
University of Oklahoma Health Sciences Center, Oklahoma City; St. Jude Medical GVA, Geneva, Switzerland (H.L., E.F., A.Y.); and University of Geneva, Geneva, Switzerland (D.C.S.).
Correspondence to Hiroshi Nakagawa, MD, PhD, Heart Rhythm Institute, University of Oklahoma Health Sciences Center, 1200 Everett Dr (TUH-6E-103), Oklahoma City, OK 73104. E-mail [email protected]
Relationship Between Catheter Contact Force and Radiofrequency Lesion Size and Incidence
of Steam Pop in the Beating Canine HeartElectrogram Amplitude, Impedance, and Electrode Temperature Are Poor
Predictors of Electrode-Tissue Contact Force and Lesion Size
Atsushi Ikeda, MD, PhD; Hiroshi Nakagawa, MD, PhD; Hendrik Lambert, PhD; Dipen C. Shah, MD; Edouard Fonck, PhD; Aude Yulzari, MS; Tushar Sharma, MD, MPH;
Jan V. Pitha, MD, PhD; Ralph Lazzara, MD; Warren M. Jackman, MD
by guest on June 18, 2017http://circep.ahajournals.org/
Dow
nloaded from

Ikeda et al Contact Force vs RF Lesion Size 1175
MethodsCF Sensing Ablation CatheterThe 7F quadripolar ablation catheter with a CF sensor (TactiCath, St. Jude Medical, Geneva, Switzerland) has a 3.5-mm tip electrode with 6 small irrigation holes (0.4 mm diameter) around the circum-ference, located 1.2 mm from the tip for saline irrigation during ra-diofrequency delivery (Figure 1). The ablation electrode contains a thermocouple to measure the electrode temperature.
The CF sensor consists of a deformable body (elastic polymer) and 3 optical fibers (0.125 mm diameter, Figure 1) attached circumfer-entially around the deformable body. Force on the deformable body changes the reflected wavelength of light in the 3 optical fibers.8,9,11,12
By monitoring the reflected wavelength, the system is able to calcu-late the amplitude and display the vector of the CF at 100 ms intervals.
Experimental ModelThe experimental protocol was approved by the University of Oklahoma Committee on the Use and Care of Animals. Eight
Tip Electrode
(7F, 3.5mm)
Saline Irrigation
Holes
3 Optical Fibersfor Contact Force
Sensing
Force
DeformableBody
Figure 1. Schematic representation of the distal end of the 7F contact force (CF) sensing ablation catheter. The CF sensor includes 3 optical fibers attached circumferentially with Fiber Bragg Gratings (FBG) to a deformable body. CF on the deform-able body changes the FBG refractive index pattern which changes the reflected wavelength of light in the 3 optical fibers. The change in reflected wavelength is proportional to CF (magni-tude and angle), measured at intervals of 100 ms.
Amplitude (mV)
Duration (ms)
Bipolar Electrogram(30-500 Hz)
Mean NegativedV/dt
Amplitude (mV)
Duration (ms)
Amplitude of Injury Current
(mV)
Unipolar Electrogram(1-500 Hz)
=
Amplitude (mV)
Duration (ms)
Figure 2. Examples of measurements of electrogram parameters on a bipolar ventricular potential (top) and unipolar ventricular potential (bottom). Electrogram amplitude was measured from peak-to-peak. The mean negative dV/dt was measured as the amplitude of the downstroke divided by its duration. The ampli-tude of injury current was measured on the unfiltered unipolar electrogram from the baseline to the peak of ST elevation.
4.8
5.9
Depth5.8 mm
Diameter8.2 mm
8.7
9.4
5mm TransmuralLesion
Low ContactForce (6g)
Moderate Contact Force (22g)
High Contact Force (60g)
Low ContactForce (6g)
Moderate Contact Force (20g)
High Contact Force (50g)
10.5
15.0
8.0
8.9 mm
5.0
5.7
5mmCraterFormation
(Steam Pop)
RV 30W, Low CF (n=8) RV 30W, Moderate CF (n=7)(1 Transmural Lesion Excluded)
RV 30W, High CF (n=5)(3 Transmural Lesions Excluded)
LV 40W, Low CF (n=8) LV 40W, Moderate CF (n=8) LV 40W, High CF (n=8)
A B
C
Figure 3. Radiofrequency (RF) ablation lesion size as function of low contact force (CF), moderate CF, and high CF. A, Examples of RF lesions (30 Watts, 60 seconds) in the right ventricle (RV). Increasing from low to high CF, increased the lesion depth from 4.8 mm to 8.7 mm, and increased lesion diameter from 5.9 mm to 9.4 mm. B, Examples of RF lesions (40 Watts, 60 seconds) in the left ventricle (LV). Increasing from low to high CF, doubled the lesion depth from 5.0 mm to 10.5 mm, and almost tripled lesion diameter from 5.7 mm to 15.0 mm. The crater in the high CF lesion resulted from a steam pop. C, Lesion measurements (mean±SD) at low, moderate, and high CF for the RV (top) and LV (bottom). Measurements include maximum depth, maximum diameter, depth at maximum diameter, and surface lesion diameter. Increasing from low to high CF, increased lesion depth in the RV from 5.0±0.7 mm to 8.5±1.3 mm, and increased lesion depth in the LV from 5.9±1.2 mm to 11.2±0.9 mm. Lesion measurements were not used in the 4 transmural lesions observed in the RV (1 at moderate CF and 3 at high CF).
by guest on June 18, 2017http://circep.ahajournals.org/
Dow
nloaded from
1176 Circ Arrhythm Electrophysiol December 2014
mongrel dogs weighing 31 to 39 kg were anesthetized with sodium pentobarbital (30 mg/kg) and ventilated mechanically with room air. The right carotid artery was cannulated for monitoring arterial pressure. A 7F, 20-electrode catheter was inserted into the right jugular vein and advanced into the coronary sinus under fluoro-scopic guidance. A 10F ultrasound catheter (AcuNav, Acuson) was inserted into the left femoral vein and advanced into the right atrium to be used for intracardiac echocardiography. Heparin (5000 IU) was administered intravenously, with additional doses, as necessary to maintain the activated clotting time >250 seconds. Transeptal puncture was performed under intracardiac echocardiography and fluoroscopic guidance. The CF ablation catheter was inserted into the left atrium through the transeptal sheath. The CF catheter was initially positioned centrally within the left atrium, without endo-cardial contact (confirmed by intracardiac echocardiography), to calibrate the CF sensor to 0 g (baseline noncontact value). The CF ablation catheter was advanced into the left ventricle (LV) for ab-lation. After LV ablation was complete, the transeptal sheath was withdrawn into the right atrium and the CF ablation catheter was positioned into the right ventricle (RV). Ablation was then per-formed in the RV as described below.
Ablation ProtocolRadiofrequency applications were performed at 3 separate sites in the LV (septum, lateral free-wall, and apical region) and 3 separate sites in the RV (basal free-wall, medial wall of the out-flow tract, and apical region). These 6 locations were sufficiently far apart to identify accurately during lesion assessment. The 3 radiofrequency applications in the LV and the 3 radiofrequency applications in the RV were delivered at 3 different levels of CF (one each, randomized): (1) low CF (range 2–10 g, median 8 g); (2) moderate CF (range 20–30 g, median 21 g); and (3) high CF
(range 50–100 g, median 60 g, Figure 2). CF was stabilized and averaged over the 5 seconds before the onset of the radiofrequen-cy application. Data for radiofrequency applications were not in-cluded if the catheter position or movement had changed during ablation or if the CF measured immediately after ablation had changed (>5–10 g). To examine selectively the effect of CF on le-sion size, radiofrequency applications were delivered at constant radiofrequency power and application time. In the LV, radiofre-quency applications were delivered at 40 Watts for 60 seconds, using a saline irrigation flow rate of 30 mL/min. Radiofrequency applications in the RV were delivered at 30 Watts for 60 sec-onds, using an irrigation flow rate of 17 mL/min. In the event of a steam pop (abrupt small increase of impedance, audible or not, confirmed by histology with small cavitation or crater formation) or impedance rise (>10 Ohms), the radiofrequency application was continued for the full 60 seconds to allow the comparison of lesion size. Lidocaine (100 mg) was administered intravenously just before ablation to prevent radiofrequency-induced ventricu-lar fibrillation. Additional doses of lidocaine were administered as needed.
A custom radiofrequency generator (Radionics, model RFG-3DJ) was used to allow the recording of power, impedance, and electrode temperature at 20 ms intervals. Intracardiac electrograms (bipolar and unipolar signals), CF, radiofrequency power, impedance, and electrode temperature were monitored continuously and recorded (LabSystem Duo, CR Bard, Inc).
The dogs were euthanized 30 minutes after the final radiofrequen-cy application. The hearts were excised and stained with triphenyl tetrazolium chloride, which stains intracellular dehydrogenase a deep red color, distinguishing viable (red), and necrotic (pale) tissue. The hearts were fixed in 10% formalin and sectioned to measure radiofre-quency lesion size (maximum depth, maximum diameter, depth at the maximum diameter, and surface diameter).
0
2
4
6
8
10
12
14
0 20 40 60 80 100 120
MaxLesionDepth(mm)
0
2
4
6
8
10
12
14
0 20 40 60 80 100 120
Contact Force (grams)
RV 30WA BLV 40W(n=20) (n=24)4 Transmural Lesions Excluded
p < 0.0001Y = 6.27 + 0.07*X95% CI = (0.05, 0.10)
p < 0.0001Y = 4.68 + 0.07*X95% CI = (0.05, 0.10)
0
2
4
6
8
10
12
14
16
18
20
0
2
4
6
8
10
12
14
16
18
20
0 20 40 60 80 100 120
MaxLesion
Diameter(mm)
0 20 40 60 80 100 120
Contact Force (grams)
p < 0.0001Y = 8.93 + 0.09*X95% CI = (0.05, 0.13)
p = 0.0003Y = 7.27 + 0.08*X95% CI = (0.04, 0.12)
RV 30W LV 40W(n=20) (n=24)4 Transmural Lesions Excluded
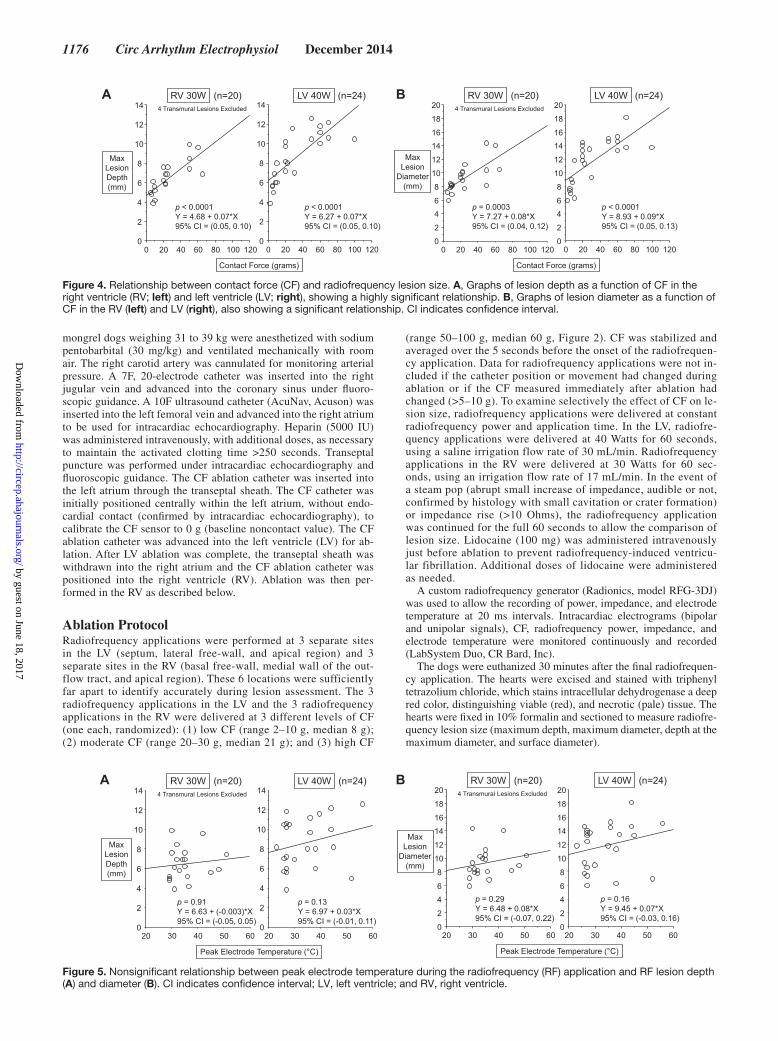
Figure 4. Relationship between contact force (CF) and radiofrequency lesion size. A, Graphs of lesion depth as a function of CF in the right ventricle (RV; left) and left ventricle (LV; right), showing a highly significant relationship. B, Graphs of lesion diameter as a function of CF in the RV (left) and LV (right), also showing a significant relationship. CI indicates confidence interval.
20 30 40 50 60 20 30 40 50 600
2
4
6
8
10
12
14
MaxLesionDepth(mm)
0
2
4
6
8
10
12
14
Peak Electrode Temperature (°C)
p = 0.13Y = 6.97 + 0.03*X95% CI = (-0.01, 0.11)
p = 0.91Y = 6.63 + (-0.003)*X95% CI = (-0.05, 0.05)
RV 30WA BLV 40W(n=20) (n=24)4 Transmural Lesions Excluded
20 30 40 50 60 20 30 40 500
2
4
6
8
10
12
14
16
18
20
0
2
4
6
8
10
12
14
16
18
20
MaxLesion
Diameter(mm)
60
p = 0.16Y = 9.45 + 0.07*X95% CI = (-0.03, 0.16)
p = 0.29Y = 6.48 + 0.08*X95% CI = (-0.07, 0.22)
RV 30W LV 40W(n=20) (n=24)4 Transmural Lesions Excluded
Peak Electrode Temperature (°C)
Figure 5. Nonsignificant relationship between peak electrode temperature during the radiofrequency (RF) application and RF lesion depth (A) and diameter (B). CI indicates confidence interval; LV, left ventricle; and RV, right ventricle.
by guest on June 18, 2017http://circep.ahajournals.org/
Dow
nloaded from

Ikeda et al Contact Force vs RF Lesion Size 1177
Measurement of Electrogram ParametersBipolar electrograms were recorded between the tip electrode and second electrode and filtered at 30 to 500 Hz. Unipolar electrograms were recorded between the tip electrode and a needle skin electrode, filtered at 1 to 500 Hz. The following electrogram measurements were obtained at each ablation site before the onset of the radio-frequency application: (1) bipolar ventricular potential amplitude (peak-to-peak); (2) bipolar ventricular potential mean negative dV/dt (amplitude/duration, downstroke slope); (3) unipolar ventricular potential amplitude (peak-to-peak); (4) unipolar ventricular potential mean negative dV/dt (amplitude/duration, downstroke slope); and (5) unipolar injury current amplitude (Figure 2).
Statistical AnalysisStatistical analyses were performed using SAS software (version 9.2). The relationships between average CF, peak electrode tempera-ture, and decrease in impedance (the impedance at the onset of ra-diofrequency application minus the minimum impedance during the radiofrequency application) versus lesion depth and lesion diameter were assessed by a mixed effects model using Proc Genmod, provid-ing β-coefficients for x variables and their corresponding 95% confi-dence intervals (CIs). Chi square test and Fisher exact test were used to test the overall association between CF category and the incidence of steam pop and impedance rise. The relationships between average CF, electrogram amplitude, mean negative dV/dt (downstroke slope), injury current amplitude, impedance at the onset of radiofrequency application, and impedance decrease were assessed by a mixed ef-fects model using Proc Genmod. The relationship between the degree of impedance decrease and the occurrence of steam pop was assessed by Mann–Whitney U test. A probability value of <0.05 was consid-ered to be statistically significant.
ResultsRelationship Between CF and Lesion Size and Incidence of Steam PopA total of 48 lesions were created in the 8 dogs: 24 lesions in the RV (30 Watts, 60 seconds) at low CF (n=8), moderate CF (n=8), and high CF (n=8); and 24 lesions in the LV (40 Watts, 60 seconds) at low CF (n=8), moderate CF (n=8), and high CF (n=8). Lesion measurements were not used in the 4 transmural lesions observed in the RV (1 at moderate CF and 3 at high CF) because these values would be artificially low. Lesion size was independent of the 3 locations in the RV and the 3 locations in the LV.
At constant radiofrequency power and application time, lesion depth and diameter increased significantly with increas-ing CF (Figures 3 and 4). Lesions at lower power (30 Watts)
and moderate CF were significantly deeper (6.7±0.8 mm ver-sus 5.9±1.2 mm) and wider (9.6±1.1 mm versus 8.0±1.9 mm) than lesions at higher power (40 Watts) at low CF (Figure 3C). Lesions at lower power (30 Watts) and high CF were similar in depth and diameter to lesions at higher power (40 Watts) at moderate CF (Figure 3C). Lesion depth and diameter cor-related well with average CF for both RV and LV. (Figure 4). Peak electrode temperature during the radiofrequency appli-cation correlated poorly with lesion depth and diameter (Figure 5). The decrease in impedance during the radiofre-quency application relatively correlated well with lesion depth and diameter for lesions in the LV: 95% CI=0.13–0.28 and 95% CI=0.20–0.33, respectively, and in the RV: 95% CI=0.03, 0.14 and 95% CI=0.06, 0.19, respectively, Figure 6A and 6B.
The incidence of a steam pop increased significantly with increasing CF at 40 Watts (P=0.03) and with higher power (40 Watts versus 30 Watts, P=0.02, Figure 7). At 30 Watts in the RV, a steam pop occurred during 0/8 radiofrequency appli-cations at low CF, 1/8 radiofrequency applications at moder-ate CF, and 1/8 radiofrequency applications at high CF. At 40 Watts in the LV, a steam pop occurred during 0/8 radiofre-quency applications at low CF, 4/8 radiofrequency applica-tions at moderate CF, and 5/8 radiofrequency applications at high CF.
0 10 20 30 40 50 60 0 10 20 30 40 50 600
2
4
6
8
10
12
14
MaxLesionDepth(mm)
0
2
4
6
8
10
12
14
Impedance Decrease (Ohm)
p < 0.0001Y = 3.86 + 0.21*X95% CI = (0.13, 0.28)
p = 0.0015Y = 4.95 + 0.09*X95% CI = (0.03, 0.14)
RV 30WA BLV 40W(n=20) (n=24)4 Transmural Lesions Excluded
0 10 20 30 40 50 60 0 10 20 30 40 50 600
2
4
6
8
10
12
14
16
18
20
0
2
4
6
8
10
12
14
16
18
20
MaxLesion
Diameter(mm)
p < 0.0001Y = 5.61 + 0.27*X95% CI = (0.20, 0.33)
p = 0.0002Y = 6.96 + 0.12*X95% CI = (0.06, 0.19)
RV 30W LV 40W(n=20) (n=24)4 Transmural Lesions Excluded
Impedance Decrease (Ohm)
Figure 6. Relationship between the decrease in impedance during the radiofrequency (RF) application and RF lesion depth (A) and diam-eter (B). CI indicates confidence interval; LV, left ventricle; and RV, right ventricle.
100
p=0.03p=NS
p=NSp=0.08
0
10
20
30
40
50
60
70
80
90
0/80%
4/850%
5/863%
Low Moderate High0
10
20
30
40
50
60
70
80
90
100
0/80%
1/813%
1/813%
Low Moderate High
Contact Force
Pop(%)
LV, 40 WattsRV, 30 Wattsp=0.02
Figure 7. Incidence of steam pop for radiofrequency applications at low, moderate, and high contact force in the right ventricle (RV; 30 Watts for 60 seconds, left) and left ventricle (LV; 40 Watts for 60 seconds, right).
by guest on June 18, 2017http://circep.ahajournals.org/
Dow
nloaded from

1178 Circ Arrhythm Electrophysiol December 2014
0
5
10
15
20
25
0 20 40 60 80 100 120Contact Force (grams)
BipolarAmplitude
(mV)
n = 48p = 0.17Y = 6.17 + 0.03*X95% CI = (-0.01, 0.08)
RV, 30WattsLV, 40Watts
0
0.5
1.0
1.5
2.0
2.5
3.0
0 20 40 60 80 100 120
BipolardV/dt
(mV/ms)
RV, 30WattsLV, 40Watts
n = 48p = 0.59Y = 0.77 + (-0.002)*X95% CI = (-0.007, 0.004)
Contact Force (grams)
0
10
20
30
40
50
0 20 40 60 80 100 120
UnipolarAmplitude
(mV)
n = 48p = 0.26Y = 20.36 + (-0.06)*X95% CI = (-0.16, 0.04)
RV, 30WattsLV, 40Watts
Contact Force (grams)
0
0.5
1.0
1.5
2.0
2.5
3.0
0 20 40 60 80 100 120
UnipolardV/dt
(mV/ms)
RV, 30WattsLV, 40Watts
n = 48p = 0.995Y = 1.10 + 0*X95% CI = (-0.007, 0.007)
Contact Force (grams)
RV, 30WattsLV, 40Watts
0
5
10
15
20
25
30
0 20 40 60 80 100 120Contact Force (grams)
UnipolarInjury Current
Amplitude(mV)
n = 48p = 0.006Y = 4.19 + 0.14*X95% CI = (0.06, 0.22)
40
60
80
100
120
140
160
0 20 40 60 80 100 120Contact Force (grams)
InitialImpedance
(Ohm)
n = 48p < 0.0001Y = 92.31 + 0.21*X95% CI = (0.15, 0.27)
RV, 30WattsLV, 40Watts
0
10
20
30
40
50
60
1200 20 40 60 80 100Contact Force (grams)
ImpedanceDecrease
(Ohm)
120
n = 48p < 0.0001Y = 14.06 + 0.24*X95% CI = (0.20, 0.28)
RV, 30WattsLV, 40Watts
0
10
20
30
40
50
60
(n=22) (n=2)
ImpedanceDecrease
(Ohm)
0
10
20
30
40
50
60
(n=15) (n=9)
RV 30W LV 40W(n=24) (n=24)
p=NSp<0.05
No Pop Pop No Pop Pop
17 18 1924
Median
0
10
20
30
40
50
60
0 10 20 30 40 50 60
Timing ofSteamPop(sec)
Impedance Decrease (Ohm)
RV, 30WattsLV, 40Watts
n = 11p =0.08Y = 43.46 + (-0.31)*X95% CI = (-0.67, 0.04)
A B
C D
E F
G H
I
Figure 8. Weak relationships between surrogate parameters and contact force (CF). Graphs of bipolar electrogram amplitude vs CF (A), mean negative dV/dt of the bipolar electrogram vs CF (B), unipolar electrogram amplitude vs CF (C), mean negative dV/dt of the unipolar electrogram vs CF (D), amplitude of the unipolar injury current vs CF (E), initial impedance (impedance at the onset radiofrequency [RF] application) vs CF (F) and impedance decrease vs CF (G). The deference of the degree of impedance decease between RF applications with and without steam pop (H), and the relationship between the degree of impedance decrease and the time of occurrence of the steam pop (I).
by guest on June 18, 2017http://circep.ahajournals.org/
Dow
nloaded from

Ikeda et al Contact Force vs RF Lesion Size 1179
An impedance rise (≥10 Ohms increase from the minimum value during radiofrequency) occurred only in 3/8 radiofre-quency applications at high CF and high power (40 Watts). An impedance rise did not occur at lower CF or at 30 Watts.
Relationship Between Surrogate Parameters and CF and Lesion SizeThe peak-to-peak amplitude and downstroke slope of the bipo-lar and unipolar ventricular potentials correlated poorly with CF (Figure 8A–8D). The amplitude of unipolar injury current correlated better with CF but still had a wide overlap in values (Figure 8E). The ratio of injury current/unipolar ventricular potential amplitude correlated less well with CF than injury current amplitude, Y=0.34+0.01*X, 95% CI=0.002–0.02, P=0.022 and Y=4.19+0.14*X, 95% CI=0.06–0.22, P=0.006, respectively. Impedance at the onset of radiofrequency appli-cation (initial impedance) also correlated poorly with CF (Figure 8F). The degree of decrease in impedance during the radiofrequency application correlated only slightly better with CF (Figure 8G). At higher radiofrequency power (40 Watts), the occurrence of a steam pop correlated with the degree of impedance decrease (Figure 8H), but there was no significant relationship between the time of steam pop and the degree of impedance decrease (Figure 8I).
DiscussionTo our knowledge, this is a first study to examine the relation-ship between radiofrequency lesion size and CF in the beating heart. We found a wide range of lesion size (depth and diameter) for radiofrequency applications with varying CF but same power and application time. Under these conditions (constant radiofre-quency power and time), lesion size correlated well with CF (Figures 3 and 4). Increasing from low CF to high CF increased lesion depth by 70% at 30 Watts and by 90% at 40 Watts (Fig-ure 3C). Lesions produced at 30 Watts and moderate CF were larger than lesions produced at 40 Watts and low CF, and lesions at 30 Watts and high CF were similar to lesions at 40 Watts and moderate CF (Figure 3). These data indicate that increasing CF is comparable to increasing radiofrequency power.
By measuring CF before the onset of an radiofrequency application, an appropriate radiofrequency power and time can be selected to achieve efficacy (lesion depth) and min-imize the risk of steam pop. Low CF may be compensated by delivering higher radiofrequency power. The incidence of steam pop may be decreased while maintaining similar radio-frequency lesion size by using lower radiofrequency power and maintaining good CF.
Peak electrode temperature during radiofrequency applica-tions was not predictive of lesion depth or diameter (Figure 5). The decrease in impedance during the radiofrequency appli-cation (initial impedance minus minimum impedance) corre-lated relatively well with lesion size (especially in the LV at 40 Watts, Figure 6). The degree of impedance decrease correlated with the occurrence of a steam pop at higher radiofrequency power (40 Watts) but did not correlate with the time of occur-rence of the steam pop (Figure 8H and 8I). One limitation of the impedance decrease is that this measure is not available before the onset of the radiofrequency application.
This study also demonstrates that the surrogate parameters of CF have limited or no value. Electrogram amplitude (uni-polar and bipolar) and downstroke slope correlated poorly with CF. Even the amplitude of the injury current is a weak predictor of CF, although the presence of an injury current indicates some contact. Impedance is also not predictive of the magnitude of CF. These findings indicate the surrogate mea-sures are poor predictors of CF and confirm the importance of directly measuring CF.
Study LimitationA principal limitation of the study was that all radiofrequency applications were delivered for a relatively long interval (60 seconds). The impact of CF on lesion size may be even greater during shorter radiofrequency application times. The role of CF may also be greater or lesser at higher or lower radiofre-quency power than the 30 Watts and 40 Watts used in this study. Further studies are required to compare the importance of CF to different radiofrequency power and application time.
Clinical ImplicationsIncorporating real-time CF measurement in an irrigated radio-frequency ablation catheter should help optimize the selection of radiofrequency power and application time to maximize radiofrequency lesion formation and reduce the risk of steam pop in clinical application.
Sources of FundingThis study was supported, in part, by a grant from Endosense SA (currently St. Jude Medical GVA).
DisclosuresDrs Nakagawa, Shah, and Jackman were consultants for Endosense SA. Drs Lambert, Fonck, and Yulzari were employees of Endosense SA (currently St. Jude Medical GVA). The other authors report no conflicts.
References 1. Avitall B, Mughal K, Hare J, Helms R, Krum D. The effects of elec-
trode-tissue contact on radiofrequency lesion generation. PACE. 1997;20:2899–2910.
2. Haines DE. Determinants of lesion size during radiofrequency catheter ablation: the role of electrode-tissue contact force and duration of energy delivery. J Cardiovasc Electrophysiol. 1991;2:509–515.
3. Strickberger SA, Vorperian VR, Man KC, Williamson BD, Kalbfleisch SJ, Hasse C, Morady F, Langberg JJ. Relation between impedance and endocardial contact during radiofrequency catheter ablation. Am Heart J. 1994;128:226–229.
4. Zheng X, Walcott GP, Hall JA, Rollins DL, Smith WM, Kay GN, Ideker RE. Electrode impedance: an indicator of electrode-tissue contact and lesion dimensions during linear ablation. J Interv Card Electrophysiol. 2000;4:645–654.
5. Eick OJ, Wittkampf FH, Bronneberg T, Schumacher B. The LETR-Principle: a novel method to assess electrode-tissue contact in radiofre-quency ablation. J Cardiovasc Electrophysiol. 1998;9:1180–1185.
6. Wittkampf FH, Nakagawa H. RF catheter ablation: lessons on le-sions. Pacing Clin Electrophysiol. 2006;29:1285–1297. doi: 10.1111/j.1540-8159.2006.00533.x.
7. Biase LD, Natale A, Barrerr C, Tan C, Elayi CS, Ching CK, Wang P, Al-Ahmad A, Arruda M, Burkhard JD, Wisnoskey BJ, Chowdhury P, Marco S, Armaganijan L, Litwak K, Schweikert RA, Cummings JE. Relationship between contact forces, lesion characteristics, “popping,” and char formation: experience with robotic navigation system. J Cardiovasc Electrophysiol. 2009;20:436–440.
by guest on June 18, 2017http://circep.ahajournals.org/
Dow
nloaded from

1180 Circ Arrhythm Electrophysiol December 2014
8. Yokoyama K, Nakagawa H, Shah DC, Lambert H, Leo G, Aeby N, Ikeda A, Pitha JV, Sharma T, Lazzara R, Jackman WM. Novel contact force sensor incorporated in irrigated radiofrequency ablation catheter predicts lesion size and incidence of steam pop and thrombus. Circ Arrhythm Electrophysiol. 2008;1:354–362. doi: 10.1161/CIRCEP.108.803650.
9. Shah DC, Lambert H, Nakagawa H, Langenkamp A, Aeby N, Leo G. Area under the real-time contact force curve (force-time in-tegral) predicts radiofrequency lesion size in an in vitro contrac-tile model. J Cardiovasc Electrophysiol. 2010;21:1038–1043. doi: 10.1111/j.1540-8167.2010.01750.x.
10. Thiagalingam A, D’Avila A, Foley L, Guerrero JL, Lambert H, Leo G, Ruskin JN, Reddy VY. Importance of catheter contact force during irri-gated radiofrequency ablation: evaluation in a porcine ex vivo model using a force-sensing catheter. J Cardiovasc Electrophysiol. 2010;21:806–811. doi: 10.1111/j.1540-8167.2009.01693.x.
11. Kuck KH, Reddy VY, Schmidt B, Natale A, Neuzil P, Saoudi N, Kautzner J, Herrera C, Hindricks G, Jaïs P, Nakagawa H, Lambert H,
Shah DC. A novel radiofrequency ablation catheter using contact force sensing: Toccata study. Heart Rhythm. 2012;9:18–23. doi: 10.1016/j.hrthm.2011.08.021.
12. Reddy VY, Shah D, Kautzner J, Schmidt B, Saoudi N, Herrera C, Jaïs P, Hindricks G, Peichl P, Yulzari A, Lambert H, Neuzil P, Natale A, Kuck KH. The relationship between contact force and clinical outcome during radio-frequency catheter ablation of atrial fibrillation in the TOCCATA study. Heart Rhythm. 2012;9:1789–1795. doi: 10.1016/j.hrthm.2012.07.016.
13. Perna F, Heist EK, Danik SB, Barrett CD, Ruskin JN, Mansour M. Assessment of catheter tip contact force resulting in cardiac perforation in swine atria using force sensing technology. Circ Arrhythm Electrophysiol. 2011;4:218–224. doi: 10.1161/CIRCEP.110.959429.
14. Martinek M, Lemes C, Sigmund E, Derndorfer M, Aichinger J, Winter S, Nesser HJ, Pürerfellner H. Clinical impact of an open-irrigated ra-diofrequency catheter with direct force measurement on atrial fibril-lation ablation. Pacing Clin Electrophysiol. 2012;35:1312–1318. doi: 10.1111/j.1540-8159.2012.03503.x.
CLINICAL PERSPECTIVEThis study tested a saline irrigated radiofrequency ablation catheter with 3 optical fibers to measure real-time contact force (CF) as the microdeformation of a deformable body in the catheter tip in canine beating hearts. Radiofrequency applica-tions were delivered to 3 separate sites in the right ventricle (30 W, 60 seconds) and 3 sites in the left ventricle (40 W, 60 seconds) at (1) low CF (median 8 g); (2) moderate CF (median 21 g); and (3) high CF (median 60g). Compared with the peak electrode temperature and the decrease in impedance during the radiofrequency application, radiofrequency lesion size (depth and diameter) correlated best with CF. The incidence of a steam pop increased significantly with both increasing CF and higher power. Increasing CF from low to high level increased lesion depth by 70% at 30 Watts and by 90% at 40 Watts. Lesions produced at 30 Watts and moderate CF were larger than lesions produced at 40 Watts and low CF, and lesions at 30 Watts and high CF were similar to lesions at 40 Watts and moderate CF, indicating that increasing CF is comparable to increasing radiofrequency power. The surrogate measures of CF by intracardiac electrogram amplitude (including unipolar injury current amplitude) and downstroke slope and preablation impedance had limited or no value. Incorporating real-time CF measurement in an irrigated radiofrequency ablation catheter may help optimize the selection of radiofrequency power and application time to maximize radiofrequency lesion formation and reduce or prevent steam pop in clinical application.
by guest on June 18, 2017http://circep.ahajournals.org/
Dow
nloaded from
Yulzari, Tushar Sharma, Jan V. Pitha, Ralph Lazzara and Warren M. JackmanAtsushi Ikeda, Hiroshi Nakagawa, Hendrik Lambert, Dipen C. Shah, Edouard Fonck, Aude
Lesion Sizeand Electrode Temperature Are Poor Predictors of Electrode-Tissue Contact Force and
Impedance,Incidence of Steam Pop in the Beating Canine Heart: Electrogram Amplitude, Relationship Between Catheter Contact Force and Radiofrequency Lesion Size and
Print ISSN: 1941-3149. Online ISSN: 1941-3084 Copyright © 2014 American Heart Association, Inc. All rights reserved.
Avenue, Dallas, TX 75231is published by the American Heart Association, 7272 GreenvilleCirculation: Arrhythmia and Electrophysiology
doi: 10.1161/CIRCEP.113.0010942014;
2014;7:1174-1180; originally published online November 7,Circ Arrhythm Electrophysiol.
http://circep.ahajournals.org/content/7/6/1174World Wide Web at:
The online version of this article, along with updated information and services, is located on the
http://circep.ahajournals.org//subscriptions/
is online at: Circulation: Arrhythmia and Electrophysiology Information about subscribing to Subscriptions:
http://www.lww.com/reprints Information about reprints can be found online at: Reprints:
document. Answer
Permissions and Rights Question andunder Services. Further information about this process is available in thepermission is being requested is located, click Request Permissions in the middle column of the Web pageClearance Center, not the Editorial Office. Once the online version of the published article for which
can be obtained via RightsLink, a service of the CopyrightCirculation: Arrhythmia and Electrophysiologyin Requests for permissions to reproduce figures, tables, or portions of articles originally publishedPermissions:
by guest on June 18, 2017http://circep.ahajournals.org/
Dow
nloaded from