original article - tjprc.org · the development theory states that the growth trajectory for any...
TRANSCRIPT

www.tjprc.org [email protected]
MAKE IN INDIA – PROSPECTS FOR EMPLOYMENT GENERATION
JASMIN
Assistant Professor, Jesus and Mary College & Ph.D. Scholar, Jawaharlal Nehru University, New Delhi, India
ABSTRACT
India has been witnessing a serious problem with employment generation. “Make in India” campaign aims at
transforming India into a global manufacturing hub and generate enough employment. However, the current status of
the manufacturing sector presents several impediments in making Make in India a success. Overtime, the absorptive
capacity of the sector has tended to decline, which poses serious doubts about the achievability of the aims of the
campaign. In such a case exclusive focus on the manufacturing sector looks like a faulty strategy. The paper argues that
identifying appropriate manufacturing goods and services that can generate enough employment and usher in growth is
a better strategy. Along with this identification Skilling and educating India has become imperative, to make the
workforce ready for productive employment opportunities.
KEYWORDS: Make in India, Skill India, Manufacturing Sector, Informalisation, Low-Productivity Sectors & Agrarian
Crisis
Received: Jul 06, 2017; Accepted: Jul 28, 2017; Published: Aug 03, 2017; Paper Id.: IJECRAUG201711
INTRODUCTION
India has been witnessing a serious problem with employment generation. Impressive growth rate
registered by the country, over the last few decades, has failed to reflect a concomitant improvement on the
employment generation front. The Dismal performance of the manufacturing sector has a lot to explain as to why
inclusive growth remains a far-fetched dream for India. The skewed distribution of the returns to growth in favor
of the rich and limited employment generation point towards an unsustainable growth trajectory. These two issues
are somewhere linked to the fact that the manufacturing sector has failed to increase its contribution to the GDP
and at the same time its performance has been disappointing on the employment creation front. The manufacturing
sector has been perceived to be the key to economic growth, since the time of Industrial Revolution in the 18th
century. The development theory states that the growth trajectory for any nation involves siphoning off the
resources from the agricultural sector to expand the manufacturing sector. However, in the recent years, this role
of the manufacturing sector has become dubious. India has made a leap from agriculture to services, trying to
match its position with the advanced countries where the service sector is dominant now.
This serves as a background for the “Make in India” campaign; the goal is to transform India into a global
manufacturing hub and generate enough employment. The campaign perceives raising the global competitiveness
of the Indian manufacturing sector as an imperative to igniting long-term growth. The target is to elevate the
manufacturing sector growth to 12-14% per annum over the medium term and generate 100 million additional jobs
by 2022 in the sector. The program includes major new initiatives designed to facilitate investment, foster
innovation, protect intellectual property, and build best-in-class manufacturing infrastructure. Norms have been
eased in major sectors to attract foreign direct investment.
Original A
rticle
International Journal of Economics, Commerce and Research (IJECR) ISSN (P): 2250-0006; ISSN (E): 2319-4472 Vol. 7, Issue 4, Aug 2017, 91-112 © TJPRC Pvt. Ltd.

92 Jasmin
Impact Factor (JCC):5.5658 NAAS Rating: 3.27
While “Make in India” has invited a lot of support, there are economists who advise that sticking to the service
sector and generating jobs there is a better move, Green (2014). It is the high-quality jobs that India needs to generate.
Amirapu and Subramaniam (2014) emphasize that it is the formal manufacturing sector which is characterized by high
productivity and dynamism, not the informal sector. This clearly implies that the policies should be fabricatedto expand the
formal sector. However, all this seems more like a challenge to the manufacturing sector. The feasibility of such an
approach is under question, given the fact that India is on the road to premature deindustrialization. India has a huge
unorganized sector which has been absorbing workers who move away from the agrarian sector in search of better
opportunities. Sadly, the unorganized sector has only got low quality, casual jobs to offer, with hardly any stability of
tenure. This sector, as well as the buffer available in the agriculture sector, has played a great role in real wage stagnation.
Unfortunately, this easy availability has encouraged the use of contractual employees even in the organized sector. At the
same time, technological up-gradation and a switch to capital intensive techniques have reduced the labor intensity in the
manufacturing sector, making the prospects for employment generation bleaker.
The aim of this paper is to assess the viability of the campaign and its prospective contribution to inclusive
growth. This will necessarily involve presenting the historical and current status of manufacturing sector domestically and
at the global level, reasons as to why employment generation and growth have been abysmal. India’s trade in manufactured
products has grown significantly. Still, it remains far from becoming a global manufacturing hub. Thereforeit is important
to identify subsectors in the manufacturing as well as the services sector with good potential for employment generation.
India's comparative advantage, its position in global product sharing and possible future developments on this front has
important implications regarding the exports. The labor intensity, in terms of the composition of the goods and services,
produced also has repercussions on the status of employment. Hence it becomes imperative to analyze what all forms of
labor-saving technical changes have taken place. Taking stock of the previous policies formulated with the motive to give
employment in various sectors a boost, as well as the minimum wage laws, will help identify improvements that have taken
place in the past and what needs to be charted out for the future. For instance, programs with the objective of vocationally
training and helping the workers with skill development could potentially be a significant step in this regard.
Competitiveness regarding lower costs gives the edge to the exporting activity of any nation, how is the
production kept competitive also needs to be analyzed. Labor costs in manufacturing are already low and bringing them
down further will be counter-productive. This not only means compromising on the livelihood of the workers, but also
making the growth trajectory unsustainable. Make in India is a campaign that is being administered at the central level,
state level disparities can present a great number of problems in implementing it. For instance, states at different stages of
development, experiencing different thresholds of poverty, inequality, and phases of demographic transition could present
multiple challenges. This calls for state specific policies to achieve the desired target.
India needs a comprehensive policy framework to generate quality employment and growth.
LITERATURE SURVEY
This section begins with a discussion on important theories which will place the discussion in a better perspective.
Lewis (1954) and Fei-Ranis (1961) discuss dualism. Lewis (1954) discusses the case of developing countries, with a
modern sector and a subsistence sector. The development of such economies involves the movement of labor, available in
the subsistence sector as an unlimited supply, to the industrial sector at fixed wages. This transition continues till the
surplus labor is absorbed. Fei and Ranis formalized the Lewis model. Harris-Todaro (1970) explained the rural-urban
Make in India – Prospects for Employment Generation 93
www.tjprc.org [email protected]
migration and the phenomenon of the existence of the informal sector. A plethora of studies explains India’s jobless growth
using the kaldorianframework. Dasgupta and Singh (2006) use Kaldor’s theory to explain the job problem in India. They
argue that the Indian economy has the largest size of labor force located in agriculture andinformal activities; there is
widespread disguised unemployment, which represents the available labor force for the manufacturing sector. Moreover,
informal, casual and daily laborers constitute the majority of Indian workers in rural areas, where most of the poverty is
concentrated. It follows that agricultural surplus over self-consumption is low and the demand for industrial products
coming from agriculture could be insufficient to ensure a further growth of manufacturing production accompanied by the
efficient allocation of disguised laborers in organized industrial activities. This leads to the expansion of the informal
economy, which absorbs the mass of rural workers migrating to the urban centers and which could push India away from
its trajectory from a dualistic to a modern economy (Dasgupta& Singh, 2006).
This work derives its motivation from the existing research and reports not only on the campaign but a plethora of
studies on the status of employment in India and the sad state of employment generation. This section presents a survey of
the research followed to prepare this piece of work.
Green (2014), discusses how realistic a strategy, the “Make in India” campaign is. He highlights the factthat it is
the formal sector, which should be the mainstay for employment generation. According to Green, services, lack the
potential to generate high-quality jobs, increasing the employment elasticity for this sector is a challenge. The formal
manufacturing sector, on the other hand, has not been able to realize its potential due to an adverse policy regime. He, then
argues, for a relatively supportive policy framework for the same. The paper describes significant reforms in this regard,
namely, easing labor regulation, facilitation of land acquisition, improvement of the business-government interface,
provision of public goods, and institutional reform.
Anand et al. (2015), analyzes India’s exports by the technological content, quality, sophistication, and complexity
of the export basket and identifies exports that can make “Make in India” successful. The paper identifies five key areas for
policy action, aiming at making India a global manufacturing hub. They suggest reducing the trade costs, further
liberalizing foreign direct investment, improving infrastructure, encouraging skill enhancement and ensuring human
resource development, infusing greater flexibility in the labor markets, last of all creating an environment receptive to
technological up-gradation and innovation. The paper concludes that India can benefit by increasing the quality of its high
and medium technology intensive manufacturing exports. Also, the country can benefit out of the sophistication it has
achieved in its services. Indian service exports are comparable to international standards, further development, and
diversification of these services, could turn them into lucrative exports. This could also help meet the employment
generation goal.
Rao and Dhar (2016), looks at the magnitude and nature of FDI inflows into India since the Make in India
program has been initiated. The paper mentions that the campaign has not been able to attract FDI in the focus sectors. The
nature of inflows needs to be examined with caution1.
1According to Rao and Dhar (2016), the reported investments should be examined from the points of (i) adding fresh domestic production capacities (including meaningful indigenisation), (ii) net addition to capital instead of round-tripping of funds remitted abroad on one pretext or the other, (iii) the monetary value of all the incentives and exemptions availed and (iv) last but not the least, delayed reporting and gross inaccuracies. Acquisitions and disinvestments (not to speak of outward FDI) undermine the contribution of the inflows to new capacity creation in the economy.

94 Jasmin
Impact Factor (JCC):5.5658 NAAS Rating: 3.27
Papola (2007), presents an account of the trends in employment during the period 1973�2000.The paper indicates
how the higher rate of economic growth experienced by India during this period, failed to bring about an improvement on
the employment front. He also highlights structural and qualitative dimensions of employment in India, for instance, a slow
change in the sectoral composition of employment, thedominance of self�employment and increase in the share of the
casual workers, a growing unorganized sector, stagnation and decline in the organized sector employment. The paper also
mentions how the quality of employment has deteriorated in the recent times.
Sasikumar and Thimothy (2013), Shaw (2013) give an overview of the employment trends based on NSSO’s 68th
round. Both the studies highlight an improvement on the employment front, in terms of revival in growth. Sasikumar and
Thimothy (2013), mention that manufacturing employment has stagnated, theyemphasize on the much-needed policy
action to meet the challenge posed by the demographic bulge. Low skill and increasing informality in the workforce are the
two problems that ask for a remedy.
Shaw (2013), presents evidence for a rebound in employment growth. However, his analysis shows that the
average growth in employment between 2004-05 and 2011-12 remained as low as 2.5 million per year.
Economic Survey (2014-15), states that emphasis should be laid on skilling India so that the future generations
could benefit. Focus on education and skill development will ensure that future generations are employable and can be
absorbed into quality employment.
Kapoor (2014), examines the factors holding back the growth of output and employment in the manufacturing
sector. The paper discusses how the recent economic growth has benefited industries which are relatively capital
intensiveand rely on skilled workers; the unskilled workforce continues to suffer. She points out that the increasing
informalization of the organized sector has allowed low productivity activities dominate employment in India. The paper,
emphasizes the importance of state-level policies in igniting the growth of the manufacturing sector and accelerating
employment generation.
Srija & Shirke (2014), highlights predominance of informal employment in India. They state that informalization
is a challenge which cannot be easily surmounted through labor reforms. The solution is to create an environment which
encourages the micro and small scale enterprises to register and realize the benefits of becoming a part of the formal
economy.
This study on the “Make in India” campaign utilizes studies mentioned above to assess the trends in employment
and analyzing the role of the manufacturing sector in employment creation.
Job Opportunities and the Nature of Employment in India
The inclusion of the individuals in the process of growth cannot be imagined without providing them with
adequate employment opportunities. Unfortunately, India continues to struggle with a jobs problem. According to the 68th
NSSO round, as pointed out by Shaw (2013), in 2011-12, 36.4% of the population in India was actively involved in the
labor force according to the UPS data, as per the UPSS estimates over nine million persons found employment between
2009-10 and 2011-122. Figure 1 in the appendix shares the trends in the unemployment rate in India3. The unemployment
2On a yearly basis the growth in employment in terms of UPSS works out to 4.68 million per year between 2009-10 and 2011-12. But in terms of UPS it was much lower, only 1.73 million per year

Make in India – Prospects for Employment Generation 95
www.tjprc.org [email protected]
rate in India has been lower than that of developed nations. However, in absolute terms, the unemployed in India add up to
a significant number. For instance, during 2009-10 to 2011-12, the number of unemployed rose from 9.8 million to 10.8
million regardingas per UPSS, while there was a decline in the number of unemployed from 28 million to 24.7 million as
per the CDS criterion. There is a difference between unemployment and underemployment. Bureau of labor statistics,
United States, defines underemployment as a statistic that includes over and above the unemployed, the people who are no
longer looking for work and the involuntary part-time workers, the people who could not find employment of full-time
nature despite their capabilities. The CDS measure includes both unemployment and underemployment. As illustrated by
the figure underemployment is a graver problem for India. A very important exercise is to study unemployment in
conjunction with poverty. A large proportion of employed in India, work at abysmally low levels of wages and income.
Henceforth, the goal should not only be to generate more jobs, but also to provide better income and working conditions to
the workers.
As Table 1 in the appendix, indicates the share of the workforce in the primary sector has declined from 58.5% in
2004-05 to 48.9% in 2011-12, while the share of the workforce in the secondary and services sector has risen during the
same period. There is a story behind these figures, disappointing trends that display sluggish absorption of people in the
labor force, an absorption which is primarily informal in nature.
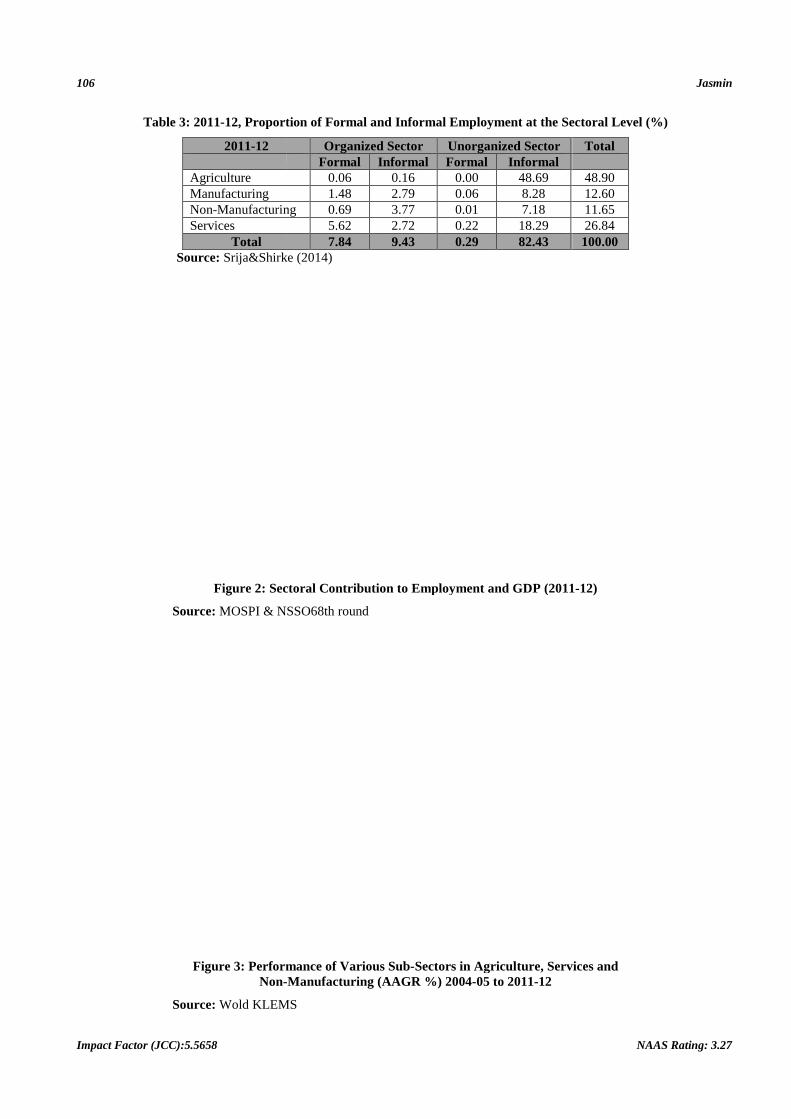
Tables 2 and 3 help us draw important inferences about the informality which is prevalent in all the sectors of the
economy. The organized sector which is expected to generate employment opportunities of the formal nature is also
increasingly relying on casual and informal labor. According to the statistics presented by Srija & Shirke (2014), informal
employment, which was about 92.73% in 2004-05, has come down by a minuscule figure to 91.86%. The numbers itself
show the nature of the growth in employment, India is witnessing. The shrinkage in the employment in agriculture has
found a way in terms ofan expansion in the other non-agriculture sector, but most of it is in the informal segment.
This huge pool of labor in the agriculture sector acts as a buffer for the non-agriculture sectors to draw from. The
conditions created in the agriculture sector, the real wage stagnation and the large labor reserve, have definitely supported a
rise in the surplus incomes. The surplus incomes of the secondary and tertiary sector have grown however there hasn’t
been enough growth in the employment opportunities so that the benefits could trickle down to the labor. Low wages and a
bleak potential for any improvement in the job quality in the organized sector says volumes about how miserable the
condition would be in the informal sector.
Mazumdar (2014) explains that the conditions for a strong wage-depressing tendency in the Indian economy and
the heightened informalisation and casualisation of work were set up among other things by the onset of a deep-rooted
agrarian crisis since the mid-1990s. Stagnation in agriculture, increasing production and marketing risks in a liberalized
trade and market regime, institutional vacuum and lack of alternative livelihood opportunities were the root cause of this
crisis. The crisis impacted small and marginal farmers the most, support systems to farming weakened, public investments
in agriculture declined, and institutions were of no help. The inability to come up with technologies that could reduce cost,
the rising input pricesmade cultivation un-remunerative. Since large segments of the agriculture-dependent population
were hit by a fall in profitability of agricultural activity and an increasing burden of debt, more and more people were
3UPSS: Usual Principal and Subsidiary Status includes, besides UPS, those available but unable to find work on a subsidiary basis, during a year. CDS: Current Daily Status measures unemployment in terms of person days of unemployment of all persons in the labour force during the reference week.
96 Jasmin
Impact Factor (JCC):5.5658 NAAS Rating: 3.27
driven out of that sector to seek work in other activities. Though much of India’s working population remains rural, there
has been a steep decline in the share of agricultural in total employment since 19914. The push out of agriculture has
resulted in the swelling of an already vast labour pool which the expansion process outside agriculture could then draw on
without that process exerting any upward pressure on wage levels. The share of informal employment has increased in the
industry over time. Surprisingly the reliance of organized service sector on informal labour has grown. In non-
manufacturing sector, which includes the construction sector, there is an increase in employment in both the organized and
unorganized sector as well as in the formal and informal sector. However, the share of informal employment is higher.
Construction has become a mainstay for the migrant labor (Mazumdar, 2014).
Apart from employing labor informally, the growth of the industry has also been subsisted by the use of cheap
labor for supplementary activities. This kind of expansion of employment accompanying rapid corporate sector growth has
not adequate to eliminate the excess labor availability.
India’s Structural Evolution
India’s job’s problem is very well illustrated in figure 2. Agriculture continues to lose its ground in favor of
services when it comes to GDP contribution. Also, this sector employs the largest share of the workforce. Industry, i.e.
manufacturing and non-manufacturing taken together have contributed abysmally to both the spheres. Services, enjoying
the lion’s share of GDP, hold roughly 27% of the workforce.
Green (2014) compares the Indian case of structural evolution with the global transformation. He mentions that
the Indian experience is of the kind, not witnessed elsewhere. The high-income countries of the current times, moved from
intensive dependence on agriculture sector to large-scale manufacturing, in terms of employment and GDP. Service sector
domination came later with high per-capita income levels. Even the successful developing countries had experiencedlarge-
scale industrialization before the services took over. Looking at the group of developing countries over the recent years, the
share of employment in the industry continued to grow while agriculture employed fewer workers.The share of the service
sector grew fastest, however. Developed countries have lost manufacturing jobs overall as their economies automate
further and rely on services for employment. In terms of GDP, the service sector in developing countries grew fastest,
gaining output share, while agriculture fell behind. The industry hit the middle, maintaining a constant share of GDP. In
developed countries industrial output actually shrank, indicating their post-industrial status.
For India, on the other hand, industry has added jobs faster than even services. Although, most of this job
generation in the industry can be attributed to construction rather than manufacturing. A further distinction for India is that
it saw growth in industry’s share of GDP, mostly due to growth in manufacturing. The service sector share of GDP grew
faster, furthering India’s service sector dominance.
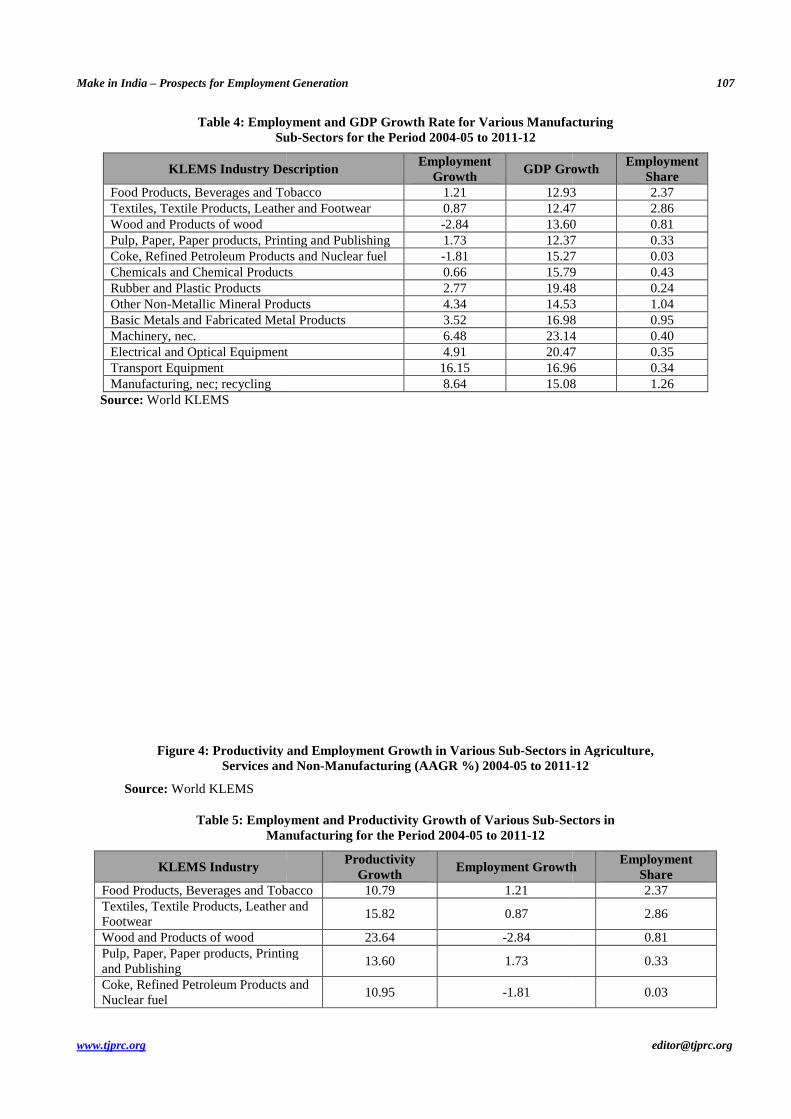
Figure 3 and Table 4 indicate the growth in employment and GDP for various sub-sectors in theeconomy during
the period 2004-05 to 2011-12. The aim is to recognize the sectors that have a greater potential to generate Jobs. Ideally, a
sector adding a greater number of employees for every percentage increase in GDP should be targeted, as far as policy
making is concerned, with an objective to generate employment. At the same time, the exercise to list down the sectors that
could potentially drive the growth requires looking at the labor productivity. Productivity means getting more done with
4Mazumdar (2014) further mentions that in the early 1990s, over 61 per cent of the workforce was engaged in agricultural activities as per the NSS data. In 2011-12, however, the proportion was less than half.
Make in India – Prospects for Employment Generation 97
www.tjprc.org [email protected]
fewer workers, so related to high productivity is a limited impact on employment. The bubble sizes in Figure 4 indicate
that the high-productivity sectors, mainly services do not employ nearly as many workers as the low-productivity sectors.
However, it doesn’t mean that the labor force should be allowed to stay stuck in the low productivity sectors, with poor job
opportunities.
Figures 3 and 4 together indicate that a major proportion of the Indian labor force is trapped in low productivity
agriculture; the sector contributes little to the GDP. There is a need to pull these workers out and shift them to high
productive sectors, where they could expect better wages and employment conditions. Opportunities need to be created in
the formal manufacturing and services sector, with an emphasis on educating and providing skills to make the workforce
suitable for these job opportunities.
It has been debated that the rapidly growing high-skilled service sector can only provide employment to a very
small percentage of the growing labor force. However, there is potential for employment generation. According to the
World Klems database, which figure 4 utilizes, business services, which can be put in the category of modern service, has
an employment growth rate of 21.3% and the corresponding productivity growth rate is 5.72%.Business services include a
gamut of activities: computer and related activities in the private sector, Legal Activities, Accounting, Book-keeping and
related activities as well as researchin development. Similarly, Other Services which includes Real Estate Activities;
Renting of Machinery and Equipment and Other Business Activities; Other Community, Social and Personal Services,
Private Household with Employed Persons, has shown a high employment growth relative to productivity improvement.
Also, the growth in employment in the other sub-sectors of services, for instance, financial services, education, hospitality,
health and social work etc. is not very disappointing. These sectors can be targeted for adequate policy measures, to expand
their workforce size.
According to the tables 4 and 5, certain sub-sectors in the manufacturing segment have shown impressive
employment growth rate, for instance: manufacture of rubber and plastic products, other non-metallic mineral products,
basic metals and fabricated metal products, machinery production, electrical and optical equipment, transport equipment
and manufacturing, n.e.c. These sectors can be tapped for employment generation. It is important to study the formal and
informal components of the manufacturing sector together. Green (2014) presents figures on the contribution to
employment and GDP by the formal and informal manufacturing. The distribution of employment across the formal and
informal manufacturing is 19% and 81% respectively; figures for the contribution to value added are 71% and 29%
respectively. The figures suggest that the formal manufacturing is far more productive. He also mentions that formal
manufacturing has the potential to generate quality employment, as it has registered an impressive rate of employment
growth in the last decade. The challenges impeding this development are, the formal sector being too small and increasing
capital intensiveness of production methods.
On these parameters, construction, a non-manufacturing sub-sector, is the only one that has been contributing to
employment massively. But as argued earlier, this employment is not qualitative. Informality, as shown in Table 6, is
pervasive in all sectors and growing by considerable amounts. So even if the sector is contributing a greater amount to
employment compared to GDP, it doesn’t necessitate generation of quality employment.
A lot can be illustrated about the nature of job opportunities using data on the status of employment. Table 7
shares these estimates.
98 Jasmin
Impact Factor (JCC):5.5658 NAAS Rating: 3.27
Casualisation of the workforce or in other words, using contractual labor is a problem too. Self-employed and
casual workers constitute a major fraction of employment in most of the sub sectors. Contractual employment has made its
way to most of the sectors, with a large number of the sectors registering a rise in this proportion. Certainly, a casual
employee does not have any stability of tenure, to make matters worse; the wages that they get are lower than those of the
regular workers. For instance, as per the 68thNSSO round, average wage and salary earnings per day received by
employees according to usual status engaged in AGEGC and non-agriculture sectors taken together for all enterprises was
Rs.401.30 for regular or the salaried workers, while it was Rs.154.72 for the casual laborers.
At the same time, this data has a positive story to tell. The manufacturing and service sub-sectors that have
registered impressive rate of growth in employment (mentioned above) have also registered a rise in the share of regular
workers.
It needs to be reiterated that informalization needs to be reduced.
Manufacturing Sector
Lack of employment opportunities, a growing informal sector is not all. The data for Indian manufacturing sector
reveals that workers haven’t been able to reap the benefits of economic growth. Worker wages have seen their income
share falling in the net value added even as the share of profits has spiraled. 2001-02 onwards the divergence becomes
glaringly visible. This pattern of functional distribution of income has become a global trend. Also, empirical evidence
indicates that the real wage growth has languished behind real productivity improvement.
A decline in the share of wages in the net value added alongside the real productivity growth outstripping the real
wage growth indicates that the workers are certainly not benefitting from the growth in productivity. On the contrary, the
gains in productivity are being divertedin favour of profit earners.
Increasing mechanization has led to high growth in productivity across industries. With rising mechanization,
workers need to upgrade and enhance their skills, which should ideally translate into higher wages. The rising share of
profits reflects that the benefits of growing productivity are being captured by the capitalists. The Dismal performance
exhibited by manufacturing sector on the employment front and the compression of the wage share depend on a lot many
factors:
• Increased mechanization
• Informalisation
• Contractualisation
• Union labor strength
• Role of minimum wage laws
• Employment programs
• Compression of wages amidst rising costs of other factor inputs to maintain competitiveness
• The ability to set high markups
The factors listed above have a great contribution in affecting the current trends.

Make in India – Prospects for Employment Generation 99
www.tjprc.org [email protected]
Mechanization
Capital deepening i.e. a rise in the capital to labor ratio, means replacement of workers by machines. Substituting
away from labor has strong implications for the worker wages. The capital intensity of manufacturing has increased over
the years. The rise in capital intensity needs to be analyzed in conjunction with growth in labor productivity. Roy (2012)
mentions that the growth in capital intensity in the Indian manufacturing sector is strongly correlated with growth in labor
productivity, the benefits of which are getting sidelined by the profit earners. He also mentions that the share of workers
employed in the manufacturing sector is on a decline and at the same time increasing use of technology might have
resulted in a rise in the number of salaried workers, thereby changing the composition of the workforce. It has also been
noted that apart from increasing mechanization of the existing industries contributing to wage compression, the emergence
of new industries like petrochemicals and metals that are naturally more capital intensive has further added to the pressure.
Informalisation
Not just mechanization of the existing industries, there has also been a shift in labour-intensive industries such as
jute to the informal segment, which has compressed wages in the formal sector.
Contractualisation
A growing body of evidence indicates a huge inflow of contract labor ready to work for low wages. In
fact,informalization of labor-intensive industries and growing contractual hiring of laborisinterrelated. Goldar and
Aggarwal (2010) point out that since the 1980s, there has been increasing informalization of industrial labor in India. This
process has taken place in two forms, firstly, there has been a continuous rise in the share of unorganized sector
employment in the manufacturing sector, and various subsectors of the organized manufacturing sector are sliding to the
informal sector owing to a massive use of contractual and informal workers. Das et al. (2015) furnish a very important fact
that the share of the workers category in total persons engaged has remained remarkably stable (76.25 per cent in 2000-01,
76.69 per cent in 2006-07, and 77.61 per cent in 2011-12), but the share of contract workers in total workers engaged has
been on a continuous rise from 21.31 per cent in 2000-01 to 30.37 per cent in 2006-07 and further to 34.61 per cent in
2011-12.This indicates that there has been a growing preference for contractual workers.
Union Labour Strength
Das et al. (2015)highlight the role of decline in labor strength as a factor affecting a fall in labor income share.
The paper mentions that the union power has displayed a secular decline starting in the 1980s. The important indicators of
union strength show a downfall, starting in the 1980s and accelerating in the 1990s. There is no evidence of deterioration in
industrial relations as captured by the absence of a strong trend in man-days lost due to industrial disputes as a proportion
of man-days worked over the whole of the 1980s. Second, union density declined from 45 per cent in the late 1970s to
about 30 per cent in the late 1980s, which further declined in the 1990s. Third, the proportion of man-days lost due to strike
started to fall in the 1980s, and the decline accelerated sharply in the 1990s. (Nagaraj, 1994; Dutt, 2003). Even verbal
support for labor has declined in the 1990s as the formal private sector workers have become politically weak (Nagaraj,
2002). Furthermore, several states have relaxed the provision of enforcement of labor laws leading to flexible practices at
the ground level.
100 Jasmin
Impact Factor (JCC):5.5658 NAAS Rating: 3.27
The Role of Minimum Wage Laws
There is a prevalent wage setting system in India, whereby the Wage Boards and Pay Commissions generally sets
wages in the public sector, which in turn sets the benchmark for private sector wages (Dutta, 2007). Wages are often set at
above market clearing levels despite being a surplus labor in the economy. The downward pressure on wages is mitigated
by labor market imperfections such as the prevalence of monopsonisticunions and minimum wages stipulated by law,
which particularly applies to the public sector, where government employees are largely unionized, assured of life-time
employment and face very little risk of being fired (Dutt, 2003). While the presence of unions and minimum wage laws has
resulted in wage inflexibility in the formal private sector (Deshpande et al., 2004, and Sharma, 2006), legally guaranteed
minimum wages have failed to impact the wages in the informal sector due to weak enforcement, irregular revisions,
inadequacy or absence of proper indexation to inflation and absence of trade unions (Dutt, 2003).
Employment Programmes
India needs a comprehensive policy framework to generate quality employment and growth. Encouraging skill
development, recognizing the appropriate subsectors for export and trying to absorb the informal employees into better
employment opportunities should be the mainstay of policy. Given the employment situation in the country, various
employment generation programs have been announced in the past. There have been programs aimed at generating
employment and ensuring minimum livelihood in the rural areas. At the same time, schemes at the level of micro and small
enterprises have also been formulated with a special focus on boosting manufacturing employment. Such programs could
play a significant role not only in a sense, that there will be more jobs but also in terms of ensuring a secure livelihood for
the workers at the bottom most layer, i.e. the rural workers. Unfortunately, programs like MNREGA have failed to achieve
a satisfactory remuneration for the rural workers, who remain dissatisfied with their incomes and stay on a constant look
out for relatively better options in the informal sector.
Advocates of the program say that MNREGA has brought about a rise in the real wages in the rural sector.
Academicians also strongly support the idea of a rise in the wages of casual workers due to MNREGA, a rise in the band of
4% to 8%. Mahajan (2012) analyzes the impact of MNREGA on the rural wages. Table 6 shares the data on the rising real
wages, for male and female agriculture workers across the major Indian states for the periods, 1999-2004 and 2004-2009.
2004-2009 is the period in which MNREGA was implemented in India with all the districts covered by 2008-2009. As
Table 8 shows, annual real wage growth rate for men working in agriculture was 3.1% in the latter period compared with
just 1.8% in the previous period. The difference is even starker for women at 5% annual growth for 2004-2009 and a
meager 1.2% for 1999-2004. But these figures cannot be analyzed in isolation. Ther real wage growth should be studied
along with the growth in productivity. Mahajan (2012) uses growth in yield rates over time as an indicator of productivity
in agriculture. Table 8 also shows the growth in athree-year average of food-grain (cereals and pulses) yields. While the
food-grain yield registered an increase of 2.5% per year in 2004-2009, it was as low as 0.1% per year during the years,
1999-2004. It is important to understand that if the productivity growth outstrips the real wage growth, the wage share of
the workers is likely to fall. This analysis highlights the importance of productivity increases.
The net increase in men’s agricultural wages, which is obtained by subtracting the food-grain yield growth rate
from real wage growth rate stands at 1.7% for the period 1999-2004 and 0.6% for 2004-2009. Thus, 2004-2009 witnessed a
lower rate of increase in agricultural wages compared to the previous period, once the growth rate in yield is taken into
account. The real productive wages for the females for the two periods stand at 1.1 and 2.5% respectively. Hence the
Make in India – Prospects for Employment Generation 101
www.tjprc.org [email protected]
wages in the rural sector have grown at a meagerrate, and this is a major explanation as to why there is a growing divide
between the rich and the poor. Low wages in the rural sector also explain why the wages are so low in the informal sector,
why is it that the economy has not been able to exhaust its unlimited supply of labor. Theabove-listed factors have played a
significant role in maintaining a condition of sclerosis in the Indian Manufacturing Sector. The degree of impact of each
one of these might differ across the sub-sectors.
Labour Saving Technical Change
Evidence for increasing capital intensity of the production processes in the Indian manufacturingsector is already
well documented in the existing research. Labour saving technological change has been seen as the main factor behind the
falling labour-intensity of the manufacturing products and the consequent employment problem. The situation poses a
danger because the capital to labor ratio has been rising across industries, i.e. not just the capital intensive industries but
also the labor intensive industries. Kapoor (2014) presents data on the growth in capital intensity of production. Table 9,
confirms rising capital intensity in labor-intensive industries too which has repercussion for the distribution of value added
into profits and wages as well. Of the labor-intensive industries, only manufacturing n.e.c, manufacture of furniture,
Manufacture of medical, precision, optical instruments watches and clocks exhibit adecline in capital intensity.
Sen and Das (2014) also identify labor intensive industries based on labor to capital ratio. The paper confirms the
trend of risingin capital intensity across Industries. They mention that the overall employment elasticity of manufacturing
can increase, even with declining labor intensity, if there is a rise in the share of labour-intensive sectors in total
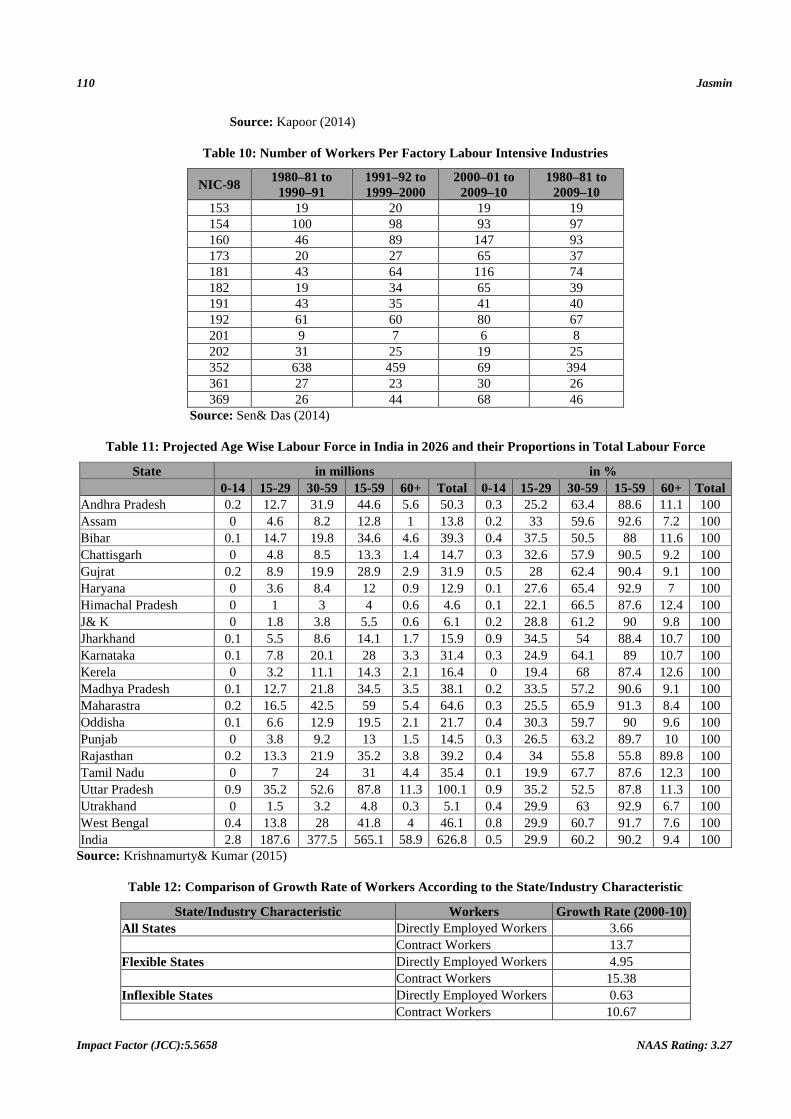
manufacturing. However, this has not happened in India.Using data from Sen& Das (2014), Table 10 shows that the labor-
intensive industries haven’t become more employment intensive, given the removal of industrial licensing and de-
reservation and may be linked to restrictive labor laws. It is widely believed that India’s rigid labor regulations and
employment protection legislation have reduced the incentive of firms to hire workers on permanent contracts and pushed
them towards more capital-intensive modes of production. However, as pointed by Sen & Das (2014) stringent labor
regulations might be able to explain the level of laborintensity but to explain the decreasing labor intensity over time, labor
regulations would need to have become tighter over time. Since this has not happened in theabsence of pro-worker
legislation for the last two decades, they attribute the increasing capital intensity to increases in the ratio of real wage rate
to the rental price of capital. This, in turn, is aresult of a fall in the relative price of capital goods, driven by trade reforms
and falling import tariffs on capital goods over time.
Inter-State Disparities
The inter-state disparities make the Indian manufacturing experience unique in itself. These disparities are likely
to act as hurdles in successful implementation of the campaign. The states differ regarding the stage of demographic
transition they are at, the level of infrastructure development, the flexibility of labor laws, the level of industrialization, etc.
Manufacturing is the main focus of the Make in India campaign. The fact that the states are different levels of
industrialization and a general trend of pre-mature deindustrialization exhibited by the economy poses doubts on the
feasibility of such a campaign. Amirapu and Subramanian (2014) highlight the disparity in the performance of states on the
manufacturing front. They state that Gujarat, Maharashtra and Tamil Nadu are the few states which could achieve a high
share of manufacturing sector in the GDP. In all the other states, manufacturing is now on a decline, infact, even in the
states that could not even industrialize effectively.
102 Jasmin
Impact Factor (JCC):5.5658 NAAS Rating: 3.27
Table 11, shows projected labor force in India in the year 2026. Krishnamurty and Kumar (2015) give these
projections. They project the labor force to grow at around 1.86% annually compared to 1% annual growth in population
during the period 2012 to 2026. They argue that the older labor force in the bracket 30-59 years will grow at a higher rate
compared to the young labor force. These willpresent problems regarding training and skill the labor force for purposeful
employment. States will differ in their contribution to the labor force; Bihar, Jharkhand, and Rajasthan are expected to
witness the rapidgrowth of the young labor force. A uniform employment policy for all states has little chance to reap
benefits. Hence, a national campaign might not be equallysuccessful in all the states.
Kapoor (2014) discusses how state-level variation in terms of flexibility of labor laws and infrastructure
development impacts employment outcomes. The paper mentions that contractualization has been on the rise across all the
states. The analysis shows that growth of directly employed workers is higher in flexible states as compared to inflexible
states. The paper highlights that the increase in shares of contract workers is larger in inflexible states, while the decline in
shares of directly employed workers is smaller in flexible states. Thus it might be the case that labor intensive industries in
inflexible states are attempting to meet their labor requirements through increased use of contract labor. The results are
shown in Table 12. Inadequate development of physical infrastructure i.e. the poor quality of power supply, road networks
and ports and airports are stumbling blocks in the path of the manufacturing sector. The paper discusses how the lack of
infrastructural development in certain states hampers employment generation.
Cost Competitiveness and Exports
Maintaining cost competitiveness is imperative to capture a reasonable share of the export market. It is easy to
link the declining wage share with cost compression practices. Kalecki’s price fixing equation can be used to understand
this.
p = (1 + µ) (wl + �� ) (a)
Dividing by p on both sides 1 = (1 + µ) (�
�
�
� +
��
� ) (b)
where p = per unit price of the good
µ = mark up
wl = unit labour cost
�� = per unit raw material cost.
In fixing the price, the firm takes into consideration its average prime costs (cost of materials and wages) and a
mark-up. Equation (b) explains how factors like markup, changes in labor productivity, the strength of trade unions and
input costs are relevant for the distribution of income between workers and capitalists. For instance, if there is a rise in the
firm profit margin, in terms of rising markups, to restore the balance there will be a squeeze on the wage bill or the raw
material costs. Shocks to the prices of inputs, either domestic or international will also be passed on to some variable in this
equation.
The easiest way to maintain cost competitiveness is to compress wages. Mazumdar (2016) mentions `The effect of
low wages on competitiveness can be said to have worked in at least three ways – one being a direct consequence of wage
stagnation in the sector and the other two being the benefits of being located in a generally cheap labor economy. First,
Make in India – Prospects for Employment Generation 103
www.tjprc.org [email protected]
wage stagnation in organized manufacturing has certainly shored up the profitability of Indian manufacturing at
internationally competitive prices even in the face of increasing capital and material costs of manufacturing output.
Second, in the face of large deficits in infrastructure which tend to increase costs, cheap labor in various supporting
activities has served as the alternative means of lowering costs of various supporting activities which have a bearing on
manufacturing competitiveness. Finally, the low and stagnant levels of wages in the Indian economy, via their effects on
the prices of not-tradeable, have also been the principal basis for preventing India’s ‘national price level’ (ratio of PPP
conversion factor to market exchange rate) from catching up even in the face of high inflation. This has helped sustain the
rupee exchange rate at a more competitive level than that in other Asian economies (Mazumdar, 2016).
Figure 5 plots the data on the average manufacturing cost index for the year 2014, given by the Boston
consultancy group. As shown in the figure India is the second lowest cost competitive exporter after Indonesia. Its cost
advantage lies in low labor costs and depreciating the currency. Labor costs have been declining due to strong productivity
gains.
Anand et al. (2015) analyze the export basket of India and provide suggestions on which exports should India
capitalize on. They find that the Indian export has evolved over time. Within manufacturing exports, a clear shift away
from traditional exports can be seen, such as textiles, gems, and leather products, there is a movement towardshigh-tech
and medium-tech manufacturing products, such as engineering goods. However, the share of high-tech and medium-tech
manufacturing exports in total good exports is substantially lower when compared to China or other Emerging markets.
The paper indicates that there is likely to be little scope for India to get any major returns out of the export of low-skill or
low-tech products because it is likely to face an incumbency disadvantage relative to China and other low-cost producers in
Asia. A better strategy is to develop and diversify the high and medium technology manufacture goods for instance:
manufacture of aircraft, motor-vehicles, automobile parts, etc.. This could also translate into better employment outcomes.
Services exported by India are highly sophisticated and complex, comparable to the international standards.
Research and development services, deserve a special mention here. Further diversification of these services, enhancing
their quality will bring in high incomes.
CONCLUSIONS
The study using data from different sources and the existing literature arrives at certain conclusions. Firstly, the
current status of the manufacturing sector presents several problems in making Make in India a success. Overtime, the
absorptive capacity of the sector has tended to decline, which poses serious doubts about the achievability of the aims of
the campaign. In such a case exclusive focus on the manufacturing sector looks like a faulty strategy. A better plan will be
to identify appropriate manufacturing goods and services that can generate enough employment and usher in growth.
Along with this identification Skillingand educating India has become imperative, to make the workforce ready for
productive employment opportunities. It seems like a long term solution, but to be able to achieve inclusive growth, the
nation needs to start now.
REFERENCES
1. “What to Make in India? Manufacturing or Services?”, Chapter 7, Economic Survey (2014-15).
2. Amirapu, Amrit& Subramanian, Arvind, 2014, “Manufacturing Futures”, Business Standard, May 9, 2014.
3. Anand, Rahul, Kochhar, Kalpana& Mishra, Saurabh, 2015, “Make in India: Which Exports Can Drive the Next Wave of
104 Jasmin
Impact Factor (JCC):5.5658 NAAS Rating: 3.27
Growth?”, International Monetary Fund, May 2015.
4. Das, Deb Kusum, Choudhury, Homagni& Singh, Jaivir, 2015, “Contract Labour (Regulation and Abolition) Act 1970 and
Labour Market Flexibility: An Exploratory Assessment of Contract Labour use in India’s Formal Manufacturing”, INDIAN
COUNCIL FOR RESEARCH ON INTERNATIONAL ECONOMIC RELATIONS, Working Paper 300, June 2015.
5. Das, Kusum Deb &Sen, Kunal (2015), “Where Have All the Workers Gone? Puzzle of Declining Labour Intensity in
Organised Indian Manufacturing”, Economic and Political Weekly, June 6, 2015
6. Dasgupta, Sukti & Singh, Ajit, 2006, “Manufacturing, Services and Premature Deindustrialization in Developing Countries: A
Kaldorian Analysis”, United Nations University: World Institute for Development Economics Research, May 2006.
7. Deshpande, L., A. N Sharma, A. Karan and S Sarkar, 2004, “Liberalization and Labour: Labour Flexibility in Indian
Manufacturing”, Institute for Human Development, New Delhi.
8. Dutt, P., 2003, “Labor Market Outcomes and Trade Reforms: The Case of India”, in R. Hasan and D. Mitra (eds.): The
Impact of Trade on Labor: Issues, Perspectives, and Experiences from Developing Asia, Amsterdam: Elsevier, 2003.
9. Dutta, P. V.,2007, “Trade Protection and Industry Wages in India”, Industrial and Labor Relations Review, Volume 60, No. 2,
Pages 268-285.
10. Fei, J.C.H & G, Ranis, 1964, “Development of Labour Surplus Economy: Theory and Policy”, Oxford University Press, New
York.
11. Goldar, Bishwanasth& Aggarwal, Suresh Chand, 2010, “In formalization of Industrial Labour in India: Are labour market
rigidities and growing import competition to blame?”, 6th Annual Conference, Indian Statistical Institute, New Delhi.
12. Green, Russell A., 2014, “Can “Make in India” Make Jobs? The Challenges of Manufacturing Growth and High-Quality Job
Creation In India”, James A. Baker III Institute of Public Policy of Rice University, December 15, 2014.
13. Harris, J.R. & M.P., Todaro, 1970, “Migration, Unemployment and Development: A Two Sector Analysis. American
Economic Review, 60 (1), 126-142.
14. Kapoor, Radhicka, 2014, “Creating Jobs in India’s Organized Manufacturing Sector”, Indian Council for Research on
International Economic Relations, September 2014.
15. Krishnamurty, Jayasankar& Kumar, Abhay, 2015 “The Demographic dividend: challenges to employment and
employability”, Indian Journal of Labour Economics.
16. Lewis, W.A., 1954, “Economic Development and Unlimited Supplies of Labour”, The Manchester School, 22 (2).
17. Mahajan, Kanika, 2012 “Agricultural wages and MNREGA: Exploring the myth”, Ideas for India for more evidence based
policy.
18. Nagaraj, R, 1994, “Employment and Wages in manufacturing Industries: Trends, Hypothesis and Evidence”, Economic and
Political weekly, Volume 29, No. 4, Pages 177 – 186.
19. Nagaraj, R, 2002, “Trade and Labour Market Linkages in India: Evidence and Issues”, Working Paper No. 50, East West
Centre Working Papers Economic Series, East West Centre, Hawaii, August 2002.
20. Papola, T.S., 2007, “Employment Trends”, in KaushikBasu (Ed), The Oxford Companion to Economics in India. Oxford
University Press, New Delhi.
21. Rao, K.S. Chalapati & Dhar, Biswajit, 2016, “The Tenuous Relationship between Make in India and FDI Inflows”, Institute
for Studies in Industrial Development New Delhi, India, December 2016.

Make in India – Prospects for Employment Generation
www.tjprc.org
22. Roy, Satyaki, 2012, “CHANGING FACTOR INCOMES IN INDUSTRIES AND OCCUPATIONS Review of Long Term
Trends”, ISID.
23. Sasikumar, S.K. &Thimothy, Rakkee, 2013, “Surmounting India’s Employment Challenge: Evide
05 to 2011-12)”, Labour and Development, V.V. Giri National Labour Institute, Volume 20, No.1, June 2013.
24. Sharma, A. N.,2006, “Flexibility, Employment and Labour Market Reforms in India
41, No. 21, Pages 2078 – 2085.
25. Shaw, Abhishek, 2013, “Employment Trends in India An Overview of NSSO’s 68th Round”, Economic & Political Weekly,
October 19, 2013.
26. Srija, A. &Shirke, Shrinivas V., 2014 “An Analysis of the Informal Labour Market in India
September-October 2014.
APPENDIX
Figure
Source: Papola (2007) & Shaw (2013).
Table
PrimarySecondaryServices
Source:
Table 2: 2004-05, Proportion of
2004-05
Agriculture Manufacturing Non-ManufacturingServices
Total Source: Srija&Shirke (2014)
Prospects for Employment Generation
Roy, Satyaki, 2012, “CHANGING FACTOR INCOMES IN INDUSTRIES AND OCCUPATIONS Review of Long Term
, Rakkee, 2013, “Surmounting India’s Employment Challenge: Evide
12)”, Labour and Development, V.V. Giri National Labour Institute, Volume 20, No.1, June 2013.
Sharma, A. N.,2006, “Flexibility, Employment and Labour Market Reforms in India”, Economic and Political Weekly, Volume
Shaw, Abhishek, 2013, “Employment Trends in India An Overview of NSSO’s 68th Round”, Economic & Political Weekly,
Srija, A. &Shirke, Shrinivas V., 2014 “An Analysis of the Informal Labour Market in India”,
Figure 1: Unemployment Rate (% of Labor Force)
Papola (2007) & Shaw (2013).
Table 1: Sectoral Break-Up of Employment (%)
Sector 2004-05 2009-10 2011-12 Primary 58.5 53.2 48.9 Secondary 18.5 21.5 24.3 Services 23.4 25.3 26.8
Source: 61st, 66th, and 68th NSSO rounds.
05, Proportion of Formal and Informal Employment at the Sectoral Level
Organized Sector Unorganized Sector Formal Informal Formal Informal
0.76 0.99 0.00 56.75 1.21 2.10 0.10 8.33
Manufacturing 0.53 1.45 0.00 4.42 4.48 1.89 0.19 16.80 6.98 6.43 0.29 86.30
Srija&Shirke (2014)
105
Roy, Satyaki, 2012, “CHANGING FACTOR INCOMES IN INDUSTRIES AND OCCUPATIONS Review of Long Term
, Rakkee, 2013, “Surmounting India’s Employment Challenge: Evidence from NSSO Data (2004-
12)”, Labour and Development, V.V. Giri National Labour Institute, Volume 20, No.1, June 2013.
Economic and Political Weekly, Volume
Shaw, Abhishek, 2013, “Employment Trends in India An Overview of NSSO’s 68th Round”, Economic & Political Weekly,
Confederation of Indian Industry,
Sectoral Level (%)
Total
58.50 11.73 6.41 23.36 100.00
106
Impact Factor (JCC):5.5658
Table 3: 2011-12, Proportion of
2011-12
Agriculture Manufacturing Non-ManufacturingServices
Total Source: Srija&Shirke (2014)
Figure 2: Sectoral Contribution to Employment and GDP (2011
Source: MOSPI & NSSO68th round
Figure 3: Performance of Various SubNon-
Source: Wold KLEMS
12, Proportion of Formal and Informal Employment at the Sectoral Level
Organized Sector Unorganized Sector Formal Informal Formal Informal
0.06 0.16 0.00 48.69 1.48 2.79 0.06 8.28
Manufacturing 0.69 3.77 0.01 7.18 5.62 2.72 0.22 18.29 7.84 9.43 0.29 82.43
Srija&Shirke (2014)
: Sectoral Contribution to Employment and GDP (2011
MOSPI & NSSO68th round
Performance of Various Sub-Sectors in Agriculture, Services and -Manufacturing (AAGR %) 2004-05 to 2011-12
Wold KLEMS
Jasmin
NAAS Rating: 3.27
Sectoral Level (%)
Total
48.90 12.60 11.65 26.84 100.00
: Sectoral Contribution to Employment and GDP (2011-12)
Sectors in Agriculture, Services and
Make in India – Prospects for Employment Generation
www.tjprc.org
Table 4: Employment and GDP Sub
KLEMS Industry Description
Food Products, Beverages and TobaccoTextiles, Textile Products, Leather and FootwearWood and Products of wood Pulp, Paper, Paper products, Printing and PublishingCoke, Refined Petroleum Products and Nuclear fuelChemicals and Chemical Products Rubber and Plastic Products Other Non-Metallic Mineral Products Basic Metals and Fabricated Metal ProductsMachinery, nec. Electrical and Optical EquipmentTransport Equipment Manufacturing, nec; recycling
Source: World KLEMS
Figure 4: Productivity and Employment Growth in Various SubServices and Non
Source: World KLEMS
Table 5: Employment and Productivity Manufac
KLEMS Industry
Food Products, Beverages and TobaccoTextiles, Textile Products, Leather and Footwear Wood and Products of wood Pulp, Paper, Paper products, Printing and Publishing Coke, Refined Petroleum Products and Nuclear fuel
Prospects for Employment Generation
Employment and GDP Growth Rate for Various Manufacturing Sub-Sectors for the Period 2004-05 to 2011-12
KLEMS Industry Description Employment
Growth GDP Growth
Products, Beverages and Tobacco 1.21 12.93Textiles, Textile Products, Leather and Footwear 0.87 12.47
-2.84 13.60Pulp, Paper, Paper products, Printing and Publishing 1.73 12.37
Products and Nuclear fuel -1.81 15.27Chemicals and Chemical Products 0.66 15.79
2.77 19.48Metallic Mineral Products 4.34 14.53
Basic Metals and Fabricated Metal Products 3.52 16.986.48 23.14
Electrical and Optical Equipment 4.91 20.4716.15 16.968.64 15.08
Productivity and Employment Growth in Various Sub-Sectors in Agriculture, Services and Non-Manufacturing (AAGR %) 2004-05 to 2011-
Employment and Productivity Growth of Various Sub-Sectors Manufacturing for the Period 2004-05 to 2011-12
Productivity Growth
Employment Growth
Food Products, Beverages and Tobacco 10.79 1.21 Textiles, Textile Products, Leather and
15.82 0.87
23.64 -2.84 Pulp, Paper, Paper products, Printing
13.60 1.73
Coke, Refined Petroleum Products and 10.95 -1.81
107
Various Manufacturing
GDP Growth Employment
Share 12.93 2.37 12.47 2.86 13.60 0.81 12.37 0.33 15.27 0.03 15.79 0.43 19.48 0.24 14.53 1.04 16.98 0.95 23.14 0.40 20.47 0.35 16.96 0.34 15.08 1.26
Sectors in Agriculture, -12
Sectors in
Employment Growth Employment
Share 2.37
2.86
0.81
0.33
0.03

108 Jasmin
Impact Factor (JCC):5.5658 NAAS Rating: 3.27
Table 5: Contd., Chemicals and Chemical Products 17.06 0.66 0.43 Rubber and Plastic Products 10.79 2.77 0.24 Other Non-Metallic Mineral Products 11.71 4.34 1.04 Basic Metals and Fabricated Metal Products
11.99 3.52 0.95
Machinery, nec. 13.36 6.48 0.40 Electrical and Optical Equipment 10.68 4.91 0.35 Transport Equipment 6.87 16.15 0.34 Manufacturing, nec; recycling 8.58 8.64 1.26
Source: World KLEMS
Table 6: Informal Employment in the Non-Agriculture Sector (In Million)
Non-Agriculture Sector 2004-05 2011-12 Mining 1.82 1.79 Manufacturing 47.92 52.49 Electricity & Water Supply 0.24 1.21 Construction 24.94 48.92 Trade, Hotel & Restaurant 46.02 50.17 Transportation, Storage & Communications 14.66 18.02 Real estate other business activities 3.43 5.02 Education 5.15 6.31 Finance 1.13 1.81 Health 2.1 2.68 Public Administration, defence 1.17 1.11 Other Services 12.26 14.5
Source: Srija&Shirke (2014)
Table 7: Distribution of Self-Employed, Casual and Regular Workers
Source: World KLEMS
Self Employed Casual Workers Regular Workers
KLEMS Industry Description 2004-05 2011-12 2004-05 2011-12 2004-05 2011-12
Agriculture,Hunting,Forestry and Fishing 63.89 64.55 35.02 34.60 1.10 0.85
Mining and Quarrying 10.33 6.00 45.46 56.27 44.21 37.74
Food Products,Beverages and Tobacco 54.70 64.68 26.53 13.85 18.77 21.47
Textiles, Textile Products, Leather and Footwear 53.49 44.88 14.86 16.50 31.65 38.62
Wood and Products of wood 77.66 70.41 15.88 21.86 6.46 7.73
Pulp, Paper,Paper products,Printing and Publishing 30.92 30.28 8.57 8.21 60.51 61.51
Coke, Refined Petroleum Products and Nuclear fuel 11.76 5.03 14.86 14.60 73.38 80.37
Chemicals and Chemical Products 22.09 12.41 17.94 11.42 59.97 76.17
Rubber and Plastic Products 18.16 14.51 13.47 8.50 68.37 76.99
Other Non-Metallic Mineral Products 43.02 24.01 38.67 54.40 18.32 21.59
Basic Metals and Fabricated Metal Products 28.14 27.19 25.70 16.75 46.15 56.06
Machinery, nec. 24.68 29.22 12.06 5.67 63.26 65.11
Electrical and Optical Equipment 26.17 20.29 6.26 5.13 67.57 74.58
Transport Equipment 7.52 11.03 10.02 6.64 82.47 82.33
Manufacturing, nec; recycling 58.26 52.86 13.92 14.51 27.82 32.64
Electricity, Gas and Water Supply 2.47 2.46 13.08 6.12 84.45 91.42
Construction 30.83 10.92 62.17 83.49 7.01 5.58
Trade 73.63 76.19 10.36 5.22 16.02 18.60
Hotels and Restaurants 63.48 59.13 8.86 11.64 27.66 29.23
Transport and Storage 46.46 44.48 14.63 15.27 38.91 40.25
Post and Telecommunication 27.26 13.01 8.82 4.36 63.91 82.64
Financial Services 23.58 24.57 1.11 1.04 75.31 74.40
Business Service 50.14 29.67 3.90 4.43 45.97 65.90
Public Administration and Defense; Compulsory Social Security 0.49 0.00 3.24 0.89 96.27 99.11
Education 15.97 11.10 1.15 0.77 82.89 88.13
Health and Social Work 29.05 27.65 2.28 2.74 68.67 69.62
Other services 58.49 59.52 9.45 10.76 32.06 29.73

Make in India – Prospects for Employment Generation 109
www.tjprc.org [email protected]
Table 8: Real Wage and Yield Growth (CAGR %)
State Real Wage Rate Male
(1999-2004)
Real Wage Rate Male
(2004-2009)
Real Wage Female
(1999-2004)
Real Wage Female
(2004-2009)
Food Grain Yield
(1999-2004)
food Grain Yield
(2004-2009) Andhra Pradesh 0.4 7.9 -0.2 10.4 0.9 5.5 Assam 4.9 0 7.9 -0.4 1.4 1.4 Bihar 2.5 1.8 2.5 1.9 -2.7 3.2 Gujarat 1.1 1.1 1.4 1.9 0.7 3.7 Haryana 1.4 0.7 -0.2 -0.6 1.8 1.9 Karnataka 0.9 4.4 1.2 4.1 -2.7 6.2 Kerela 1.2 1.1 -0.1 5.4 1.6 2.3 Madhya Pradesh 2.2 3.8 1.7 5.2 -0.5 1.6 Maharashtra 0.6 1.9 -0.1 4.7 -0.7 4.7 Orissa 7.1 2.9 5.1 4 0.2 4.9 Punjab -0.2 1.9 -2.7 0.5 0.7 1.4 Rajasthan 3.1 1.9 3.5 3 1.4 1.3 Tamil Nadu 1.8 3.8 0.3 5.9 -6.8 6.3 Uttar Pradesh 3 2.5 4.2 0.2 -0.8 2 West Bengal -0.3 4 -0.4 3.5 2.1 0.7 All India 1.8 3.1 1.2 5 0.1 2.5
Source: Mahajan (2012)
Table 9: Trend Growth Rate in the Capital Intensity of Production by Industry (2000-01 to 2010-11), NIC 2004
Labour Intensive Industries Capital Intensive Industries NIC Trend Growth (%) NIC Trend growth (%) 152 5.77 151 3.47 153 9.19 155 2.56 154 4.18 171 4.91 160 4.41 210 7.25 172 3.64 221 11.13 173 1.71 223 -2.21 181 1.47 231 8.97 182 16.89 232 1.10 191 2.27 241 9.74 192 0.48 242 6.29 201 11.81 243 3.19 202 5.78 251 3.29 222 9.42 252 0.84 273 10.74 261 1.78 281 10.45 269 1.53 289 4.44 271 5.01 291 4.77 272 7.60 292 4.34 293 2.00 311 5.99 300 2.49 312 4.27 313 3.57 315 -1.84 314 1.52 331 -3.73 319 1.89 333 -8.92 321 -7.14 342 2.57 322 8.96 351 24.72 323 5.65 352 7.84 332 1.26 361 -0.25 341 2.52 369 -5.41 343 3.47
353 8.49
359 1.35
110 Jasmin
Impact Factor (JCC):5.5658 NAAS Rating: 3.27
Source: Kapoor (2014)
Table 10: Number of Workers Per Factory Labour Intensive Industries
NIC-98 1980–81 to 1990–91
1991–92 to 1999–2000
2000–01 to 2009–10
1980–81 to 2009–10
153 19 20 19 19 154 100 98 93 97 160 46 89 147 93 173 20 27 65 37 181 43 64 116 74 182 19 34 65 39 191 43 35 41 40 192 61 60 80 67 201 9 7 6 8 202 31 25 19 25 352 638 459 69 394 361 27 23 30 26 369 26 44 68 46
Source: Sen& Das (2014)
Table 11: Projected Age Wise Labour Force in India in 2026 and their Proportions in Total Labour Force
State in millions in %
0-14 15-29 30-59 15-59 60+ Total 0-14 15-29 30-59 15-59 60+ Total
Andhra Pradesh 0.2 12.7 31.9 44.6 5.6 50.3 0.3 25.2 63.4 88.6 11.1 100 Assam 0 4.6 8.2 12.8 1 13.8 0.2 33 59.6 92.6 7.2 100 Bihar 0.1 14.7 19.8 34.6 4.6 39.3 0.4 37.5 50.5 88 11.6 100 Chattisgarh 0 4.8 8.5 13.3 1.4 14.7 0.3 32.6 57.9 90.5 9.2 100 Gujrat 0.2 8.9 19.9 28.9 2.9 31.9 0.5 28 62.4 90.4 9.1 100 Haryana 0 3.6 8.4 12 0.9 12.9 0.1 27.6 65.4 92.9 7 100 Himachal Pradesh 0 1 3 4 0.6 4.6 0.1 22.1 66.5 87.6 12.4 100 J& K 0 1.8 3.8 5.5 0.6 6.1 0.2 28.8 61.2 90 9.8 100 Jharkhand 0.1 5.5 8.6 14.1 1.7 15.9 0.9 34.5 54 88.4 10.7 100 Karnataka 0.1 7.8 20.1 28 3.3 31.4 0.3 24.9 64.1 89 10.7 100 Kerela 0 3.2 11.1 14.3 2.1 16.4 0 19.4 68 87.4 12.6 100 Madhya Pradesh 0.1 12.7 21.8 34.5 3.5 38.1 0.2 33.5 57.2 90.6 9.1 100 Maharastra 0.2 16.5 42.5 59 5.4 64.6 0.3 25.5 65.9 91.3 8.4 100 Oddisha 0.1 6.6 12.9 19.5 2.1 21.7 0.4 30.3 59.7 90 9.6 100 Punjab 0 3.8 9.2 13 1.5 14.5 0.3 26.5 63.2 89.7 10 100 Rajasthan 0.2 13.3 21.9 35.2 3.8 39.2 0.4 34 55.8 55.8 89.8 100 Tamil Nadu 0 7 24 31 4.4 35.4 0.1 19.9 67.7 87.6 12.3 100 Uttar Pradesh 0.9 35.2 52.6 87.8 11.3 100.1 0.9 35.2 52.5 87.8 11.3 100 Utrakhand 0 1.5 3.2 4.8 0.3 5.1 0.4 29.9 63 92.9 6.7 100 West Bengal 0.4 13.8 28 41.8 4 46.1 0.8 29.9 60.7 91.7 7.6 100 India 2.8 187.6 377.5 565.1 58.9 626.8 0.5 29.9 60.2 90.2 9.4 100
Source: Krishnamurty& Kumar (2015)
Table 12: Comparison of Growth Rate of Workers According to the State/Industry Characteristic
State/Industry Characteristic Workers Growth Rate (2000-10) All States Directly Employed Workers 3.66 Contract Workers 13.7 Flexible States Directly Employed Workers 4.95 Contract Workers 15.38 Inflexible States Directly Employed Workers 0.63 Contract Workers 10.67

Make in India – Prospects for Employment Generation 111
www.tjprc.org [email protected]
Table 12: Contd., Labour Intensive Industries in Flexible States Directly Employed Workers 15.36 Contract Workers 2.69 Labour Intensive Industries in Inflexible States Directly Employed Workers 10.54 Contract Workers 11.08
Source: Kapoor (2014)
Figure 5: Average Manufacturing Cost Index 2014
Source: The Boston Consultancy Group
